Keeping Working Class and Immigrant Tenants in the Place they Shaped and Call Home: Bushwick
KEEPING WORKING CLASS AND IMMIGRANT TENANTS IN THE PLACE THEY SHAPED AND CALL HOME: BUSHWICK
DEVELOPED BY
Soraya Barar
Avery Crower
Aqdas Fatima
Isabelle Groenewegen
Lauren Leiker
Rhaynae Lloyd
Zoe Moskowitz
Natalie Temple
Leah Roy
Chey Socheata
COORDINATED BY
Gabriela Rendón
Associate Professor of Urban Planning and Community Development
MS Design and Urban Ecologies Program
ACKNOWLEDGEMENTS
BUSHWICK HOUSING INDEPENDENCE PROJECT
Amy Collado
Rossy Esmil
Jenny Akchin
Cathy Barreda
Kery Espino
Teresa Basilio Gaztambide
Michael Grinthal
Raquel Namuche
Sadia Rahman
Cynthia Tobar
EL PUENTE BUSHWICK LEADERSHIP CENTER
Jazmin Torres, Director
ORAL HISTORY PROJECT
Jenny Ackchin
Amy Collado
Margarita Cruz
Michael Grinthal
Alberto Mendoza
TABLE OF CONTENTS
PART I: BUSWICK
Introduction
Bushwick’s Social + Economic Composition
Bushwick’s Housing Conditions
PART II: RADICAL LISTENING
Understanding Housing in Bushwick
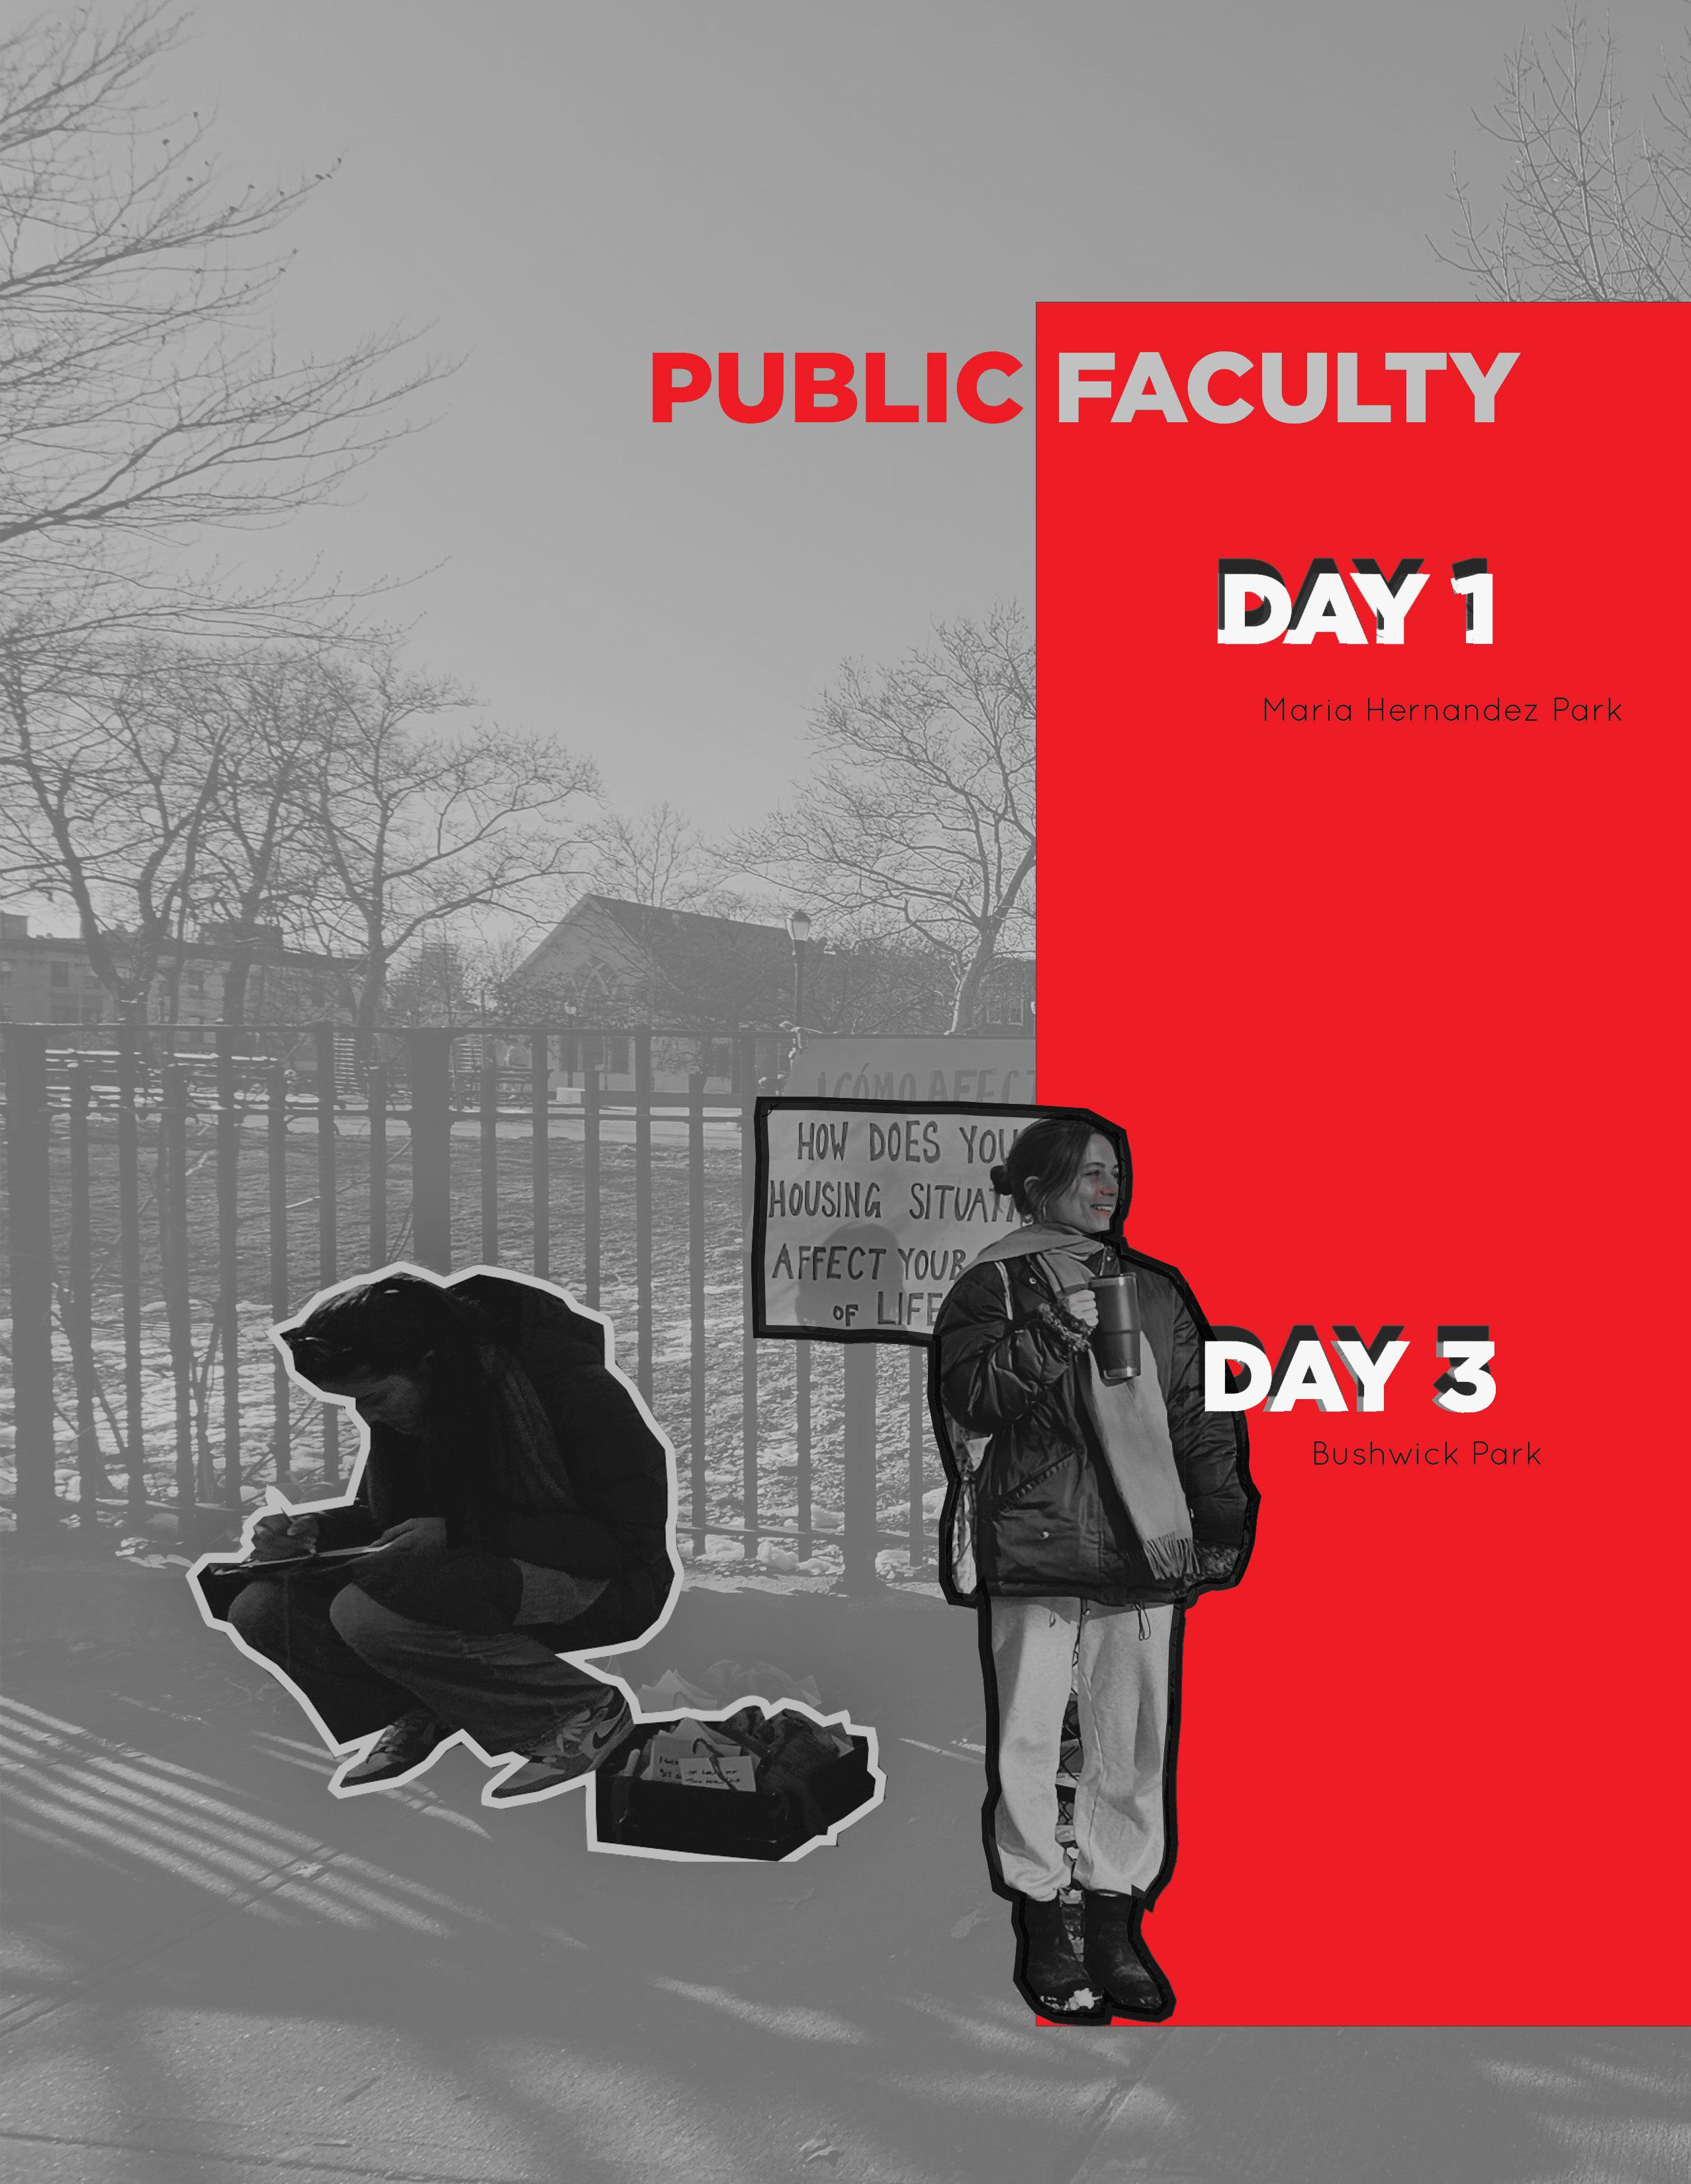
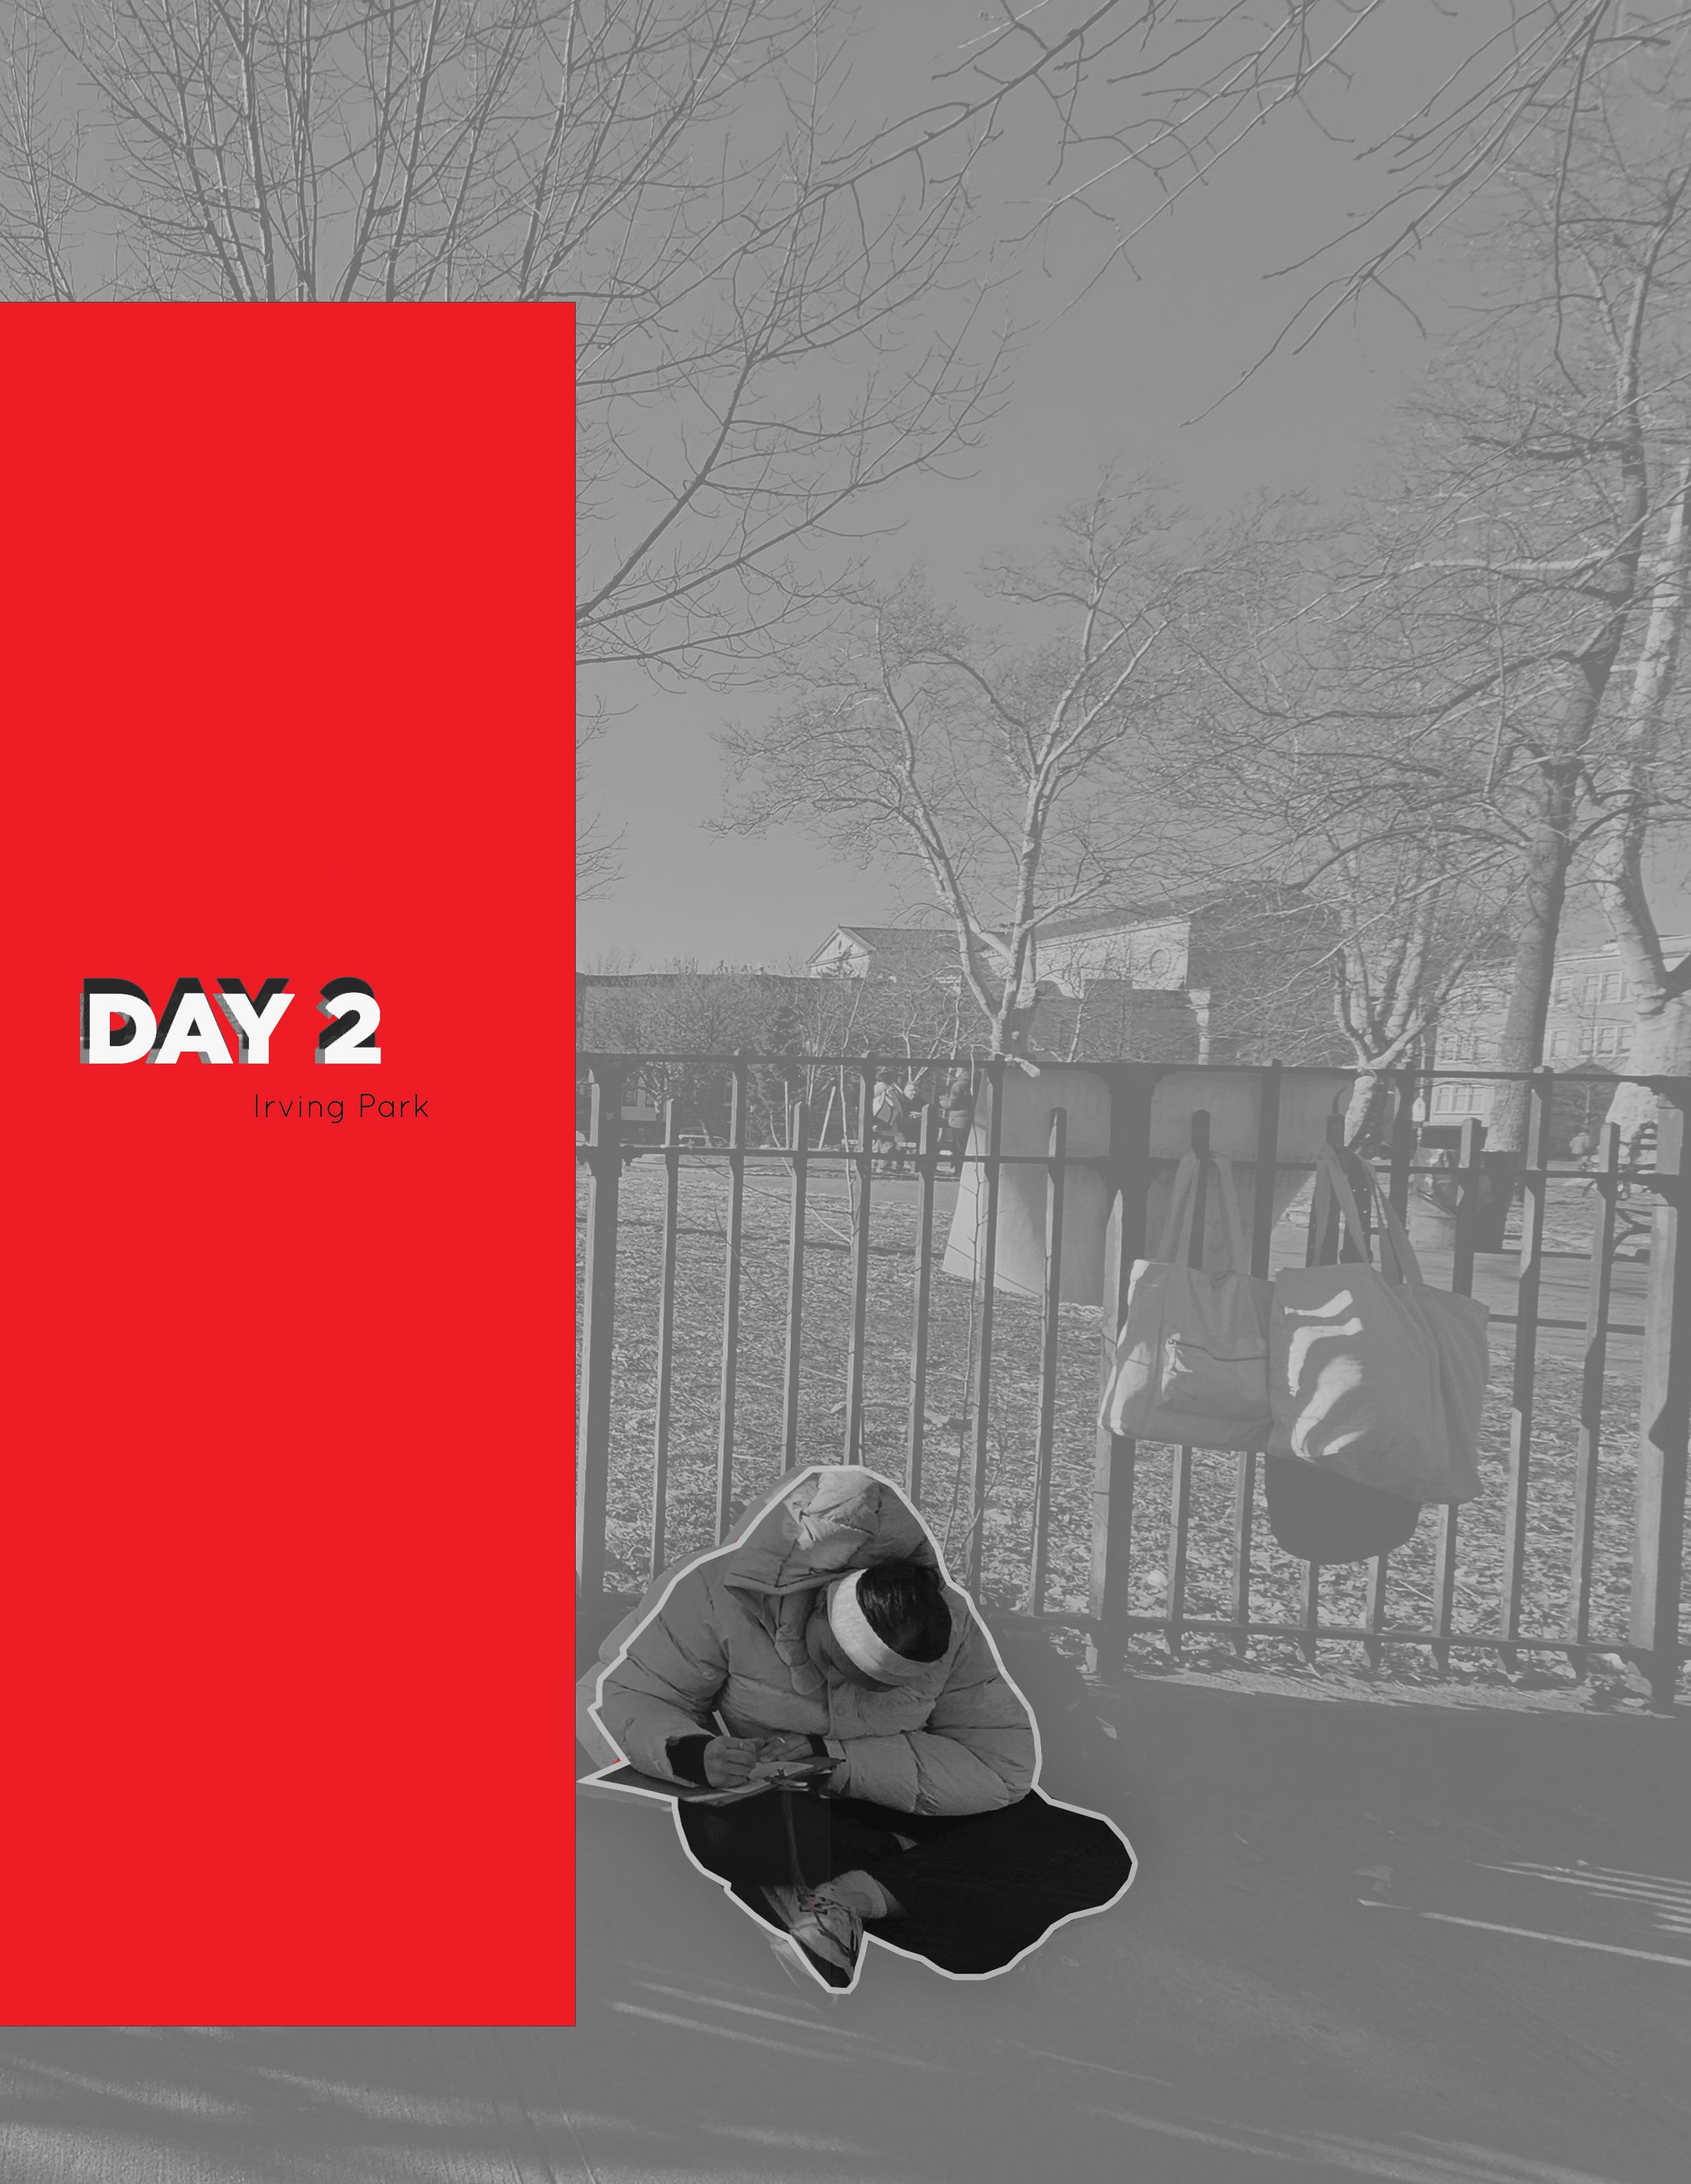
Public Faculty Map
Public Faculty Responses
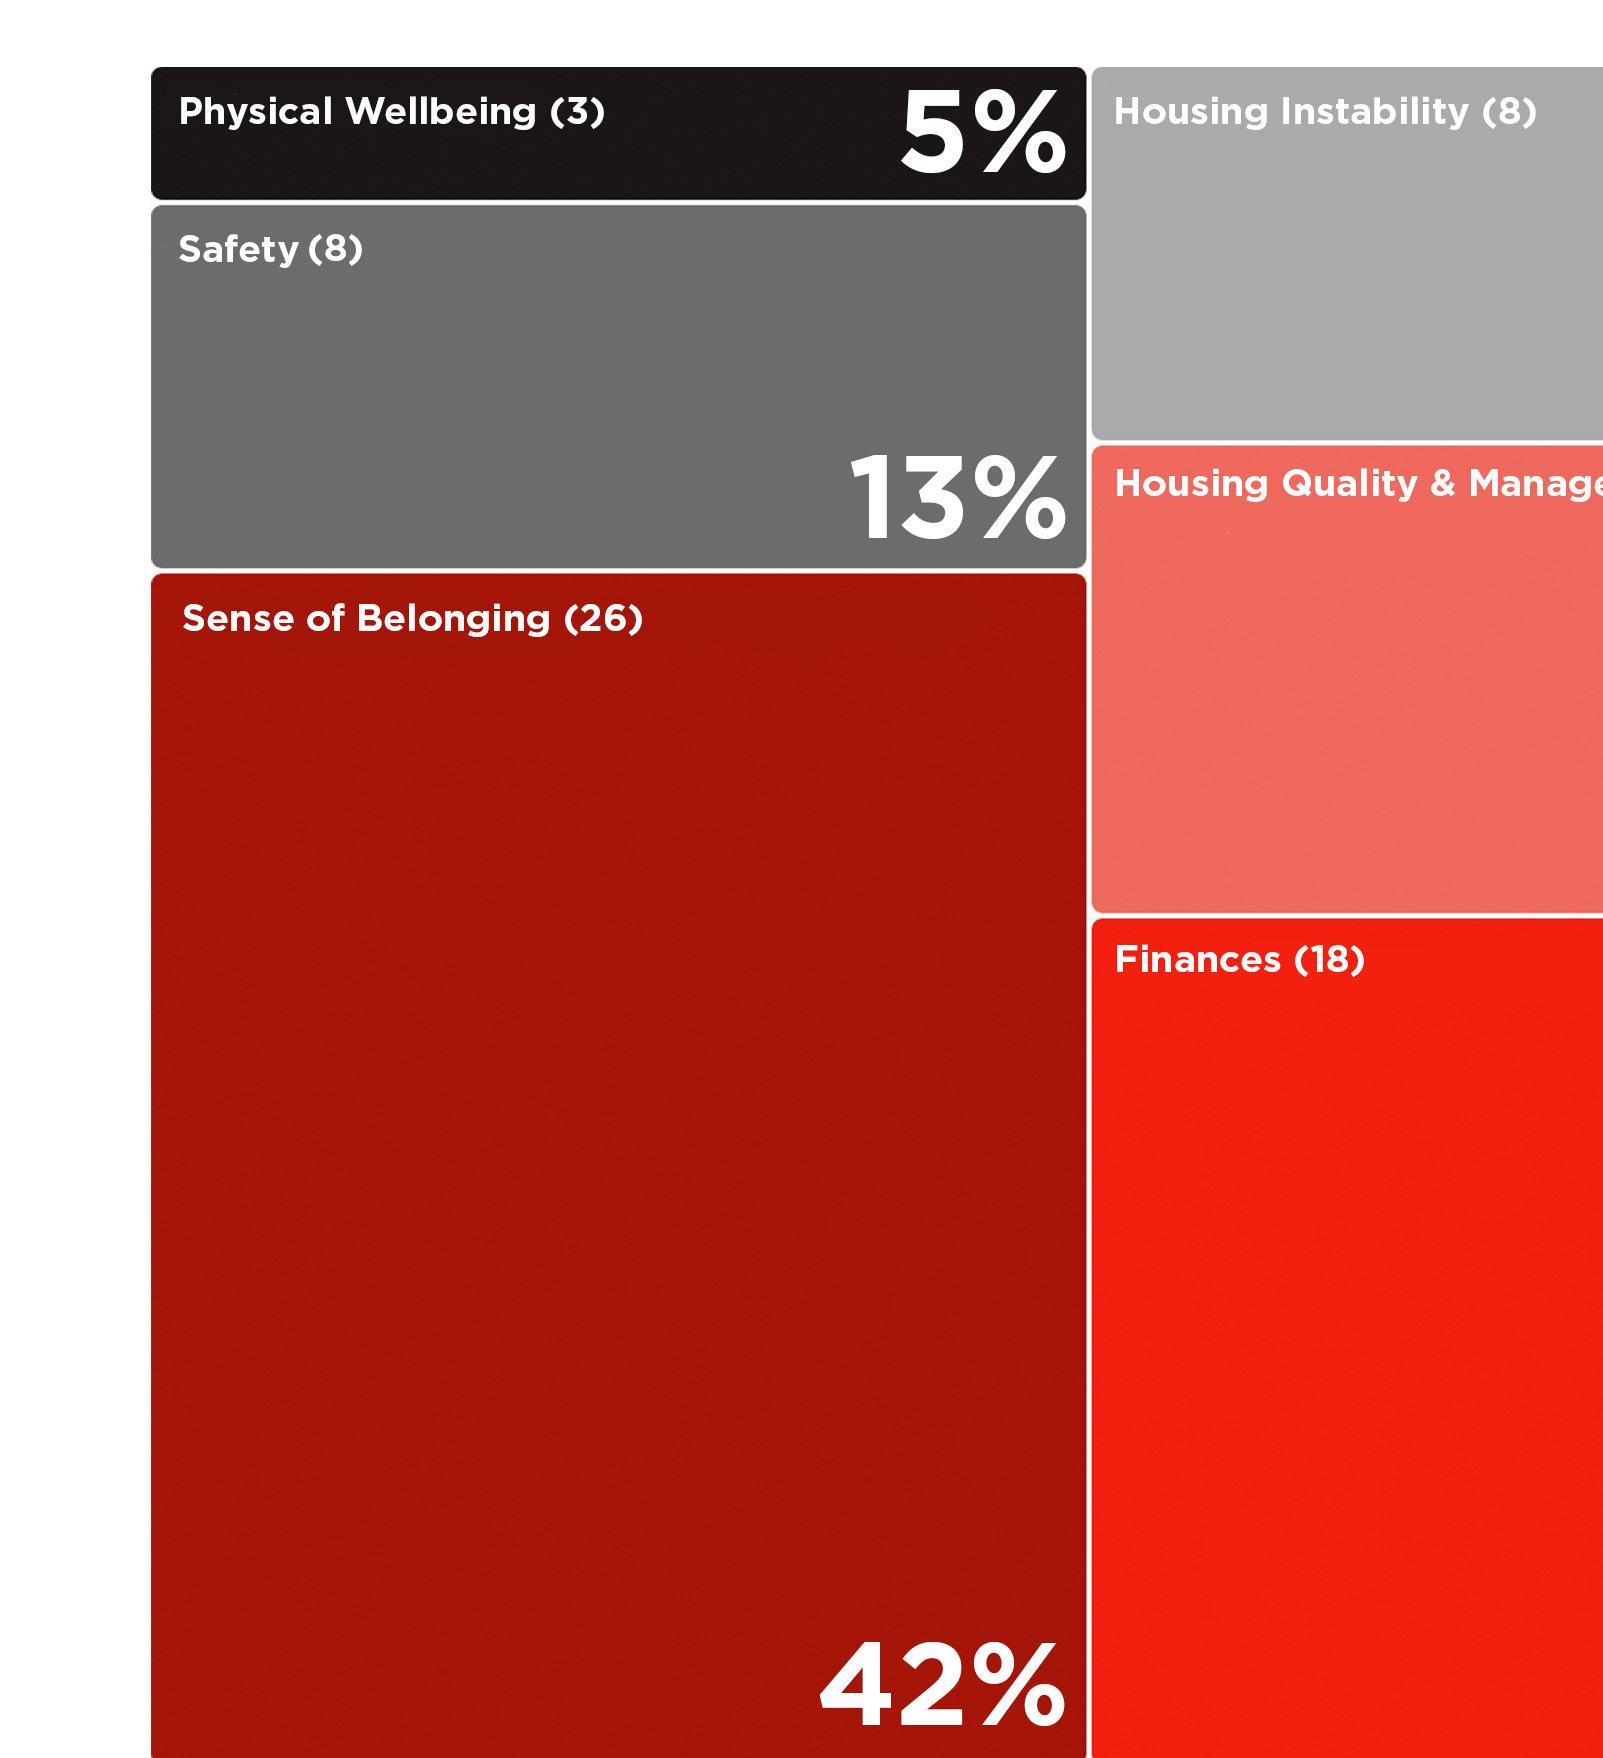
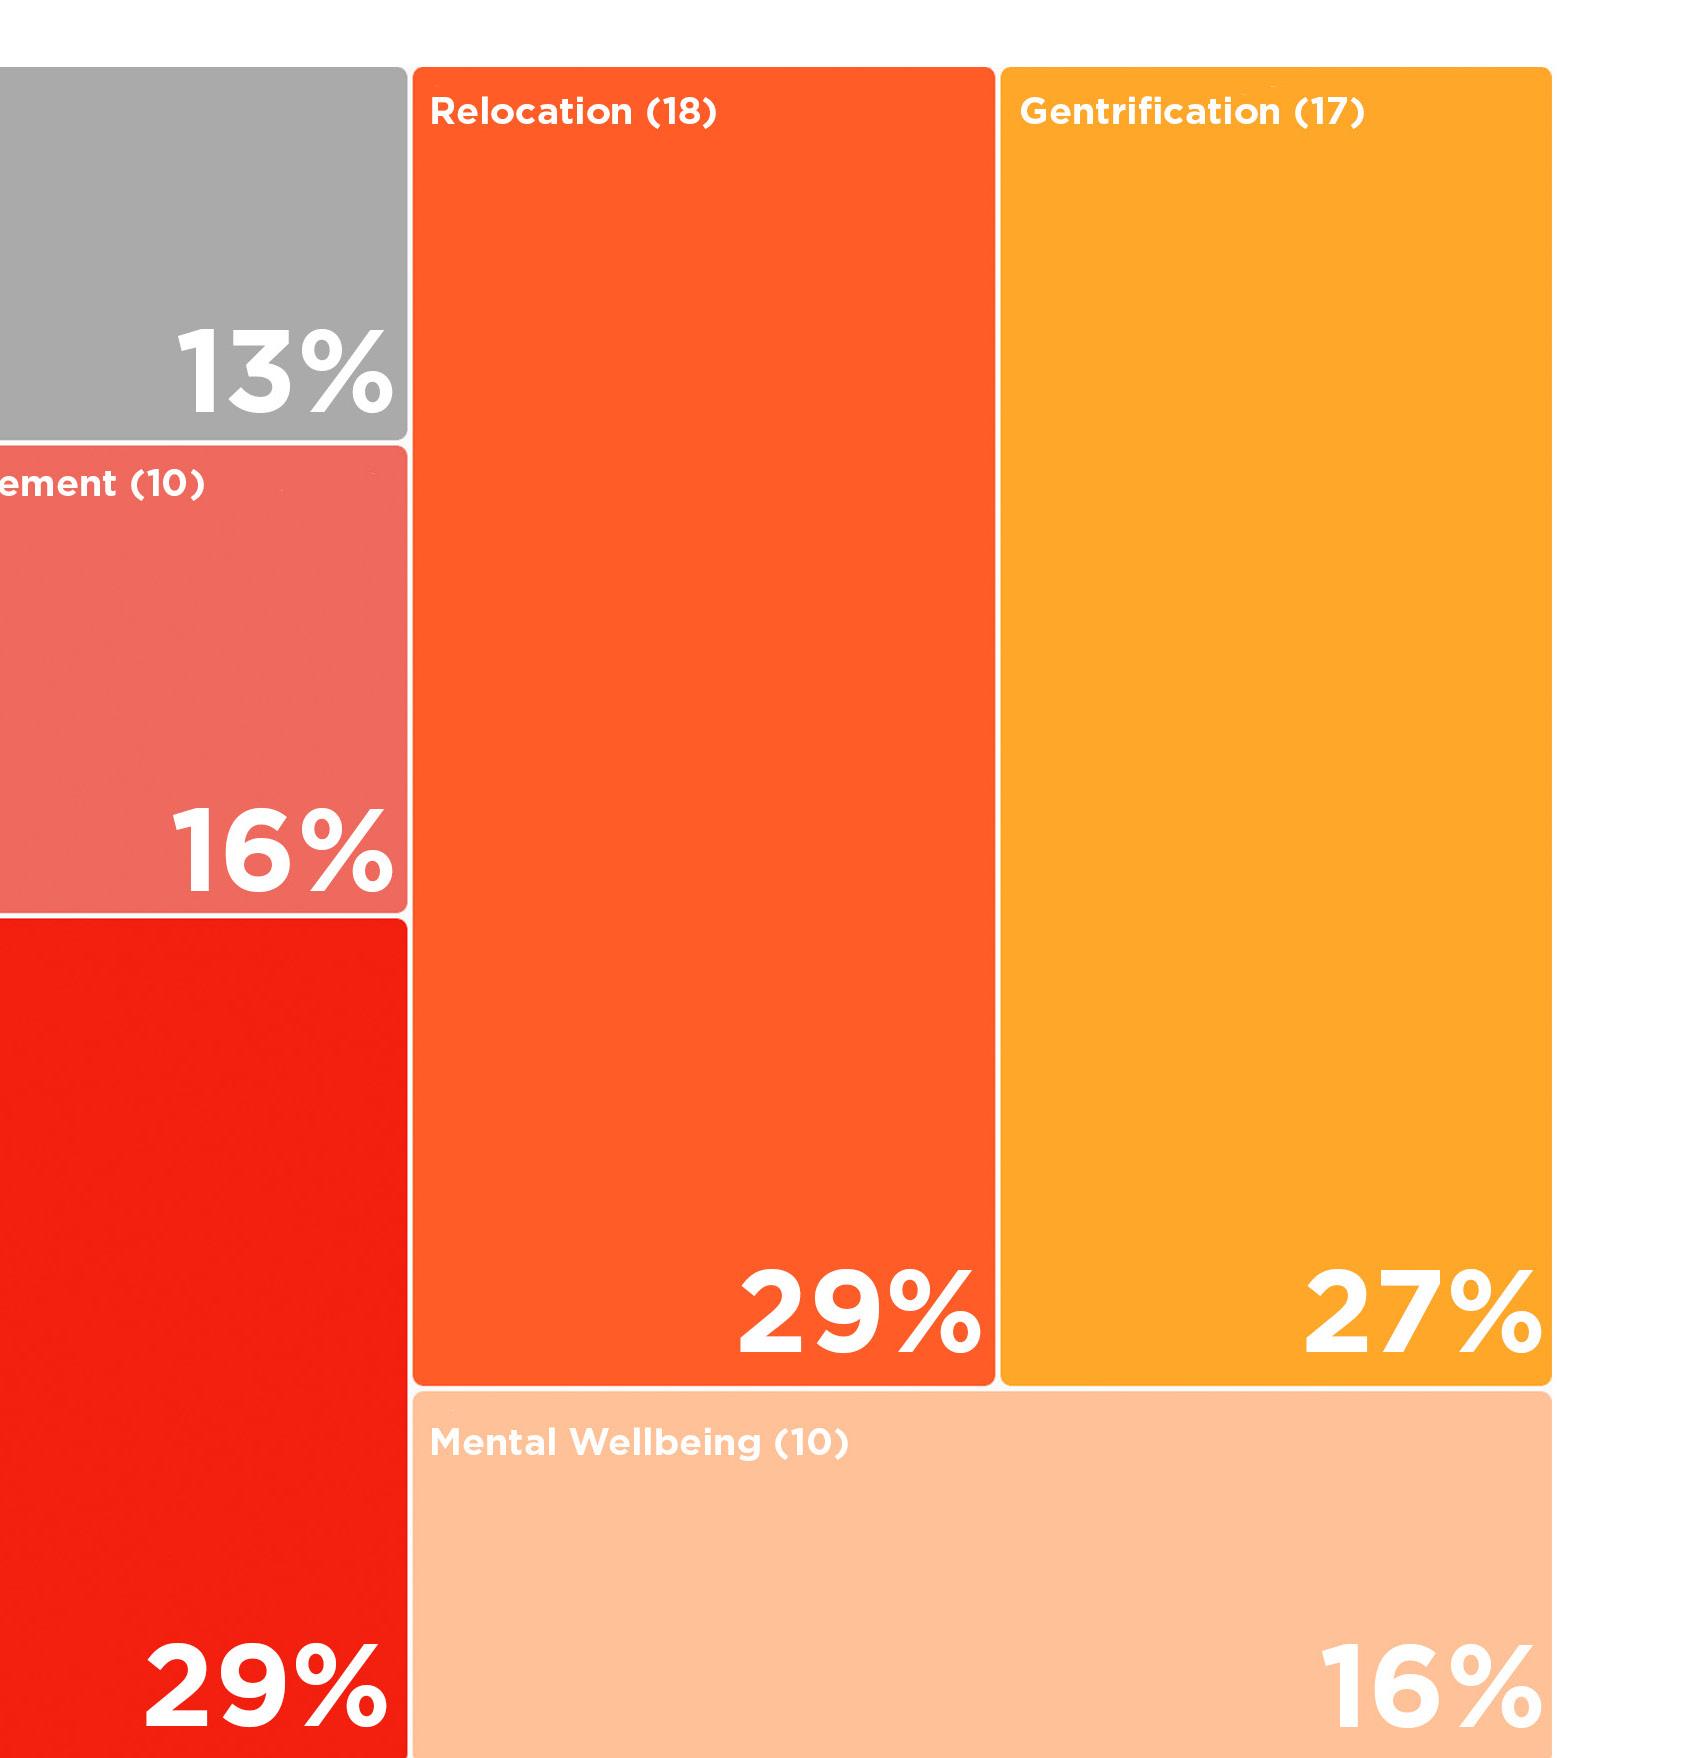
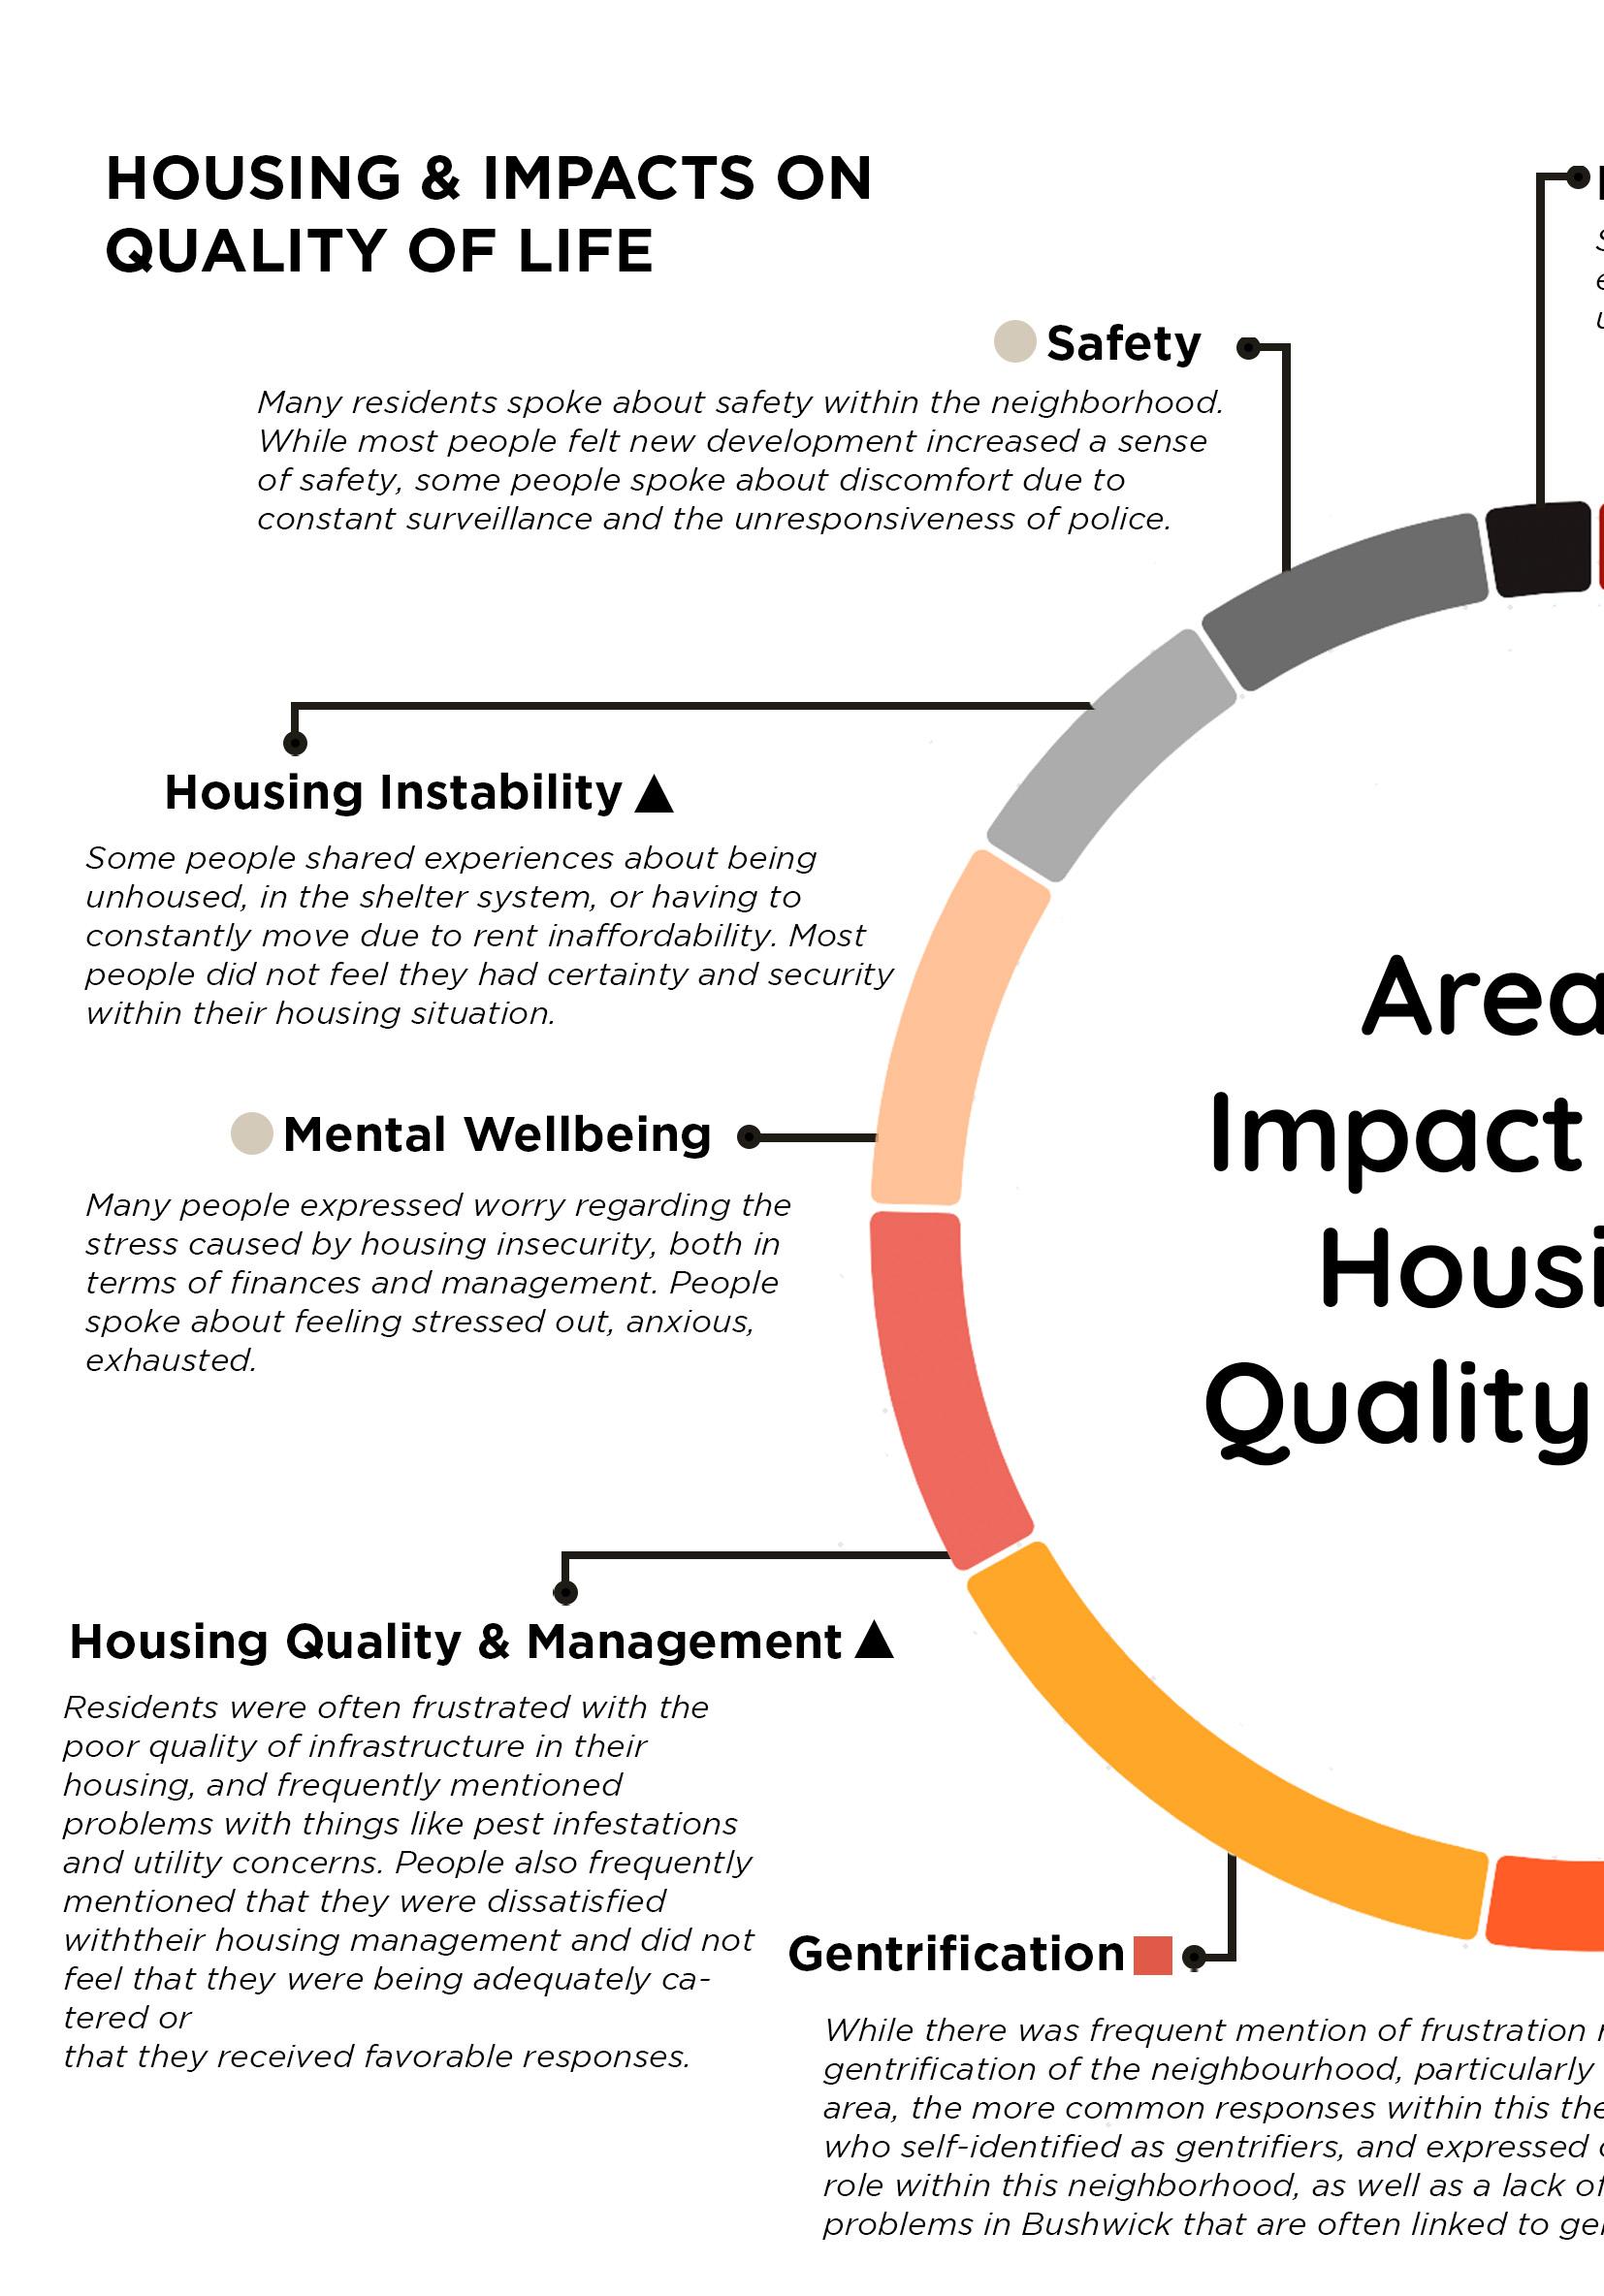
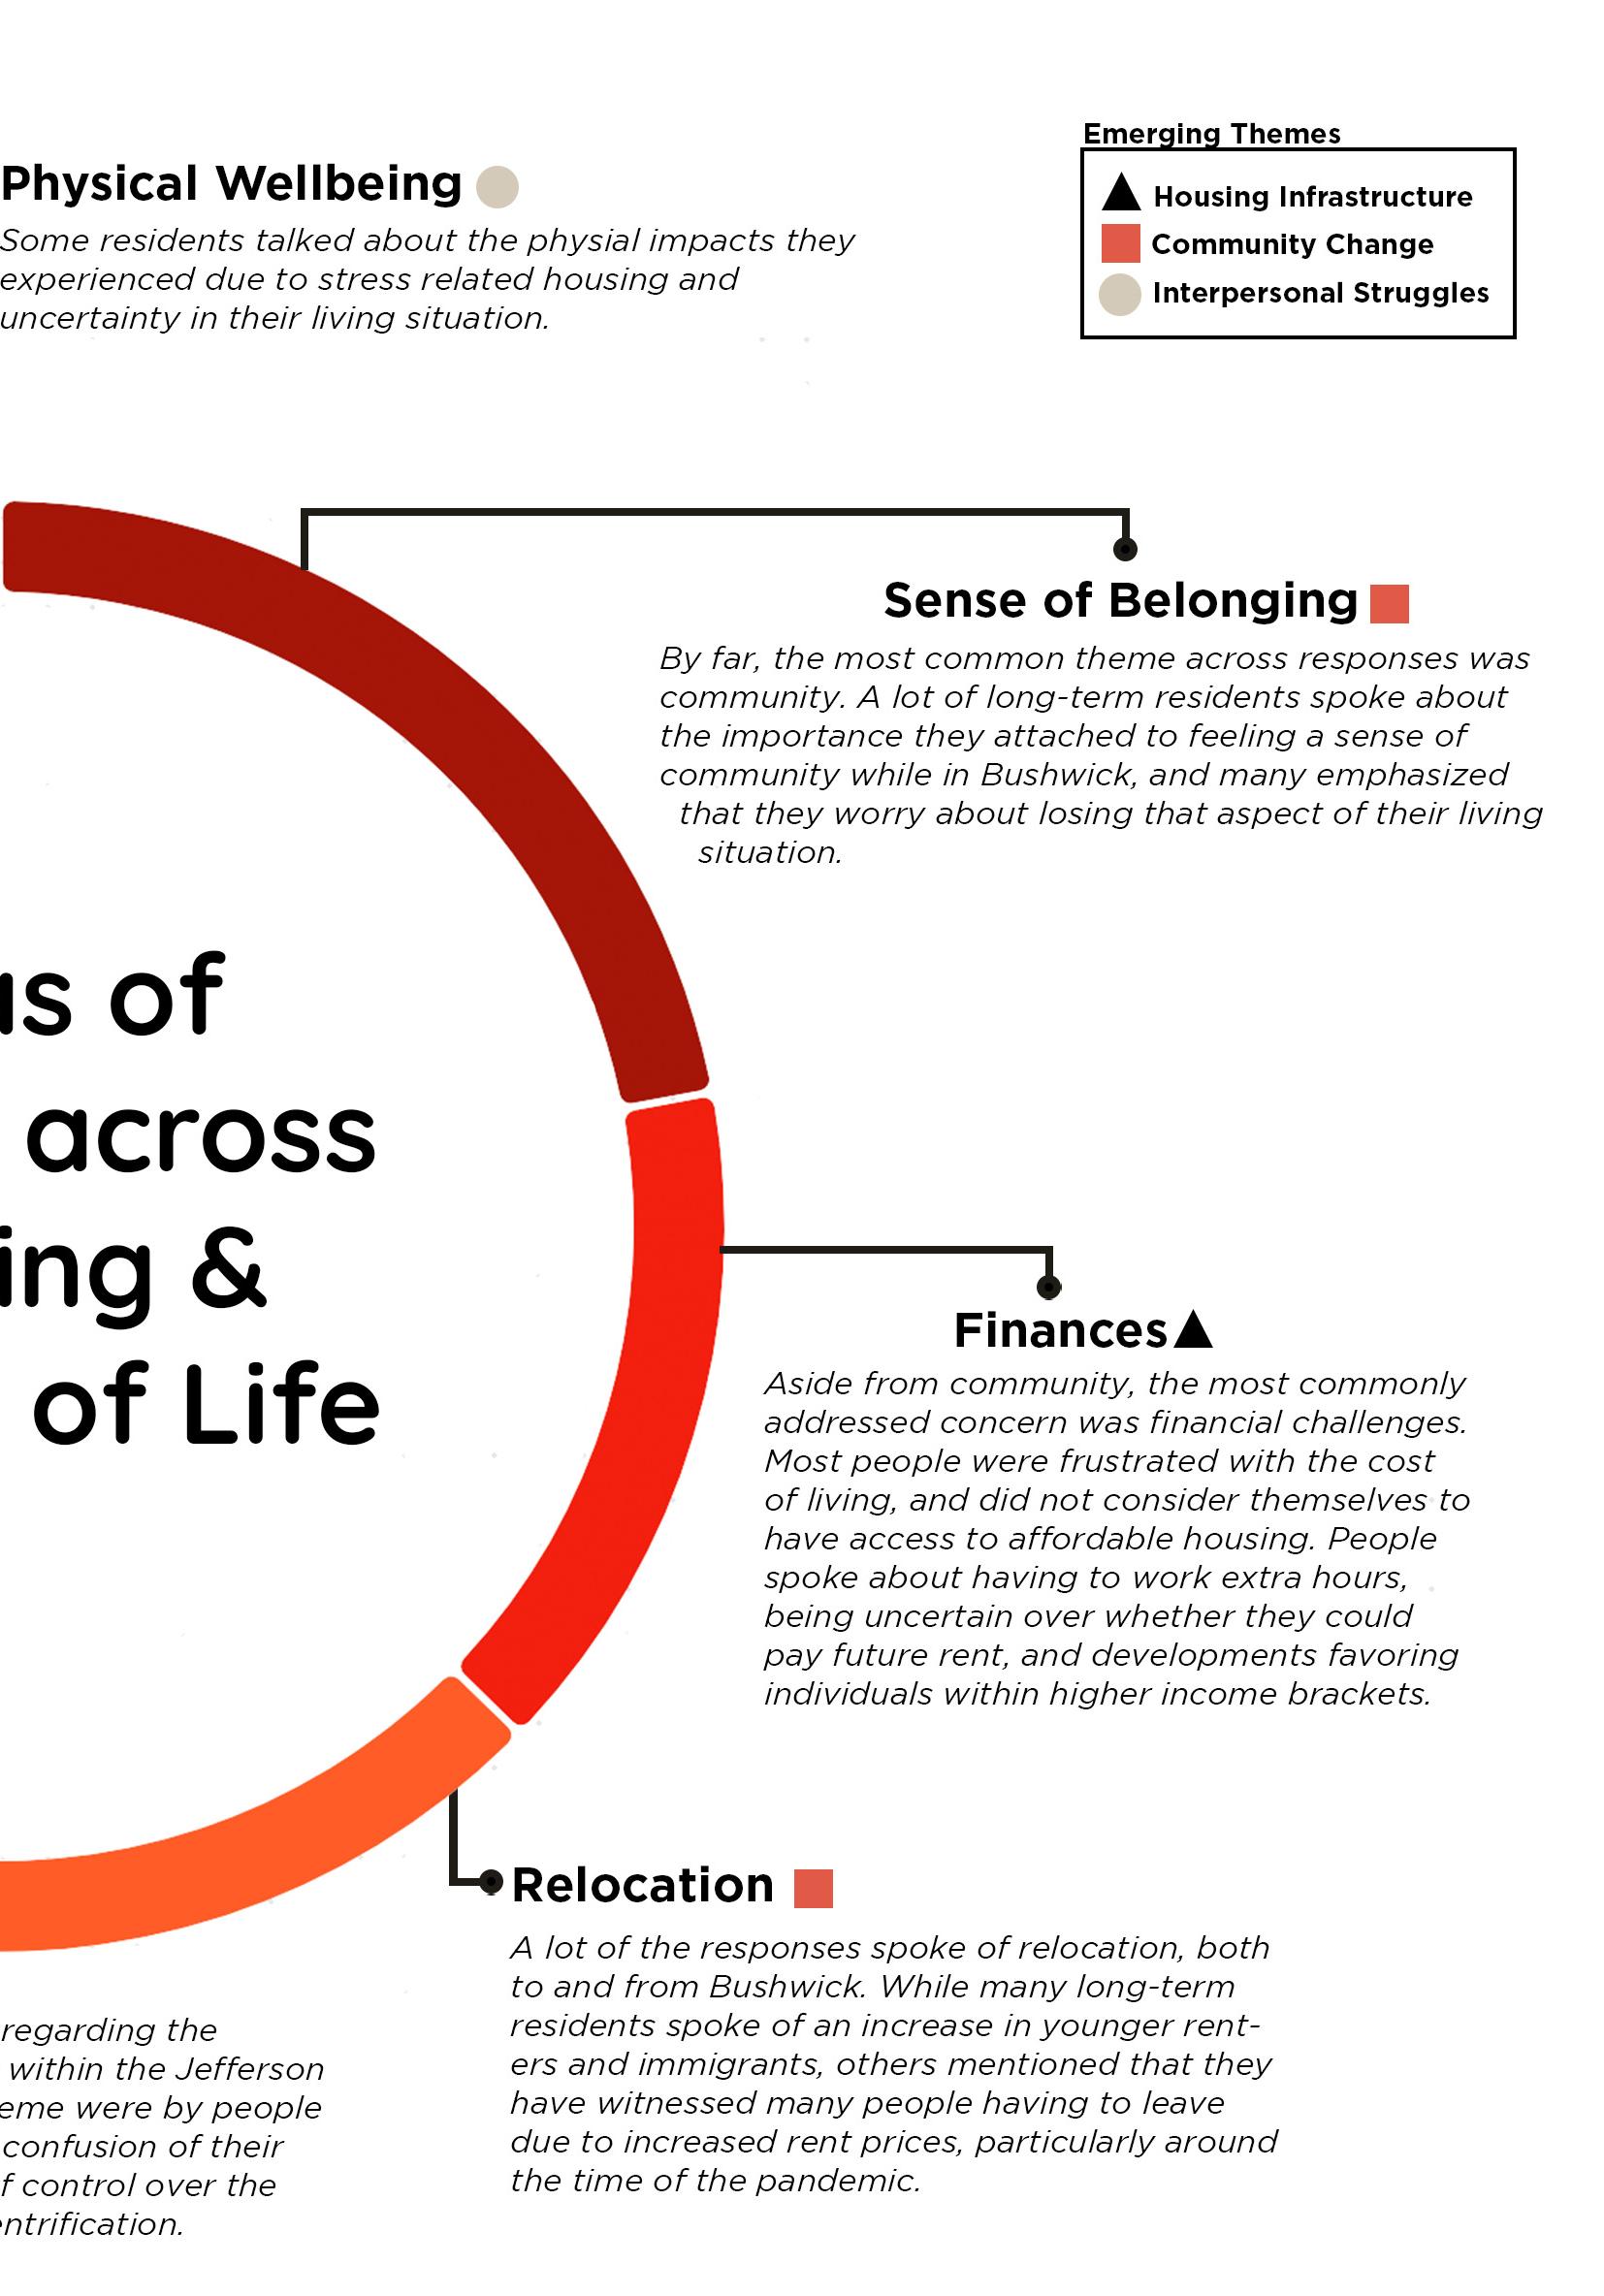
Thematic Analysis
BIBLIOGRAPHY
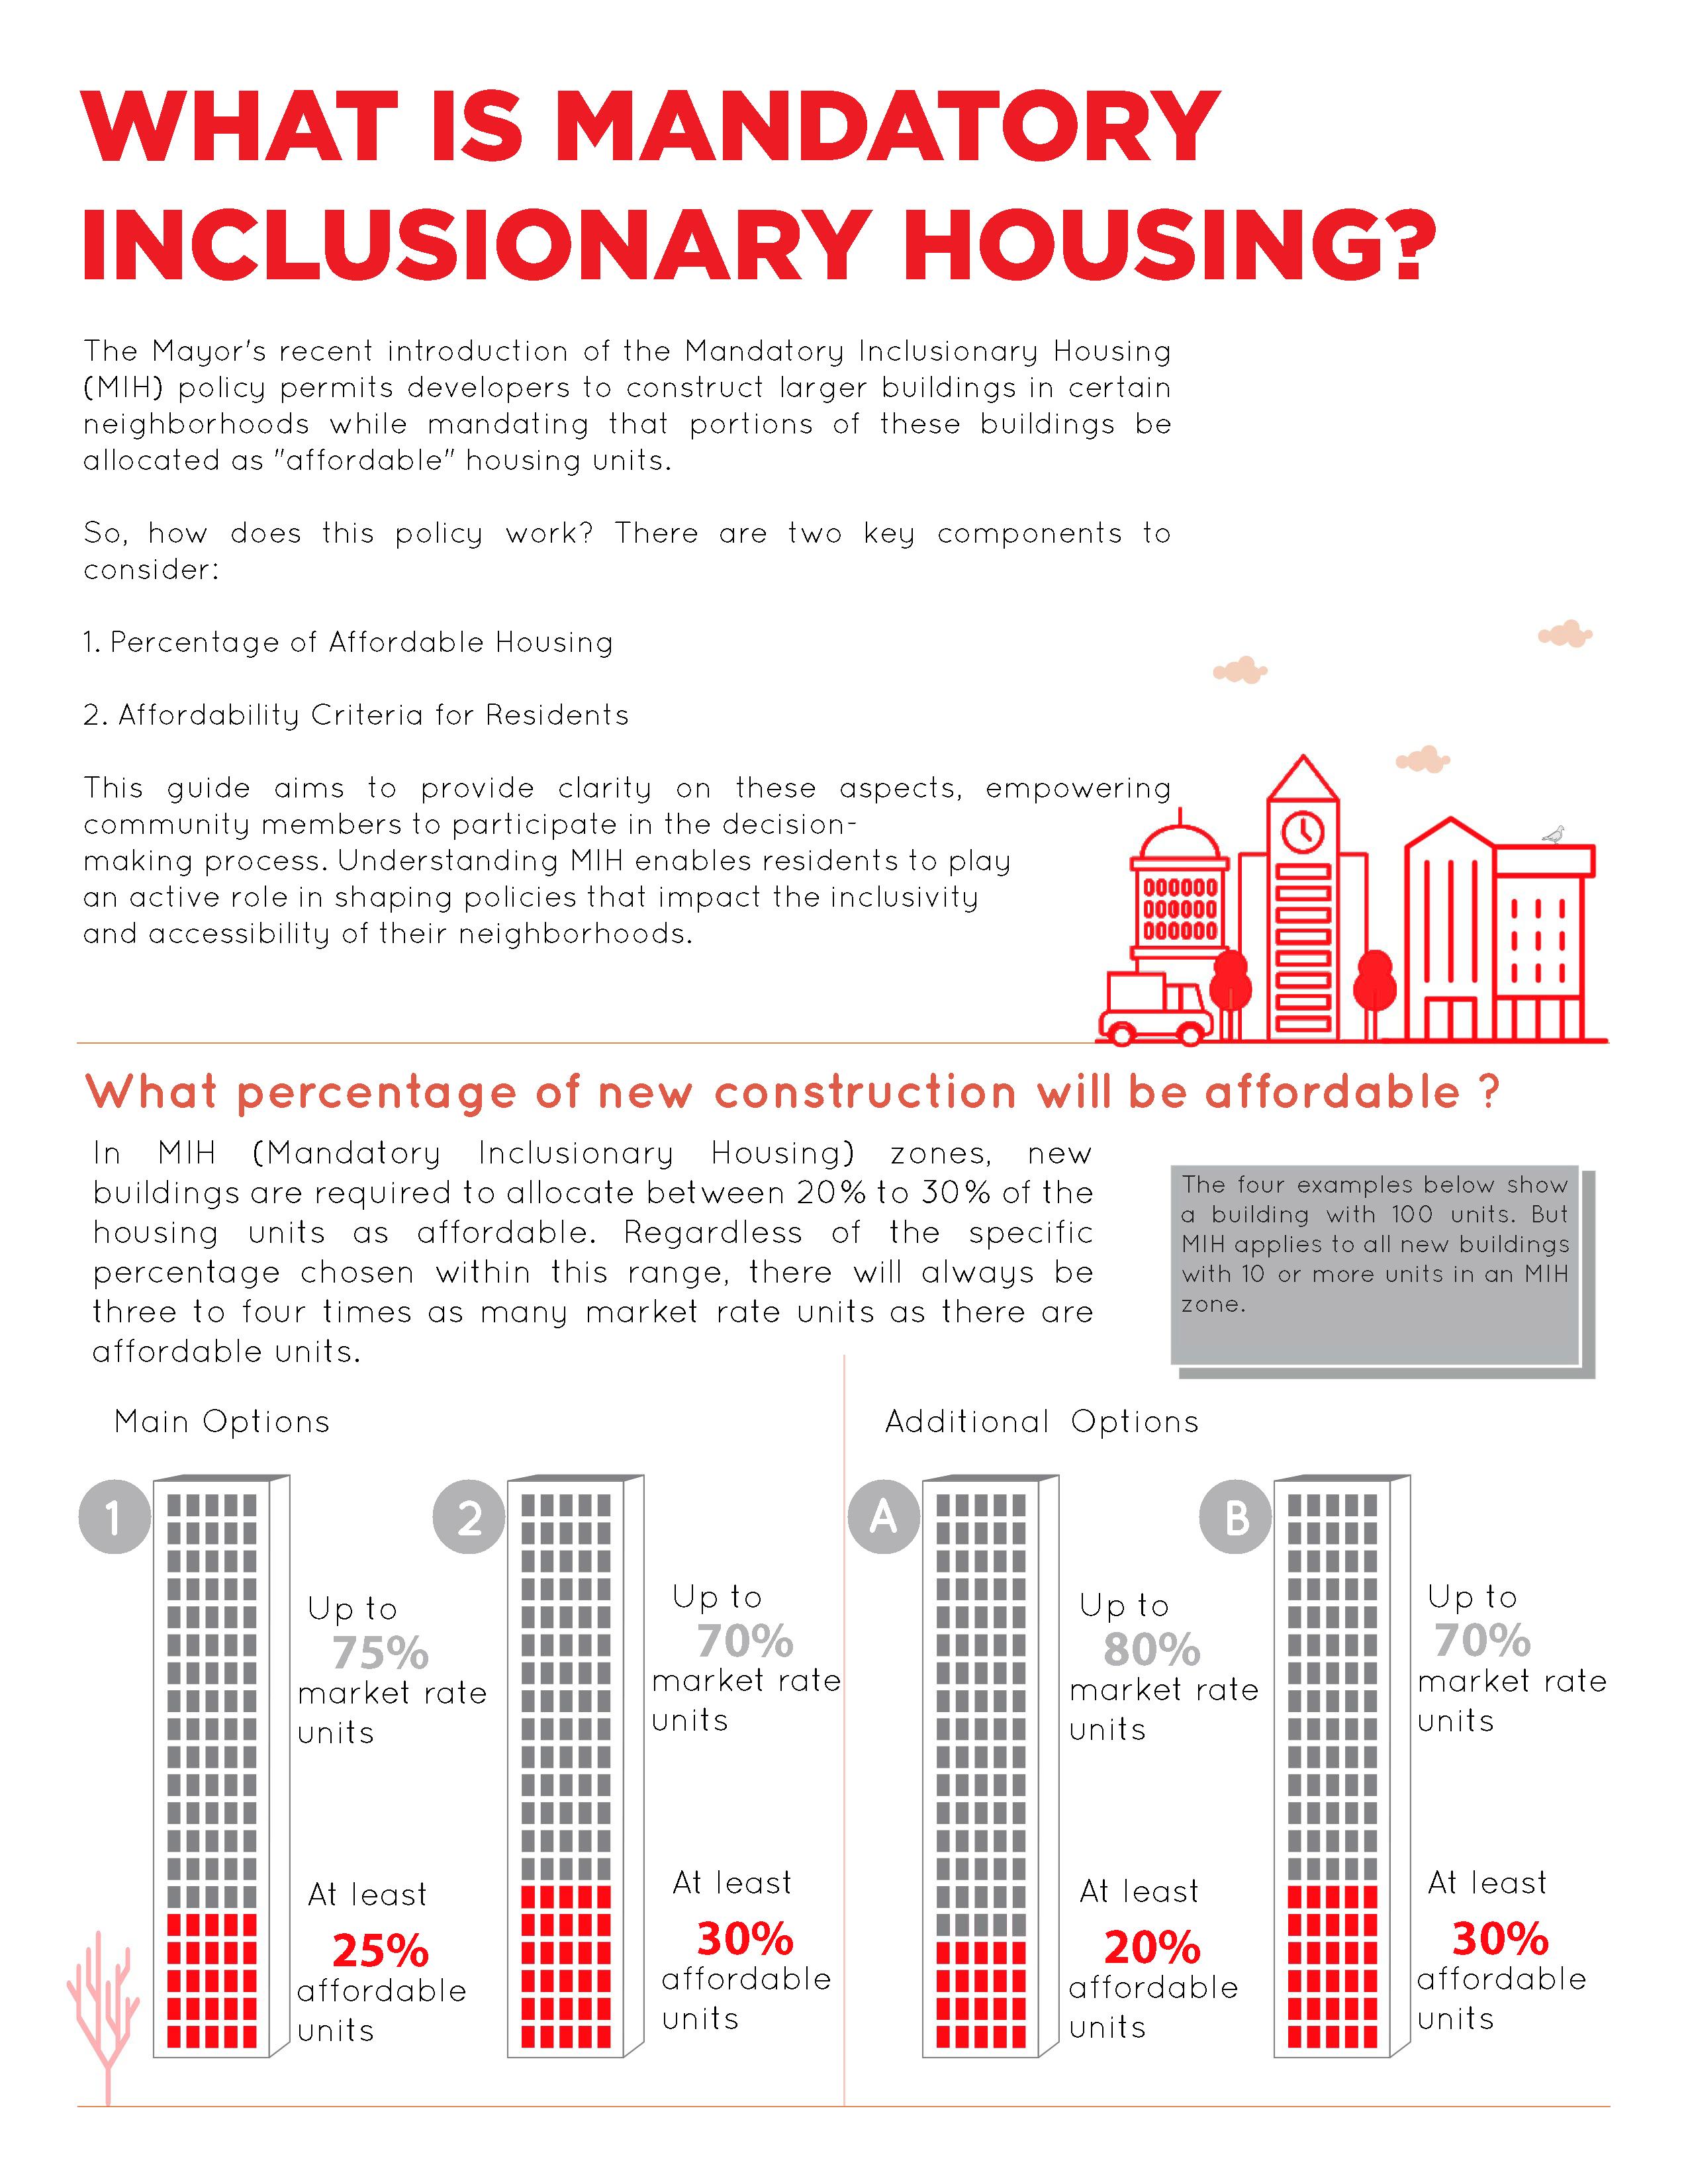
This report includes the outcomes of a participatory-action research endeavor spearheaded by the MS Design and Urban Ecologies Program’s Class of 2025, in collaboration with the Bushwick Housing Independence Project (BHIP) and fortified by the support of the El Puente Bushwick Leadership Center. Our exploration embarked on three distinct pathways of inquiry. Firstly, we ventured into Bushwick’s social and economic fabric, tracing the contours of economic, racial, and ethnic dynamics alongside fluctuations in employment rates, job availabilities, educational landscapes, and poverty thresholds. Secondly, we delved deep into the realm of Bushwick’s housing ecosystem, meticulously scrutinizing shifts in property values, rental costs, and the overall quality of housing stock. Lastly, we explored city and local plans and policies, scrutinizing their impact on housing development within Bushwick’s vibrant community. Across seven intense weeks, our research traversed the intersection of traditional, participatory, and creative methodologies, connecting statistical analysis, secondary research, oral history, radical listening, and innovative datagathering techniques. Collaborating closely with community members and BHIP leadership, students unearthed the aspirations, challenges, and dreams of Bushwick’s hardworking, immigrant tenants. The research findings are here presented in a visually compelling format, suitable for educational and organizing purposes.
Using this research, students will collaborate with BHIP to craft an action plan comprising clear goals, strategic approaches, phased implementation, and effective dissemination strategies. This plan will encompass both short- and long-term tactics, ranging from exposing the housing crisis to fostering community awareness related to tenants rights within the neighborhood. And, from the development of educational resources and organizational tools for
tenants to initiatives aimed at establishing tenant associations and spearheading anti-eviction campaigns in strategically targeted blocks or neighborhood zones.
BHIP is a community-based non profit organization whose mission is the collective strength, stability, visibility and self-determination of Bushwick’s working class and immigrant renters. BHIP’s antidisplacement work is grounded in a commitment to maintaining the social and cultural fabric of Bushwick, not just preserving individual homes but also history, culture, and community networks. In other words, the fabric of the neighborhood.
The BHIP Board is currently led by eight long-time community organizers, advocates, and cultural workers, the majority of whom identify as members of historically marginalized communities, and all of whom share professional and personal experience of displacement. BHIP’s dedicated staff, apprentices, and board of directors are steadfastly committed to revitalizing the organization following the loss of two visionary founding leaders, Father John Powis and Yolanda Coca, who tirelessly championed housing justice in Bushwick for decades.
Our research team had the opportunity to access the beautiful space of El Puente Bushwick Leadership Center, which currently lends a community space for BHIP’s organizing activities. El Puente Bushwick Leadership Center is a vibrant, safe and nurturing community for young people and their families. It offers a comprehensive year round program that integrates El Puente’s signature Membership model that focuses on holistic leadership development, one to one mentoring and project based learning. An array of skills based activities focus on achieving educational mastery and transformative social action. We are grateful to have the opportunity to use this inspiring space for this collaborative project.
PART I: BUSHWICK
BUSHWICK’S SOCIAL + ECONOMIC COMPOSITION
DEMOGRAPHIC, SOCIAL AND ECONOMIC CHARACTERISTICS OF BUSHWICK + ORGANIZATIONS
PROVIDING SOCIAL SERVICES IN THE COMMUNITY.
HISTORICAL CONTEXT
The change from the historical to the contemporary demographic and cultural landscape of Bushwick is a testament to the profound social and economic shifts to which urban neighborhoods are subject as a result of real estate speculation. An analysis of Brooklyn community 4 reveals “two Bushwicks” that, while visibly separate, are inextricably linked.1 One is composed of Bushwick’s long-term residents and the other is the realm of the gentrifying class.
Bushwick’s long-term residents are predominantly immigrant, low-income, older, LatinX, Spanish-speaking residents that have lived in the neighborhood since the 1970s, when processes like suburbanization and disinvestment led to major demographic shifts in the area.2 The white population of Bushwick dropped from 89% to 38% between 1960 and 1970 due to economic decline, which was compounded by the lasting impacts of redlining in the 1930s. This led to financial and social exclusion as well as prolonged, systemic disinvestment in the area.3 ‘White flight’, which charts the trajectory from city to suburbs, was so named because racialized and discriminatory housing policies allowed
white people to leave, while preventing lowincome communities of color from escaping the neighborhood’s worsening conditions.6 An influx of Puerto Rican and other hispanic groups began to repopulate and regenerate the Bushwick neighborhood as New Yorkers of German and Italian ancestry disappeared.
The second Bushwick of today is generally comprised of “gentrifiers,” a population of largely young, white, English-speaking residents that have been moving into the area over the last decade or so as a result of processes like rezoning and urban restructuring.7 As gentrification has extended from the manufacturing area near East Williamsburg into the residential areas of Bushwick further west, racially and economically defined stratification between the ‘two Bushwicks’ is not only visible but is materially felt by long-term residents.
118,143
*5% increase since 2006-2010
ETHNIC & RACIAL COMPOSITION
On the surface, many demographic statistics seem to paint a picture of a neighborhood still dominated by its long-term residents. For example, Bushwick’s 2015 community health profile reflects the following: 65% of residents identified as LatinX, 37% of residents were born outside of the U.S., and about 34% of the population was 25-44 years old. However, despite the appearence of long-term residents’ majority presence, the trends marking gentrification are statistically visible as far back as 2011. From 2000 to 2011, the White population in Bushwick increased from 3% to 11%, while
Race/Ethnicity: Bushwick (2017-2021 ACS Estimate)
both the LatinX and Black populations decreased (from 68% to 65% and 23% to 18%, respectively). As of 2021, the LatinX population made up just 52.2% of the overall population while the White population had risen to 22.5%, marking an 11.5% increase in a decade while the population of other racial and ethnic groups continued to decline. Additionally, the American Community Survey 5-year Estimates reveal that the population of individuals in the age range of 25-34 rose from 19% (2006-2010) to 28.7% (2017-2021), also demonstrating the continued growth of this ‘second’ Bushwick.
Race/Ethnicity: Bushwick (2006-2010 ACS Estimate)
Race/Ethnicity: Bushwick (2006-2010 ACS Estimate) Hispanic or Latinx (of any race)
Race/Ethnicity: New York City (2017-2021)
Race/Ethnicity: NewYork City (2017-2021)
Figure: Overview of Ethnic and Racial composition of New York City. Here, the difference between the racial/ethnic composition of Bushwick relative to NYC as a whole is highlighted. Particularly, while Bushwick is over 50% LatinX, NYC is only 28.9% LatinX.
RACE AND ETHNICITY SPATIAL DISTRIBUTION
White Population of Bushwick (2018-2022)
LatinX Population of Bushwick (2018-2022)
Black Population of Bushwick (2018-2022)
Asian Population of Bushwick (2018-2022)
ETHNIC & RACIAL COMPOSITION: FOREIGN BORN POPULATION
Foreign Born Population in Bushwick (2017-2021)
The most recent ACS data shows that Bushwick’s foreign born population is below that of both Brooklyn and NYC. While not drastically lower, this actually follows
Spatial Distribution of Foreign Born Population in Bushwick (2017-2021)
There are a few areas in central Bushwick where the foreign born population is more highly concentrated, and a few closer to the perimeter where this population is almost completely lacking.
the patterns of other demographic shifts in the area, as the 2006-2010 reflected a time when Bushwick’s foreign born population surpassed those of both Brooklyn and NYC.
New York State (22.5%)
Brooklyn (35.3%)
Bushwick (30.5%)
New York City (36.3%)
Place of Birth of Foreign Born Population: Bushwick (2017-2021)
Place of Birth of Foreign Born Population: Bushwick (2017-2021)
Distribution of Foreign Born Population from the Americas: Bushwick (2017-2021)
Distribution of Foreign Born Population from the Americas: Bushwick (2017-2021)
Of the 74.3% of foreign born Bushwick residents, 73.5% hail from Latin America, with prominent communities from the Dominican Republic, Mexico, and Ecuador.
ETHNIC & RACIAL COMPOSITION: CITIZENSHIP
Citizenship %: Bushwick (2017-2021)
Citizenship %: Bushwick (2017-2021)
The trends in the proportion of the population holding a U.S. citizenship follows those of the foreign born population. While the discrepency between Bushwick, Brooklyn, and New York City,
this data demonstrates a pivot away from a time when Bushwick’s non-citizen population (27.2%) surpassed those of both Brooklyn (16.7%) and NYC (17.9%) (per 2006-2010 ACS).
New York State (90.7%)
Kings County (86.5%)
Bushwick (84.9%)
New York City (84.8%)
ETHNIC & RACIAL COMPOSITION: LANGUAGE
Language Spoken at Home: Bushwick (2017-2021)
Language Spoken at Home: New York City (2017-2021)
The figures below represent the language that New York City households, and Bushwick households specifically, identified as their primary shared language in the home. In Bushwick, over 50% of households report a language besides English as their primary shared language. This measure does not take into account the multilingual nature of many households, just primary selfreported language spoken by all members of the household.
While NYC as a whole also reflects a composition of almost 50% non-English households, a little over 40% of non-English households in Bushwick are Spanishspeaking households compared to just 23.5% of all non-English NYC households. This means that almost half of NYC’s Spanish households (as self-reported primary household language) are in Bushwick (10%).
CHANGING DEMOGRAPHICS
Although Bushwick has seen changes like lowered poverty and unemployment rates over the past several years, rather than indicating overall economic improvement, these statistics suggest displacement of long-term residents as a result of gentrification, with an influx of college-educated young professionals shifting the demographic landscape.
Long-term residents of Bushwick are generally older but it is critical to examine how gentrification is affecting the outcomes and opportunities for youth in the neighborhood. At the turn of the century, 54% of Bushwick households included residents 18 years or younger. In 2017, that number was 30%. This is a symptom of gentrification, whereby multi-generational families with children are priced out and collegeeducated young professionals replace them.
Overcrowding is a major issue in New York City schools yet Bushwick faces the issue of under crowding, which in turn can jeopardize funding for school resources.
The issue of under crowding and ensuing lack of funding is particularly crucial in Bushwick; 35% of the students at P.S. 123 are classified as English Language Learners and at P.S. 106, 28% of kids have a disability, indicating a need for extra resources to support these students. In fact, the
Age, Education + Gentrification IN 2000, 54% OF HOMES INCLUDED RESIDENTS 18 YEARS OR YOUNGER. IN 2017, THAT NUMBER WAS 30%
35%
OF THE STUDENTS AT
P.S.
123 ARE ENGLISH LANGUAGE LEARNERS AND AT P.S. 106, 28% OF KIDS HAVE A DISABILITY
Statements of Community District Needs and Community Board Budget RequestsFiscal Year, 2024 stated the most important issues related to Youth, Education and Child Welfare as; After school programs - Support services for special needs youth (disabled, immigrant, non-English proficient, etc.)Remote learning and technology - Schools and educational facilities (Maintenance).
The statements acknowledged how “dynamic educational and workforce development programming” were critical to reducing vulnerability to poverty and creating future opportunities for low-income families experiencing higher costs of living during Bushwick’s gentrification process. However, as young couples begin to have children, overcrowding may arise as a pertinent issue in gentrifying areas of Bushwick.
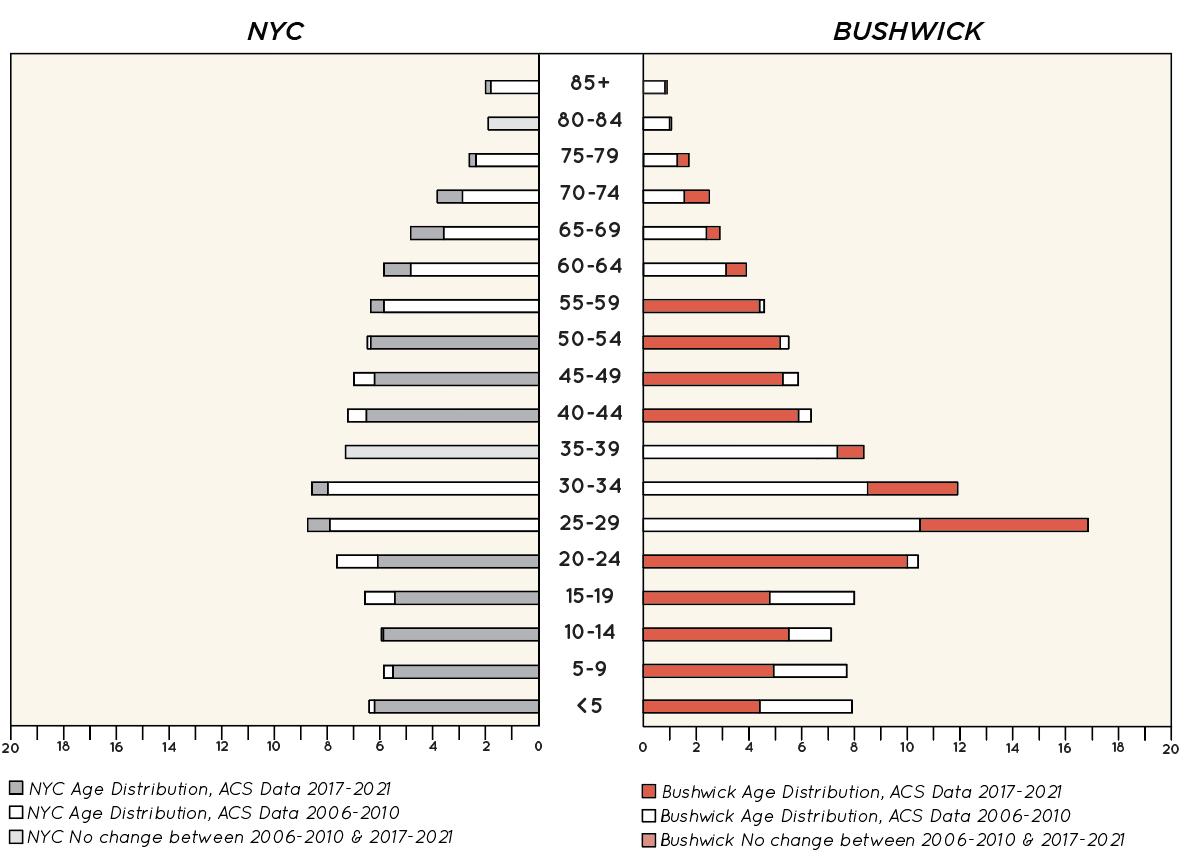
Age distribution in New York city has shifted in the past 15 years but the most pronounced change is visible in Bushwick, specifically across the 25-34 and the <5 - 19 age range. This graph suggests the impact
An excerpt frvvom the Gothamist article, Displaced Bushwick Families: Landlords ‘Would Rather Rent To A White Man With A Dog Than Me With My Kids’ (2016), is testament to the connection between shifting age demographics and displacement: One reason families were being forced to leave the neighborhood, numerous residents reported, was that Bushwick landlords wouldn’t rent to families with children— something that remained a common practice even though it’s illegal under the federal Fair Housing Act. “When you call the
that the influx of young, college-educated professionals in the past decades has had on the school-age population. One can see the trend of families with children being displaced by the young professional class.
number and ask, ‘Do you have an apartment for rent?’ the first question he asks is if you have children,” said Diana Zarumeno, who along with her husband and three pre-school-age kids was evicted from her Bushwick apartment; they ended up having to move across the Queens border to a more expensive apartment in Ridgewood. When she called realtors to ask about available apartments, she said, the answer was always,
“If you have children, then no, the apartment is already rented.”
CHANGING DEMOGRAPHICS
Education in Bushwick
Educational opportunities for public school students are threatened by Charter Schools, with attendance of the latter having more than quadrupled from 2010 to 2019.
Charters are publicly funded private schools and typically outperform public schools. They are generally made up of black and latinx students and those who support charter schools emphasize their academic rigor and the increased opportunities for these students. However, the rise of charter schools is criticized for siphoning “millions of dollars from public school funding, in addition to increasing rent prices and tuition for those who rely on the current system.”
A quality education is acknowledged as a key indicator for better socio-economic outcomes, however Bushwick’s elementary school absenteeism rate is higher than the rate for NYC overall. Seven out of 10 high school students in Bushwick graduate in four years, lower than the citywide rate. This correlates with a higher rate of poverty in Bushwick (25%) than the rest of New York (20%) and a higher rate of assault-related hospitalizations (72 per 100,000 people in Bushwick vs. 59 for NYC and for Brooklyn).
The map below visualizes the location of elementary, middle, and high schools in Bushwick.
Bushwick Boundary
Highest Level of Education Acheived % 25yrs and Older
(2015 - 2019)
less than high school
high school grad or some college
college grad
source: u.s. census bureau, acs 2015-2019
This data visaulization highlights the discrepancy in education levels in bushwick compared to the rest of brooklyn and nyc overall. despite an exponential increase in college-educated new residents since 2000, bushwick residents overall still have significantly lower rates of high school and college graduation levels.
Bushwick also has an incarceration rate of 610 per 100,000 adults 16 years and older, far exceeding the Brooklyn and NYC average. This does not only indicate higher levels of crime but also higher levels of policing in the neighborhood.
Data on Physical Violence Reported in Bushwick non-fatal assault hospitalizations (per 100,000 people)
source: NewYork state Dept. of health, Sparcs ,2012-2014
EDUCATIONAL ATTAINMENT
Demographic shifts due to gentrificaiton and displacement can also be reflected in changes in statistics concerning educational attainment. Whereas nearly half of Bushwick’s population surveyed in the 2006-2010 ACS achieved a maximum educational attainment of less than a high school diploma (42.7%), that number has been cut in half (21.9%) while the number of residents achieving a maximum
Maximum Educational Attainment: Overview
attainment of a Bachelor’s degree has nearly tripled (9.8% to 26.1%) in the 20172021 ACS. While this could reflect a number of trends from the last few decades, like increased access to education in general, it also certainly reflects the influx of individuals from the “gentrifier” population into Bushwick and displacement of some of the long-term resident community.
Bushwick (2006-2010)
Bushwick (2006-2010)
Bachelor’s Degree
High School Diploma, GED, or equivalent credential
Spatial Distribution: Residents of Bushwick with a Bachelors Degree (2018-2022)
Bushwick (2017-2021)
Bushwick (2017-2021)
New
(2017-2021)
NewYork City (2017-2021)
Less than a High School Diploma Graduate or Professional Degree
Some college, no degree
Associate’s Degree
Maximum Educational Attainment: Less than High School Diploma
Maximum Educational Attainment: Less than High School Diploma
Maximum Educational Attainment: Bachelor’s Degree
Maximum Educational Attainment: Bachelor’s Degree
Measures of economic health for the neighborhood also accentuate the effects of gentrification in the area. Although Bushwick has seen changes like lowered poverty and unemployment rates over the past several years, rather than indicating overall economic improvement, these statistics
Unemployment Rate
suggest displacement of long-term residents as a result of gentrification, with an influx of college-educated young professionals shifting the demographic landscape. In fact, from 2000 to 2011, the percentage of households with an income of $60,000 or more increased from 26% to 34%.
Quickly following this increase was a decline in “the share of apartments on the market that are affordable to households with incomes at 80% of the Area Median Income” from 65.2% in 2009 to 45.5% in 2017. Thus, seemingly positive
shifts in Bushwick’s economic conditions may actually reflect practices like tenant harassment and eviction, as well as a lack of affordable housing, which have all contributed to the displacement of longterm residents.
COMMUNITY NEEDS
Bushwick Community Board 4
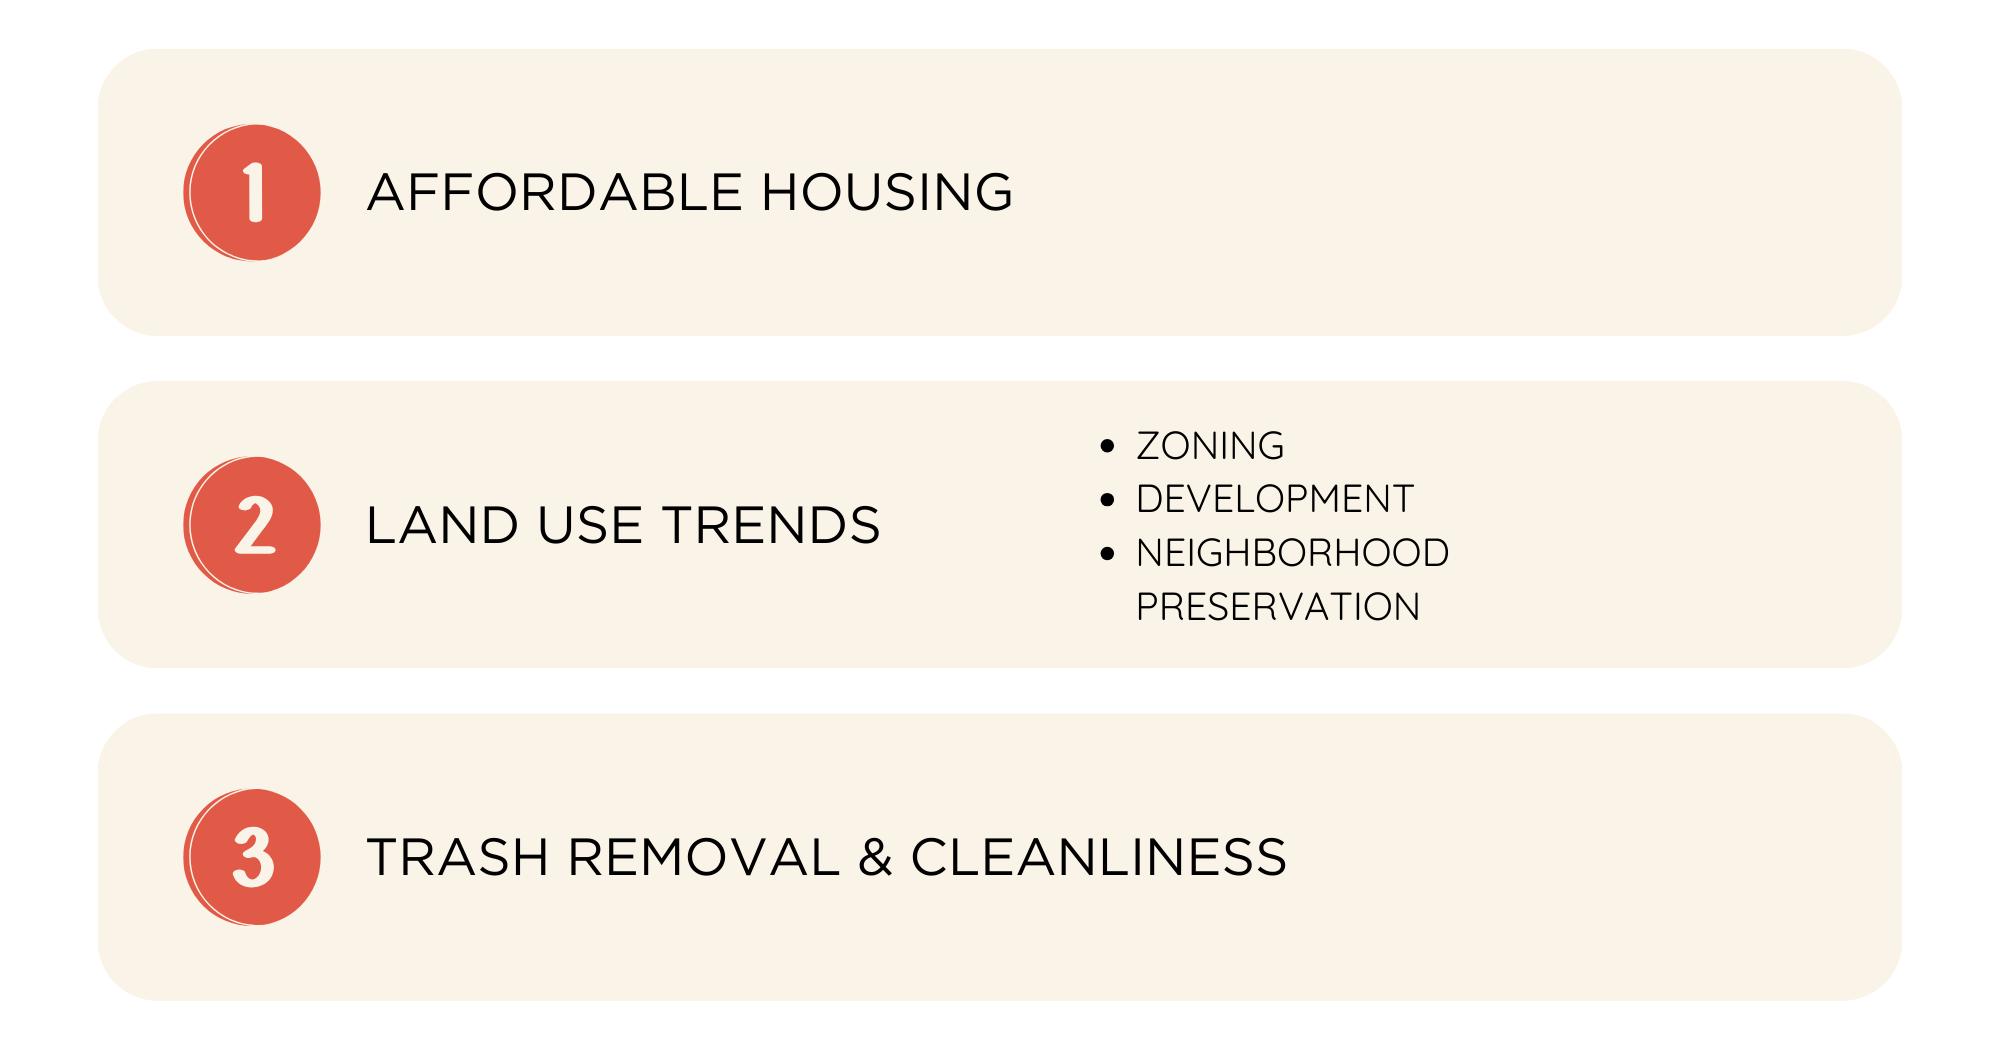
Bushwick’s community board is one of 59 in New York City. Every January, each community board holds an annual meeting to prepare a “Statement of Community District Needs and Community Board Budget Requests.” Through these chartered mandates, board members are able to share the needs of community members and discuss the top issues impacting their neighborhoods. Alongside voicing
the opportunities in the community with city agencies, the budget request also provides valuable information for elected officials, planning priorities, and research purposes. Bushwick’s (Community District 4) Fiscal Year 2024 Request highlighted three pressing issues; Affordable Housing, Land Use Trends (zoning, development, neighborhood preservation), and Trash Removal & Cleanliness.
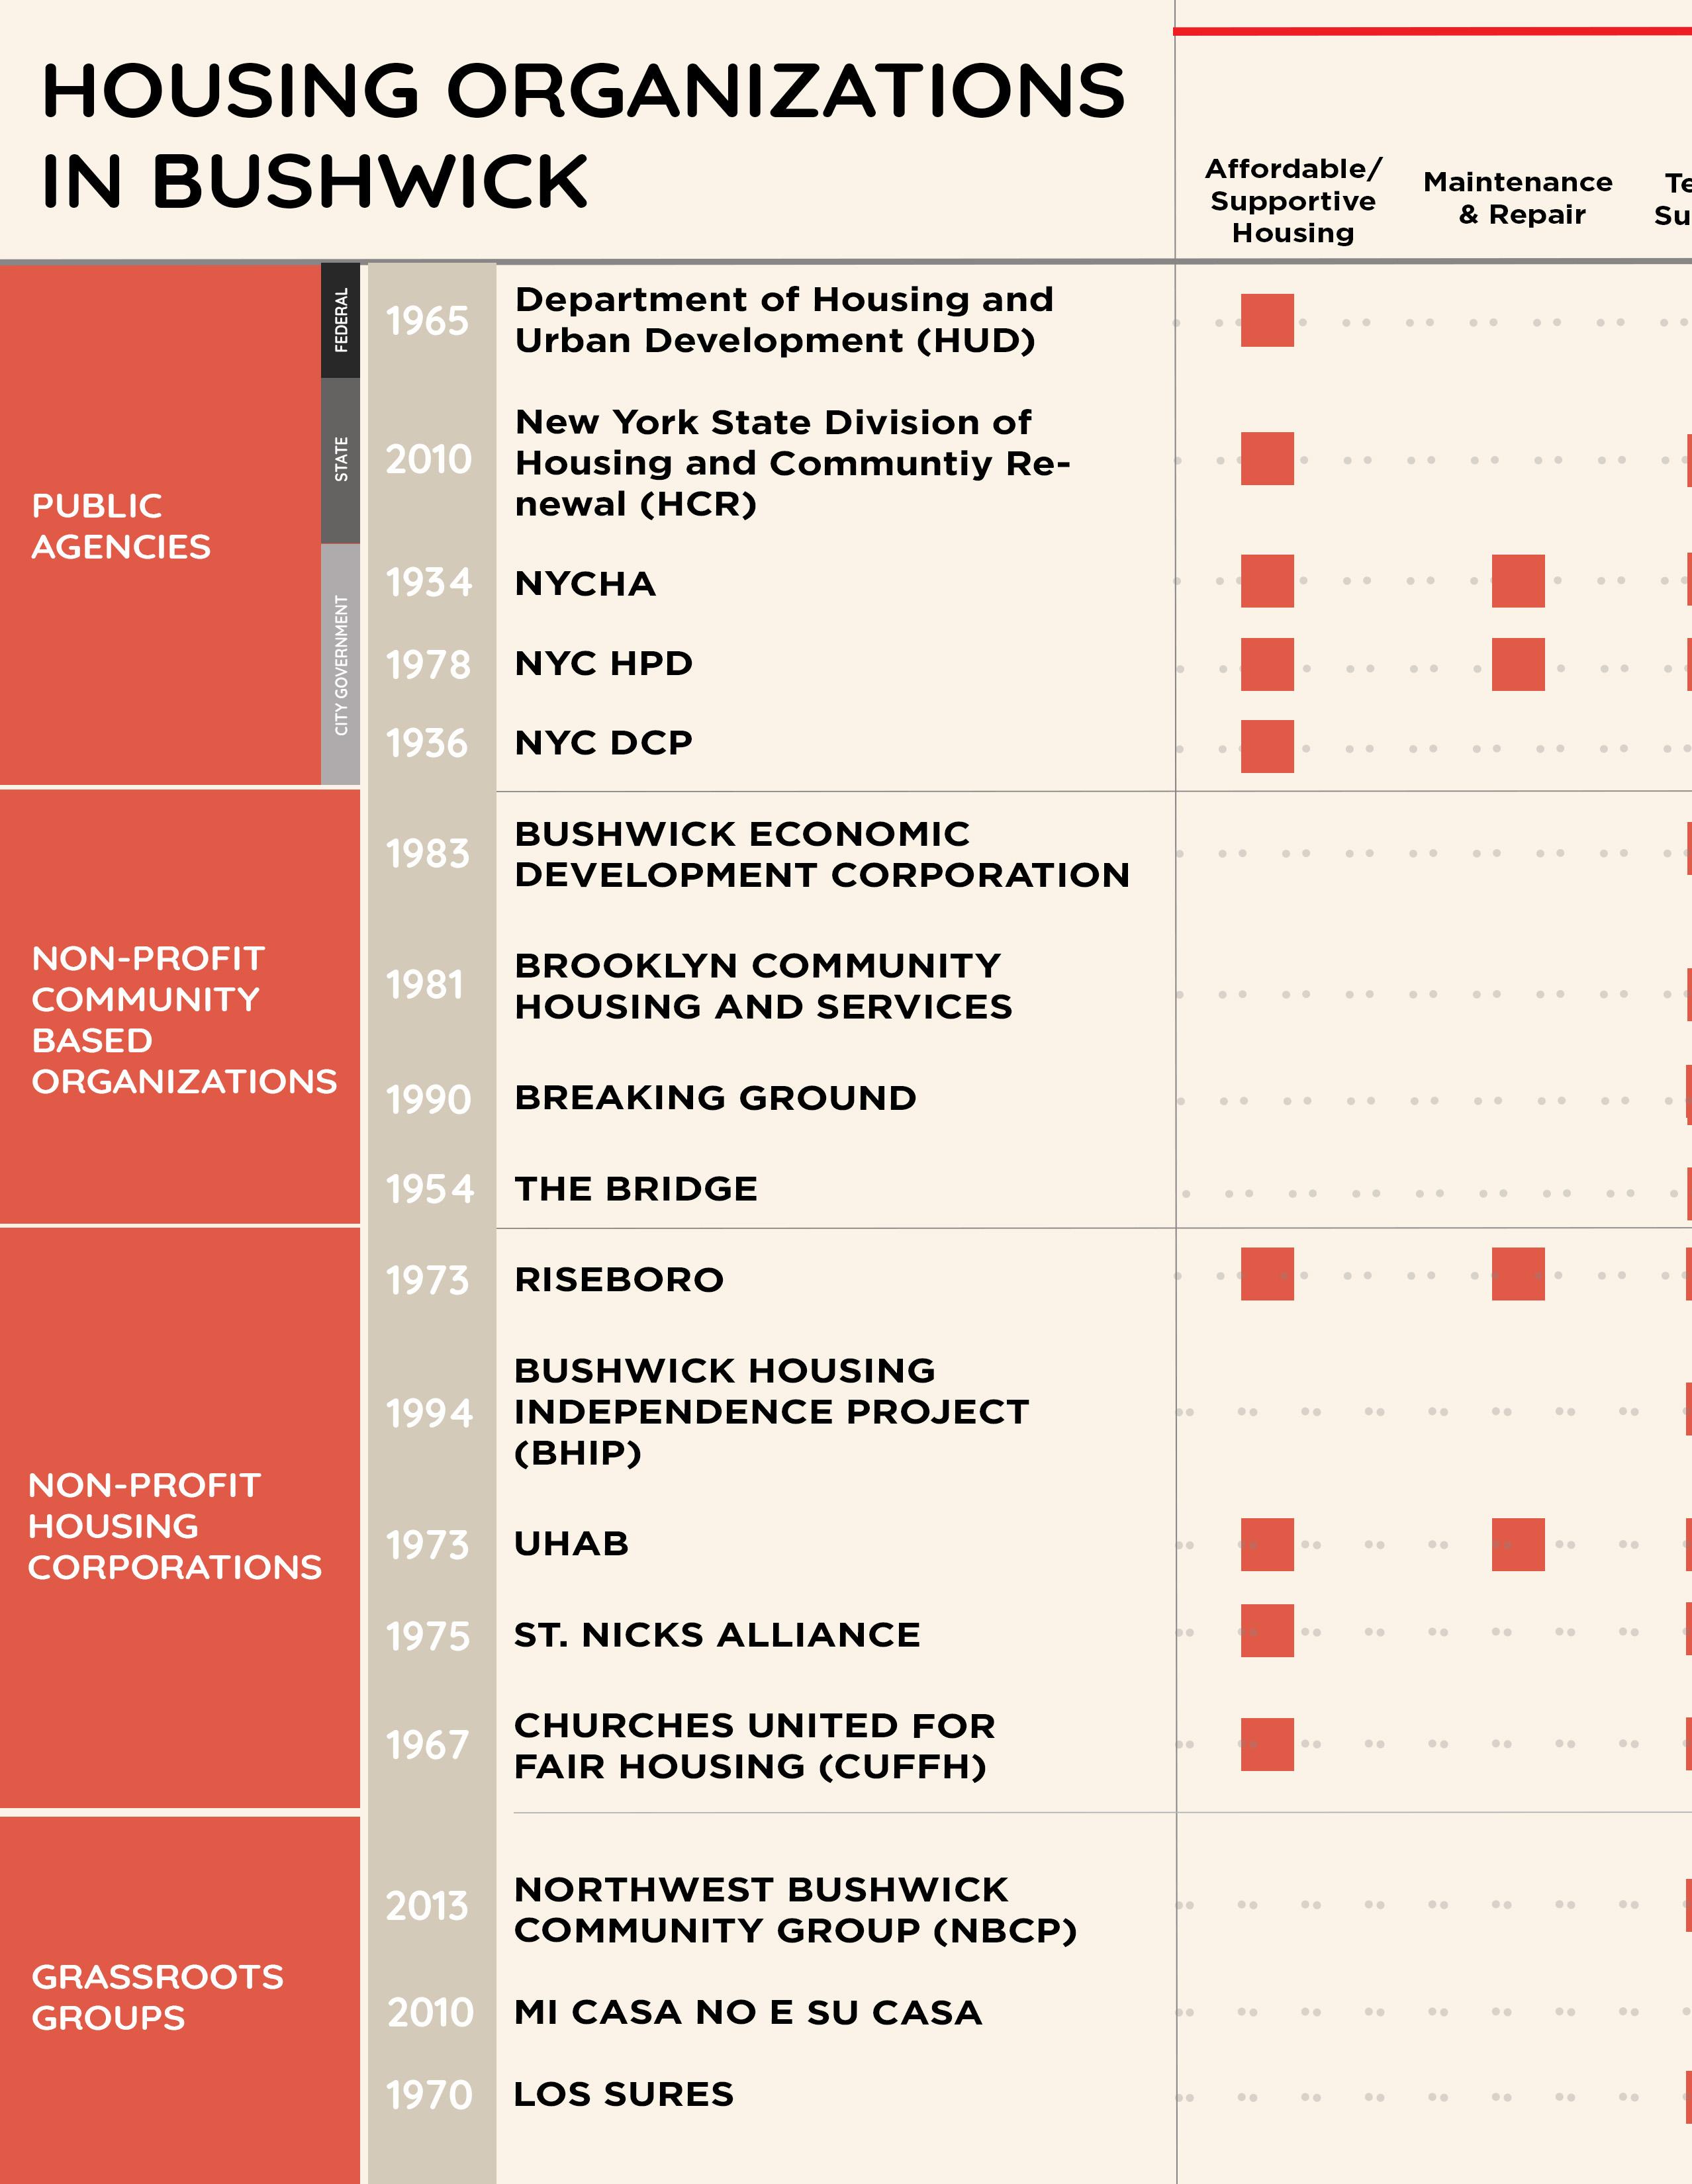
The chart above compares the six largest nonprofit social service organizations providing aid in Bushwick. Listed by chronological order, all of these agencies flex in more than one speciality and overlap in services provided. The services are expressed by icons which are labeled on the key.
Riseboro is the largest social service organization in Bushwick. With over 31+ programs offered and 11 locations, their presence is felt throughout the community. Rise focuses on “holistic community revitalization” and does so by developing
neighborhood assets. Their three main goals since 2020 have been to fight inequalities, build community, and expand impact.
SCO Family Services is a social service organization that serves Bushwick through the forms of food security, family counseling & support, and youth & after school programming. SCO spans across other parts of Brooklyn, Queens, Long Island, and the Bronx. Their main focus is to deliver human services to children, families, and adults in underserved communities.
The Bushwick Multi-Service Center is a fourstory facility that houses approximately 12 health and human service programs. The services range from mental and primary health care, to job referrals and placement, to legal services and also emergency food pantries. The building also houses other not-for-profit organizations including: Brooklyn Community Board #4, Family Services Network of New York (FSNNY), and SCO Family of Services.
St. John’s Bread & Life focuses on addressing the hunger needs of Bushwick. Their services within food security include: a food pantry, grab & go meals, a mobile soup kitchen, and a mobile market program. The organization also assists community members with applying for SNAP benefits, Medicare, Medicaid, Social Security, etc., has an on-site health clinic, and can provide legal services.
Latino children. Throughout the years CHFS has expanded to provide mental health counseling, foster care services, and youth leadership & after school programs. Their main goal is to empower children, youth, and families with “opportunities for success and self-reliance” while reinforcing their sense of culture and self-identity. Make the Road New York (MRNY) is the largest progressive grassroots immigrantled organization in the state that also offers avenues of social services. In the health world, MRNY provides assistance with health insurance, food stamp enrollment, emergency food services, and bilingual health and safety training. MRNY also provides legal guidance, adult literacy classes, job training programs, and youth & after school programming.
BUSHWICK’S HOUSING CONDITIONS
:
PROPERTY VALUES, RENT
COST,HOUSEHOLDS RENT BURDEN, RENT
CONTROL HOUSING, PUBLIC HOUSING;
ORGANIZATIONS PROVIDING HOUSING
SERVICES IN THE COMMUNITY.
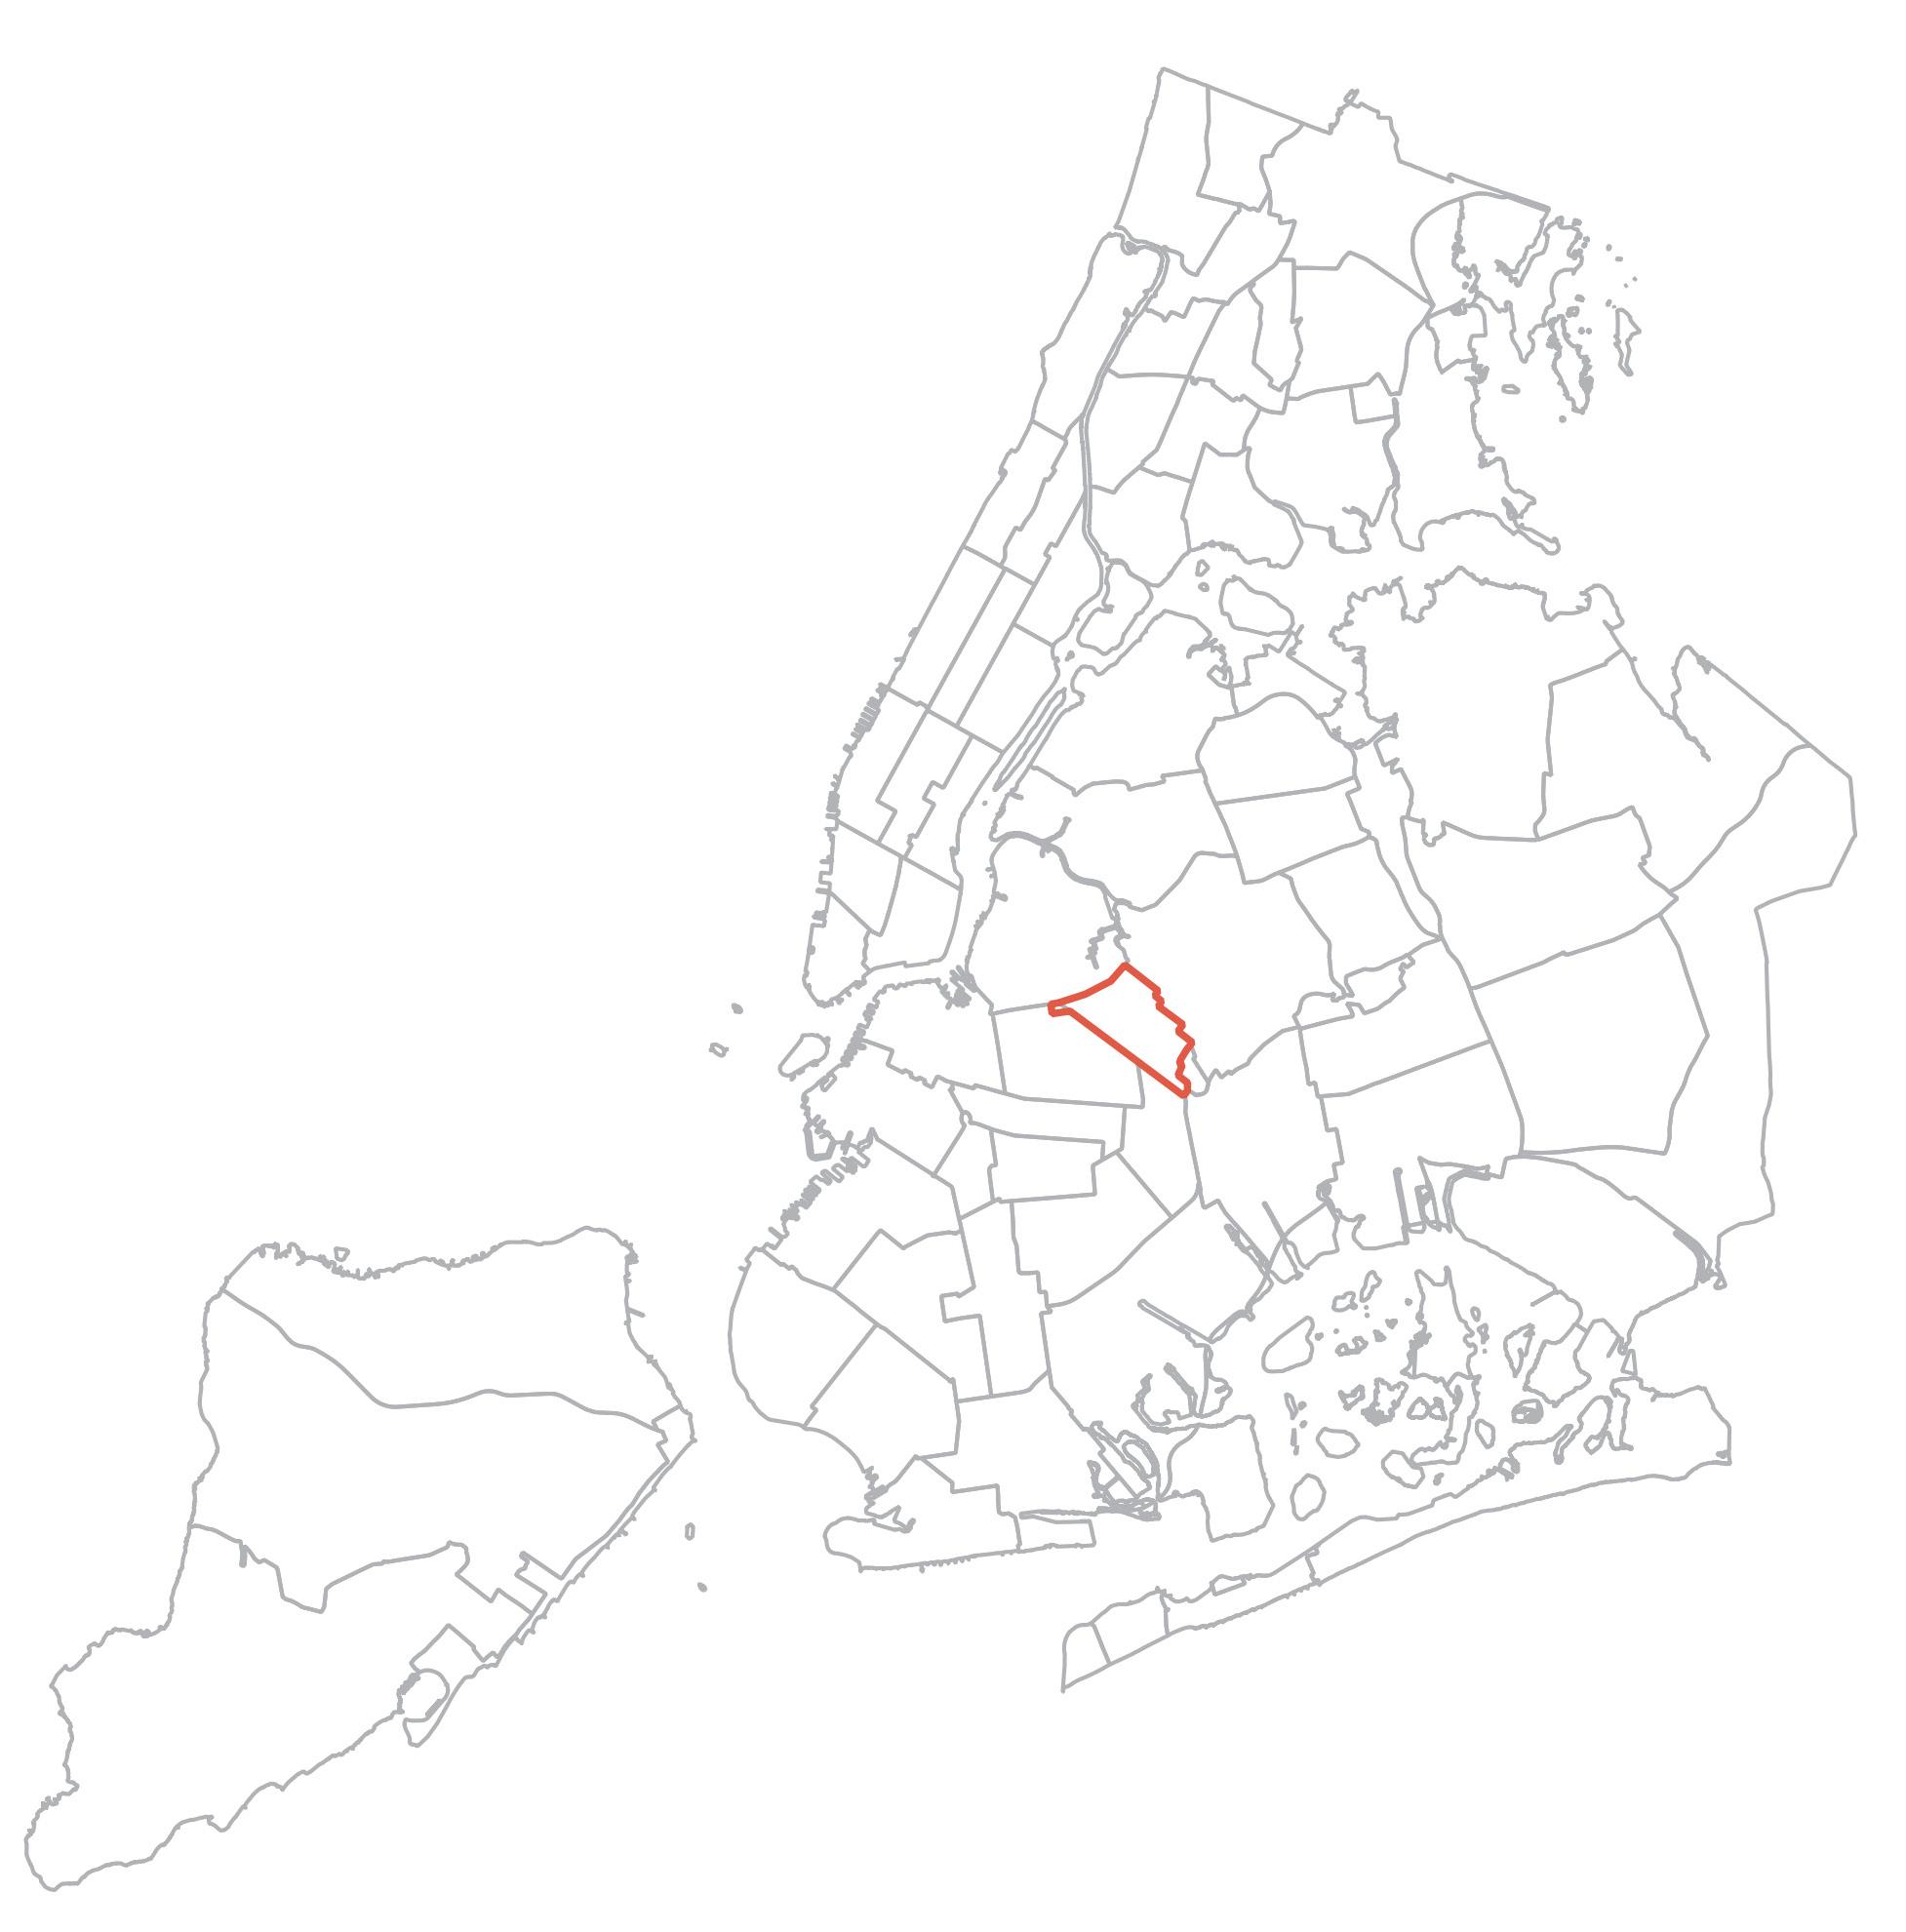
BUSHWICK
LOCATION IN NYC
Market-rate housing is housing that already exists or is part of a proposed development that is based on existing area market values and demand. The market consists of regulated and unregulated housing.
Market Rate (Unregulated) Housing tenants have less legal protections regarding the right to a lease renewal and evictions. Owners of market rate housing are not required to provide tenants with leases and are allowed to raise rents to any amounts. Market rate housing also tends to be more expensive, especially in neighborhoods with high demand.
Rent-Regulated Housing includes both “rent controlled” and “rent-stabilized” apartments. Besides the benefit of rent increases that are set by a government agency, tenants in rent regulated housing also have greater legal protections than those living in market rate housing. These units are available on the private market, but rent increases and lease renewals are regulated by both New York State and New York City.
MARKET VS PUBLIC RENT:
Units available for rent at prices that fall below the market rate, which is, in most instances, determined by the Area Median Income (AMI) level of area residents. New York City’s AMI area includes all NYC boroughs plus high-income counties north of The Bronx.
The New York City Housing Authority (NYCHA) was created in 1935 to provide affordable housing for low- and moderateincome New Yorkers. NYCHA houses every 1 in 17 New Yorkers, providing affordable housing to 528,105 authorized residents through public housing and Permanent Affordability Commitment Together (PACT) programs as well as Section 8 housing.
Approximately 229,000 of New York City’s 2.3 million rental units are considered to subsidized, generally by a government entity. Rents in these apartments may be tied to income and may include other qualifying conditions, such as age or disability. While many programs subsidize housing, here are the most common types.
Rent Regulation
Under the Emergency Price Control Act, the federal government established a price regulation system nationwide in response to the prospect of wartime shortages and inflation.
Nov. rents were frozen for all rental units in New York City.
NY enacts “stand by” legislation to preserve rent controls in the event that federal controls expired. In 1950 this legislation was activated with a rent freeze and the establishment of a commission to review rent regulation.
Congress adopts the Housing and Rent Act of 1947 which preserves rent controls into 1948.
“Stand by” legislation activates with a rent freeze and the establishment of a commission to review rent regulation.
In anticipation of the withdrawal of federal controls, the State adopted a system of rent regulation similar to the federal system, and the administration of rents for 2.1 million apartments was transferred to the State from the federal government.
Creation of the Rent Guidlines Board and the Rent Stabilization Law [1] (RSL) of 1969.
Emergency Tenant Protection Act [2] (ETPA). Together with the RSL and the Local Emergency Rent Control Act of 1962 [3], this is the fundamental law now governing the rent stabilization system.
Housing Stability and Tenant Protection Act [4]
Learn about [these laws and acts] on the next pg
Limits the rent an owner may charge for an apartment
Restricts the right of any owner to evict tenants.
Tenants can “succeed” a lease if they had lived with the original leaser for the twoyear period immediately preceding their passing or departure from the apartment.
Tenants may file relevant complaints on a variety of forms created by Divsion of Housing and Community Renewal. DHCR is required to serve the complaint on the owner, gather evidence and then can issue a written order which is subject to appeal.
Limitations on the amount of rent increases.
Tenants are entitled to have their leases renewed, and may not be evicted except on ground allowed by law.
Leases may be renewed for a term of one or two years, at the tenant’s choice.
Tenants can file relevant complaints on a variety of forms created by the DCHR. DHCR is required to serve the complaint on the owner, gather evidence and then issue a written order which is subject to appeal.
[Laws and Acts]
1This law applied to ~325,000 apartments that had been completed after February 1, 1947, and ~75,000 formerly controlled apartments that had been decontrolled through subdivision, conversion or luxury decontrol laws. Unlike rent control, which applied to buildings with 3 or more units (and one- or two-unit buildings if continuously occupied since April 1, 1953), rent stabilization applied to buildings with 6 or more units. Consequently, decontrolled units in buildings with 3, 4 or 5 units remained decontrolled. Also, the law did not apply to new buildings that received a certificate of occupancy after March 10, 1969.
2Objective of which was to prevent excessive rent increases in the decontrolled sector of the rental housing market due to low vacancy rates, the inadequate supply of standard rental housing and the increase in new household formations.
Deregulation
There are many instances where an apartment can become deregulated and enter the market.
Vacancy
Rent stabilized apartments where the owner receives J-51 or 421-a tax benefits may become deregulated upon vacancy.
Rent controlled apartments are subject to decontrol upon vacancy unless the outgoing rent controlled tenant was forced out through harassment. However, many decontrolled apartments will fall under rent stabilization.
3Transferred the administration of rent control from the state government to the New York City government.
4Extends and makes permnent rent regulations laws. Repeals High Rent Vacancy Deregulation & High Income Deregulation. Extends Rent Overcharge Look-Back to Six Years. Allows any municipality to opt-in to rent stabilization if there is a housing emergency in which the rental vacancy rate is five percent or less. Reforms Rent Adjustment Formula for RentControlled Tenants: Limits rent controlled rent increases to the lesser of 7.5 percent or a level equal to the average of the previous five RGB increases for one-year stabilized renewal leases and prohibits fuel adjustments or pass-along increases for rent-controlled tenants. Keeps Stabilized Apartments Rented to Nonprofits in the Stabilization System.
If the apartment is in a building with six or more units, the landlord can initially charge whatever the market will bear, subject to the tenant’s right to file what is known as a “Fair Market Rent Appeal.” However, if the apartment is in a building with fewer than six units, the apartment will most likely no longer be under any rent regulation.
Tax Abatements
Under certain circumstances, apartments in 421-a buildings may become deregulated at the end of the last lease commencing during the period of the tax abatement.
DO I QUALIFY FOR RENT REGULATION?
Access your rental history: https://hcr.ny.gov/most-common-rent-regulation-issues-tenants Source: https://hcr.ny.gov/system/files/documents/2024/01/fact-sheet-01-01-2024_0.pdf
START HERE
Was your building constucted before 1974?
Yes
Does your building recieve j-51, 421-a, or 421-g tax benefits?
Yes No No
Have you, or your family unit, been in continuous occupancy prior to July 1, 1971?
Yes No
These tax benefit program have their own specific rules as to which apartments are covered under RENT CONTROL. Find out if your building is covered here: https://rentguidelinesboard. cityofnewyork.us/resources/ faqs/tax-abatementsexemptions/ Before 1947? Yes No
Your building is protected under RENT CONTROL
Limits the rent an owner may charge for an apartment
Restricts the right of any owner to evict tenants.
Tenants can “succeed” a lease if they had lived with the original leaser for the two-year period immediately preceding their passing or departure from the apartment.
Tenants may file relevant complaints on a variety of forms created by Divsion of Housing and Community Renewal. DHCR is required to serve the complaint on the owner, gather evidence and then can issue a written order which is subject to appeal.
Your building is protected under RENT STABILIZATION
Limitations on the amount of rent increases.
Tenants are entitled to have their leases renewed, and may not be evicted except on ground allowed by law.
Leases may be renewed for a term of one or two years, at the tenant’s choice.
Tenants can file relevant complaints on a variety of forms created by the DCHR. DHCR is required to serve the complaint on the owner, gather evidence and then
issue a written order which is
Your building does not qualify for rent regualtion, but you still have rights as a tenent.Learn more here: https://www.nyc.gov/ content/tenantprotection/ pages/newv-protectionsfor-all-tenants
AMI: AREA MEDIAN INCOME
Area Median Income (ami) is a statistical measure to determine affordable housing eligibility. ami represents income in the middle of the distribution
New York’s AMI:
$94,400 (2023)
This calculation includes all 5 boroughs with addition of these counties:
Putman Suffok Westchester
$83,600 (2021)
$91,000 (2021)
$89,300 (2021) Respective AMI’s
Why include these additional counties?
By shifting income categories upwards, the goal is to allow for more people to qualify for afforable housing
Does it work?
No! Most “affordable” units serve the 6080% AMI group
Bushwick’s AMI
$38,780 (2021) 45% very low-income
Low Income Housing
NYCHA new york housing authority
HPD department of housing preservation and development
HCR new york state homes and community renewal
HUD department of housing and urban development
HDFC housing development fund cooperation
NYCHA, HUD
Housing units constructed and managed by government for low-income households. Homeless and domestic violence victims are a high priority group. Social services are available in a number of the developments.
section 8
mitchell-lama public housing
note: these developemnts have waitlists that will take years to accomodate.
Co-ops HDFC
Rehabilatated buildings that had been abandoned over the years, gave the tenants the opportunity to own their apartments and become shareholders.
Limited equity- limits the equity that can be earned if a tenant decides to sell. It is great for longterm community building.
Market rate- are not insulated from market rates. Tenats may buy and sell for profit.
NYCHA, HPD
A federal housing allowance program that provides rent subsidies in the form of vouchers and certificates for low-income households.
HCR, HPD
NO LONGER ACCEPTING APPLICATIONS.
Provides affordable rental and cooperative housing to moderate and middleincome families. As of 2017, there were approximately 92 City-sponsored, moderate- and middle-income rental and limited-equity cooperative developments.
To apply for a Mitchell-Lama apartment you must get on the waiting list of the individual development.
Cohousing- shared housing with private quartes and public amenities.
Leasing- tenats do not own the building, they lease from an organization.
Affordable housing
A variety of subsidized/affordable housing programs exist in New York City. Most affordable housing programs can be applied for through the city’s housing connect website. New york state also maintains a database of affordable housing on their website.
all applications can be found on their departments website
Rent Guidelines Board
9 = 2 + 2 + 5
MEMBERS TENANT REPS PUBLIC REPS OWNER REPS
In 1969
rapidly falling vacancy rates and an increases in complaints of rising rents in non- controlled units led the mayor to call upon a group representing the owners of unregulated apartments to propose a selfregulation program. At the same time the Mayor appointed the first Rent Guidelines Board “to make an independent evaluation of the plan for self-regulation” to be submitted by the owner’s group.
Each year, the NYC Rent Guidelines Board (RGB) establishes the lease guidelines for rent stabilized apartments, lofts and hotels. The RGB typically votes on the guidelines each June. Those guidelines then apply to leases with effective dates between October 1 of that year and September 30 of the following year.
These guidlines encompass:
• special orders concerning: sublet allowances
• supplemental rent adjustments
• special guidelines & decontrolled units
• electrical inclusion adjustment
• buildings with J-51 or 421-a tax abatements
• stabilizers
• other – fractional terms, escalator clauses
• exemptions to orders
• warehousing exemptions
• registration exemption/hotels
PROPERTY VALUES IN BUSHWICK
The escalating trend of real estate development, housing financing, and profit-driven practices in Brooklyn, particularly in the Bushwick district, has resulted in a concerning surge in property values, triggering rent increases and the displacement of long-term residents. The takeover of housing provision and the incorporation of gentrification as a policy in urban revitalization efforts have fostered illegal practices such as property abandonment and milking, contributing to the loss of affordable housing and the expulsion of established communities. Rezoning processes, especially in the last few years, have played a pivotal role in this unsettling scenario, leading to a significant increment in property prices with indirect repercussions on local economies and lowincome families that have resided in the area for decades. Speculation and investment in rezoned areas have further exacerbated the issue, resulting in the massive displacement of long-term residents and local businesses. The focus on attracting middle- and highincome households has heightened the commodification of housing, driving up property values and making it increasingly challenging for current low-income individuals to afford the area, thereby intensifying the cycle of displacement and gentrification in Brooklyn.
The following maps show the home values in Bushwick. There are two distinct maps with two distinct home values. Each map shows the number of housing units sold at that specified value.
Home Values: Owner Occupied Housing Units (2018-2022)
$100,000 to $124,000
$1,000,000 to $1,499,000
Source: GIS Data - IPUMS NHGIS (2018-2022)
HOUSING MARKET TRENDS
what is the housing market like in Bushwick today?
Bushwick Housing Market Trends
What is the housing market like in Bushwick today?
As of December 2023, the prices of homes in Bushwick have risen by 2.8% from the previous year, reaching a median price of $1.1M. On average, homes in Bushwick are sold after 92 days on the market, compared to 84 days the previous year. December witnessed the sale of 43 homes, a decrease from 46 homes sold during the same period last year.
As of December 2023, the prices of homes in Bushwick have risen by 2.8% from the previous year, reaching a median price of $1.1M. On average, homes in Bushwick are sold after 92 days on the market, compared to 84 days the previous year, December witnessed the sale of 43 homes, a decrease from 46 homes sold during the same period last year.
$1,077,500
Median Days on Market +10 year-over-year +3.6% year-over-year
Median sale price 42 # of Homes Sold -8.7% year-over-year 94
Source: Redfin
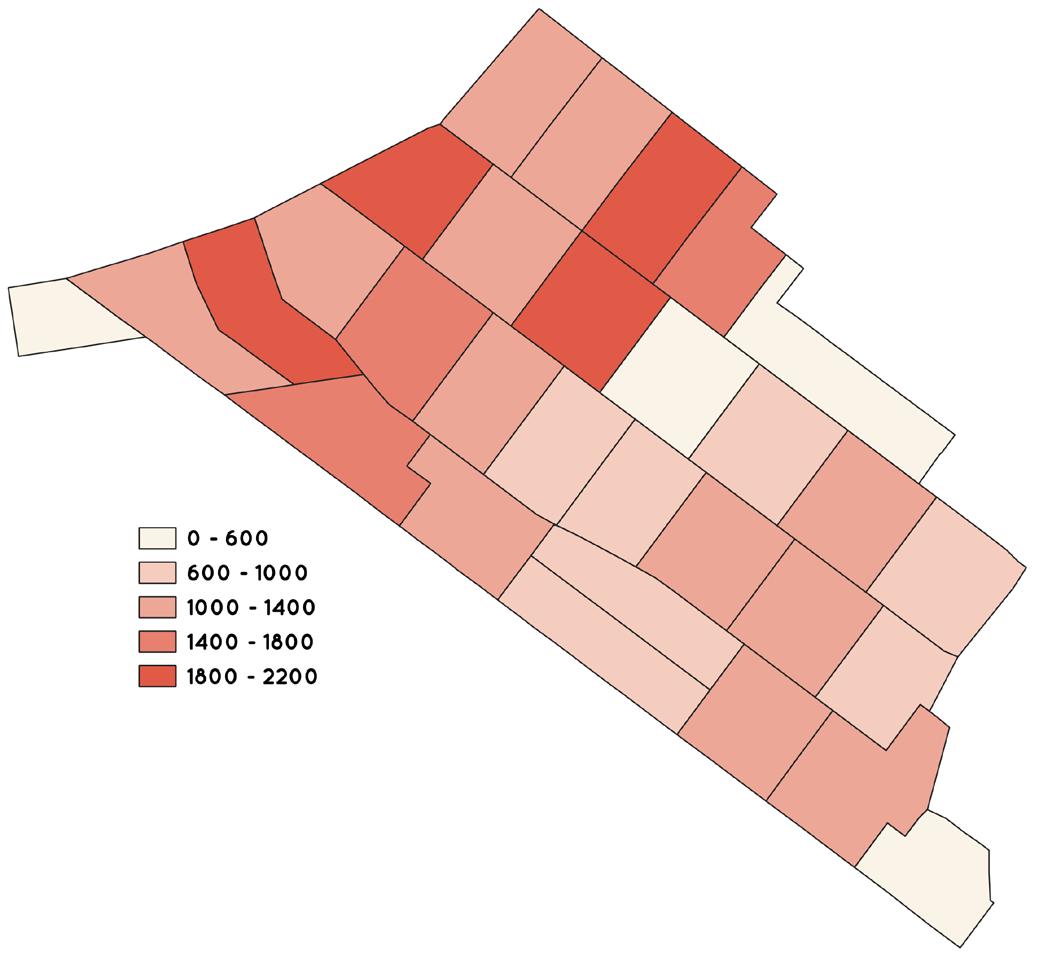
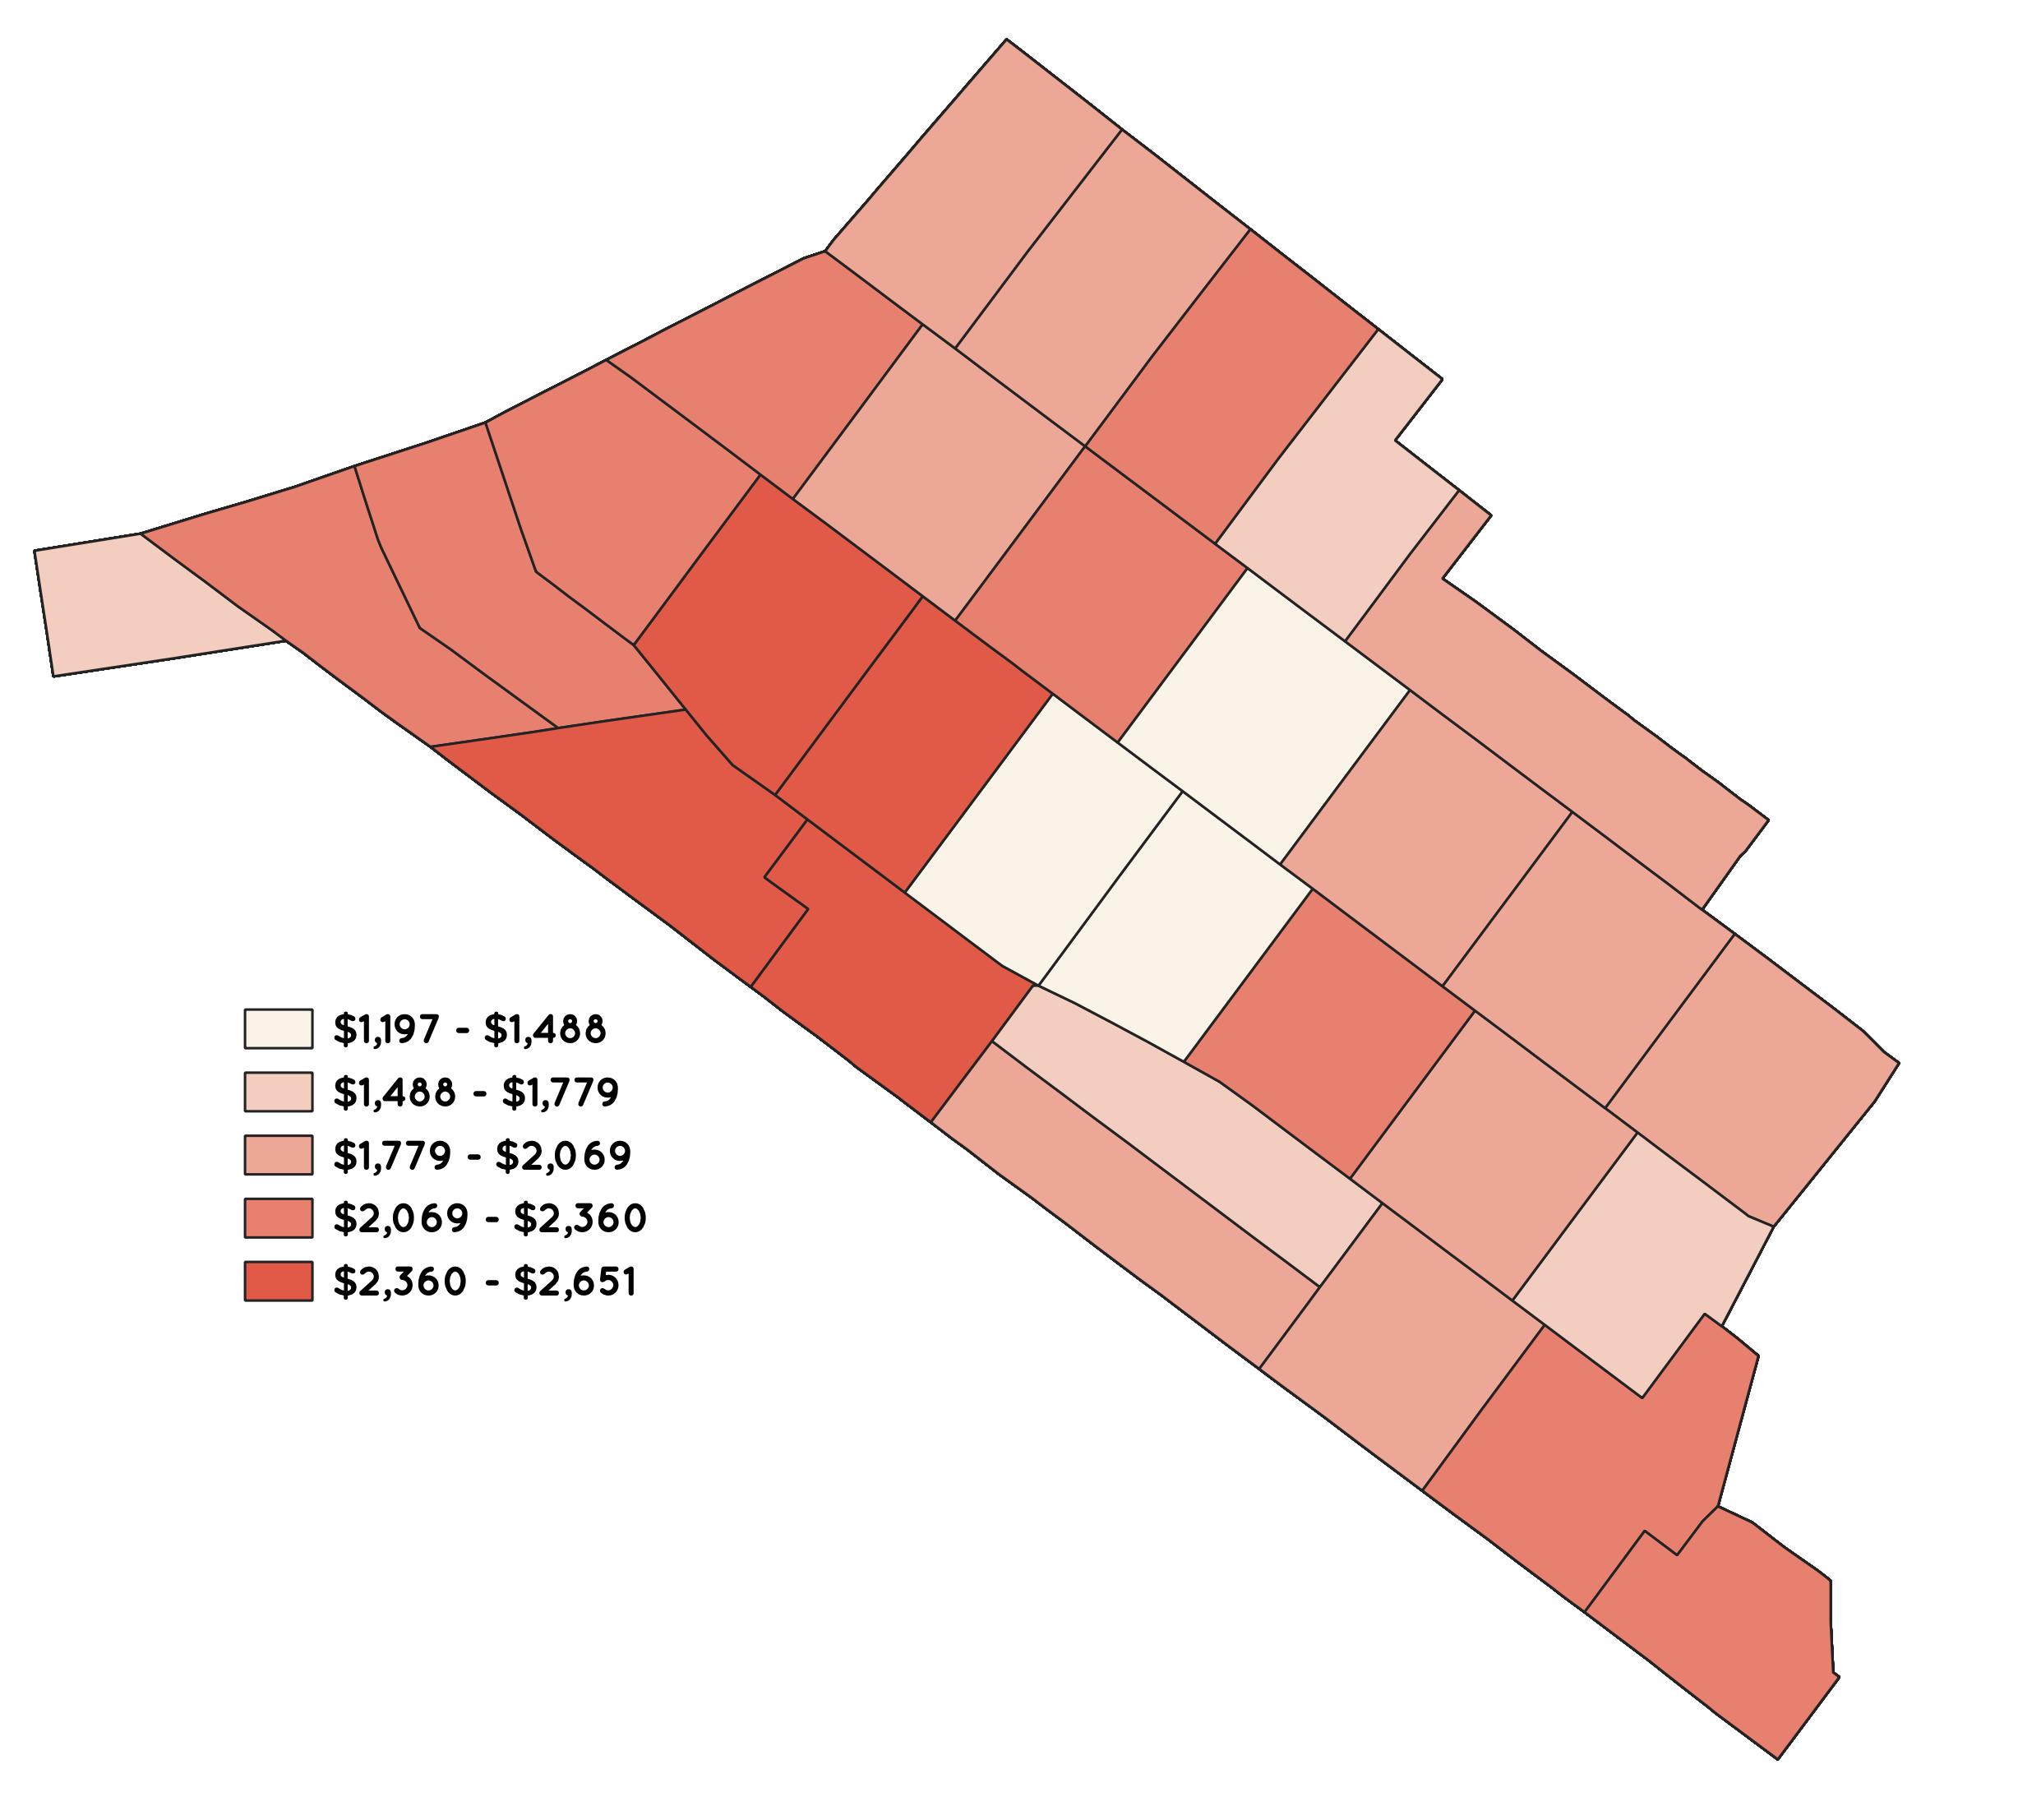
COST OF RENTING IN BUSHWICK
This map illustrates the rental expenses in Bushwick. A notable concentration of red indicates that the majority of rents hover around $1,400. It’s noteworthy that the central area highlighted in beige corresponds to public housing locations. The elevated prices surrounding these public housing areas may exert significant pressure on them due to their ‘prime’ real estate positioning.
Source: GIS Data - IPUMS NHGIS (2018-2022)
EXPLORING RENTAL RATES
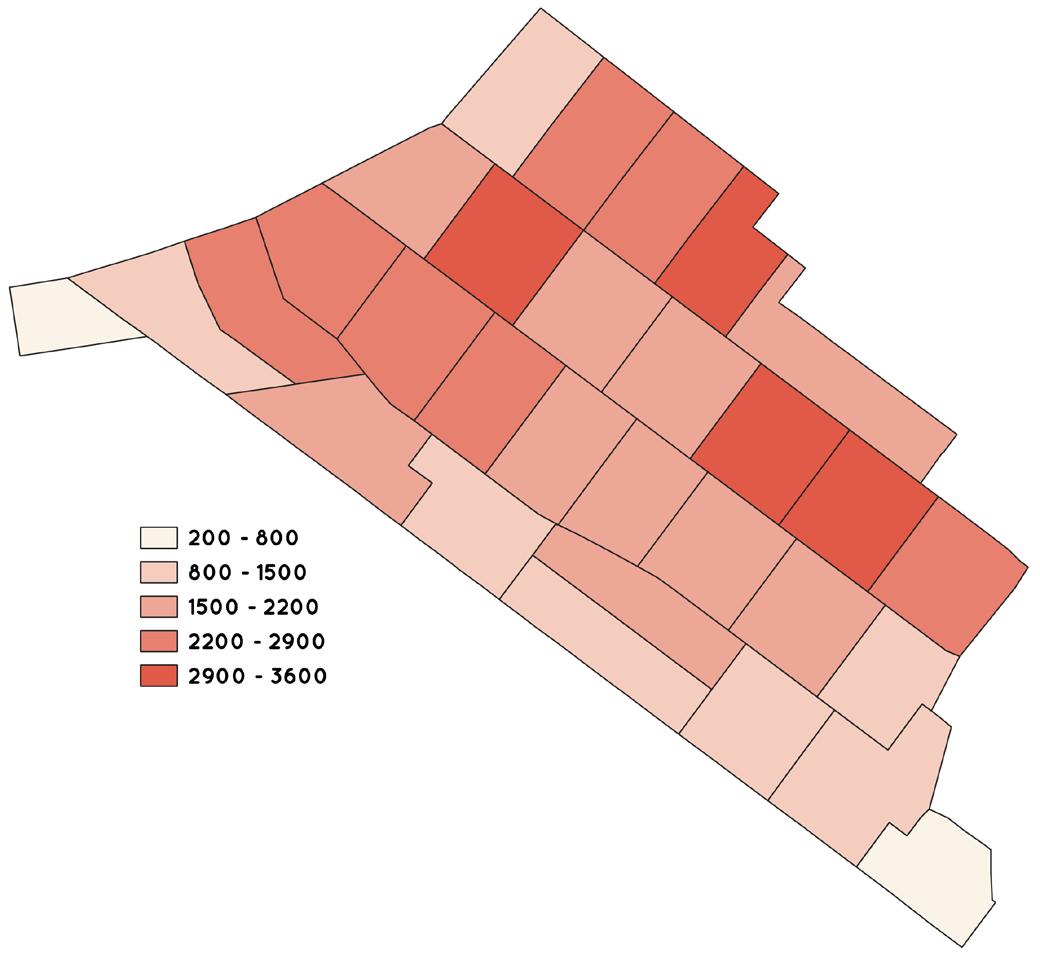
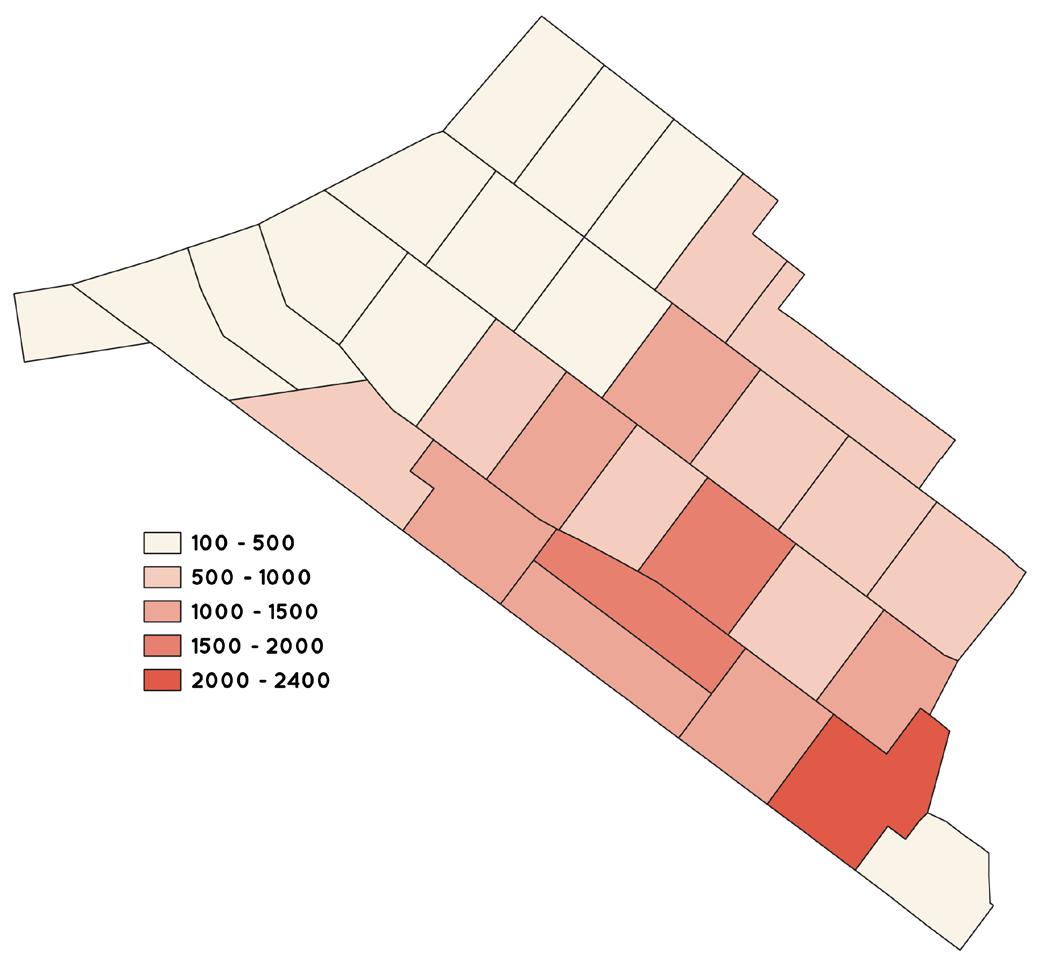
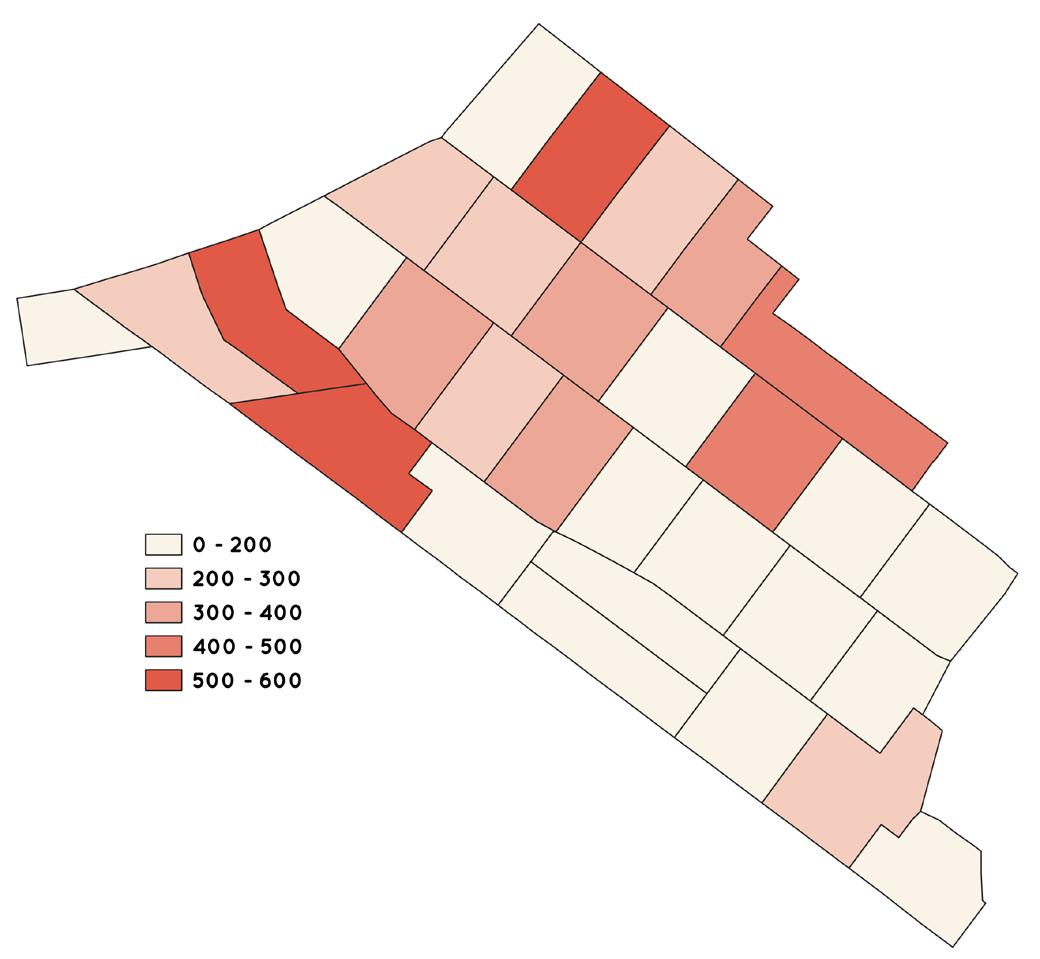
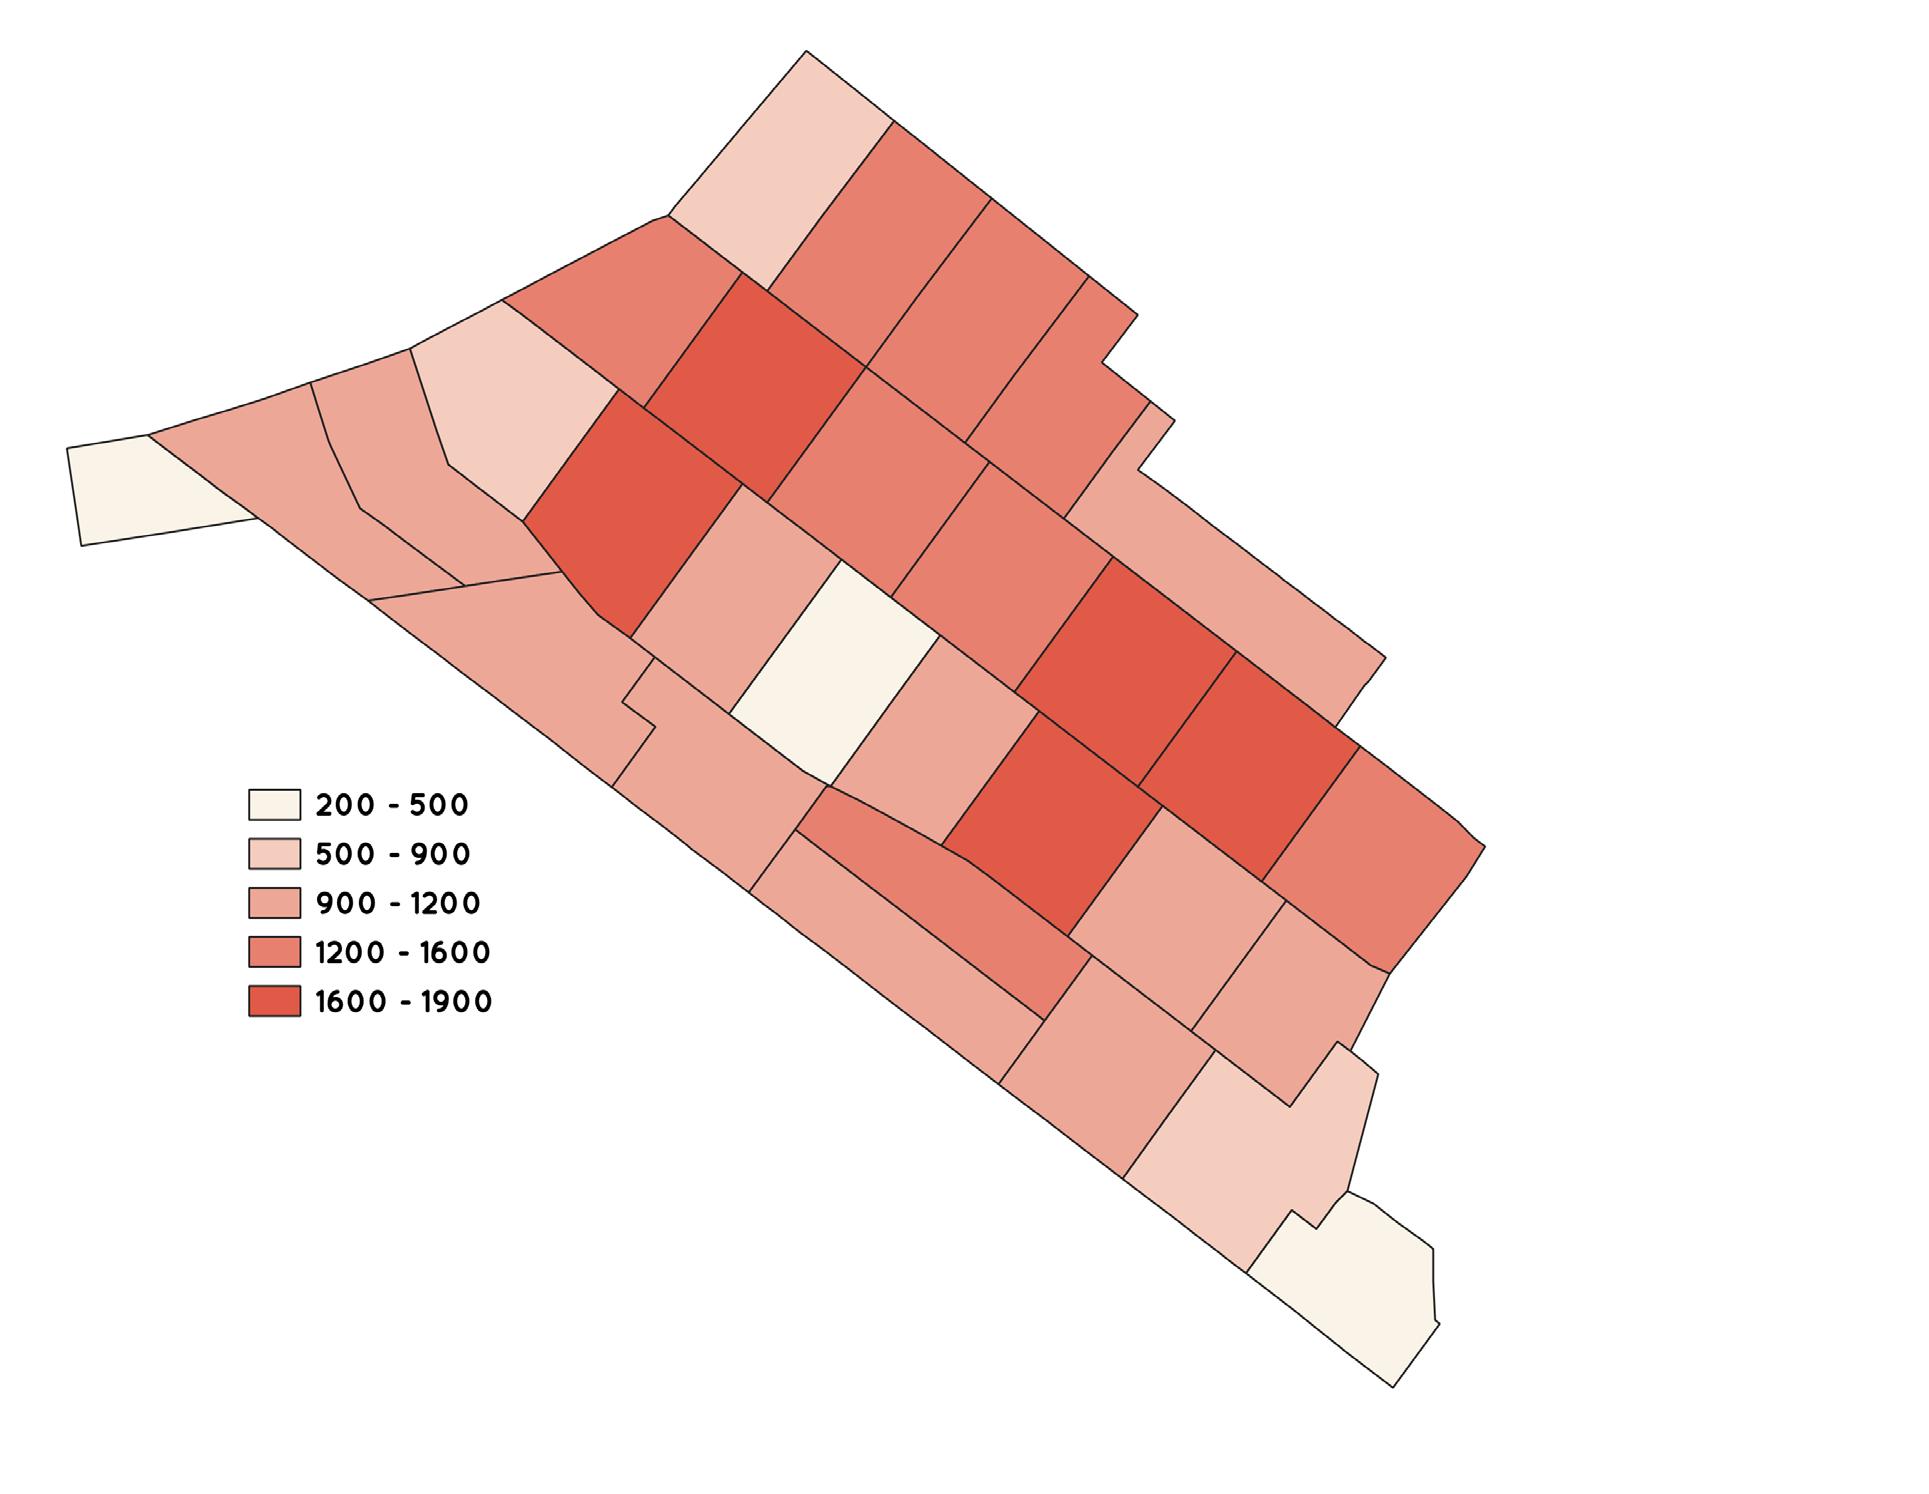
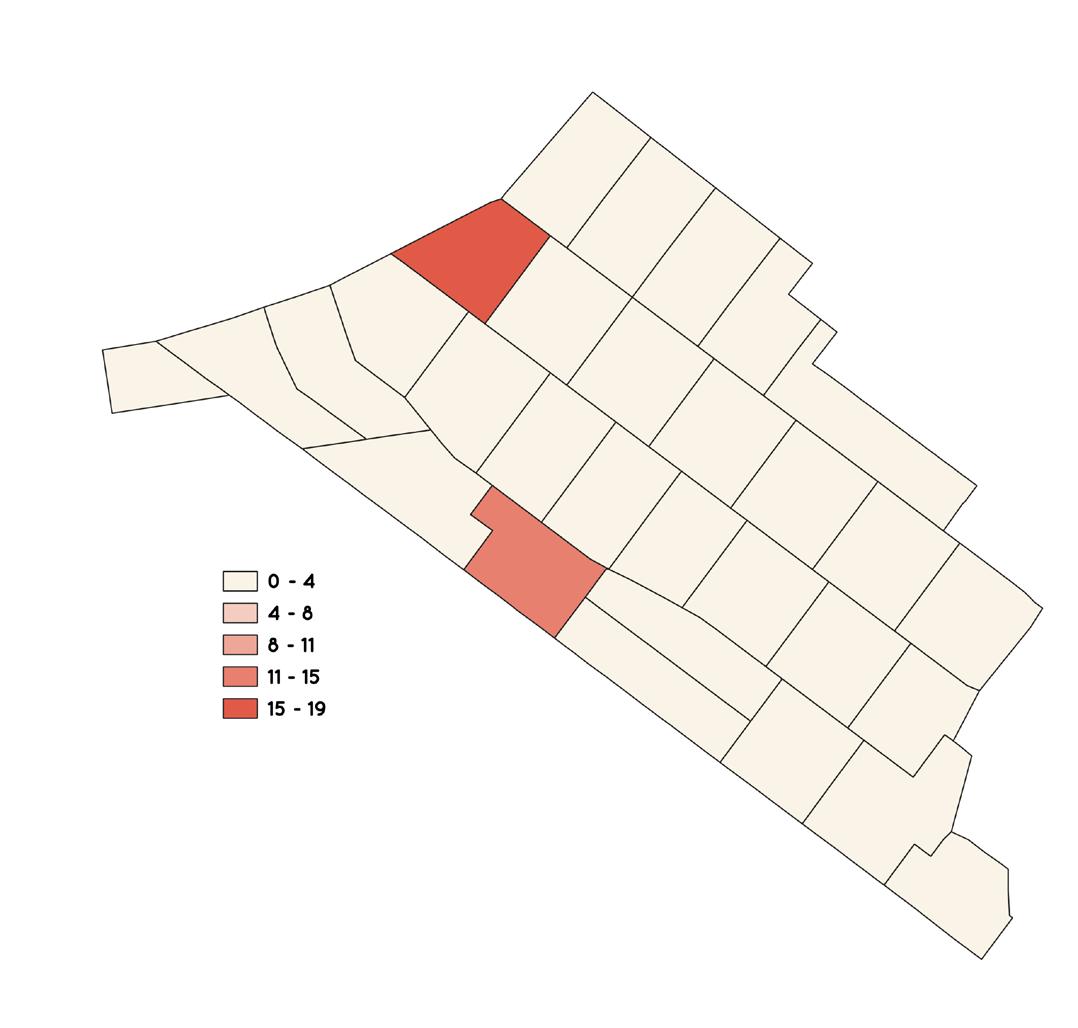
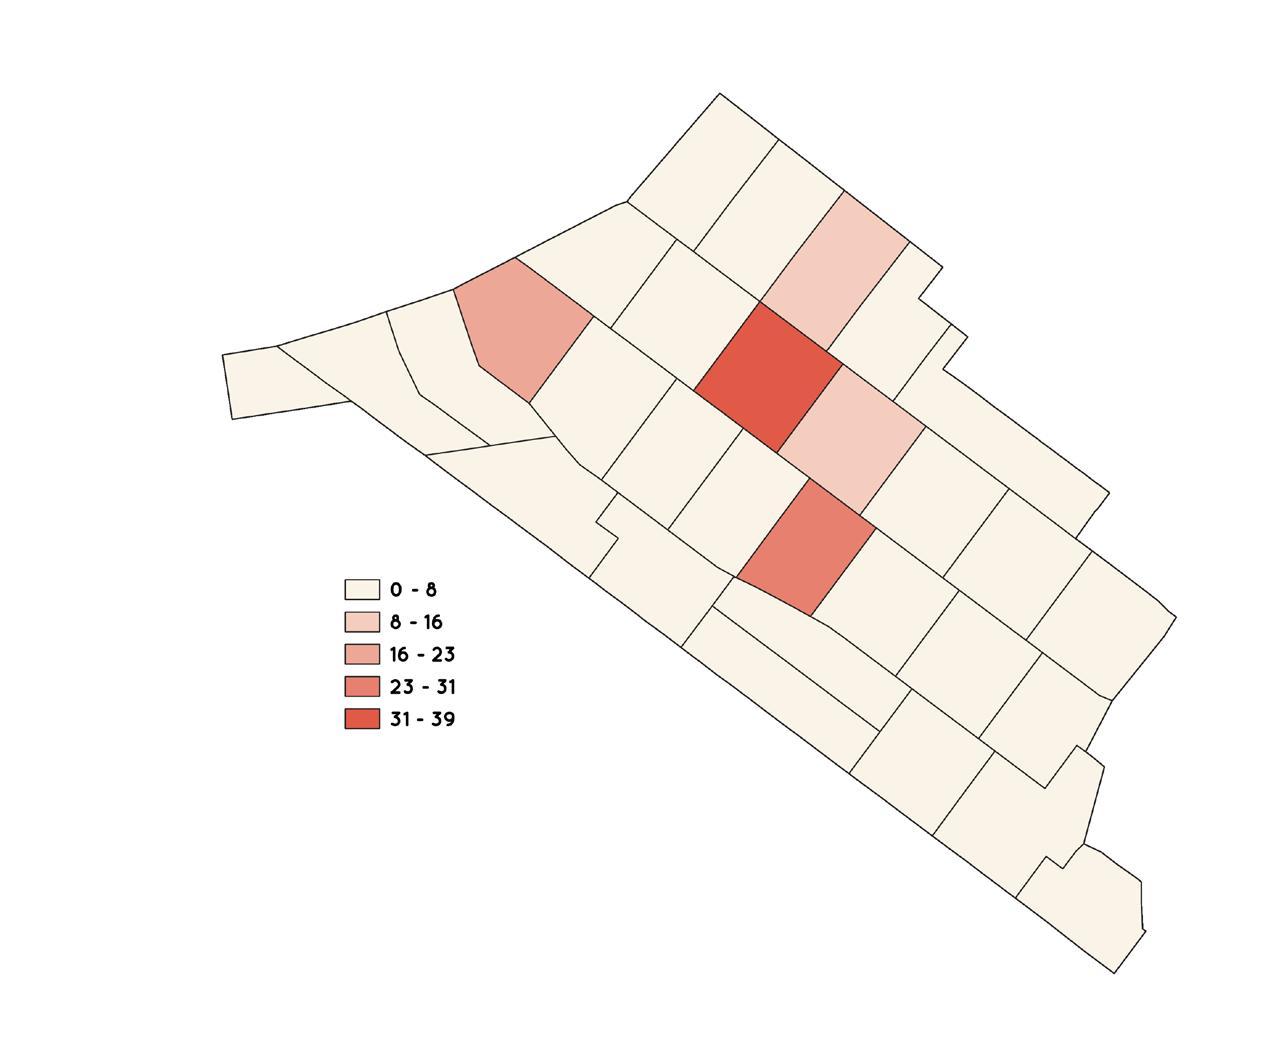
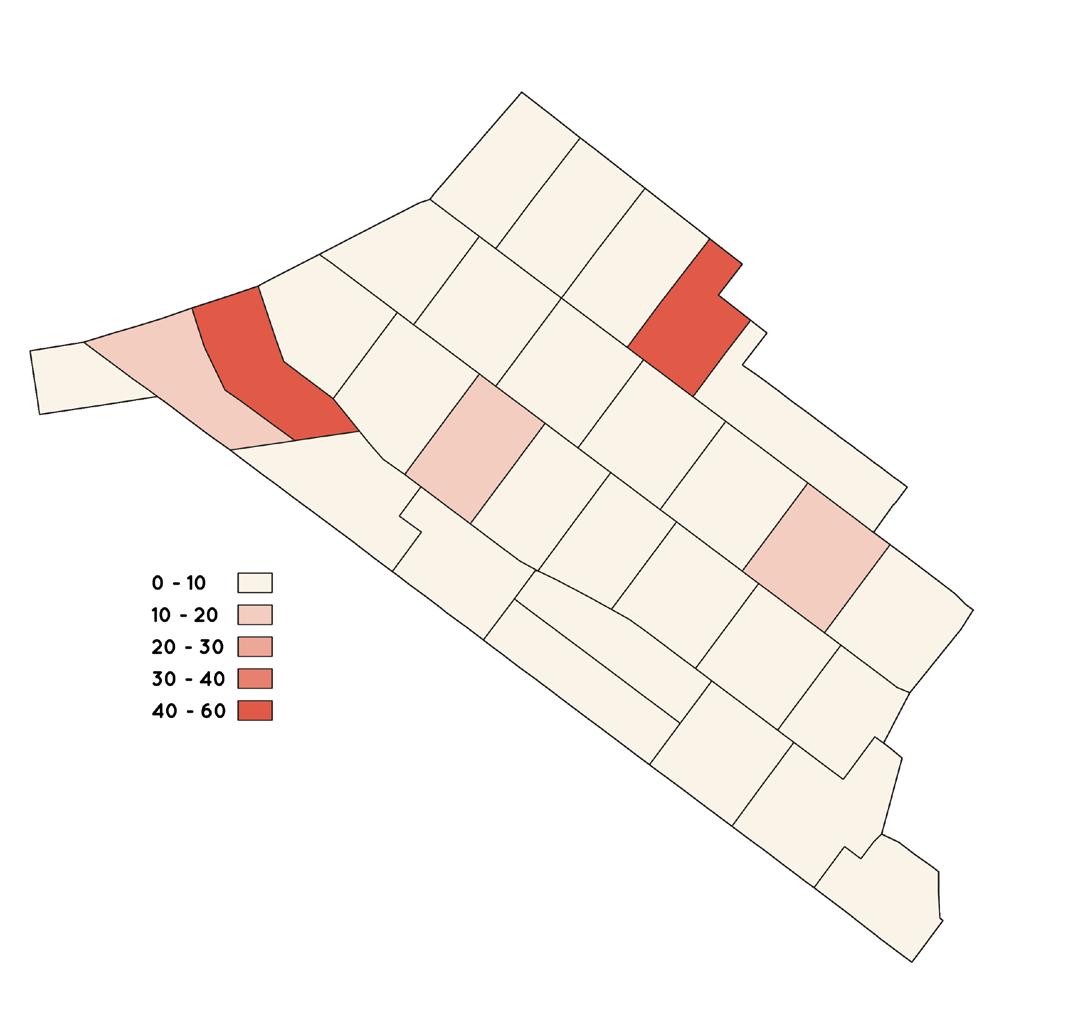
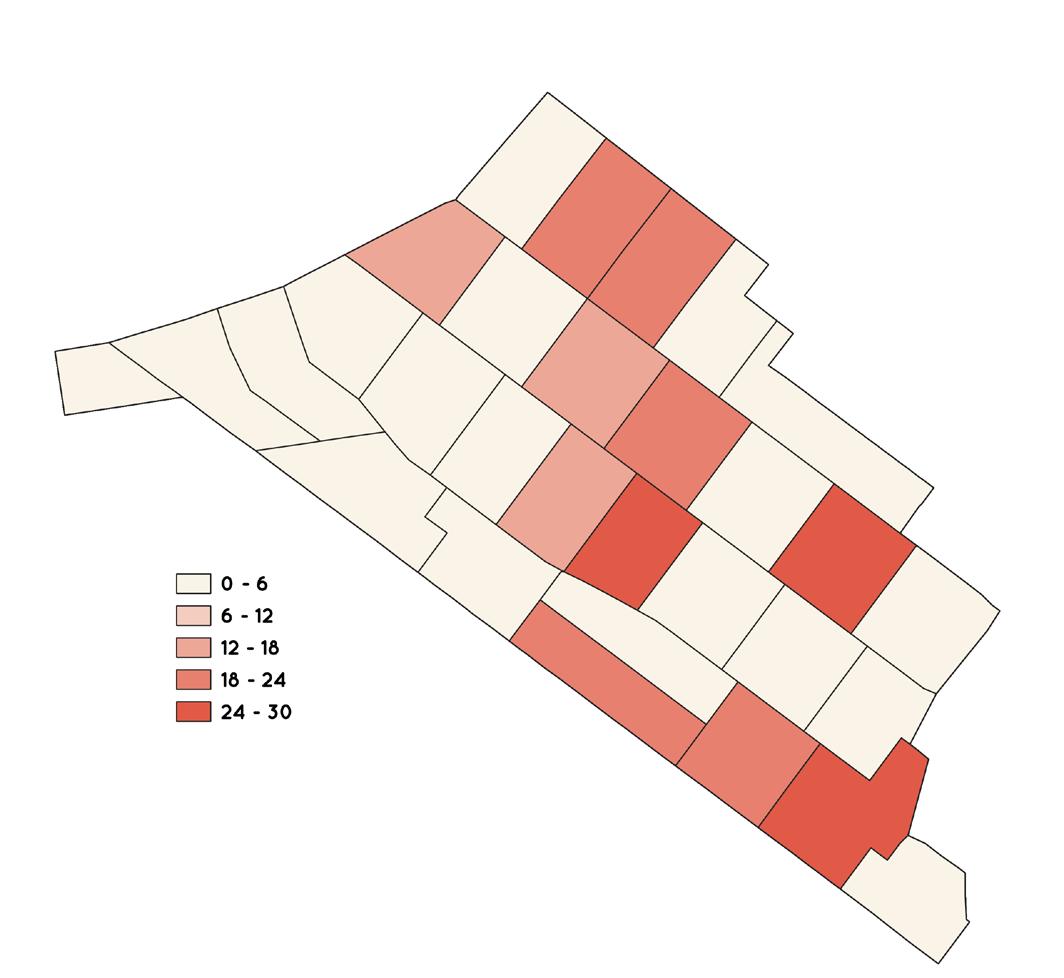
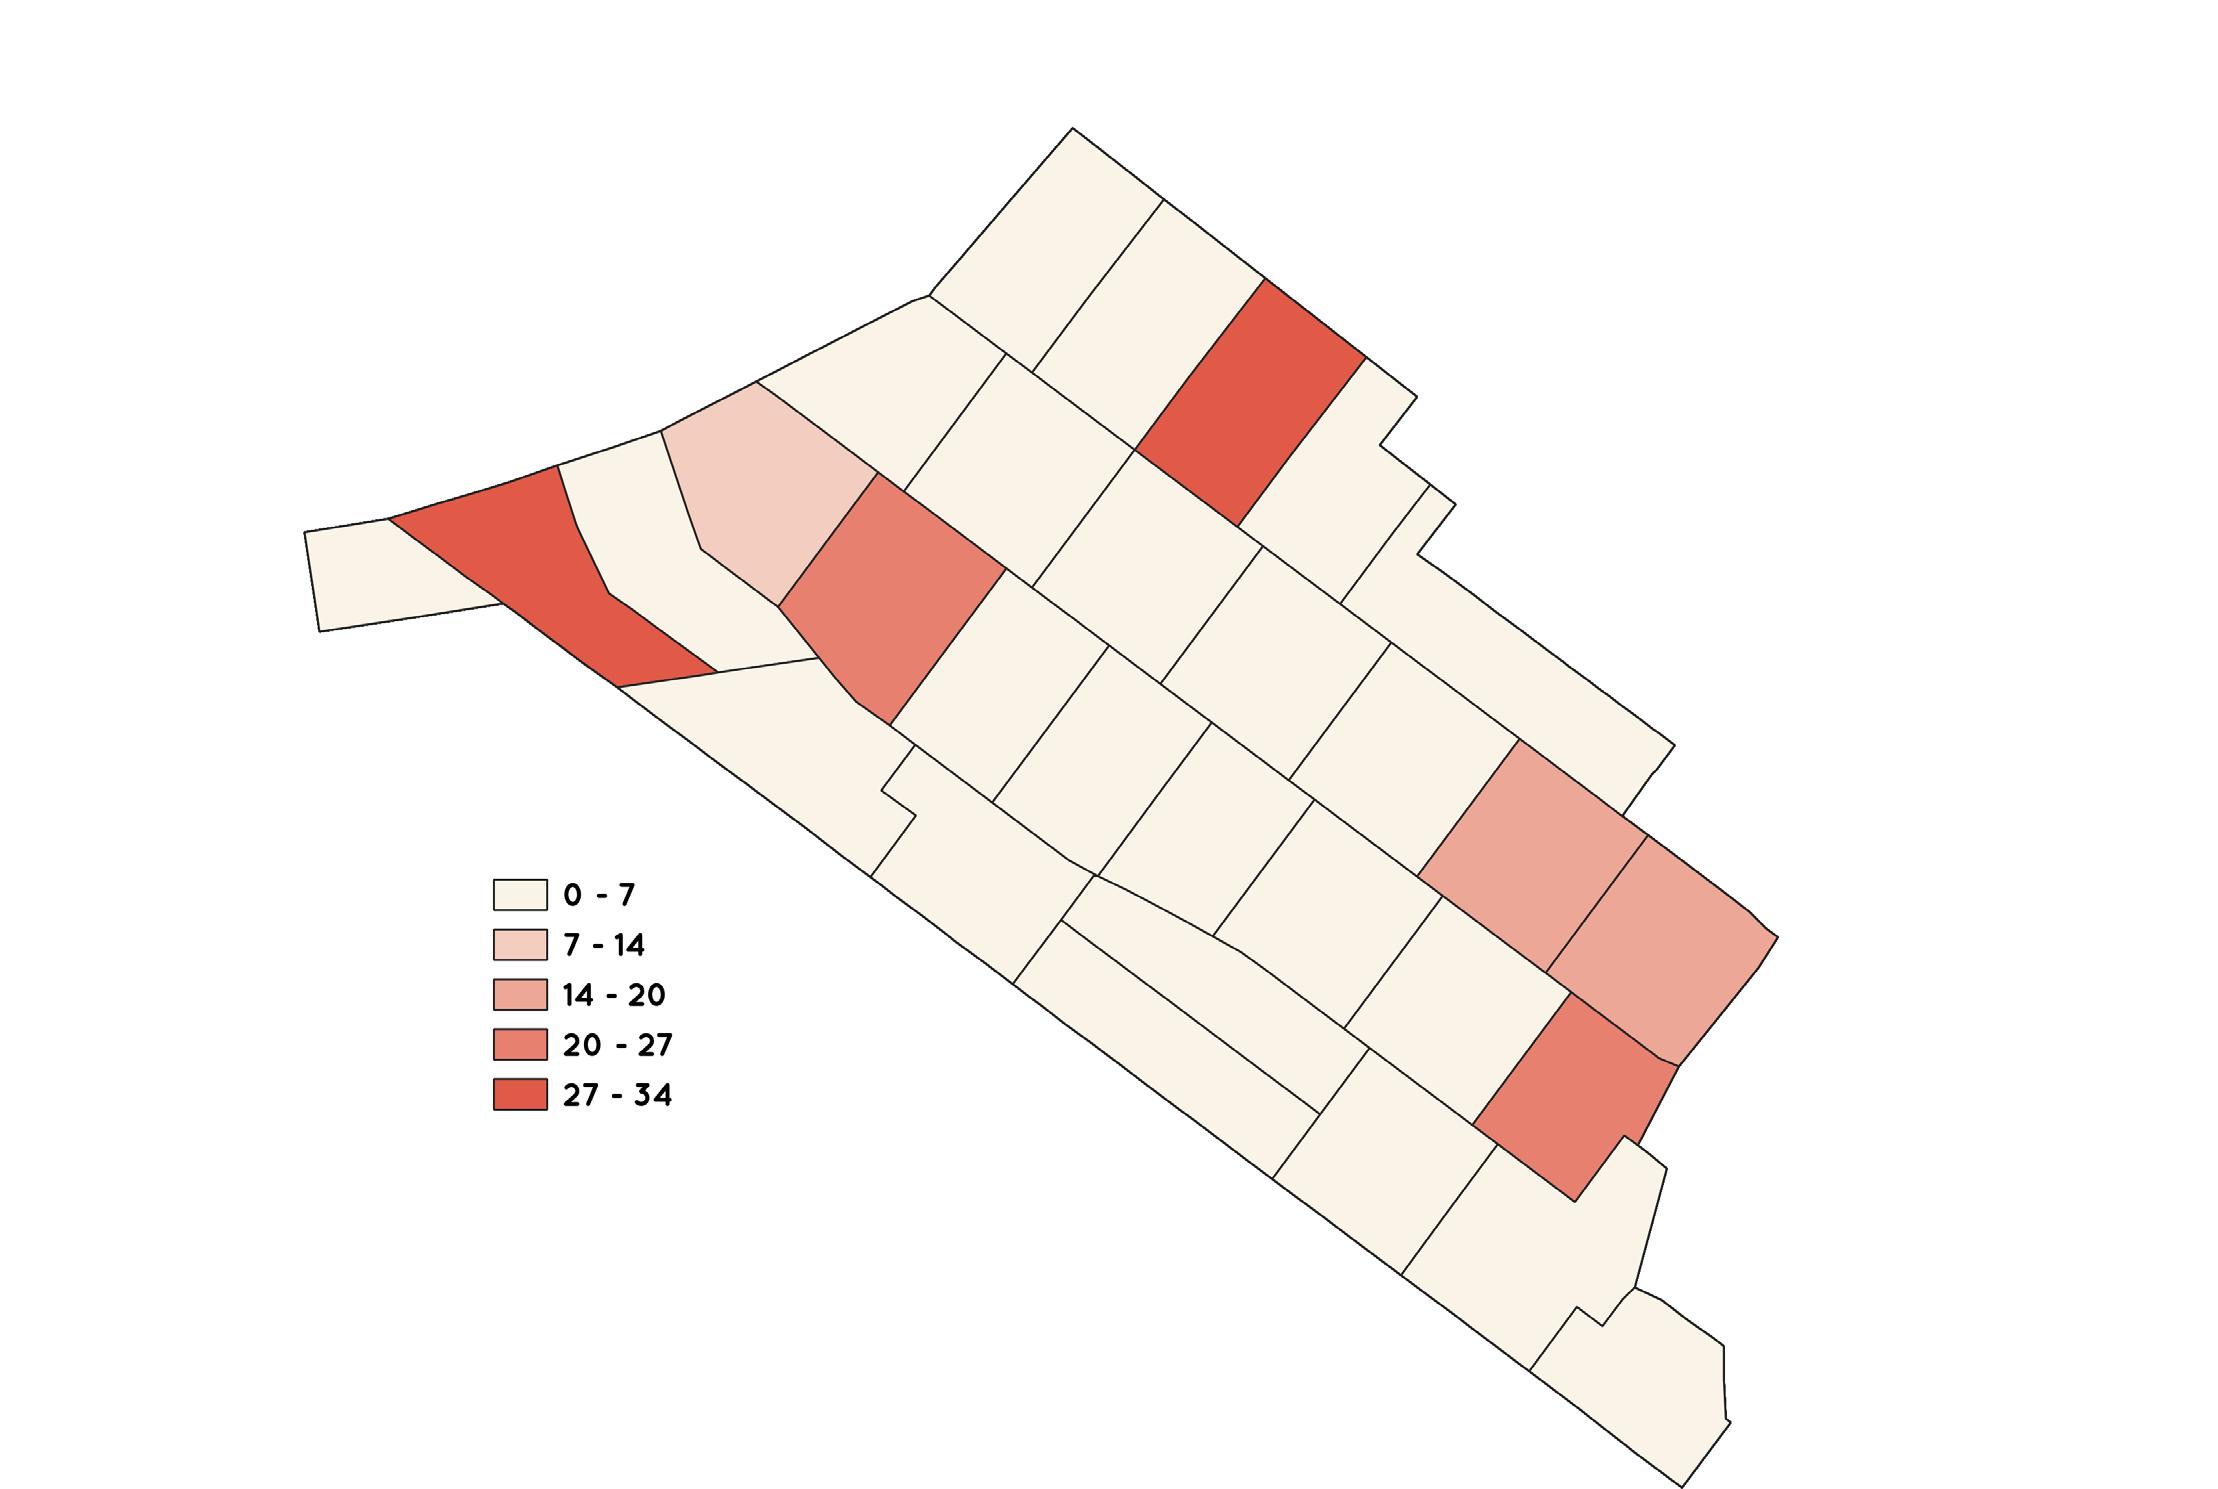
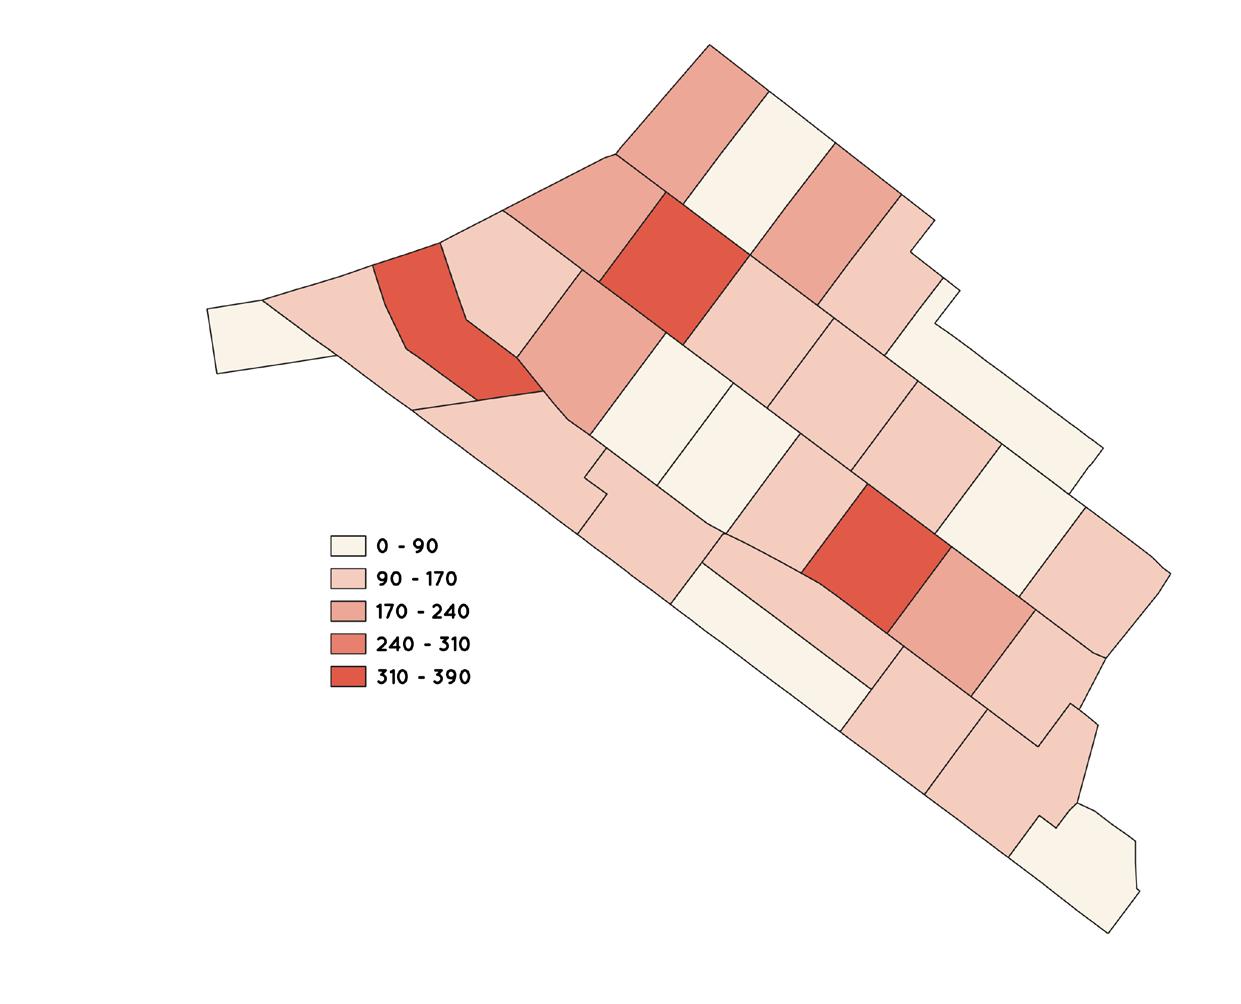
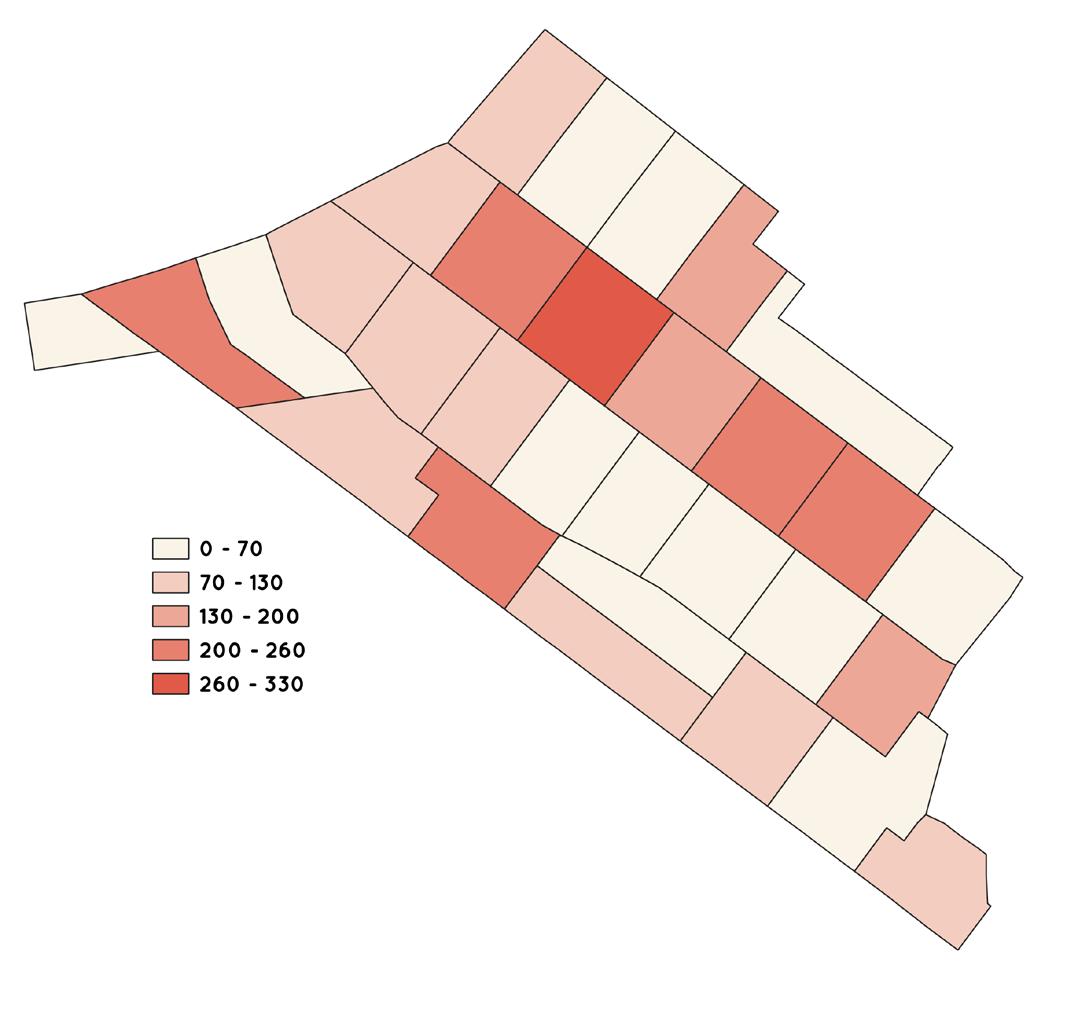
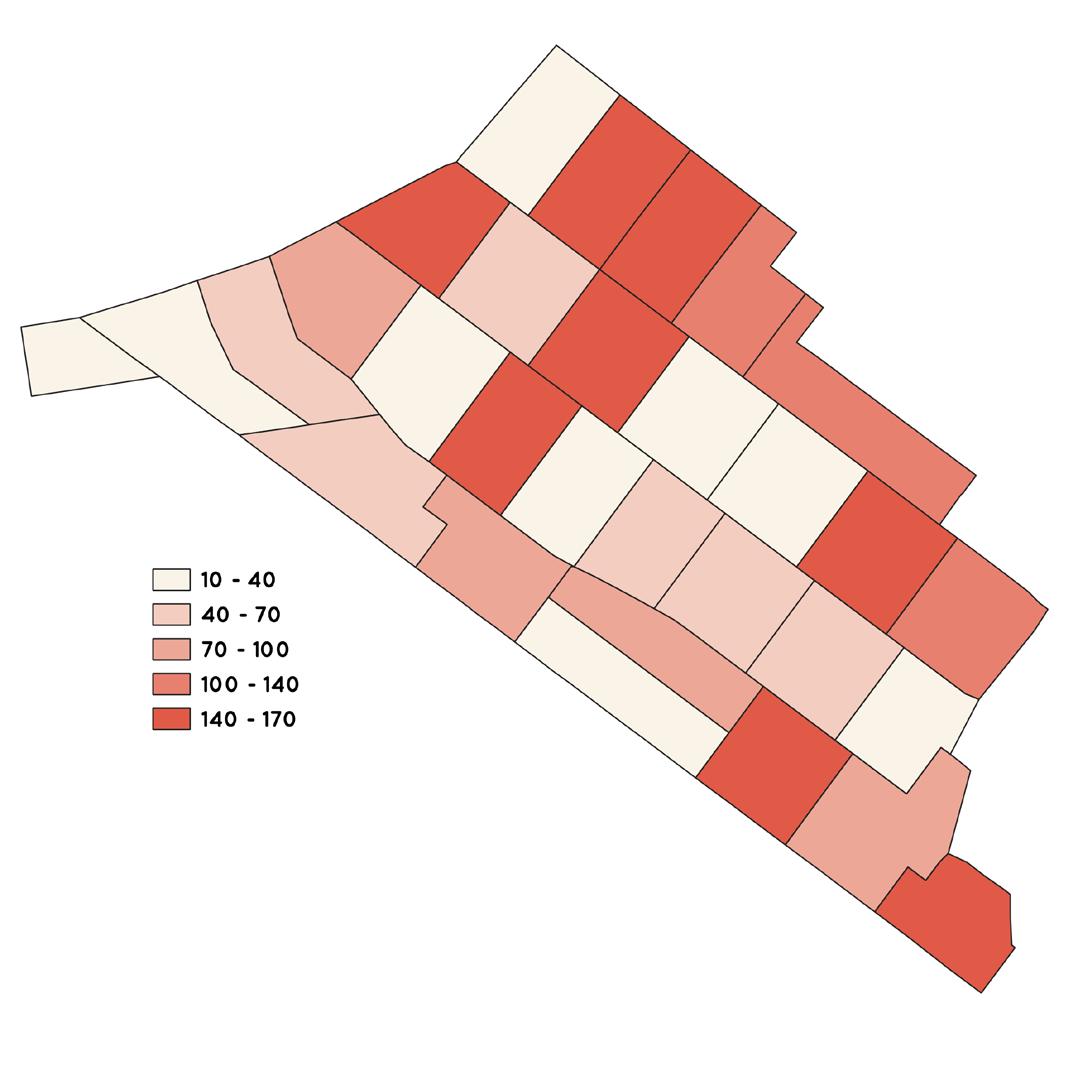
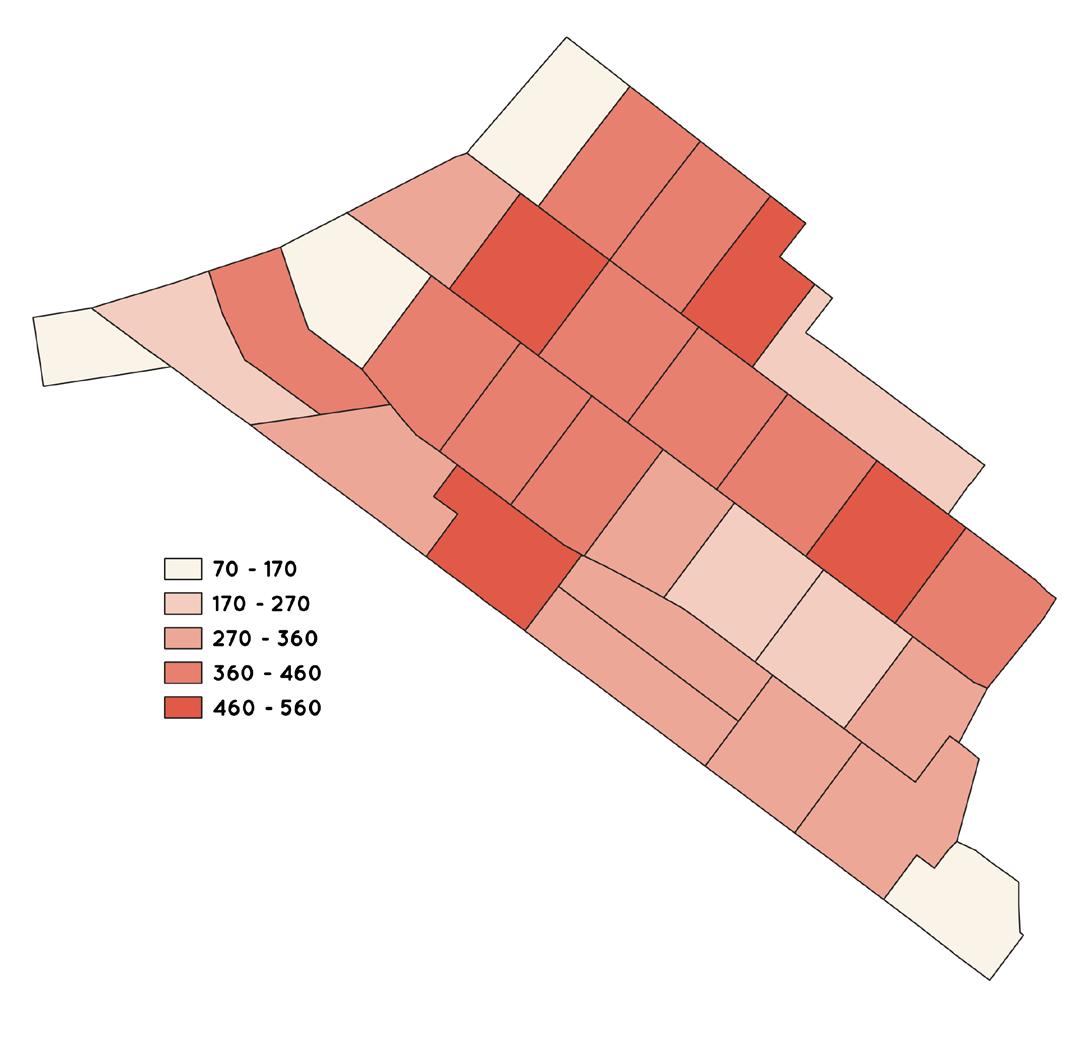
These maps provide insights into the rent asked for vacant-for-rent and rented, not occupied housing units within the area. The show the number of units at a specific rate. Through the lens of four distinct maps, a visual narrative is offered of the rental landscape. The first map highlights units priced at less than $100, revealing a notable concentration in the middle area and northeast. Moving froward, the second map unveils the distribution of units with rent ranging from $1,000 to $1,250, with a predominant presence in the north, center,
less than $1,000
$1,250 to $ $1,499
$1,000 to $1,249
$1,500 to $1,999
and northeast regions. The third map showcases units priced between $1,250 and $1,500, with a dispersion across the northeast and northwest areas. Finally, the fourth map explores units demanding $3,500 or more in rent, with a noticeable spread in the northwest and southern sectors of the map. These maps serve as invaluable tools in understanding the dynamics of rental affordability and availability in Bushwick. Source:
$2,000 to $2,499
$2,500 to $2,999
Source: GIS Data - IPUMS NHGIS(2018-2022)
$3,000 to $ $3,499
$3,500 or more
Source: GIS Data - IPUMS NHGIS(2018-2022)
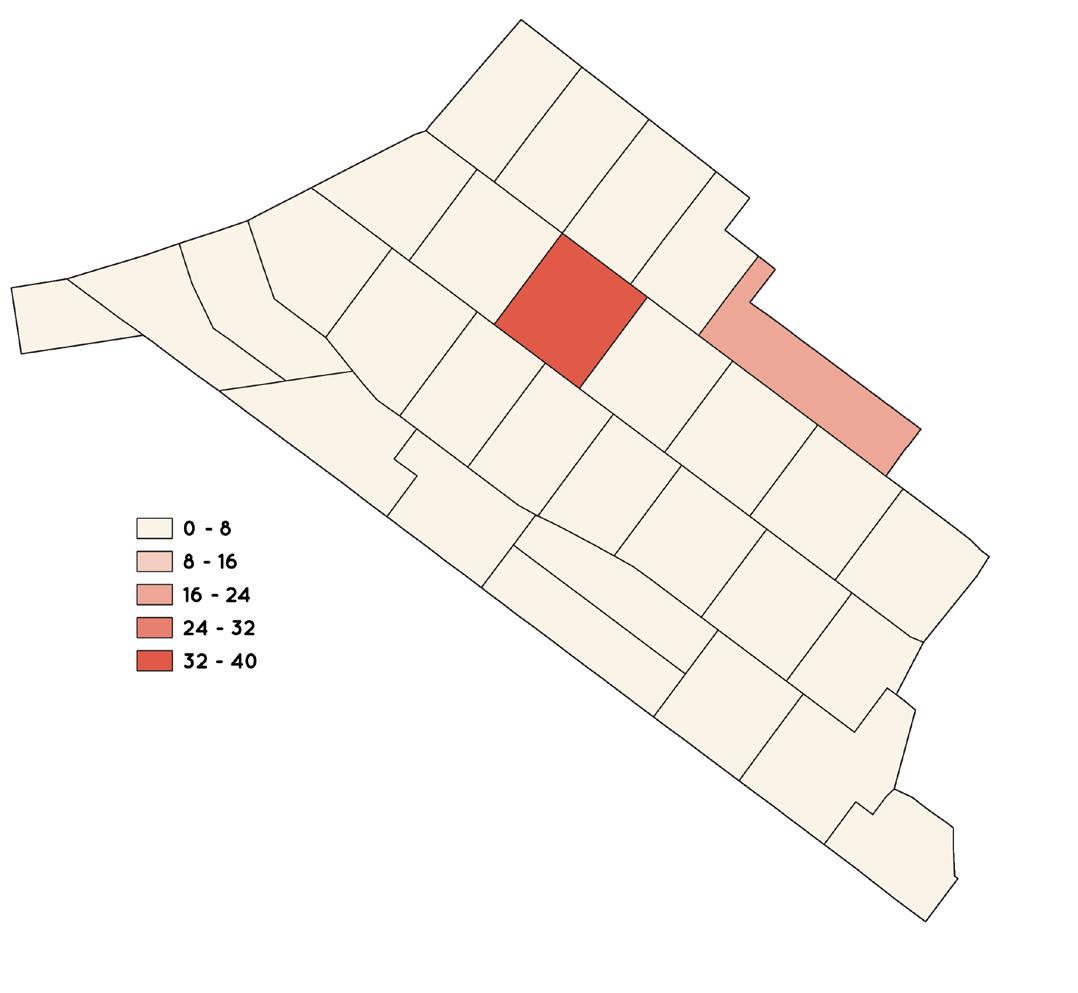
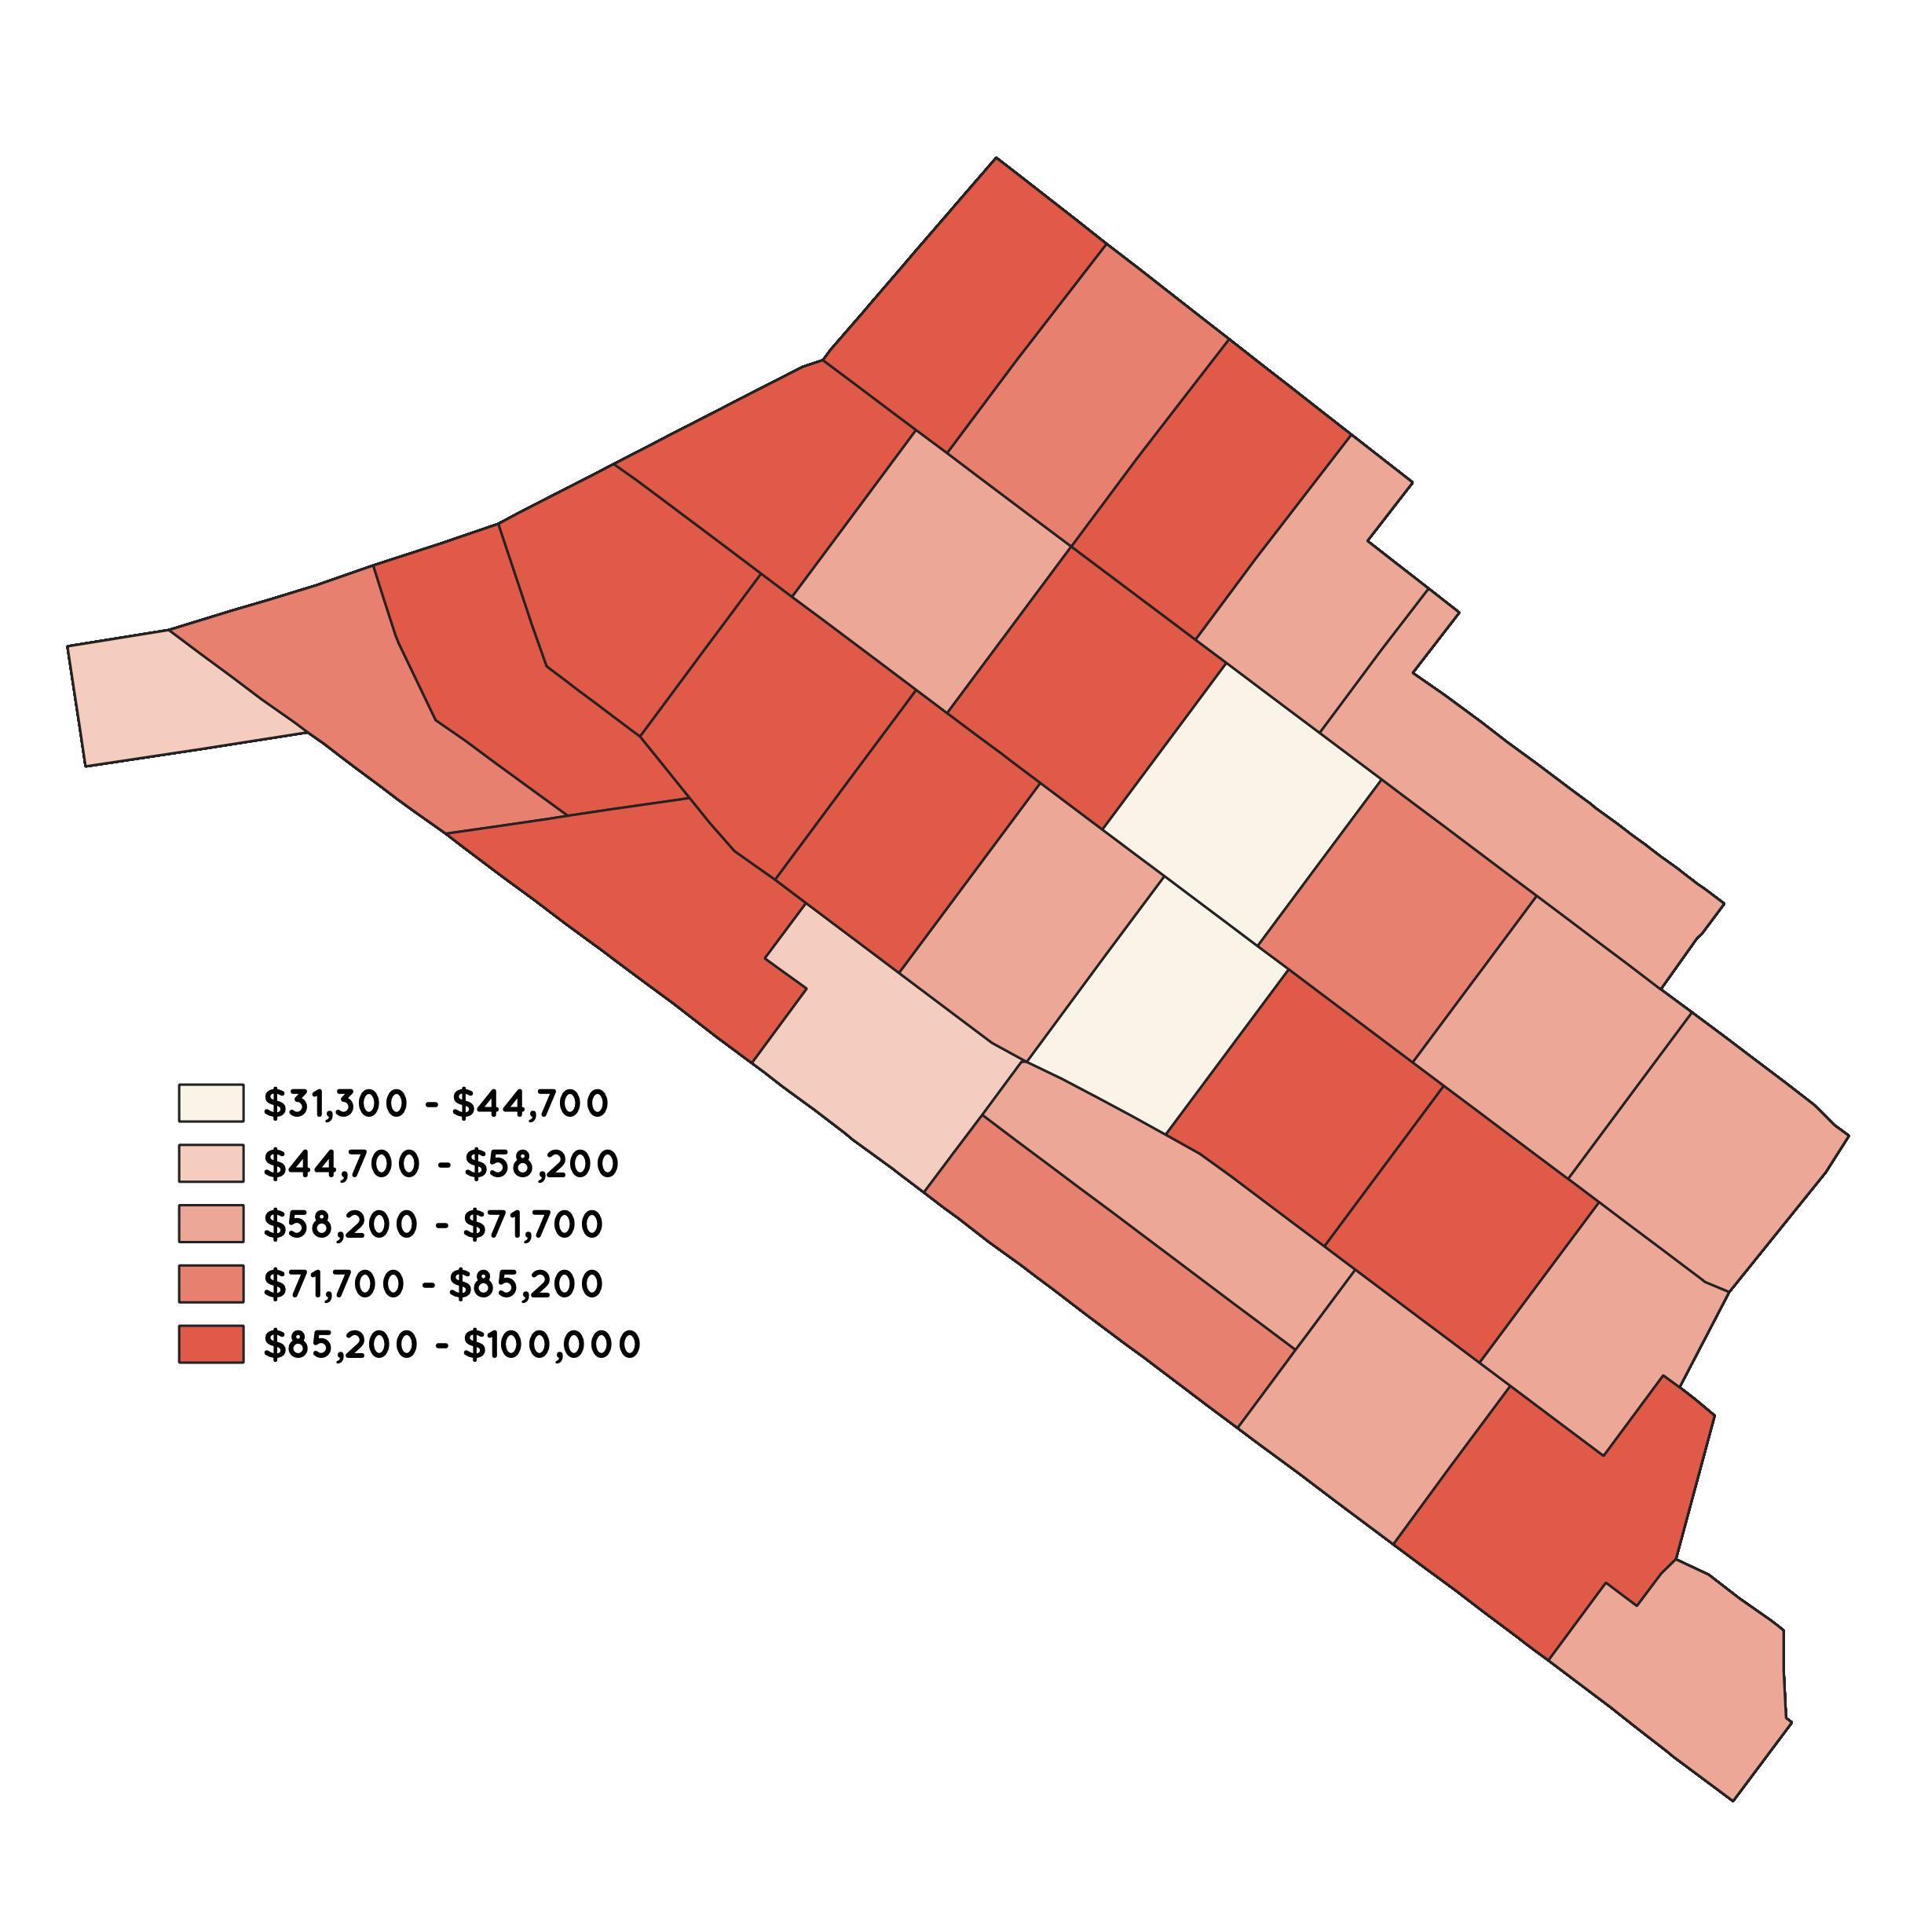
MEDIAN HOUSEHOLD INCOME
in the past 12 months
As evident from both this map and the subsequent ones, even households with higher median incomes struggle to afford their rent.
Source: GIS Data - IPUMS NHGIS (2018-2022)
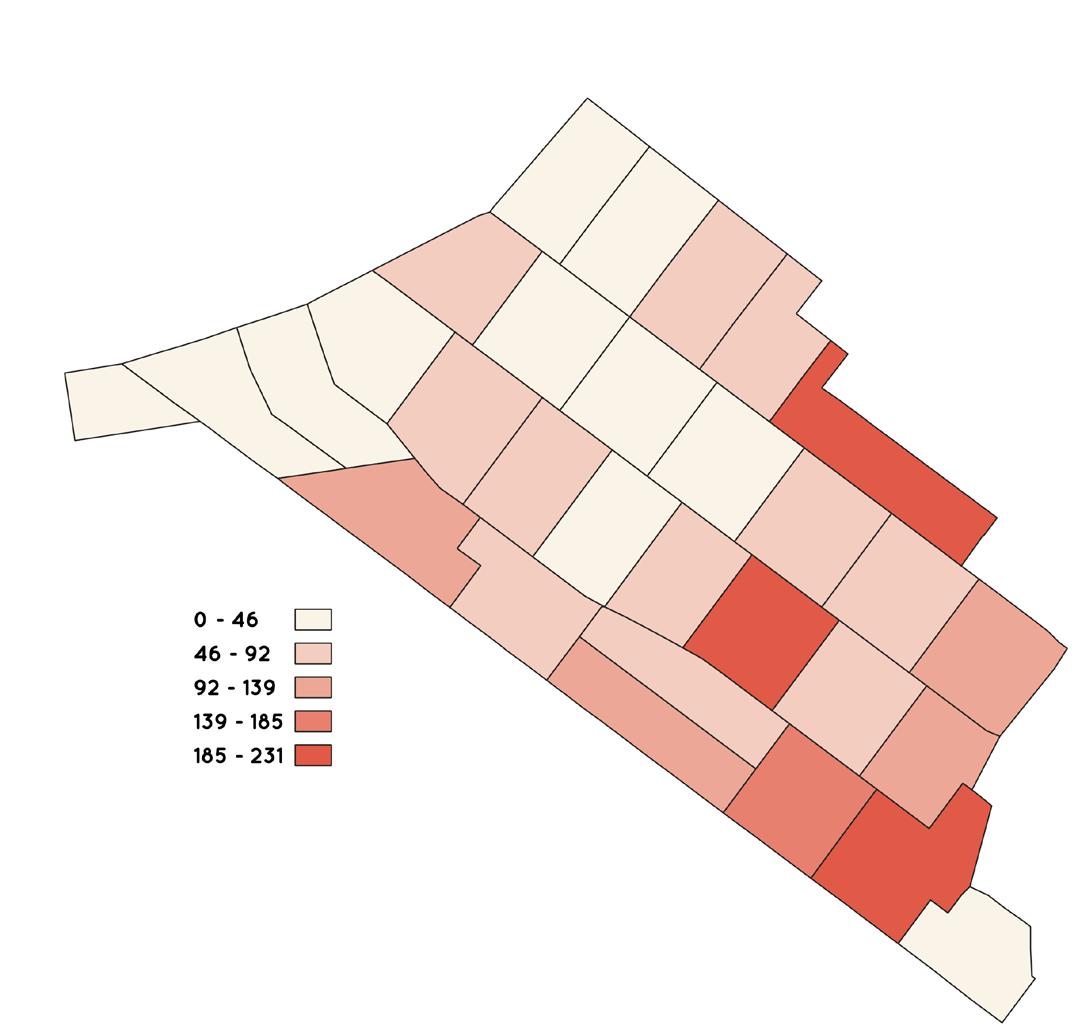
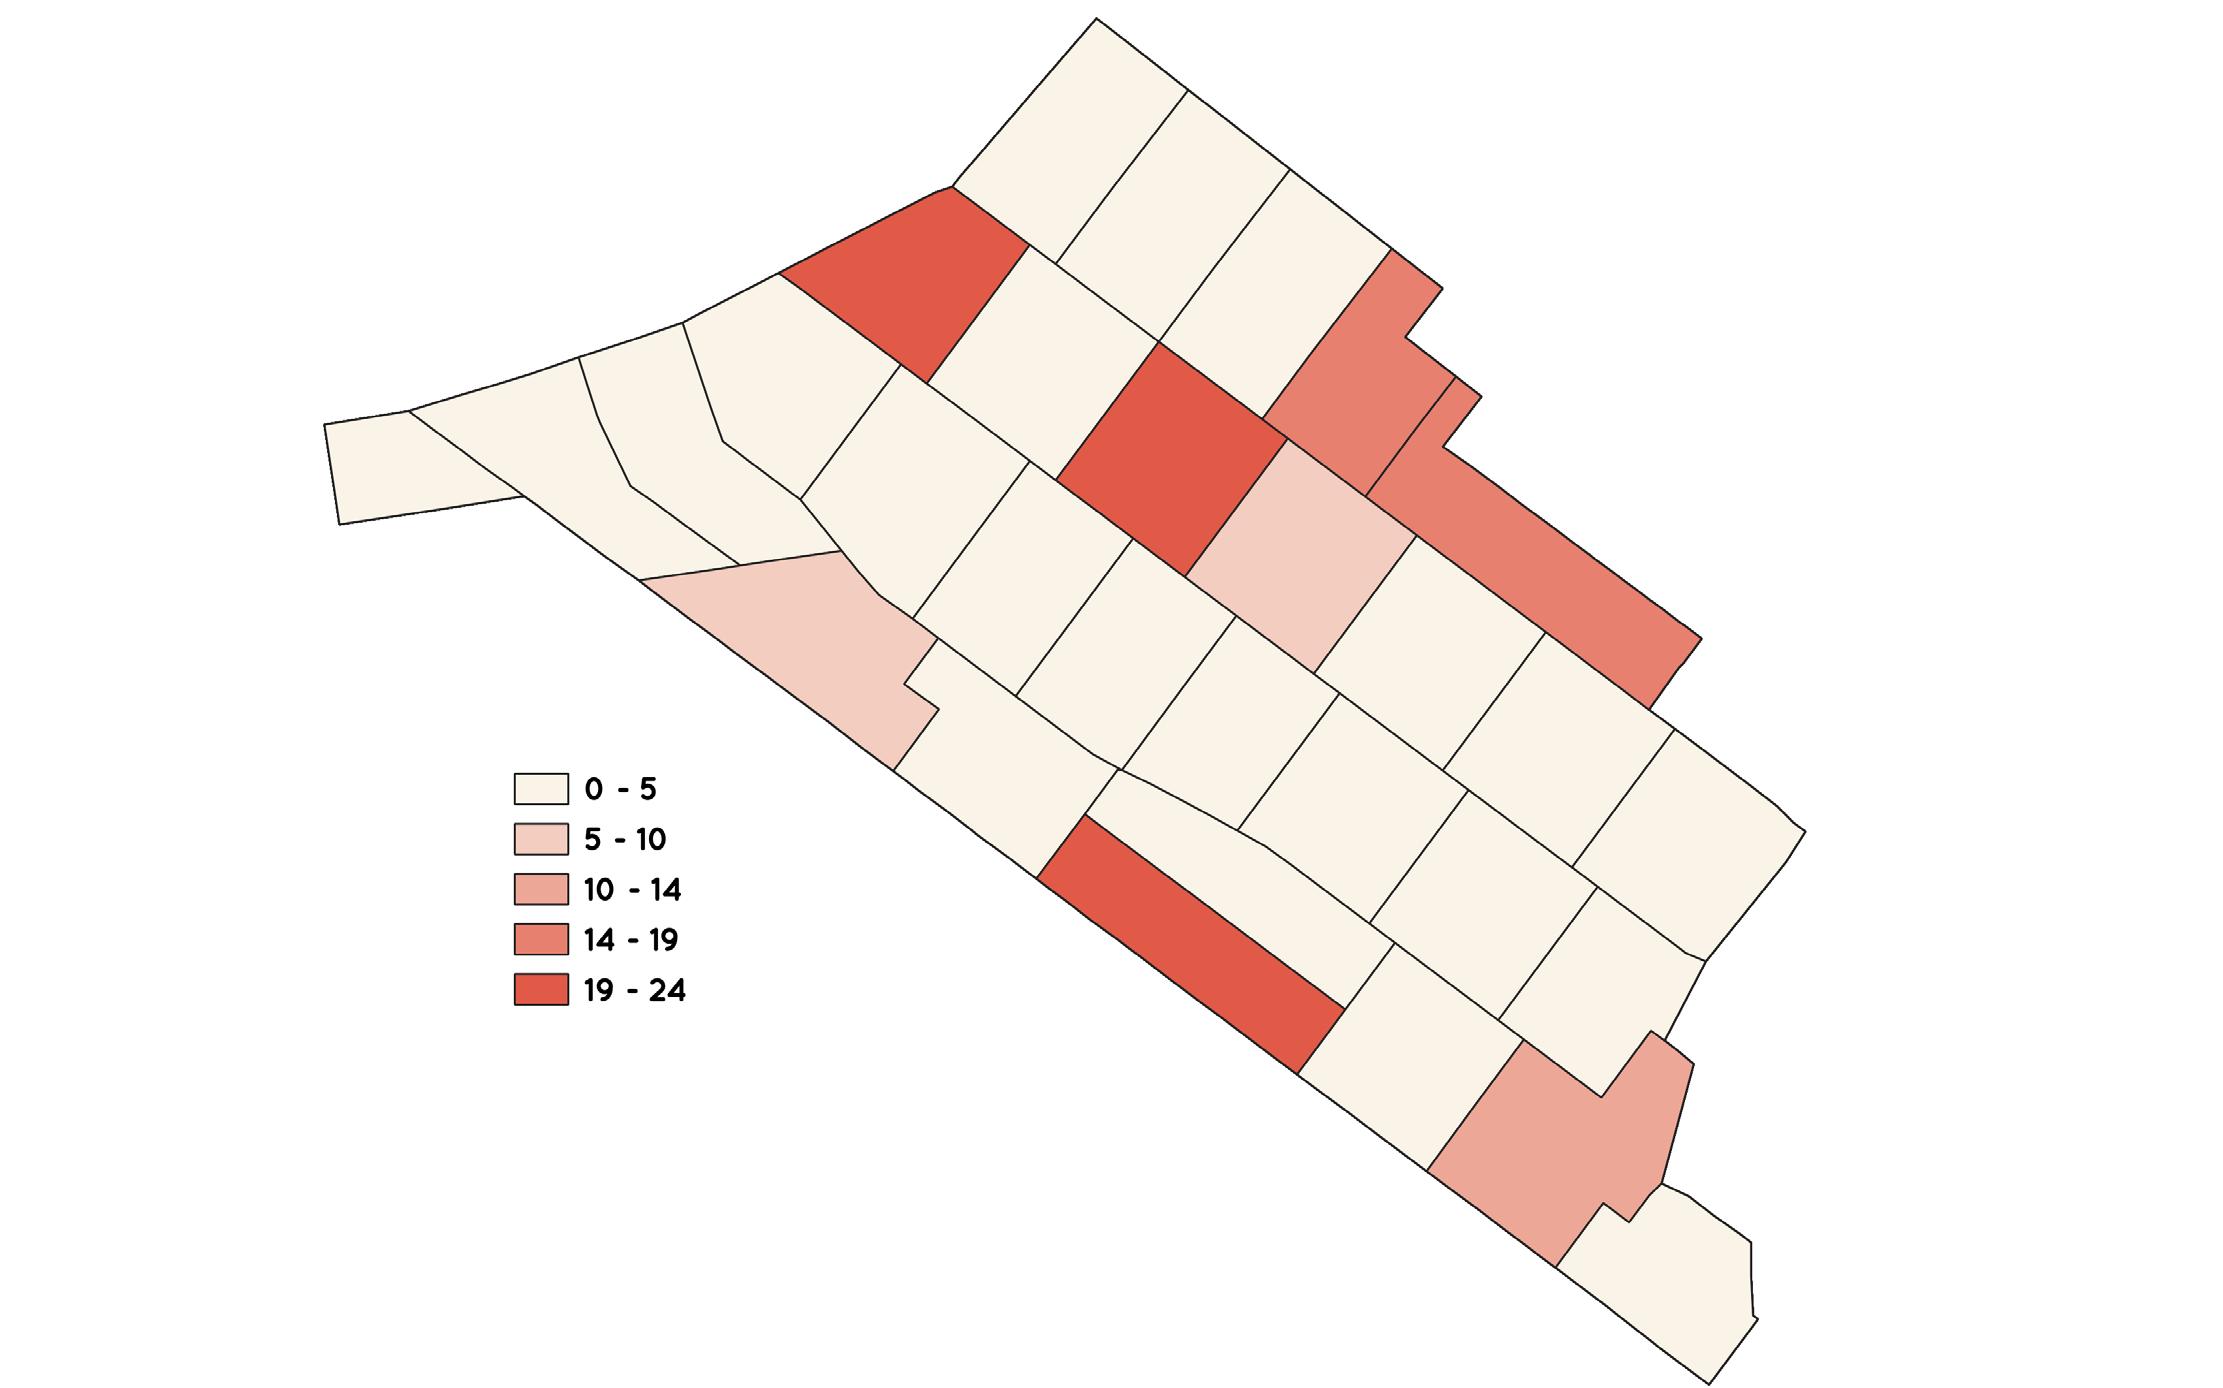
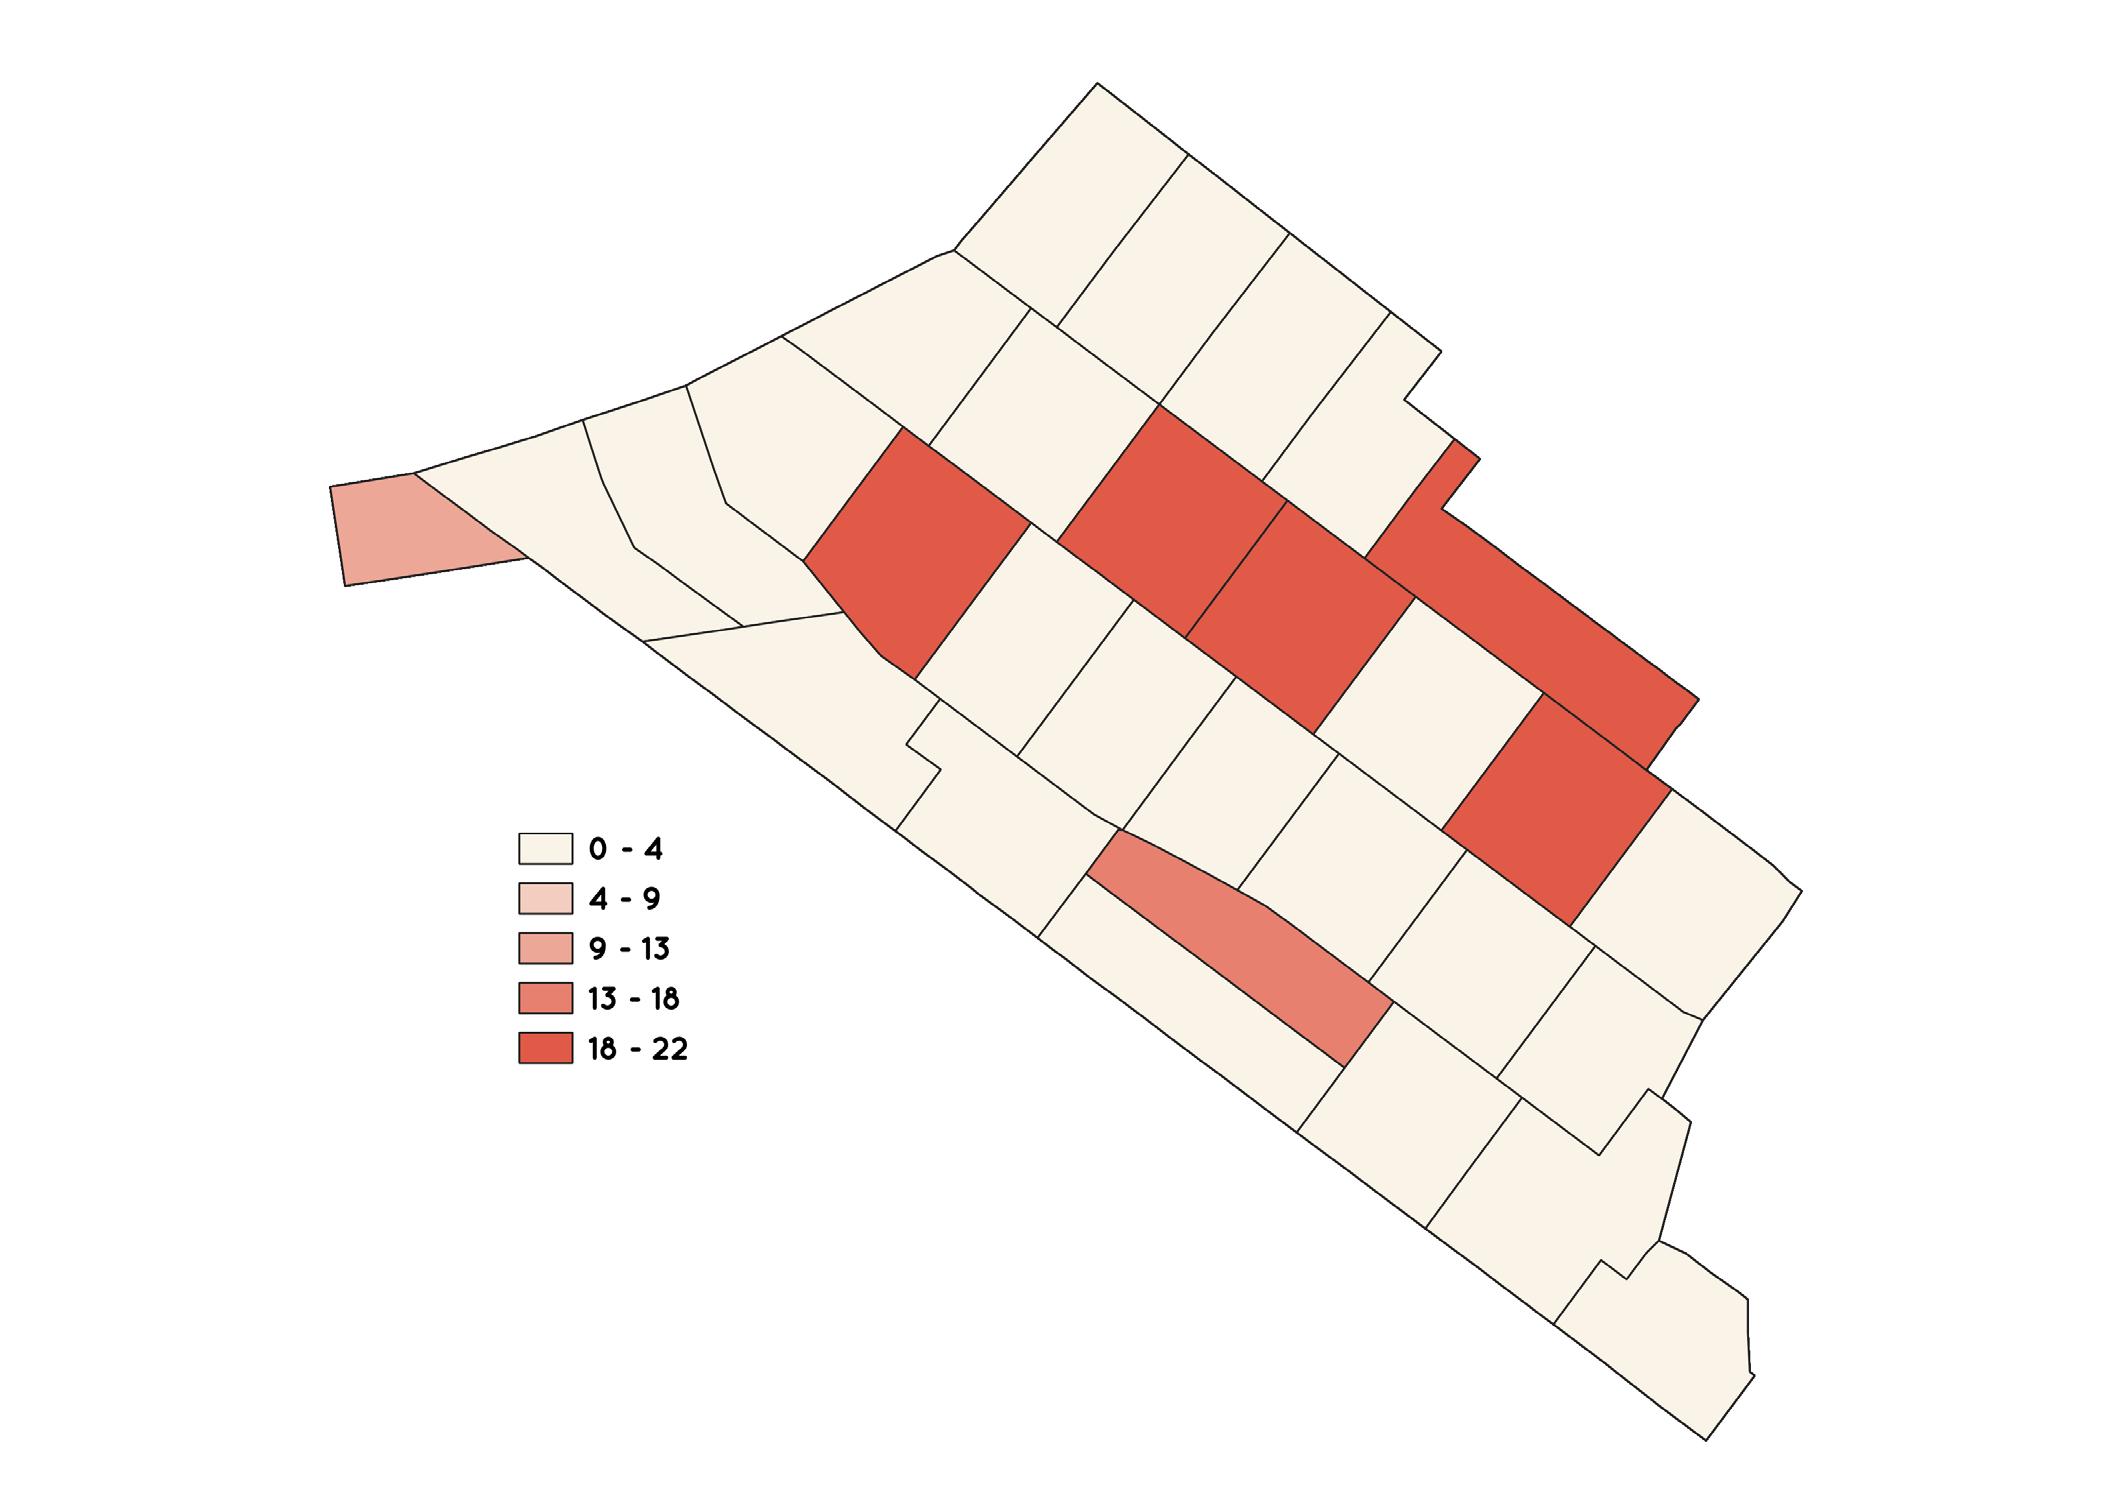
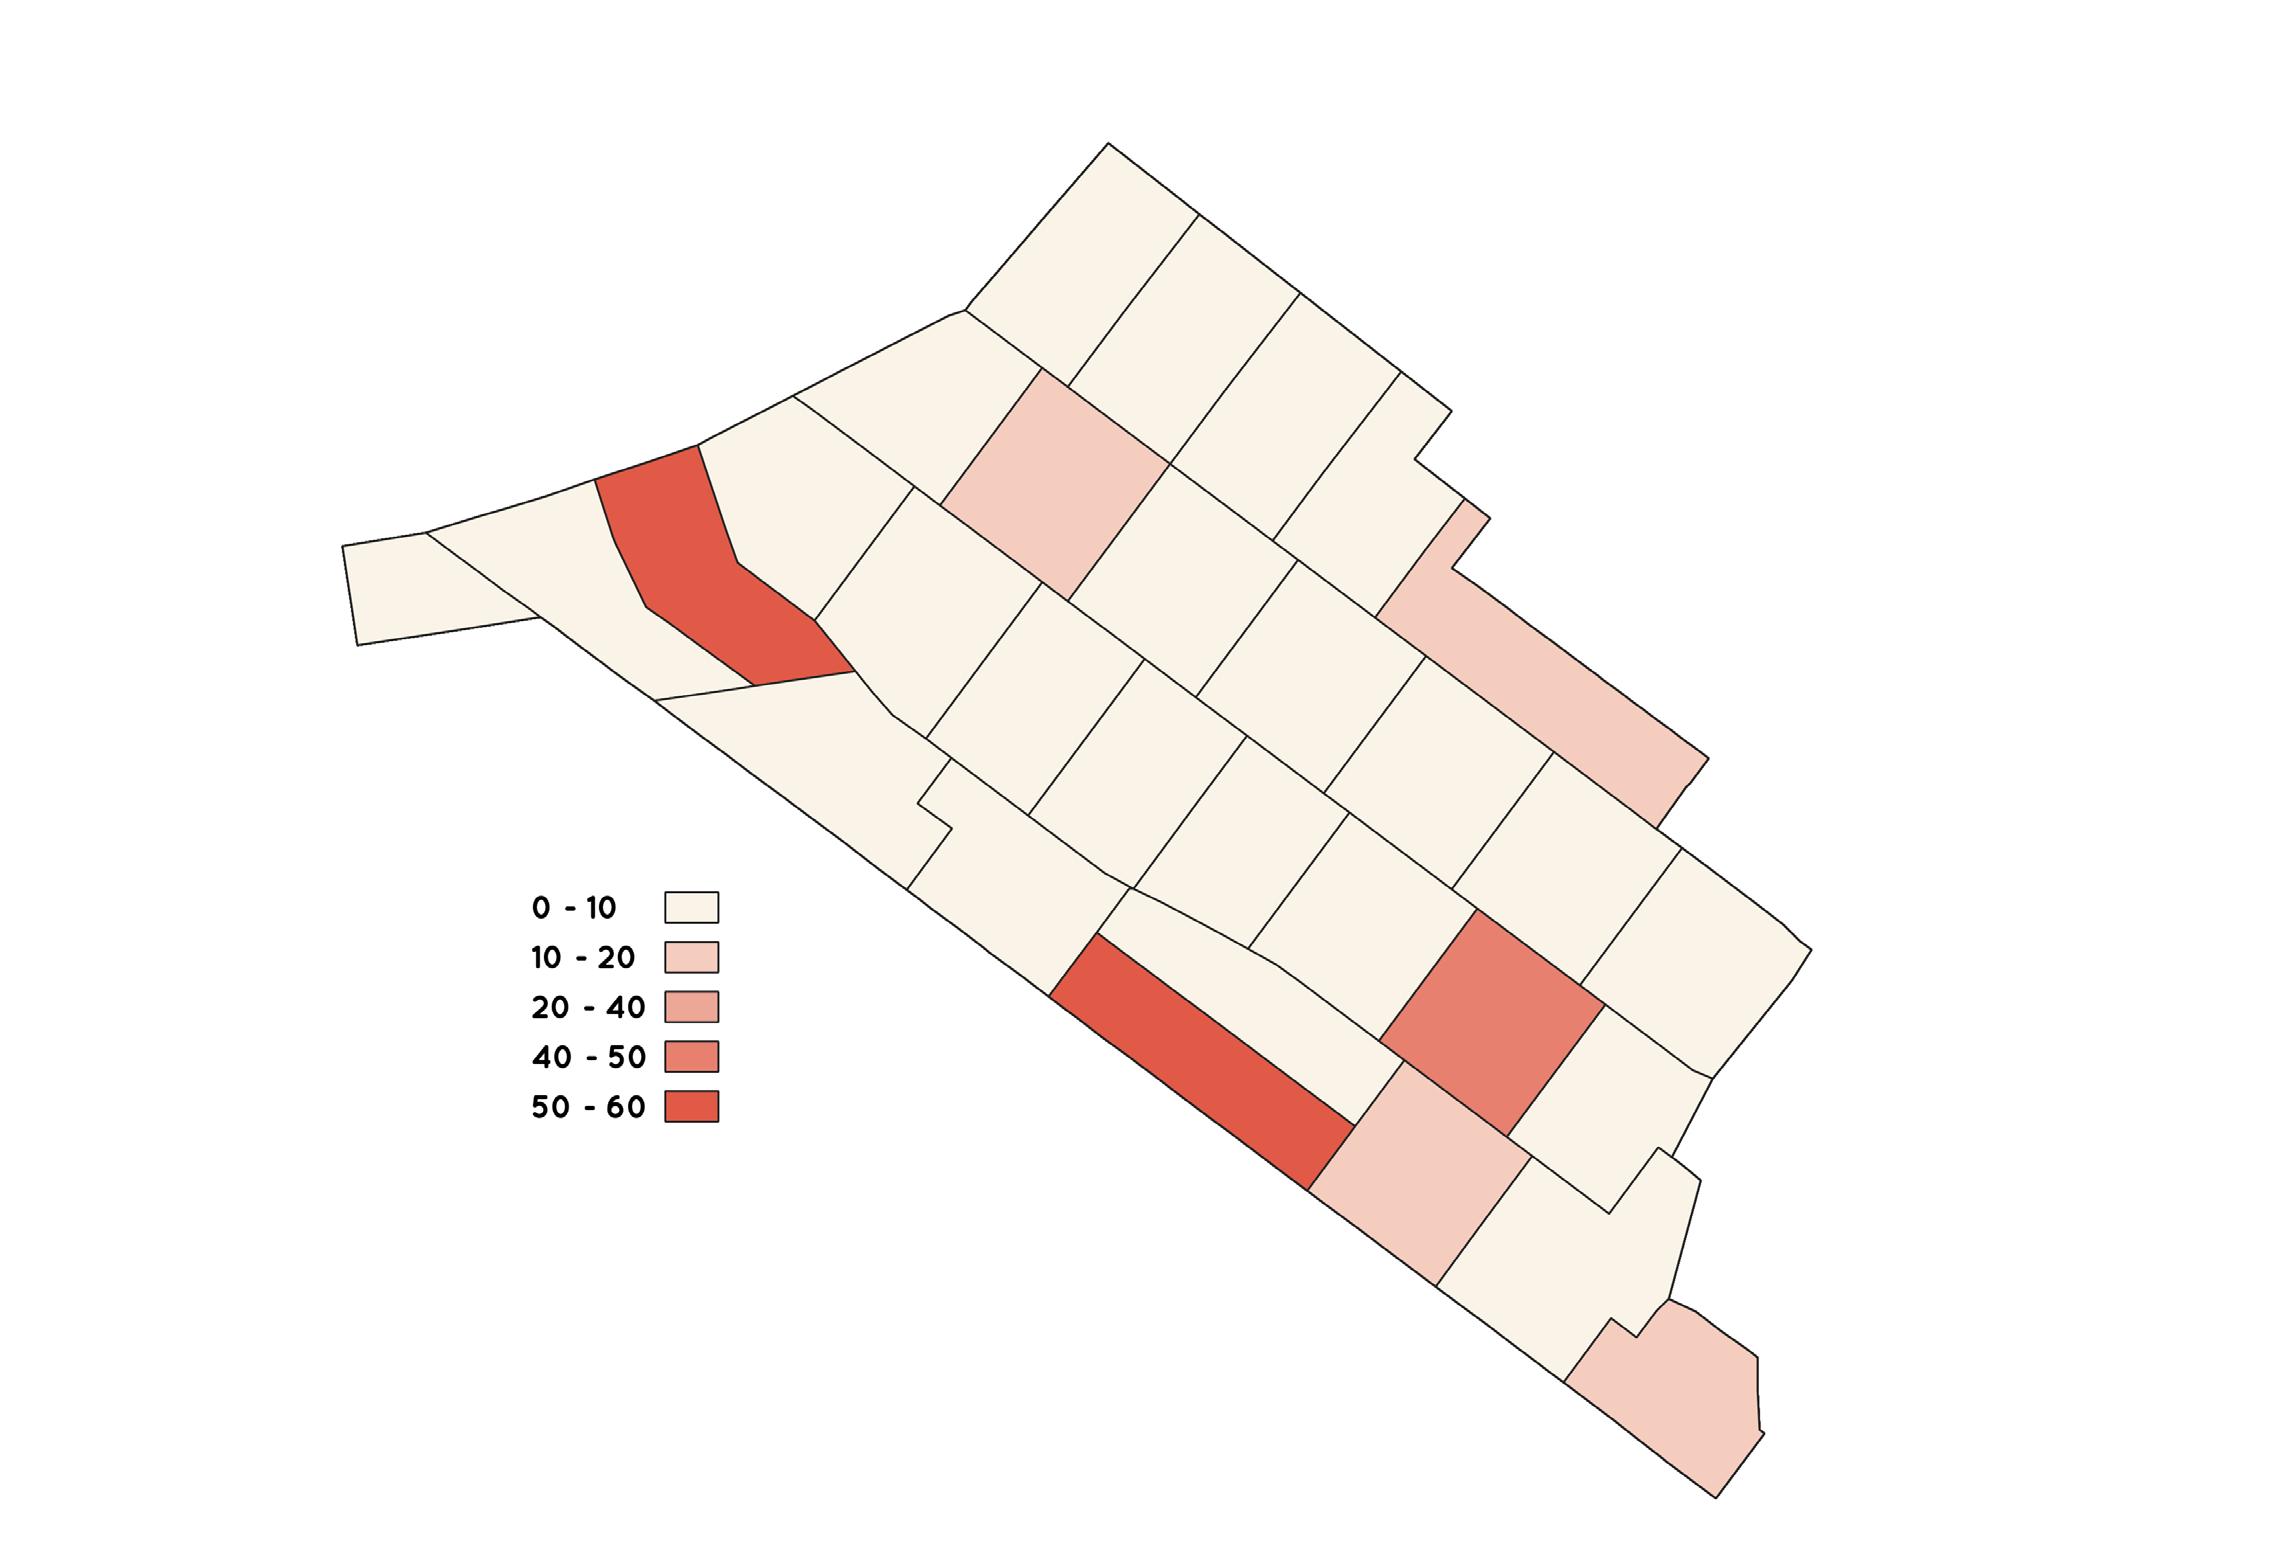
RENT BURDEN
number of people who spend more than 30% of their income on rent
This examines the proportion of household income dedicated to rent payments over the past 12 months. Represented through four maps, each depicting different ranges of this percentage, we shed light on the financial burden faced by residents. Ranging from 30-35%, 35-40%, 40-50%,
or more, these maps vividly illustrate the number of individuals and families struggling to afford their rent. As the maps show, a significant portion of the populations experiences rent burden.
Source: GIS Data - IPUMS NHGIS (2018-2022)
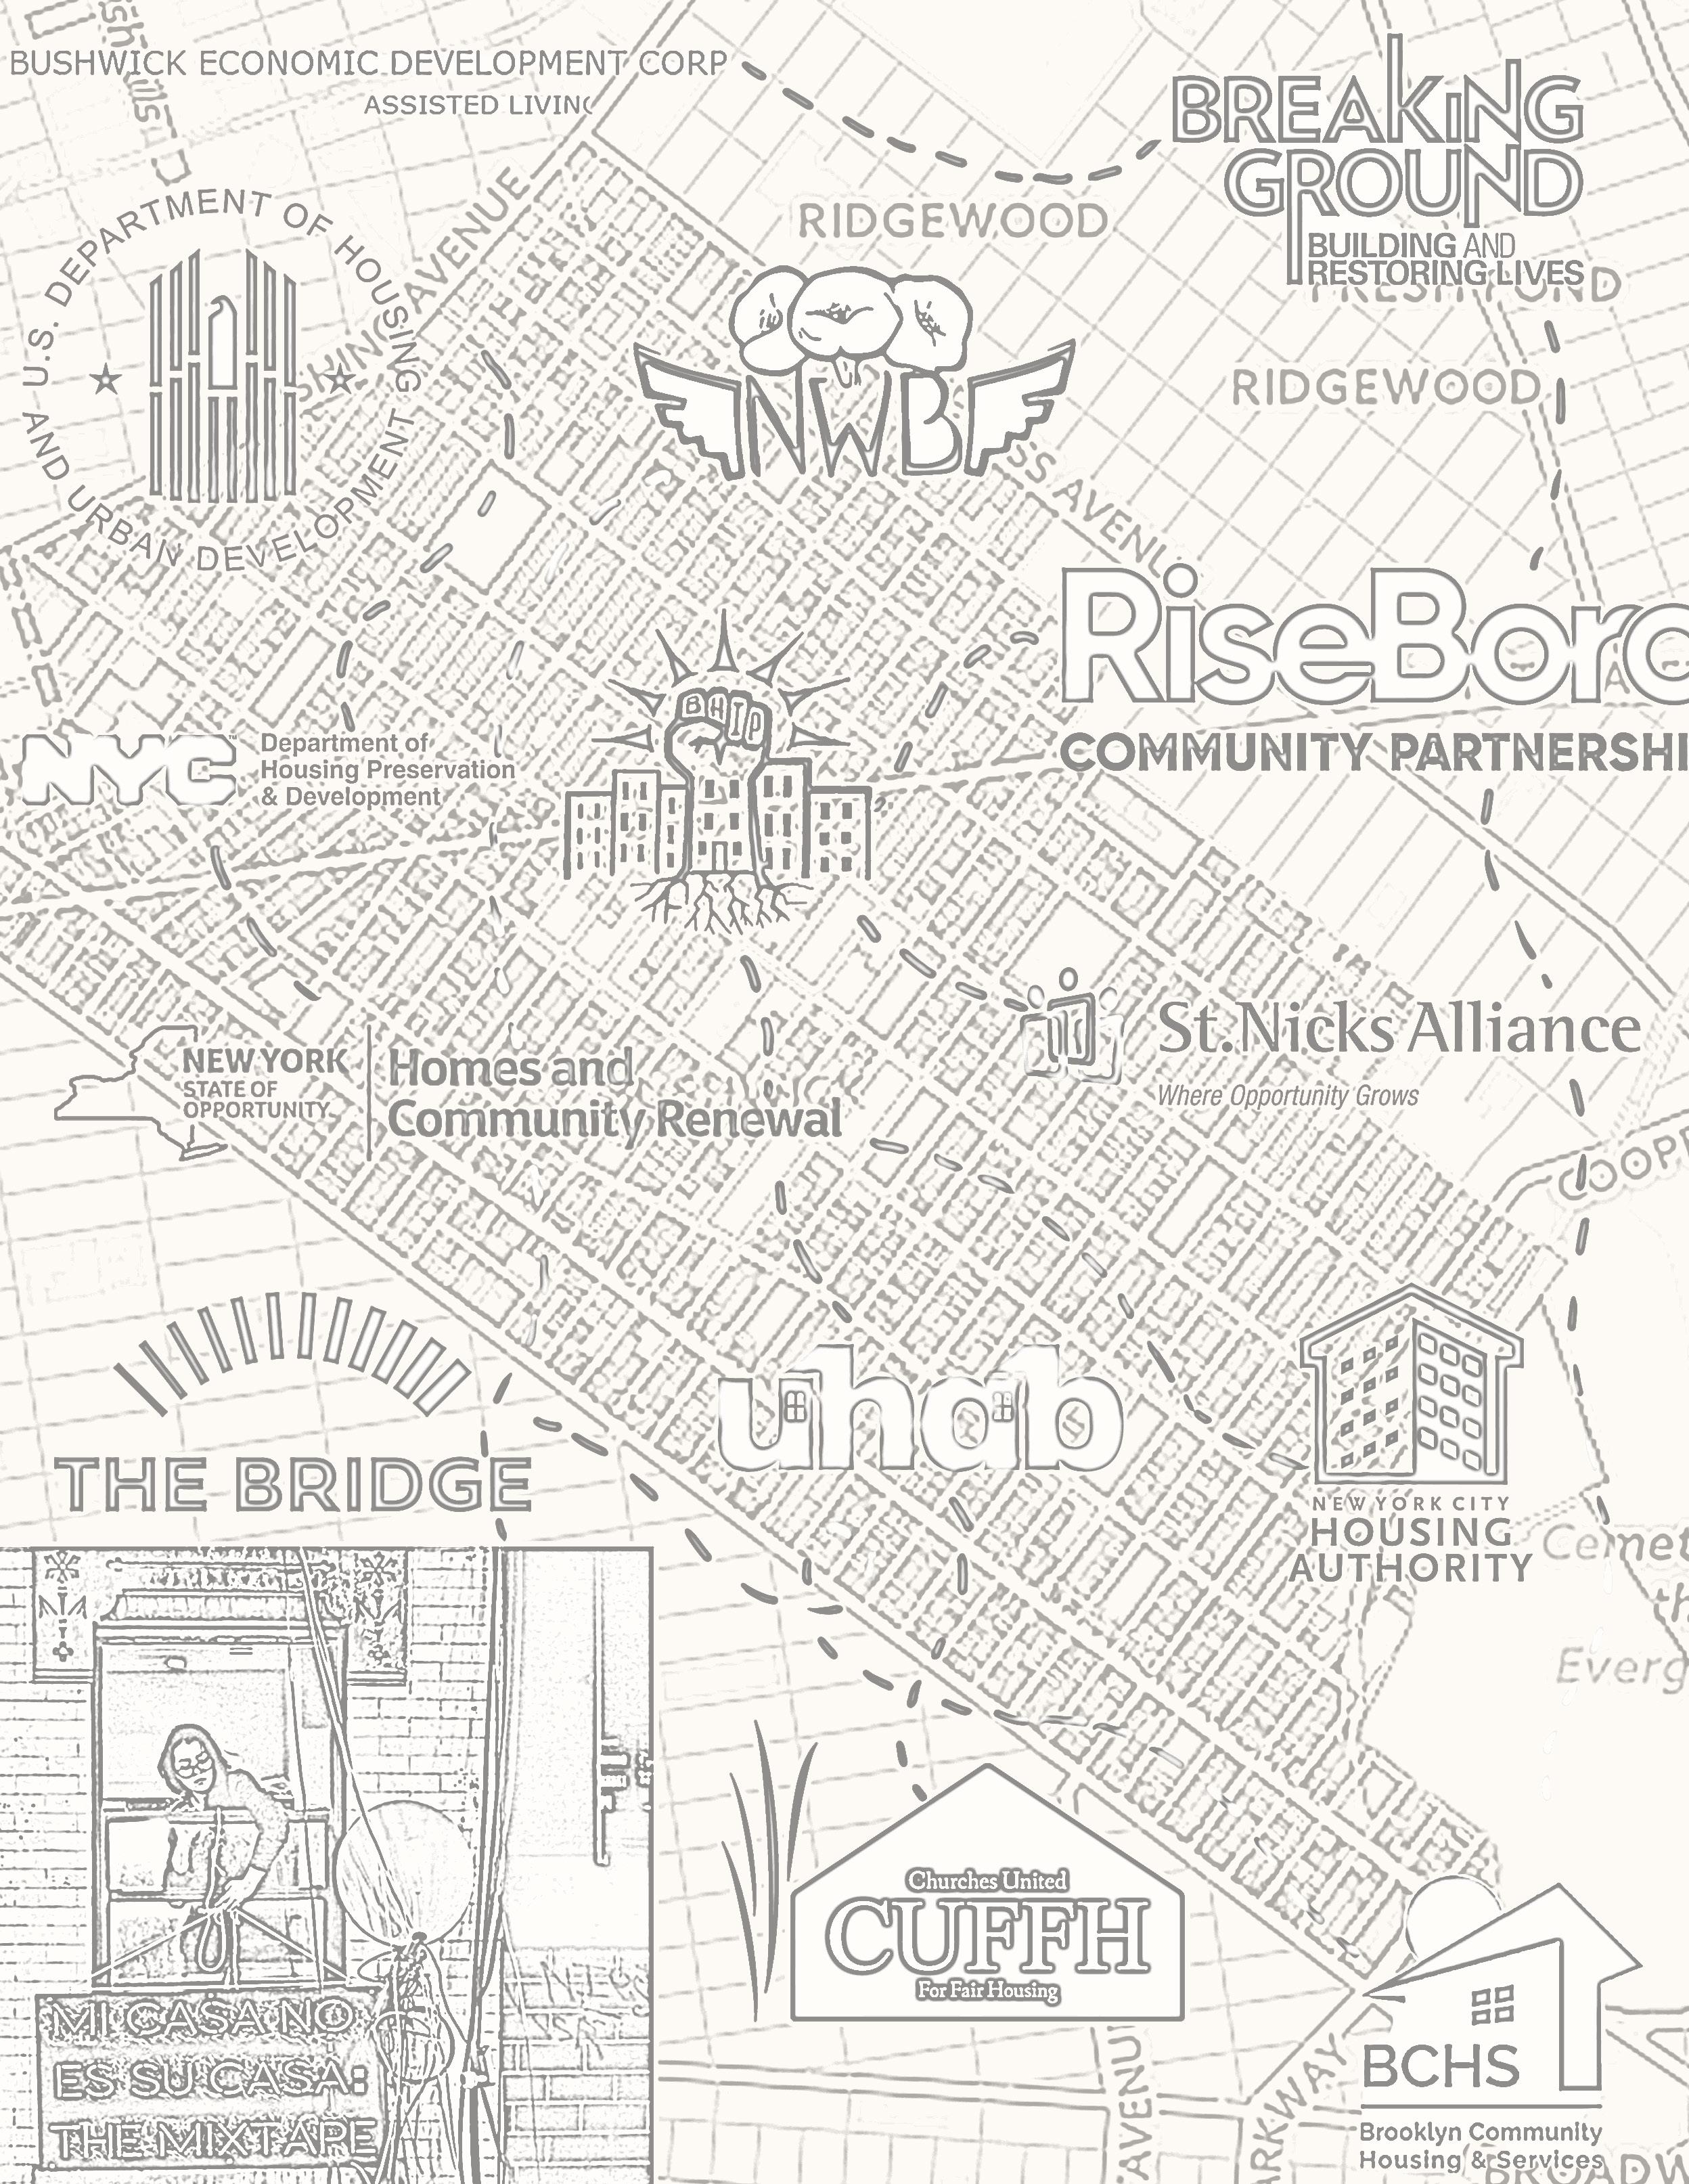
ORGANIZATIONS PROVIDING HOUSING SERVICES IN THE COMMUNITY
Types of organizations involved in housing in Bushwick
Housing in Bushwick is provided, managed, and advocated for by various kinds of organizations ranging from public agencies, non-profit housing corporations, non-profit community organizations, and grassroots activism groups. As such, these housing initiatives vary in their focus, and in the kinds of housing and services they provide. Below is a list of the various organizations that are involved in housing in Bushwick communities, and an infographic detailing the various forms of engagements that they are involved in.
PUBLIC AGENCIES
Federal Department of Housing and Urban Development (HUD):
The U.S. Department of Housing and Urban Development (HUD) is a federal agency responsible for addressing housing needs and promoting community development across the United States. HUD’s mission is to create strong, sustainable, inclusive communities and quality affordable homes for all. The agency oversees a wide range of housing programs and initiatives, including public
HUD provides funding to state and local governments, nonprofit organizations, and private developers to support the construction and rehabilitation of affordable housing, as well as rental assistance programs to help low-income individuals and families afford safe and decent housing. Additionally, HUD enforces fair housing laws to prevent discrimination in housing and promotes sustainable and equitable development practices to revitalize communities and improve access to opportunities for all
New York State Division of Housing and Community Renewal (HCR):
The New York State Division of Homes and Community Renewal (HCR) is tasked with advancing housing affordability, community development, and economic growth across the state of New York. HCR oversees various programs and initiatives aimed at addressing housing needs, promoting fair housing practices, and revitalizing communities.
The agency administers programs to increase the availability of affordable housing, including financing for the construction and rehabilitation of affordable housing units, rental assistance programs, and initiatives to promote homeownership for low- and moderate-income households. HCR also provides funding and technical assistance to support community development projects, infrastructure improvements, and economic development initiatives aimed at creating jobs and strengthening local economies. Additionally, HCR enforces fair housing laws to prevent discrimination in housing and promotes sustainable and inclusive development practices to foster vibrant, resilient communities across New York State.
New York City Housing Authority (NYCHA):
The New York City Housing Authority (NYCHA) plays a significant role in providing affordable housing and community support services in the Bushwick neighborhood of Brooklyn. With several public housing developments in the area, NYCHA serves as a key provider of housing for low- and moderate-income residents in Bushwick.
NYCHA’s work in Bushwick includes the management and maintenance of public housing developments, such as the Bushwick Houses and the Borinquen Plaza Houses. These developments offer affordable apartments to thousands of residents, providing them with safe and decent housing options in the neighborhood.
In addition to managing housing units, NYCHA collaborates with local community organizations and service providers to offer social services and programs to residents in Bushwick. These may include job training and employment assistance, educational programs, health and wellness initiatives, and recreational activities aimed at enhancing the quality of life for residents and promoting community engagement.
NYCHA is also responsible for addressing the unique needs and challenges facing residents in Bushwick through targeted initiatives and partnerships. This may involve efforts to improve safety and security in public housing developments, enhance access to economic opportunities and supportive services, and
New York City Department of Housing Preservation and Development (HPD):
The New York City Department of Housing Preservation and Development (HPD) is responsible for implementing housing policy and programs to promote the preservation and development of affordable housing, enforce housing quality standards, and support neighborhood revitalization efforts throughout the five boroughs of New York City.
HPD oversees a variety of initiatives aimed at addressing housing affordability, including the construction and preservation of affordable housing units, the enforcement of housing maintenance codes, the provision of rental assistance to low-income households, and the promotion of homeownership opportunities for first-time buyers.
Additionally, HPD works closely with community-based organizations, developers, landlords, tenants, and other stakeholders to address housing-related challenges and promote equitable access to safe, decent, and affordable housing for all New Yorkers.
Through its comprehensive approach to housing policy and development, HPD plays a vital role in supporting vibrant, inclusive communities and improving the overall quality of life for residents across the city.
HPD is currently supporting UHAB and RiseBoro in the creation of a CLT to turn 17 existing affordable rental apartment buildings in Bushwick into a scattered site co-op.
NON-PROFIT COMMUNITY-BASED ORGANIZATIONS
Bushwick Economic Development Corporation (BEDCO):
The Bushwick Economic Development Corporation (BEDC) plays a pivotal role in addressing housing needs within the Bushwick community. Established with a mission to foster economic growth and stability, BEDC focuses on various housing initiatives aimed at providing affordable and sustainable living options for residents. Through strategic partnerships with local government entities, developers, and community organizations, BEDC works to create and preserve affordable housing units, rehabilitate distressed properties, and offer housing counseling services to empower residents with knowledge and resources. By advocating for equitable housing policies and implementing innovative solutions, BEDC strives to enhance the overall quality of life and promote inclusive economic development in Bushwick.
While their primary focus isn’t solely on housing, they play a significant role in revitalizing Bushwick and creating affordable
• Bushwick Landing: Mixed-use development with commercial space, community facilities, and affordable apartments.
• Small Business Support: Supporting local businesses that contribute to the economic vitality of the neighborhood.
Brooklyn
Community Housing & Services
Brooklyn Community Housing and Services (BCHS) is dedicated to addressing homelessness and providing stable housing solutions for individuals and families in Brooklyn. Their work encompasses a range of services aimed at preventing homelessness, such as eviction prevention programs and supportive housing initiatives. BCHS operates transitional and permanent housing programs, offering safe and supportive environments for those in need. Additionally, they provide wraparound services including case management, mental health support, and vocational training to help residents rebuild their lives and achieve self-sufficiency. By collaborating with local stakeholders and leveraging resources, BCHS works to create a more inclusive and compassionate community where everyone has access to safe and affordable housing.
Breaking Ground:
Breaking Ground is a nonprofit organization committed to combating homelessness and providing supportive housing solutions in New York City. With a focus on serving vulnerable populations, Breaking Ground offers a comprehensive range of services
designed to address the complex needs of individuals experiencing homelessness. They operate a continuum of housing programs, including transitional housing, permanent supportive housing, and affordable housing developments, with a special emphasis on providing homes for those with mental illness and other disabling conditions. Breaking Ground also offers on-site supportive services such as counseling, healthcare access, and job training to help residents stabilize their lives and thrive independently. Through innovative approaches and collaborative partnerships, Breaking Ground strives to create lasting solutions to homelessness and promote
The Bridge:
The Bridge is a nonprofit organization dedicatedto providing housing and support services for individuals with mental health and developmental challenges in New York City. Specializing in serving those often marginalized by society, The Bridge offers a continuum of care that includes supportive housing, crisis intervention, and communitybased programs. Through their supportive housing initiatives, The Bridge offers safe and affordable housing options coupled with comprehensive services tailored to the unique needs of each individual. These services may include mental health treatment, substance abuse counseling, life skills training, and vocational support, all aimed at promoting recovery, independence, and community integration. By combining housing with wraparound services, The Bridge endeavors to empower their clients to lead fulfilling lives and achieve their highest potential, while also advocating for policies that support the needs of individuals with mental health and
NON-PROFIT HOUSING CORPORATIONS
RiseBoro Community Partnership
RiseBoro is a non-profit organization that develops and manages affordable housing, provides supportive services to residents, and advocates for policies that promote housing justice. They work toward supportive housing for individuals and families experiencing homelessness, senior housing, homeownership assistance, financial counseling, rental assistance, and community organizing.
With a multifaceted approach to community development, RiseBoro’s housing division plays a crucial role in providing affordable and sustainable housing options for individuals and families. Through innovative development projects, RiseBoro creates mixed-income housing developments that cater to diverse community needs. They prioritize the preservation of existing affordable housing stock while also spearheading new construction initiatives to expand access to safe and affordable homes. RiseBoro’s housing efforts are complemented by comprehensive support services, including financial counseling, workforce development, and community engagement programs, aimed at fostering long-term stability and empowerment for residents.
Specific Programs:
• Bushwick II CDA: Affordable apartments for low- and moderate-income families.
• East New York Triangle: Mixed-use development with affordable housing, retail space, and community amenities.
• Hope Gardens: Supportive housing for formerly homeless individuals and families.
Bushwick Housing Independence Project:
The Bushwick Housing Independence Project (BHIP) is a nonprofit organization dedicated to providing housing assistance and support services to individuals and families experiencing homelessness or housing instability in the Bushwick neighborhood of Brooklyn. BHIP’s work in Bushwick focuses on addressing the immediate housing needs of vulnerable populations while also promoting long-term housing stability and independence.
One of BHIP’s primary initiatives in Bushwick is the provision of supportive housing services to individuals and families experiencing homelessness. BHIP offers transitional and permanent supportive housing options, providing safe and stable living environments along with supportive services such as case management, counseling, and access to healthcare and social services.
In addition to supportive housing, BHIP offers homelessness prevention services to individuals and families at risk of eviction or housing loss in Bushwick. This may include rental assistance, financial counseling, and mediation services to help prevent eviction and stabilize housing situations.
BHIP also engages in advocacy efforts to address systemic issues contributing to homelessness and housing instability in Bushwick. This may involve collaborating with local policymakers, community organizations, and stakeholders to advocate for increased funding for affordable housing, stronger tenant protections, and policies to address the root causes of homelessness.
UHAB:
The Urban Homesteading Assistance Board (UHAB) has been instrumental in supporting affordable housing initiatives and cooperative development in the Bushwick neighborhood of Brooklyn. UHAB’s work in Bushwick focuses on empowering residents to take control of their housing through cooperative ownership models and community-led development efforts.
One of UHAB’s key initiatives in Bushwick is the facilitation of tenant cooperatives in existing rental buildings. Through its Mutual Housing Association (MHA) program, UHAB assists tenants in forming cooperatives, enabling them to collectively purchase and manage their buildings. This empowers residents to stabilize their housing situations, gain control over their living conditions, and build stronger, more resilient communities.
UHAB also provides technical assistance, training, and support to tenant cooperatives in Bushwick to help them navigate the complexities of cooperative ownership and management. This includes assistance with legal and financial aspects of cooperative formation, building maintenance and repairs, governance structures, and conflict resolution.
In addition to supporting tenant cooperatives, UHAB engages in community organizing and advocacy efforts in Bushwick to promote housing justice and equitable development. This may involve collaborating with local residents, community organizations, and policymakers to address housing affordability, tenant rights, and other housing-related issues affecting the neighborhood.
St Nicks Alliance:
St. Nicks Alliance is a prominent nonprofit organization committed to enhancing the quality of life for residents in North Brooklyn. Within its array of community development programs, St. Nicks Alliance’s housing division plays a pivotal role in addressing housing needs and promoting affordable housing solutions. Through strategic partnerships and innovative initiatives, St. Nicks Alliance works to preserve and develop affordable housing units, ensuring that residents have access to safe and stable homes. They offer a range of housing services, including tenant advocacy, affordable housing development, and supportive housing programs tailored to meet the diverse needs of the community. St. Nicks Alliance also provides residents with access to vital resources such as financial counseling, eviction prevention assistance, and affordable housing application support. By advocating for equitable housing policies and empowering residents with the tools they need to secure and maintain housing stability,
Churches United For Fair Housing (CUFFH):
Churches United for Fair Housing (CUFFH) is a grassroots organization dedicated to addressing housing injustice and advocating for fair housing policies in New York City. With a foundation rooted in faith and social justice, CUFFH engages in community organizing, education, and direct services to promote equitable access to affordable housing and combat housing discrimination. Through its
various programs, CUFFH assists individuals and families in navigating the complex housing market, providing resources such as housing counseling, tenant organizing, and legal assistance to empower community members to assert their housing rights. Additionally, CUFFH engages in advocacy efforts to advance policies that promote inclusive and equitable housing practices, such as affordable housing development,
GRASSROOTS GROUPS
Northwest Bushwick Community Group
NBGC runs the Neighbors Without Borders (NWB) project, which works to build and sustain meaningful relationships that further community collaborations and works towards housing justice for all through education, cross-cultural dialogues, and direct political action in Bushwick and beyond.
North West Bushwick is an inclusive Community Group advocating a diversity of tactics to address local concerns & meet Community needs.
We look to civic channels that are participatory and advocate for policy and resources responsive to actual local community need before private capital gain. We seek to foster and support development and change in Bushwick that is responsive to the local long term residents and business.
We look to facilitate the Communities’
organizational and action oriented goals. We seek non-speculative development that serves local needs. We seek a Community Land Trust in Bushwick; a network of Community owned
Mi Casa No Es Su Casa:
“Mi Casa No Es Su Casa” is an art-activism campaign that emerged in New York City to challenge gentrification, displacement, and the commercialization of public spaces. Through creative interventions and public art installations, the campaign aims to raise awareness about the impact of gentrification on marginalized communities and advocate for housing justice. By reclaiming public spaces and utilizing art as a tool for social change, “Mi Casa No Es Su Casa” sheds light on issues such as evictions, rent hikes, and the loss of affordable housing. The campaign also fosters community engagement and solidarity among residents facing displacement, while pushing for policies that prioritize the needs of long-standing residents over the interests of developers and gentrifiers. Through its grassroots efforts and collaborative approach, “Mi Casa No Es Su Casa” amplifies the voices of those most affected by gentrification and strives to create spaces where everyone can thrive, regardless of their socioeconomic status or background.
This group works to combat gentrification and displacement in Bushwick through various initiatives such as organizing protests, advocating for stronger tenant protections, and providing legal assistance to tenants facing eviction or harassment.
Los Sures:
Los Sures is a community-based organization located in the Southside of Williamsburg, Brooklyn, dedicated to addressing housing and social justice issues. Rooted in the diverse cultural heritage of the neighborhood, Los Sures works to empower residents and preserve the unique character of the community amidst rapid gentrification and displacement pressures. Through a variety of initiatives, including affordable housing development, tenant organizing, and community outreach, Los Sures strives to ensure that long-time residents have access to safe, affordable housing and are able to remain in their homes. Additionally, the organization provides vital social services, such as legal assistance, eviction prevention, and financial counseling, to support residents in navigating the complexities of the housing market and advocating for their rights. By fostering resident leadership and mobilizing collective action, Los Sures is a driving force for social change, working to create a more equitable and inclusive neighborhood where everyone can thrive.
PART I: BUSHWICK
CITY + BUSHWICK’S PLANS
GENTRIFICATION, NEW DEVELOPMENTS, + ZONING
GENTRIFICATION + LAND USE
Gentrification is the transformation of a neighborhood through the influx of more affluent, often white and young residents, businesses and both public and private investments. It is often coupled with the displacement of longtime residents, changes in the area’s social fabric socially, culturally and commercially. Gentrification has very real impacts on residents’ lives as well as changing the physicality of a neighborhood, and is a direct result and consequence of uneven urban development. Evictions as a result of gentrification and rising real-estate values are at a crisis point nationwide. Millions of tenants currently face evictions, with hispanic and black residents experiencing evictions at disproportionately higher rates than white residents.
Bushwick has been experiencing an accelerated process of gentrification and displacement since the early 2000s. This process is increasingly mirroring the changes that first took place in some of the ‘outer borough’ or waterfront neighborhoods such as Williamsburg and Dumbo in previous years.11 During Bloomberg’s tenure as mayor from 2001-2013, his mayoral office attempted to implement several massive rezoning projects across the city, which focused on issues surrounding quality of life and the development of formerly industrial areas, as “One of the main goals of this change, common in Bloomberg-era rezonings, was to ‘reinforce neighborhood character,’” as under Bloomberg, 37% of the city was rezoned. This in turn led to the massive redevelopment and gentrification of rezoned areas. Given that large parts of Bushwick have been or currently are zoned as industrial these rezonings had a massive impact on the neighborhood and its residents.
Prior to the 1960’s Bushwick was a mixed residential, industrial working class neighborhood in Brooklyn that went through a significant period of deindustrialization and disinvestment. By the 1970’s, via white flight and numerous “urban renewal” projects throughout NYC, Bushwick’s population was largely people of color, with a large Puerto Rican community. Communities, families, and businesses in Bushwick have, for the past decade, been experiencing a substantial shift in the urban fabric of their neighborhood as more and more young, white, middle-class individuals move into the area, rent prices skyrocket, and predatory zoning and development practices are enacted.
ZONING IN BUSHWICK
Previous Rezoning Efforts
In 2019, the New York City Planning Department released the Bushwick Neighborhood Plan, which the department claimed “identifies land use, housing, economic development, transportation, open space, and community health and resource strategies, and builds on previous collaborative work conducted as part of the BCP by DCP, other City agencies, community residents and stakeholders… serving as a roadmap for City agencies and its neighborhood partners as they work to implement a cohesive vision for Bushwick’s future.”The plan focused on two main areas of concern: economic development and affordable housing. While it appeared from the DCP press releases and web content,
NYC Re-Zoning Map
New York City 2013
the Neighborhood Plan seemed to have been a collaborative effort from many neighborhood stakeholders, many residents in the area were displeased when the plan was released, or were at least dubious about how the new zoning and planning processes will affect current residents, as “Upzoning that increases the potential for development very often ‘puts gentrification on steroids…it can multiply the effects of this more gradual process of gentrification and displacement that occurs all the time, always has occurred. And the rezoning can make it much more dramatic.’” In public planning meetings, community board meetings, and in gatherings of local organizations, residents
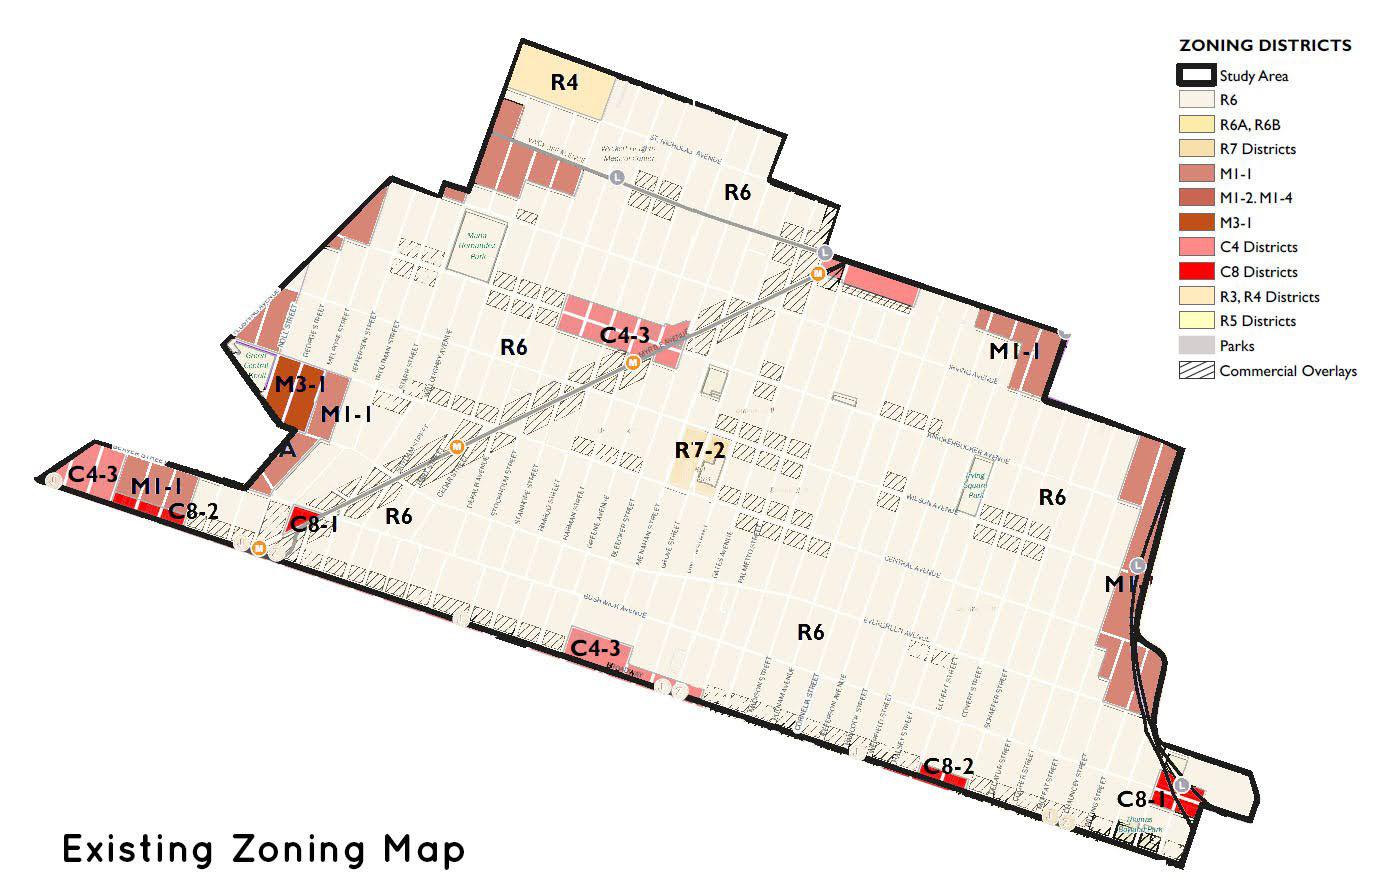
Existing Zoning
Bushwick 2024
expressed their concerns over the Bushwick Neighborhood Plan’s lack of commitment to truly affordable housing and keeping new developments from pricing out current community members. Many felt that from the beginning, the Department of City Planning did not take their concerns seriously, and this was evident in the current iteration of the plan. Initially, in response to the rapid changes in Bushwick that threatened to price out longterm residents, the Bushwick Community Plan was proposed, in partnership with residents, business owners, and other stakeholders in the area and in the city as a whole. The Bushwick Community Plan outlined nearly 200 key recommendations to the city, ranging from increasing health outcomes to networks for cultural resources. However, many of the ideas and proposals put forth differed from the plans set forth by the Department of Planning.. Many leaders and
community members involved in the Bushwick Community Plan have felt that it has been ignored in favor of large scale development opportunities. In 2020, Deputy Mayor Vicki Been “rejected a December request from local officials urging the city to study the Bushwick Community Plan—a four-year collaboration between residents, elected officials, and city agencies to plan the Brooklyn neighborhood’s future..” and “says the review process will not move forward for either plan for now, but that “the door is still open” if Bushwick officials are willing to negotiate,” putting the current residents still at risk of being displaced by the forces of gentrification development, and real estate speculation. However, many community groups are still at work to keep fighting for affordable housing and economic justice in the neighborhood.
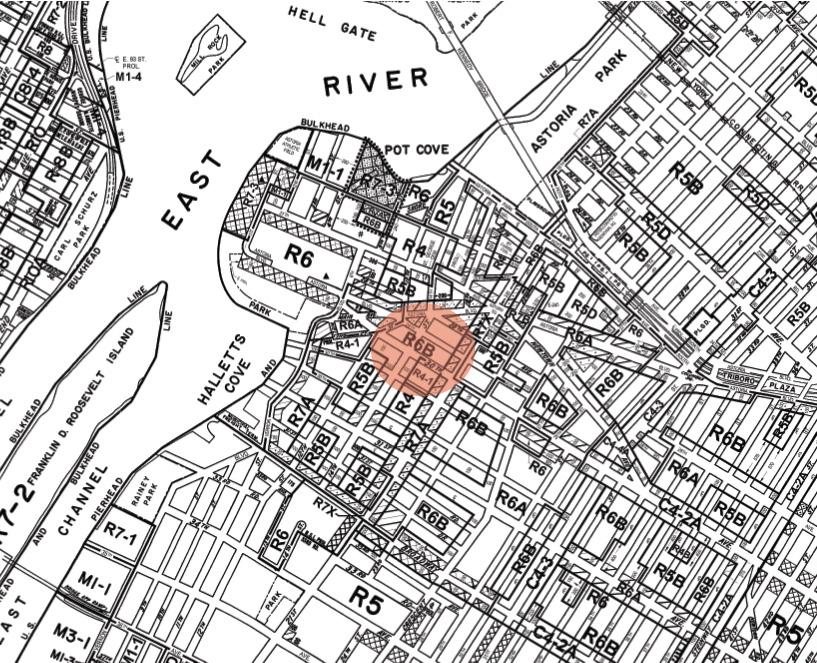
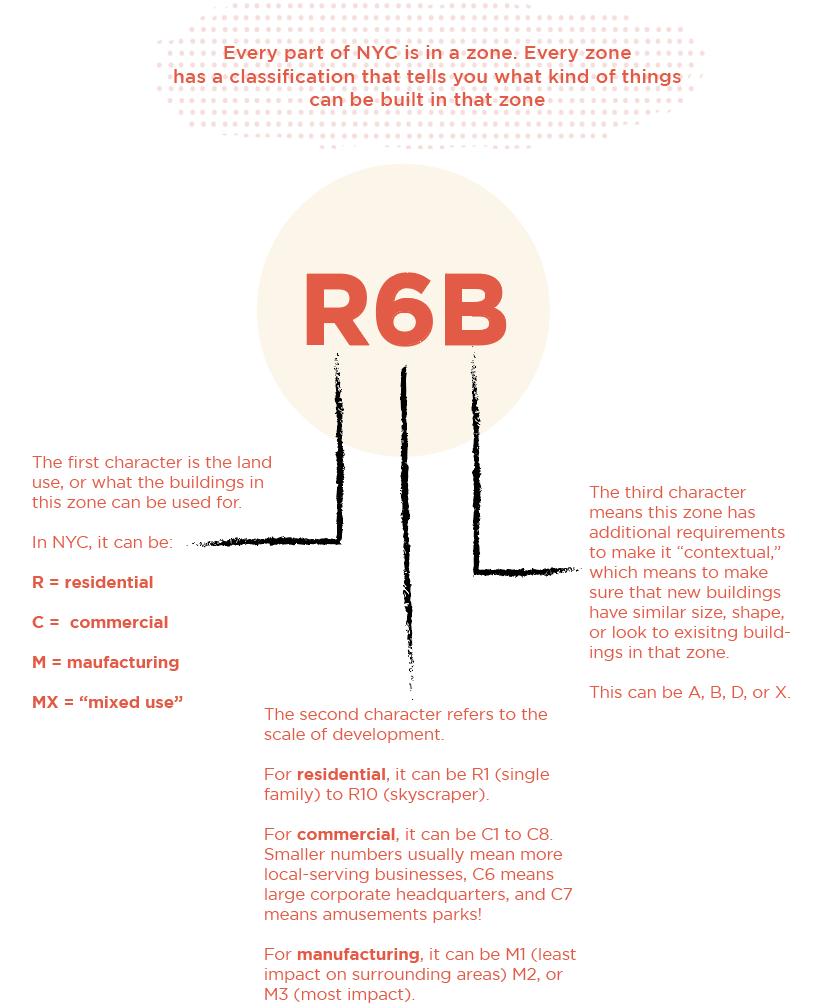
WHAT’S MY ZONE?
THIS IS WHAT A ZONING MAP LOOKS LIKE. EVERY BLOCK IN THE CITY HAS A SPECIFIC ZONE DESIGNATION.
WHAT IS ZONING?
Zoning law defines land use, it keeps housing in one zone and factories in another. It defines how big or small a building can be, the density of the area, as well as the shape of the building itself!
oning defines wh at can be built there.
New York has 4 different zoning (land use) categories: Residential, Commercial, Manufacturing, + Special Purpose
Bushwick’s current zoning mostly consists of R6 and R7 residential zones. Bushwick also has zoning for M1 and M2 manufacturing zones, as well as C4 and C8 commercial zones.
Ima gine a vancant lot next to your building
R1 - R10C
1 - C8
M1 - M3
WHAT DOES IT MEAN?
Uniform. rm. Land U Use. Review. Proceduedure.
department of city planning
community boar d
certifies application to start the ulurp process. makes advisory recommendation on proposal
public hearin g
30 days no time limit
60 days
community approval required! makes advisory recommendation on proposal
sometimes the borough board weighs in too. borough president
ULURP is how NYC makes sure big decisions about land use that affect neighborhoods get looked at by the public and decided on by local to citywide decision-makers.
It might seem a bit confusing, but ULURP is one way communities can have a say in what happens in their neighborhoods.
Before ULURP, community members didn’t really have many avenues to speak up about the decisions that influenced their neighborhoods. Even though ULURP isn’t flawless, it’s a big chance for people to actually have their say and influence how their community evolves.
the whole process can take up to a maximum of 215 da ys.
votes on proposal
votes on proposal city planning commission city council public hearin g
60 days public hearin g
mayor
50 days approves or vetoes proposal.
5 days
NEW DEVELOPMENTS
Affordable Housing Stock
Bushwick experienced a housing boom in 2017 and 2018 followed by a decline in net housing unit developments. The housing stock that is being constructed is primarily market rate housing. This housing is neither affordable or accessible to longterm residents. The changing housing market is a reflection and reaction to the change in demographics and displacement of longer-term Bushwick residents.
Net Housing Units New Housing Units
“Net housing units” typically refers to the total number of housing units available after deducting any non-residential units (such as commercial or industrial spaces) from the total housing stock within a particular area, such as a neighborhood, city, or region.
The data for net housing units in Bushwick shows a sharp decline from 2010 to 2012, followed by significant growth until 2018, indicating rapid development. The fluctuations in subsequent years suggest market adjustments and stabilization efforts, reflecting the complex interplay of economic factors, urban policies, and demographic changes within the neighborhood.
Gentrification and displacement as a result do not occur by accident. Neighborhoods are often targeted and promoted by news and media outlets and staked out by real estate developers and investors. Bushwick has repeatedly been cited in outlets like the New York Times as, “The next up and coming hipster NYC neighborhood” and “the coolest place on the planet”.8 The influx of luxury apartments and taller newer buildings is no accident either - these developments are often built with government subsidies that accelerate and exacerbate the ongoing displacement. Jose Lopez, an organizer with the Youth Power Project comments on the radically changing urban landscape, noting that in place of bodegas and family owned restaurants they are now seeing wine bars and luxury condos. Lopez urges the city to create a supportive plan that helps current longterm residents in the community to continue to live, work, and stay in their community.
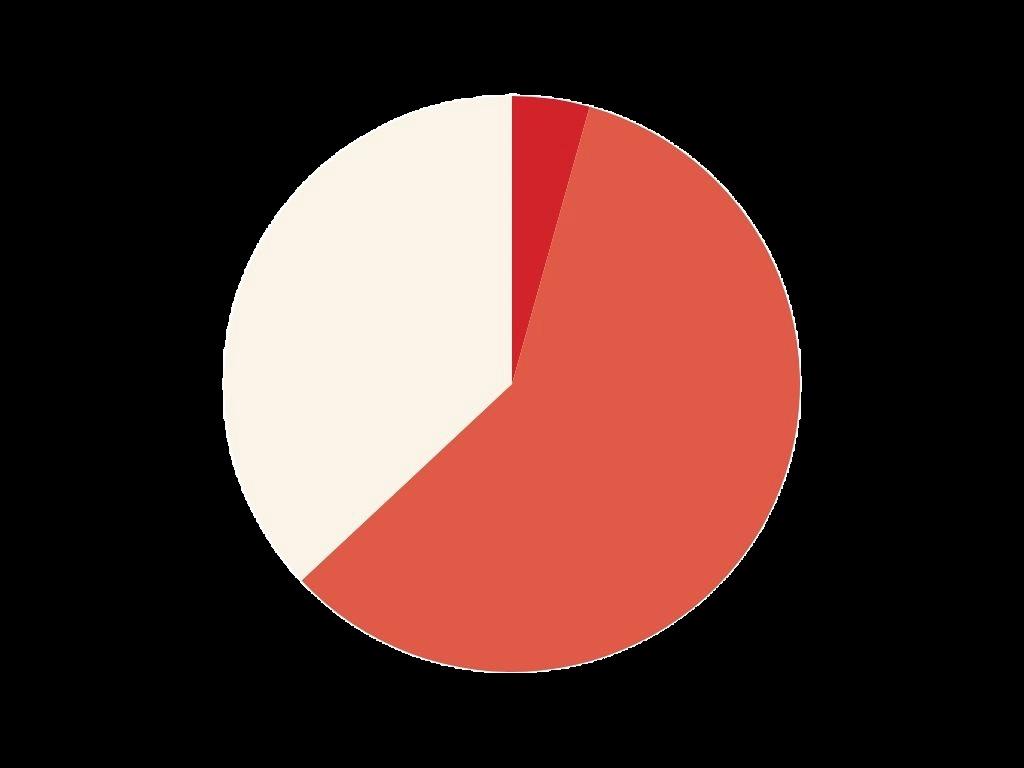
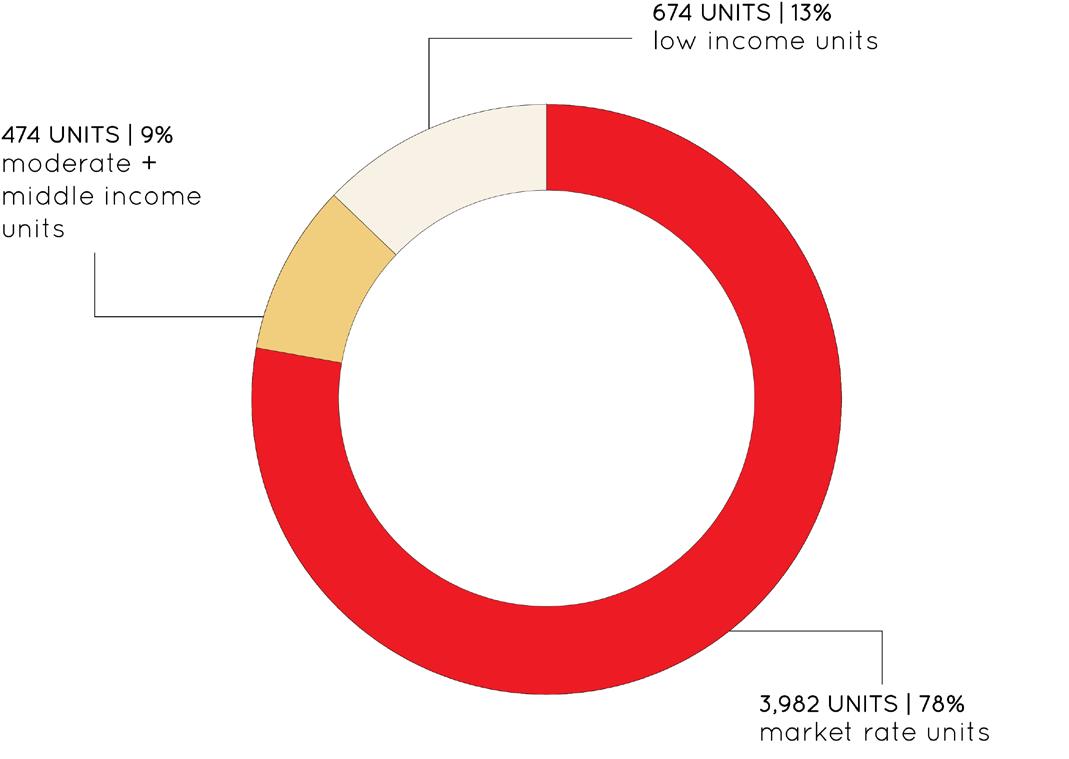
The figure below indicates that 78% of all new housing units in Bushwick since 2010 have been market rate units. Only 13% of new units built have been low income units.
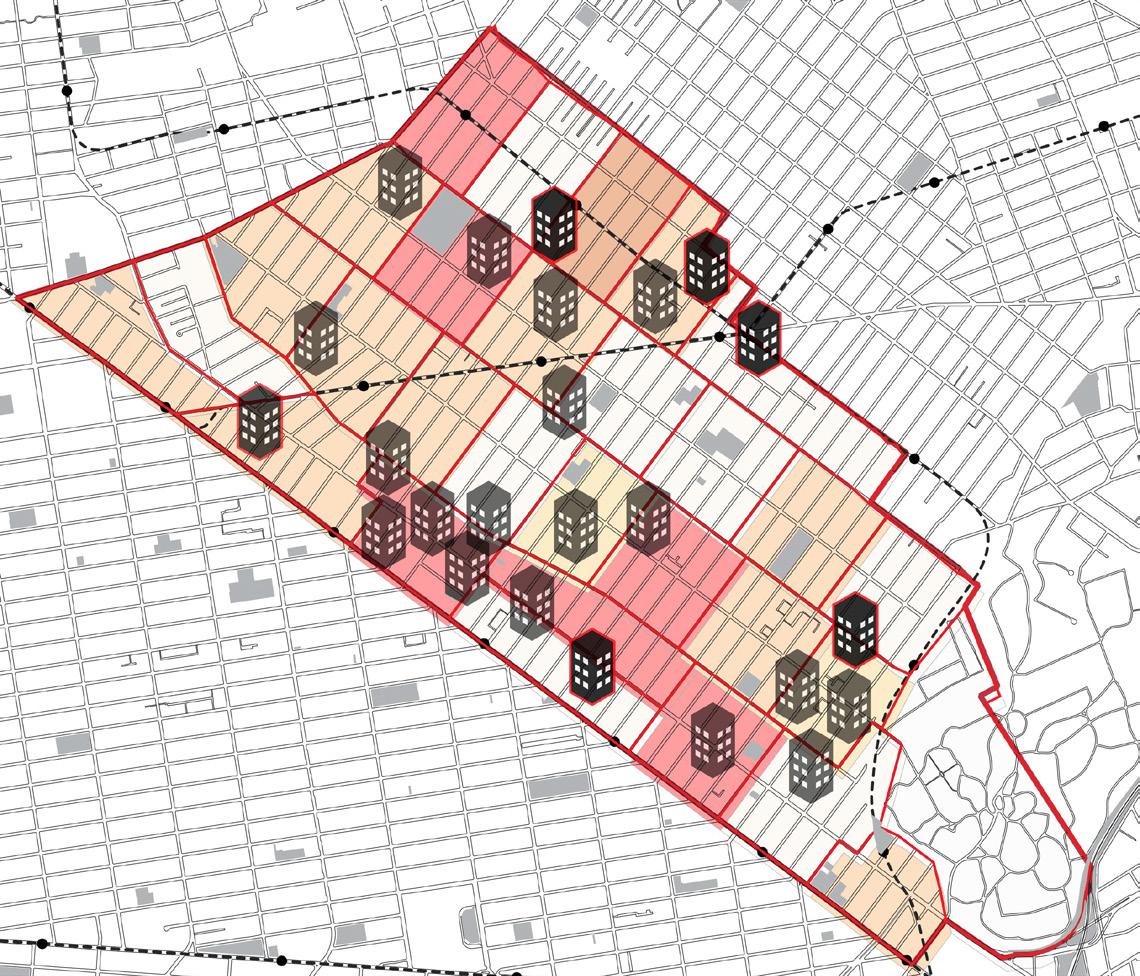
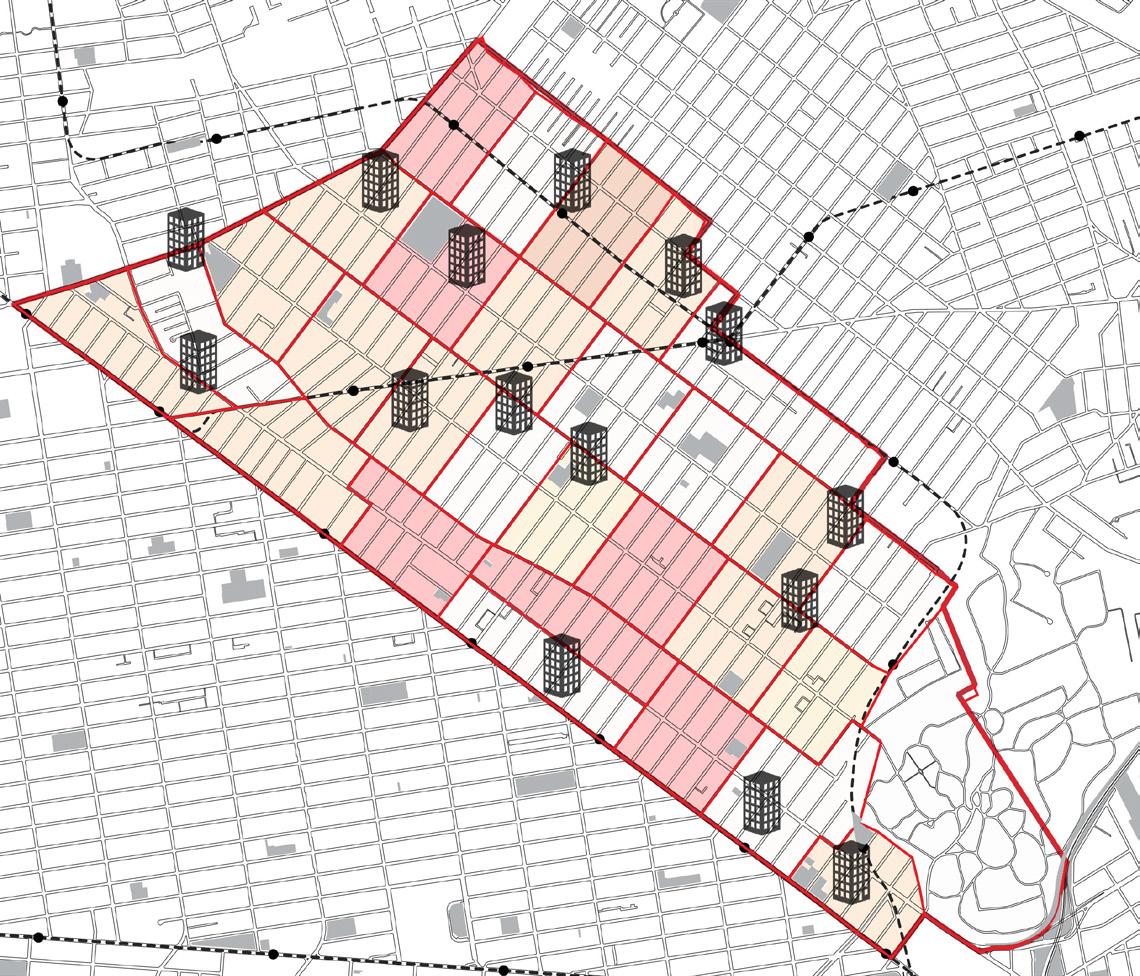
The maps below display new developments in Bushwick from 2015-2023. The first map displayed below visualizes new market rate housing buildings and the second map displays affordable housing developments in the Bushwick neighborhood.
Utilizing data from The Urban Displacement Project we were able to visualize the stages of gentrification affecting individual census tracts across Bushwick in 2019. Through meticulous research and analysis The Urban Displacement project demarcated 5 stages of gentrification as follows. The first categorization is low-income areas that are not currently losing low-income households, the second category is tracts that are experiencing ongoing displacement of lowincome households, the third is tracts that are at risk of gentrification, the fourth is tracts that are experiencing ongoing gentrification, and the fifth is moderate to high income tracts that are in stages of advanced
gentrification. These five categories were calculated and determined by a number of criteria including, population size, racial and ethnic composition, average median household income, as well as changes in rent prices. Based on this data, 40% of the census tracts in Bushwick are currently experiencing “Ongoing Gentrification”, and just over 20% of the census tracts in Bushwick are experiencing “Ongoing Displacement of Low-Income Households” via gentrification processes.
In 2020 COVID-19 put a pause on evictions but also made way for a new wave of wealthy white residents due to the infamous “covid-deal” apartments. Since 2020 there has been a continued influx of white and wealthier residents in Western Bushwick and long the L and J subway lines. These areas are experiencing accelerated rates of gentrification as noted in the map to the right.
Not Losing osing Low-Income H Hoouseholds (Low Income)
Population in 2000 > 500
Low income tract in 2016
Not classified as at risk or ongoing gentrification or displacement
Ongoing Dis Displacement ement of Low-Income H Households (Low Income)
Population in 2000 > 500
Low income migration rate lower in 2015 than 2019
Loss of LI households 2000-2016 Few signs of gentrification occuring
At Risk of Gen f Gentrification rification (Low Income)
Population in 2016 > 500
Low income tract in 2016
“Hot Market” from 2000 to 2016 (above regional median change in rent OR median home value)
Vulnerable in 2016 (experienced demographic change between 2000 - 2015
Ongoing Gen Genttrification rification (Low Income)
Population in 2016 > 500
Low income tract in 2016
Vulnerable to gentrification in 1990 and experienced demographic change between 1990-2000
Advanced Gen ed Gentrification rification (Mo (Moderate to High Income)
Population in 2016 > 500
Moderate to high income tract in 2016
Gentrified in 1990-2000
Chapple
Household Income Distribuition
< $20,000
$20,001 - $40,000
$40,001 - $60,000
$60,001 - $100,000
$100,001 - $200,000 > $200,000
DATA FROM:
The distribution and change in household income over time is a clear indicator that processes of gentrification are taking place within neighborhoods. The displacement of longer-term POC residents can also be seen, quantitatively, through the data on the household income distribution. From 2000 to 2021 in Bushwick lower-income households decreased while the number of high-income households increased. In 2000 16% of households had an income between $60,001$100,000 and by 2021 21% of the households had an income between $60,001-$100,000. Additionally in 2021, 24% of the population had an income between $100,001-$250,000, while in 2000 only 9% of the population had an income between $100,001 and $250,000. As shown in the figure above. The increase in the income of Bushwick residents has a growth rate of 8% between 1990 and 2000, to 16% between 2000 and 2010. These numbers indicate that the neighborhood has been attracting wealthier residents since the 90’s at a rate that continues to accelerate. Additionally, as shown by the figure to the
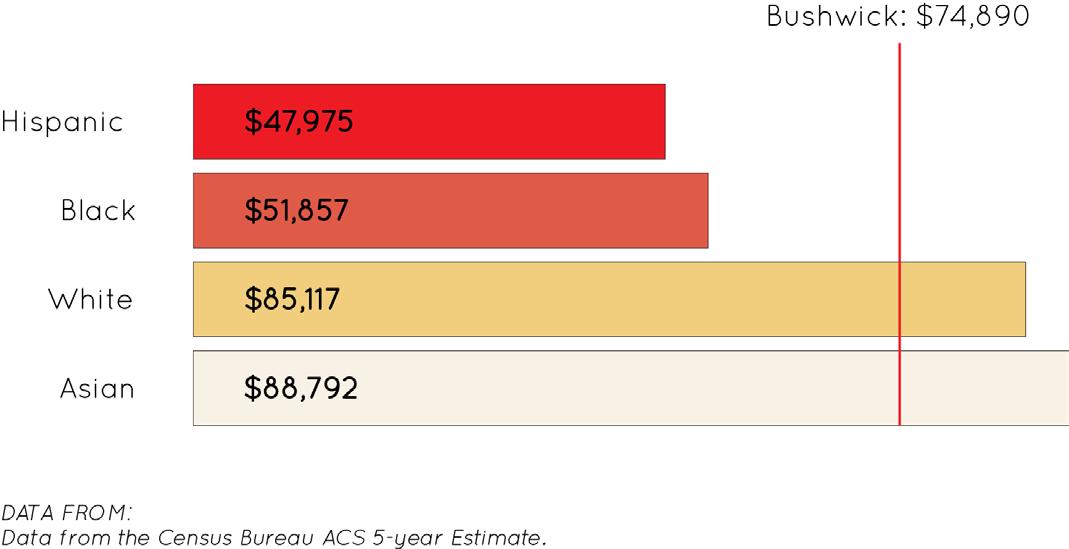
right this rise in household income cannot be attributed to Bushwick’s long term Hispanic population getting increasingly wealthier. The figure below illustrates that Hispanic households make an average of $47,975 a year which, as of 2021 is below the Bushwick average household income of $74,890 a year. Only White and Asian households on average are making more than the Bushwick average, once again pointing to an influx of white and wealthy residents into the neighborhood.
Racial Distribution of Median Household Income
Bushwick 2021
Da ta from the Census Bureau ACS 5-year Estimate.
With increasing numbers of higher income residents who are able to afford higher rents, rental prices have also been on the rise in Bushwick since the early 2000s. The average cost of rent in Bushwick has increased 44% since 2000, this is the second highest rent increase after the Williamsburg neighborhood, and double the city-wide average rent increase of 22%. In 2012, the average rent for a one-bedroom apartment in Bushwick was $1,756 a month, in 2015 average rent was just below $2,100 a month.9 As of last month December 2023, according to the MNS real estate report, the average price for a one-bedroom apartment in Bushwick is $2,885 a month.
10 While rent stabilization regulations limit how much rent can be increased each year, market rate apartments’ rent can be raised each year with no limit.11 In Brooklyn as a whole only 30% of apartments are under rent stabilization regulations putting huge swaths of the population at risk of displacement. According to a survey done by the Center for Urban Pedagogy and a group of Bushwick high school students 12 out of 14 people said they knew somebody
that had to move because their rent and/ or cost of living became too expensive. 12
As displayed by the figure below median rental price has been consistently rising in Bushwick since 2006. In 2006 the median rental price in pushwich was $1,160 below both the Brooklyn and New York City averages. By 2021 Bushwicks median rental price has surpassed both Brooklyn and New York City averages at $2,000 a month for a one-bedroom apartment.
The rise in income as well as rent are clear indicators of gentrification as new residents flock to an area often attracted to the promise of lower rents compared to other neighborhoods in New York City. This pattern highlights the economic transformation of the neighborhood, indicating the displacement of existing lower-income residents and the altering of the community fabric.
Median Rental Price
Bushwick 2006-2021
Bus Bushwick
Brookl yn
New York City
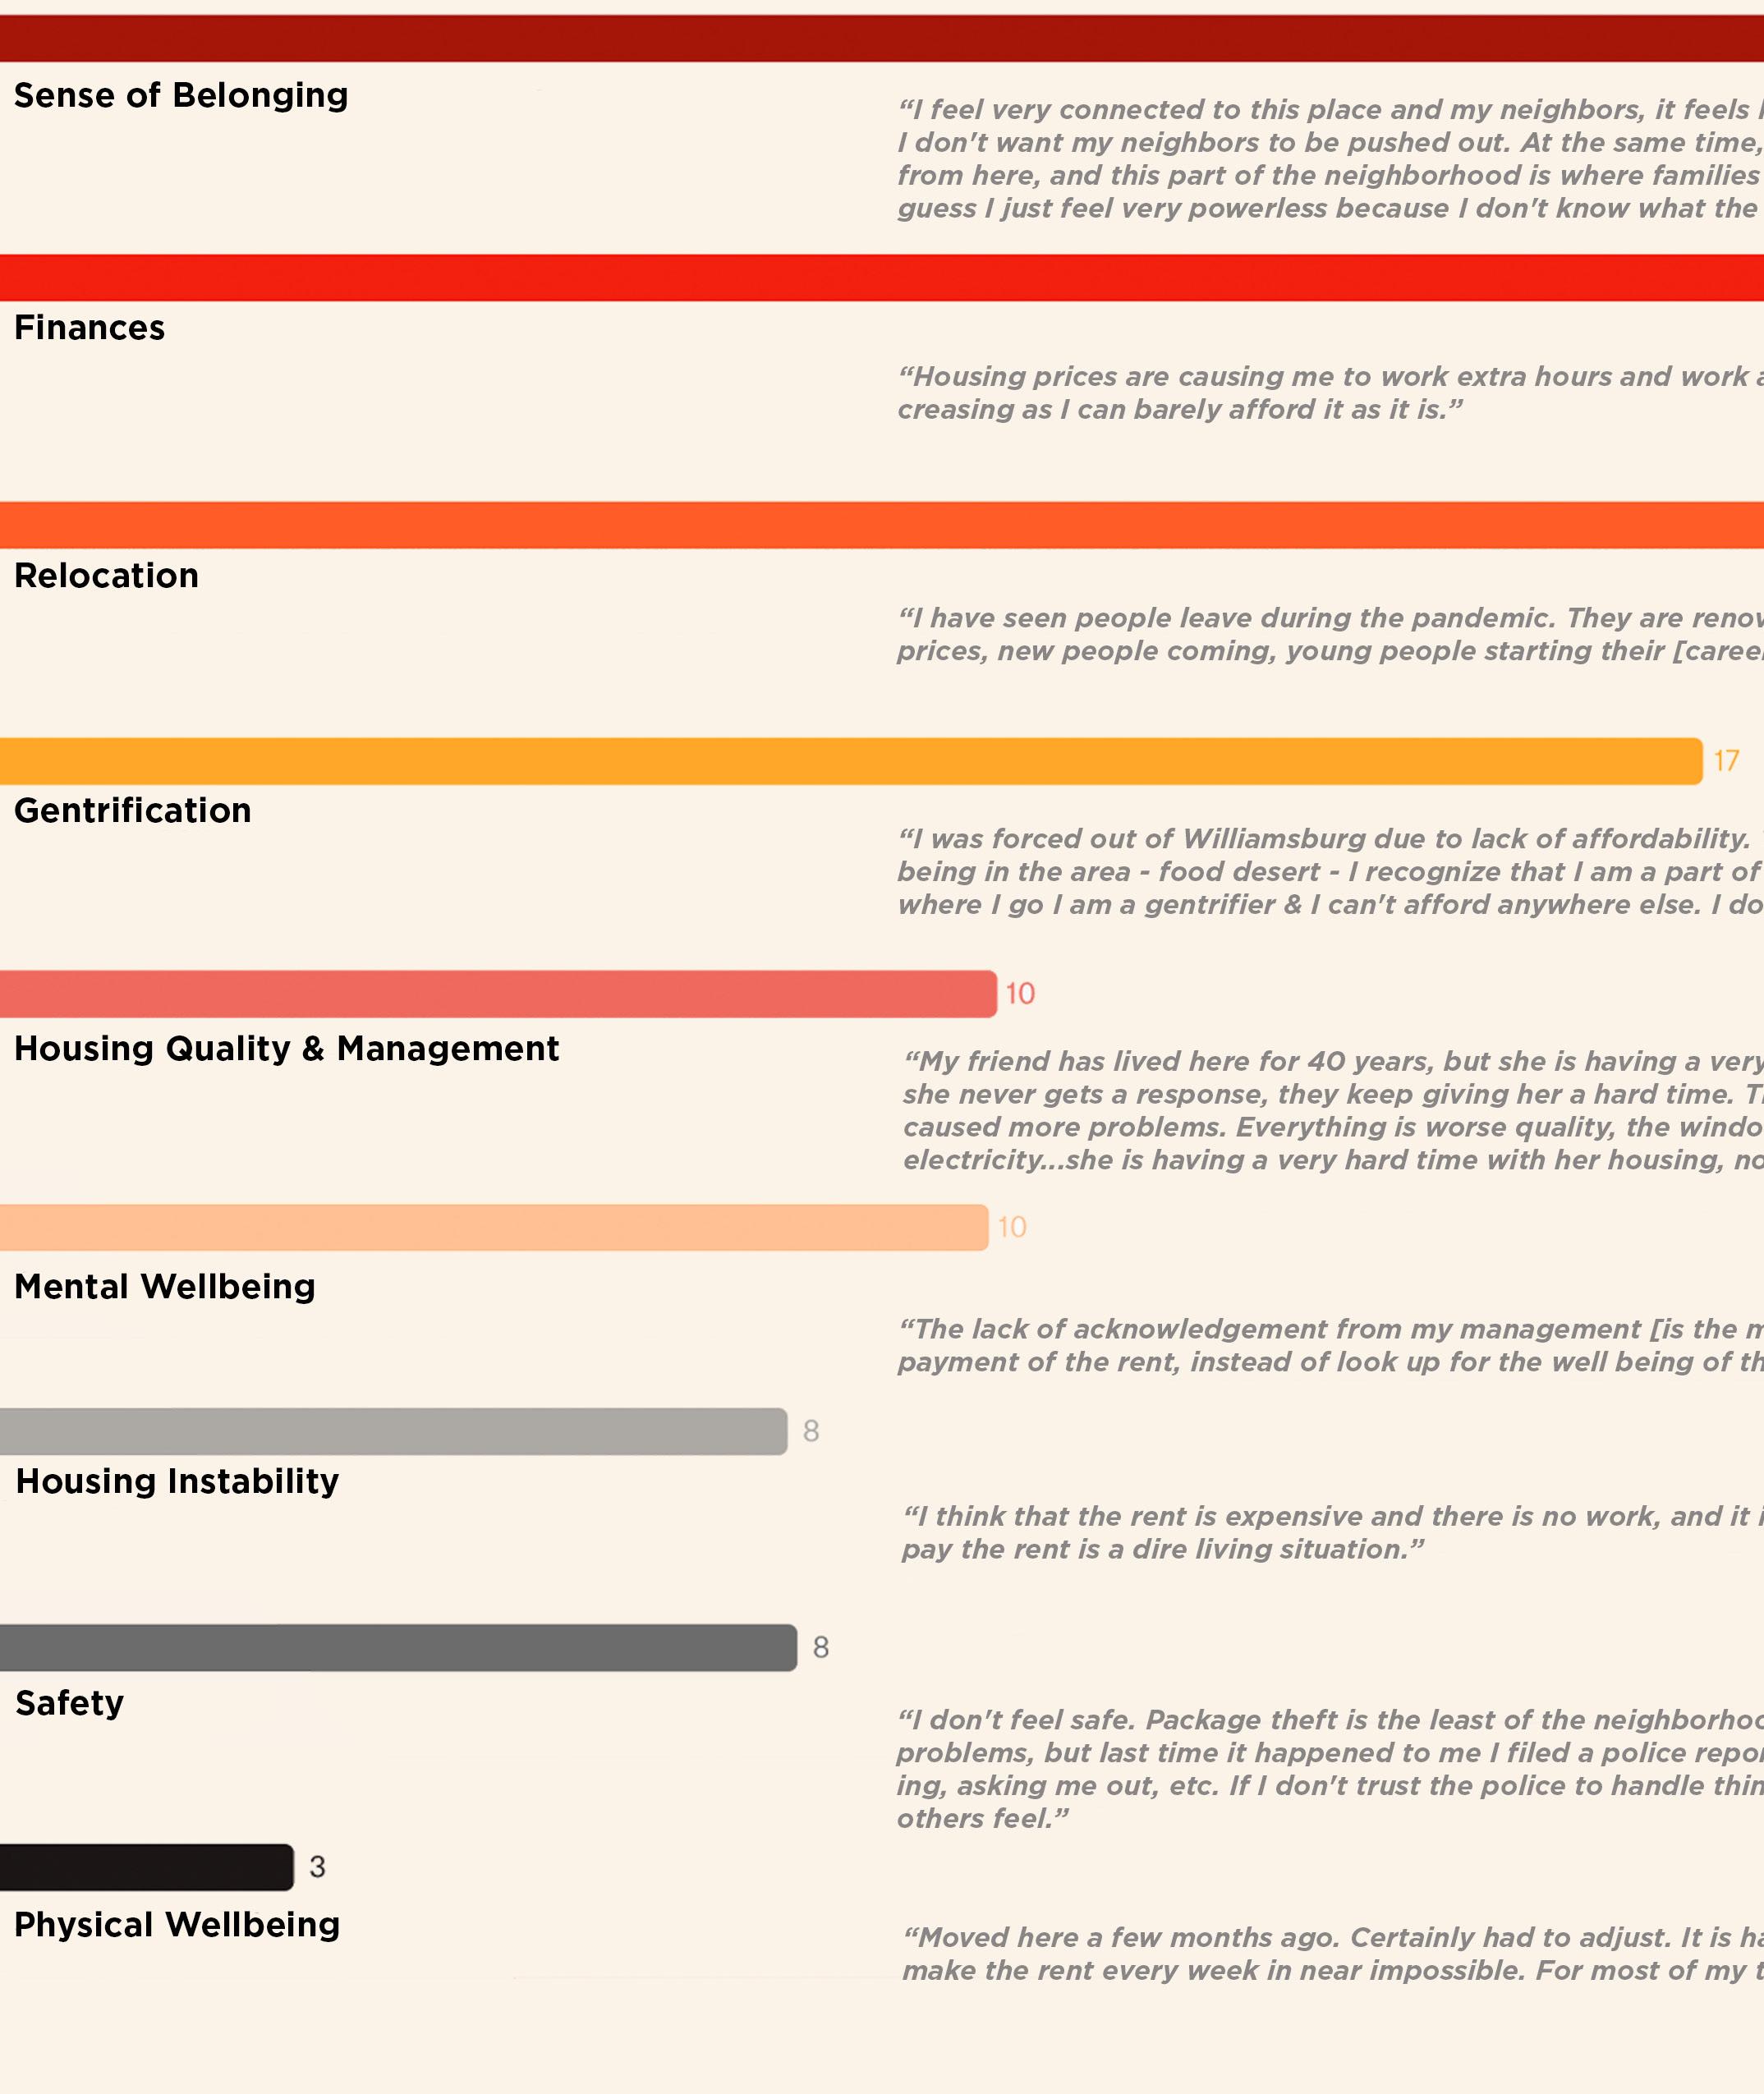
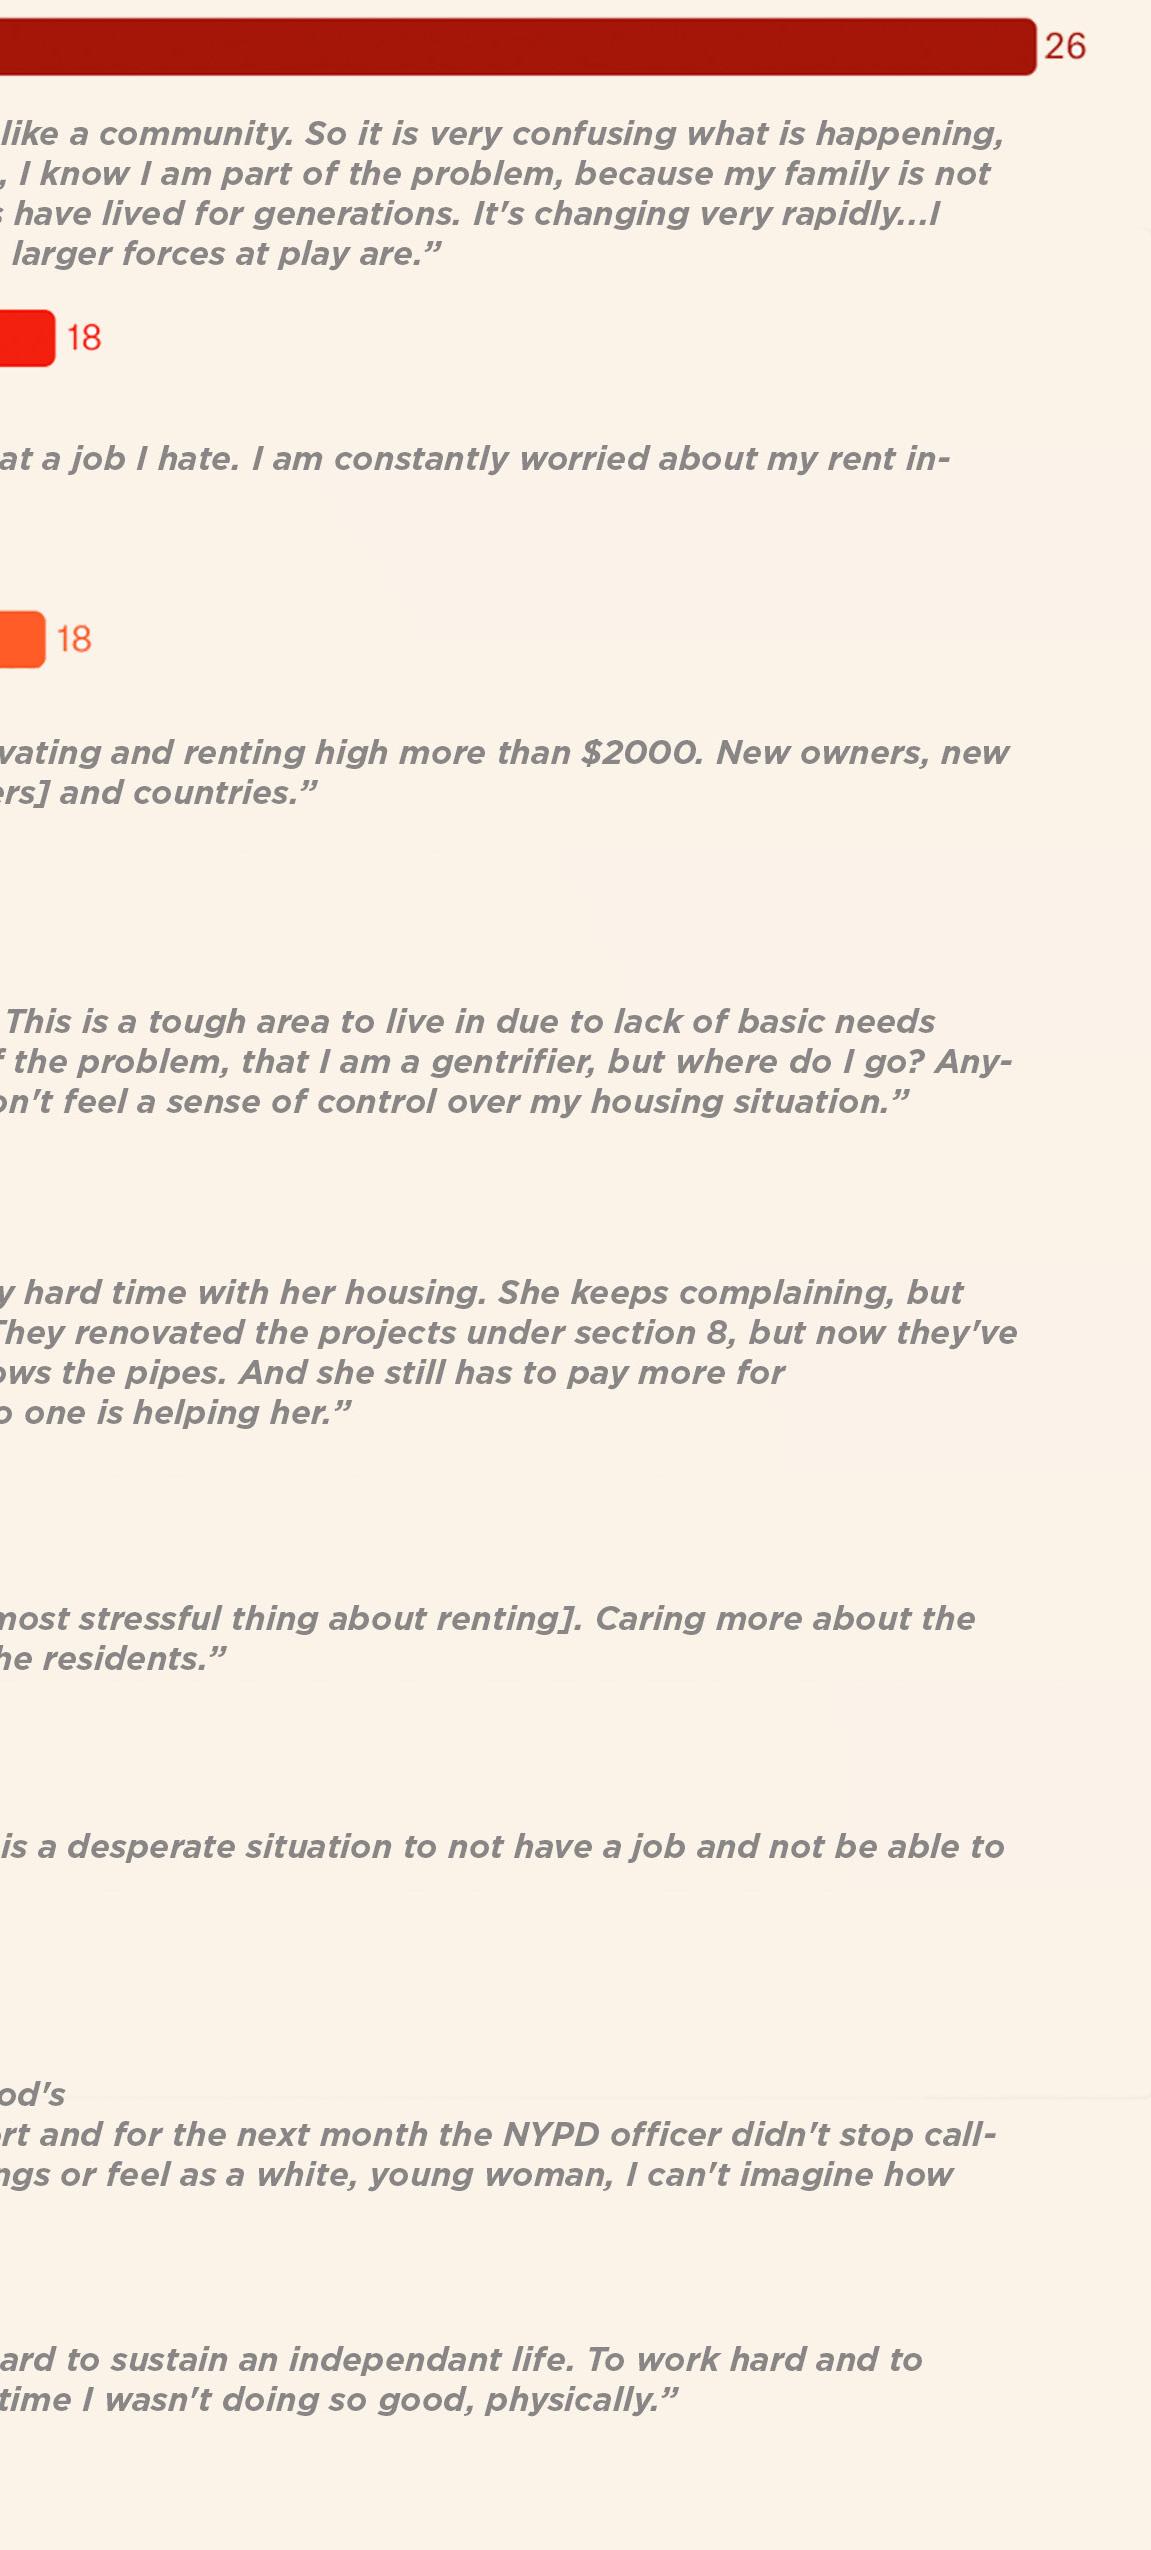
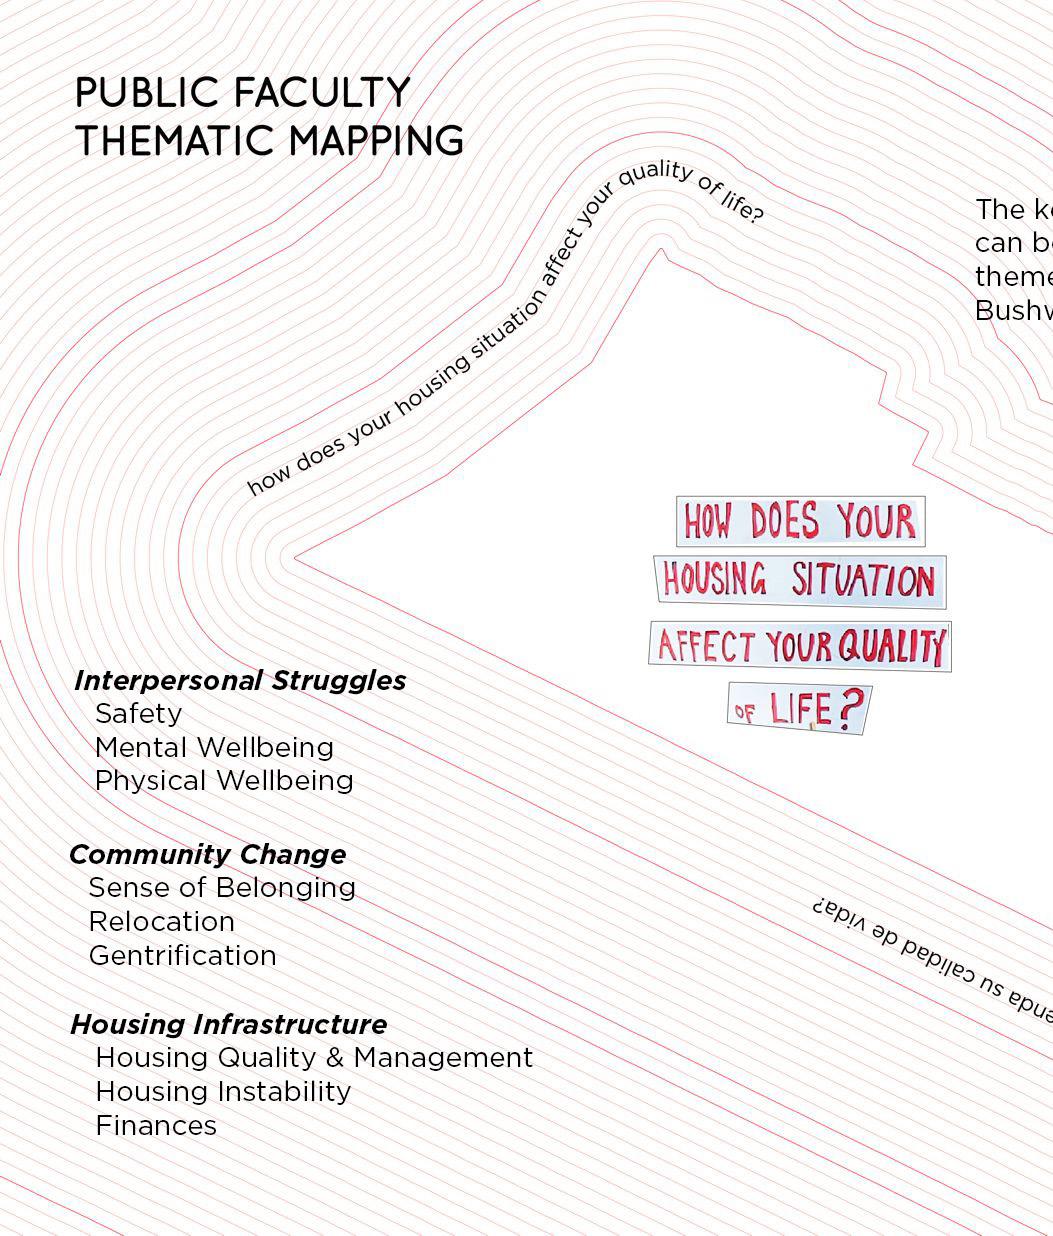
UNDERSTANDING HOUSING IN BUSHWICK:
RADICAL LISTENING & PUBLIC FACULTY
Public Faculty involves creative interventions in public spaces to engage in ‘deep and radical listening’. The goal is for the interviewer to listen to people’s descriptions of their daily conditions and struggles, as well as their feelings and dreams.
Radical Listening provides a similar purpose, “it is not so much to identify answers, as it is to listen to people phrase their grievances. Because people carry the specificities of place in their emotional tissues, participants listen for nuance that can reveal the emotion texture of the place. This practice determines how existing conflicts can become productive by speaking and thinking together about concrete situations in public.”
(Van Heewijk and Rendon 2018, 245)
Public Faculty uses strategies to rethink, redefine, and re-enter the public space through collective action. The impetus behind Public Faculty is to engage in collective learning through a process of knowledge exchange within a specific place bound context. It also promotes the learning of how to listen to people describe their daily conditions, which they often feel incapable of changing.
Public Faculty has a set format: it takes four days, four hours each day. It involves standing at a city location where there are pressures or burdens affecting the local community and speaking to members of the public willing to discuss them.
PUBLIC FACULTY MAP
3 days/4 hours each
Public Faculty: Understanding Housing in Bushwick
3 days/4 hours each
BEDFORD-STUYVESANT
As part of our project, we conducted a public faculty to understand experiences of housing in Bushwick. For our faculty design, we formulated a question that could garner knowledge pertaining to the goals of our work with the Bushwick Housing Independence Project; these goals are:
• Preserving community and culture
• Understanding housing struggles
• Understanding efforts to organize for housing.
Based on this, we decided on the question:
How does your housing situation impact your quality of life? And is there anything you can do about it?
We conducted the public faculties across 3 days, in three different locations, as outlined by the map. During the exercise, we set up a hand-made map of Bushwick in the locations, and asked people our question. We listened to their responses, and wrote down what they shared on cards, which were then pinned to the maps in locations identified by respondents.
El Puente Bushwick Leadership Center
place for Parsons Students and BHIP organizers.
A STEP BY STEP GUIDE
RESPONSES
FROM RADICAL LISTENING EXCERCISE
2/17 - 2/24
these responses were written by facilitators or participants depending on the participant’s preference. some were translated from spanish during the listening and note taking, while a couple were written directly in spanish and translated to english with google translate. the responses noted down in spanish can be found on this document.
responses translated from spanish to english via google translate are in red and begin with an asterisk.
Has a friend in a bad situation that went through a $300 increase. They (interviewees) have lived here 8/9 years. The neighborhood is changing fast.
Age: 36 & 40 Emi & Masaya
Feel more patrolled [in Bushwick than in BedStuy], minimized sketchy scenarios [in Bushwick], park gets locked, parking is easier than in Bed-Stuy where I lived before, lots cheaper in Bushwick.
I have seen people leave during the pandemic. They are renovating and renting high more than $2000. New owners, new prices, new people coming, young people starting their and countries.
Born and raised here, it’s gotten more expensive. This used to be shooting & drugs, people are getting kicked out - it started in williamsburg, seeing it east NY. Gentrification is good and bad. Safer. I do a lot for community. I help in the neighbourhood. People just working to pay rent, used to be able to go out with friends.
Age: 29
My wife and I moved from the Bronx to here and own our home. Our daughter tried living in Bushwick, but rent was too high, so she lives with us. A lot harder for young people to live on their own.
We bought a condo here two years ago, we’ve lived in Brooklyn for 20 years though. My wife’s family is from here, there’s lots of construction that will change the neighborhood, especially next to us on Broadway/Junction. (This guy felt bad that he was a part of changing the neighborhood).
The lack of acknowledgement from my management [is the most stressful thing about renting]. Caring more about the payment of the rent, instead of look up for the well being of the residents.
Age: 29
Moved here recently, gentrifier. Lives in a rent stabilized building. Part of a building that has existing life.
Claire, Age: 29
Work isn’t secure, it is difficult and you have to live with relatives to continue in the neighborhood. We have to help one another, with family, friends and acquaintances. *
I think that the rent is expensive and there is no work, and it is a desperate situation to not have a job and not be able to pay the rent is a dire living situation.*
Landlords prefer animals to children. [They] don’t rent to you if you have kids. $250, $1800, $300 and $1100 per room with a shared kitchen with broken windows. / you have to laugh and laugh! How do we live in this situation? *
Appearances decieve and so we have to create trust so that we can be a little bit more confident in our lives. Unite the migrant community to share together and rise all together like life as if it were the last day of life. *
I don’t have a permanent job so I don’t get paid and I pay the rent little by little. *
My friend has lived here for 40 years, but she is having a very hard time with her housing. She keeps complaining, but she never gets a response, they keep giving her a hard time. They renovated the projects under section 8, but now they’ve caused more problems. Everything is worse quality, the windows the pipes. And she still has to pay more for electricity. She has a family, a daughter and grandaughters, but she is having a very hard time with her housing, no one is helping her.
Moved here a few months ago. Certainly had to adjust. It is hard to sustain an independant life. To work hard and to make the rent every week in near impossible. For most of my time I wasn’t doing so good, physically. I try to participate in the community as much as I can. Still learning of course. Weird being here amongst all these other people. It’s like a place that is divided in identity. I like this park though.
Rents out property: $3000/month for 2 bedroom. Rent is set by broker in housing market.
Moved to Bushwick to get away from Long Island. Came here for working & dancing community. Moved a year ago. Commutes every day to the city.
I just moved here a month ago from Prospect Lefferts Gardens and Bushwick feels much safer. I was catcalled by the subways there and am not here, I feel like everyone in Bushwick is looking out for each other. The deli already feels like home.
crowded apartment with family (5 persons), he would like to move out but it’s too expensive.
I live in the area. Its very nice and great access to the park, but it doesn’t have any light and is very overpriced.
J Hernandez Jordan
Alexandra B
They say there is an affordable housing program but the limitations and restrictions make it barely plausible low-income families.
Housing is sort of broken, high rent. Personally, my family has trouble buying clothes & goods - stairs are also dangerous, the landlord hasn’t responded in 3 weeks. Sometimes it’s hard to pay rent and because of that we can’t pay for other things like school supplies and things for my siblings and I.
Age: 18
I worked for the 311 and heard many experiences [that] distressed New Yorkers about their housing conditions. Bronx and Brownsville: [many] difficult stories. Rodents, non-sanitary conditions. Bushwick prices are very high, moving our people [with] illegal practices.
Juan
In every aspect - having a good housing situation allows you to actually enjoy the miniscule things that life has to offer, without fear of losing the most fundamental human right to housing.
Age: 23 - Kevin
I have lived in this neighborhood for 9 years, and I feel very connected to this place and my neighbors, it feels like a community confusion. So it is very confusing what is happening, I don’t want my neighbors to be pushed out. At the same time, I know I am part of the problem, because my family is not from here, and this part of the neighborhood is where families have lived for generations. It’s changing very rapidly, I guess it has been going on for awhile but it really sped up after covid. I guess I just feel very powerless because I don’t know what the larger forces at play are. I would want to stay in Bushwick, but I wouldn’t want this part of the neighborhood to turn into the Jefferson part that is only nice to visit. Right now, the flooding in this neighborhood is a bigger problem for me than rent.
Our building is getting renovated, so we have to look for temporary housing. We have lived here for 11 years. We have a good rent price ($1,800 for a 2 bed), we would not find a place at that price point in this neighborhood now.
I was in Bushwick for 3 years, my area became different, prices rose. I left Bushwick to live in BedStuy. Bed-Stuy felt culturally more my scene.
Age: 27
Bushwick seems like a place of transition, I’ve only been here for a month but it seems like it’s like half gentrified.
Age: 26
Just moved here becasue we just had a baby and wanted more space. We want to raise our child in the city in a diverse environment but we acknowledge that we are really lucky becasue we have the ability to make that choice.
severely affected by rent burden and issues with landlord (did not elaborate but will come into BHIP).
Live and grew up in Bushwick for 15 years. parents own apartment. notice new building and drug use in the neighborhood. Rent price rose dramatically. Franklin
I am a typical gentrifier - paying loads of money for rent but I can afford it unlike some people.
High rent, living in small spaces w/ multiple people, in Queens
15 years in Bushwick from Mexico, change in community services. society --> alcohol teen in park, rent not affordable, not helpful landlord, old building not fixing.
In shelter, has to move out next week, has to find somwhere else during shelter renovation, long shelter lines.
I applied for a tiny affordable room, and there were about one hundred other applicants, which makes the whole process quite stressful. It feels impossible to afford a place on my own.
[Been here] 5 years. Moved a few times especially during the pandemic. Lived in building that [was gentrified]. Now [live] in a building with a community, feelings of safety and belonging. Talked to landlord to avoid [illegible]. People [look out for each other]. True friendship. I’d rather give money to the local landlord.
Age: 28 - Paula
I’ve lived here 6 years and came for the hispanic community and nightlife. You see an increase of everyone now - immigrants, white people, tourists...it is nice to see the area getting more popular - I hope there can be a “sweet spot” of gentrification.
Rent increased by $500 in the last 2 years. No communication from landlord.
The neighborhood has changed, its safer - less drug deals, less shootings. Those things are important. If it is becasue of gentrifiers, than that is a double edged sword. We should all have common courtesy for where we live.
I was forced out of Williamsburg due to lack of affordability. This is a tough area to live in due to lack of basic needs being in the area - food desert - I recognize that I am a part of the problem, that I am a gentrifier, but where do I go? Anywhere I go I am a gentrifier & I can’t afford anywhere else. I don’t feel a sense of control over my housing situation & I don’t feel safe. Package theft is the least of the neighborhood’s problems, but last time it happened to me I filed a police report and for the next month the NYPD officer didn’t stop calling, asking me out, etc. If I don’t trust the police to handle things or feel as a white, young woman, I can’t imagine how others feel. I’m absolutely not settling down here. I’m actively looking for a way out, for housing I can afford elsewhere. I like this park, during the day. But no, I don’t want to stay here.
Me and my boyfriend were living with his grandma and she passed away so they had to sell and now we are homeless.
Age: 22
I am a student at NYU living in Bushwick. I feel lucky to have my place. Theres rats dying in the basement but that doesn’t really affect me. The rent is really high + gets higher and higher as you get closer to Manhattan. I have to work at a place thats against my values just to pay my rent so I do not go broke.
Age: 25 - Tristan
Just moved here becasue we just had a baby and wanted more space. We want to raise our child in the city in a diverse environment but we acknowledge that we are really lucky becasue we have the ability to make that choice.
Age: 40
Expensive, accessibility to job, will stay in Bushwick for at least another year.
Cannot afford to move because of initial fees, taxes taking too much income.
In a shelter, hasn’t been easy.
I’ve lived in 4 different Bushwick apartments over the years and have had all kinds of issues with landlords. Most recently the door to my building hasn’t has a working latch on it in a month. I’ve contacted my landlord multiple times and he hasn’t done much.
THEMATIC ANALYSIS
Based on the responses we collected through our public faculties we conducted a qualitative analysis using a qualitative analysis software, Atlas, to determine the key words that came up across the intersection of housing and quality of life in Bushwick. While various common concerns emerged, we grouped them into nine key words that identify areas of impact which are outlined in the treemap. These areas of impact were used to derive larger themes of concerns regarding housing and quality of life in Bushwick
The nine key phrases derived from our collected responses can be grouped into three broader themes related to housing and quality of life.These themes are as follows:
Housing Infrastructure:
This theme is crucial in exploring the daily struggles people face regarding securing housing, maintenance, and whether they feel supported as tenants by their management and landlords. Understanding this better allows us to look into what kinds of support systems and resources residents require, and how they can be empowered to feel control over their living conditions through understanding their housing rights.
Community Change:v
Community change is a crucial theme to expand on our goal of cultural preservation within Bushwick, and understand how residents are impacted by processes of gentrification and neighborhood changes, both in terms of infrastructure and sociopolitical conditions. It can help us understand how we evaluate the exchanges and relations between people and their neighborhood spaces.
Interpersonal Struggles:
Alongside interpersonal and community struggles, it was also evident that residents experience interpersonal challenges regarding their mental and physical wellbeing as a result of housing circumstances. This is an essential aspect of developing design interventions that are grounded in care, and thus can form an important basis for understanding health & bodily impacts of housing stressors.
BIBLIOGRAPHY
BUSHWICK’S SOCIAL + ECONOMIC COMPOSITION
1 Parés, Marc, Sonia Ospina, and Cliff Frasier. 2015. “Bushwick: Emerging Innovations in a Dramatically Gentrified Neighbourhood.” https://webs.uab.cat/socrisis/wp-content/uploads/sites/39/2020/01/Bushwick_report.pdf
2 Hernandez, Mario. 2023. “‘We Are without God Now’: Benign Neglect and Planned Destruction of Brooklyn’s Bushwick Neighborhood.” Journal of Urban History 49 (2): 411–29. https://doi.org/10.1177/00961442211008852.
3 Hernandez, “Without God.”
4 Rendon, G. 2018. “Housing as an Urban Restructuring Strategy in Brooklyn: The Case of Bushwick,” Cities for or against Citizens? Socio-Spatial Restructuring of Low-Income Neighborhoods and the Paradox of Citizen Participation. Architecture and the Built Environment.
5 Rendon, “Urban Restructuring,” 181-182.
6Rendon, G. 2018. “Housing as an Urban Restructuring Strategy in Brooklyn: The Case of Bushwick,” Cities for or against Citizens? Socio-Spatial Restructuring of Low-Income Neighborhoods and the Paradox of Citizen Participation. Architecture and the Built Environment.
7 Rendon, “Urban Restructuring,” 181-182.
8 “Hundreds of Bushwick Residents Rally to ‘Say No!’ To Gentrification.” Make the Road New York, June 27, 2018. https://maketheroadny.org/hundreds-of-bushwick-residents-rally-to-say-no-to-gentrification/?fs=1.
9O’Connor, Brendan. “Welcome to Postcolonial Bushwick.” Make the Road New York, June 27, 2018. https:// maketheroadny.org/welcome-to-postcolonial-bushwick/?fs=1.
10 “Brooklyn Rental Market Report: MNS, Real Estate Obsessed.” Brooklyn Rental Market Report | MNS, Real Estate Obsessed. https://www.mns.com/brooklyn_rental_market_report.
CITY + BUSHWICK'S PLANS
11 “Sociodemographics of Rent Stabilized Tenants.” The Official Website of the City of New York. https://www.nyc. gov/assets/hpd/downloads/pdfs/services/rent-regulation-memo-1.pdf.
12 Welcometocup.org. “Displaced from This Place?” CUP, https://welcometocup.org/projects/displaced-from-thisplace.