Wyndham Lakes Market Review
Presented By Michael Citron
Total Homes Sold
In the recent 90-day period, Wyndham Lakes recorded 13 home sales, indicating a significant increase in sales compared to the previous year. However, it is noteworthy that homes in our community are selling for record prices.

Average Days On Market
In the last 90 days, the average time it took for homes to sell in Wyndham Lakes was 16 days, indicating a much slower sales pace compared to the rest of Coral Springs, where homes sold in an average of 37 days.

Median Sales Price
The median sales price in Wyndham Lakes has consistently held at just over $560,000 year-over-year, indicating a robust market in our community. The desirability of gated communities with proximity to great schools, shopping, and accessibility to local highways yields higher sales prices and record time on market in Wyndham Lakes.

SINGLE FAMILY MARKET REPORT

3/27 23 11 16


$560,000
MEDIAN SALES PRICE
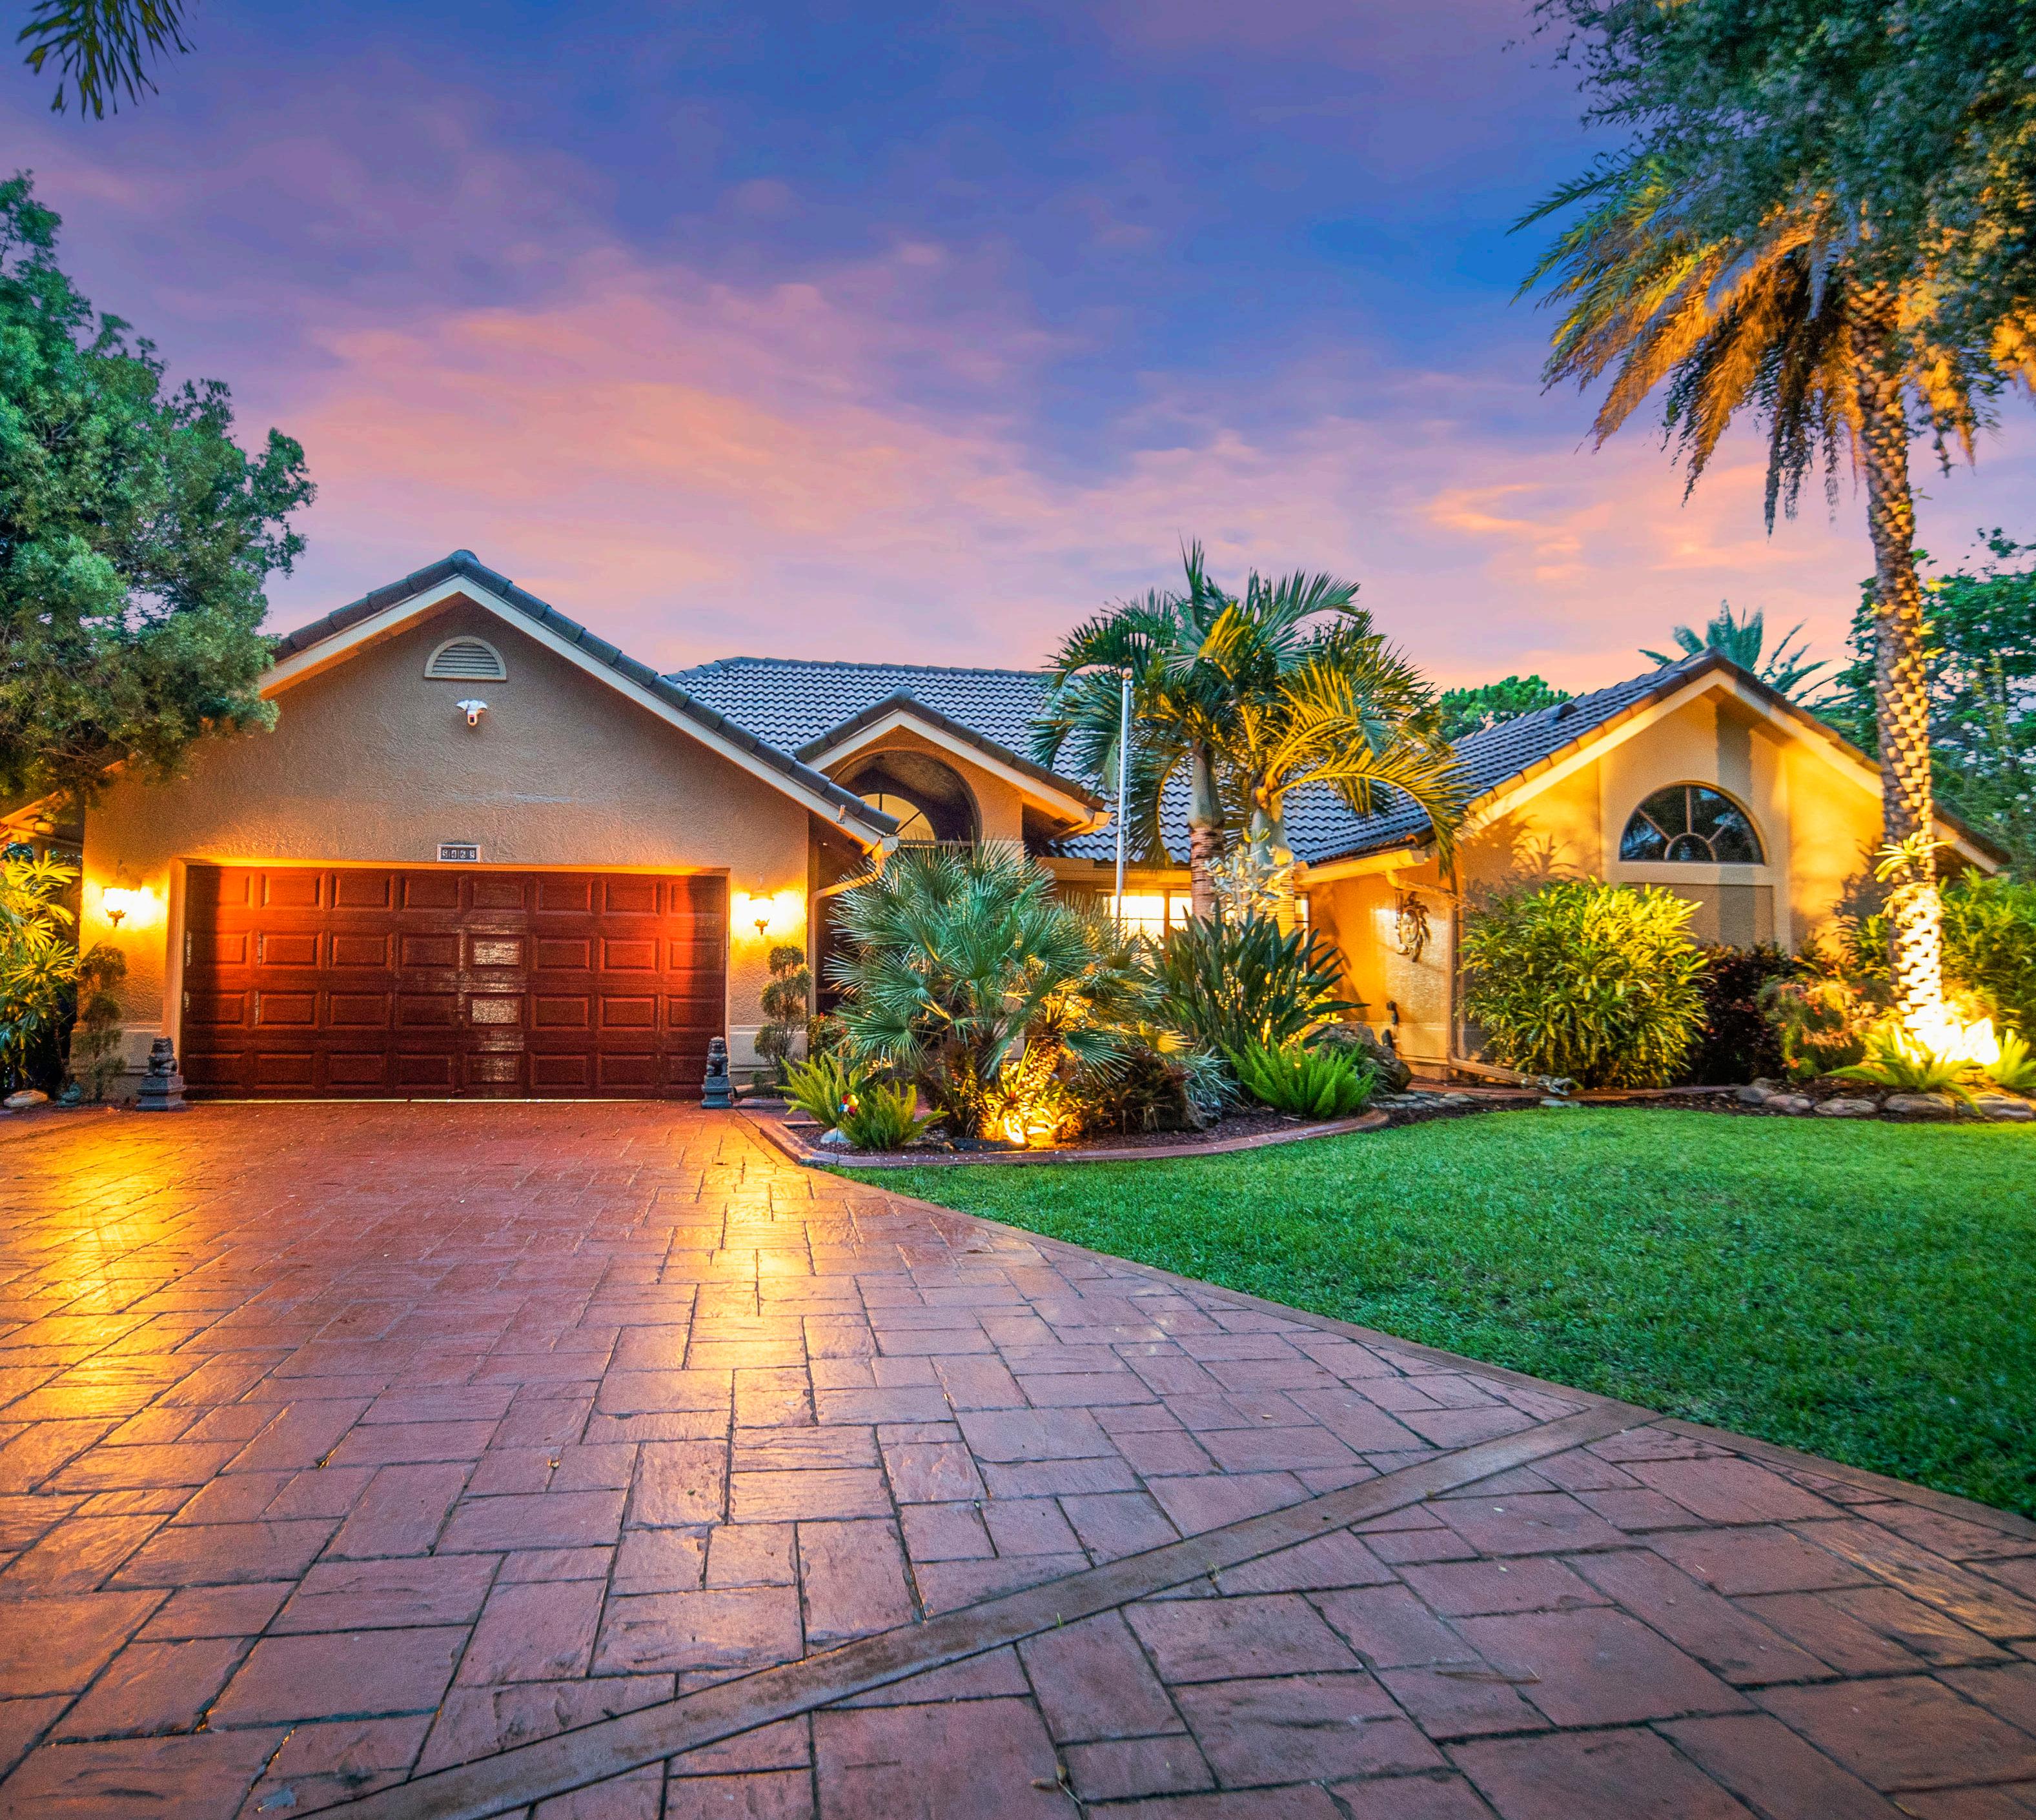
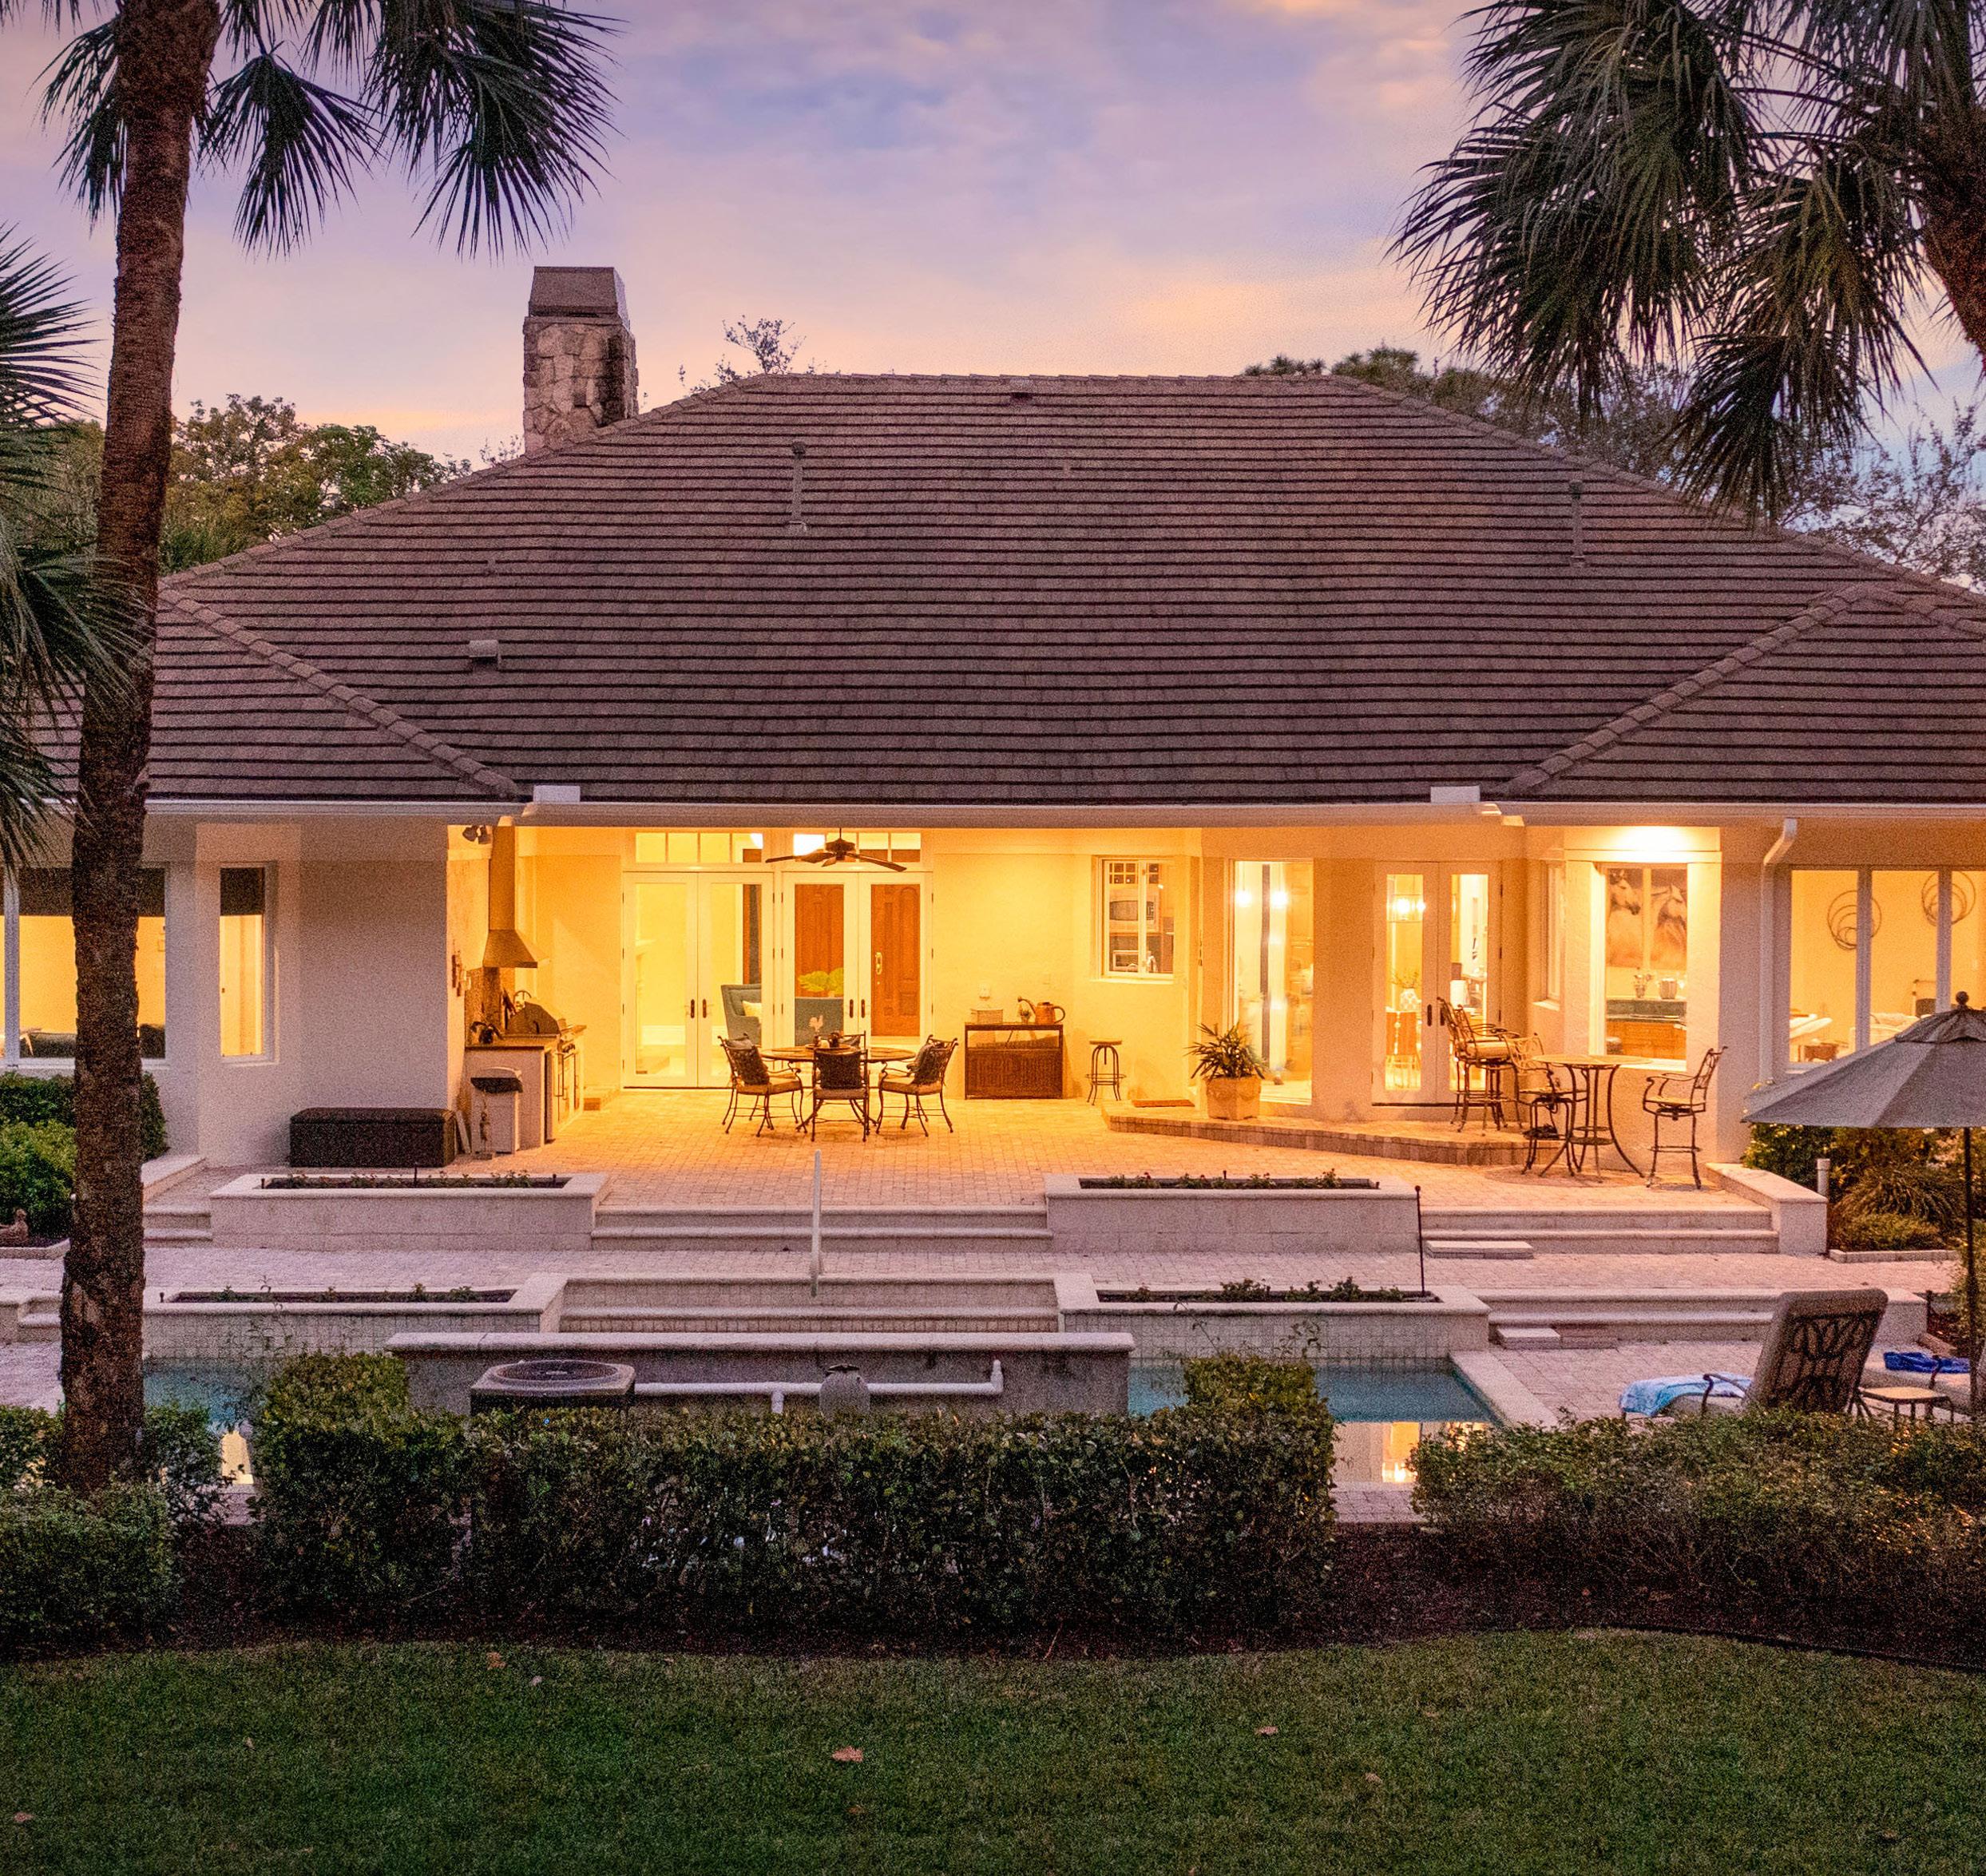
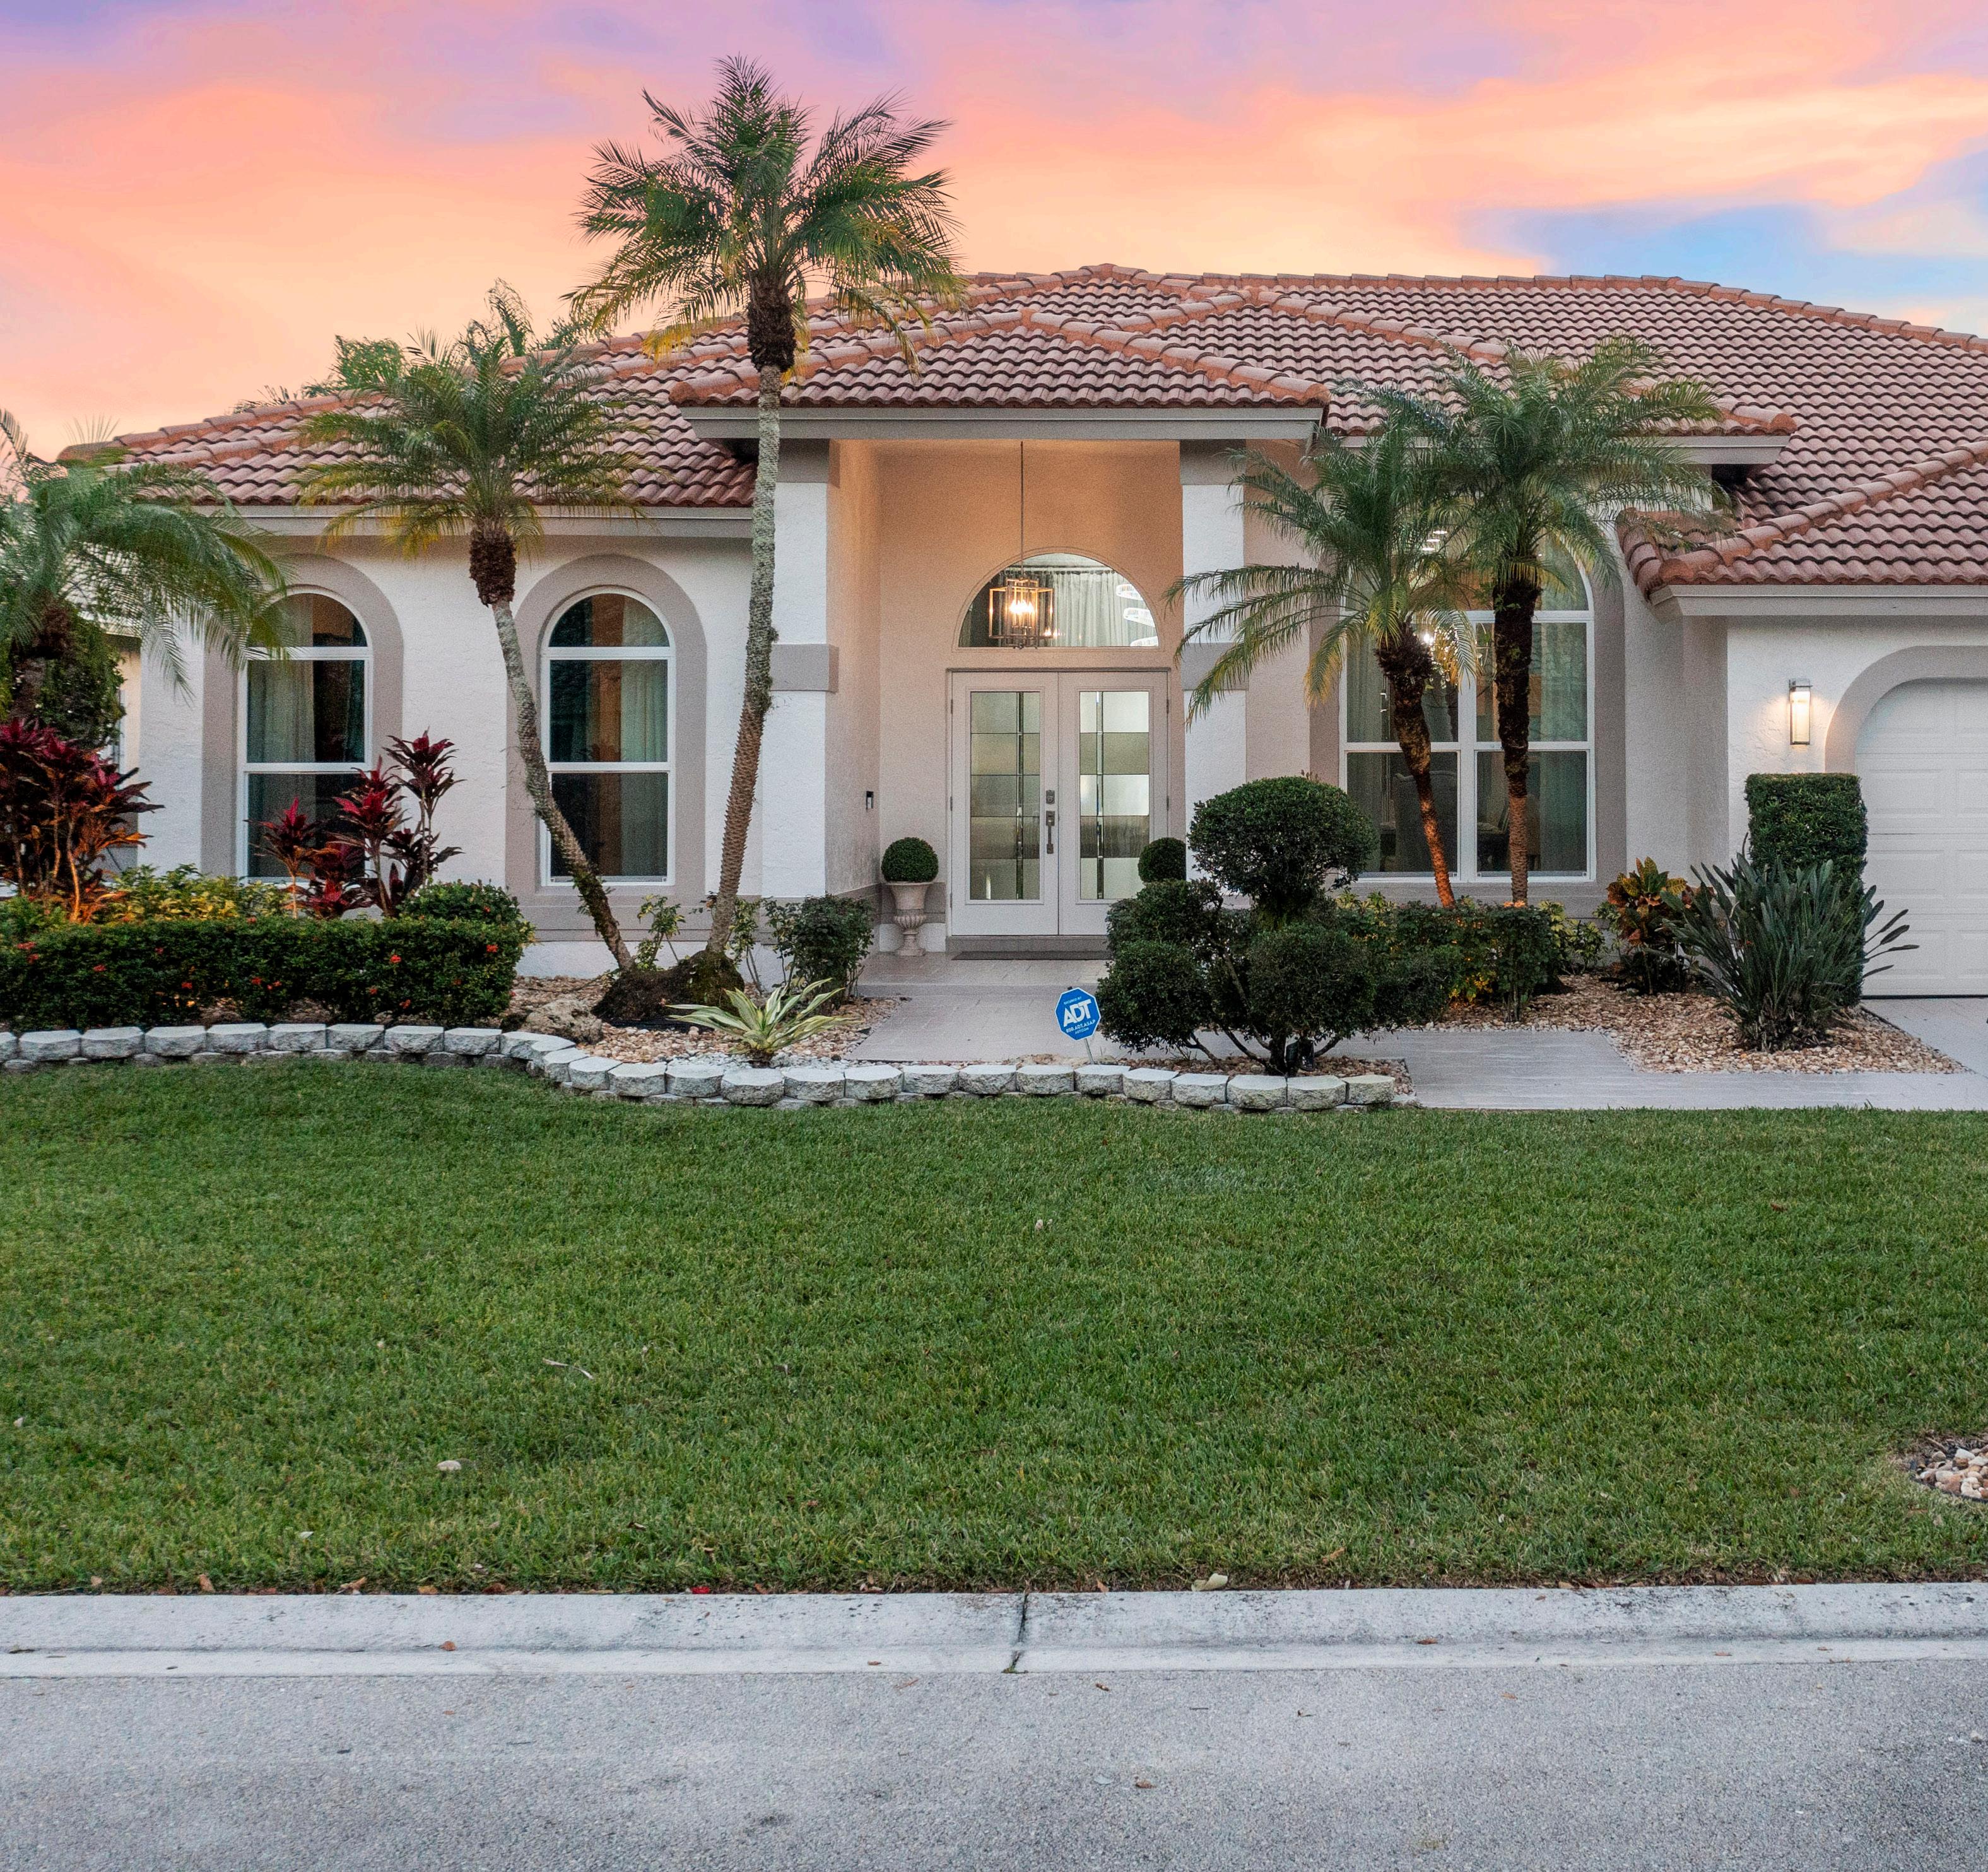
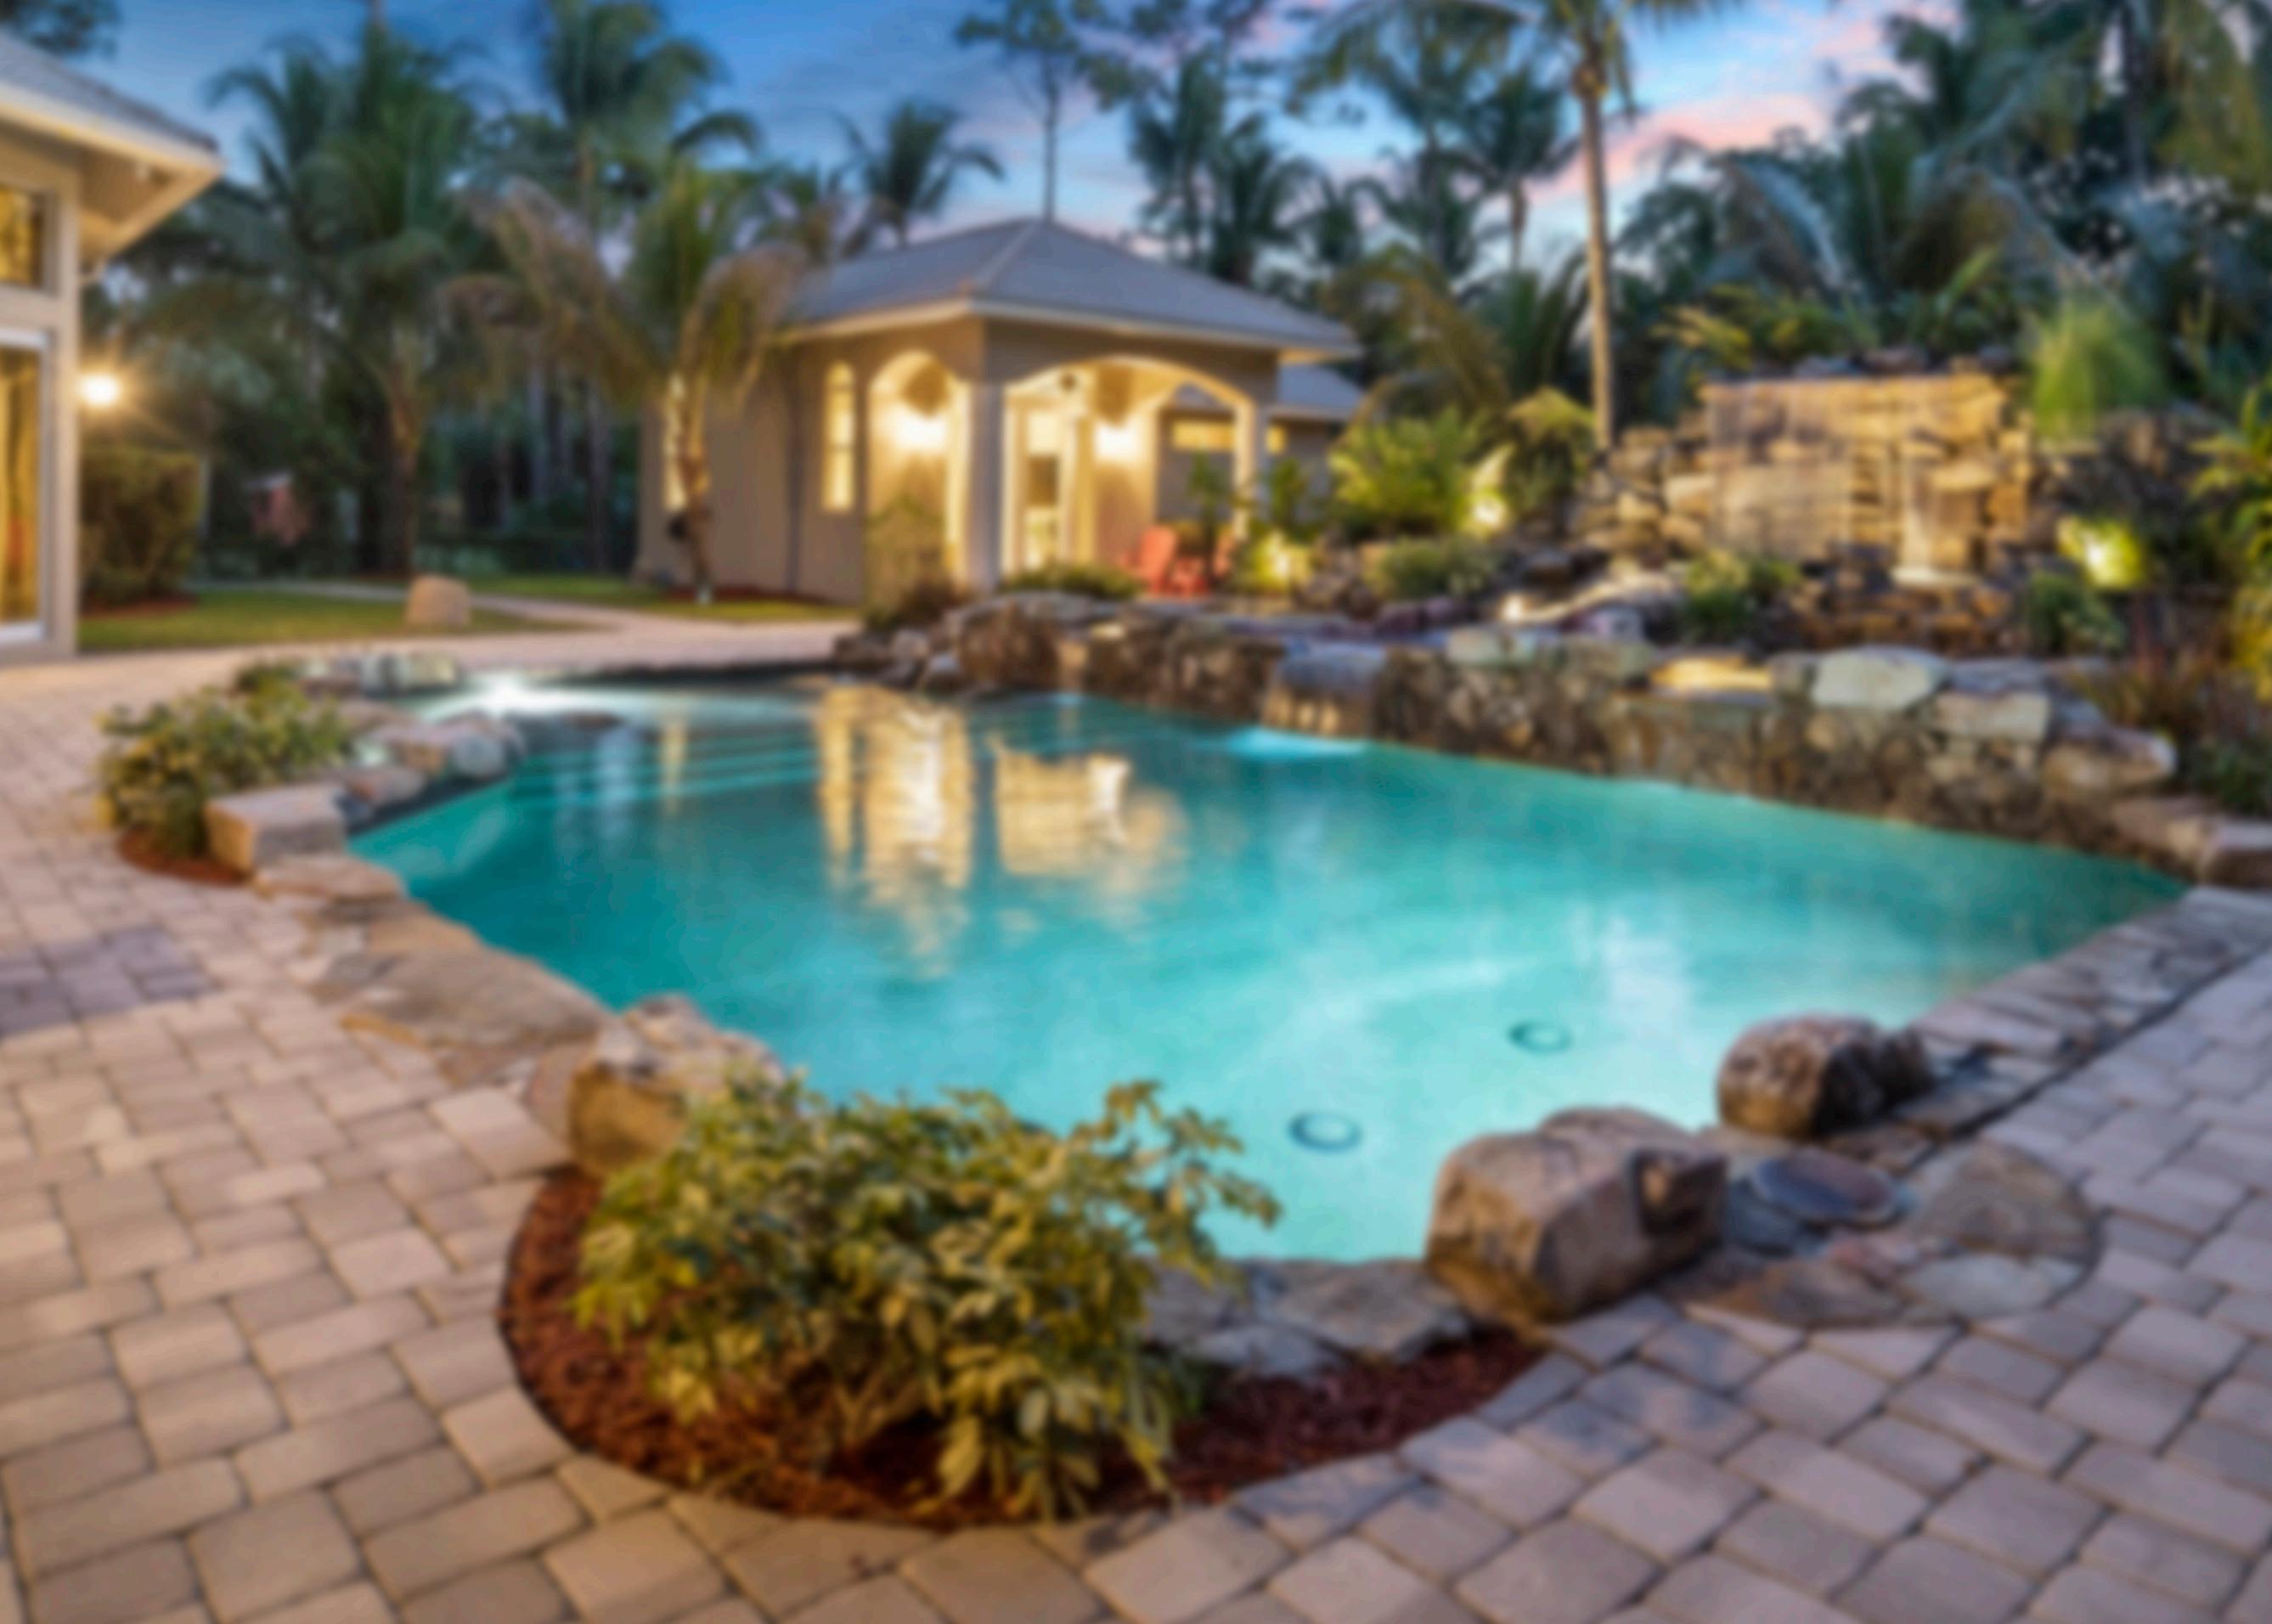
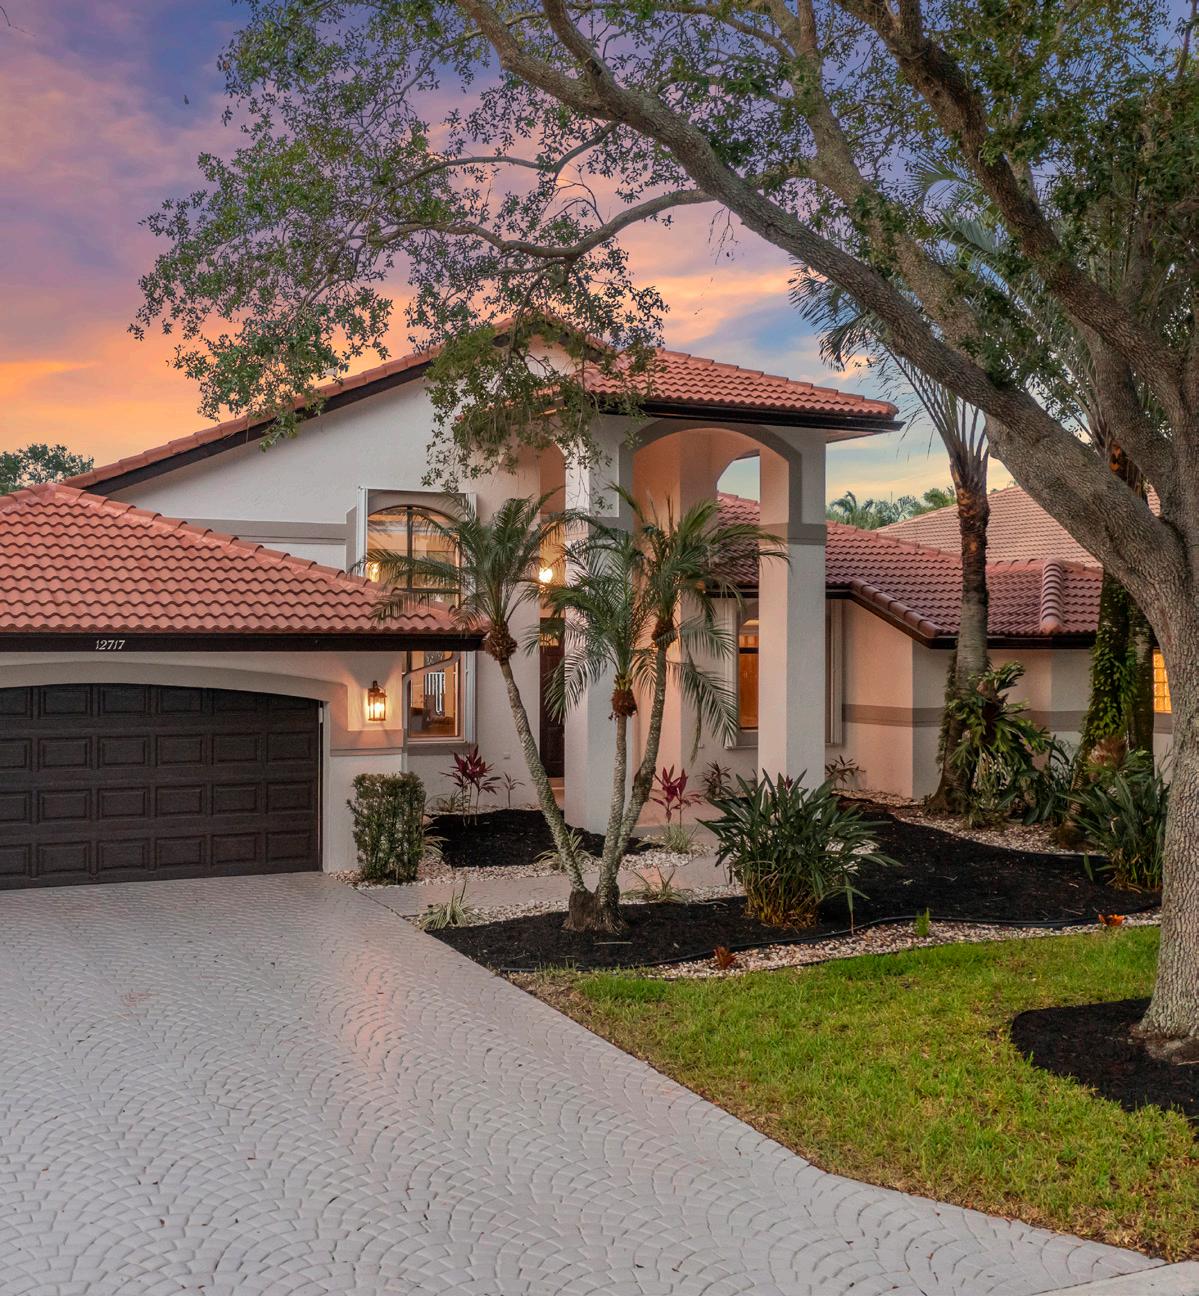
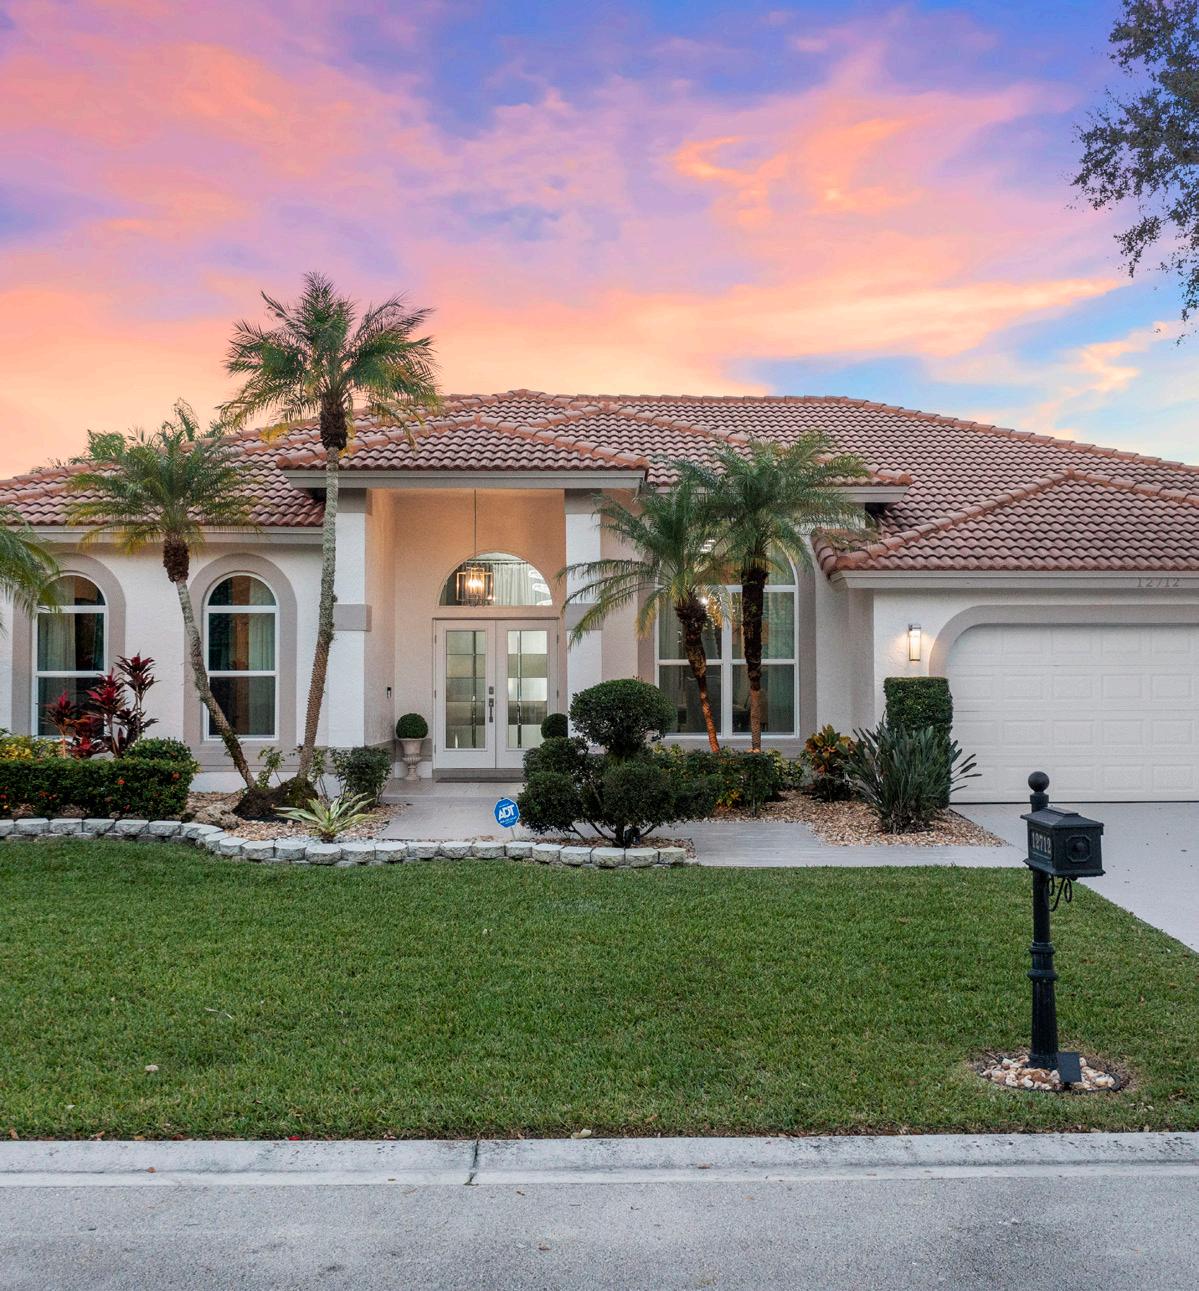
Sold For $824,900 | Represented Seller Sold For $775,000 | Represented Buyer Sold For $959,000 | Represented Seller Sold For $925,000 | Represented Seller 12219 NW 49th Street 12254 NW 48th Dr 12712 NW 17th Street 12717 NW 18th Place 3.5 Baths 5 Beds Pool 3.5 Baths 5 Beds Pool 2.5 Baths 5 Beds Pool 3 Baths 5 Beds Pool IN 2 DAYS! Get Your Free Home Evaluation Today Visit www.WyndhamLakesREALESTATE.com
WYNDHAM LAKES JULY 2023 MARKET REPORT * Data shown for the sales in Wyndham Lakes is based on the MLS as of July 13th, 2023 and is deemed to be reliable but should be verified. 2023 2022 NUMBER OF HOMES SOLD 2022 to 2023 Comparison MEDIAN SALES PRICE 2022 to 2023 Comparison $1,200,000 $1,100,000 $1,000,000 $900,000 $800,000 $700,000 $600,000 $500,000 $400,000 $300,000 $200,000 $100,000 0 FEB MAR APR MAY 14 12 10 8 6 4 2 0 FEB MAR APR MAY ACTIVE LISTINGS PRICE REDUCTIONS PENDING SALES SOLD IN PAST 90 DAYS AVERAGE DAYS ON MARKET 11
Waterfront Waterfront