Watercrest Market Review
 Presented By Michael Citron
Total Homes Sold
In the recent 90-day period, Watercrest recorded 11 home sales, indicating a similar number of sales compared to the previous year. However, it is noteworthy that homes in our community are selling for record prices and with less price reductions.


Average Days On Market Median Sales Price
In the last 90 days, the average time it took for homes to sell in Watercrest was 48 days, indicating a much faster sales pace compared to the rest of Parkland, where homes sold in an average of 51 days.
The median sales price in Watercrest has consistently held at jaround $1,200,000 year-over-year, indicating a robust market in our community. The desirability of gated communities with newer construction homes that have all the top of the line upgrades and luxury finishes and resort style amenities.

Upgrades
7 4/15 8 11 48 MEDIAN SALES PRICE

ON

$1,200,000

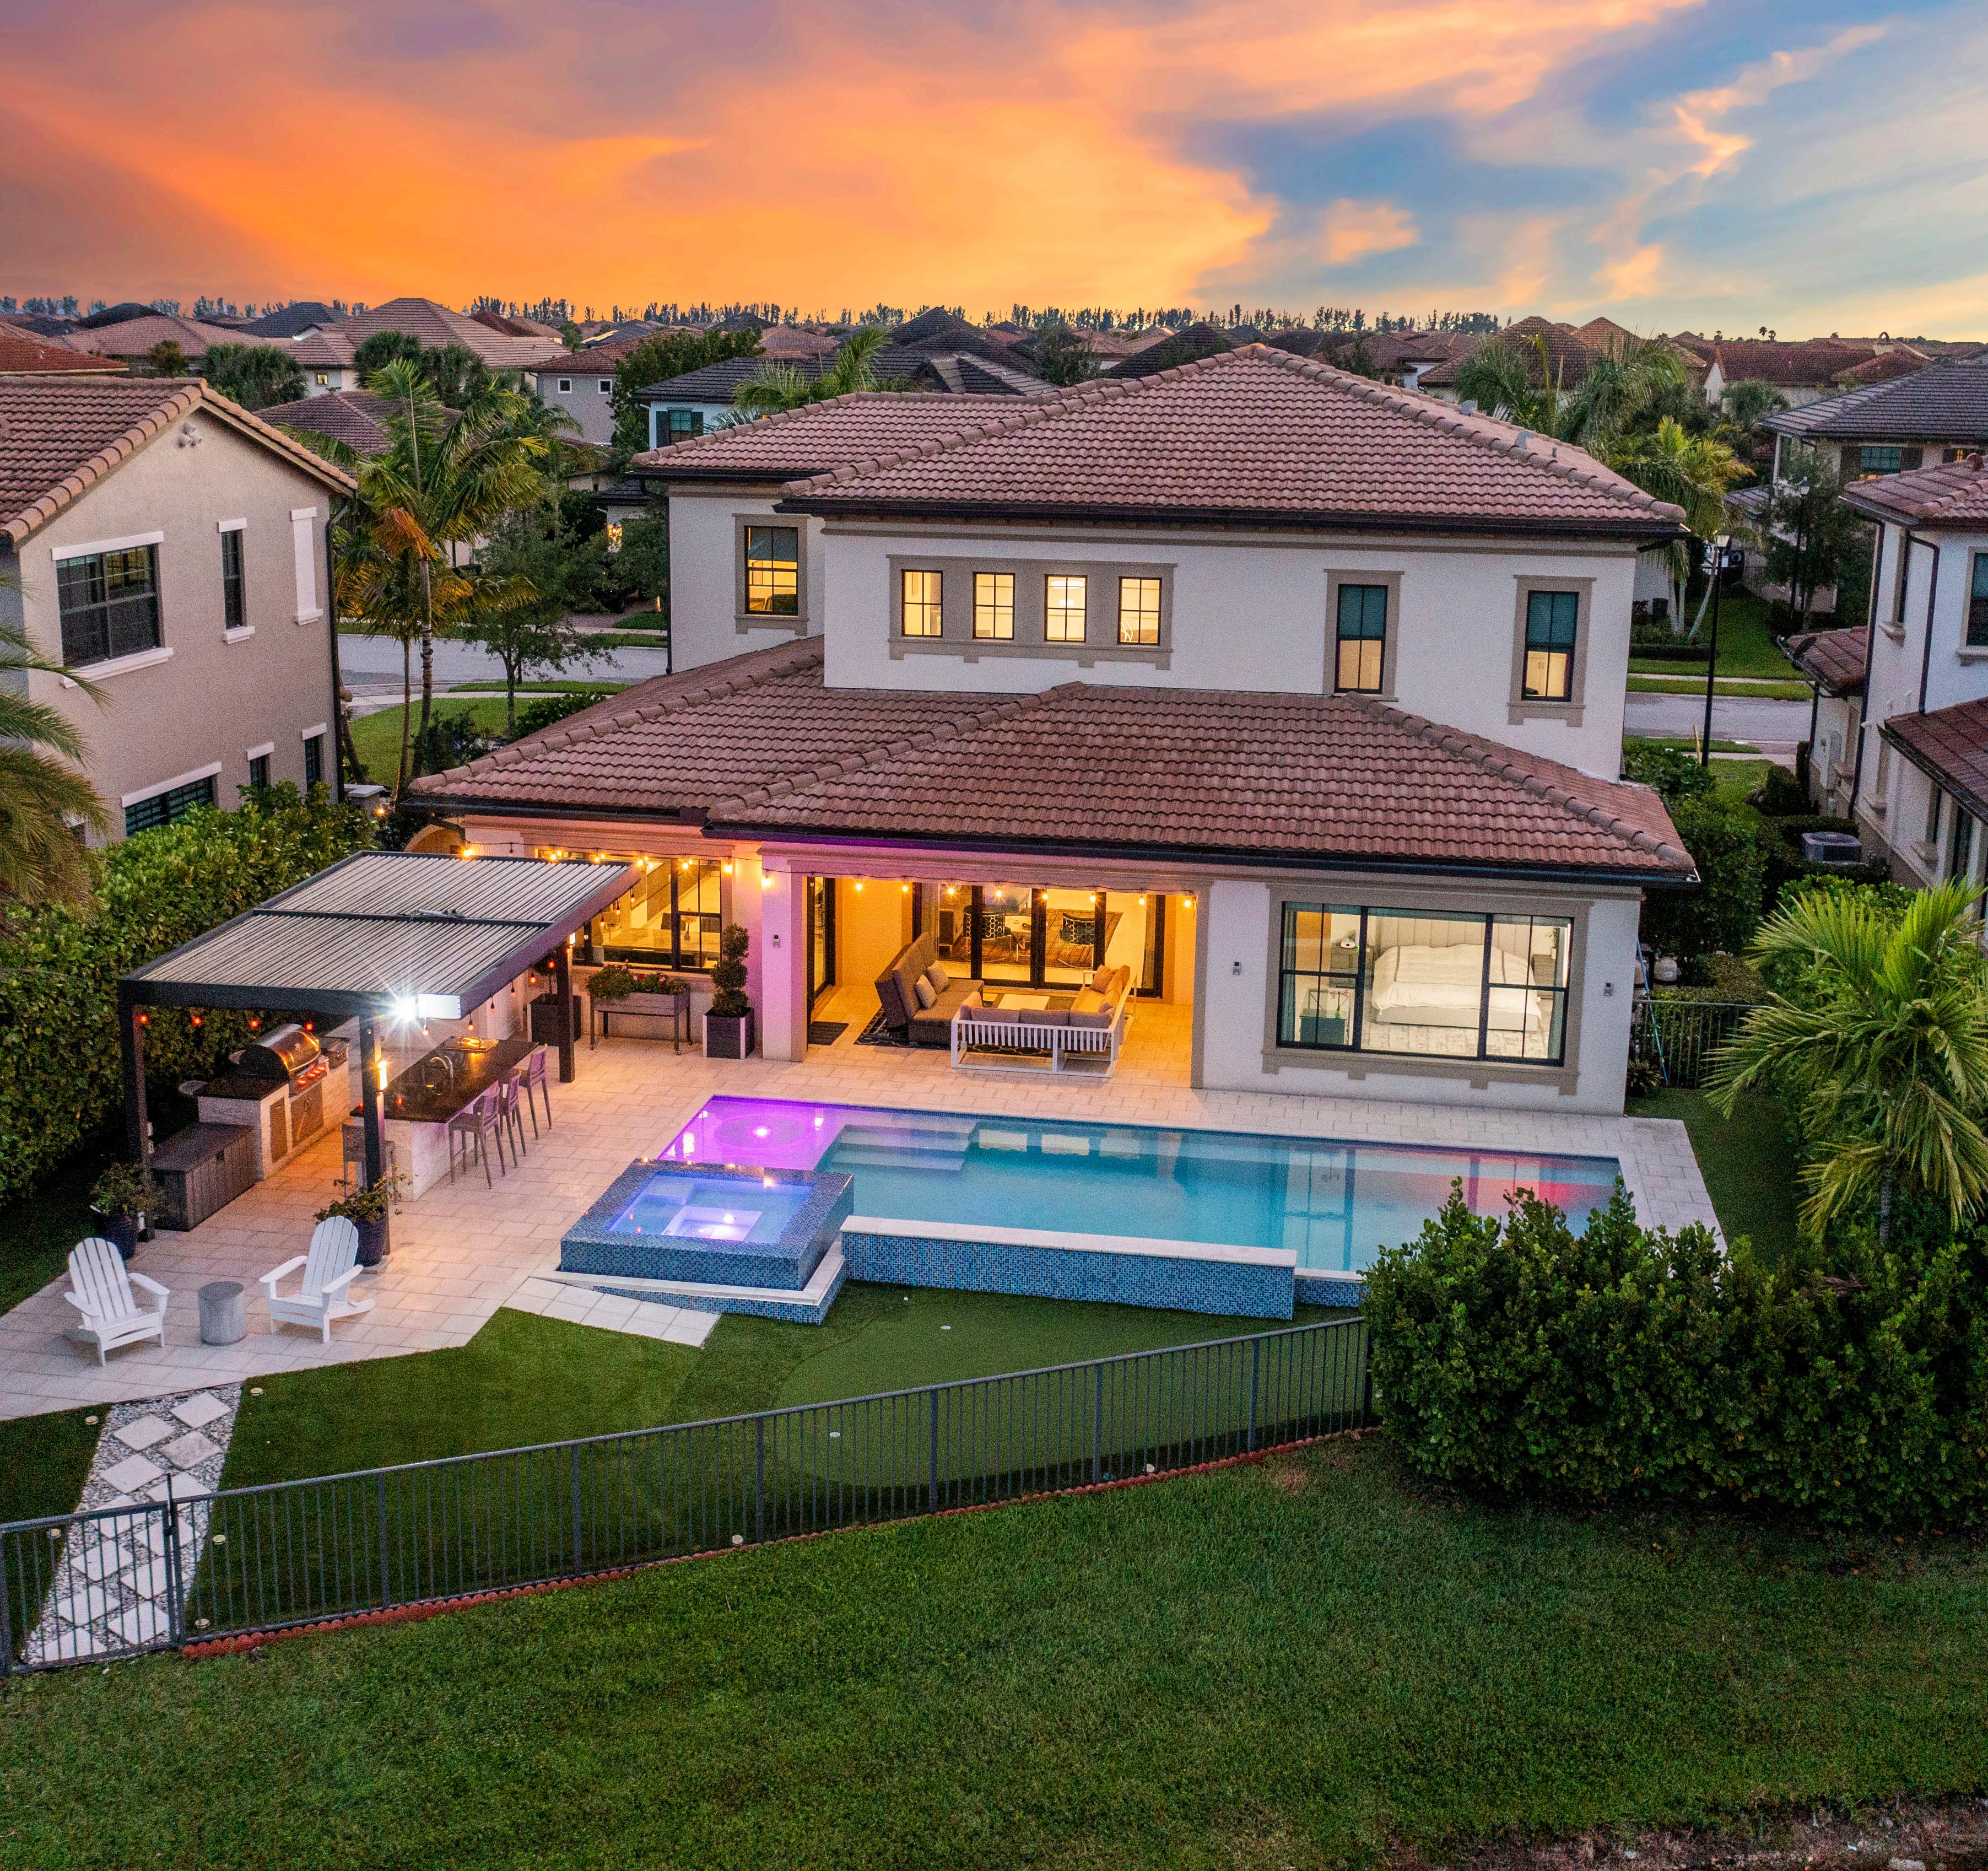
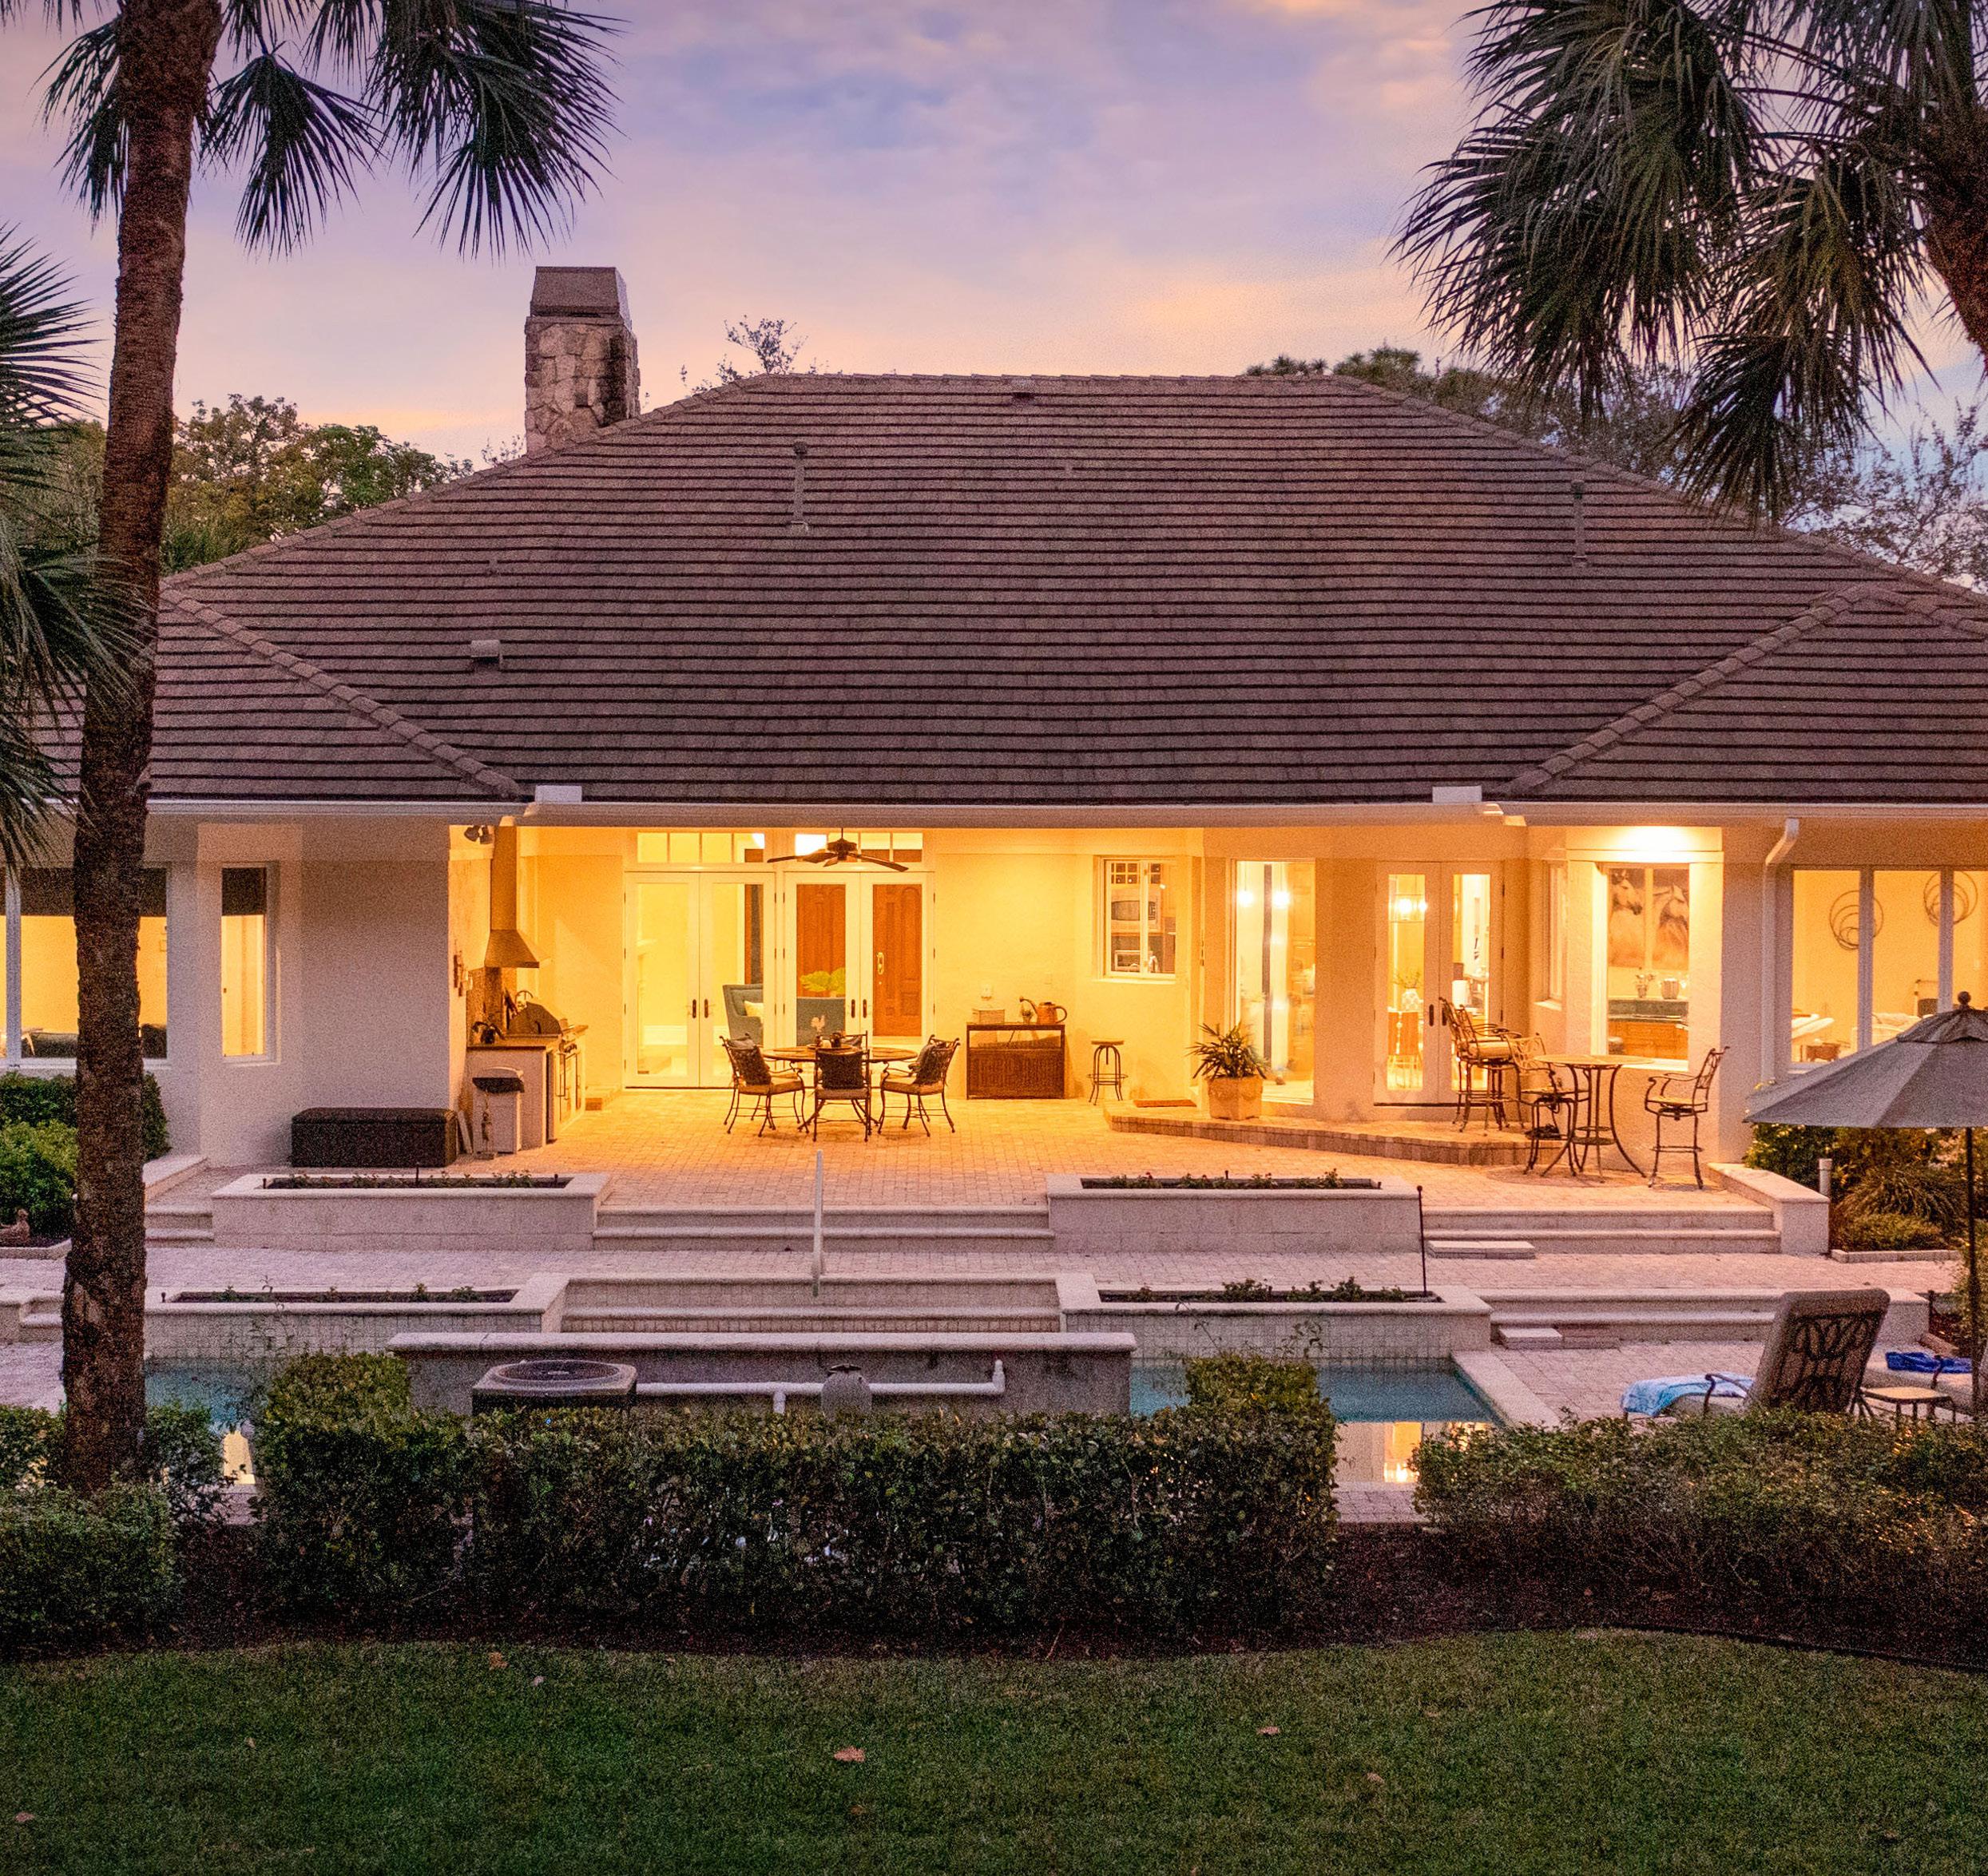
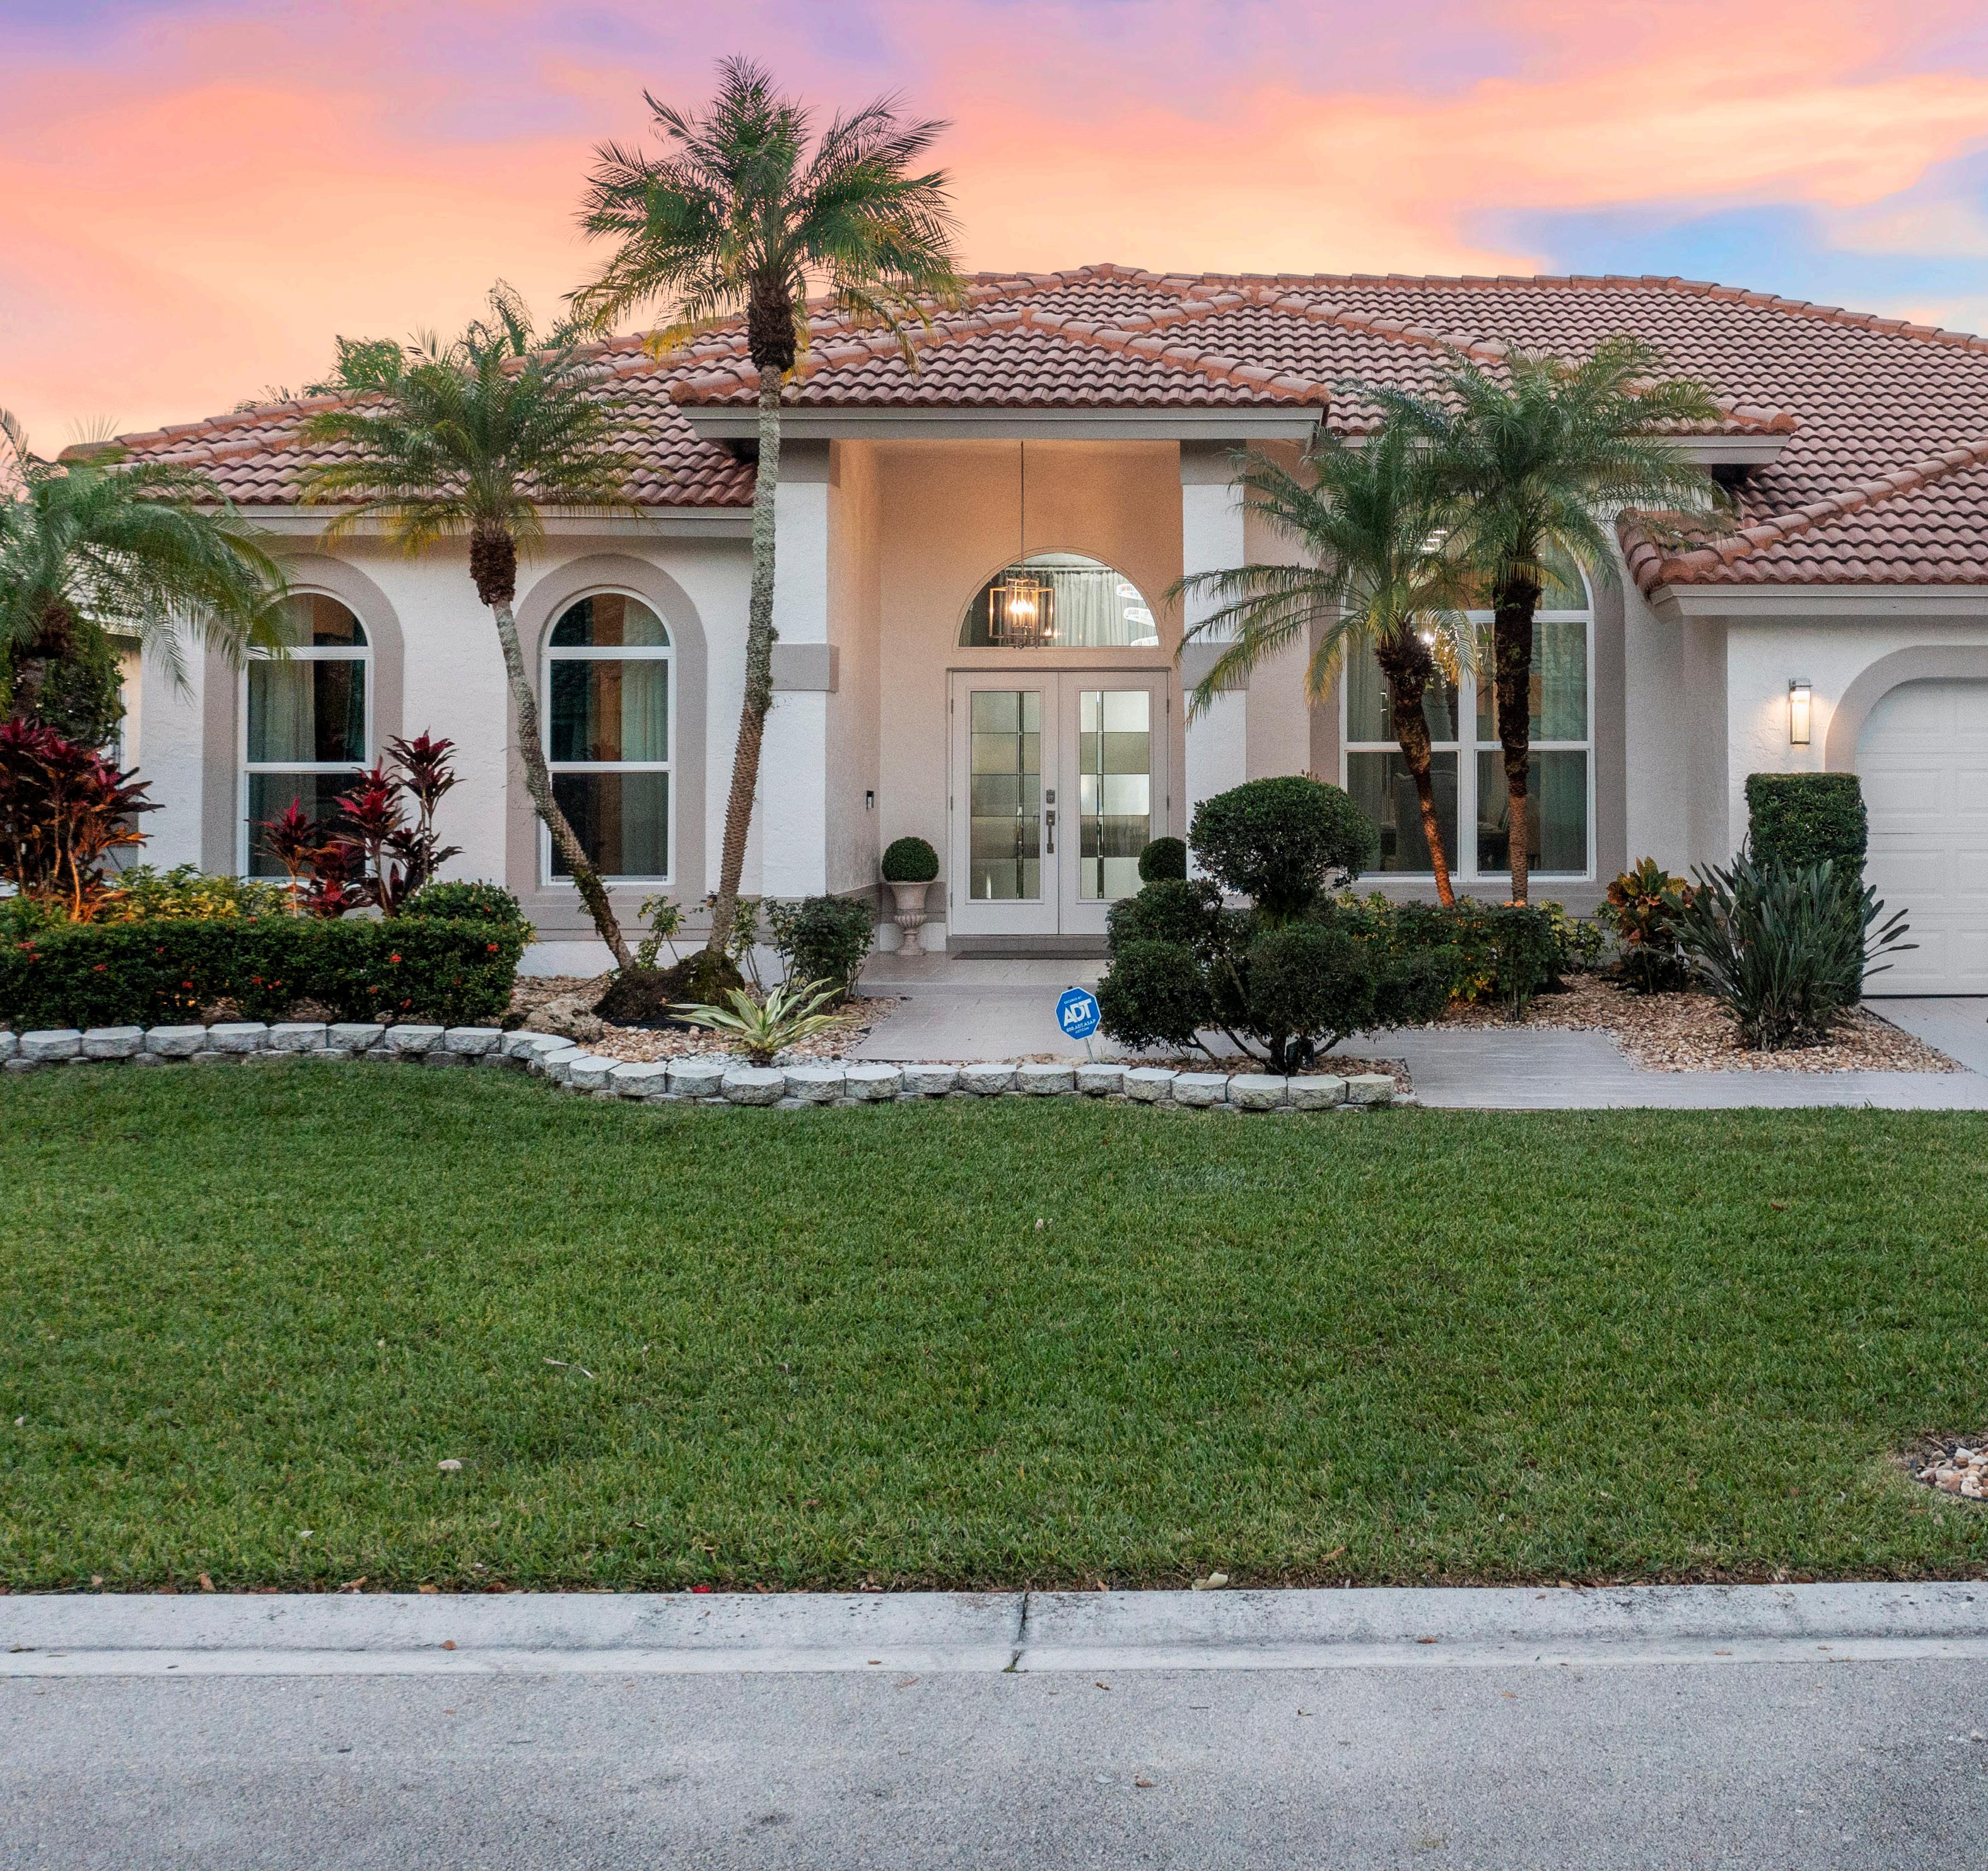
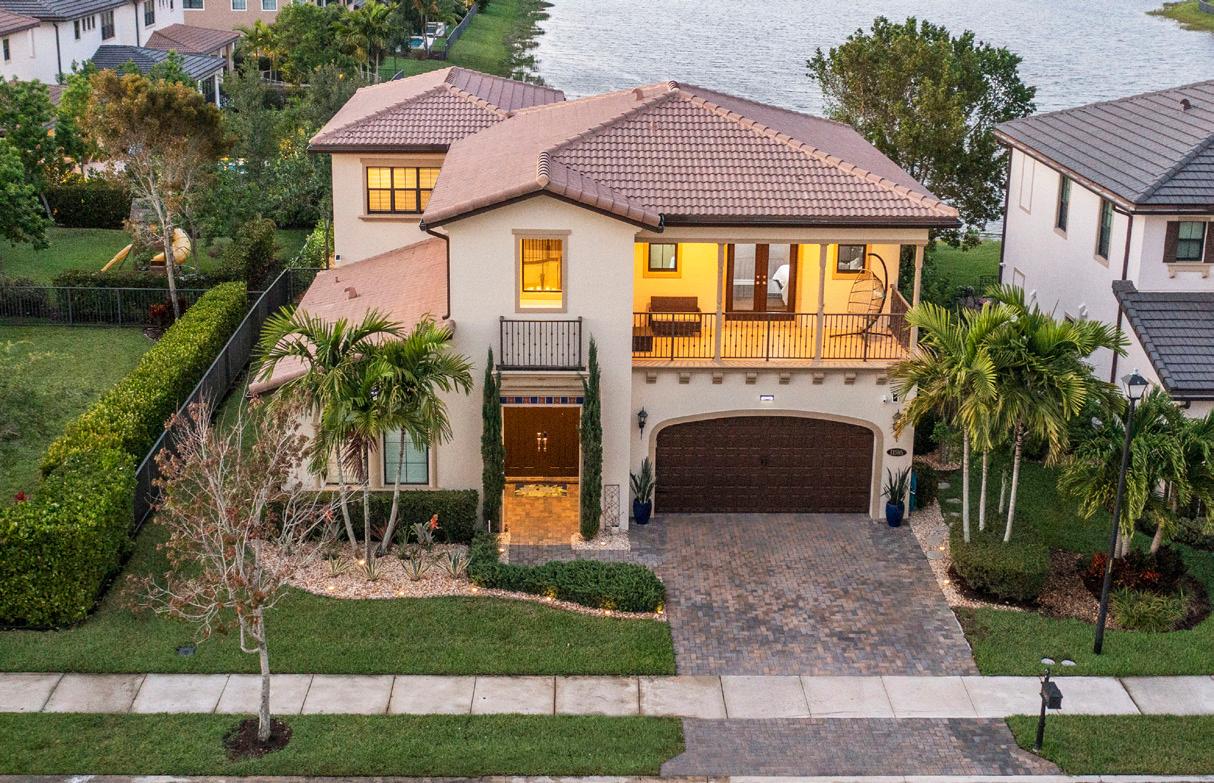
SOLD AT $1,150,000 Under Contract | Listed at $1,349,900 11595 Carrington Avenue 9315 Meridian Dr W Sold For $1,117,500 | Represented Seller $25,000 Over Asking | Sold for $1,175,000 11073 Meridian Dr N 9040 Watercrest Circle E Listed at $1,099,900 9330 Meridian Dr E 4.5 Baths 5 Beds Prepared Exclusively for Get Your Free Home Evaluation Today Visit www.LIVEINWatercrest.com
WATERCREST JULY 2023 MARKET REPORT * Data shown for the sales in Watercrest is based on the MLS as of July 13th, 2023 and is deemed to be reliable but should be verified. 2023 2022 NUMBER OF HOMES SOLD 2022 to 2023 Comparison MEDIAN SALES PRICE 2022 to 2023 Comparison $1,800,000 $1,650,000 $1,500,000 $1,350,000 $1,200,000 $1,050,000 $900,000 $750,000 $600,000 $450,000 $300,000 $150,000 0 MAR APR MAY JUNE 7 6 5 4 3 2 1 0 MAR APR MAY JUNE SINGLE FAMILY MARKET REPORT ACTIVE LISTINGS PRICE REDUCTIONS PENDING SALES SOLD IN PAST 90 DAYS AVERAGE
DAYS
MARKET
Custom
REPRESENT BUYER & SELLER