


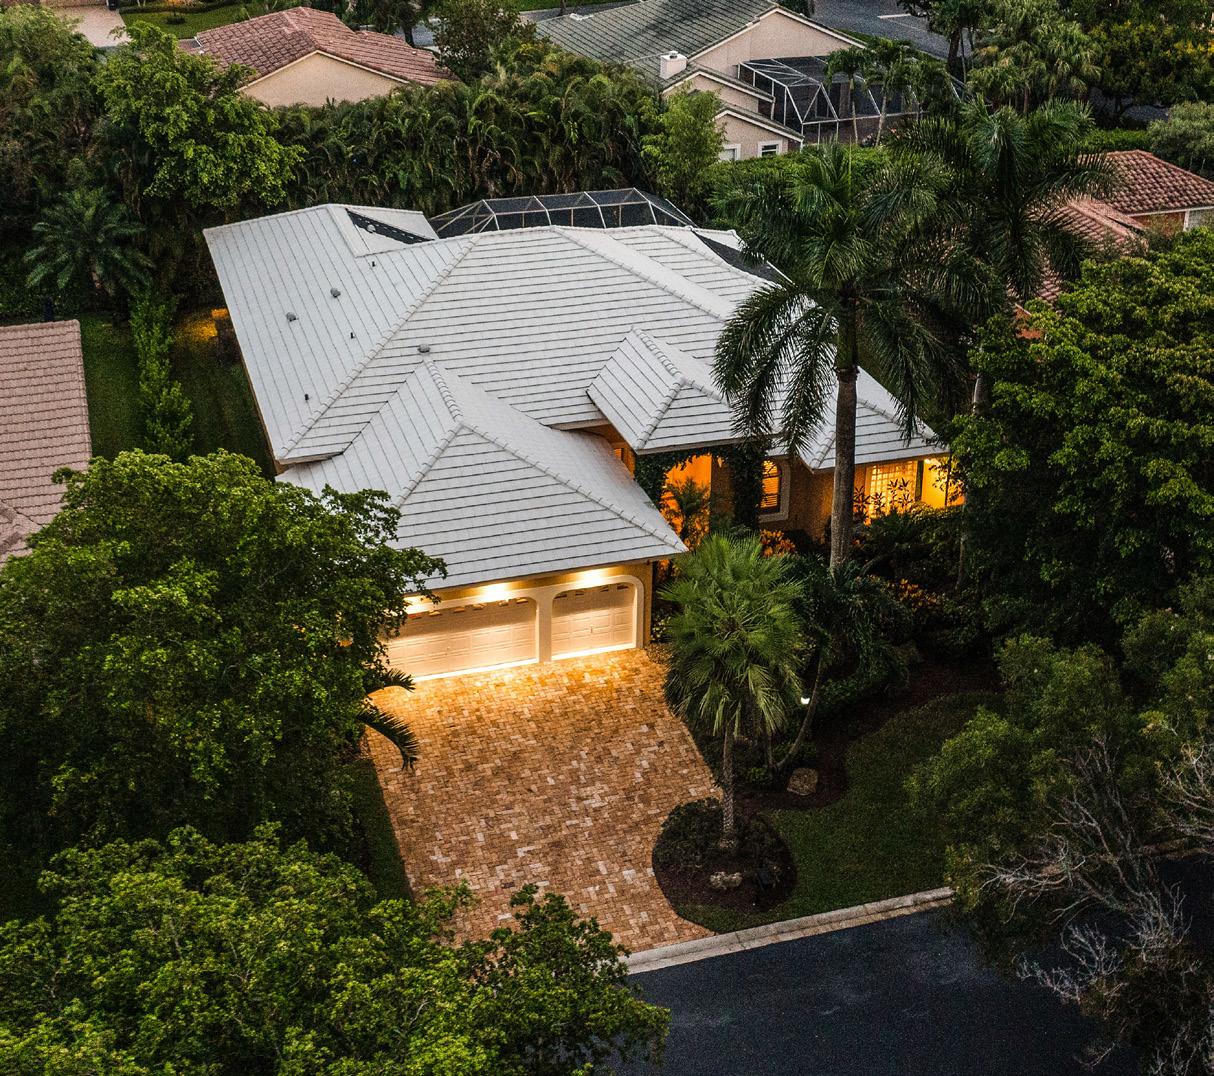
Presented by Michael Citron Prepared Exclusively for JULY 2023 Edition FOX RIDGE #1 PARKLAND REAL ESTATE TEAM 7 YEARS IN A ROW REAL ESTATE MARKET REPORT 6733 NW 105th Lane FULL DETAILS INSIDE SOLD FOR $1,294,900 Use Camera Phone To Watch This Property’s Creative Lifestyle Video Permit # 3018 11555 Heron Bay Blvd. Suite 200 Coral Springs FL, 33076 954.609.0591 Michael@ParklandParrot.com www. LIVEIN FoxRidge.com www. LIVEIN FoxRidge.com JULY 2023 Edition Find Out What Happened at 12712 NW 17th St Scan Here For The Full Story
Fox Ridge Market Review
Presented By Michael Citron
In the recent 90-day period, Fox Ridge recorded 4 home sales, indicating a decline in sales compared to the previous year. However, it is noteworthy that homes in our community are experiencing fewer price reductions before being sold, suggesting a favorable trend in the market.
In the last 90 days, the average time it took for homes to sell in Fox Ridge was 53 days, indicating a relatively slower sales pace compared to the rest of Parkland, where homes sold in an average of 51 days.
The median sales price in Fox Ridge has rose to around $1,242,450, indicating a robust market in our community. The desirability of gated communities coupled with diversely styled homes in East Parkland tends to attract many buyers who are looking to live the Parkland lifestyle along with resort style amenities.


0/1 1 4 53 MEDIAN SALES PRICE
PAST 90 DAYS AVERAGE DAYS ON MARKET
$1,242,450


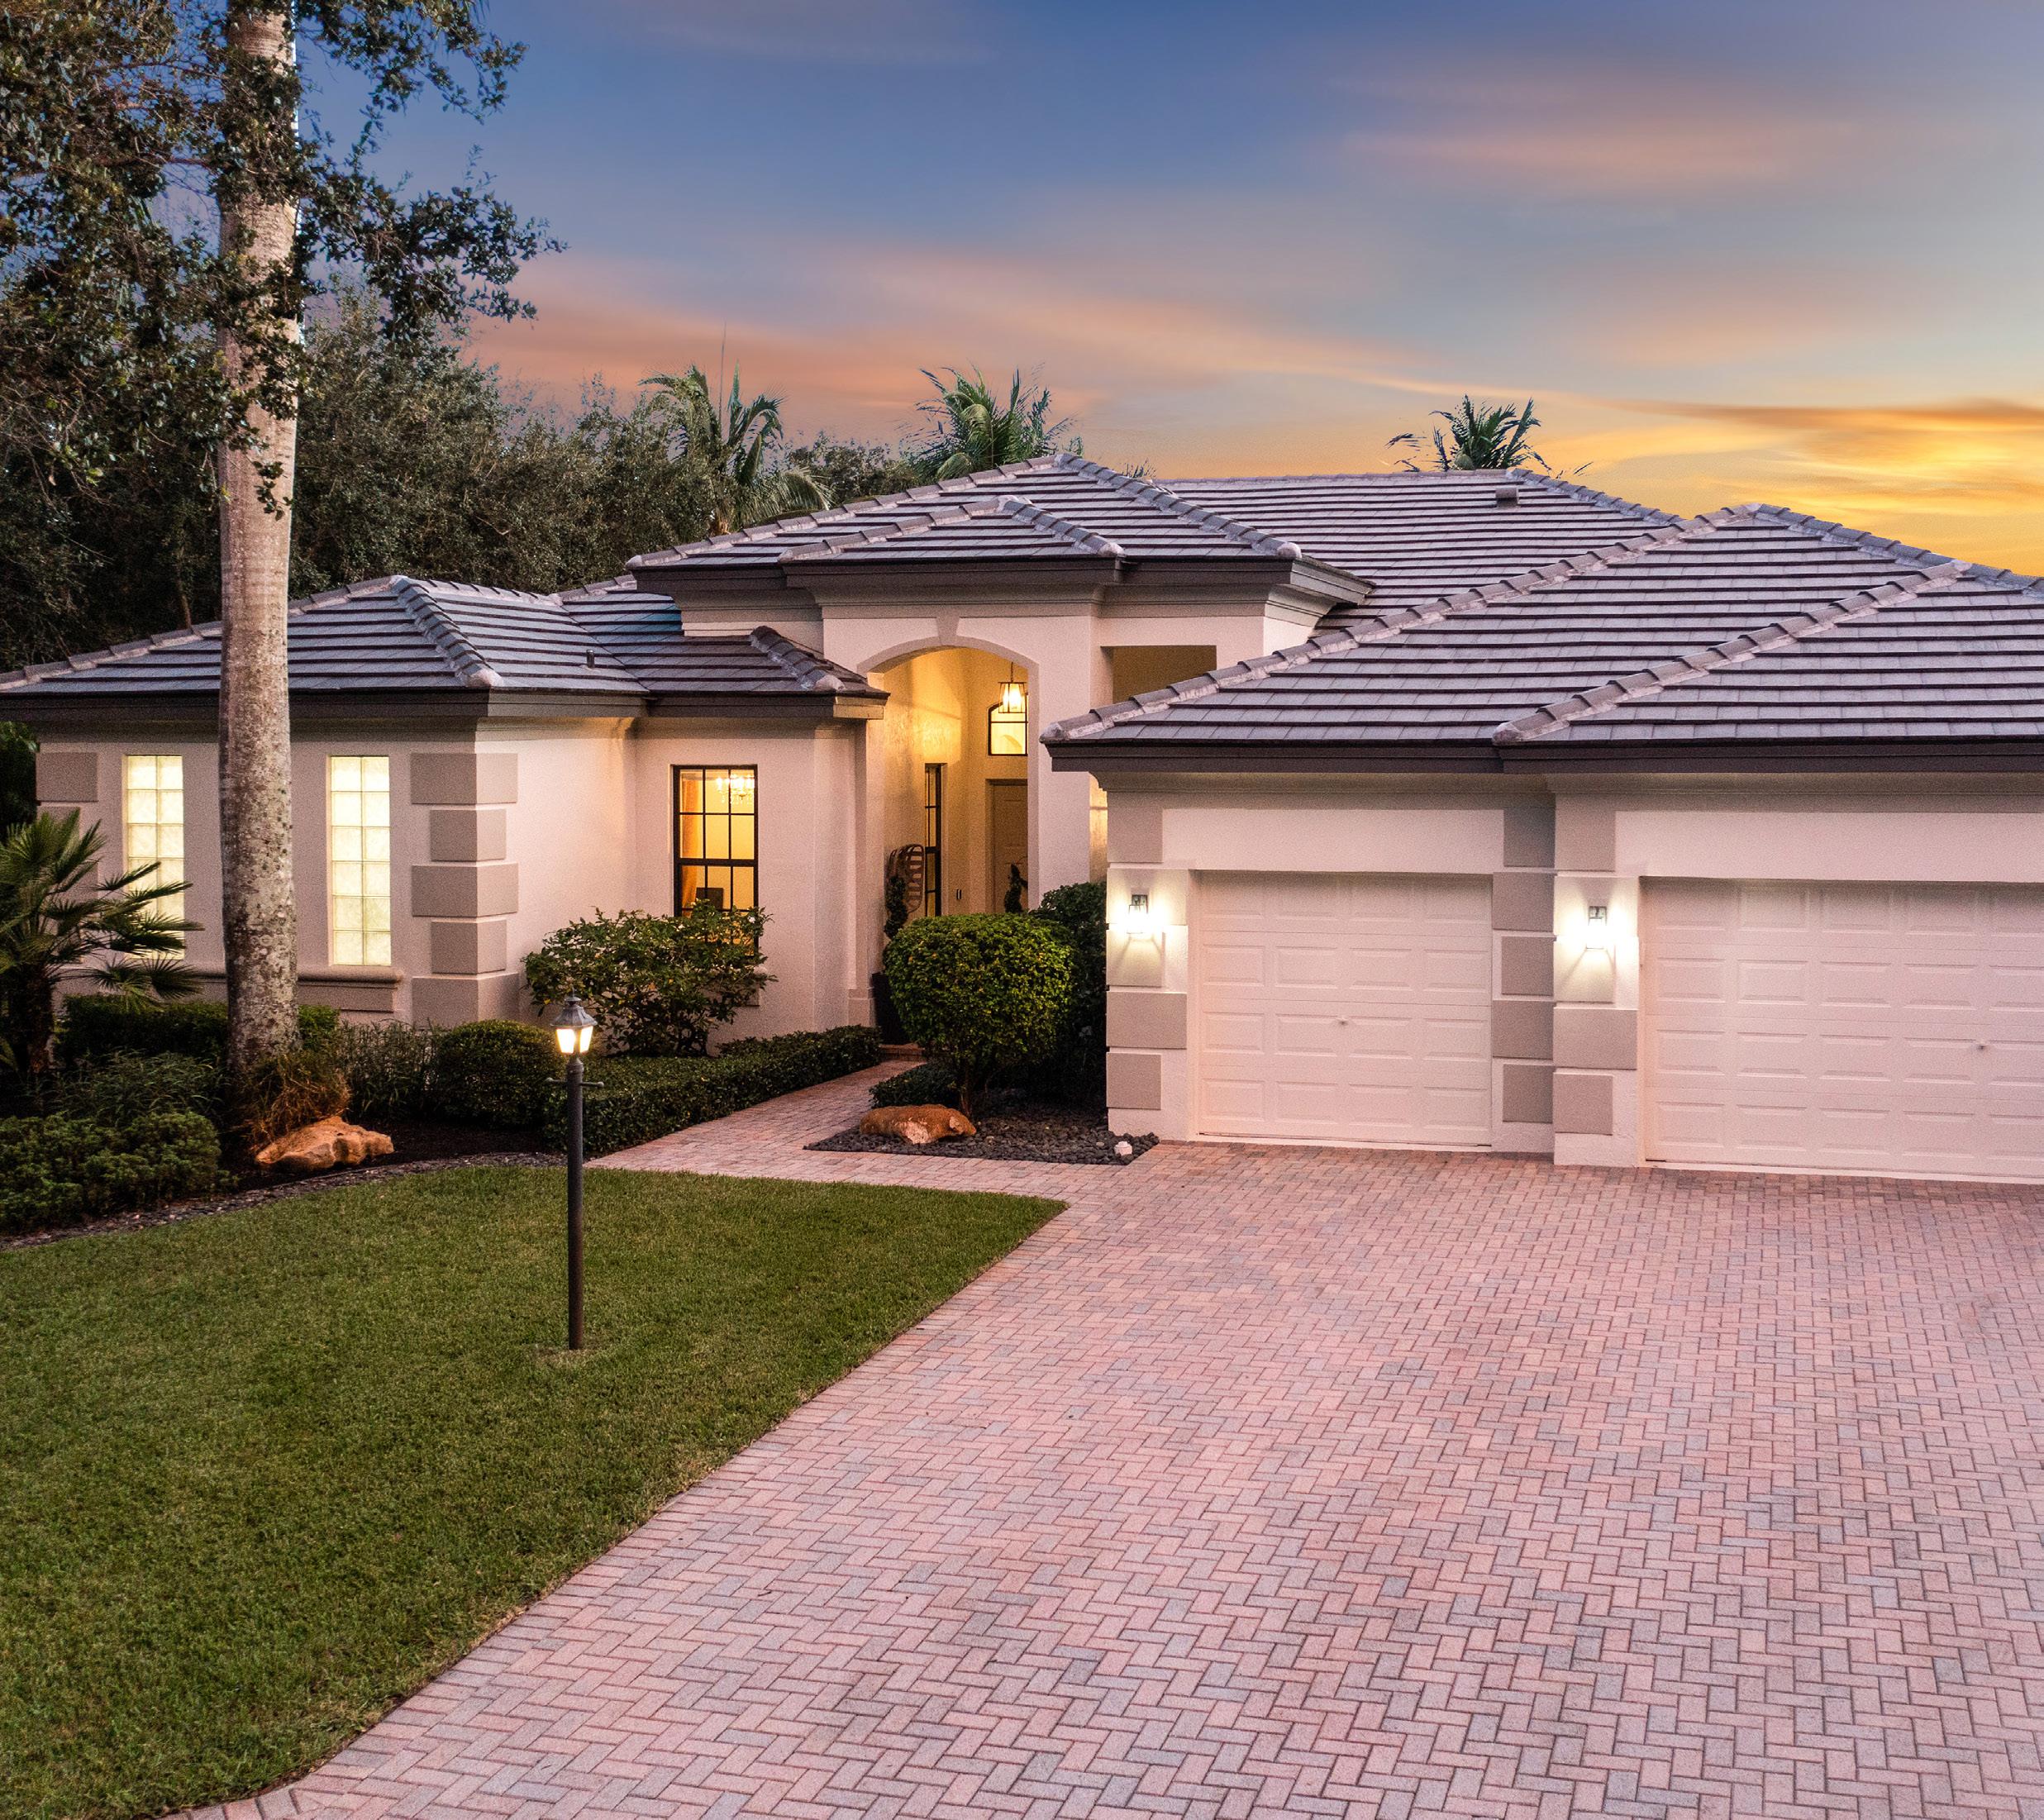
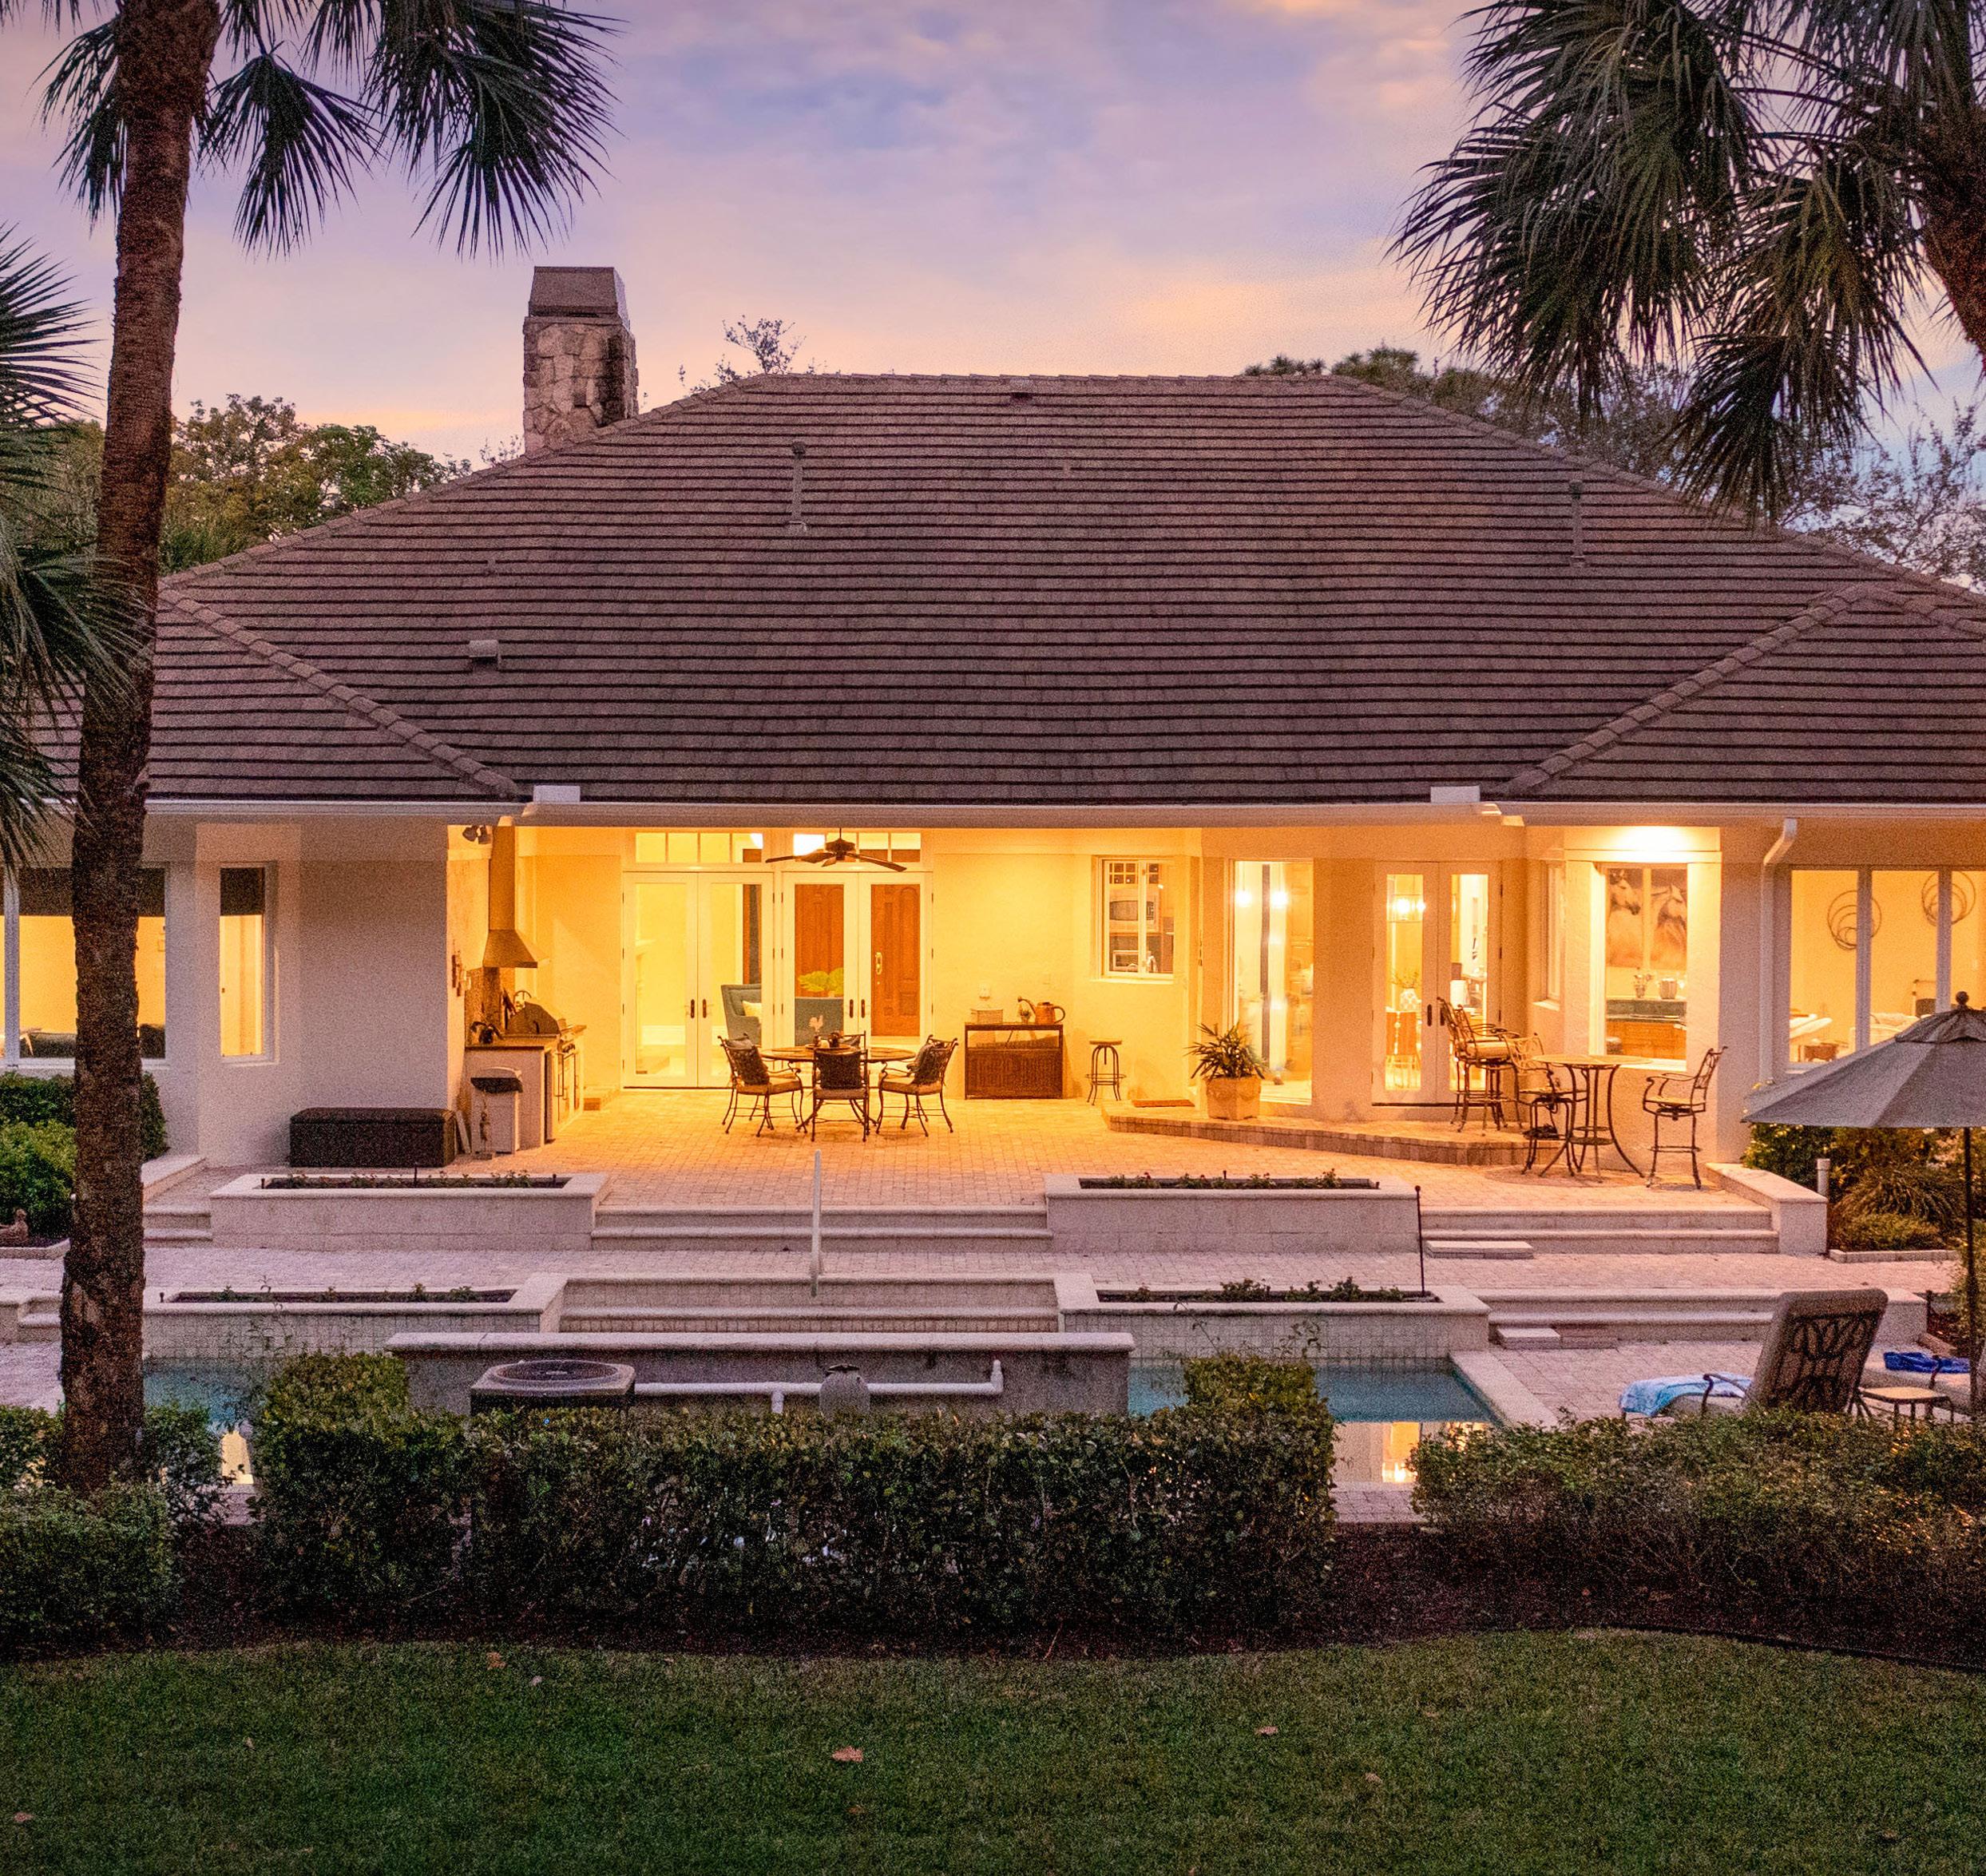
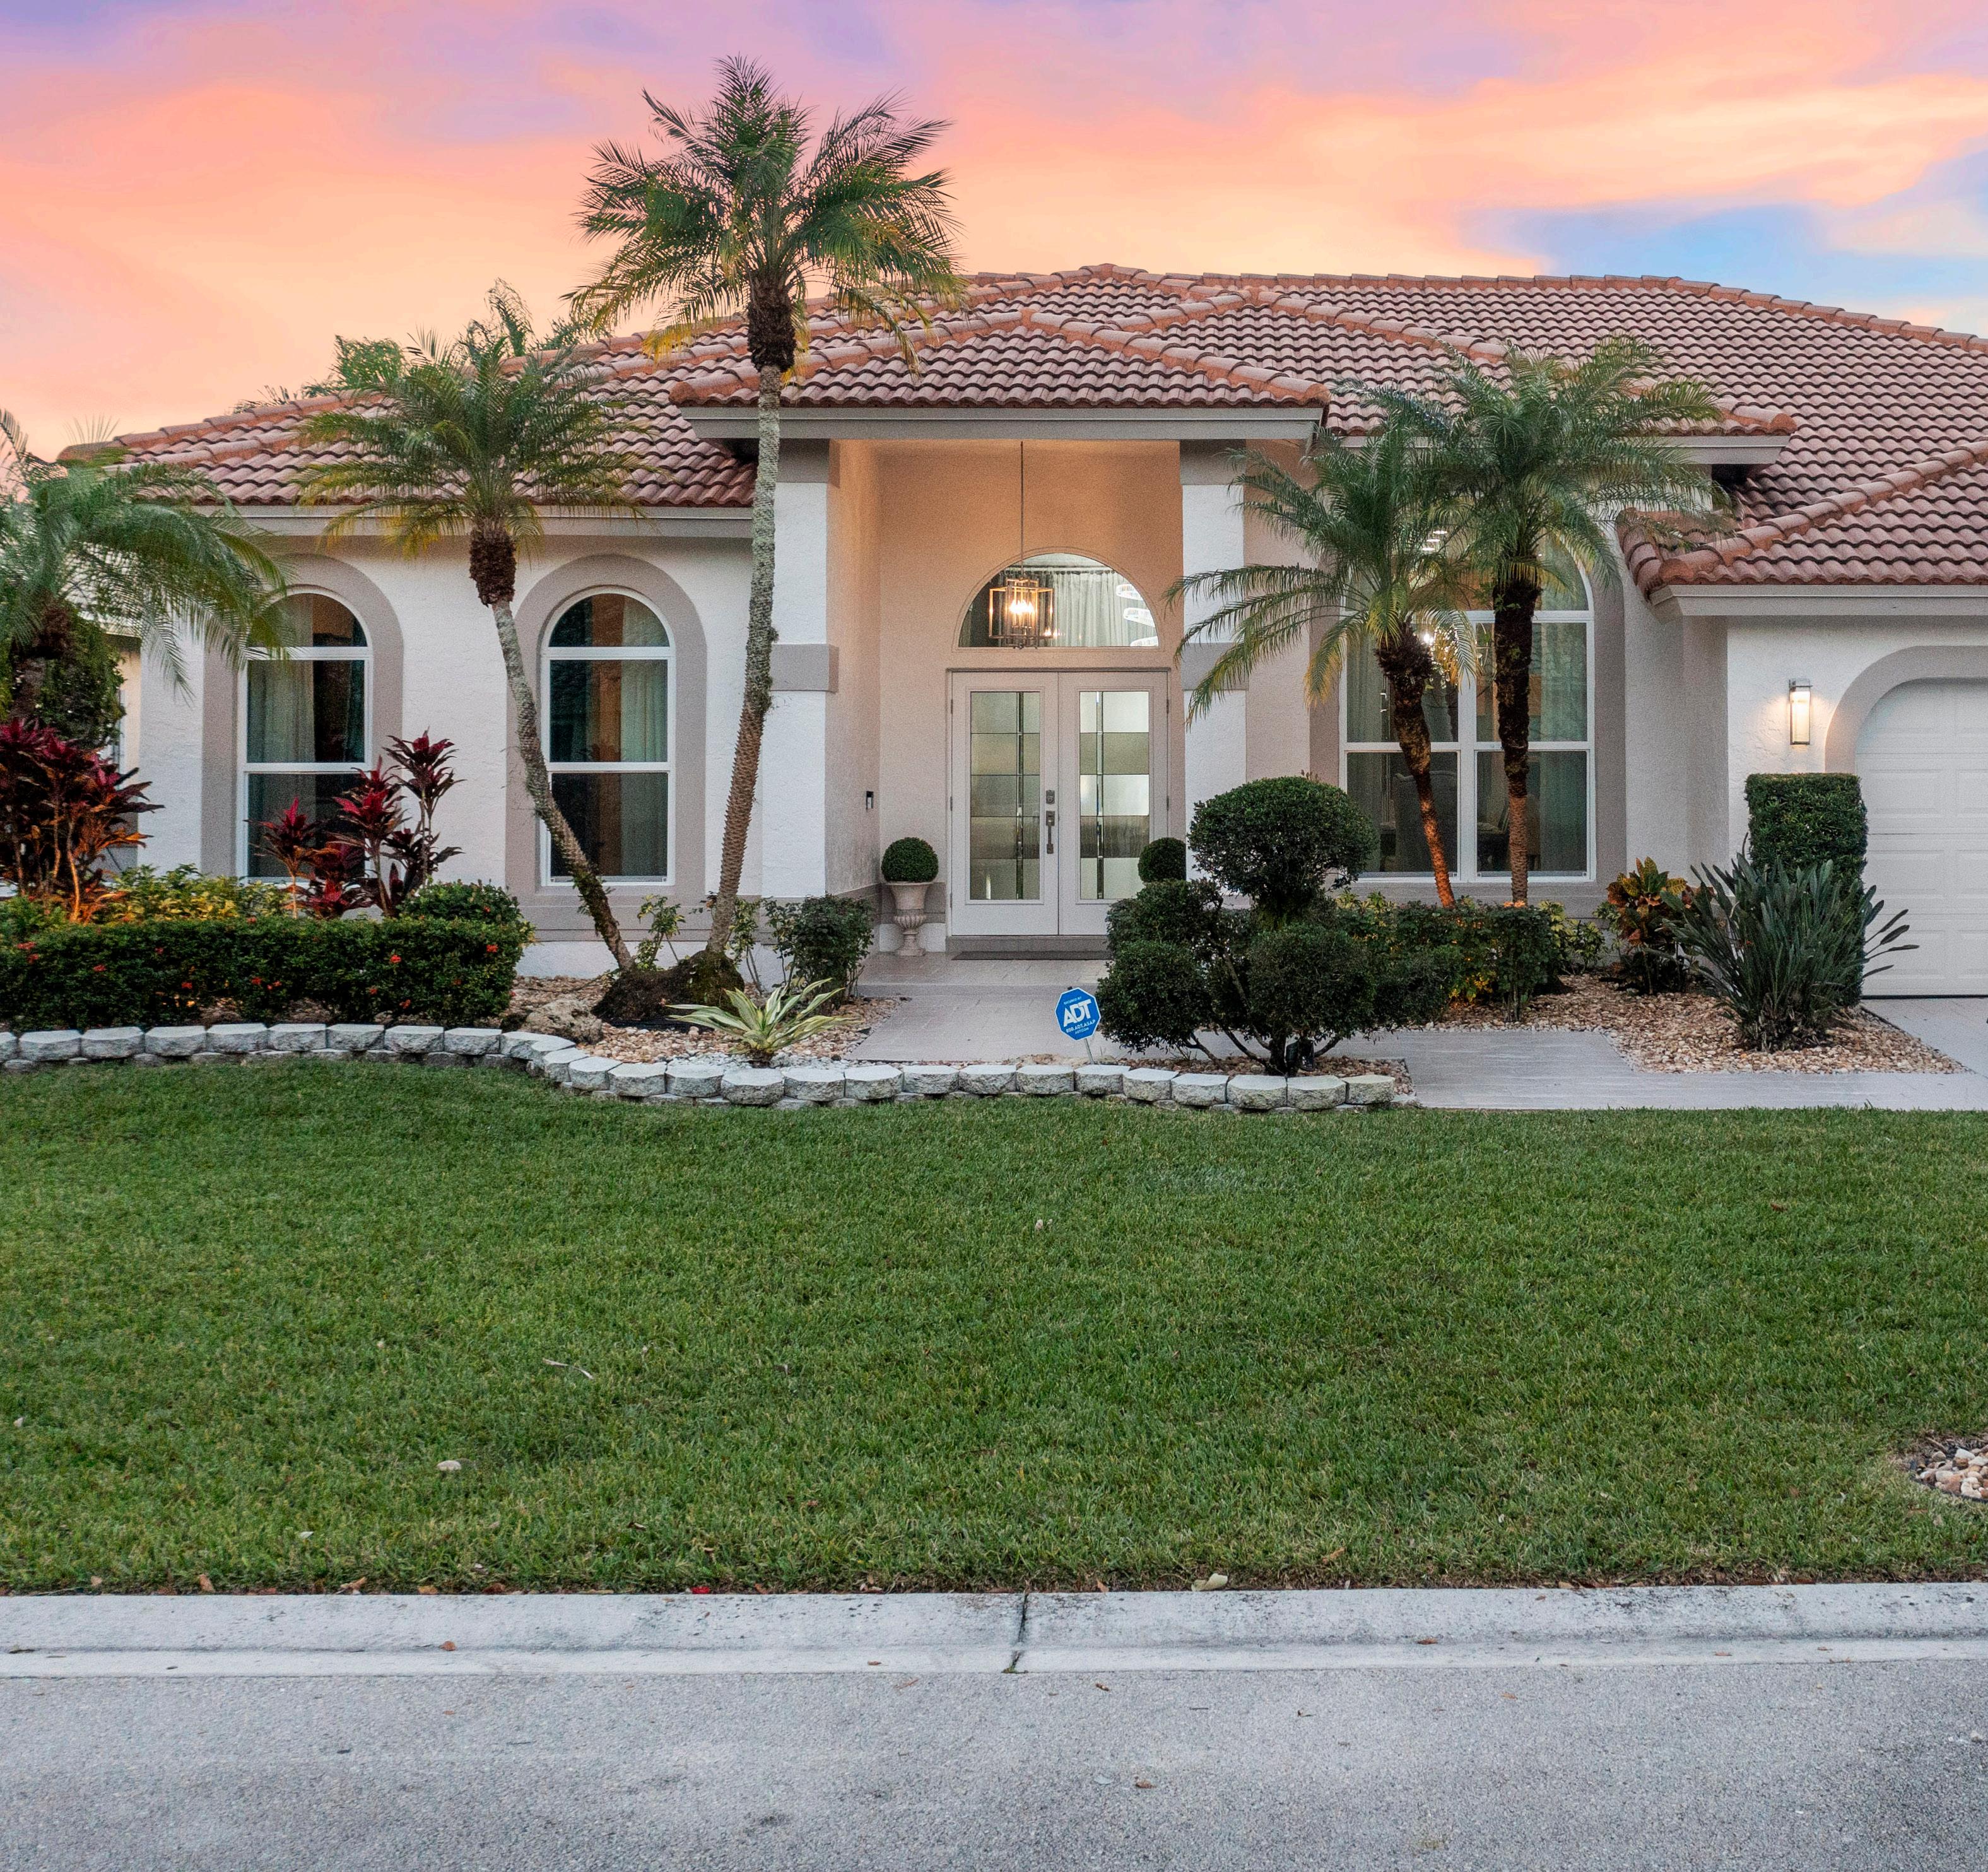
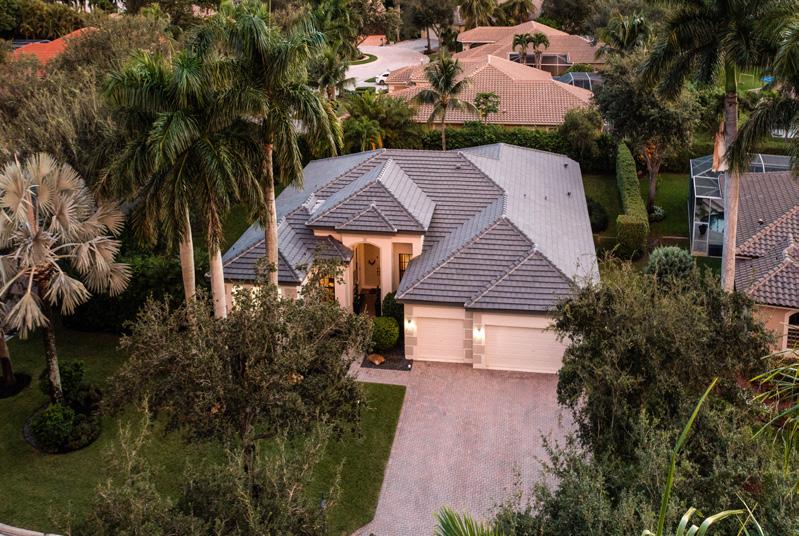
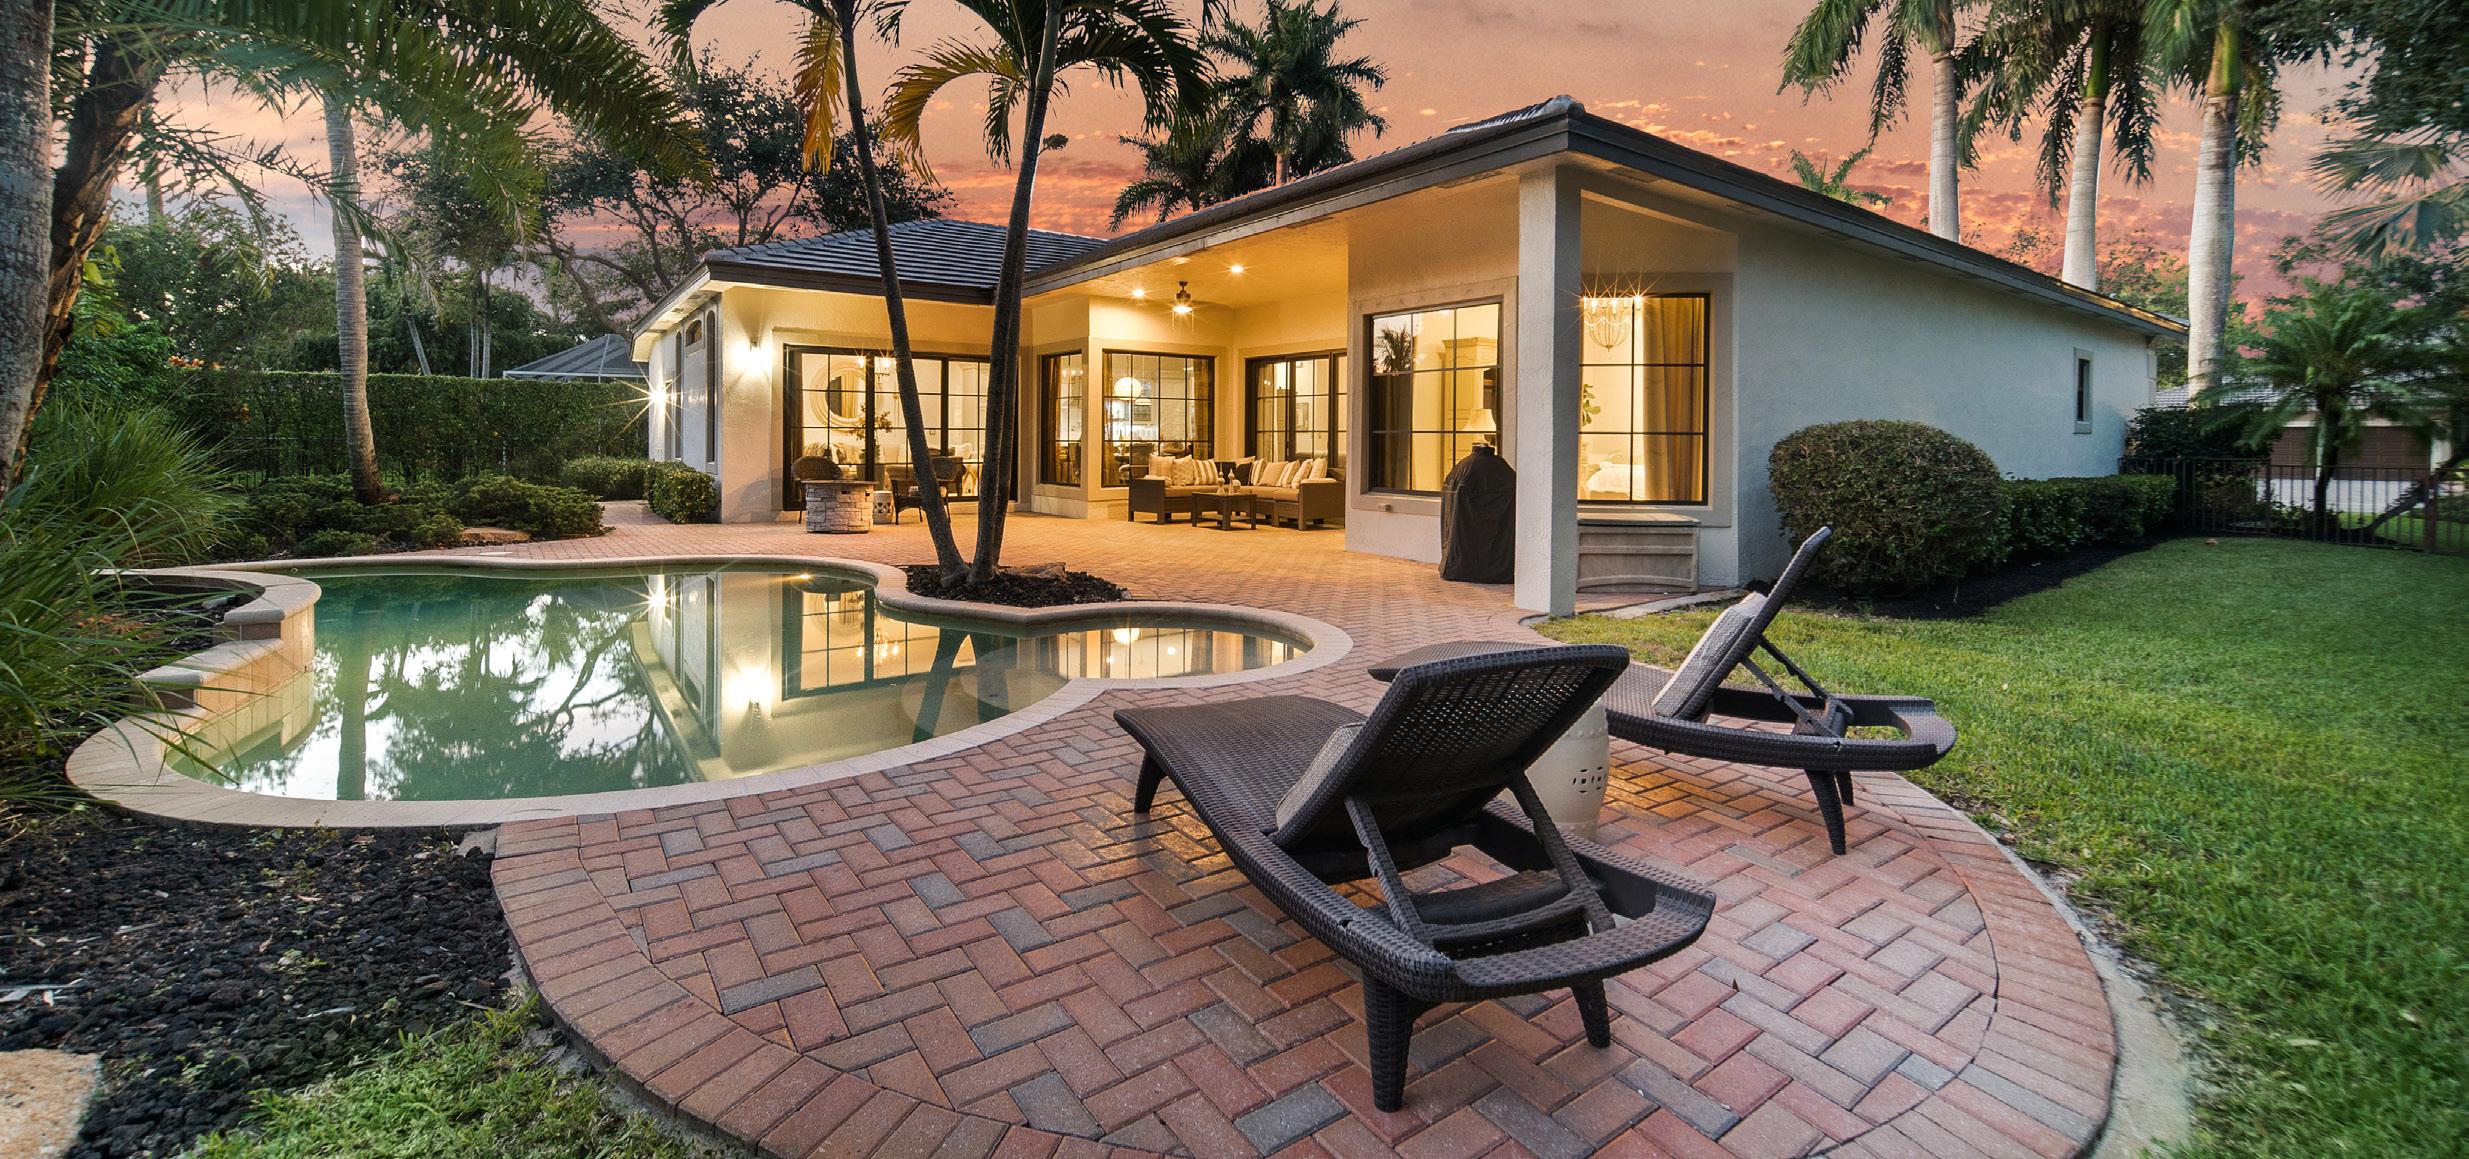
Under Contract | Listed at $999,900 Sold For $885,000 | Represented Buyer 6998 NW 111th Terrace | Parkland Isles 6526 NW 99th Lane | Meadow Run Sold for $1,294,900 | Represented Seller 6733 NW 105th Lane Pool 4 Full Baths 5 Beds Prepared Exclusively for Get Your Free Home Evaluation Today Visit www.LIVEINFoxRidge.com
FOX RIDGE JUNE 2023 MARKET REPORT 2023 2022 NUMBER OF HOMES SOLD 2022 to 2023 Comparison MEDIAN SALES PRICE 2022 to 2023 Comparison $2,400,000 $2,200,000 $2,000,000 $1,800,000 $1,600,000 $1,400,000 $1,200,000 $1,000,000 $800,000 $600,000 $400,000 $200,000 0 MAR APR MAY JUNE 7 6 5 4 3 2 1 0 MAR APR MAY JUNE SINGLE FAMILY MARKET REPORT ACTIVE LISTINGS PRICE REDUCTIONS PENDING SALES SOLD
IN
0
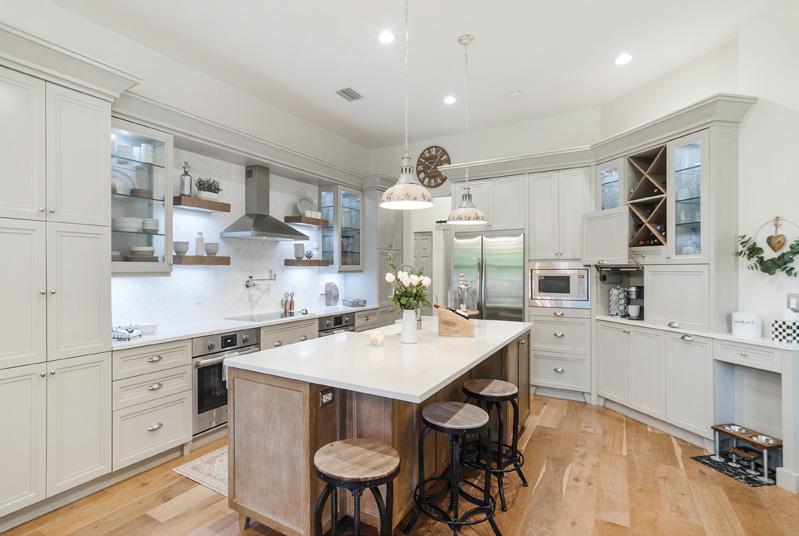
$300,000 Custom Upgrades
Total Homes Sold Average Days On Market Median Sales Price * Data shown for the sales in Fox Ridge is based on the MLS as of July 13th, 2023 and is deemed to be reliable but should be verified.