


Presented by Michael Citron Prepared Exclusively for APRIL 2023 Edition FOX RIDGE #1 PARKLAND REAL ESTATE TEAM 7 YEARS IN A ROW REAL ESTATE MARKET REPORT 6733 NW 105th Lane FULL DETAILS INSIDE UNDER CONTRACT Use Camera Phone To Watch This Property’s Creative Lifestyle Video Permit # 3018 11555 Heron Bay Blvd. Suite 200 Coral Springs FL, 33076 954.609.0591 Michael@ParklandParrot.com www. LIVEIN FoxRidge.com 1 10 Our Team Leads Parkland in Sales, with 15 sold of 110 sales in 2023 These Statistics Reflect The Data from BeachesMLS as of April 24, 2023 From Parkland Single Family Sales & Non 55+ Communities Our Current List to Sales Price ratio Median Days on Market OUT OF MORE THAN 14% 102% 12 www. LIVEIN FoxRidge.com APRIL 2023 Edition Sold Their Parkland Homes with Us
Prepared
FoxRidgeMarketReview


 PresentedByMichaelCitron

Total Homes Sold
We’re past the first quarter of the year and the market is certainly hot! With some of the most the desirable homes in Parkland the activity in Fox Ridge remains relatively slow for 2023 with 1 home sold in the past 90 days.
Average Days On Market

Pricing a home correctly can make or break a sale. It’s important to understand how the market is constantly fluctuating. Home values of 2021 and 2022 may not remain the same in 2023.
Median Sales Price
The median sales price for this year in Fox Ridge is $835,000. As a these pending sales will close we can expect this number to change to reflect actual Fox Ridge values. The sales of 2023 do reflect lower sale prices this year as many buyers in the area have more options with inventory finally increasing.
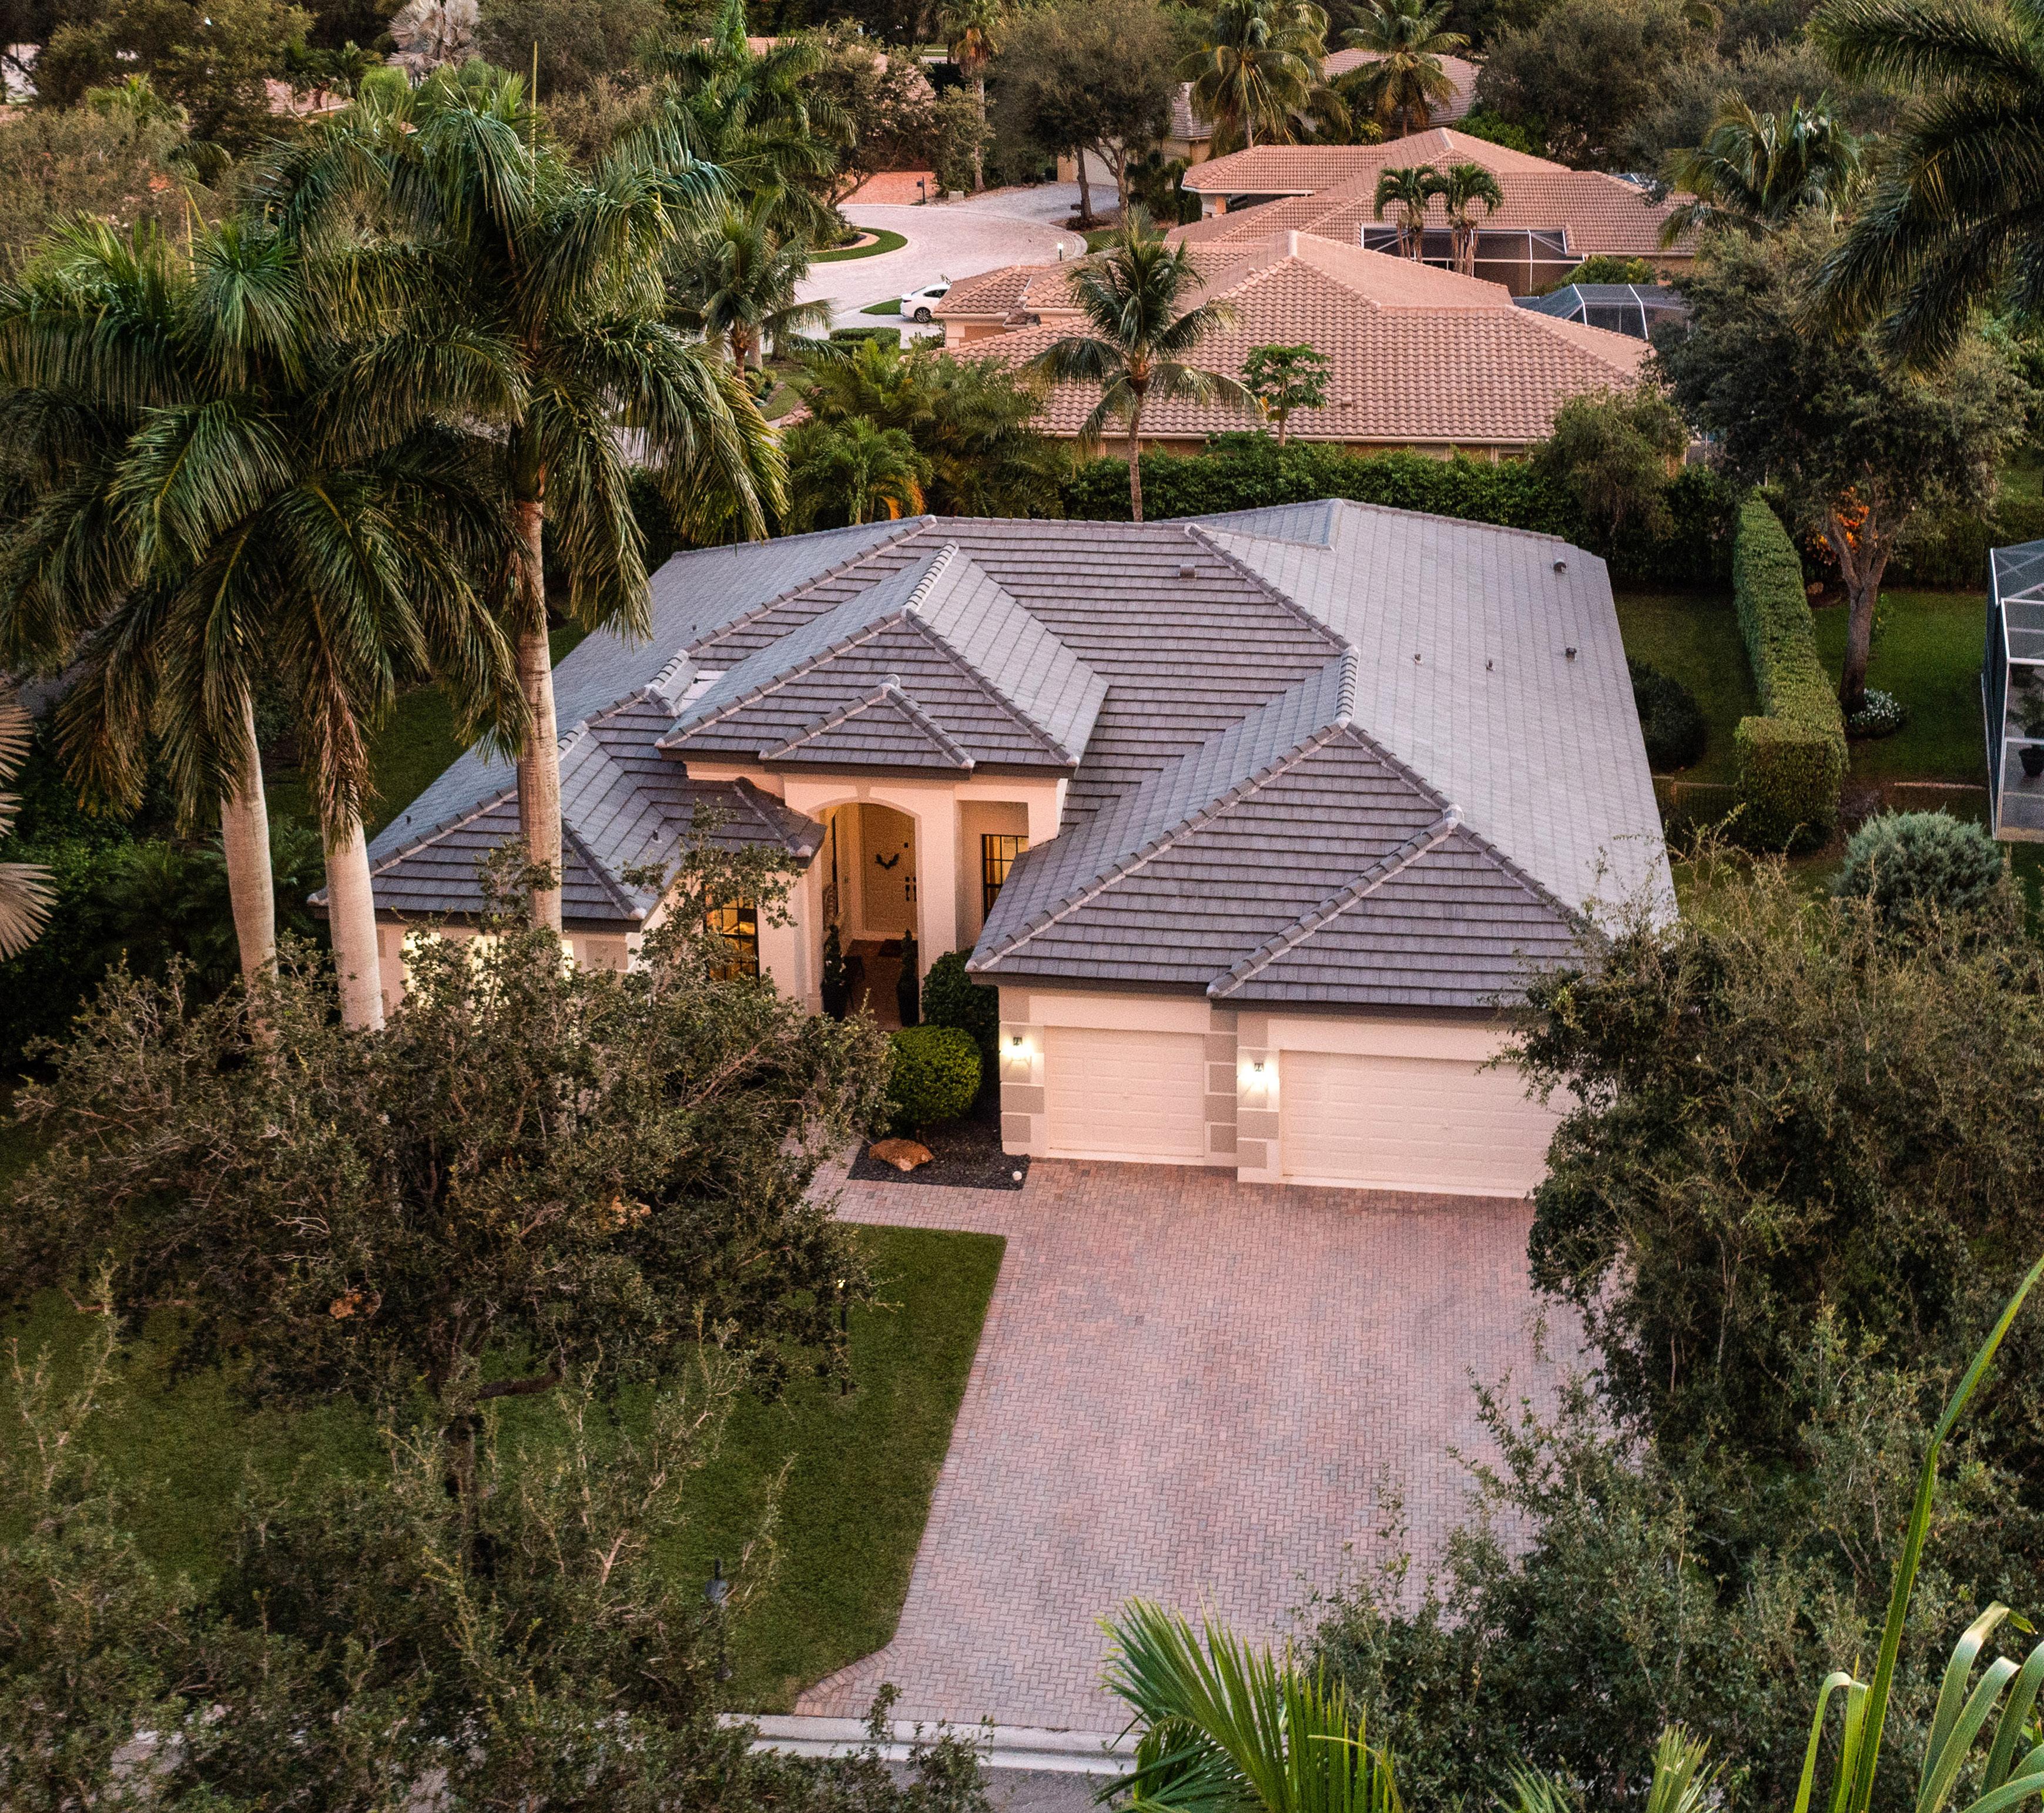
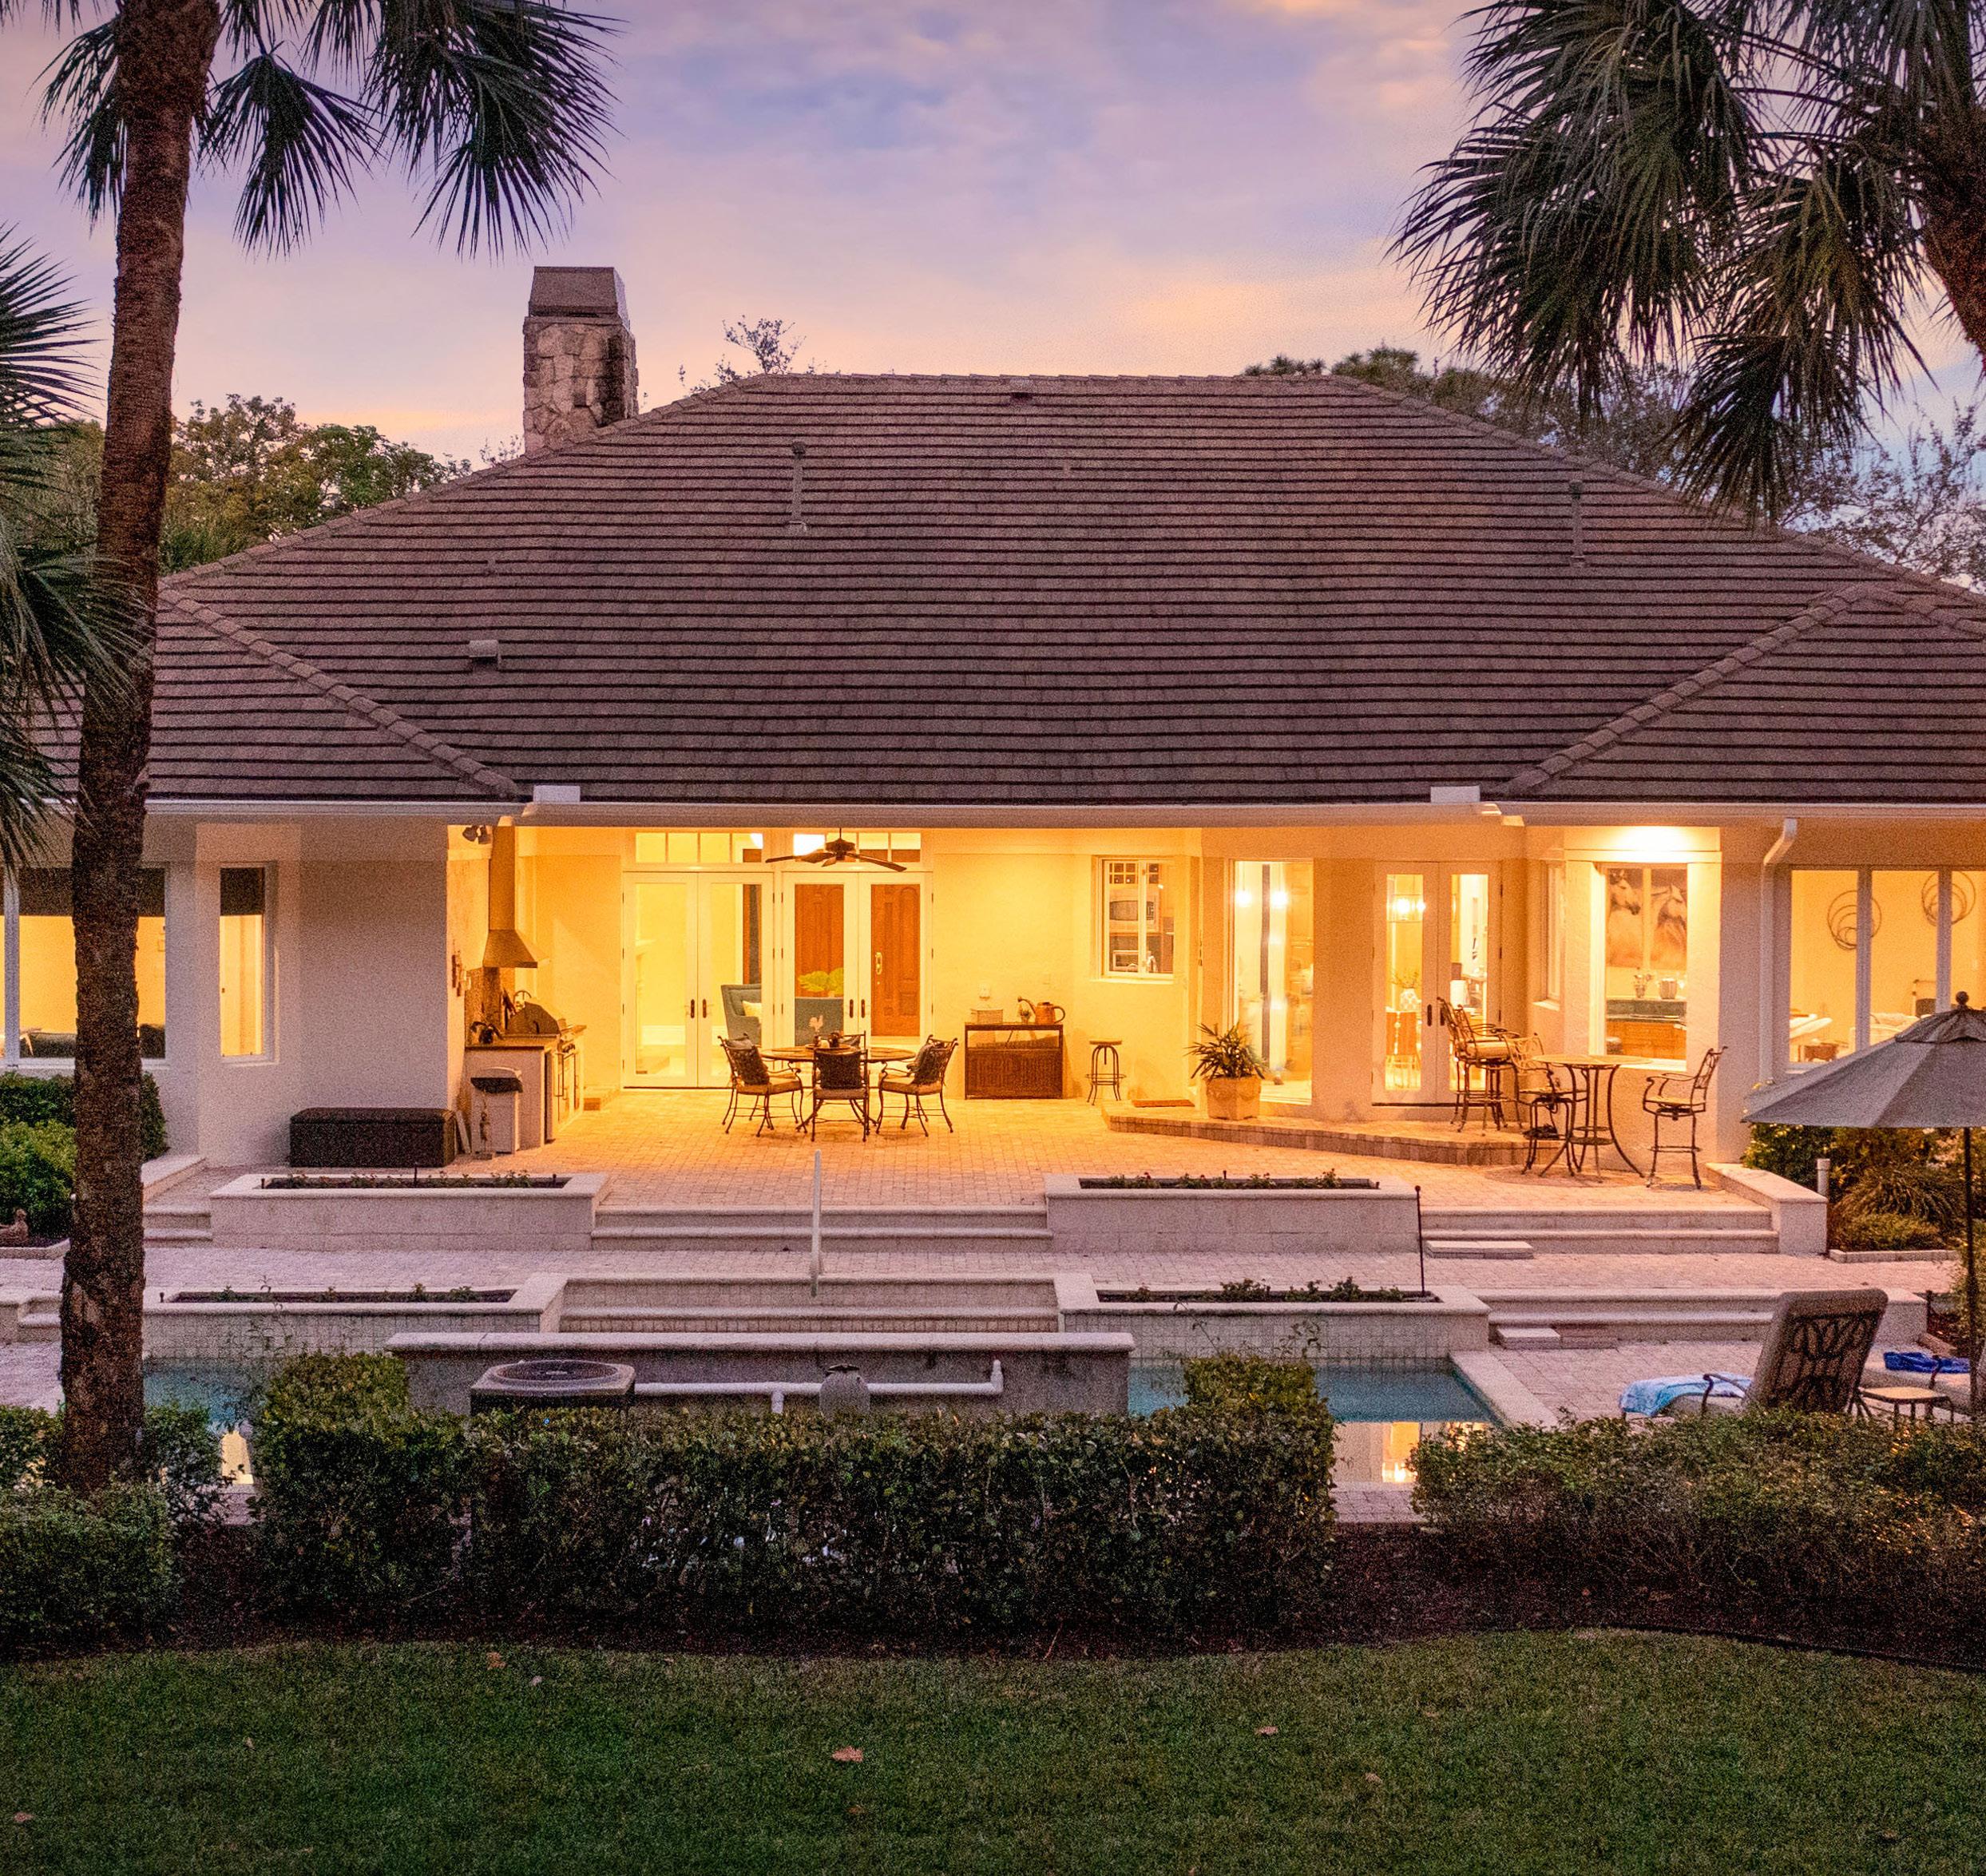
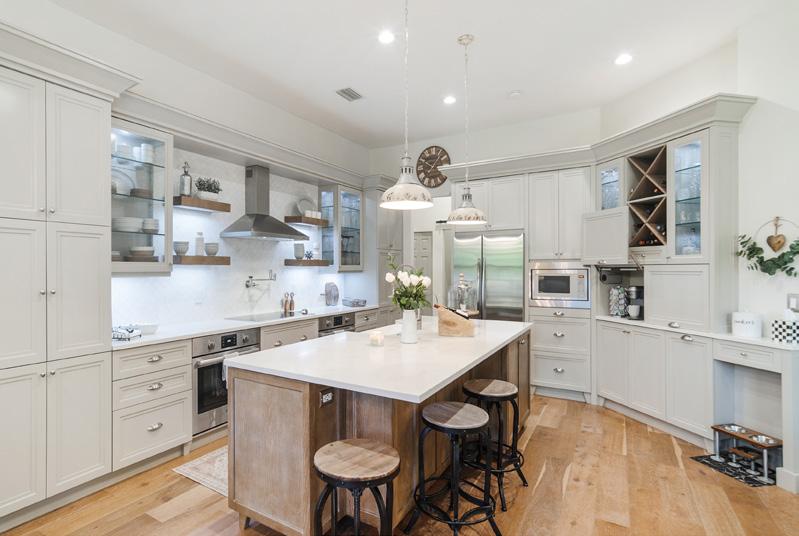
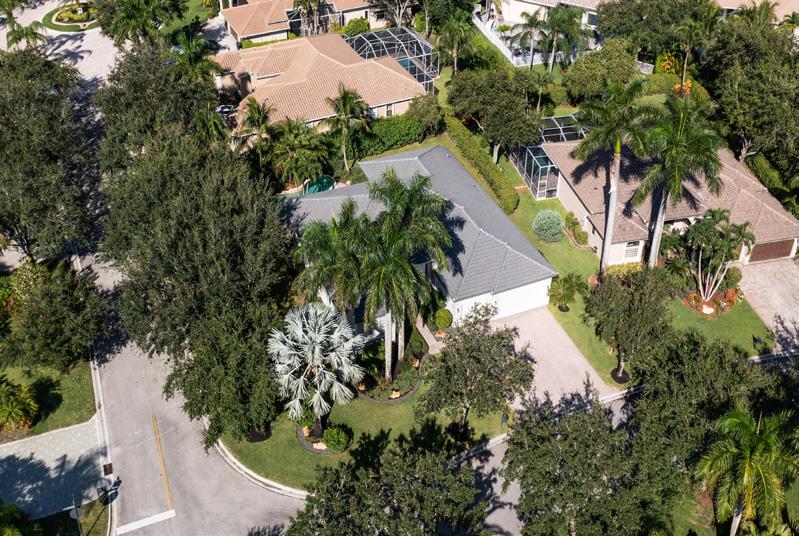
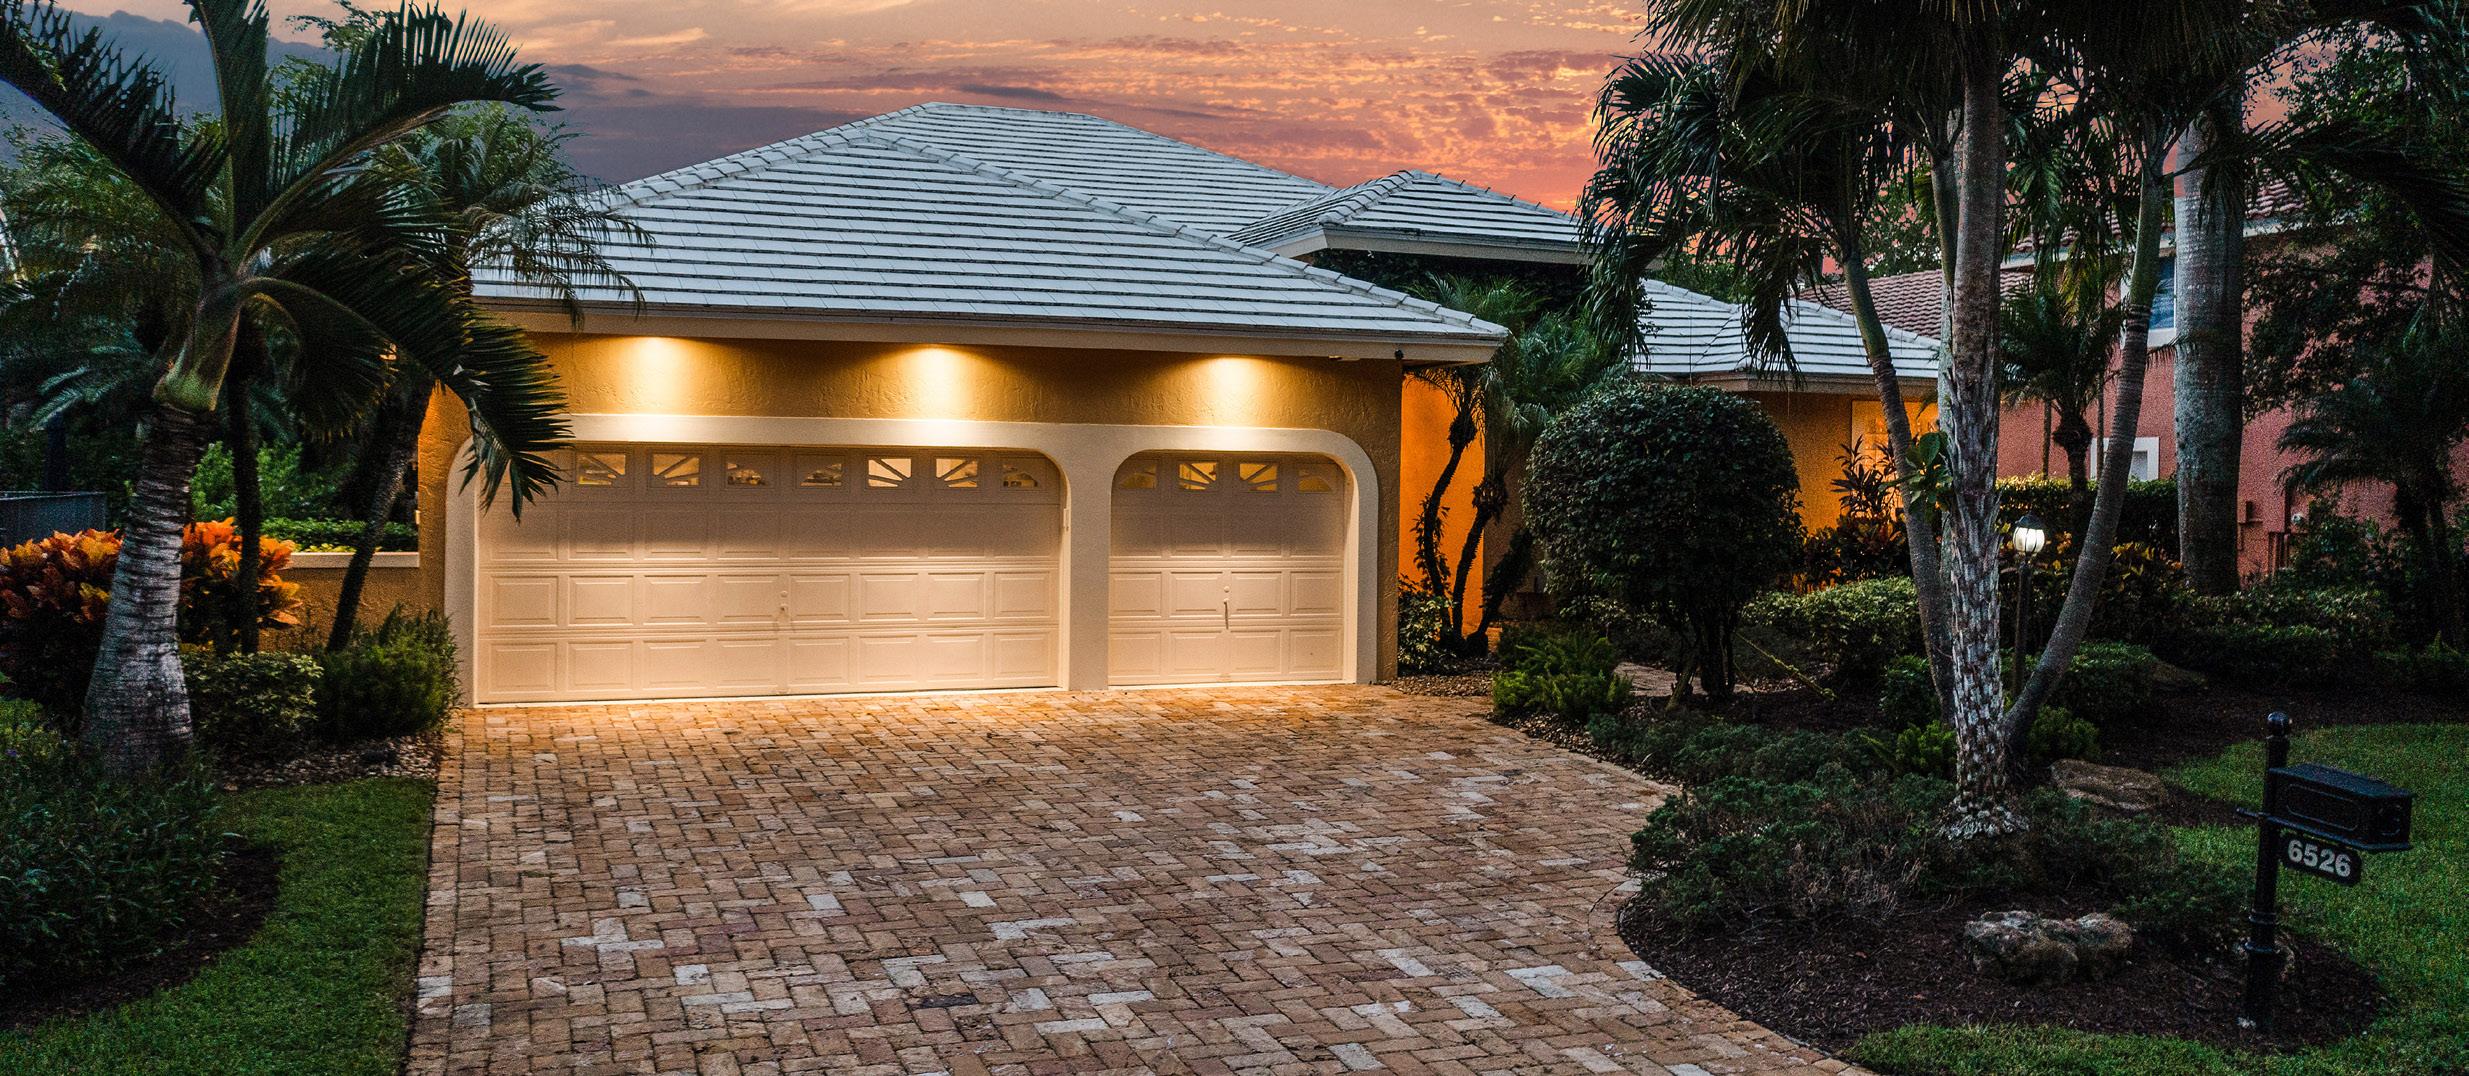
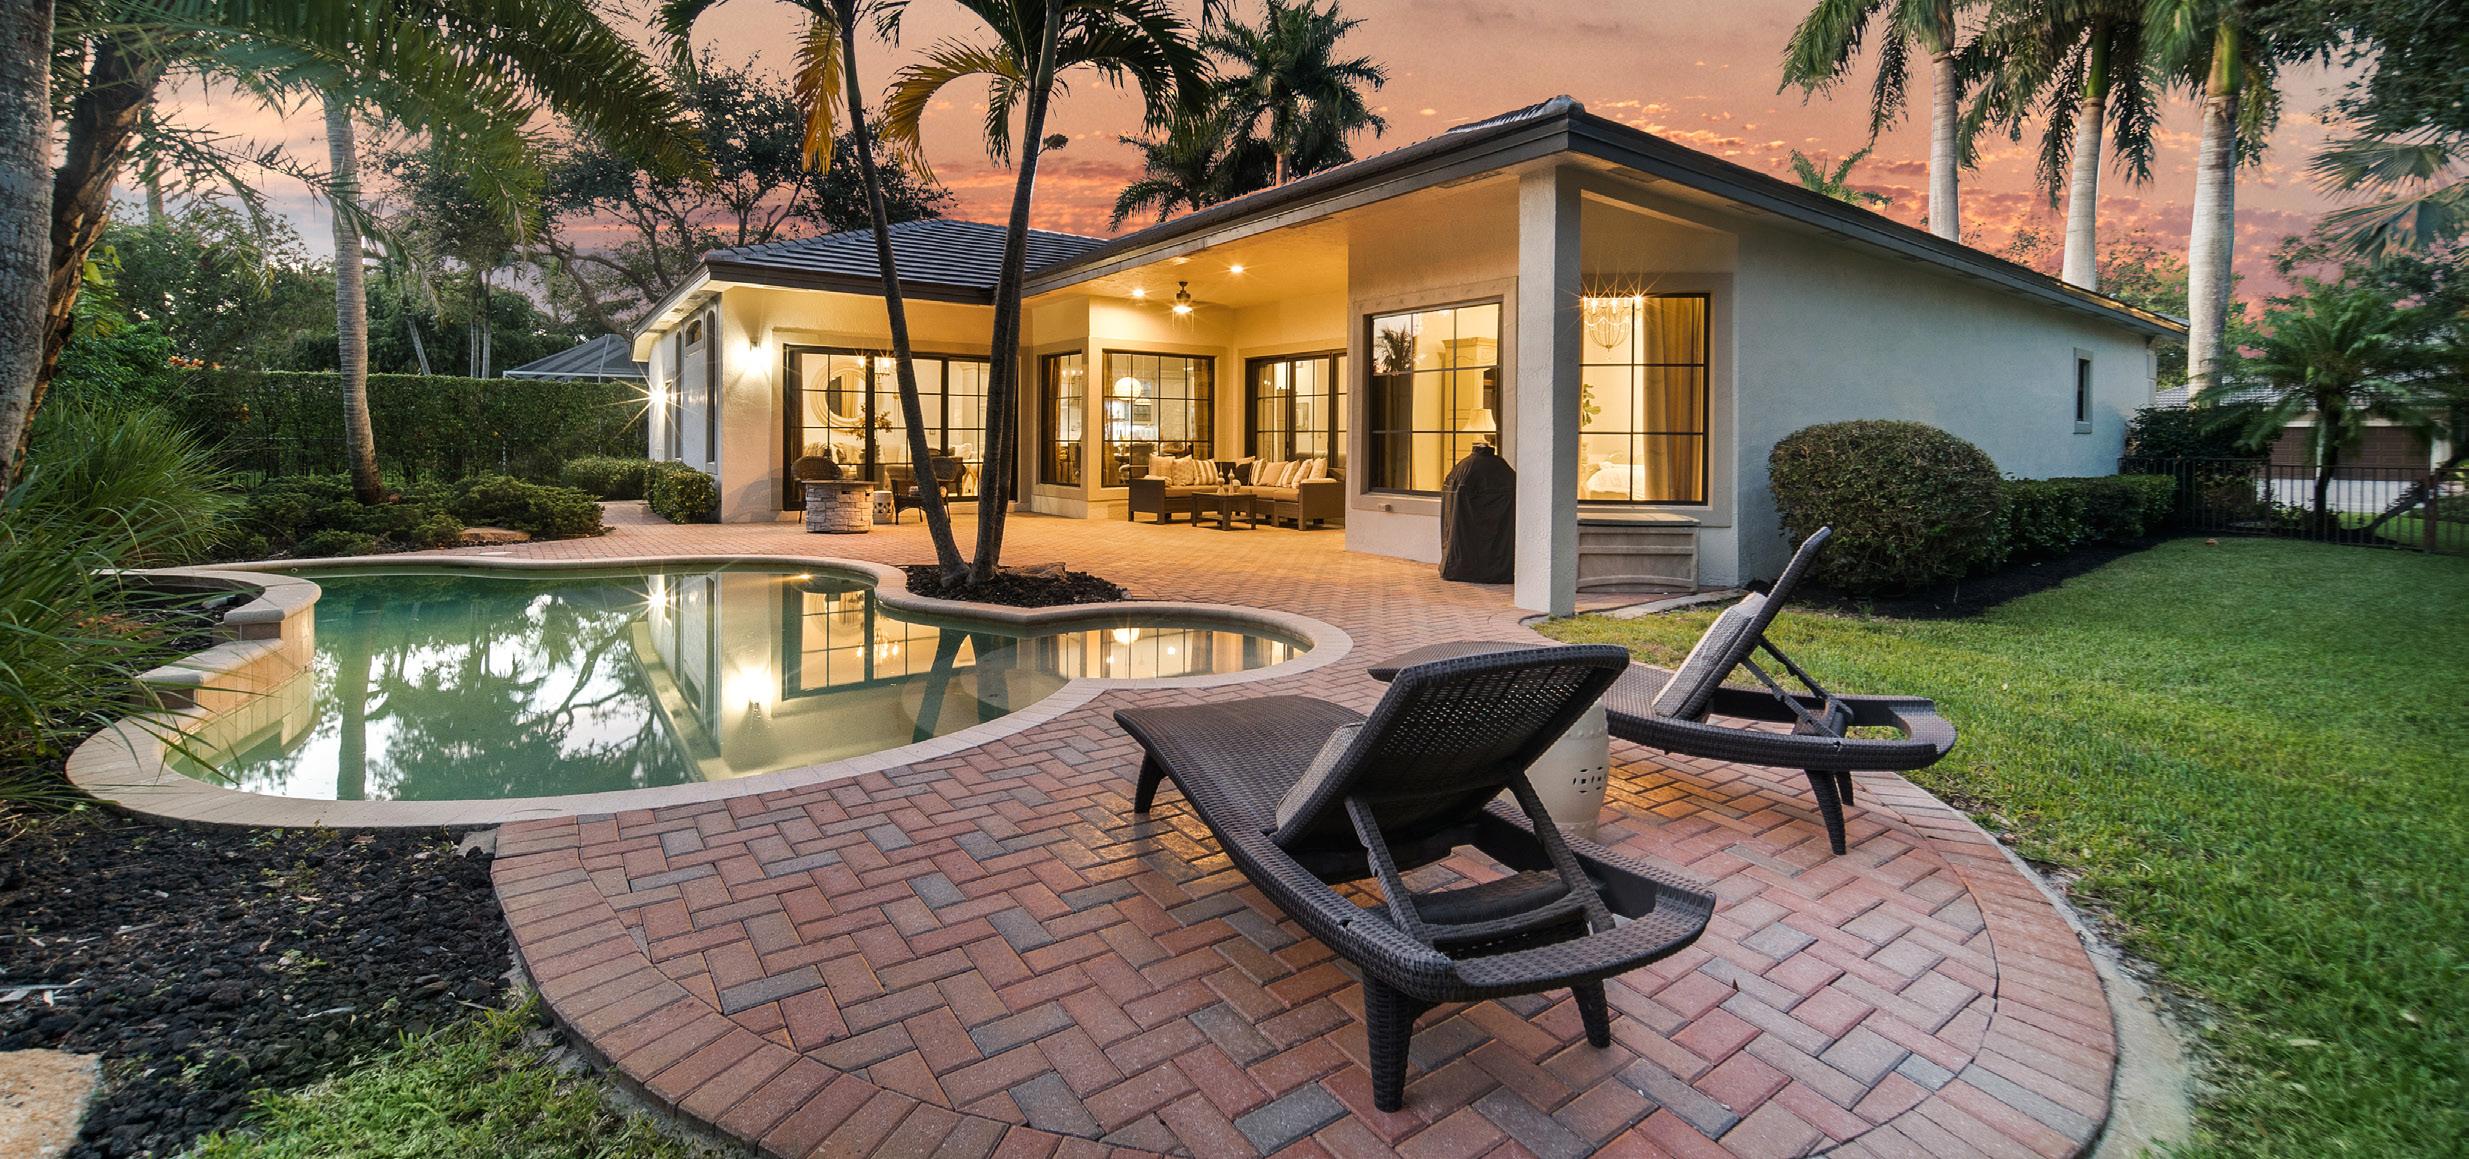
Under Contract | Listed at $1,294,900 Sold For $875,000 | Represented Seller 6733 NW 105th Lane 6526 NW 99th Lane | Meadow Run Pool 4 Full Baths 5 Beds
for Get Your Free Home Evaluation Today Visit www.LIVEINFoxRidge.com
Exclusively
FOX RIDGE APRIL 2023 MARKET REPORT *Data shown for the sales in Fox Ridge is based on the MLS as of April 21, 2023 and is deemed to be reliable but should be verified. 2022 & 2023 2021 & 2022 NUMBER OF HOMES SOLD 2021-2022 to 2022-2023 Comparison MEDIAN SALES PRICE 2021-2022 to 2022-2023 Comparison $1,200,000 $1,100,000 $1,000,000 $900,000 $800,000 $700,000 $600,000 $500,000 $400,000 $300,000 $200,000 $100,000 0 DEC JAN FEB MAR 7 6 5 4 3 2 1 0 DEC JAN FEB MAR SINGLE FAMILY MARKET REPORT ACTIVE LISTINGS PRICE REDUCTIONS PENDING SALES SOLD IN PAST 90 DAYS AVERAGE DAYS ON MARKET 0 1/3 3 1 141 MEDIAN SALES PRICE $835,000 $300,000 Custom Upgrades