


Presented by Michael Citron Prepared Exclusively for APRIL 2023 Edition CYPRESS HEAD #1 PARKLAND REAL ESTATE TEAM 7 YEARS IN A ROW REAL ESTATE MARKET REPORT 6821 N Woodridge Dr FULL DETAILS INSIDE JUST LISTED www. LIVEIN CypressHead.com Permit # 3018 11555 Heron Bay Blvd. Suite 200 Coral Springs FL, 33076 954.609.0591 Michael@ParklandParrot.com 1 10 Our Team Leads Parkland in Sales, with 15 sold of 110 sales in 2023 These Statistics Reflect The Data from BeachesMLS as of April 24, 2023 From Parkland Single Family Sales & Non 55+ Communities Our Current List to Sales Price ratio Median Days on Market OUT OF MORE THAN 14% 102% 12 www. LIVEIN Cypresshead.com APRIL 2023 Edition Sold Their Parkland Homes with Us
Cypress Head Market Review
Presented By Michael Citron

Total Homes Sold
We’re past the first quarter of the year and the market is certainly hot! We’re seeing quite a bit of action in Cypress Head with 7 active listings and 3 sales pending and 5 sold in the past 90 days
Average Days On Market


Cypress Head is home to some of the most unique homes in Parkland which is why the average days on market typically tend to be higher than the rest of our city. These custom homes with large lots and gated community and amenities come at a cost!


Median Sales Price
The values of Cypress Head remain at record highs since last year. Those who purchased 2-3 years ago have certainly gained lots of equity in their home. If you’re looking to cash out and leverage those gains then now may be a good time to sell your home.

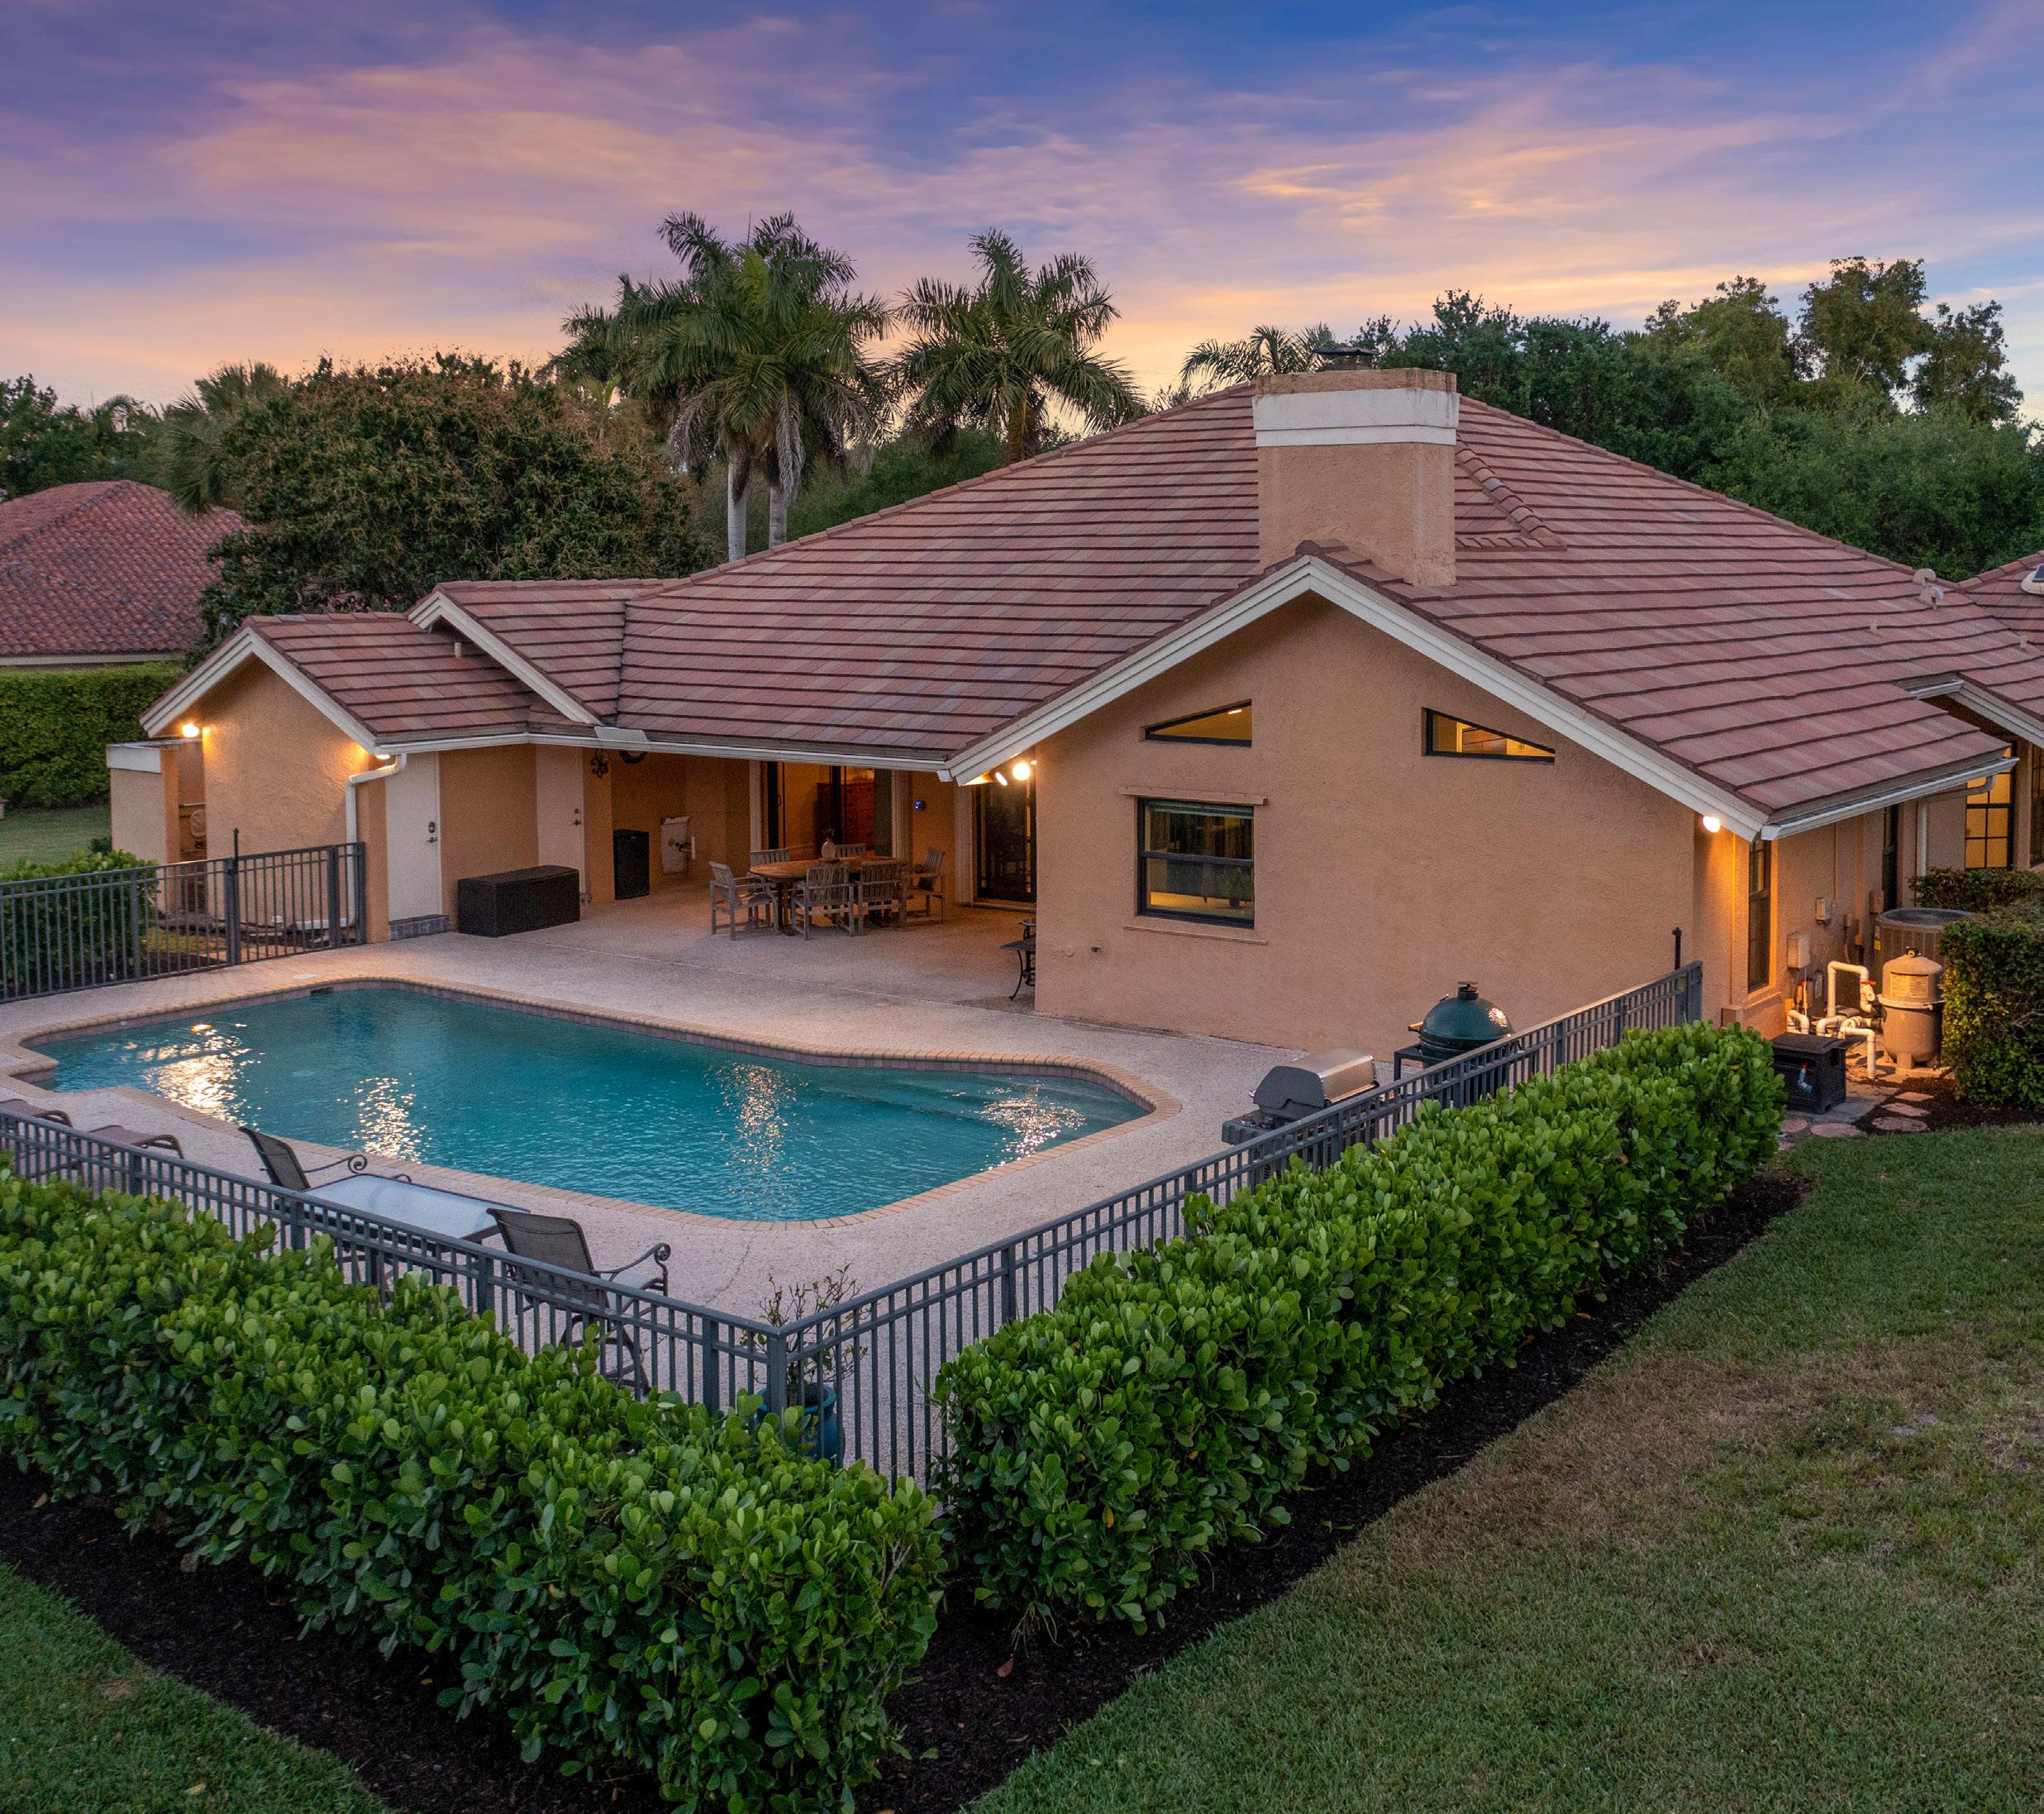
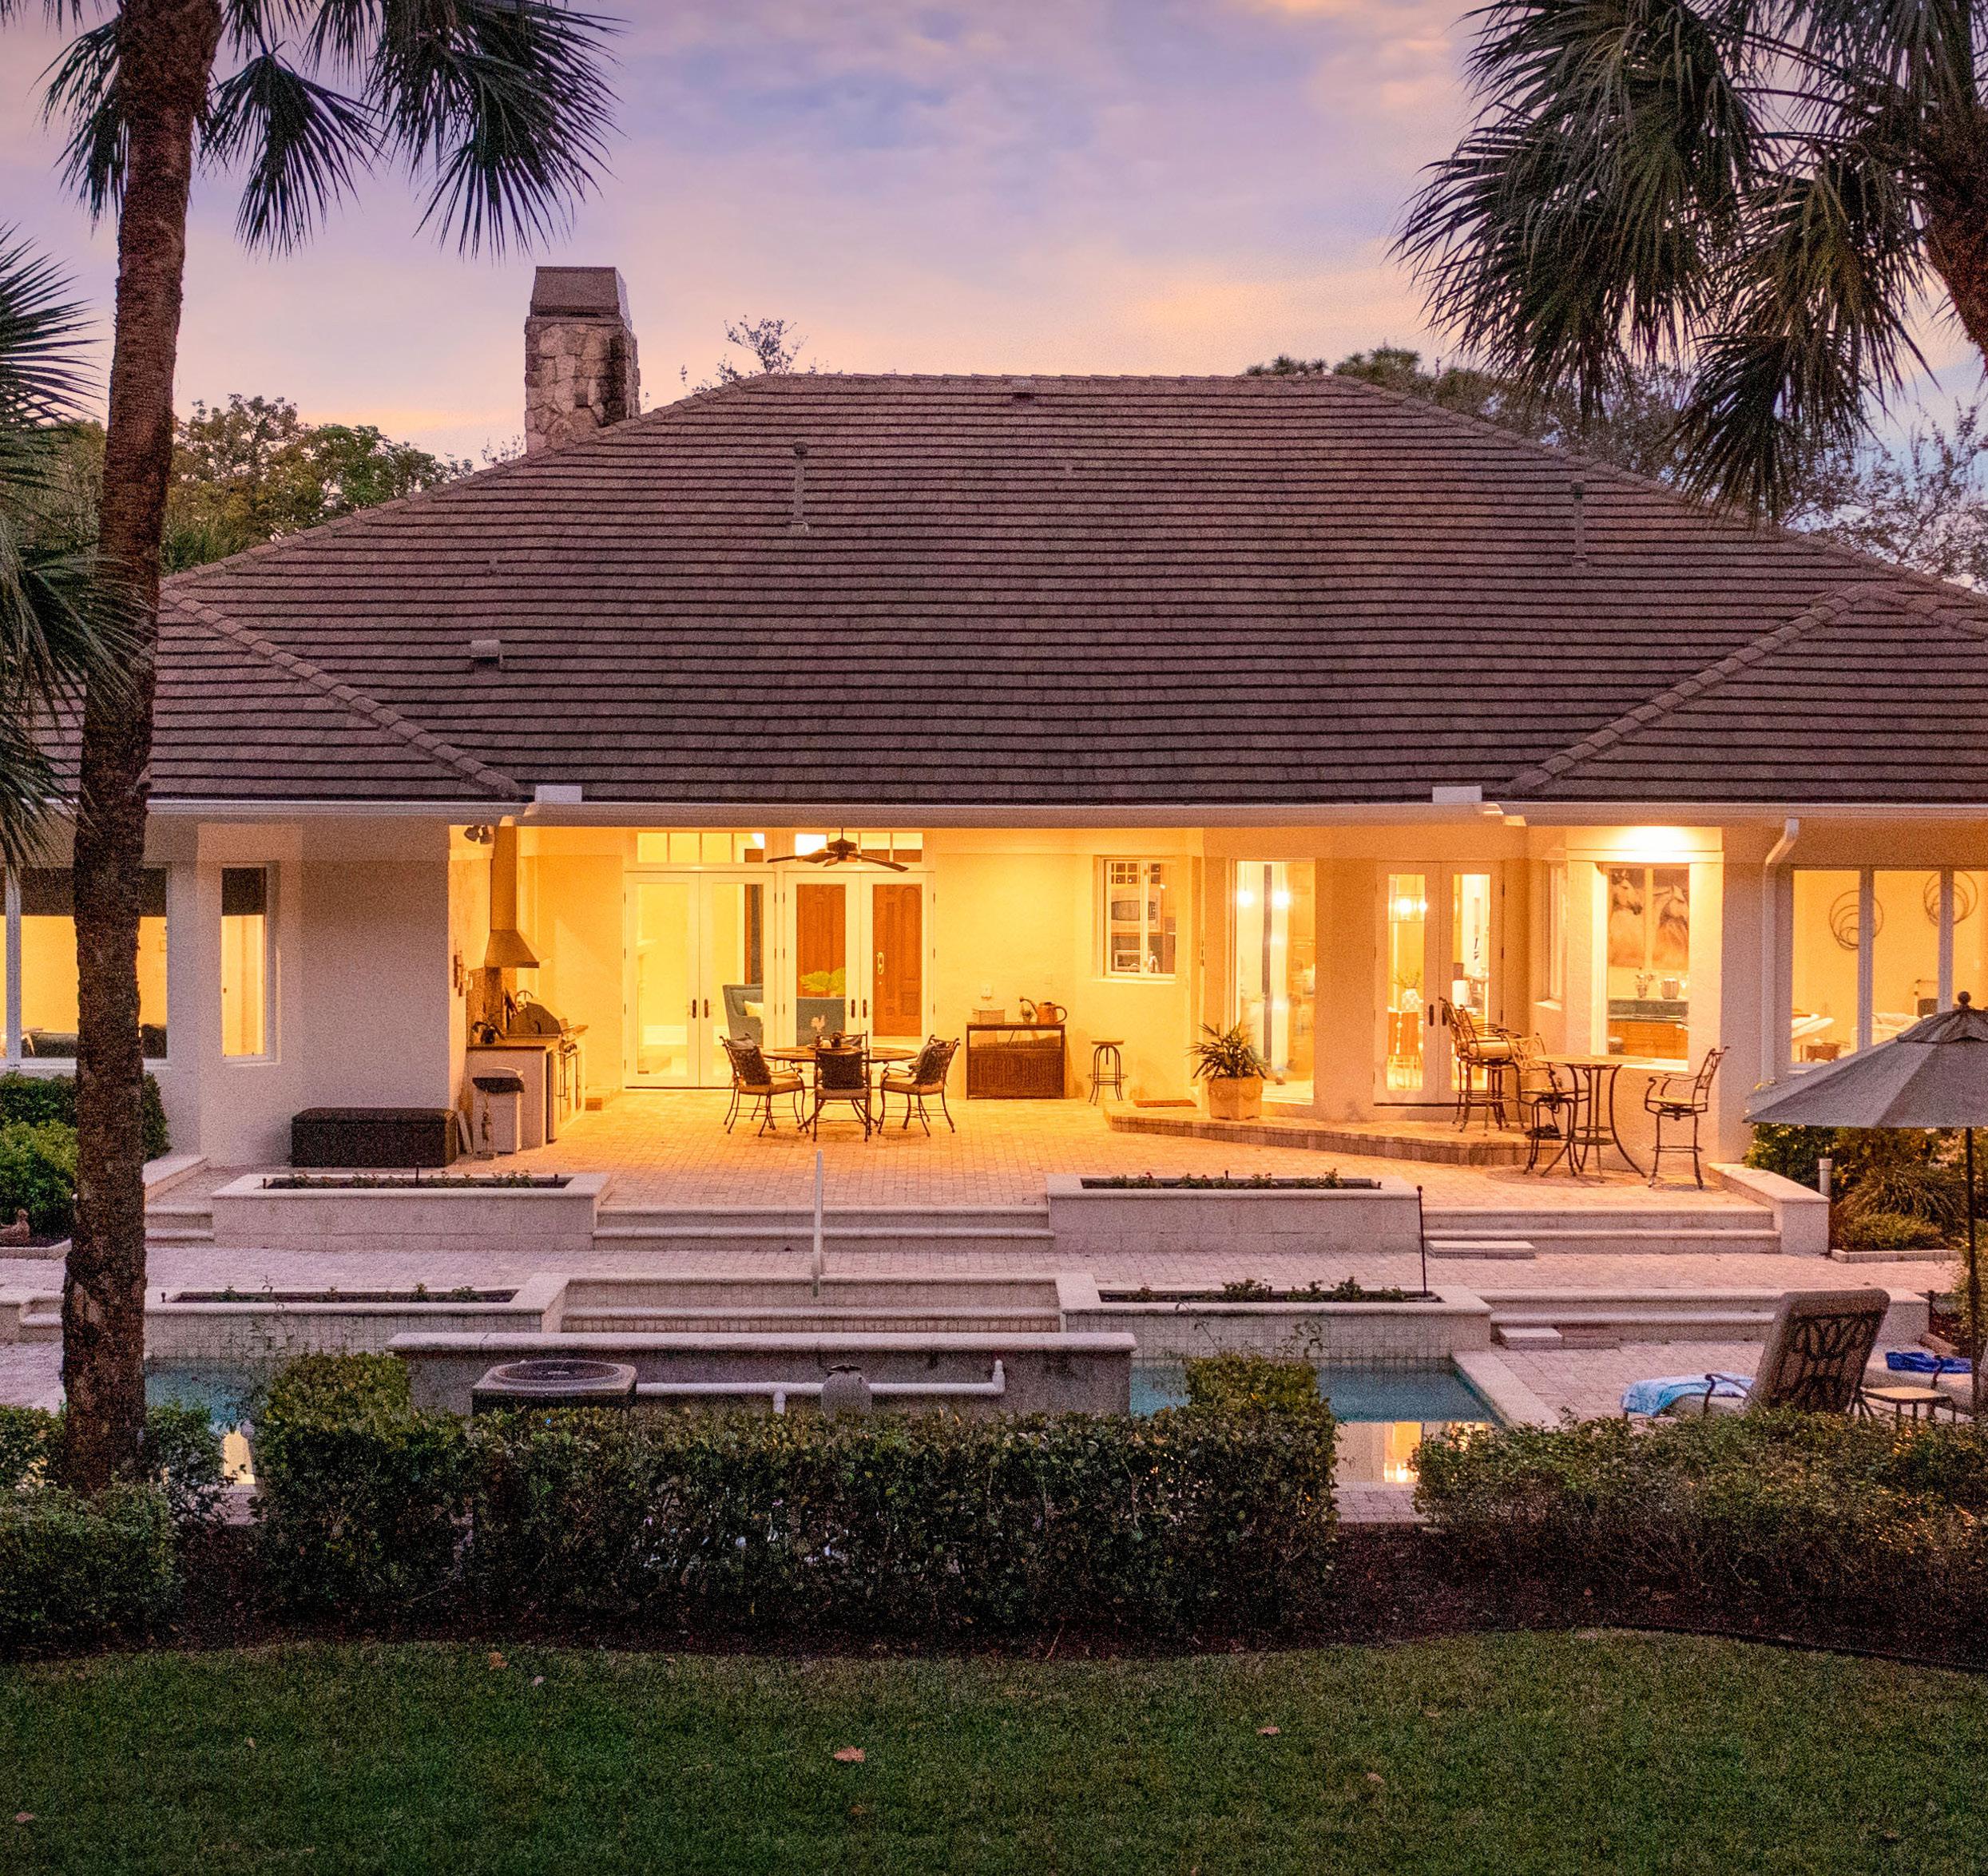
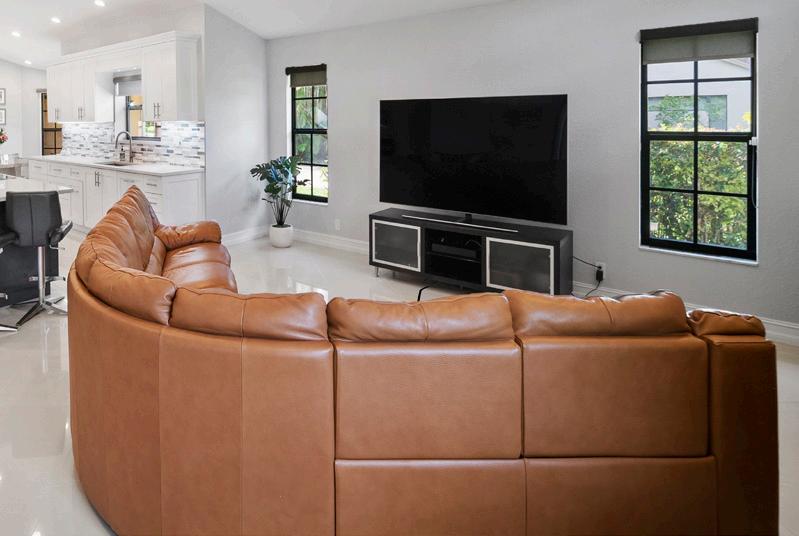
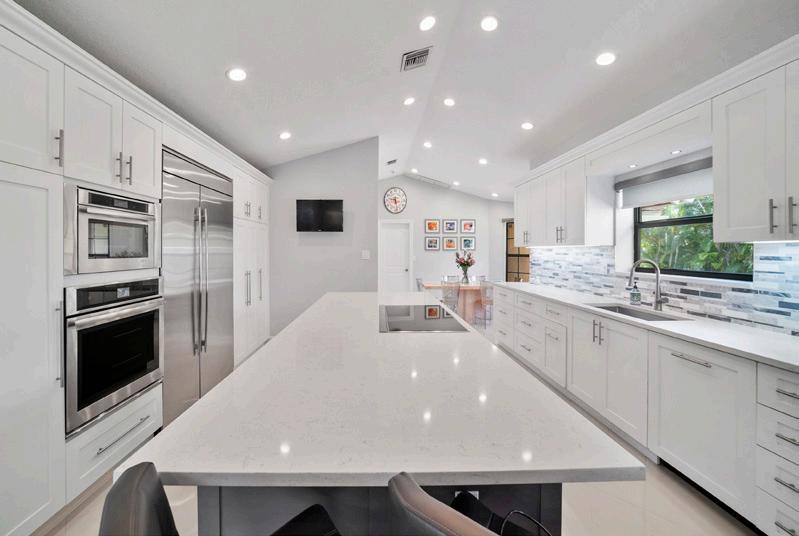
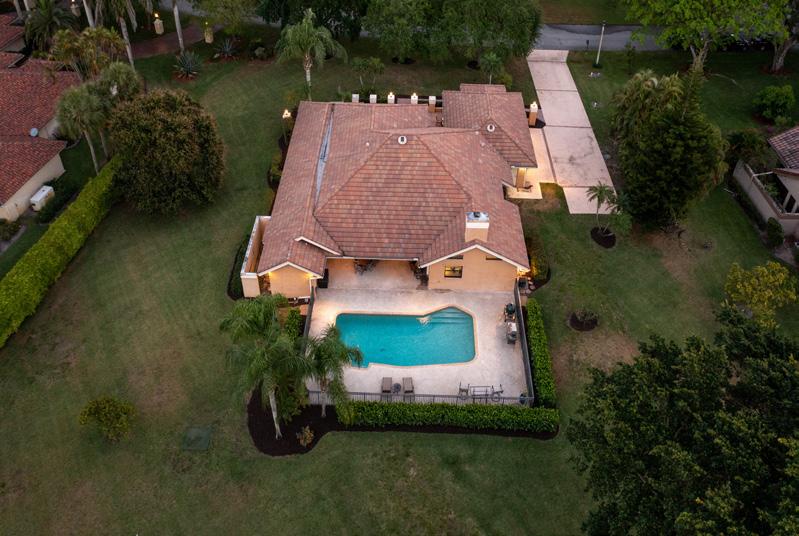
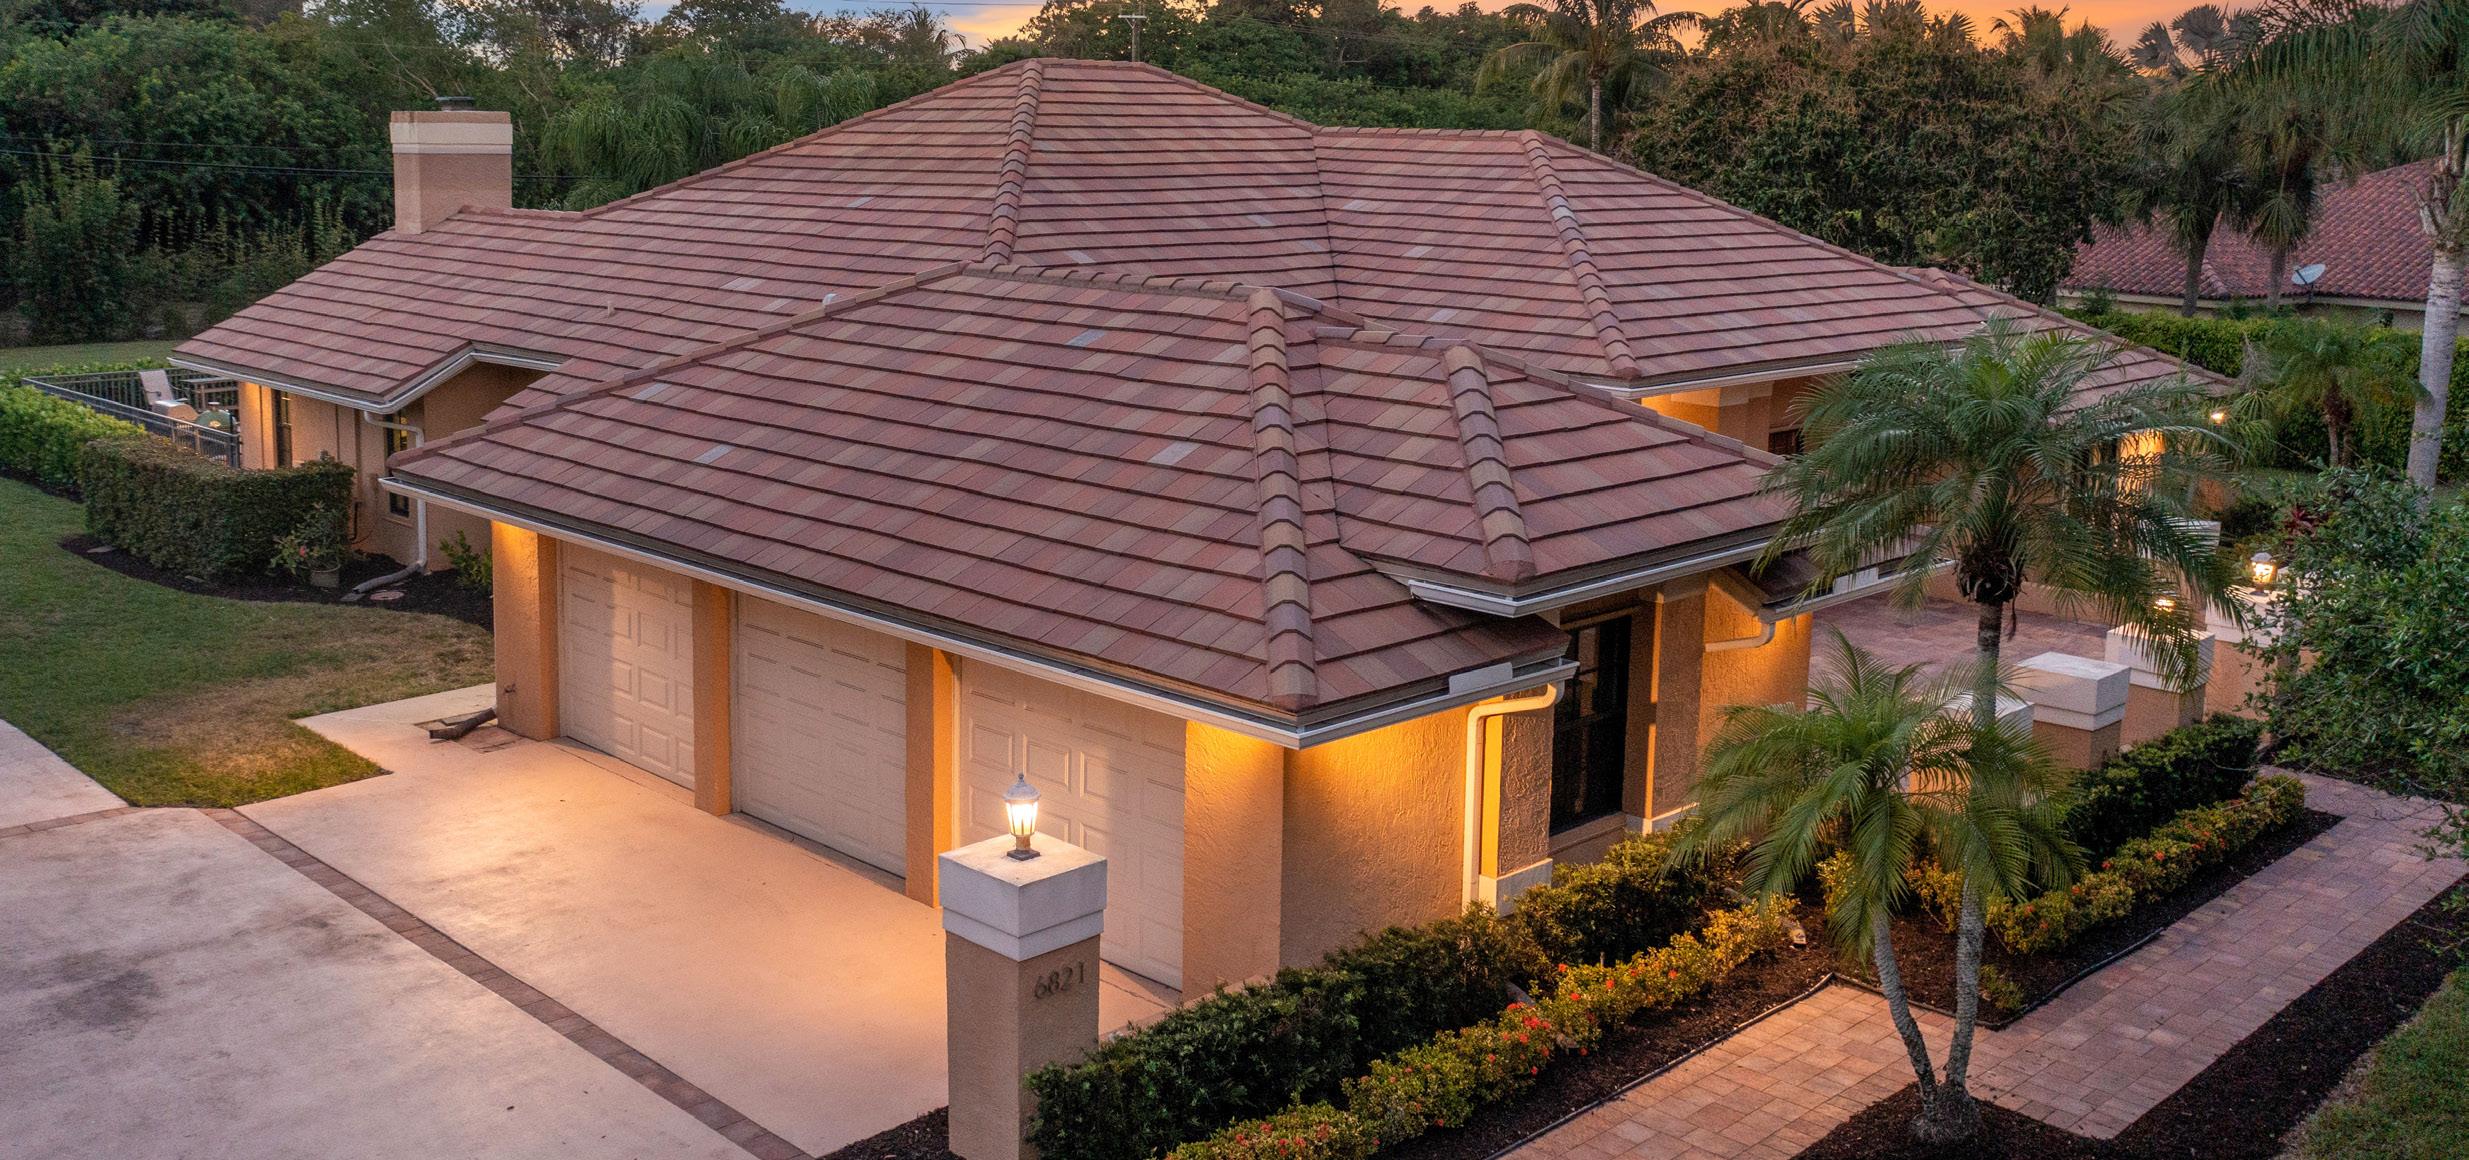
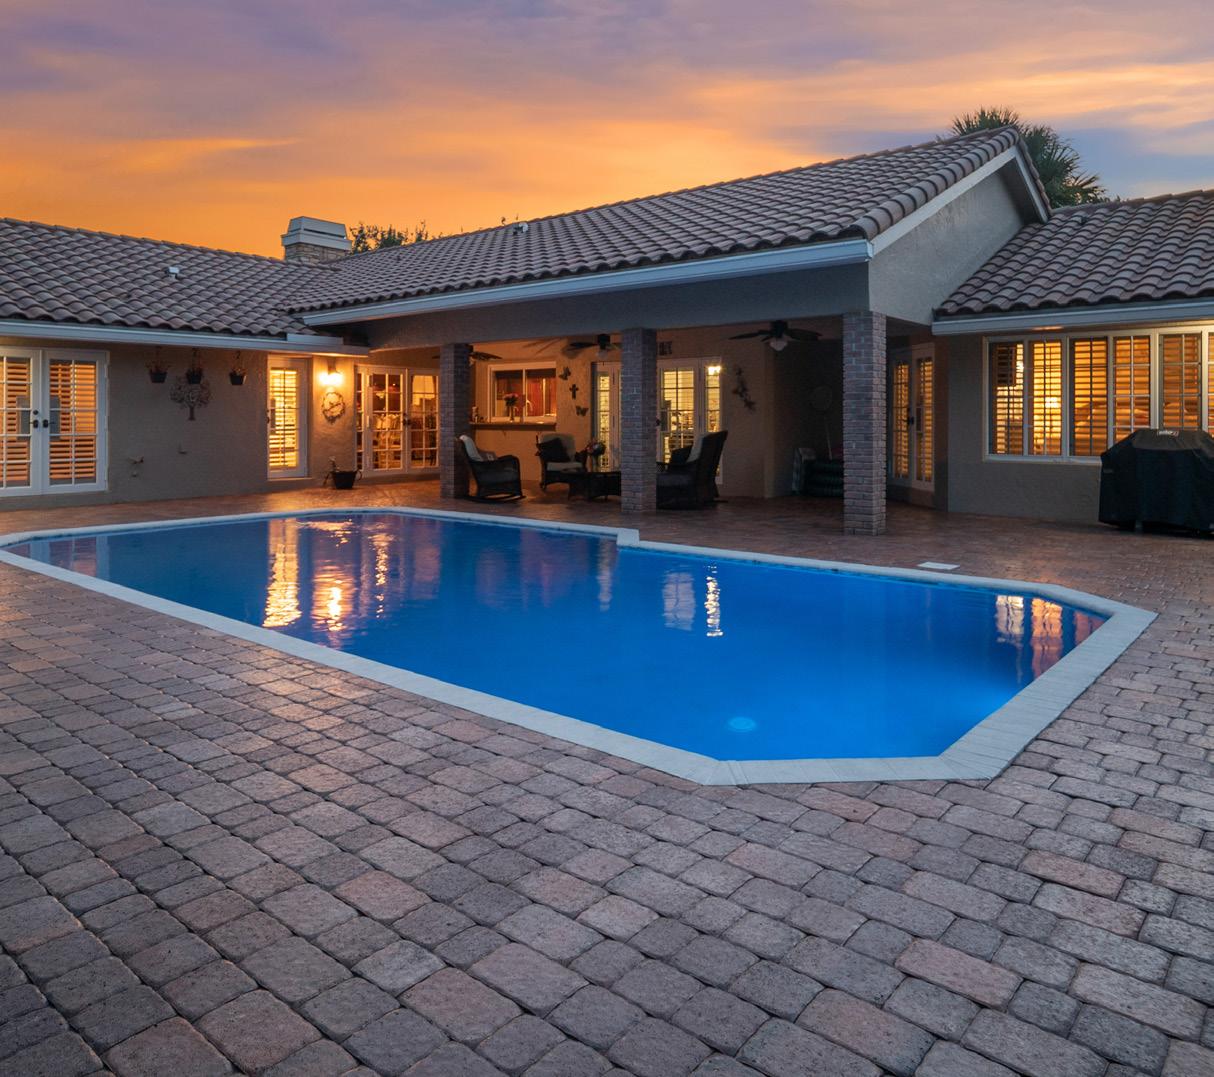
Sold For $1,200,000 | Represented Seller Sold For $1,149,900 | Represented Seller 6720 Yellowstone Lane 7320 Dover Court Just Listed | Listed at $1,374,900 6821 N Woodridge Drive 3.5 Baths 5 Beds Pool Custom Updgrades
Exclusively for Get Your Free Home Evaluation Today Visit www.LIVEINCypressHead.com
Prepared
CYPRESS HEAD APRIL 2023 MARKET REPORT * Data shown for the sales in Cypress Head is based on the MLS as of April 13, 2023 and is deemed to be reliable but should be verified. 2022 & 2023 2021 & 2022 NUMBER OF HOMES SOLD 2021-2022 to 2022-2023 Comparison MEDIAN SALES PRICE 2021-2022 to 2022-2023 Comparison $1,800,000 $1,650,000 $1,500,000 $1,350,000 $1,200,000 $1,050,000 $900,000 $750,000 $600,000 $450,000 $300,000 $150,000 0 DEC JAN FEB MAR 7 6 5 4 3 2 1 0 DEC JAN FEB MAR ACTIVE LISTINGS PRICE REDUCTIONS PENDING SALES SOLD IN PAST 90 DAYS AVERAGE DAYS ON MARKET 7 4/10 3 5 95 MEDIAN SALES PRICE $1,432,500 SINGLE FAMILY MARKET REPORT