


Presented by Michael Citron Prepared Exclusively for APRIL 2023 Edition COUNTRY’S POINT #1 PARKLAND REAL ESTATE TEAM 7 YEARS IN A ROW REAL ESTATE MARKET REPORT 6821 N Woodridge Dr FULL DETAILS INSIDE JUST LISTED IN CYPRESS HEAD www. LIVEIN CountrysPoint.com Permit # 3018 11555 Heron Bay Blvd. Suite 200 Coral Springs FL, 33076 954.609.0591 Michael@ParklandParrot.com 1 10 Our Team Leads Parkland in Sales, with 15 sold of 110 sales in 2023 These Statistics Reflect The Data from BeachesMLS as of April 24, 2023 From Parkland Single Family Sales & Non 55+ Communities Our Current List to Sales Price ratio Median Days on Market OUT OF MORE THAN 14% 102% 12 www. LIVEIN CountrysPoint.com APRIL 2023 Edition Sold Their Parkland Homes with Us
Country’s Point Market Review


Presented By Michael Citron
We’re past the first quarter of the year and the market is certainly hot! We’re seeing quite a bit of action in Country’s Point with 3 Active listings and 5 sales pending and 2 sold in the past 90 days.
Total Homes Sold Average Days On Market


Homes move fast in the East Parkland communities especially with Country’s Point with an average of 16 days on market. As the desirability of East Parkland location and gated community and the close proximity to major highways and shopping attracts many buyers.


Median Sales Price
Fluctuation in the Real Estate market is common these days. Last year we saw record prices and this year the median sales price seems to be a little less than that of this time last year. As we head into summer this may change. So if you’re looking to capitalize on some hard earned equity start getting your home ready to sell!

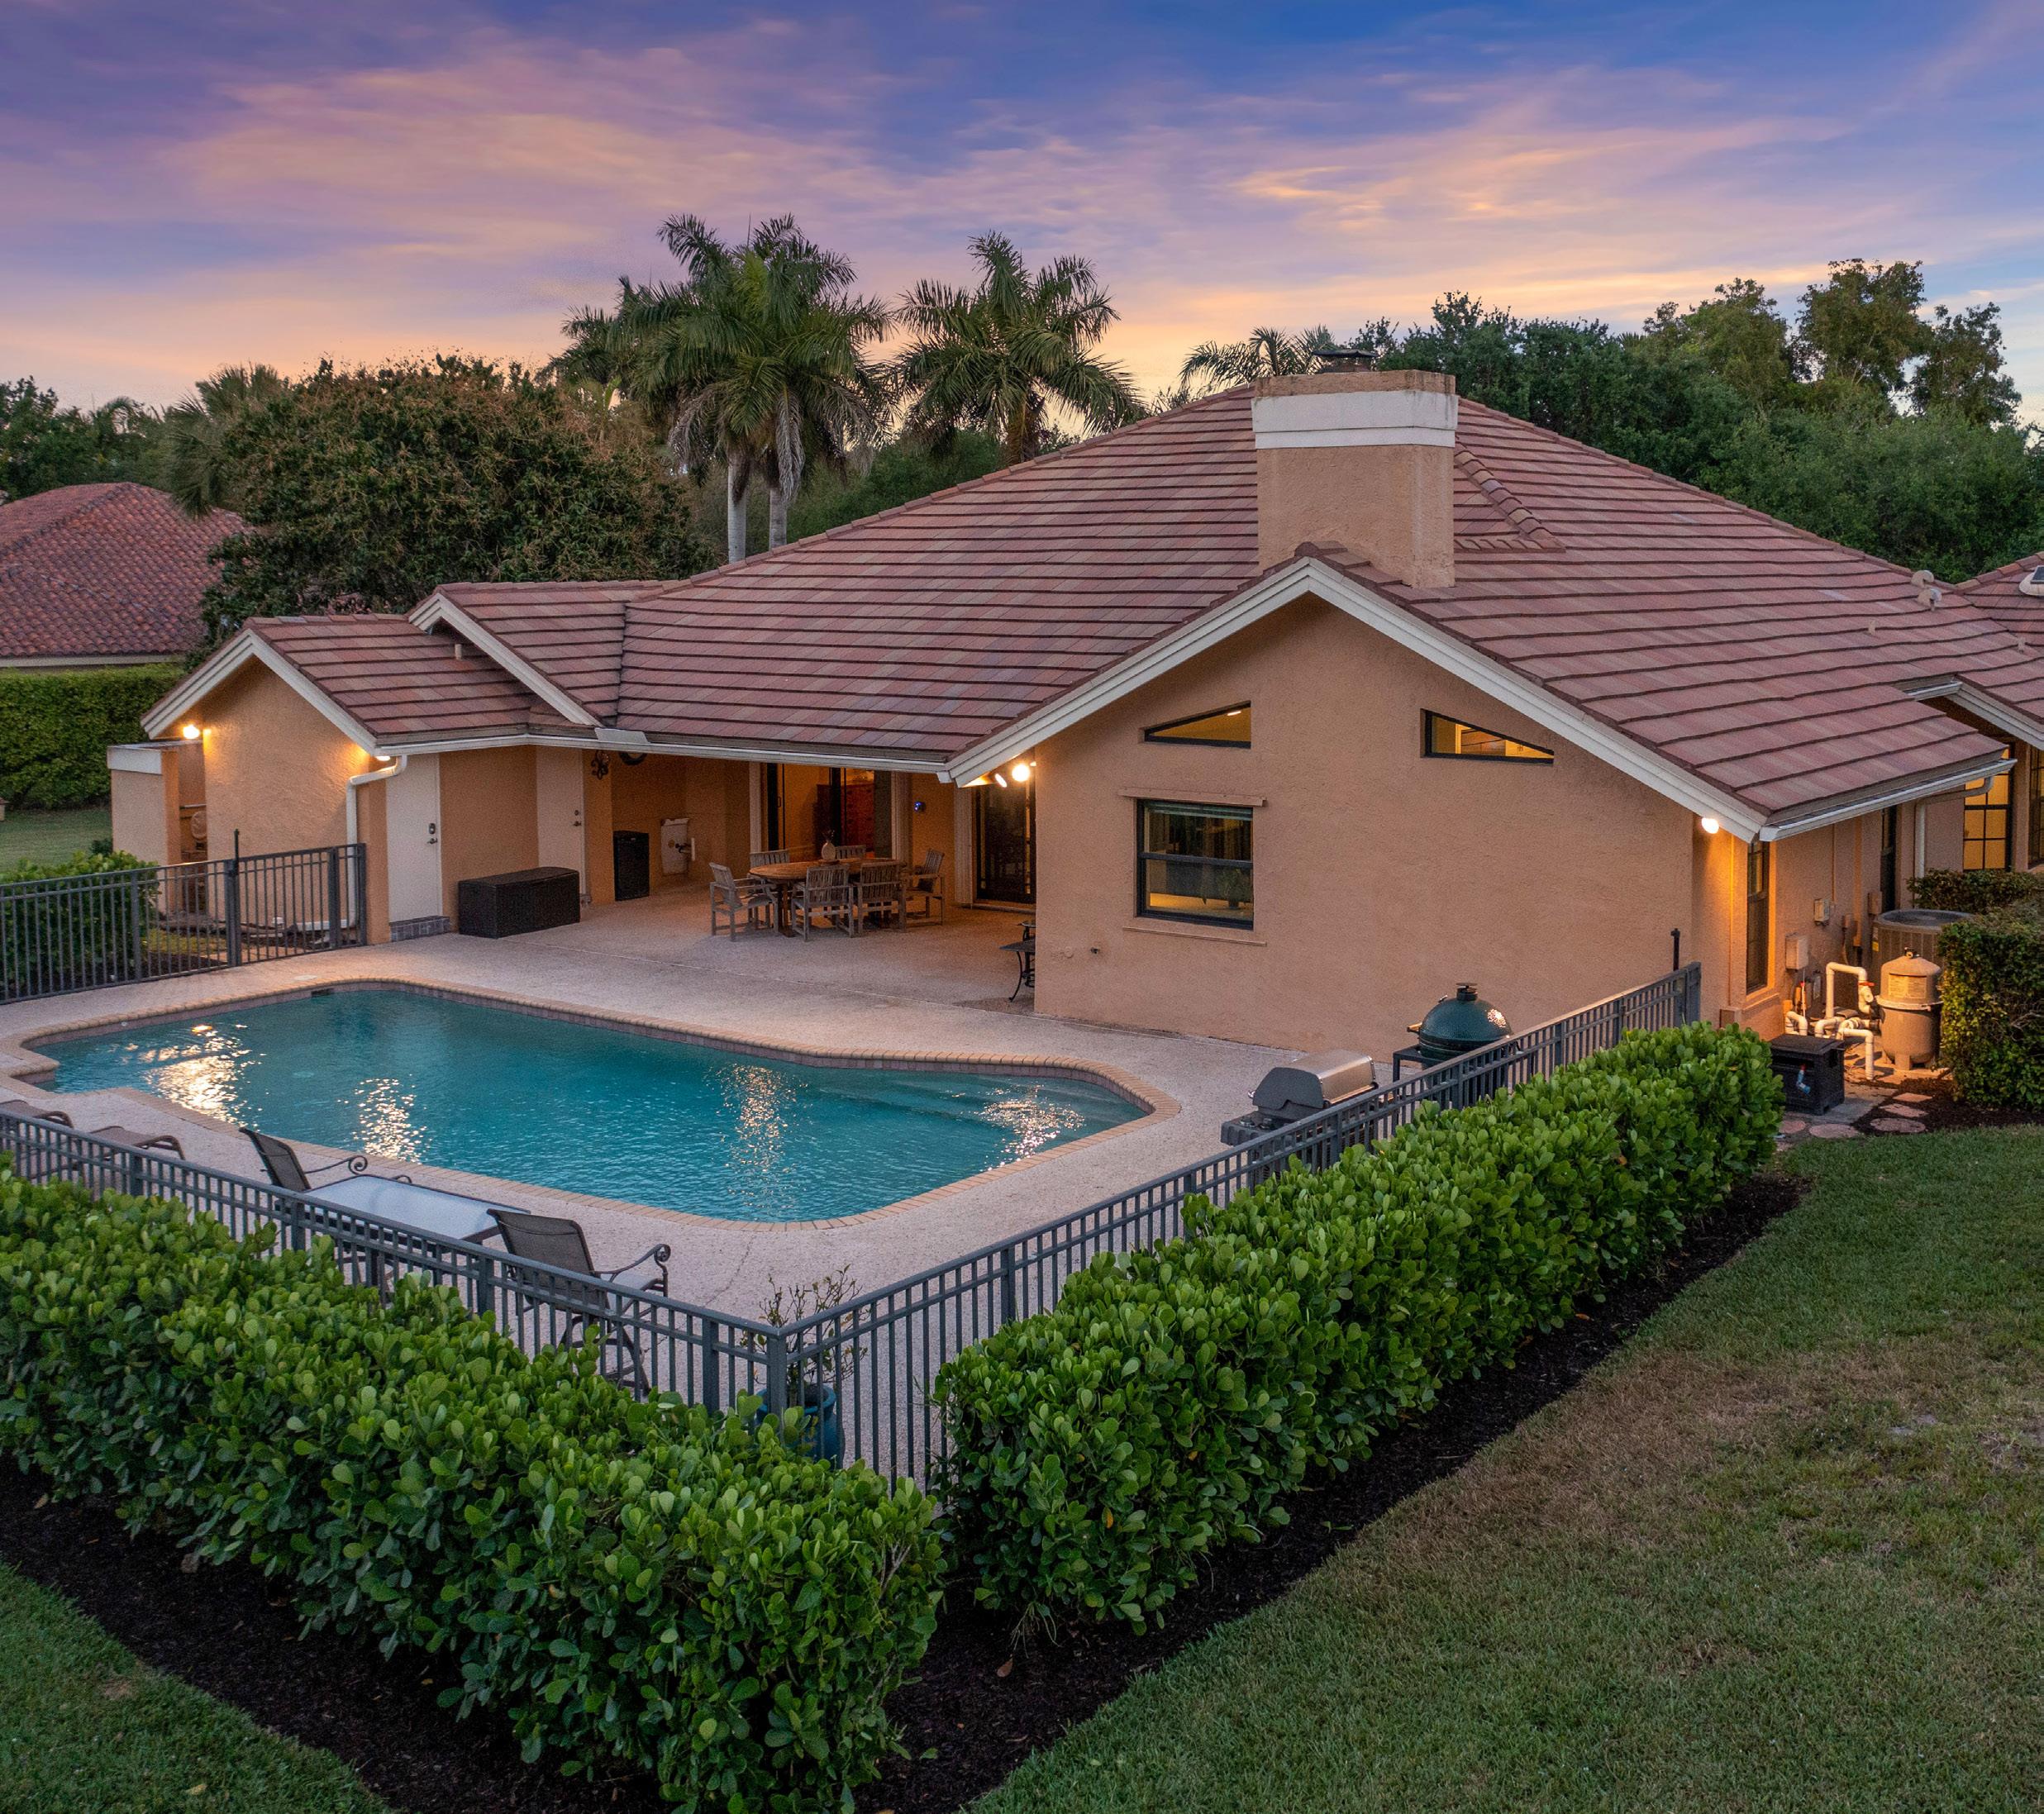
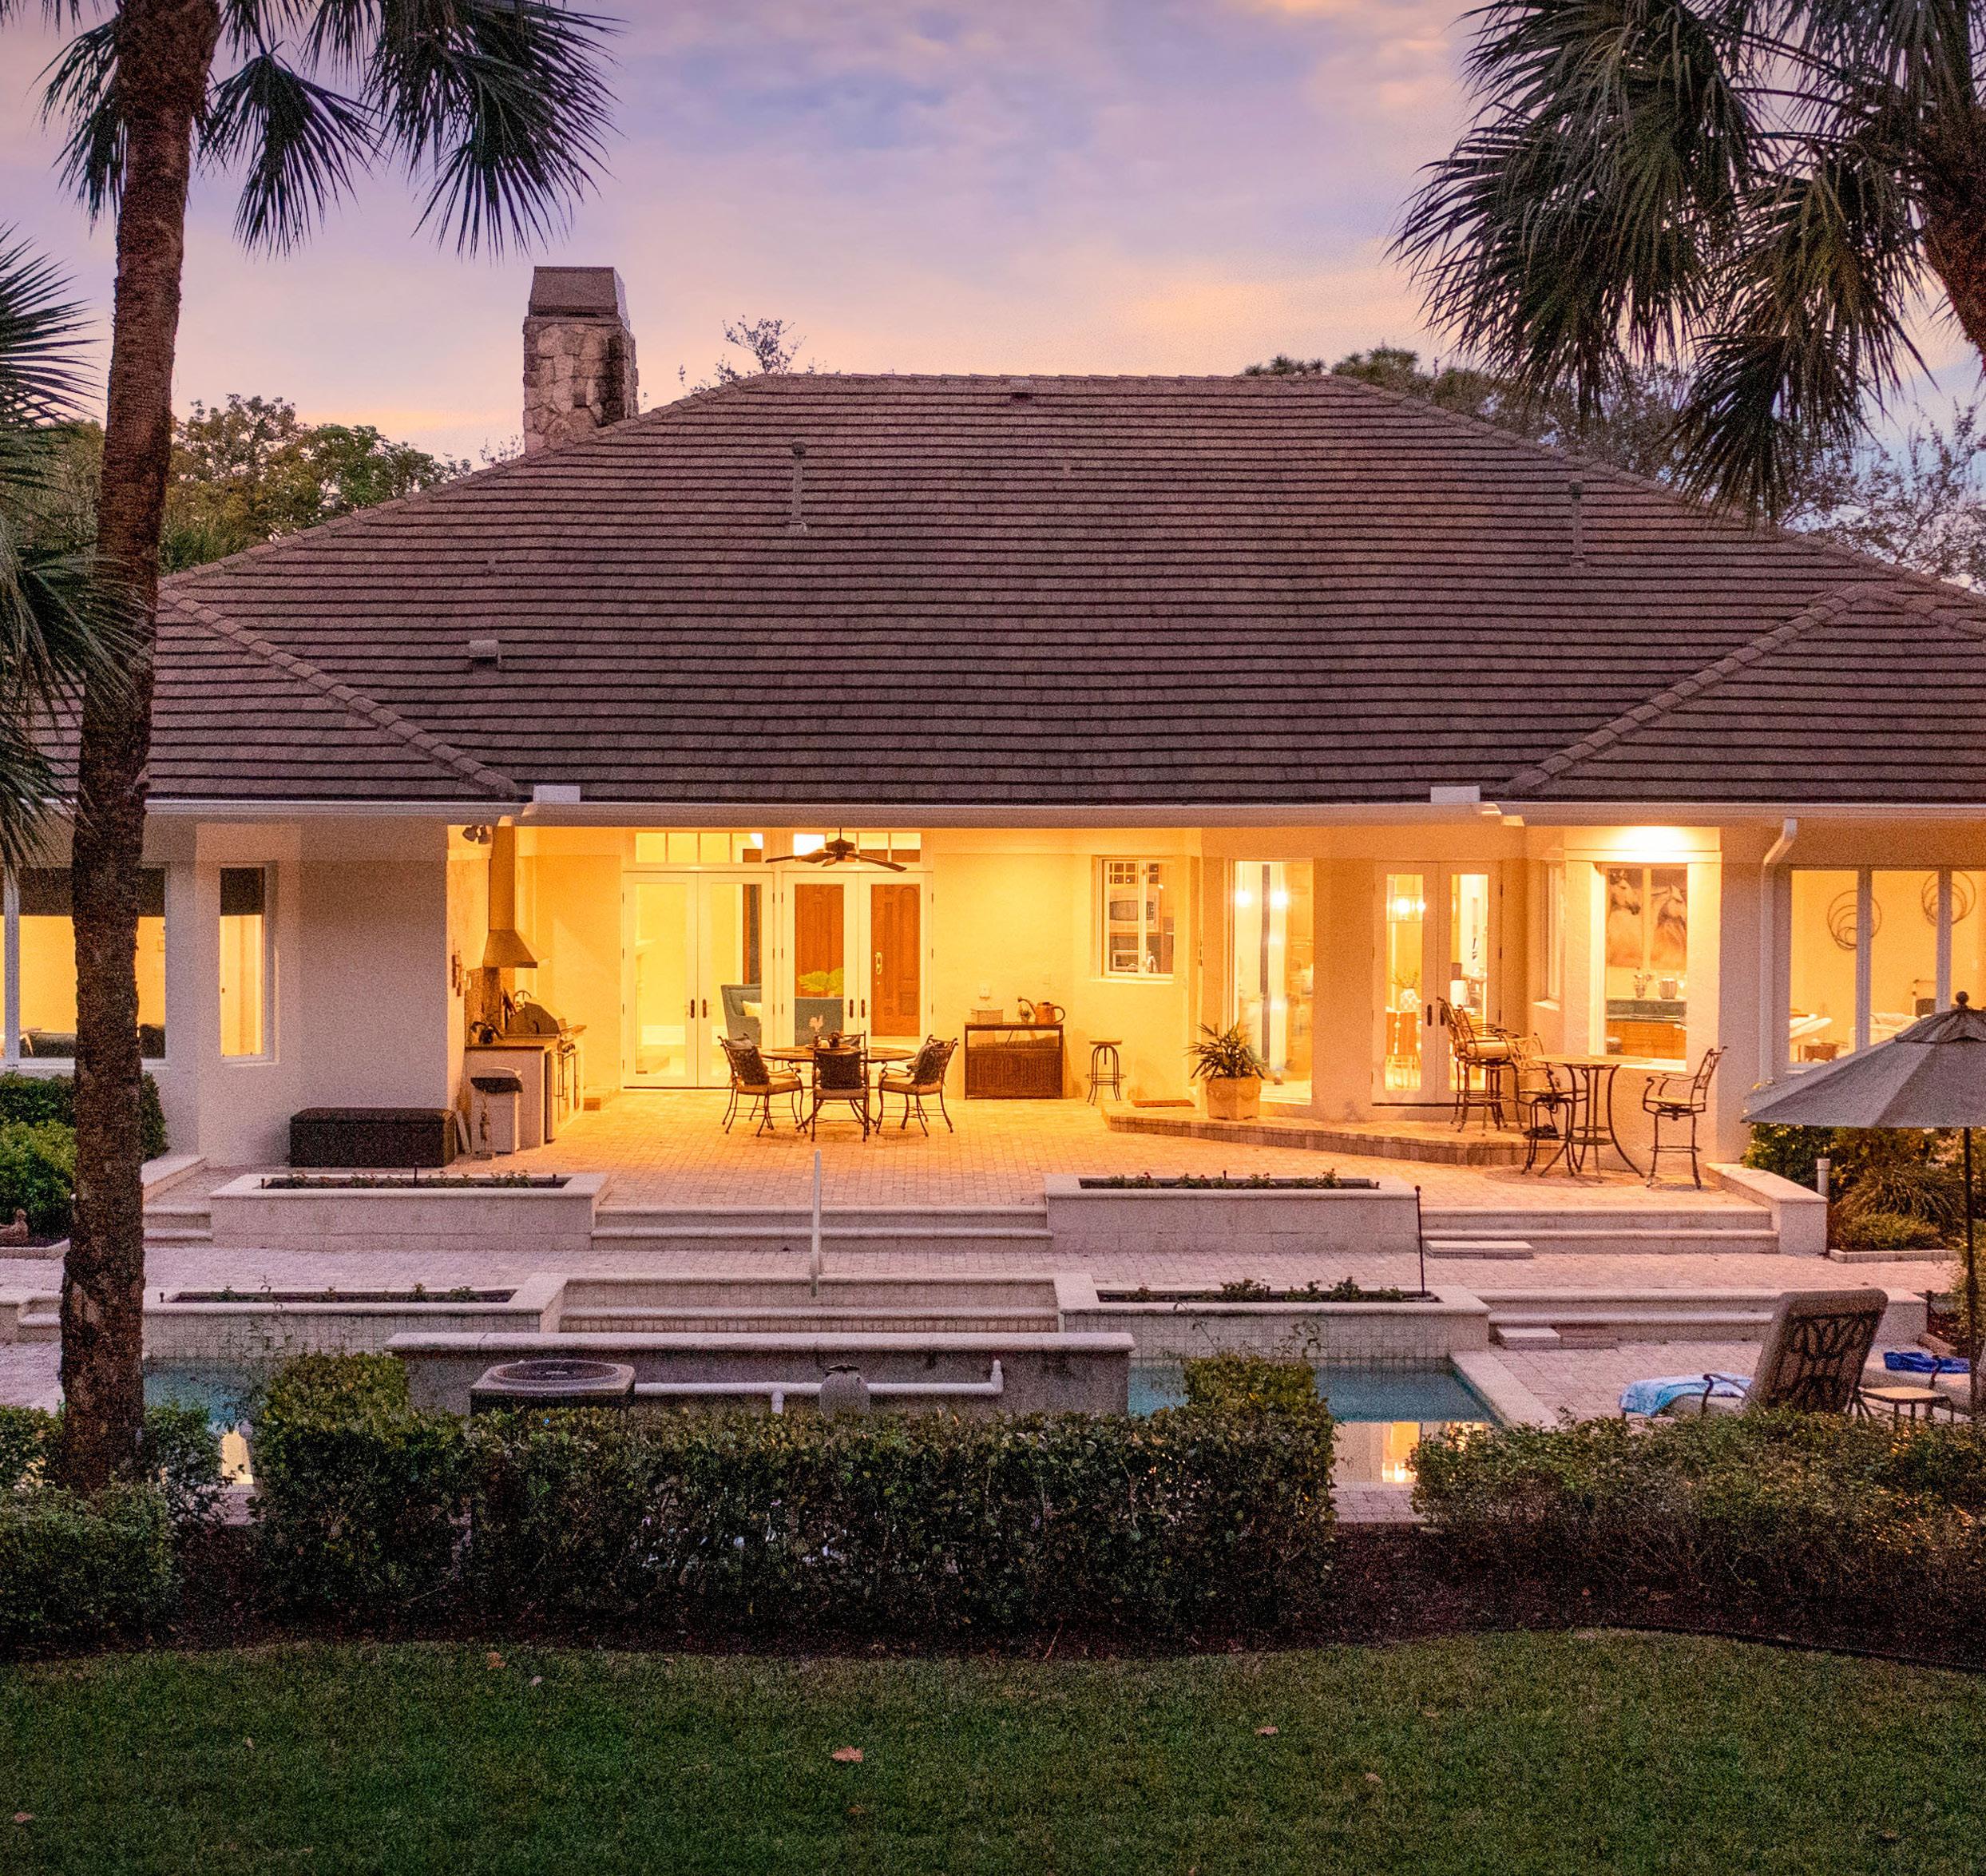
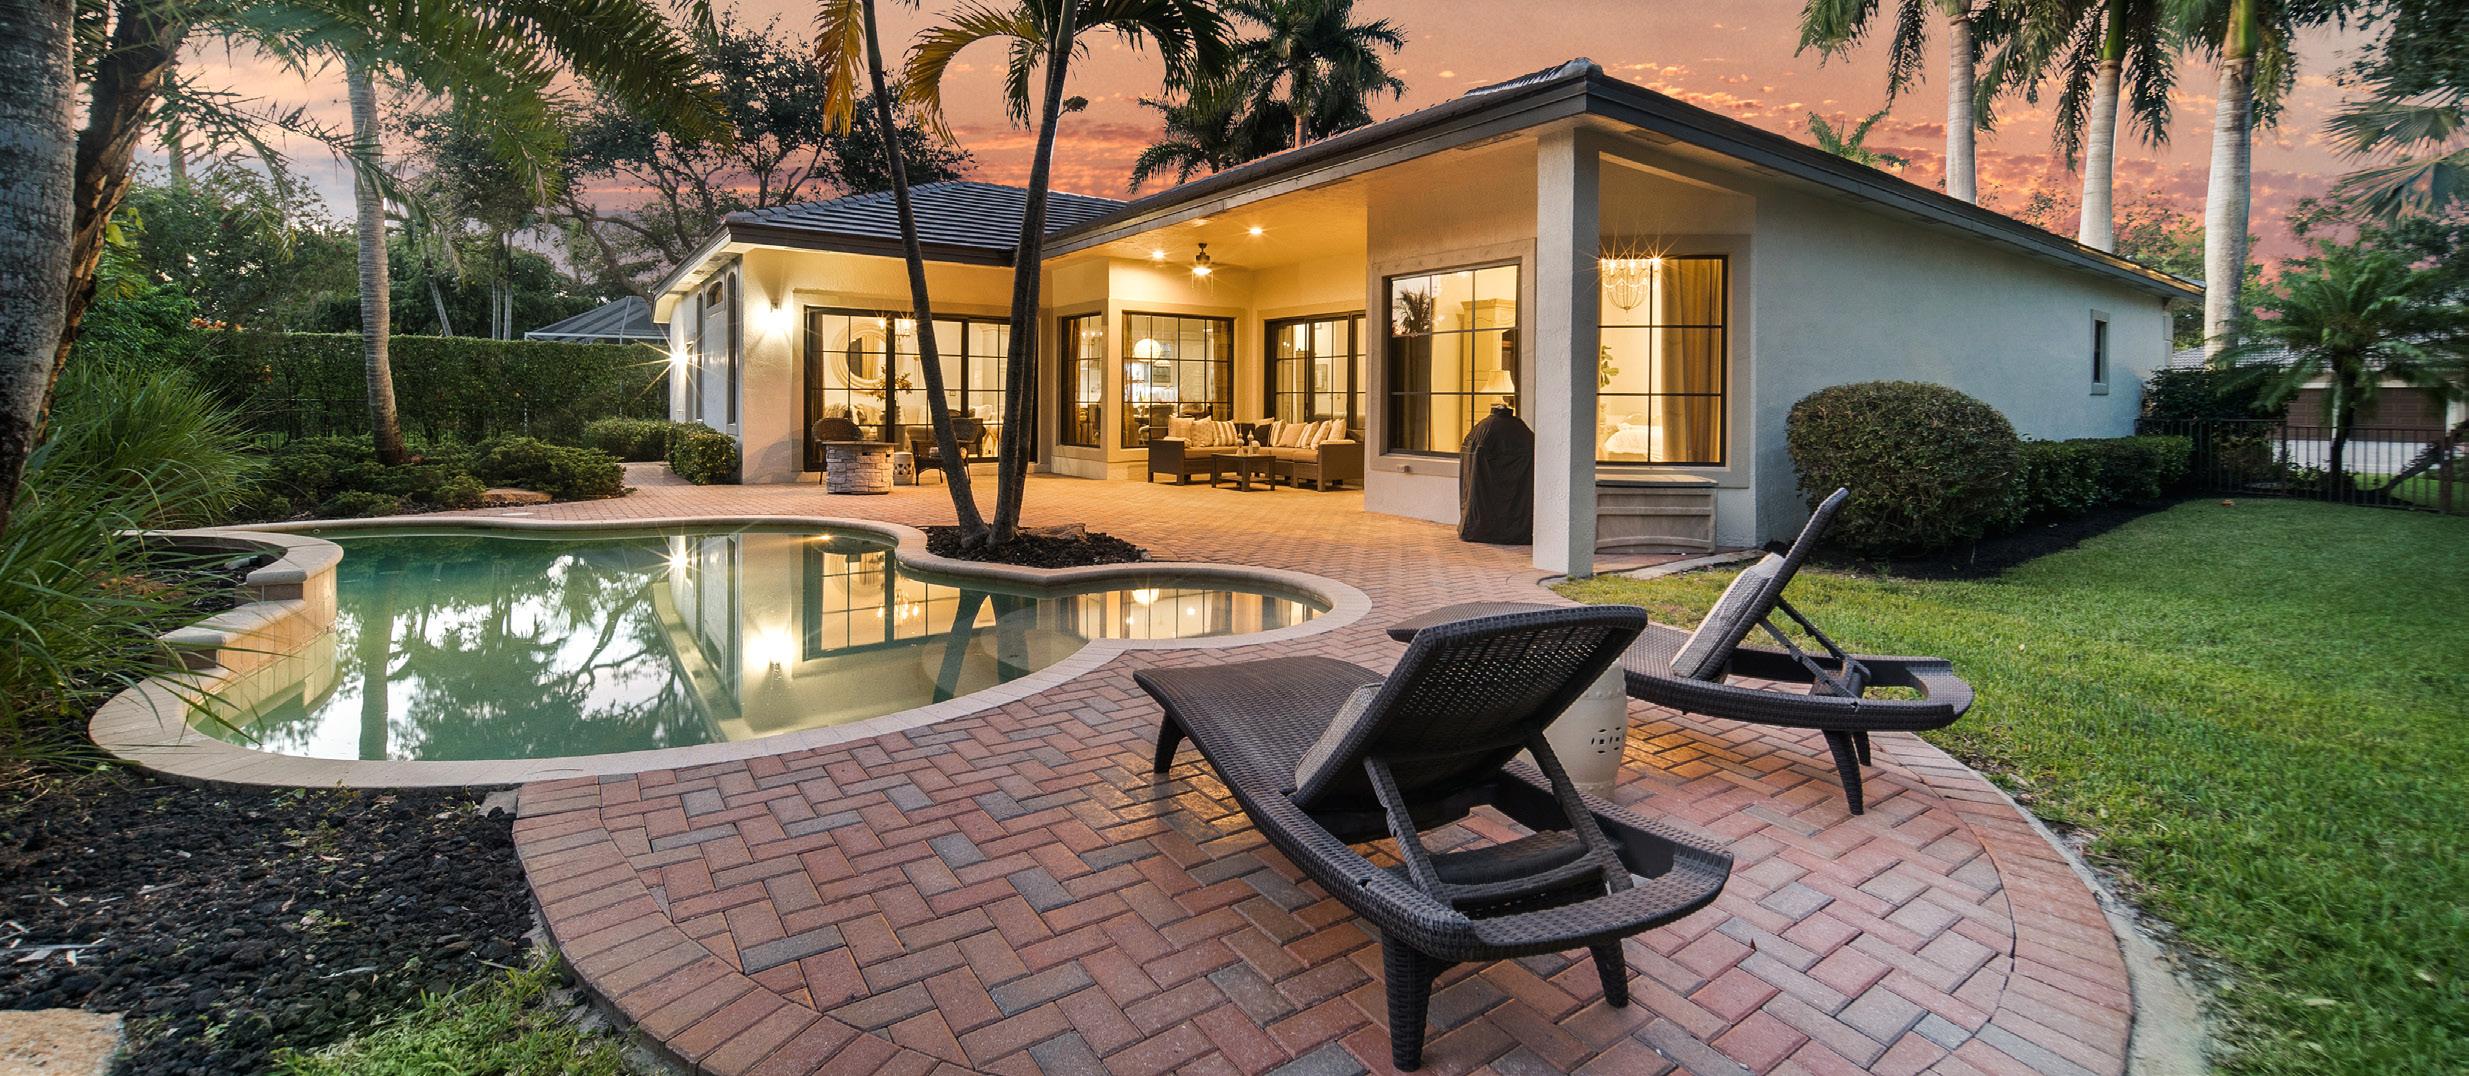
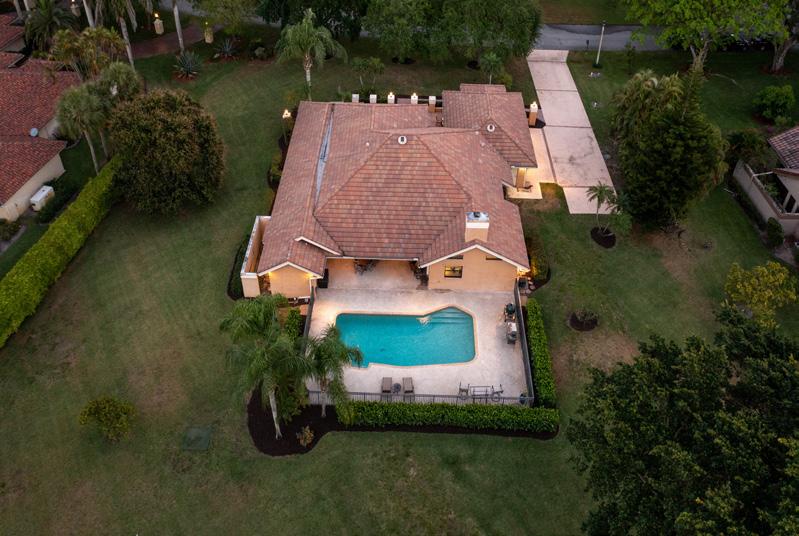
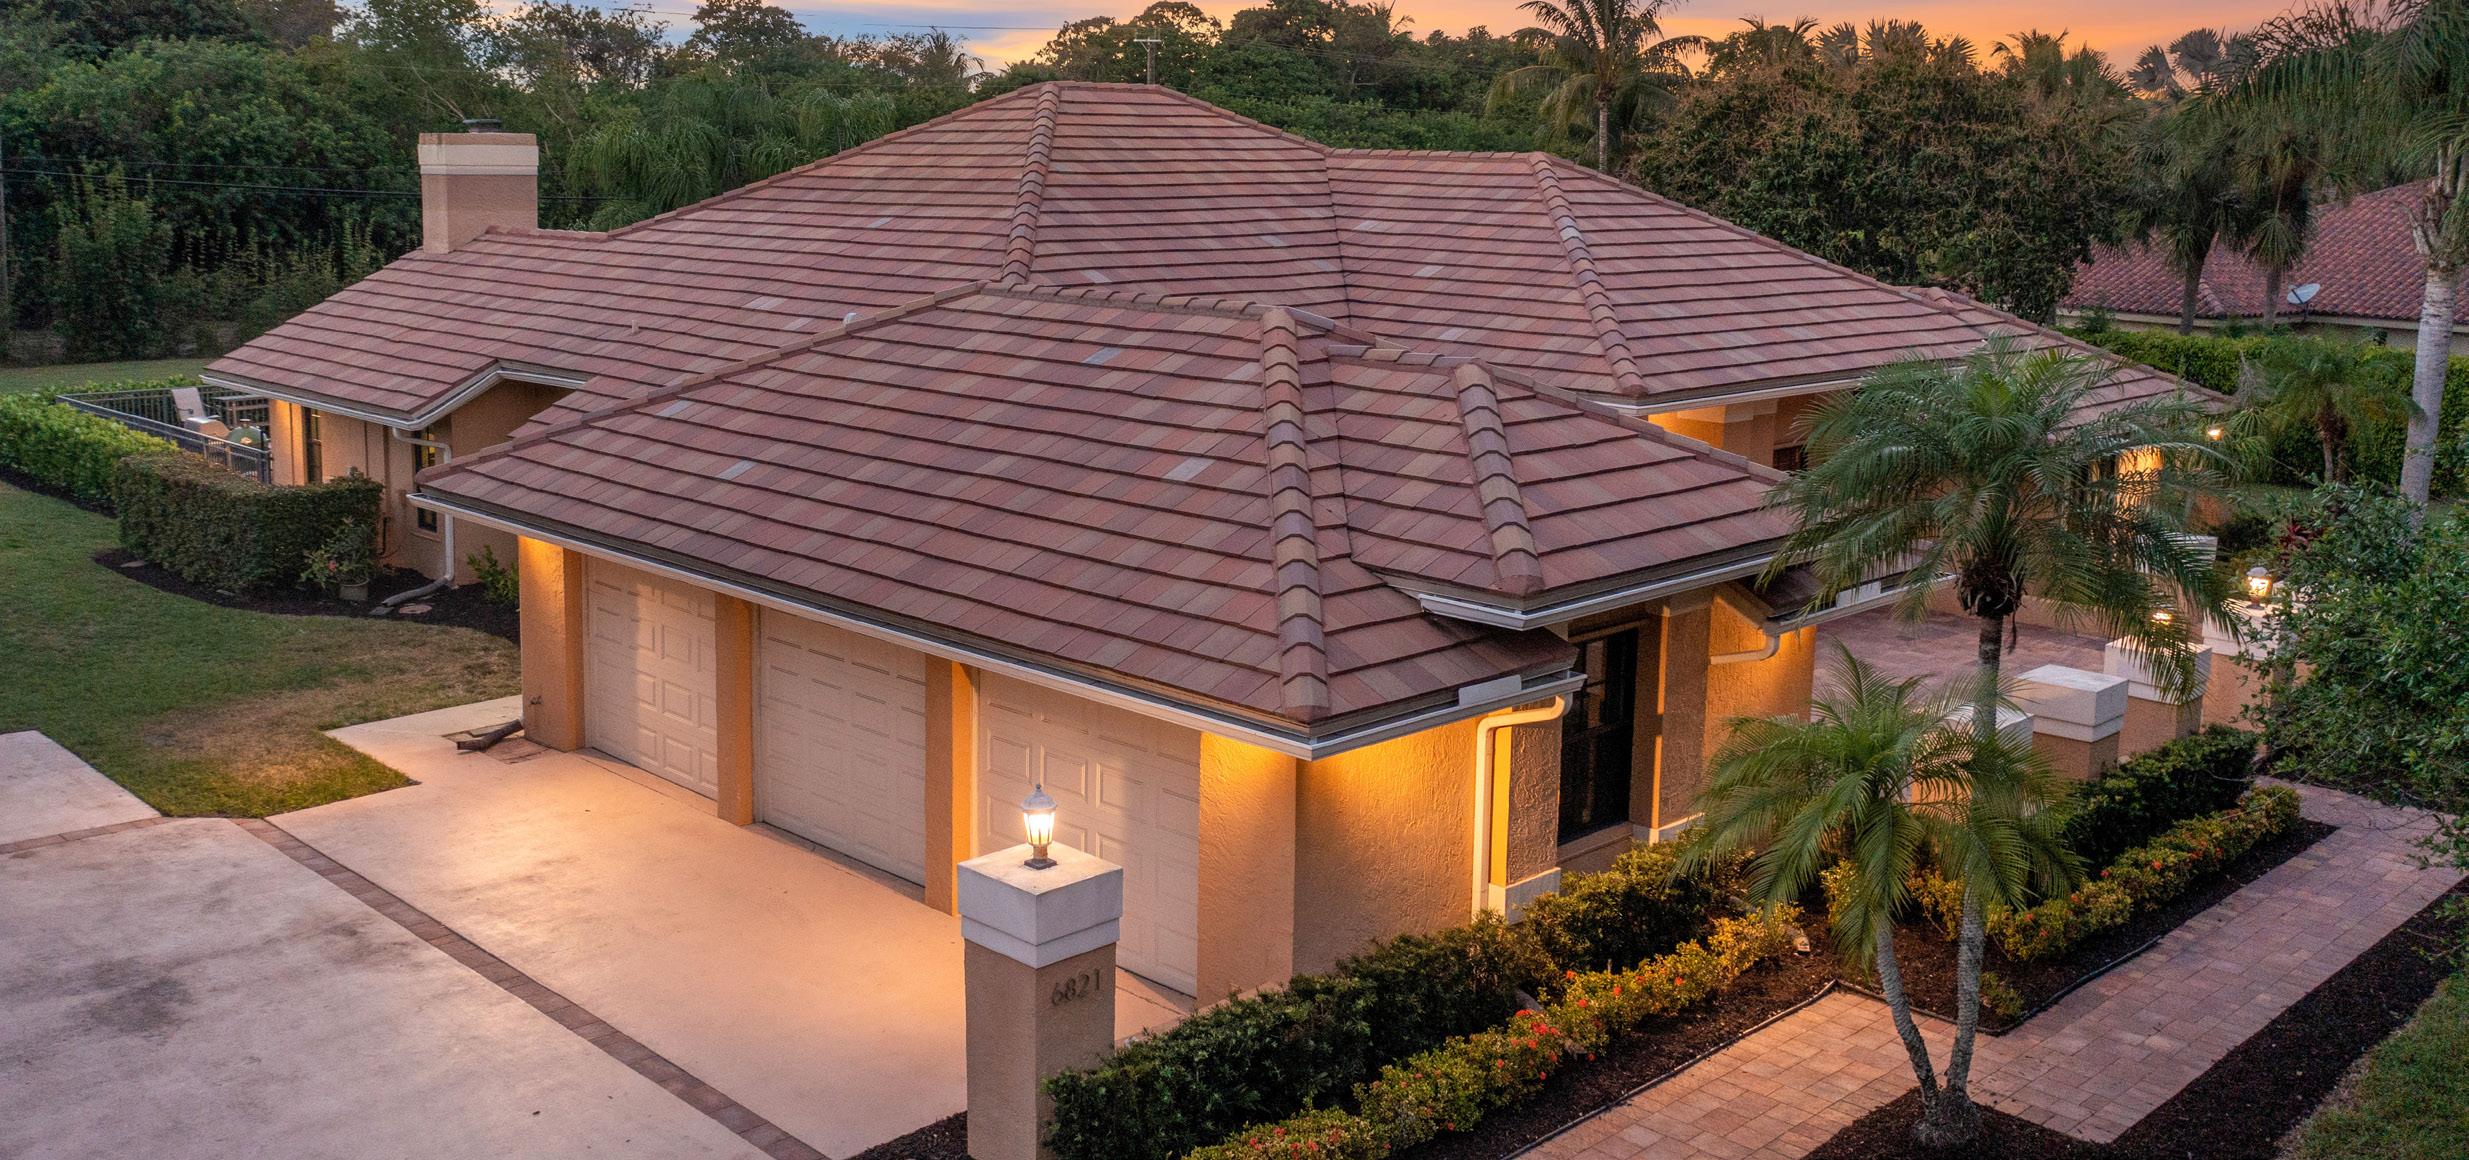
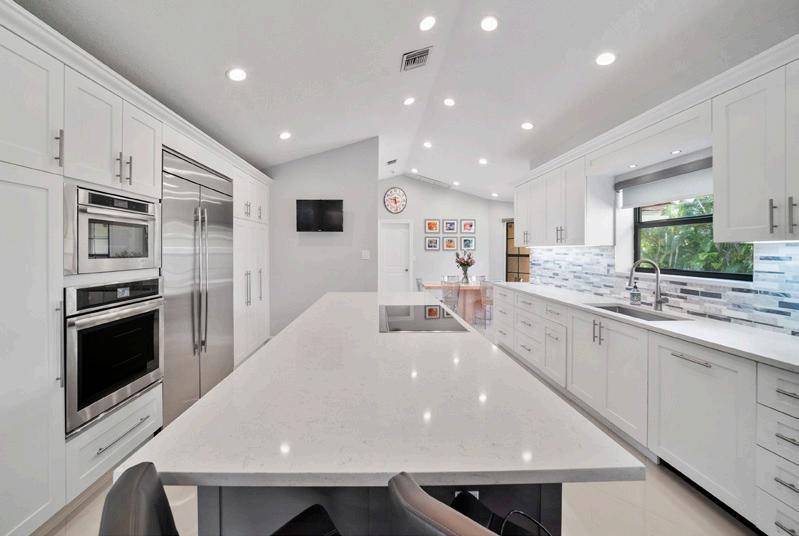
Just Listed | Listed at $1,374,900 6821 N Woodridge Drive 3.5 Baths 5 Beds Pool Custom Updgrades Under Contract | Listed at $1,294,900 6733 NW 105th Lane | Fox Ridge Prepared Exclusively for Get Your Free Home Evaluation Today Visit www.LIVEINCountrysPoint.com
COUNTRY’S POINT APRIL 2023 MARKET REPORT *Data shown for the sales in Country’s Point is based on the MLS as of April 13, 2023 and is deemed to be reliable but should be verified. 2022 & 2023 2021 & 2022 NUMBER OF HOMES SOLD 2021-2022 to 2022-2023 Comparison MEDIAN SALES PRICE 2021-2022 to 2022-2023 Comparison $1,200,000 $1,100,000 $1,000,000 $900,000 $800,000 $700,000 $600,000 $500,000 $400,000 $300,000 $200,000 $100,000 0 DEC JAN FEB MAR 7 6 5 4 3 2 1 0 DEC JAN FEB MAR SINGLE FAMILY MARKET REPORT ACTIVE LISTINGS PRICE REDUCTIONS PENDING SALES SOLD IN PAST 90 DAYS AVERAGE DAYS ON MARKET 3 2/8 5 2 16 MEDIAN SALES PRICE $993,000 Use Camera Phone To Watch This Property’s Creative Lifestyle Video