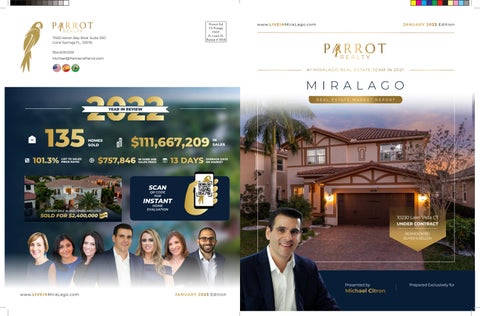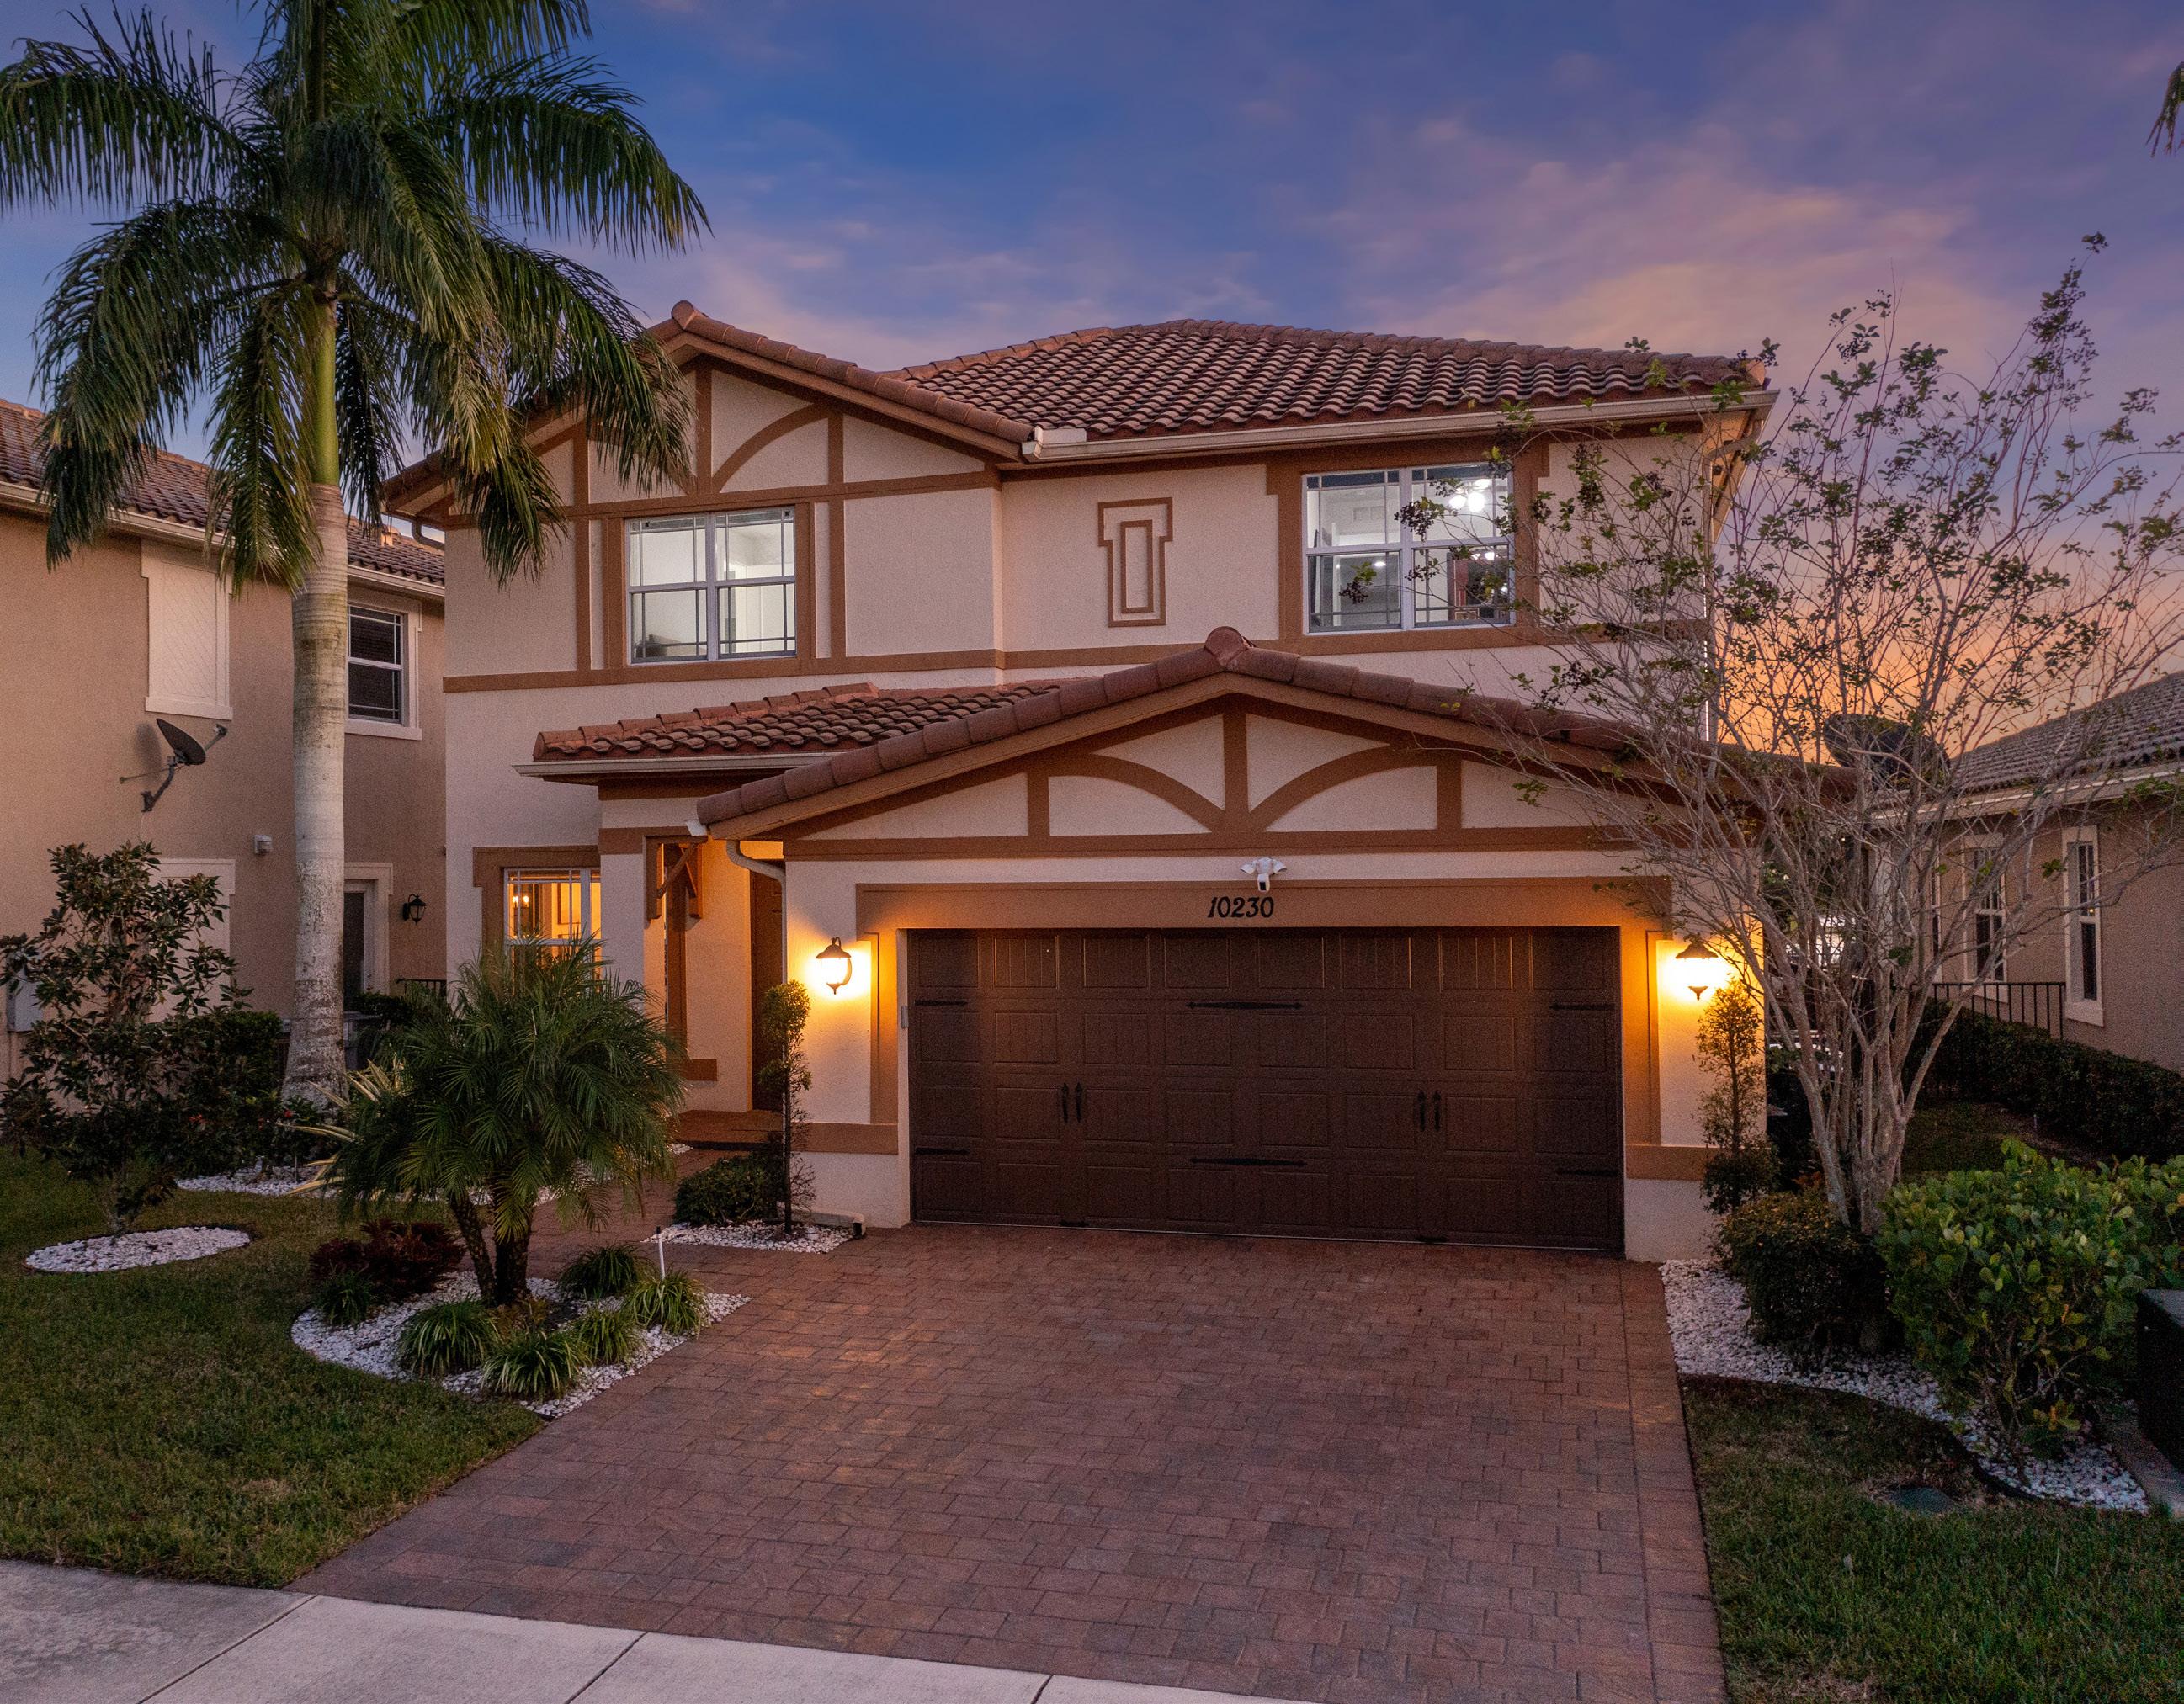


Permit # 3018 11555 Heron Bay Blvd. Suite 200 Coral Springs FL, 33076 954.609.0591 Michael@ParklandParrot.com www. LIVEIN MiraLago.com JANUARY 2023 Edition MIRALAGO #1 MIRALAGO REAL ESTATE TEAM IN 2021 10230 Lake Vista CT REPRESENTED BUYER & SELLER UNDER CONTRACT Presented by Michael Citron Prepared Exclusively for REAL ESTATE MARKET REPORT t HIGHEST SALE IN 2022 | PARKLAND GOLF SOLD FOR $2,400,000 135 HOMES SOLD $ 101.3% $757,846 13 DAYS LIST TO SALES PRICE RATIO IN OVER ASK SALES PRICE AVERAGE DAYS ON MARKET YEAR IN REVIEW $111,667,209 IN SALES www. LIVEIN MiraLago.com JANUARY 2023 Edition
2022 MiraLago Market Review
Presented
By Michael Citron
Total Homes Sold
The Real Estate Market in 2022 has surely shaped the future for years to come as we saw exponential growth in many of our communities. MiraLago had 26 sales in 2022, and 57 in 2021. That’s more than 100% decrease in sales.

Average Days On Market
Some of the biggest changes we have seen in 2022 was the Average Days on Market, as this was our biggest indicator that the buyer frenzy market was slowing down. Although in MiraLago, not much has changed. In 2022, MiraLago’s Average Days on Market was 30 and in 2021 it was 30 days.
Median Sales Price
The biggest change in the market was that in 2022 the median sales price in MiraLago was $992,000. The community had it’s fair share of Record Sales this past year. In 2021, it was only $849,000. Although, with the recent increase in interest rates we may expect home prices to decrease as we come into the 1st and 2nd quarters of 2023.


2 7
8
$558,750

Our Success In MiraLago 2022 $3,015,000 Closed In Sales 3

REPRESENTED BUYER & SELLER REPRESENTED SELLER 8910 Edgewater Pl 9820 S MiraLago Way REPRESENTED SELLER $120,000 OVER ASKING 8670 Lakeside Bend $45,000 OVER ASKING $20,000 OVER ASKING Prepared Exclusively for MIRALAGO JANUARY 2023 MARKET REPORT * Data shown for the sales in MiraLago is based on the MLS as of January 6, 2023 and is deemed to be reliable but should be verified. 2022 2021 Get Your Free Home Evaluation Today Visit www.LIVEINMiraLago.com $1,500,000 $1,350,000 $1,200,000 $1,050,000 $900,000 $750,000 $600,000 $450,000 $300,000 $150,000 0 14 12 10 8 6 4 2 0 SEPT OCT NOV DEC MEDIAN SALES PRICE* 2021-2022 Comparison NUMBER OF HOMES SOLD* 2021-2022 Comparison SEPT OCT NOV DEC SINGLE FAMILY MARKET REPORT ACTIVE LISTINGS AVERAGE DAYS ON MARKET PENDING SALES SOLD IN PAST 90 DAYS MEDIAN SALES PRICE 6 100
3/8 $985,000 PRICE REDUCTIONS TOWN PARC MARKET REPORT ACTIVE LISTINGS AVERAGE DAYS ON MARKET PENDING SALES SOLD IN PAST 180 DAYS MEDIAN SALES PRICE 2
1
1/3
PRICE REDUCTIONS
57