


6733 NW 105th Lane FULL DETAILS INSIDE JUST LISTED Use Camera Phone To Watch This Property’s Creative Lifestyle Video Permit # 3018 11555 Heron Bay Blvd. Suite 200 Coral Springs FL, 33076 954.609.0591 Michael@ParklandParrot.com Presented by Michael Citron Prepared Exclusively for www. LIVEIN FoxRidge.com JANUARY 2023 Edition FOX RIDGE #1 PARKLAND REAL ESTATE TEAM 6 YEARS IN A ROW REAL ESTATE MARKET REPORT t HIGHEST SALE IN 2022 PARKLAND GOLF SOLD FOR $2,400,000 135 HOMES SOLD $ 101.3% $757,846 13 DAYS LIST TO SALES PRICE RATIO IN OVER ASK SALES PRICE AVERAGE DAYS ON MARKET YEAR IN REVIEW $111,667,209 IN SALES www. LIVEIN FoxRidge.com JANUARY 2023 Edition
2022 Fox Ridge Market Review
Presented By Michael Citron
The Real Estate Market in 2022 has surely shaped the future for years to come as we saw exponential growth in many of our communities. Fox Ridge had 18 sales in 2022, and 10 in 2021.


Total Homes Sold Average Days On Market

Some of the biggest changes we have seen in 2022 was the Average Days on Market, as this was our biggest indicator that the buyer frenzy market was slowing down. In 2022, Fox Ridge’s Average Days on Market was 41 and in 2021 it was 12 days. That was over a 200% increased time on market.
The biggest change in the market was that in 2022 the median sales price in Fox Ridge was $1,062,500. The community had it’s fair share of Record Sales this past year. In 2021, it was only $827,000. Although, with recent interest rates increasing we may expect home prices to decrease as we come into the 1st and 2nd quarters of 2023.

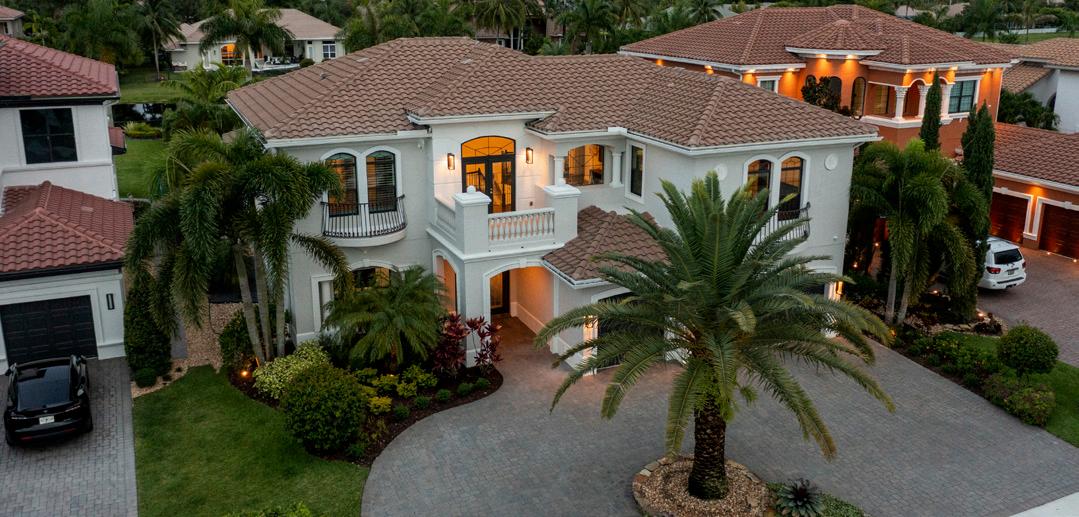
2/2 $1,175,000

Pool 4 Full Baths 5 Beds #300,000 Custom Upgrades

Meadow Run
Pool
Our Success In Fox Ridge 2022 $2,070,000 Closed In Sales 2 Prepared Exclusively for FOX RIDGE JANUARY 2023 MARKET REPORT * Data shown for the sales in Fox Ridge is based on the MLS as of January 6, 2023 and is deemed to be reliable but should be verified. 2022 2021 NUMBER OF HOMES SOLD* 2021-2022 Comparison MEDIAN SALES PRICE* 2021-2022 Comparison Get Your Free Home Evaluation Today Visit www.LIVEINFoxRidge.com $1,200,000 $1,100,000 $1,000,000 $900,000 $800,000 $700,000 $600,000 $500,000 $400,000 $300,000 $200,000 $100,000 0 SEPT OCT NOV DEC 7 6 5 4 3 2 1 0 SEPT OCT NOV DEC SINGLE FAMILY MARKET REPORT ACTIVE LISTINGS AVERAGE DAYS ON MARKET PENDING SALES SOLD IN PAST 90 DAYS MEDIAN SALES PRICE 1
1
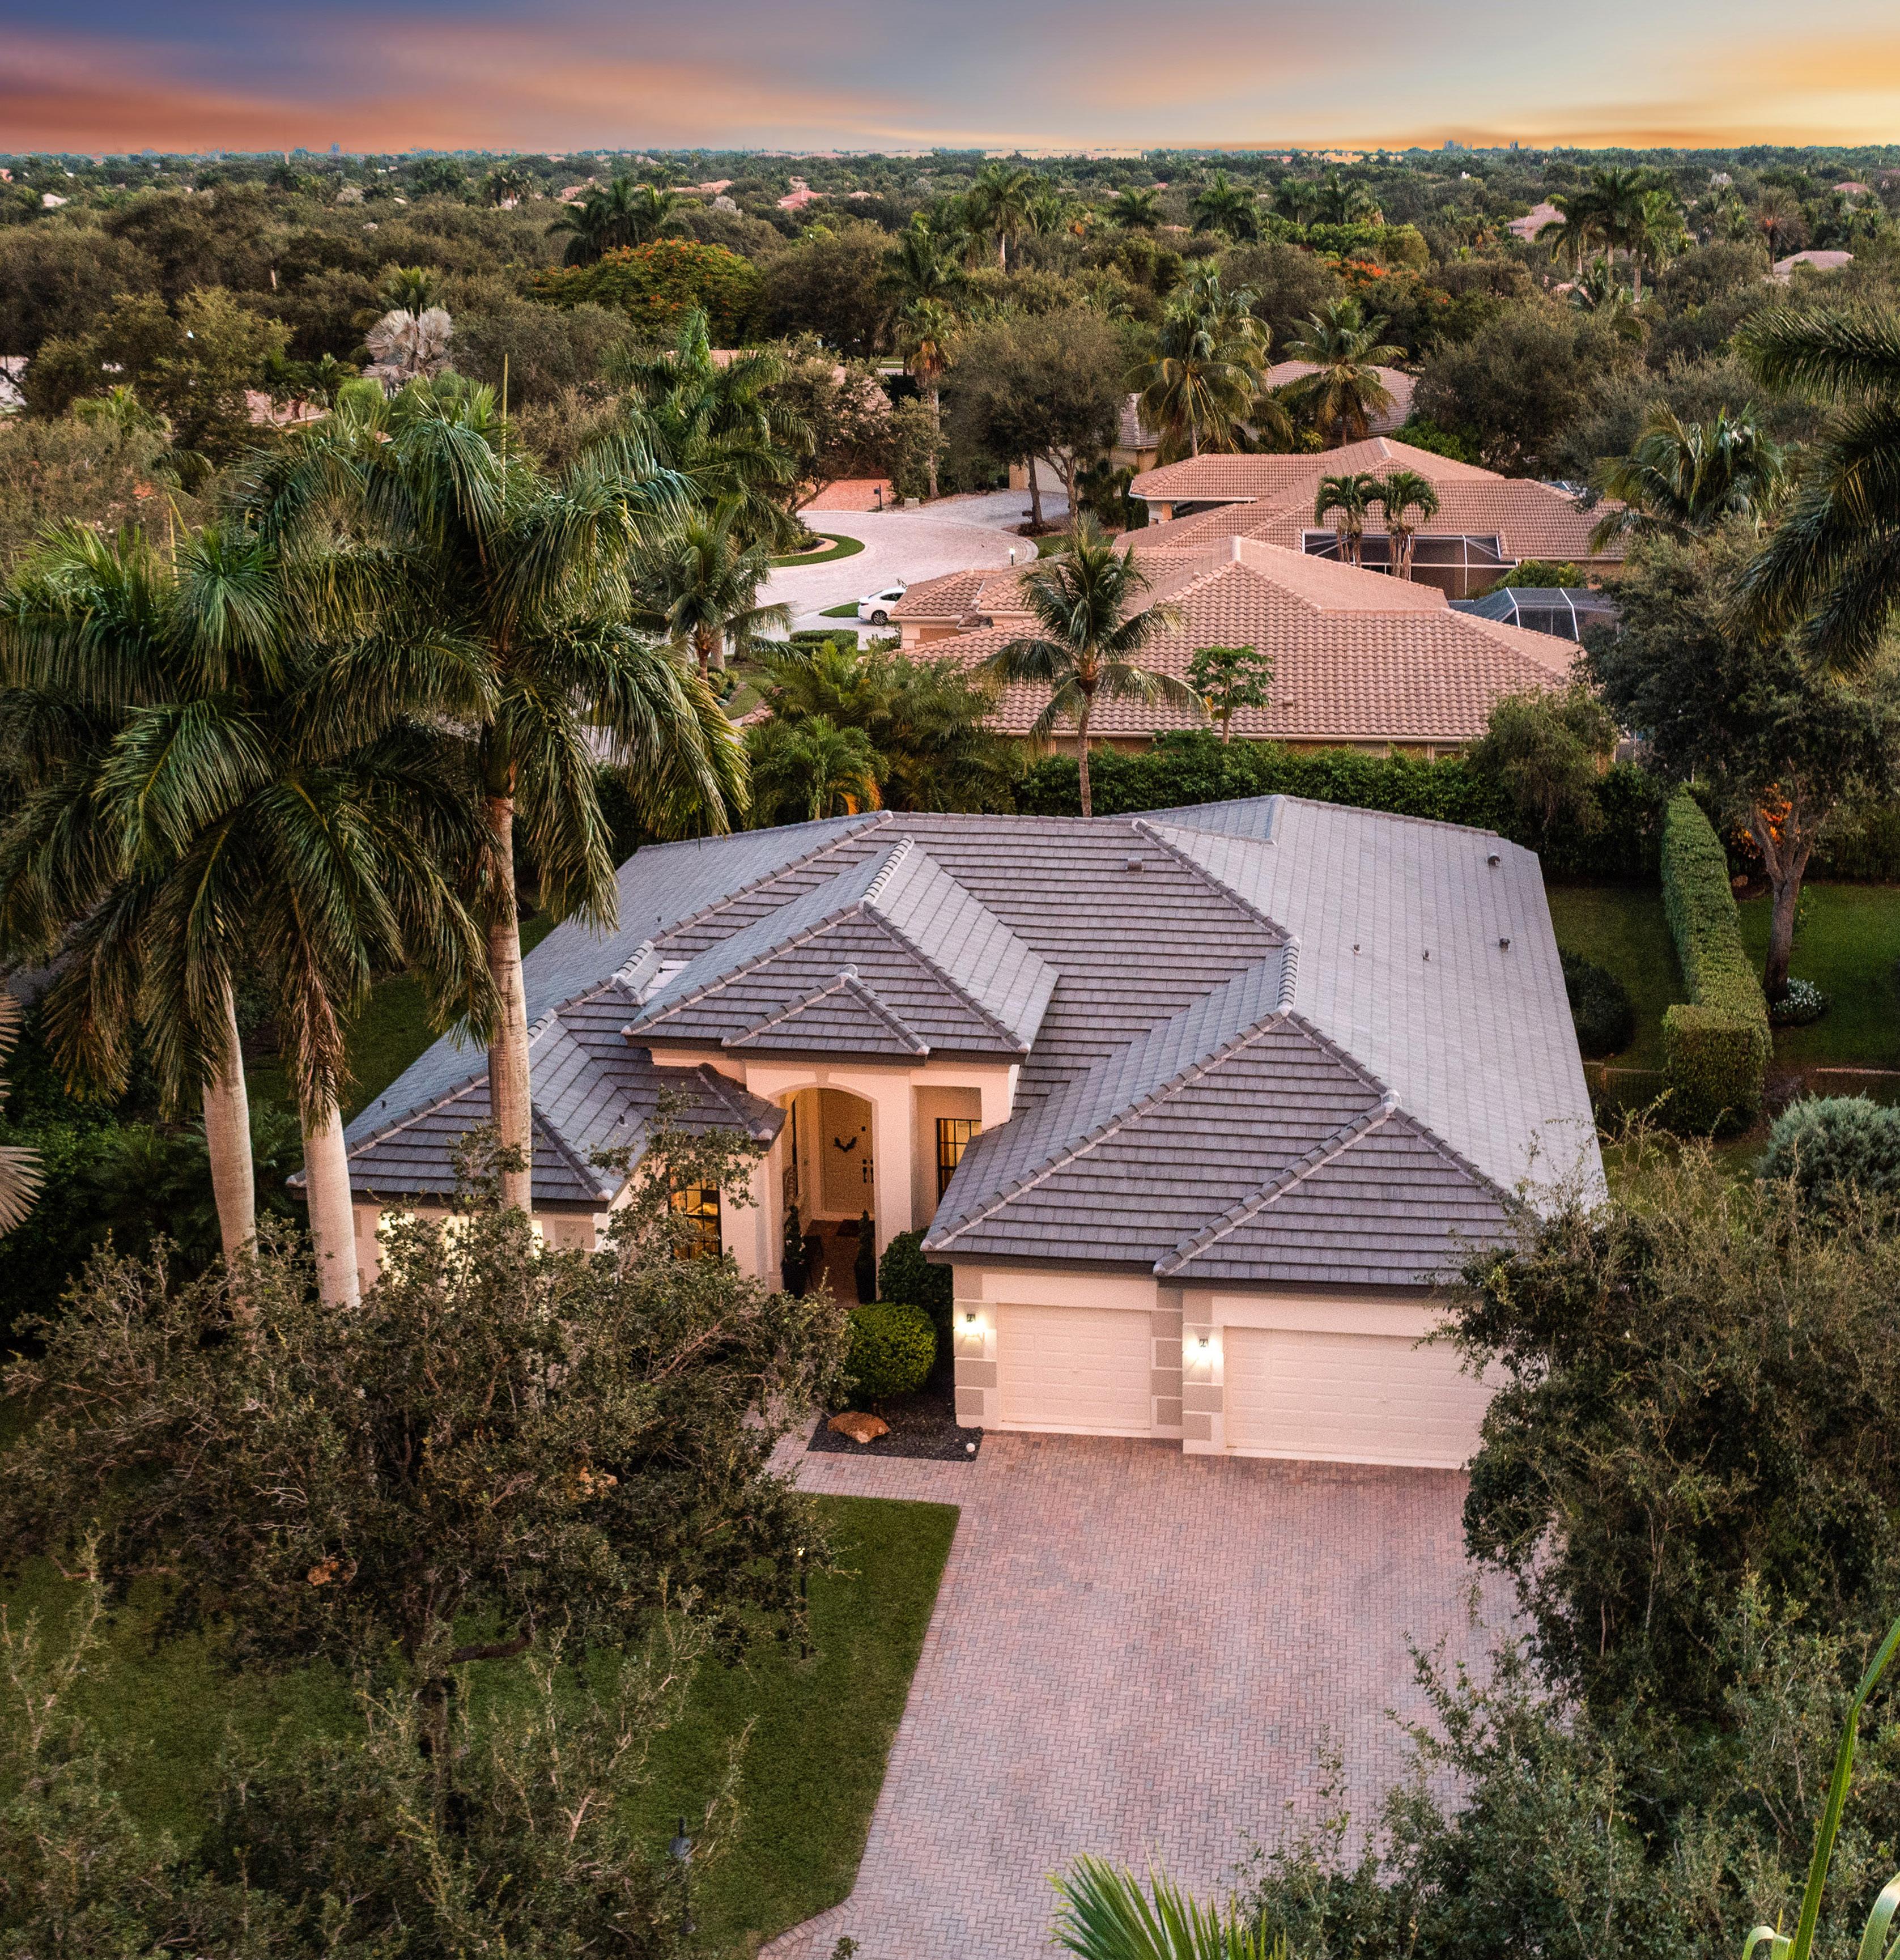
45 PRICE REDUCTIONS LISTED AT $1,294,900 6733 NW 105th Lane 6526 NW 99th Lane
5
3 Full Baths 5 Beds Custom Upgrades
Median Sales Price
SOLD FOR $875,000 | REPRESENTED SELLER