

Location: Marina Bay Sands, Singapore ISBN978 981 18 © 2022 Singapore Institute of Surveyors and Valuers. All rights reserved. by: Singapore Institute of Surveyors and
Singapore
Scientific and Technical Committee
Published
Proceedings of the 12th 13th September 2022, Institute of Surveyors and Valuers, Transformation in
Singapore Proceedings of the PAQS Congress 2022: Disruption and

5478 1 Copyright
Valuers
LING
Edited by: Florence Y.Y.
PAQS Congress 2022,
Date: 9 13 September 2022
2
the Built Environment
Professor Florence Yean Yng Ling, National University of Singapore
Professor Bon Gang Hwang, National University of Singapore
Colin Kin, Rider Levett Bucknall, Singapore
3 Proceedings of the PAQS Congress 2022, 12th 13th September 2022, Singapore Institute of Surveyors and Valuers, Singapore Disruptive Technologies Data Science and Machine Learning for Quantity Surveying: A Brief Perspective Yu Qian Ang..............................................................................................................................5 Agility in Internal Cost Database including Human Retooling to Provide Competitive Cost Estimation for Projects Khaidir Ariffin and Nurul Aminah M Azmi....................................................................................17 Prefabricated Prefinished Volumetric Construction (PPVC) Development In Singapore Jacqueline Chie Sze Huan...........................................................................................................28 Towards A Framework of Internet of Things (IoT) In Smart Buildings: A Bibliometric Approach Bruno Lot Tanko 42 Transformative Delivery Recipes in Manoeuvering Building Information Modelling (BIM) to Quantity Surveying Profession Nadzirah Zainordin, Wai Kuen Wong, Sui Lai Khoo 57 Driving digital transformation in the built environment industry: A proposed holistic digital transformation framework (HDTF) in cost management Myke Ong, Ziwen Liu, Lu Chang Peh And Nazirul Fariq 69 Smart, Sustainable and Resilient Cities: Evolving Brains and Brawn Seah Hsiu Min Eugene 79 Green and Wellness Environmental and Thermal Comfort Assessment of Different Wall Types for a School Building During Pandemic Ryan Chan, Emmanuel Atienza and Jason Maximino Ongpeng..........................................................84 A Key to Make Sustainable Buildings People Centric: User-environment Interactions Cheng Siew Goh and Khai Sheng Yang.........................................................................................97 Embodied carbon reduction: insight into the maturity of the New Zealand construction industry Senarathna DR, Finnie D and Hislop JJ .......................................................................................106 Smart Cities What Technologies Can Eventually Do in the Built Environment Vincent Leong Poh Man and Wong Yi Min 120 The conducive working environment to improve employees’ productivity a case study from mental wellbeing’s perspective Claire Zhang Pei, Ruiwu Li and Lei Feng 125

4 Proceedings of the PAQS Congress 2022, 12th 13th September 2022, Singapore Institute of Surveyors and Valuers, Singapore QS and Cost Management Service Transformation sruptive Technologies Effects of Disruption on Construction Materials Stanley Chang Hon Wah, Chew Jin Jeak, Rachel Wong Chyn Lin, Chin Wei Sun and Chan Lei Onn 130 Construction Cost Comparison Across Borders: The role of Purchasing Power Parity Hoffie Cruywagen...................................................................................................................144 Value management practices in New Zealand commercial construction David Finnie, Joshua Cockroft and Randima Senarathna.................................................................153 Employees’ attitudes towards Hybrid Working A study of Quantity Surveyors in Singapore Guo Yunting, Lian Khin Ming Jonathan and Tay En Rong Stephen ..................................................170 Identification of Digitalization Characteristics for the Surveying Practices across the PAQS Country Members via an Interview Survey Mei Yung Leung, Seki Ka Ching Chan, Dharma Angkasa Angky, Paul Bowen, Haelly Hamid, Mohamed Humdhan, Florence Yean Yng Ling, Masato Yokozawa and Hong Zhang, Nadzirah binti Zainordin .......185 The Value of Price Data for Quantity Surveying Professionals in Australia Anthony Mills, Alexia Nalewaik, Argaw Gurmu, Citra Ongkowijoyo, Wenying Yao and Anthony Lieberman ............................................................................................................................................194 Reimagining the quantity surveying practice in the post COVID-19 pandemic AbdulLateef Olanrewaju, Paul Anavhe, Shalini Sanmargaraja and Olatoyese Oni................................208 Lump Sum Contracts in Uncertain Times: How do we Make our Construction Contracts Future Proof? Jose Carlo Padilla....................................................................................................................228 A comparison between traditional quantity take-off practices vs BIM-based quantity take-off (BIM-QTO) Taki Eddine Seghier, Jason Wong, Lu Change Peh and Ziwen Liu....................................................238 A Discussion on how QSs Manage Project Cost Deliverables in the Digital Age Singapore’s Perspective Claire Zhang Pei .....................................................................................................................247
Brief Perspective
Data science and machine learning represent a new paradigm for quantity surveying a profession conventionally slow in technology adoption. In the high volume, low margins construction sector plagued by labor shortages and rising costs, advancements in data driven computational methods present potential to improve resource utilization and business scalability. This paper discusses the potential applications of data science and machine learning methodologies including supervised and unsupervised learning in cost management. Practical use cases are presented with examples and recommendations for implementation.
5
Proceedings of PAQS Congress 2022, 12th 13th September 2022, Singapore Institute of Surveyors and Valuers, Singapore Data Science and Machine Learning for Quantity Surveying: A
the
1 Introduction
The quantity surveying profession, including cost engineering/management domains, is a practice with deep rooted history. From mud houses to megalithic structures to skyscrapers ever since humans began constructing buildings, they have found it necessary to estimate the quantities of the required materials and the cost of the endeavor (Ofori & Toor, 2009). The profession has undergone multiple transitions and paradigm shifts, with the present day practice of cost management further evolving due to globalization, client focus, the proliferation of information and communication technologies, and the diffusion of knowledge from academia and research (Thayaparan et al., 2011).
To the author’s best knowledge, this is the first paper to discuss the integration of data science and machine learning methodologies in the quantity surveying profession.
Labour productivity in the construction sector has been consistently lagging compared with industries such as manufacturing (Hovnanian, Kroll, & Sjodin, 2019). In the changing geopolitical and socio economic landscapes, organizations in the various disciplines of the Architecture, Engineering, and Construction (AEC) industry are facing increasing pressure to offer value added services and innovate to survive the intense competition with quantity surveying being no exception. Modernizing a typically conservative profession slow to adopt advanced technologies is critical in ensuring survivability, especially with strong headwinds and shrinking fees/margins. Theconfluenceofadvancedtechnologiesapplicabletothebuiltenvironment suchasartificial intelligence (AI), 3D printing, blockchain, and the Internet of Things (IoT) has opened a myriad of possibilities for AEC professions. Among these, artificial intelligence is poised to
Yu Qian Ang, yuqian@mit.edu
Massachusetts Institute of Technology Abstract
Keywords Machine learning, data science, quantity surveying, cost management
Admittedly, adopting these tools and methods may be challenging for project driven/project organized businesses such as quantity surveying unlike manufacturing which tend to follow a repeatable (and somewhat more predictable) process. The culture of valuing individual experience and seniority over data and empirics is also inhibiting. However, with the plethora of open source tools, online tutorials, and support communities, the barriers to entry are significantly lower in the modern context. By leveraging data already collected, machine learning algorithms and analytics can help uncover insights to augment decision making. This study contributes to research and practice in several ways. First, it demonstrates how modern machinelearningalgorithms andmethodscanbeappliedto cost management,bridging the gap between academia/research and practice. Practical use cases are also discussed, providing examples of how quantity surveyors can quickly integrate these methods for fast results. Finally, this study also lays out a roadmap/framework for how the cost management profession can begin to modernize and structure data acquisition and analysis pipelines to achieve greater productivity and efficiency with limited resources.
This paper discusses the potential applications of data science and machine learning methodologies including supervised and unsupervised learning in cost management.
Practical use cases are presented with examples and recommendations for implementation.
6
Proceedings of the PAQS Congress 2022, 12th 13th September 2022, Singapore Institute of Surveyors and Valuers, Singapore create a significant impact due in part to its ability to analyze large amounts of data coupled with the proliferation of accessible computing resources and open source libraries. Machine learning, commonly perceived as a sub field of AI, is a field of inquiry that constructs models that leverage data for inferences and predictions (Mitchell, 1997), improving performance through algorithmic training and experiences. Machine learning provides computer programs, algorithms, and systems with the ability to learn and acquire ‘knowledge’ (instead of relying on hard coded information) by extracting patterns from raw data. (Goodfellow, Bengio, & Courville, 2016).
1.1 Value Proposition
The modern building delivery process involves massive amounts of data, of which manual (human based) analysis using typical rule based methods or heuristics is extremely arduous and time consuming. The quantity surveyor not only has to perform quantity take offs and measurements, analyze rates, and produce bills of quantities but also has to manage progress payments and variations. Adopting data driven solutions already implemented (and revolutionized) in other sectors will enhance productivity, improve resource allocation, reduce risks, and ultimately bring better capital project outcomes.
2 Data Science and Machine Learning Machine learning is commonly perceived as a sub field of AI, where computer programs learn from experiences and improve performance based on a predetermined set of metrics. On the other hand, data science is an interdisciplinary domain that utilizes algorithms, statistics, mathematical/scientific methods, and processes to extract insights from data (Leek, 2013). In modern day academia and industry, they are almost synonymous with little distinction. In contrast to conventional rule based programming or heuristics, data science, and machine learning methods seek to build and train models which can subsequently be utilized to make predictions on new (or unseen data). In some cases, the models can be reduced to statistical functions. In others, they are grey or black boxes with little opacity regarding how predictions are made although the predictions can be highly accurate.
of the
7
2.1 Supervised Learning
Proceedings PAQS Congress 2022, 12th 13th September 2022, Singapore Institute of Surveyors and Valuers, Singapore Machine learning methods can be categorized in various ways, with the most common categorization being supervised (regressors and classifiers) and unsupervised. Figure 1 summarizes standard machine learning methods, their purpose, use cases, and relevance for cost management/quantity surveying. Supervised methods require training data for predictor (independent) and target (dependant) variables. Supervised learning methods can predict continuous or discrete outcome values using either regressors or classifiers. Common supervised learning methods/algorithms include linear regression, decision trees, tree based ensemble models, and neural networks. Unsupervised learning models seek to learn patterns and structures in data without target labels and are commonly used in clustering and dimension reduction tasks.
There are various common supervised learning methods in machine learning. Linear regression also known as least squares regression is the most basic and commonly used predictive and inference analysis. The least squares method in linear regression calculates the best fitting model (line) in the observed data by minimizing the sum of squares of the deviations from each data point to the line. As the variations are squared and summed, there are no differences in impact between the positive and negative values in the metric. In the Bayesian perspective, as opposed to the Frequentist view, linear regression is formulated using probability distributions instead of point estimates. The response/target is assumed to be drawn from a probability distribution rather than a single value (Koehrsen, 2018). The objective of Bayesian Linear Regression seeks to investigate the posterior distribution for the model parameters rather than the single ‘best’ values. In this context, the regression model parameters are also assumed to be drawn from a probability distribution. Decision trees are one of the most common and practical approaches that can be used to solve both regression and classification problems. Decision trees are flowchart like tree models that split data into a series of decisions and possible results. In decision trees, the root node is the initial node that represents the entire sample sets and gets split into further nodes based on various criteria (decisions). Leaf notes represent potential outcomes.
Figure
Proceedings 2022, 12th 13th September 2022, Singapore Institute of Surveyors and Valuers, Singapore 1. machine learning methods and their relevance to cost management/quantity surveying.

8
Common
of the PAQS Congress
Figure 2. Sample decision tree for classifying buildings into clusters

Figure 2 shows a sample decision tree extracted from an ensemble model where buildings are categorized into clusters based on parameters such as wall material, roof material, number of rooms, basement type, etc.
Ensembled models such as Random Forest combine many decision trees to produce better predictive and inference results and can be used for both regression and classification tasks. The fundamental principle behind the ensemble model is that a group of trees (also known as learners) are much stronger. Ensemble models leverage the bootstrap aggregation (bagging) concept to reduce variance in single decision trees. The Random Forest algorithm is the best example of an extension over bagging. Random Forests combines tree predictors such that each tree independently depends on the values of random vector samples, with the same distribution for all trees (in the forest) (Breiman, 2001). The intent is to correct potential overfitting in the individual decision tree and to enhance generalizability and predictive Boostingabilities. is another tree based ensemble method for creating a committee or collecting predictors. In boosting, weak learners build upon each other sequentially, with weak early learners fitting simple models to the data and understanding the errors. Subsequent learners compensate for the weaknesses of their predecessors. Commonly used boosting algorithms include XGBoost (Chen & Guestrin, 2016), which many Kaggle competition winning teams have Finally,used.modeling loosely on the human brain, neural networks comprise many processing nodes that are densely interconnected in layers (Hardesty, 2017). Data in the most basic
9
Proceedings of the PAQS Congress 2022, 12th 13th September 2022, Singapore Institute of Surveyors and Valuers, Singapore
For example, large firms with large repositories comprising data from projects over the years can compile data libraries and build multiple competing models to validate current estimates fornewprojects. Thesemodels will augmentquantity surveyorsrunninglive projects, allowing them to validate cost estimates, assessments, and cost plans. The models can be ‘live’ constantly updated and iteratively optimized to ensure currency.
Proceedings of the PAQS Congress 2022, 12th 13th September 2022, Singapore Institute of Surveyors and Valuers, Singapore neural networks move forward in one direction (feed-forward). Nodes will be assigned a “weight,” which is “trained” through iterations of training data passing through the entire network. These “weights” are constantly adjusted until training converges. Modern neural nets have deep, complex architecture, performing myriad tasks from regression to classification to multi modal image recognition and text generation, stock market prediction to healthcare, and more. Figure 3 shows a simple feed forward neural network with eight neurons in the input layer, four in the hidden layer, and one in the output layer common for simple regression or binary classification tasks. 3. Simple feed forward neural network
Figure
Using simple classification models, quantity surveyors can quickly segment and prioritize variation orders or change requests based on predetermined parameters to better understand the variables that impact these most significantly. Advanced neural network models offer a wider

10
2.1.1
Potential Use Cases in Cost Management
The most obvious use case for machine learning in cost management is to develop models with good prediction and inference capabilities for cost relevant tasks. With the cost driven nature of AEC projects and the vast amount of rate and cost data in quantity surveying firms, it is surprising that not many firms have started to leverage these data for prediction and inference. The quantity surveying profession has (an overbearingly) strong culture of valuing experience and seniority over data and empirical methods. It could benefit from a shift to more data driven methods and processes.
Unsupervised Learning
11
Unsupervised learning uses machine learning and data science algorithms to identify and discover hidden trends, patterns, and structures in datasets. Since there are no labeled data, unsupervised learning methods are ideal for exploratory data analyses. Common unsupervised learning methods include clustering and dimensionality reduction methods. Clustering is a data mining and categorization technique that groups data based on similarities (or differences). Clustering algorithms can process raw data with varying dimensions into groups (or clusters), each with different structures or patterns.
Figure 4. Buildings generated using GANs

The K Means algorithm (Jin & Han, 2011) is one of the most popular clustering methods where data points are assigned into K groups, where K = number of clusters based on distance from each cluster’s centroid. Data points will be assigned to a particular cluster if it is closest to the cluster’s representative centroid. K Means is commonly used in many AEC related applications, such as clustering building energy use. Figure 5 shows two energy use clusters for buildings in a United States city, obtained using time series K Means with the dynamic time warping distance metric.
Proceedings of the PAQS Congress 2022, 12th 13th September 2022, Singapore Institute of Surveyors and Valuers, Singapore range of possibilities. Figure 4 shows a series of buildings entirely generated by Generative Adversarial Networks (GANs), a neural network architecture that pits two neural networks against each other to generative new instances in this case, new building designs based on a training dataset. Architectural firms with advanced computational capabilities have used similar methods to general floor plans and BIM families/components. There is no reason why quantity surveyors cannot benefit more, such as using these methods to generate automated, intelligent cost plans.
2.2
2.2.1 Potential Use Cases in Cost Management
12 Proceedings of the PAQS Congress 2022, 12th 13th September 2022, Singapore Institute of Surveyors and Valuers, Singapore
Figure 6. Dendrogram example with five clusters

Hierarchy clustering can be agglomerative or divisive, with the former being a ‘bottoms-up’ approach and the latter being ‘top down.’ In hierarchical clustering, data points or clusters are iteratively merged or separated based on similarity, with Euclidean distance being the most common metric. Hierarchical clustering is often visualized as dendrograms, tree like structures (Figure 6) that document the history of merging or splitting data points (or clusters) at each iteration. Other common clustering methods include DBSCAN and Gaussian Mixture Models, among others.
Figure 5. Two building energy use clusters
Clustering techniques have many potential applications in cost management. For example, one can extract information from building information models, perform clustering on clash detection results, and selectively resolve clashes with high time and cost implications. Figure

Although more data is often beneficial for machine learning models, too much (or high dimensionality) can sometimes make it difficult to find critical variables or visualize the dataset. Dimensionality reduction techniques are often used when the number of predictors or features is too high. Principal component analysis (PCA) is one of the most common dimensionality reduction techniques. In PCA, A linear transformation is used to create new data representations, thus resulting in a set of ‘principal components’ representing the original predictor set. The first principal component maximizes thedataset's variance,whilethesecondalsoseeks to maximize variance, albeit perpendicular to the first and uncorrelated.

Proceedings of the PAQS Congress 2022, 12th 13th September 2022, Singapore Institute of Surveyors and Valuers, Singapore 6 illustrates an example of a density plot resulting from a clustering exercise, where conflicts are filtered for high cost and time implications. In Figure 7, clashes between floor slabs and columns have relatively high time and cost implications. 7. Dendrogram example with five clusters

13
Word2Vec is commonly used in modern language models to learn word embedding from text datasets for downstream tasks (Google, 2022). Word2vec primarily uses a neural network model to learn word associations from a text corpus and translates these embedding into vectors, with some indication of syntax and semantic similarity.
Latent Dirichlet Allocation (LDA) is a generative probabilistic model used for topic modeling of discrete text data such as text corpus (Biel, Ng, & Jordan, 2003). LDA finds a fixed set of topics, each representing a set of words. The goal is to map all the training data (or documents) to the topics so that the topics modeled by the algorithm most capture each document's words. Like clustering for numerical data, LDA can cluster documents based on text data.
Finally, modern transformer models utilize neural networks to learn context and meanings in sequential data, such as words in sentences (Merritt, 2022). These models are highly advanced and among the most powerful class of language models, driving a new paradigm of advances in language modeling. Transformer models are used in myriad applications, translating and generating text and speech in real time or near real time.
2.3 Text Analytics/Natural Language Processing
Natural language processing (NLP) is a machine learning field that integrates linguistics, computer science, and AI to analyze and synthesize speech and text. Modern NLP models are highly advanced, able to generate, understand and respond to text or speech data, sometimes resembling actual humans. Some common NLP tasks include text generation, speech recognition, and sentiment analysis.
Figure
Quantity surveyors have only much to benefit from leveraging these models to reduce the time needed to draft, validate, and update contract and tender documents.
Step 2: Create economies of scale Cost management teamsaretypicallyproject based,with team membersmanaging andmoving across multiple projects and data passing across projects. While firm wide processes span multiple units, individual teams often focus on their assigned projects and rarely commit wholeheartedly to organizational wide implementations. This trend has been witnessed across periods and technologies, such as BIM. Rather than pushing machine learning and automating
Modern language models have evolved from random text generation or automated chatbots with standardized response into highly advanced generative models, impacting even industries requiring a high degree of language contextualization, such as the legal profession.
Potential Use Cases in Cost Management
Step 1: Identify requirements and needs
One of the most significant timesinks in any construction or building project is the timeneeded to draft, update and monitor construction contracts. Modern language models can help in many aspects, from fact-checking to validationto evenautomaticgenerationofstandardtexts. Figure 8 shows an example using DeepAI’s application programming interface (DeepAI, 2022). With only onesamplesentence as input (‘thequantitysurveyormadeamistakeinhiscostestimates), the language model can output an entire paragraph of relevant text.
Forquantity surveying firms to successfullyimplementmachinelearningforimpact, theauthor recommends a four step process:
14 Proceedings of the PAQS Congress 2022, 12th 13th September 2022, Singapore Institute of Surveyors and Valuers, Singapore 2.3.1
3 Recommended Implementation Framework
Figure 8. Automatic text generation using a language model.
Depending on firmsize, business model, andcore competencies,quantity surveying firms must identify the essential requirements including hardware, software, and personnel and objectives for impact. A central and perennial challenge for project based teams in the AEC domain is that knowledge within and across building projects is rarely codified or documented in full. Many decisions are not easily distilled or cannot be easily translated into simple, programmable rulesets. In this context, it is vital to identify feasible and achievable goals that enhance organizational productivity in a practical manner.

Advantages Complete IP protection and Ableownershiptomatch company and project use cases End solution tailored to business and project Strengthensneedsinternal capabilities
It can be costly if complete business and project needs are not met (need overhaul) No ownership of the solution Solution not fully tailored to business and project needs May reduce competitive advantage if other firms own their solutions
Conclusion
The archetype applications and use cases in step 2 can guide analysis and decisions on what the firm may need, but actual deployment models will be necessary to get started. Table 1 summarizes the differences between customized and off the shelf approaches. Assessing these options will require consideration of a myriad of factors, such as how well the solution can be used across multiple project teams and use cases, resource availability, and stakeholder buy in, among others.
Step 3: Assess existing capabilities and development needs
Customized Off The Shelf
the entire process at once, firms can create economies of scale incrementally by reviewing inputs, controls, procedures, and documentation in individual teams and start by ensuring these are consistent. For example, several units may struggle with documenting or searching for material rates or quantity take offs. Since many use cases and applications across project teams may be similar, the firm can group these into ‘archetype applications and use cases’ and apply machine learning to automate or enhance the productivity of these processes.
Description
librariesleverageModelsvendors/contractors/consultantswithbuiltfromscratchbutcanstandardopensource
Disadvantages Significant development time and time to Requiresmarketgood leadership Requires strong internal competencies and capabilities Development may be expensive
Step 4: Pilot and scale
Thefinalstepinvolvespilotingthesolutionsinasmallnumberoftest bedprojectsforfeedback anddeployingat scale.Machinelearningmodels requiredataofareasonablequalitytoproduce good predictions and outcomes. Data and information across project teams are often inconsistent and raw, requiring processing to be usable. It is thus integral to pilot the models to identify areas to be improved before scaling.
Quick to deploy Requires less internal staffing and Goodcapabilitiesforcost reduction Lower start up investment and costs
Proceedings of the PAQS Congress 2022, 12th 13th September 2022, Singapore Institute of Surveyors and Valuers, Singapore
Developed in house or
4
Table 1: Summary of comparison between customized and off the shelf solutions
Solutions built for specific use Maycaseshave low or no code solutions that reduce the need for an in house data scientist or machine learning engineers
15
5 References Biel, D., Ng, A., & Jordan, M. (2003). Latent Dirichlet Allocation. The Journal Of Machine Learning Research, 993 1022. Breiman, L. (2001). Random Forests. Machine Learning. Cartlidge, D. (2006). New aspects of quantity surveying practice (2nd Edition). London: Butterworth Heinemann. Chen, T., & Guestrin, C. (2016). XGBoost: A Scalable Tree Boosting System. Machine DeepAI.Learning.(2022). Text Generation API. Retrieved from DeepAI.org. Goodfellow, I., Bengio, Y., & Courville, A. (2016). Deep Learning. Cymbolix. Google. (2022, July 27). word2vec. Retrieved from TensorFlow: Hardesty,https://www.tensorflow.org/tutorials/text/word2vecL.(2017,April2017).Explained:Neural
M., Siriwardena, M., Amaratunga, D., Malaldoga, C., & Keraminiyage, K. (2011). Lifelong Learning and the Changing Role of Quantity Surveying Profession. 15th Pacific Association of Quantity Surveyors Congress, 351 360.
16 Proceedings of the PAQS Congress 2022, 12th 13th September 2022, Singapore Institute of Surveyors and Valuers, Singapore This manuscript discusses various common machine learning methods and algorithms and how they can be potentially applied to the quantity surveying practice. While machine learning is relatively mature in many industries, applications to cost management for AEC projects are still nascent, with plenty of room for growth.
Networks: Ballyhooed artificial intelligence technique known as “deep learning” revives 70 year old idea. Retrieved from MIT News: https://news.mit.edu/2017/explained neural networks deep learning 0414 Hovnanian, G., Kroll, K., & Sjodin, E. (2019). How analytics can drive smarter engineering and construction decisions. McKinsey & Co. Jin, X., & Han, J. (2011). K Means Clustering. Encyclopedia of Machine Learning. Koehrsen, W. (2018, Apr 4). Introduction to Bayesian Linear Regression: An explanation of the Bayesian approach to linear modeling. Retrieved from Towards Data Science: https://towardsdatascience.com/introduction to bayesian linear regression e66e60791ea7 Leek, J. (2013). The key word in Data Science is not data, it is Science. Simply Statistics. Merritt, R. (2022, March 25). What Is a Transformer Model? Retrieved from Nvidia: https://blogs.nvidia.com/blog/2022/03/25/what is a transformer model/ Mitchell, T. (1997). Machine Learning. McGraw Hill. Ofori, G., & Toor, S. u. R. (2009). Role of Leadership in Transforming the Profession of Quantity Surveying. The Australasian Journal of Construction Economics and Building, 37 Thayapparan,44.
PETRONAS. Board of Quantity Surveyor Malaysia, Malaysia
Keywords Digitalization, agile, cost estimation, human retooling, database. 1 Introduction Digital Transformation in Cost Engineering is shifting the conventional estimation process to automated method. This initiative digitalizes the existing manual estimation work processes and enhances resources through human retooling, the ideation concept, technical commercial definition, and knowledge capture processes. The objectives of the digitalization initiative are value focused and delivered through a combination of manual application conversion, integration across applications, improved data utilization and business process improvements. Key value creations include:
• Maximize pace of estimation delivery by automating quantity and cost, selection, and associated techno commercial activities.
Proceedings of the PAQS Congress 2022, 12th 13th September 2022, Singapore Institute of Surveyors and Valuers, Singapore Agility in Internal Cost Database including Human Retooling to Provide Competitive Cost Estimation for Projects
PETRONAS. Malaysia Board of Technologies, Malaysia Abstract
This paper discusses a project realized in digitalization from the cost domain perspective, with emphasis on the methodology, process enhancements made possible by automation, and lessons learnt discovered throughout the transformation to create an integrated cost estimation application with better decision making and effective action suitable to the ever changing VUCA (volatility, uncertainty, complexity and ambiguity) business landscape. The transformation has been an iterative process that began with digitalizing modules within the estimators’ work process and eventually evolving into an integrated multi discipline digital application. Along the journey, application of Agile project management strategies enabled continuous enhancements to be identified and implemented through lessons learnt, formal design thinking reviews, new idea generation and informal engagements with other disciplines in their digital transformation journey. The process enhancements include new ways of working to seamlessly integrate technical and cost analytics engines, and across broader enterprise digital Field Development processes as well as new sources of insight to expand ideation using cross industry learnings, maximize use of extensive internal project data, and embedding Best in Class benchmarking.
17
Khaidir Ariffin (corresponding author), email: khaidir.ariffin@petronas.com
Nurul Aminah M Azmi, email: nurulaminah_azmi@petronas.com
Digital transformation is shifting the structure of work in nearly every industry and fundamentally changing the value proposition for customers. As part of the overall digital transformation, Cost Engineering has embarked on an ambitious program to digitalize and integrate the company’s cost estimation processes and templates into a single digital tool. This paper provides Case Studies in Cost Engineering digitalization, with a focus on the methodology used, process enhancements that were enabled through automation, and lessons learned during the transformation.
18
3 Methodology
The Cost Engineering digital transformation commenced following a holistic review, pain point identification and inefficiencies within the existing cost estimating process. These includes:
• Improve overall cost development performance through use of external databases and project learnings.
• Thecostestimationprocessishighlymanual,resultinginhighresourcing andexcessive time to mature the estimation. This has a significant indirect impact in limiting the ideation and value obsession opportunities due to time and tool limitations.
• Although COMPANY has access to an extensive internal and external data set, these arenot collatedto asingleuseabledatabaseto leverageprovenideas, benchmarkresults or tap into corporate memory to improve decision making quality and value.
The transformation process commenced after identification of pain points and screening of the value enhancement potential through pain point elimination workshop. This included the development and syndication of a Solution Charter with clear identification of the vision, end state, delivery plan and resources. The intention is to integrate vertically within the broader standardized built up rates, with scenarios and data sourced from the overall business and to specialized design applications in providing comprehensive technical and cost analytics engines. This approach allows for digital input/output at the business level to be seamlessly transferred to a tool to generate a highly accurate definition.
Proceedings of the PAQS Congress 2022, 12th 13th September 2022, Singapore Institute of Surveyors and Valuers, Singapore
2 Literature Review
• Full range of techno commercial definition with little or no human intervention.
• Maximize technical and cost accuracy through seamless digital integration of the full suite of technical commercial applications and improved utilization of corporate knowledge.
The initiative’s end state will enable a full range of cost estimation scenarios to be assessed at digitalspeed,basedoncomprehensivetechnical andcostdefinition,automatedscreeningbased on project drivers, and enhanced benchmarking to improve the selection process. As the nature of estimation work shifts away from manual deliverables generation now enabled through human retooling, a re focus on value obsession, assurance and risk management is possible as part of continuous improvement of project realization outcomes.
19
Figure 1. Architecture brain enable quantification and cost estimation However, this may provide a significant value lever as technical definition and cost estimating accuracy value is realized much earlier in the development cycle.
Proceedings of the PAQS Congress 2022, 12th 13th September 2022, Singapore Institute of Surveyors and Valuers, Singapore
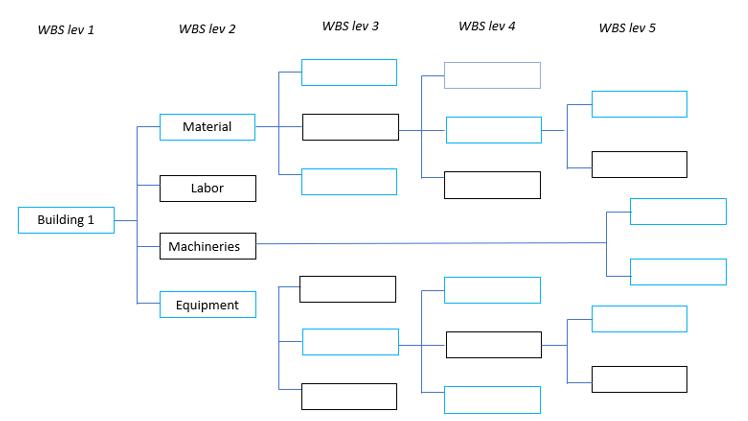
To enable seamless integration between the brains, the WBS which acts as the integrator, will connect, and synchronize the Cost brains. To boost further the functionality and accuracy of outcomes of this Built up rates tool, other disciplines’ digital applications e.g., civil structural, piping, electrical were integrated into this tool by mapping them into the overall architecture.
Based on the discoveries from the workshops, further enhancement of the end state was identified and required a re framing of the work plan. This re framing was done using the Design Thinking process, which is beneficial to solve complex issues by understanding user’s needs and coming up with effective solutions to meet those needs. The process involved engaging with the Cost Engineering fraternity and the broader stakeholder teams to review and update needs, confirm the pain points identified in the existing workflow and processes, identify the main features required, and prioritize the features over various product i.e., Built up rates which ableto be customizedfor infraworks andsmall building calculation.Additional features will also be added in the future releases. As the result from the workshop, a workflow was established based on the existing manual workflow and to meet the end state requirements while incorporating all the features identified A significant challenge was identified with the integrationofathirdpartytechnical andcostapplication tool.However,it couldnotbedigitally integrated as the developer doesn’t provide an open API for the application.
Based on identified pain pointes, the major showstopper is to be a fully integrated digital techno commercial application as data was scattered and would require manual human intervention. Hence, to address these obstacles, the cost estimation analytics brain was developed. The Analytics Brain was developed with major features to perform the quantification through a standard work breakdown structure (WBS). Prioritization of effort had to take place in sourcing of data and mapping the architecture and logics to enable this feature as early as the first release. The generic brain architecture is shown in Figure 1.

Proceedings of the PAQS Congress 2022, 12th 13th September 2022, Singapore Institute of Surveyors and Valuers, Singapore
To develop the brain, agile project management techniques were used to develop a series of evolving Minimum Viable Products for this Build Up Rates tool to the end state. As this was the first time Domain personnel had applied Agile, there remained a focus on developing tools to achieve end state objectives, rather than iterative MVP progress that tests and improve the eventual end state. Regular meetings via scrums and pod meetings were held to refine the MVP road map to allow iterative evolvement towards the end state, rather than apply the traditional Domain approach of mapping out a single path to end state.
• Automated reports to support deliverables
4 Findings and Discussion
Both technical and cost benchmarking were also embedded as part of the tools workflow in ensuring quality and accuracy of the results generated.
Key observable value creations were identified through the exercise which include increase cost estimation accuracy, improve project definition in earlier phase, streamlining workflow for different gate stages, accelerate estimation deliverables, single source of truth to minimize the Price of Non Conformance (PONC) and enhanced information plus insights for CAPEX compression, economic optimization and decision making. Through a workshop, key features were identified, and they are:
• Standardized, automated project data entry supported by validation and audit trail
20
• System data integration to create a single source of truth
• Engineering simulations that significantly impact the decision making and cost analysis
• Insights and collaboration from external sources
• Techno commercial analysis customized for each estimation stage
In ensuring the program developers understood the architecture and able to develop the brain, clear building blocks were established, supplemented with flowcharts and parametric curves to process the inputs, and produce the outputs.
The Build Up Rates data sources is shown in Figure 2. An enhanced workflow was established through mapping of the existing workflow, incorporating the Design Thinking features to meet the end state objectives. A comprehensive building block as shown in Figure 3 was developed from initiation to decision making and reporting, including Project Management, Input Data, Cost Brain, Decision Making Space and Reporting & Archiving. The workflow is based on maximizing digital integration and automation, with limited manual intervention steps identified for project kick off and resourcing, data validation, shortlisted concept assurance, and collaborative decision making.
21 Proceedings of the PAQS Congress 2022, 12th 13th September 2022, Singapore Institute of Surveyors and Valuers, Singapore
Figure 2. Build Up Rates data sources
The cost estimation e.g., CAPEX is generated based on equipment listing, weights and corresponding unit prices mapped in the common WBS. The fundamental building block of the Cost Brain is the pre defined unit cost based on procurement norms and updated at regular intervals through Management of Change (MOC) process. The insight is leveraged from various databases e.g., internal proprietary cost data, internal benchmarking, and industry best practices to ensure competitive results. Additional submodules e.g., cost risk, Operational Expenditure (OPEX) and Abandonment Expenditure (ABEX) are incorporated in the Cost Brain to ensure cost completeness prior moving into the decision making space.

Figure 3. Building Block
22
Thestandardizationof WBS helpedin tabulatingtherates and subsequently ensuring all scopes were covered. The rates were then stored within the Cloud database to ensure it is accessible by all Cost Estimator while providing the single source of truth throughout organization.
of the
collected, analysis can be done by collecting and assemble the scattered cost data, populate, and evaluate the unit rates competitiveness against various measures or references as shown in Figure 5. This is to ensure that each of the database produced are cloud competitive against the market prior cloud migration. Finally, it can also be utilized to develop benchmarking statistics/charts if relevant.
To address the pain point on the uncollated database, enhancement on the out turn data was made to better manage the cost database hence improving the response time and data gathering Throughprocess.
Proceedings PAQS Congress 2022, 12th 13th September 2022, Singapore Institute of Surveyors and Valuers, Singapore
utilization of the tool developed, the results from the out turn projects will subsequently create the project database. As database is a key for Quantity Surveyor to perform an estimation, it can be from various resources such as historical project cost, market survey and Withprocurement.allofthedata

Figure 4. Tool Back End Representation
The granular internal defined norms for cost and concepts will allow configurable rules-based engine hence eliminating the black box approach. The users are able to explore the cost drivers and subsequently identify the optimization levers. At the back end, the tool can be represented as per Figure 4.
The process starts with getting the take off quantities from drawing either from BIM modelling or traditional method. Once user complete the project information such as of location, year of execution, the system will generate rates based on location factor, escalation index applied.
This categorization is based on Civil Engineering Standard method measurement (CESMM) that has been established by Construction Industry Development Board (CIDB) Malaysia. The categories such as site clearance, drainage, road work etc. This system shows the description of works, unit, and rates. Once all information done, User will click on Update and proceed to result to generate the bill of quantity (BQ).
The brain will be ready to generate the cost based on selection. Next, user needs to select on the category, type and option.
4.1 Case Study 1: Building Build-Up Rate and Estimation (X)
23 Proceedings of the PAQS Congress 2022, 12th 13th September 2022, Singapore Institute of Surveyors and Valuers, Singapore
The tool simplified the analysis thru simple platform e.g., Power BI for visualization, Excel and data source stored within company’s cloud system. The tool and system were designed accordingly to the oil and gas business requirement instead of generic tool in the market which is more suitable for building and infrastructure works complexity. These includes Preambles, Preliminaries, Earthworks, General Piling and Testing, Precast Concrete, Precast Spun Piles
Drainage turfing and fencing. Moving forward, additional elements will be added to enrich further the database. The elements unit rates within the tool e.g., labor, machinery will then be connected to generate the estimation. The user interface of the tool is shown in Figure 6.
Figure 5. Structure vs. Unstructured Database

Built up rates aretheprocess ofcalculatingthecost ofeach material involvedin aconstruction. In making estimation, the template is important for beginners to make cost planning based on the scope that has been given. As estimators, basic things that we plan at beginning stage is the Work Breakdown structure (WBS). It has to ensure covered overall scope before perform estimation. In our quantity surveying practices, the estimation is made with PreliminaryDesign Abstracts (PDA) and then Built Up Rates is a mandatory calculation to obtain the project cost. Most organizations have their internal Built up rates template.
Below case studies will further discuss the process in getting the build up rates and the output.
Through this tool, significant value creation has been identified i.e., single collated database as the estimation works is produce and save in the cloud platform, single point of truth hence improving the delivery speed as well as improved the quality and cost reduction or avoidance from 3rd party consultant engagement.
In the oil and gas industry, petrol stations are one of marketing retails that is designed direct to the customer. Currently PETRONAS has more than 1200 Petrol Station around Malaysia. As to attract the costumers’ experiences, from time to time, business will construct new stations or refurbish and upgrading existing facilities. The design will be updated approximately every 5 years including islands which determine the scale of the petrol stations.
24 Proceedings of the PAQS Congress 2022, 12th 13th September 2022, Singapore Institute of Surveyors and Valuers, Singapore Figure 6. Build Up Tool Interface
Petrol station is a typical onshore project compared to other building or services construction.
The Build Up tool has been pre loaded with the prototype model in order to implement the “Design 1 Built Many” and the application of 3D BIM for design. Based on the simulation, it improved the delivery speed due to the standard design hence maintaining the quality by the consistency of technical and cost accuracy.
4.2 Case Study 2: Petrol Station Build-Up Rate and Estimation
User will also be able to edit the rates or customize the item which is not covered under the standard template according to the drawing requirement. The bill of quantity will directly connect with e bidding system for the tendering process which is control by Procurement Department. This feature will result in accelerating the deliverables required i.e., commercial model and early error or gap identification.

Other than the location, year of execution also required in order to generate rates based on location, escalation and inflation on execution year that determine money of the day. As the tool is intended for the feasibility study stage, stage, the size of construct area will be generated based on the typical design of piling and number of piles required.
The estimation process will start with development of scope of work and WBS for all engineering disciplines. The breakdown includes site preparation, architectural, piling model, civil and structure model, mechanical & electrical and external works. The scope of work is shown in Figure 7. 7. Petrol Station Scope of Work

The summary cost report will then be produced once all the input has been submit followed by benchmark generation. This tool may also produce Bill of quantity (BQ) which is custom for the petrol station projects and in lump sum quantity unlike Case 1 which able to produce more details output. Nonetheless, this BQ will still be able to cover the whole element consist of
Figure
25
Proceedings of the PAQS Congress 2022, 12th 13th September 2022, Singapore Institute of Surveyors and Valuers, Singapore
The WBS will then connect and synchronize with the unit rates cost database. Regular update will be done to ensure database competitiveness and reflecting the current market situations.
As for the substructure due to the soil condition treatment, design of piling and substructure will be varying between project to project Therefore, during the engineering stage, designer will only be spending time and cost for substructure instead
Next, the user will select on create new project at the dashboard page. The scope and quantities will be extracted from drawing or direct from 5D BIM modelling. At this stage, minimum project information requirement such us number of pump island, type of retail shop and other technical input as given by Business.
With a good historical data, benchmarking can be performed by engineering disciplines in order to monitor cost assurances on each of facilities.
The digitalization of this tools will benefit Business to get early feasibility study cost to run the project economics. Once it meets the business model, Business may proceed for next gate with the high possibility of cost accuracy. Similar with case 1, the Cloud promotes easy sharing and collaboration between team to develop the cost estimation.
5 Conclusion
Significant value creation is also seen during the estimation of Petrol Station projects as the tool will enable the estimation to be done in house especially for the “Design and Build” contracting strategy. This will improve the delivery speed as well as securing the confidential information of the company.
Proceedings of the PAQS Congress 2022, 12th 13th September 2022, Singapore Institute of Surveyors and Valuers, Singapore Preamble, Preliminary, Work items, daywork schedule and grand summary. The user interface for Petrol Station project is shown in Figure 8.
26
Figure 8. Petrol Station User Interface
Less than a decade ago, the team never imagined cost estimating will be fully automated which will address the human capital issues. The pandemic has accelerated most companies push into the digital transformation. It is a change management exercise that requires lot of grit and effort to create a culture and subsequently execute it to remain ahead of the curve in the business. The initiative’s end state will enable a full range of cost estimation scenarios to be assessed at digitalspeed,basedoncomprehensivetechnical andcostdefinition,automatedscreeningbased
This this also has been developed internally using Excel for template and database and synchronize with the source file for in Power BI visualization. This is useful for other team members and management view to monitor the performances.

We thank our team members who provided valuable insights and expertise in completing the initiative.
27 Proceedings of the PAQS Congress 2022, 12th 13th September 2022, Singapore Institute of Surveyors and Valuers, Singapore on project drivers, and enhanced benchmarking to improve the selection process. As the nature of estimation work shifts away from manual deliverables generation now enabled through human retooling, a re focus on value obsession, assurance and risk management is possible as part of continuous improvement of project realization outcomes. 6
Acknowledgement
This paper aims to provide an overview of the PPVC development in Singapore since 2015, such as the government role in the successful implementation of the new technologies, the constraints that affecting the types and delivery of PPVC in Singapore, and the design and contractual framework for the project stakeholders to overcome the initial and ongoing challenges. The paper also aims to find out how Covid 19 affects the PPVC project progress through an informal interview and a factory visit with two Integrated Construction and Prefabrication Hub (ICPH) operators.
Prefinished Volumetric Construction (PPVC) Development In Singapore
Keywords: COVID 19, DfMA, ITM, Modular Construction, PPVC.
1 Introduction
One of the key products of DfMA is Prefabricated Prefinished Volumetric Construction (PPVC). With the Government’s strong and continued supports such as stipulating mandatory requirement for the adoption of PPVC for new government land developments, more than 35 nos of PPVC projects have been generated since 2015. The government was also envisioned to create a double demand in 2020 & 2021, before the strong hits of the pandemic to the global construction industry.
With the aim of transforming Singapore’s built environment to be more advanced and integrated through adoption of new game changing technologies, the Singapore Government launched the Construction Industry Transformation Map (ITM) in October 2017. The Construction ITMis oneofthe23ITMs identifiedundera$4.5billionIndustryTransformation Programme proposed by the Government’s Future Economy Council (FEC). One of the 3 key approaches of the Construction ITM is Design for Manufacturing and Assembly (DfMA).
DfMA and PPVC is the Government’s strong initiative to transform Singapore’s built environment. WhiletheadoptionofPPVCmightstill createdesign andconstructionchallenges to the project team, with the experience gained and the lesson learnt from this paper, it will certainly help to smoothen the implementation process and improve the construction methods.
Proceedings of the PAQS Congress 2022, 12th 13th September 2022, Singapore Institute of Surveyors and Valuers, Singapore
Jacqueline Chie Sze Huan, email: jacquelinehuancs@gmail.com Singapore Institute of Surveyor and Valuers
Abstract With the aim of transforming the Singapore’s built environment to be more advanced and integrated through adoption of new game changing technologies, Singapore government launched the Construction Industry Transformation Map (ITM) in October 2017. One of the three key approaches of the ITM is Design for Manufacturing and Assembly (DfMA). The concept of DfMA has been introduced since 2015 to improve the construction productivity. It is a design approach that focuses on ease of manufacturing and efficiency assembly, in the minimum time and lower cost.
Prefabricated
28
Besides monetary support, new mandatory conditions and requirements were also enacted as part of the Government’s strong efforts in promoting the adoption of PPVC in the construction projects. For the private sector, stipulated as the mandated land sales conditions for new development sold under Government Land Sales (GLS) Programme from 1 November 2014, the Developer is required to adopt the PPVC for selected non landed residential and hotel land parcels. An example of the imposition of the PPVC requirement in the GLS programme is enclosed herewith as Appendix A
2 What is PPCV and why PPCV?
Singapore’s Building Construction Authority (BCA) stipulates the minimum requirements for PPVC which both the Developer and the Main Contractor shall comply with. Extracted from the Code of Practice on Buildability 2017 (COP 2017), the minimum level of use of PPVC shall be 65% of the total super structural floor area of the building or the component of the building that is to be used for residential or private dwelling purposes. The COP 2017 also clearly indicates the minimum level of finishing and fittings to be completed off site for the volumetric modules (see Table 1). Should there be any deviation from these minimum levels is necessary, prior approval must be sought from BCA.
3 Government regulation for PPVC in Singapore
• Better construction environment due to lesser construction works and manpower on site, such as reduction of dust and noise pollution, lesser construction waste and better site safety; and
The concept of DfMA has been introduced since 2015 through the launching of the 2nd Construction Productivity Roadmap which set aside a funding of S$450 million aimed to improve Singapore's construction productivity. It is a design approach that focuses on ease of manufacturing and efficient assembly, in the minimum time and lower cost. Some of the examples of DfMA concepts are Prefabricated Bathroom Units (PBUs), Mass Engineered Timber (MET) and Prefabricated Mechanical Electrical and Plumbing (MEP) System. In Singapore, Prefabricated Prefinished Volumetric Construction (PPVC) is one of the key products of DfMA due to the strong and continued Government’s initiatives in generating the project demands.
Withmaintenance.majority
• Improve productivity by up to 40% in terms of manpower and time savings, depending on the complexity of the projects;
29 Proceedings of the PAQS Congress 2022, 12th 13th September 2022, Singapore Institute of Surveyors and Valuers, Singapore
PPVC is a modular construction that adopts the concept of “factory assembly followed by onsite installation”. It comprises integrated free standing volumetric modules complete with internal finishes, fixtures and fittings that are manufactured in the factory, and then to be delivered to site for installation in a ‘lego like’ manner. There are 3 types of PPVC systems available in the market, namely concrete, steel and hybrid of concrete and steel in which concrete PPVC modules are more commonly used in Singapore due to the climate and better of the on-site construction works shifted to off-site controlled factory environment, adoption of the PPVC is envisaged with the following benefits:
• Improve quality control as off site fabrication can generate higher quality end products.
Source: BCA, 2017
The Government also encourages the adoption of PPVC through formulating a master plan of the development of Integrated Construction and Prefabrication Hubs (ICPH) with a 30 year lease term. ICPH is a multi storey automated and high degree mechanized manufacturing facilities which produce prefabricated components including PPVC modules. From 2017 onwards, the Contractor who develops ICPH can also apply for the Land Intensification Allowance (LIA) which aims to promote the intensification of industrial land use towards more land efficient and higher value added activities across various sectors in Singapore.
30 Proceedings of the PAQS Congress 2022, 12th 13th September 2022, Singapore Institute of Surveyors and Valuers, Singapore
A comprehensive acceptance framework was also being established in ensuring that all PPVC systems designed by different Consultants and Contractors are reliable, robust and meet minimum standards. The acceptance framework consists of two parts acceptance by the Building Innovation Panel (BIP), followed by accreditation under and the PPVC Manufacturer Accreditation Scheme (PPVC MAS).

Table 1 Minimum level of finishing and fittings to be completed off site
Figure 1 Application Process of PPVC Manufacturer Accreditation Scheme
Source: BCA, 2020

To date, 33 nos of Concrete PPVC Systems and 17 nos of Steel PPVC Systems have been accepted by the BIP and 5 nos of ICPHs are constructed and in full operation. The full list of the approved PPVC systems and the operators of ICPH is enclosed herewith as Appendix B
PPVC requires huge land space for the production and storage of the volumetric modules. In the land scarce Singapore, this has become a luxurious request and hence resulted in a unique arrangement of the modular construction process. Typically, the volumetric module will be fully fabricatedwithin thesamemanufacturingfactoryforit's structural, architectural andMEP components. For Singapore’s PPVC, the fabrication process is split into two parts: structural carcass factory in neighboring country (i.e. Johor, Malaysia) and architectural and MEP fit out factory in Singapore. Even with the successful implementation of the 5 ICPHs up to date, according to CKR and SoilBuild, they are only able to produce 20% of the total precast components required for the construction works and the industry is still highly reliant on Malaysia's factories for the remaining 80%.
If exceeds the above controlling parameters, LTA permit and Auxiliary Police Escort are required for the module transportation from point to point.
The other two deciding factors on the module design are transportation and hoisting limits. Logistics for module transportation from factory to site determines the maximum size and volume of each module design. In compliance to Land Transport Authority (LTA)‘s traffic regulatory requirements, the ideal dimension of a single PPVC module shall be as follow:
5 Design and Construction Constraints
With the strong push by the Singapore’s Government for the DfMA and PPVC, the DfMA adoption rate (in term of Gross Floor Area (GFA)) has increased from 19.2% in 2017, the year ofthelaunchofConstructionITM,to44%in2021.Ithassurpassedthe ITMtargetofachieving 40% in 2020 and Mr Desmond Lee, Minister of Ministry of National Development (2022) affirmed that the built environment sector is on track to meet its next target of 70% of GFA by As2025.of December 2019, BCA has also created 36 PPVC projects (34 residential sites and 2 hotels) through the GLS programme and envisioned 39 more in the following 2 years. If to includethePPVC projects in thepublicsector,whichis 35%ofthenewpublichousingprojects according to the Housing and Development Board (HDB), it is believed that more than 40 PPVC projects or close to 50 PPVC projects have been successfully generated as of end 2019.
31 Proceedings of the PAQS Congress 2022, 12th 13th September 2022, Singapore Institute of Surveyors and Valuers, Singapore 4 Current Outlook of PPVC in Singapore
• Height: < 4.5 metres (inclusive of truck height)
• Width: ≤ 3.4 metres • Laden Weight: < 80 tons
As most of the Government’s released statistics on DfMA and PPVC are only available up to end 2019, an informal interview and a factory visit were conducted with two ICPH operators, to understand further on how COVID 19 pandemic has affected the progress and development of PPVC in Singapore in 2020 and 2021. The impact of COVID 19 shall be discussed in length at the latter part of this paper.
• Transportation
Thecurrent availabletypes ofhoisting cranes (i.e. towercrane,mobilecrane andcrawlercrane) have a similar lifting capacity of 25 tons to 40 tons, which dictates the maximum weight of a single PPVC module to be. As such, while making the layout plan design fully complies with regulatory requirements, the Designer and Contractor shall also ensure the PPVC module size allows transportation from factory to site and within the hoisting limits.
The PPVC module requires custom made mould which are unlikely to be recycled and reused for other projects. The higher number of the different modules in one PPVC project, the more precast moulds are required and hence, more cost to be added to the overall contract sum.
Being Singapore's first private PPVC building that was completed in 2016, the cost premium of adopting PPVC in Crown Plaza Changi Airport Hotel Extension was estimated to be 10 to 15% more as compared to conventional reinforced concrete construction (Today, 2016). With the launch of Construction ITM in 2017 and more PPVC players have come into the market, the estimated cost premium has been further reduced to 8% as of February 2020 (BCA, 2020). The estimated cost premium of PPVC is mainly driven by the following cost factors:
32 Proceedings of the PAQS Congress 2022, 12th 13th September 2022, Singapore Institute of Surveyors and Valuers, Singapore Figure 2 Illustration of off site factories in Johor, Malaysia and Singapore and the construction site

• Precast Mould
Compared to the one time transportation of the conventional precast concrete component, the PPVC module requires two times transportation before reaching the construction site, i.e. from carcass factory to the fit out factory and from fit out factory to the construction site. Also, in theevent that LTApermit andAuxiliaryPoliceEscortis requiredas highlightedin theprevious section, the application cost for the permit and escort shall constitute an additional cost to the overall contract sum.
6 Cost Implications
Contractual Framework
Source: BCA, 2020 Hoisting Crane
•
33 Proceedings of the PAQS Congress 2022, 12th 13th September 2022, Singapore Institute of Surveyors and Valuers, Singapore Figure 3 Type of Hoisting Cranes

7.1 Early Contractor Involvement (ECI)
The PPVC module generally requires heavy duty hoisting cranes for on site installation. The initial cost and rental of such cranes is considerably higher than typical capacity cranes.
• Off-Site Yard PPVC requires two off site fabrication yards: carcass factory and fit out factory. Additional costs are incurred for setting up, operating and maintaining PPVC manufacturing factories in Malaysia and Singapore. Additional cost in sending off site and overseas supervisors is also required in ensuring the product quality and full compliance to the COP 2017.
7
One of the key benefits of adopting PPVC is the significant construction time savings. For example, in The Clement Canopy, a 40 storeys high condominium which is still the world’s tallest concrete PPVC building (before the completion of the 56 storeys high Avenue South Residence targeted in 2022), took 7 days to construct a floor, compared to 14 to 21 days using conventional construction method. One of the learning points from this project was the early confirmation of designs and materials which led to a smooth production cycle that constituted time savings.
Progress Payment and Advance Payment Guarantee
Proceedings of the PAQS Congress 2022, 12th 13th September 2022, Singapore Institute of Surveyors and Valuers, Singapore Particularly due to the complexity of the PPVC module and its own proprietary system, Developers are highly encouraged to engage the PPVC Manufacturers and Contractors early through the ECI approach. ECI is an approach where Contractors are engaged early during the design stage to facilitate integration of design and construction process, through early collaboration between the Developer, Consultants and Contractors. The PPVC manufacturers and Contractors can be engaged during the Concept Design stage and/or Schematic Design stage to provide their technical input in developing a more comprehensive design of structural, architectural and MEP. This helps in providing better and more effective technical solutions to the PPVC modules before the actual tender launch. In terms of procurement approach, Design & Build or Design Development & Build are also more preferred than the traditional Design Bid Build for construction projects involving PPVC.
Payment for material off site is not a contractual provision in most standard forms of contract in Singapore. Hence, the immediate concern of most PPVC contractors is whether employers are willing to make payment for PPVC works that are mostly carried out at the off-site yards.
To address the contractor’s major concern on the construction cashflow, conditional payment schemes for off site PPVC works have been developed.
34
Under the Public Sector Standard Conditions of Contract (PSSCOC), an Option Module of “Lump Sum Advance Payment for PPVC” has been introduced. An Advance Payment Guarantee is required to be submitted by the Contractor to the Employer (Developer) as a condition precedent to any Advance Payment to be made by the Employer. Within 28 days from the date of the receipt of the Advance Payment Guarantee and security deposit (performance bond) by the Employer, the Employer shall pay to the Contractor an advance payment of 20% of the PPVC costs, capped at 10% of the total construction sum unless otherwise stated in the Appendix of the PSSCOC. The Employer is entitled to recover the Advanced Payment by equal installments at the agreed intervals from the agreed recovery start date as specified in the Appendix, from the Contractor’s submitted payment claimed amount.
Figure 4 An Overview of ECI in Design Stage Source: Khoo, 2015 7.2

With the adoption of the PPVC, some of the NSCs’ products such as sanitary wares, wardrobes and switches shall be delivered to off site fit out yards instead of the construction site. Back to back provisions relating to payment, advance payment guarantee and insurances shall be provided and stipulated clearly in the NSC’s contract to ensure the water tightnesses of the overall contract provision between the Main Contract and NSCs.
7.3 Insurances Due to some off site PPVC works to be carried out in oversea factories, the existing off site storage and inland transit endorsement that have territorial limits in Contractor’s All Risks Policy (CAR) are no longer sufficient. Additional Property All Risk Policy is required to cover off site fabrication in another country. A proper Marine Cargo Insurance is also required to cover shipments or transit of the PPVC modules from another country to Singapore. Both insurance policies are to be issued in the joint names of both the Contractor and Employer so long the PPVC modules are stored overseas. As such, it is preferable for the Contractor to directly procure the insurance from the Employer’s insurance broker in ensuring the Employer’s full overseas insurance coverage is being well taken care of.
• Upon completion of the PPVC carcass: 30% • Upon completion of the off site fit out: 30% • Final installation on site: 40%
Similarly, an Advance Payment Guarantee from the Contractor remains as a condition precedent prior to any milestone payment to be made by the Employer.
The unexpected COVID 19 pandemic has affected economies and businesses around the world including the growing progress of the DfMA and PPVC development in Singapore. One example is the master plan of the development of ICPH. The Construction ITM has targeted to construct up to 10 ICPHs by 2020 but as of February 2022, only 5 ICPHs are completed and in full operation. To further understand the impact of COVID 19 on PPVC development, informal interviews and factory visits were conducted with 2 ICPH operators in 2022. A list of questions (see Appendix C) was sent to the ICPH operators prior to the visit and a fruitful discussion and factory tour that lasted for about 2 hours was conducted.
35 Proceedings of the PAQS Congress 2022, 12th 13th September 2022, Singapore Institute of Surveyors and Valuers, Singapore Unlike the PSSCOC, the standard forms of contract used in the private sector, i.e. Singapore Institute of Architects Articles and Conditions of Building Contract and the REDAS Design and Build Conditions of Contract donot containsimilarpaymentprovisions as oftoday. Whilst a similar advance payment scheme has been adopted to some of the private PPVC projects, a milestone payment framework based on the agreed % has also been negotiated to facilitate the PPVC payment. The most common schedule for milestone payment is shown as follow:
7.4 Nominated Sub Contracts (NSCs)
8 Impact Of COVID-19 on PPVC development
this backdrop, COTMA was enacted on 7 April 2020 aims to provide temporary reliefs to specific contracts that fall within the eligible period. These reliefs include universal Extension of Time (EOT) for construction contracts (Part 8A), co share of certain costs between contracting parties (Part 8B) and reliefs for parties affected by the increase in foreign manpower costs (Part 10).
SoilBuild highlighted that the cost premium of adopting PPVC has reverted back to the initial level of 15% during the pandemic period. A surge in the cost of material, shipping/ transportation, labour, etc. due to various COVID restrictions and shortage of resources are the contributing factors. The pandemic situation has further triggered the PPVC manufacturers to be innovative on how to improve PPVC design and production to achieve more time and cost savings. A research and development department was then set up in ICPH operator’s organisation. It is an incubation centre of engineering design through harnessing digital technology and introducing automation and robotics in DfMA. According to their research, one potential improvement is the configuration of PPVC modules. Currently, the modules are configured by the Consultants according to the Architect’s design layout. The number of the module size is highly dependent on the layout configuration which determines the required number of precast mould for one project. The ICPH operator proposed suggestion is through the ECI in the design stage, the PPVC manufacturers can provide a list of market available PPVC mould designs for the Consultants’ consideration in configuring the
Government Support Measure for PPVC
Besides the reliefs provided under COTMA, upon the Contractors’ submission and on a case by case basis, BCA has granted waivers to relax the minimum required level stipulated in the COP 2017 on the finishing and fittings to be completed off site for the PPVC modules. One example is allowing full cabinetry works to be done on site instead of only restricted to door
According to one ICPH operator, the border closure between Malaysia and Singapore resulting from the execution of Malaysia’s Movement Control Order (MCO) and Singapore’s Circuit Breaker (CB) has minimal impact on PPVC. Although the PPVC module transportation was put to halt at the beginning, such precast construction works had soon to be classified as critical and essential services and the delivery between both countries had resumed shortly after. What impacts the PPVC development the most is the shortage of construction workers, which is not unique to construction projects involving PPVC but the entire Singapore’s built environment Againstsector.
Theinstallation.Government
11 Innovation to Improve PPVC Design
36 Proceedings of the PAQS Congress 2022, 12th 13th September 2022, Singapore Institute of Surveyors and Valuers, Singapore 9 Government Reliefs under the COVID-19 (Temporary Measures) Act (COTMA)
10
has also furthersupported oneofthe ICPHoperatorin providing aTemporary Occupational Land (TOL) at Punggol Pulau Timor as a temporary manufacturing and storage space for their precast components including PPVC modules. The bulky and heavy PPVC modules are unable to be stored on site and hence, Just in Time (JIT) delivery and installation are crucial for the smooth construction site progress. COVID 19 badly hit the site operation and many construction programme plannings were beyond the industry players’ control. Therefore, the TOL space at Punggol Pulau Timor serves as an in time aid to one ICPH operator in resolving the PPVC modules’ storage issue.
Proceedings of the PAQS Congress 2022, 12th 13th September 2022, Singapore Institute of Surveyors and Valuers, Singapore unit layout plan. The project team can mix and match or adopt the similarity from the available PPVC systems in customizing their PPVC modules. This will increase the recycling and reusing rate of the precast mould which will help in reducing the cost premium.
13 References
Arcadis Singapore Pte Ltd. (2017) Design for Manufacturing & Assembly Prefabricated Pre Finished Volumetric Construction (DfMA PPVC). Arcadis Insights, Issue 1. [Online] Available at: BuildingBuildingBuilding[Accessedfinished/media/project/arcadiscom/com/perspectives/asia/publications/insights/prefabricatedhttps://media.arcadis.com/-prevolumetricconstruction.pdf?rev=3ca5adcf068e4cc6baad7f42c305bde0on28February2022]ConstructionAuthority.(2017)CodeofPracticeonBuildability2017Edition.pp.56.[Online]Availableat:https://www1.bca.gov.sg/docs/defaultsource/docscorpbuildsg/constructionitm/cop2017.pdf.[Accessedon28February2022]ConstructionAuthority.(2019)AnnexBFactsheetonDesignforManufacturingandAssembly(DfMA).[Online]Availableat:https://www1.bca.gov.sg/docs/defaultsource/docscorpnewsandpublications/annexb.pdf?sfvrsn=cce13313_0.[Accessedon28February2022]ConstructionAuthority.(2019)PipelineofProjectsPrescribingDfMATechnologies(forconstructiontendersexpectedtobecalledbetweenJan2020toDec2021).[Online]Availableat:https://www1.bca.gov.sg/docs/defaultsource/docscorpbuildsg/constructionitm/2020pipelinedfmaprojectsin2020and2021(writeup)(rev2).pdf?sfvrsn=9d0460_0.[Accessedon28February2022]
37
12 Conclusion With the strong support in terms of monetary fundings, regulations and even reliefs during the COVID 19 pandemic rendered from the Government to the adoption of DfMA and PPVC, the message is clear that Singapore’s construction industry is determined to transform to be an advanced and integrated sector. Significant demands for DfMA projects have been generated since the launch of the Construction ITM in 2017. More PPVC players have entered the market since then which has brought down the estimated cost premiums of adopting PPVC from the initial 15% to less than 8% before the pandemic. The key cost drivers have been identified and discussed in length in this paper. Comprehensive contractual frameworks for PPVC projects such as Early Contractor Involvement during the design stage and milestone payment scheme for off site PPVC works have also been developed over the years to address the design and construction constraints highlighted in this paper. Whilst COVID 19 inevitably slows down the progress of PPVC development and increases the cost premiums, and the adoption of PPVC is still imposing design and construction challenges to theproject team, theindustryplayersseetheopportunityin harnessingthe digitaltechnology and robotics in PPVC to further reduce the construction time and increase cost savings. It is also believed that by adopting more innovation and game changing technologies in the built environment sector, it will attract and retain more local young talents in the industry. With the experiences gained and the lessons learnt from all the completed and on going projects, it will certainly help to smoothen the implementation process for the built environment sector to reap the full benefits of DfMA and PPVC in the near future.
Building Construction Authority and Urban Redevelopment Authority. (2014) New Regulations to Improve Productivity in the Construction Sector. [Online] Available at: https://www1.bca.gov.sg/docs/default source/docs corp news and publications/media releases/pr06112014_bca.pdf?sfvrsn=5a5253e_0. [Accessed on 28 February 2022]
Building Construction Authority. (2020) Integrated Construction and Prefabrication Hub (ICPH). [Online] Available at: https://www1.bca.gov.sg/buildsg/productivity/design for manufacturing and assembly dfma/integrated construction and prefabrication hub icph. [Accessed on 28 February 2022]
Building Construction Authority. (2021) List of Suppliers / Manufacturers that meet the PPVC Performance Requirement. [Online] Available at: https://www1.bca.gov.sg/buildsg/productivity/design for manufacturing and assembly dfma/list of suppliers manufacturers that meet the ppvc performance requirement. [Accessed on 28 February 2022]
Ho,K.M.,Lam,J.P.and Shea,M.(2018)Pre FabricatedPre FinishedVolumetricConstruction (PPVC) For Residential Projects. [Online] Available at: https://surbanajurong.com/perspective/pre fabricated pre finished volumetric construction ppvc for residential projects/. [Accessed on 28 February 2022]
Housing and Development Board. (2017) New Initiatives to Boost Construction Productivity in HDB Projects. [Online] Available at: https://www.hdb.gov.sg/cs/infoweb/about us/news and publications/press releases/new initiatives to boost construction productivity. [Accessed on 28 February 2022]
Khoo, S.B. (2015) Early Contractor’s Involvement A Paradigm Shift in Procurement Approach. [Online] Available at: http://www.icoste.org/wp content/uploads/2010/09/050.pdf. [Accessed on 28 February 2022]
Building Construction Authority. (2020) Design for Manufacturing and Assembly (DfMA) Prefabricated Prefinished Volumetric Construction. pp. 16. [Online] Available at: https://www1.bca.gov.sg/docs/default source/docs buildsg/ppvc_guidebook.pdf?sfvrsn=1a7b4580_2.pdf.corp[Accessed
Building Construction Authority. (2020) PPVC Manufacturer Accreditation Scheme. [Online] Available at: https://www1.bca.gov.sg/buildsg/quality/industry accreditation schemes/ppvc manufacturer accreditation scheme. [Accessed on 28 February 2022]
Ministry of National Development. (2022) Speech by Minister Desmond Lee at the Topping Out Ceremony of Avenue South Residence. [Online] Available at:
38 Proceedings of the PAQS Congress 2022, 12th 13th September 2022, Singapore Institute of Surveyors and Valuers, Singapore Building Construction Authority. (2019) Prefabricated Prefinished Volumetric Construction (PPVC) Information Kit. [Online] Available at: https://www1.bca.gov.sg/docs/default source/docs corp buildsg/productivity/ppvc_info_kit.pdf?sfvrsn=e716e287_0 [Accessed on 28 February 2022]
on 28 February 2022]
Building Construction Authority. (2020) Prefabricated Prefinished Volumetric Construction (PPVC). [Online] Available at: https://www1.bca.gov.sg/buildsg/productivity/design for manufacturing and assembly dfma/prefabricated prefinished volumetric construction ppvc. [Accessed on 28 February 2022]
Pte Ltd 5 Dragages Singapore Pte Ltd CIMC Modular Building Systems Holding Co. Ltd. 6 Prefab Technology Private Limited Tiong Seng Contractors Pte Ltd and
https://www.mnd.gov.sg/newsroom/speeches/view/speech
by minister desmond lee at the topping out ceremony of avenue south residence. [Accessed on 28 February 2022]
Example of the PPVC Selected GLSI Programme (Residential Development Land Parcel at Dairy Farm Walk) (Singapore)
39
Urban Redevelopment Authority. (2022) Current URA GLS Sites. [Online] Available at: https://www.ura.gov.sg/Corporate/Land
Proceedings of the PAQS Congress 2022, 12th 13th September 2022, Singapore Institute of Surveyors and Valuers, Singapore

Requirement in the
Today. (2016) Lego like building method to speed up Crowne Plaza Changi Airport hotel extension. [Online] Available at: https://www.todayonline.com/singapore/extension crowne plaza changi airport slated completion june. [Accessed on 28 February 2022]
14AppendixAppendicesA
Sales/Current URA GLS Sites/. [Accessed on 28 February 2022]
Source: URA, 2022 Appendix B1 List of PPVC Suppliers / Manufacturers S/N Concrete PPVC System Supplier / Manufacturer Steel PPVC System Supplier/ Manufacturer 1 Excel Precast Pte Ltd Unitised Building Pty Ltd 2 SPP System Pte Ltd Sembcorp EOSM Pte Ltd 3 Integrated Precast Solutions Pte Ltd Moderna Homes Pte Ltd 4 Vico Construction Pte Ltd AM Modular
Proceedings of the PAQS Congress 2022, 12th 13th September 2022, Singapore Institute of Surveyors and Valuers, Singapore Steeltech Industries Pte Ltd 7 CS Corp Pte Ltd and ICPH International Pte Ltd Dragages Singapore Pte Ltd 8 Mod Prefab Private Limited TTJ Design and Engineering Pte Ltd 9 Qingjian International (South Pacific) Group Development Co Pte Ltd Quicksmart Technology (Singapore) Pte Ltd 10 Sembcorp EOSM Pte Ltd Mod Prefab Private Limited 11 China Construction Realty Co. Pte Ltd iMax Modular Pte Ltd 12 HL Building Materials Pte Ltd TK Modular Pte Ltd 13 G & W Precast Pte Ltd Lightrus Pte Ltd 14 Sunway Concrete Products (S) Pte Ltd Tong Hai Yang Construction Private Limited 15 Moderna Homes Pte Ltd Qingjian International (South Pacific) Group Development Co Pte Ltd 16 Robin Village Development Pte. Ltd and Robin Village International Pte Ltd Australian Robotic Building Technologies Pte. Ltd. 17 Nakano Singapore (Pte) Ltd CNQC Engineering & Construction Pte. Ltd 18 Kimly Construction Private Limited 19 United Tec Construction Pte Ltd 20 TK Modular Pte Ltd 21 K&H Innovative Systems Pte Ltd 22 BHCC Construction Pte Ltd 23 Sim Lian Construction Co (Pte) Ltd 24 VC Modular System Pte Ltd 25 CNQC Engineering & Construction Pte. Ltd 26 Welltech Construction Pte Ltd 27 CCL Precast Private Limited 28 Hua Siah Construction Pte Ltd 29 Ssangyong Engineering & Construction 30 China Jingye Engineering Corporation Ltd (Singapore Branch) 31 Gammon Pte. Limited 32 Master Contract Services Pte Ltd 33 Lian Beng Construction(1988) PteSource:Ltd URA, 2022
40
4. Is ICPH able to produce all the precast components that your firm needs for the construction project on hand? If not, what is the manufacturing rate of ICPH compared to the factory in Malaysia or other place/ country?
1 Kaki Bukit Road 6 (KB 1) CKR Contract Services Pte Ltd 2 Kaki Bukit Road 6 (KB 2) Straits Construction Singapore Pte Ltd 3 Airport Road (Defu 1) Soil Build (Pte) Ltd 4 Airport Road (Defu 2) Teambuild Engineering & Construction (Pte) Ltd 5 Pulau Punggol Barat (PPB 1) HL Sunway JV Pte Ltd Source: BCA, 2020
a. What is your firm mitigation plan on the above COVID 19 impact?
ICPH Operator
Appendix C -
Location and Operators of 5 ICPH
2. What is the PPVC market in the past two years (i.e. 2020 & 2021) in the built environment industry?
1. How many PPVC projects have your firm has currently?
3. Does ICPH help to improve the construction productivity of precast components? If yes, how does ICPH help?
5. How does COVID 19 impact the precast component manufacturing process (eg. material, labour, shipping)?
b. Besides COTMA, any other government support on the COVID 19 impact to the precast component manufacturers?
S/N Location
List of Questions for ICPH operators
41 Proceedings of the PAQS Congress 2022, 12th 13th September 2022, Singapore Institute of Surveyors and Valuers, Singapore Appendix B2
The AEC sector has not embraced digital transformation as enthusiastically as other sectors (Lokshina et al 2019). The potential of the AEC industry making the transition to the digital era is made possible by the Internet of Things (IoT), which has been extensively used in a few fields. Due to its widespread usage and advantages, which have resulted in its implementation in several disciplines, it has become a hot research topic. IoT is "a system of interconnected computing devices, mechanical and digital machines, objects, animals, or people that are provided with unique identifiers and the ability to transfer data over a network without requiringhuman to humanorhuman to computerinteraction,"accordingtoElijahetal(2018).
IoT might have a significant impact in several industries, including building construction, operation,andmanagement byenablinghigh quality services, deliveringefficient features, and supporting in the pursuit of sustainable development goals (Jia et al 2019).
Keywords Bibliometrics, artificial intelligence, internet of things, smart buildings, network sensors.
The construction sector may now overcome its time and resource limits as well as its frequent defaults thanks to the usage of IoT (Tang et al 2019, Ghosh et al 2021). It may alter how people use and keep an eye on structures, ultimately enhancing the end user experience (Ruiz Zafra et al 2022). The building has developed from being used as a basic shelter throughout time into a smarter, more complicated structure that uses emerging technologies (Li et al 2021), making it an intelligent building. To maximise performance and energy management. Daissaoui et al (2020) defined an intelligent building system as one that combines intelligent building
The study of smart buildings is becoming increasingly important in the field of architecture, engineering, and construction (AEC), especially in sustainability. Smart buildings are made possible by the Internet of Things (IoT). This study uses the Scopus database to perform a bibliometrics analysis of articles from 2010 to 2021 that discuss IoT applications in smart buildings.Theobjectiveistodefinethestagesofdevelopment,identifyIoTapplicationclusters in smart buildings, and create a framework for the IoT ecosystem for smart buildings. In total, 1062 documents from 3163 different authors representing 1957 distinct institutions from 89 different countries were examined. The most often found clusters included internet of things, automation, network architecture, smart buildings, and intelligent buildings. Based on the five clusters that were identified, the IoT ecosystem for smart buildings is divided into five major processes: data gathering, data transmission, data analytics, data visualisation, and automation.
42 Proceedings of the PAQS Congress 2022, 12th 13th September 2022, Singapore Institute of Surveyors and Valuers, Singapore
Towards A Framework of Internet of Things (IoT) In Smart Buildings: A Bibliometric Approach
The results of this study will be used by policymakers to identify key topics in IoT enabled smart buildings and to guide future research in the policymaking process.
Bruno Lot Tanko, b.tanko@reading.edu.my School of the Built Environment, University of Reading Malaysia, Johor Bahru 79100, Malaysia
Abstract
1 Introduction
III. What is the Internet of Things Framework for Smart Buildings? 2 Methodology
According to a study by Adegoriola et al (2021), a systematic review is a crucial tool for identifying critical knowledge gaps and research needs. To circumvent the drawbacks of the conventional review methodology, a hybrid qualitative and quantitative method using bibliometrics analysis is used to analyse the existing papers on IoT and Smart buildings. The research process for this work is shown in Figure 1.
43
I. Which stages of IoT development in smart buildings are currently underway, according to the publication year?
II. Which IoT application clusters are there in smart buildings?
Several actions can be taken in response to a change in the status of any of the connected components in a smart building. Jia et al (2019) submitted that, the rise of connected information is one of the goals of smart buildings which is being driven by the Architecture, Engineering, Construction, and Operation (AECO) business. But sustainability is a generally acknowledged requirement, leading to energy efficient and hospitable smart buildings. To ease the adoption of IoT in smart buildings, there is a need for collaborations between various disciplines, such as civil or building engineering, communication, and information technology, electrical and electronics engineering, and computer science, in order to understand the challenges that can be solved or enhanced using IoT in smart buildings. The investigation of IoT applications in smart buildings may potentially reveal additional prospective domains and lines of inquiry for methodological and technological advancement. More research is therefore required on the application of IoT in the construction sector’s smart buildings.
Even though IoT research is well established, few thorough traditional literature reviews and systematic literature reviews on IoT for smart buildings exist. The study's goal is to evaluate IoT and smart buildings during the past eleven years using bibliometric data. Therefore, we are driven to address the following three major research concerns in this study:
Proceedings of the PAQS Congress 2022, 12th 13th September 2022, Singapore Institute of Surveyors and Valuers, Singapore management systems and big data analytics. The concept of "smart buildings" was developed through the incorporation of cutting edge technology into structures and its services. This enables remote operation and administration of the entire life cycle of the building structures, increased occupant comfort and convenience, and management of cost and energy efficiency. Big data analytics, cloud and fog computing, sensor deployment, and IoT are examples of advanced technology. The Internet of Things (IoT) has emerged as the technology that will help a smart building's various components connect the most. The IoT assists in addressing theintricatenetworkof connected,functioning entities in asmart building (Risteska Stojkoska and Trivodaliev 2017)
In recent decades, numerous studies on smart cities and smart buildings have been conducted (Minoli et al 2017). The global smart building market is anticipated to grow from USD 66.3 billion in 2020 to USD 108.9 billion by 2025 because of technological improvements in cloud computing, 5G, AI, and IoT (Li et al 2021). Smart building management systems make use of several sensors and actuators; windows, doors, and lighting are just a few of the components of a structure that are connected to sensors and actuators, which keep an eye on the condition of each component (Daissaoui et al 2020).
IdentificationofAppropriateDatabase L(SCOPUS,WebofScienceCoreCollection,etc.) argestRecordsIdentifiedthroughSCOPUS Database 1167Documents
Figure.1 Research procedure of the study
44 Proceedings of the PAQS Congress 2022, 12th 13th September 2022, Singapore Institute of Surveyors and Valuers, Singapore
ResearchClusters I d e n t i f i c a t i o n S c r e e n i n g & I n c l u s i o n S c i e n c e M a p p i n g & N e t w o r k A n a l y s i s
To choose the best database for this study, the paper first evaluates the most important research databases, including Scopus and Web of Science (WOS). The Scopus database was found to be the biggest and most suitable databank during the initial inspection. The two most complete databases for searching the literature in numerous scientific fields are Scopus and the WOS (Tanko and Mbugua 2022). Many authors have asserted that the Scopus database is the most IoTFrameworkforSmartBuildings
IdentificationofAppropriateSearchKeyword ("IoTenabledSmartBuildings","IoTintergratedSmartBuildings", "IoTinSmartBuildings","IoTandSmartBuildings","IoT"and"Smart Buildings","InternetofThings"and"SmartBuildings","IoTbased SmartBuildings" Selectionof"InternetofThings"and"Smart Buildings"astheappropriatekeywordusing ArticleTitles,AbstractsandKeywords (1167Documentsfrom20102022) (1077Documentsfrom20102021 witharticlesinpress) (1062Documentsfrom20102021 withoutarticlesinpress) (UploadofSCOPUScsvfile(1062)toVOSviewerSoftware KeywordsCooccurrence,Coauthorship,Cocitationsbetween countries,sponsors&researchinstitutions)
Scientometric mapping is a type of big data analytics that compiles applications and resources offeringmoreinformationonthedependabilityandutilityofthedatausedinstrategicplanning. Consequently, scientometric analysis has been created for the science mapping approach (Zakka et al 2021). According to (Tanko and Mbugua 2022), scientometrics entails employing scientific mapping and co citation networks to visualise important research fields (Chen 2017). Researchers find it more and more challenging to manage the literature and conduct objective literature reviews as the number of scientific publications rises.
Finding the suitable search terms to utilise within the Scopus database is the second screening step. “IoT enabled Smart Buildings” (14 documents), “IoT integrated Smart Buildings” (1 document), “IoT in Smart Buildings” (7 documents), “IoT” in “Smart Buildings” (973 documents), “IoT” and “Smart Buildings” (1040 documents), “Internet of Things” and “Smart Buildings” (1167 documents), “IoT and Smart Buildings” (2 documents), and “IoT based Smart Buildings” (14 documents) were all examined as keywords. The search terms "Internet of Things" and "Smart Buildings" were chosen since they produced the most documents (1167), while also taking care of other related search terms. The major archival period for academic research outputs used in this study was 2010 to 2021. I looked at Scopus' current literature on IoT and Smart Buildings during this time.
2.1 Bibliometric Search
45 Proceedings of the PAQS Congress 2022, 12th 13th September 2022, Singapore Institute of Surveyors and Valuers, Singapore comprehensive source of citations and abstracts for literature searches (Darko et al 2020, Shukra and Zhou 2021, Zakka et al 2021).
2.2 Science Mapping and Scientometric Analysis
Bibliometrics is a logical area of academic writing that captures quantitative information on publications, particularly the frequency of citations (Shi and Yin 2021, Lot Tanko and Mbugua 2022). According to (Mukherjee et al 2022, Tamala et al 2022), Performance analysis, science mapping, and network analysis are the three main components of bibliometric analysis. A descriptive method for assessing indicators linked to publications and citations is performance mapping. The item's co occurrence weight and overall link strength, which are supplied by the item, are a method for presenting the influences and strengths of relationships among different article attributes in science mapping. Evaluation of network metrics, grouping, and visualisation are frequently employed in network analysis. (Mukherjee et al 2022) concluded that Bibliometric research presents unique opportunities to contribute to theory and practice since top journals and scholars from various disciplines have published numerous highly impactful articles utilizing bibliometric techniques to study different fields’ evolutionary nuances and capture emerging trends. Figure 2 depicts Performance analysis and science mapping as the two categories in which bibliometric analysis methodologies can be applied. The TITLE ABS KEY was used to enter the bibliometric search of the "IoT" and "Smart Buildings" study areas into the Scopus database. At 10:00 am SGT on July 23, 2022, 1167 documents were automatically extracted from the years 2010 to 2022. Following the initial bibliometric search of journals, 1077 documents (including articles in press) and 1062 publications (excluding articles in press) between 2010 and 2021 were found. This demonstrates that, as shown in Figure 3, research in this area started to garner attention in 2010 (with at least one document).
Figure. 3 Literature sample and year of publication of IoT and smart buildings research
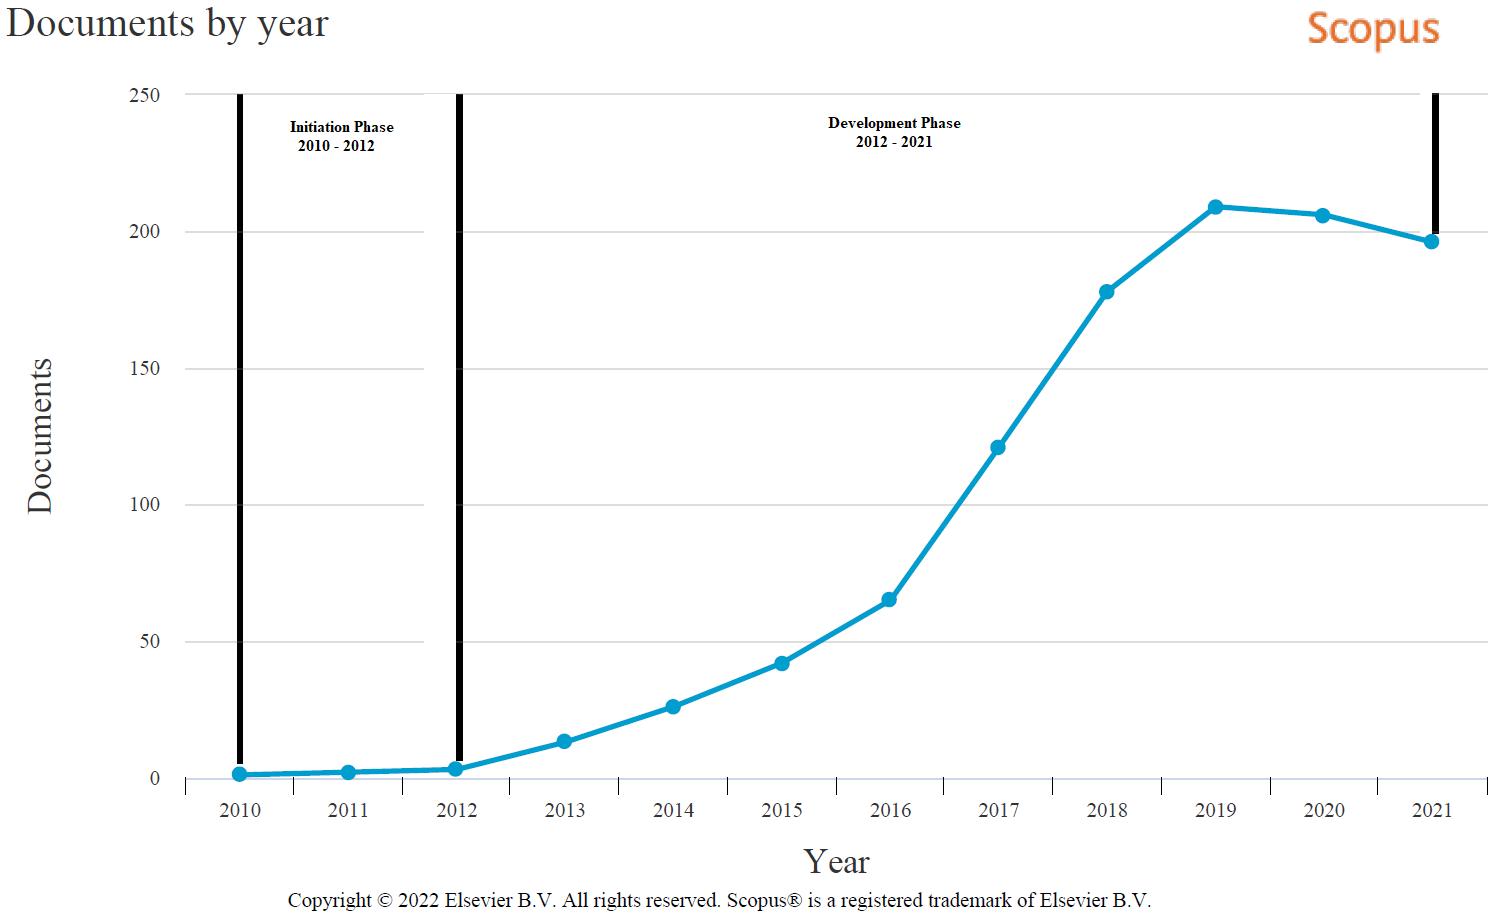
Figure 2. The bibliometric analysis toolbox. (Source: Donthu et al 2021)

46 Proceedings of the PAQS Congress 2022, 12th 13th September 2022, Singapore Institute of Surveyors and Valuers, Singapore
The"VOSviewer", atext mining programmewith user friendly capability forvisualisationand bibliometrics that has been widely used in the field of construction project management, was
3.2 Impact of Countries
3.1 Phases of IoT Development in Smart Buildings
Using keywords search on the Scopus database, a total of 1167 papers on "IoT" and "Smart Buildings" study topics were used. The distribution of publishing years is seen in Figure 3. According to the amount of the annual publication, the development of "IoT" and "Smart Buildings" is largely evaluated in two phases: initiation (commencement) and development phases. The annual publishing volume between the first era (2010 2012) was 1 3 articles, which is incredibly low. During the development phase (2013 2021), the annual publishing volume climbed from 13 in 2013 to 212 and 202 in 2020 and 2021, respectively. Since 2013, the annual publication volume has increased in a quasilinear way as scholarly interest in "IoT" and "Smart Buildings" has increased (Figure 3).
3 Findings and Discussion
47 Proceedings of the PAQS Congress 2022, 12th 13th September 2022, Singapore Institute of Surveyors and Valuers, Singapore employed in this study (Adegoriola et al 2021). Unlike previous applications used to map bibliometrics, the software gives special focus to a graphic representation of bibliometric maps (van Eck and Waltman 2010). In other review based research, it has been applied to the fields of construction engineering and project management (Darko et al 2020, Babalola et al 2021, Shukra and Zhou 2021, Makabate et al 2022). Therefore, it is worthwhile to think about using the “VOSviewer” to analyse and visualise influential papers in the fields of IoT and Smart Buildings.
The section includes information on the stages of IoT development in smart buildings, the impact of different nations, the co occurrence of keywords, and clusters of IoT applications.
As a result, the literature samples in Figure 3 represent nearly ten years of research in this area, with an increasing trendinpublications. Thepatternindicatesthattherewas no"IoT" or"Smart Buildings" research before 2010. However, there has been an increase in publications since 2013. The 1062 papers were further examined using the Scientometric methodology to offer insights into these publications, including their research keywords and collaborating nations.
The associations between the nations represented in the various publications are shown in Figure 4 along with a few clusters. A good sign of this is the co authorship of publications, which refersto writersfrom different nations whowrotethesamearticle.Eachcirclerepresents a nation, and the size of the circles is determined by the total number of publications in each nation. From first to tenth place, in that order, were the United States of America (USA), France, China, Italy, Germany, India, Spain, Australia, the United Kingdom, and Pakistan. The clusters of these nations and their neighbouring or surrounding nations show a strong association. Mexico and the US are allies, as are China and South Korea, France and Germany, the UK and Greece, Italy and Spain, Australia and India, and Malaysia and Indonesia. The countries in the centre of the cluster have the most nodes connected to them (for instance the USA).
48 Proceedings of the PAQS Congress 2022, 12th 13th September 2022, Singapore Institute of Surveyors and Valuers, Singapore
Figure 4. Relationships between countries Table 1 lists the nations with the strongest overall links as well as those where most studies were co cited. With 116 total link strength, 199 total papers, and a total of 5631 citations, the United States has the greatest overall link strength, documents, and co citations
S/N Countries Documents Citations Total Link Strength 1 United States 199 5631 116 2 France 68 1237 63 3 China 70 1330 54 4 Italy 81 1644 52 5 Germany 45 452 49 6 India 123 1520 45 7 Spain 62 984 41 8 Australia 45 446 37 9 United Kingdom 55 718 37 10 Pakistan 23 490 29 11 Canada 35 506 26 12 South Korea 39 1194 24 13 Greece 29 704 23

Internet of things, Network Architecture, Intelligent buildings, Smart Building, and Automation are the most important clusters. These groups offer a thorough overview of the several subjects that are pertinent to IoT and smart buildings.
As a crucial component of scientometric studies, keywords provide a framework for exposing investigations in a given topic and provide an overview of the current study field in that sector (Tanko and Mbugua 2022). Keywords communicate the research content's primary points and focal point. In the form of a coloured neural network, Figure 5 shows a few clusters where keywords appear at least 20 times. Each node is a keyword, and the link texture between them indicates the degree of relationship. The keywords analysis discovered five clusters by using a community finding technique.
Proceedings
Table 1. Countries with total link strength and where most of the research were co cited France is in second place with 63 total link strength, 68 papers, and 1237 citations, followed by China in third with 54 total link strength, 70 documents, and 1330 citations. The huge number of documents indicates that IoT and smart building research still lacks a global perspective.
49 of the PAQS Congress 2022, 12th 13th September 2022, Singapore Institute of Surveyors and Valuers, Singapore 14 Malaysia 25 223 19 15 Austria 11 110 19 16 Saudi Arabia 22 448 19 17 United Arab Emirates 13 170 18 18 Brazil 25 238 18 19 Hong Kong 12 42 16 20 Singapore 19 499 13
Figure 5. Co occurrence network of keywords related to IoT and smart buildings
3.3 Co-occurrence of Keywords

3.4 Clusters of IoT Applications in Smart Buildings Research on IoT and Smart Buildings has identified several primary keywords as shown in Table 2. In the cluster related to the Internet of Things, cluster 1 with the colour yellow in Figure 6, where only terms with a minimum of 20 co occurrences have been highlighted, the main associated keywords are IoT applications, Internet of things, network security, smart city, blockchain, and information services network security. IoT devices require an internet connection and are embedded systems that communicate with sensors and actuators. These IoT gadgets are also known as IoT sensors (Elijah et al 2018).
Cluster Major Keyword Associated Keywords Theme Phase of Overall Process
1 Yellow Internet of things Internet of things, IoT applications, network security, smart city, blockchain, information services Internet of things & network security Data Collection
2 Purple ArchitectureNetwork Bigdata,informationmanagement, cloud computing, computer architecture, data handling, decision making ArchitectureNetwork & Cloud Computing Data Transfer Red buildingsIntelligent Intelligent buildings, smart environment, smart buildings, buildings, user interfaces buildingsIntelligent& EnvironmentSmart Data Analysis
50 Proceedings of the PAQS Congress 2022, 12th 13th September 2022, Singapore Institute of Surveyors and Valuers, Singapore
BuildingAutomationSystems(BAS)areInternetofThings(IoT) basedsolutionsusedinsmart buildings. The building manager uses specialised software to operate the spaces, approve requests, and keep track of accesses (Ruiz Zafra et al 2022a), which is significant from the perspective of building management processes (Dave et al 2018).
3
5
Automation & SystemsEmbedded Automation
Table 2. Major Keywords detected in IoT and Smart Buildings research
4 Green Smart Building Smart buildings, energy efficiency, energy utilization, energy management Smart Buildings & Energy Efficiency Data Visualization Blue Automation Embeded systems, cyber physical system, smart homes, access control, ambient intelligence, energy harvesting, smart power grids &
Control
Figure 6. Custer 1 Internet of things & network security


51 Proceedings of the PAQS Congress 2022, 12th 13th September 2022, Singapore Institute of Surveyors and Valuers, Singapore
Figure 7. Custer 2 Network Architecture & Cloud Computing
The second cluster in Figure 7 is highlighted in purple and focuses on network architecture, which includes big data, information management, cloud computing, computer architecture, data handling, and decision making (all of which have at least 20 co occurrences). The core components of an IoT based system are sensors and actuators, sometimes referred to as the wireless sensor actuator network (WSAN).
The third cluster in Figure 8 is related to intelligent buildings, smart environments, smart buildings, buildings, and user interfaces. Only keywords with at least 20 co occurrences have been underlined in this cluster. The integration of wireless sensor networks, timers, and motion sensors in office spaces or sustainable buildings offers a practical tool to identify and respond to occupants while giving them feedback data to drive behavioural adjustments (Hernández Ramos et al 2015).
Figure 8. Custer 3 Intelligent buildings & Smart Environment
The fourth cluster (highlighted in green in Figure 9) was associated to Smart buildings, energy efficiency, energy utilisation, and energy management when keywords with at least 20 co occurrences were highlighted in that cluster. This shows how Internet of Things (IoT) technology have facilitated the development of applications to improve buildings and their surrounds, leading to "smart environments" or "smart spaces," such as smart homes (Ruiz Zafraetal2022).AccordingtoWikipedia,"intelligentbuildings"are"buildingswithintegrated enterprise, control, and materials and construction, implemented both individually and as a system to be flexible" (Le et al 2019). In addition to boosting cities and infrastructure, smart buildingsplayakeyroleinenhancingresidentcomfort. Itimprovesenergyefficiency,manages safety concerns, and provides a better foundation for the comfort, services, and quality of life of residents and businesses (Daissaoui et al 2020).
52 Proceedings of the PAQS Congress 2022, 12th 13th September 2022, Singapore Institute of Surveyors and Valuers, Singapore

Figure 10. Custer 5 Automation & Embedded Systems
53 Proceedings of the PAQS Congress 2022, 12th 13th September 2022, Singapore Institute of Surveyors and Valuers, Singapore
Figure 9. Custer 4 Smart Buildings & Energy Efficiency
According to the blue cluster 5 in Figure 10, embedded systems, cyber physical systems, smart houses, access control, ambient intelligence, energy harvesting, and smart power grids are all essential components to address the difficulties of IoT enabled smart buildings. Smart devices are becoming more and more important in networks that rely on automation and Internet platforms. Most of these gadgets are cell phones with incorporated software that enables users to track and assess remote actions in real time (Le et al 2019).


Data collection, data transfer, data analysis, data visualisation, and automation and control are the procedures involved.
54
Figure 11. IoT Framework for Smart Buildings

3.5 IoT Framework for Smart Buildings
Based on the annual publication volume, the study identified two phases for IoT and Smart Buildings research: initiation from 2010 to 2012 and developmental from 2013 to 2021. Since 2013, IoT and Smart Buildings have received more scholarly attention, and the annual publication output has increased in a quasilinear way. The top countries for publishing this field of study include the United States, France, China, Italy, Germany, Spain, Australia, and the United Kingdom. The makeup of most of the clusters is significantly influenced by their geographic location. The keyword analysis produced a list of numerous words with a variety of meanings that were connected to themes like IoT, cloud computing, smart grid, internet, energy efficiency, energy utilisation, sensor networks, big data, embedded systems, building management systems, intelligent buildings, automation, and internet protocols. Five clusters were identified by the bibliometric research, which was used to discuss the IoT framework for smart buildings. Data
Buildings now use IoT to increase their efficiency, dependability, and safety. The five primary processes identified by the study's bibliometric analysis are briefly explored in the context of the IoT framework for smart buildings (Figure 11).
Proceedings of the PAQS Congress 2022, 12th 13th September 2022, Singapore Institute of Surveyors and Valuers, Singapore
4 Conclusions
Data are collected from sensor nodes that are built into smart buildings (Data collection) and then transferred from the sensor nodes to the network server (data transfer). The information from thesmart building'sdatais analysedto providerelevant informationandinsights forsmart decision making(dataanalysis). Thedatavisualisationlayerenablesthemobiledeviceto view the analysed data thereby enabling the interaction between the real world and the virtual world via a mobile data visualisation (data visualisation). Finally, the automation and control of several appliances in the building is made possible by programmable hardware devices that are connected to the internet (automation, and control).
Darko, A., Chan, A.P.C., Adabre, M.A., Edwards, D.J., Hosseini, M.R., and Ameyaw, E.E., 2020. Artificial intelligence in the AEC industry: Scientometric analysis and visualization of research activities. Automation in Construction, 10.1016/j.autcon.2020.103081
Donthu, N., Kumar, S., Mukherjee, D., Pandey, N., and Lim, W.M., 2021. How to conduct a bibliometric analysis: An overview and guidelines. Journal of Business Research, 133, 285 296. van Eck, N.J. and Waltman, L., 2010. Software survey: VOSviewer, a computer program for bibliometric mapping. Scientometrics, 84 (2), 523 538.
Babalola, A., Musa, S., Akinlolu, M.T., and Haupt, T.C., 2021. A bibliometric review of advances in building information modeling (BIM) research. Journal of Engineering, Design and Technology, 10.1108/JEDT 01 2021 0013
Chen, C., 2017. Science Mapping: A Systematic Review of the Literature. JournalofDataand Information Science, 2 (2), 1 40. Daissaoui, A., Boulmakoul, A., Karim, L., and Lbath, A., 2020. IoT and Big Data Analytics for Smart Buildings: A Survey. In: Procedia Computer Science. Elsevier B.V., 161 168.
Jia, M., Komeily, A., Wang, Y., and Srinivasan, R.S., 2019. Adopting Internet of Things for the development of smart buildings: A review of enabling technologies and applications. Automation in Construction, 101, 111 126.
Proceedings of the PAQS Congress 2022, 12th 13th September 2022, Singapore Institute of Surveyors and Valuers, Singapore collection, data transfer, data analysis, data visualisation, automation, and control are all processes that make up the IoT Framework. Policymakers can use this study as a starting point to identify key themes in IoT enabled smart buildings and for additional research in the policymaking process. Despite the importance of this study, it has certain drawbacks. The dataset used for the analysis was mostly taken from the Scopus database, and the mixed review approach and scientific mapping utilising the “Vosviewer” software are the focus of this review. The industry reports can be used in future works, and Long-term trends may be revealed through future studies. The state of the art of "IoT" and "Smart Buildings" might be thoroughly analysed to see whether additional research is necessary to address these constraints. Even though these restrictions exist, I think they have no bearing on the overall direction of the current "IoT" and "Smart Buildings" research. 5 References Adegoriola, M.I., Lai, J.H.K., Chan, E.H., and Amos, D., 2021. Heritage building maintenance management (HBMM): A bibliometric qualitative analysis of literature. Journal of Building Engineering, 42, 10.1016/j.jobe.2021.102416
Ghosh, A., Edwards, D.J., and Hosseini, M.R., 2021. Patterns and trends in Internet of Things (IoT) research: future applications in the construction industry. Engineering, Construction and Architectural Management, 10.1108/ECAM 04 2020 0271
55
Elijah, O., Rahman, T.A., Orikumhi, I., Leow, C.Y., and Hindia, M.N., 2018. An Overview of Internet of Things (IoT) and Data Analytics in Agriculture: Benefits and Challenges. IEEE Internet of Things Journal, 5 (5), 3758 3773. 10.1109/JIOT.2018.2844296
Noguera, M., 2022. IFC+: Towards the integration of IoT into early stages of building design. Automation in Construction, Shi,10.1016/j.autcon.2022.104129S.andYin,J.,2021.Global
Proceedings of the PAQS Congress 2022, 12th 13th September 2022, Singapore Institute of Surveyors and Valuers, Singapore Li, P., Lu, Y., Yan, D., Xiao, J., and Wu, H., 2021. Scientometric mapping of smart building research: Towards a framework of human cyber physical system (HCPS). Automation in Construction, 10.1016/j.autcon.2021.103776
Tanko, B.L. and Mbugua, L., 2022. | ijbes.utm.my | eISSN 2289 8948| IJBES. International Journal of Built Environment and Sustainability, 9 (1), 23 37. Tang, S., Shelden, D.R., Eastman, C.M., Pishdad Bozorgi, P., and Gao, X., 2019. A review of building information modeling (BIM) and the internet of things (IoT) devices integration: Present status and future trends. Automation in Construction, Zakka,10.1016/j.autcon.2019.01.020W.P.,AbdulShukorLim,
56
Minoli, D., Sohraby, K., and Occhiogrosso, B., 2017. IoT Considerations, Requirements, and Architectures for Smart Buildings Energy Optimization and Next Generation Building Management Systems. IEEE Internet of Things Journal, 4 (1), 269 283.
Mukherjee, D., Lim, W.M., Kumar, S., and Donthu, N., 2022. Guidelines for advancing theory and practice through bibliometric research. Journal of Business Research, 148, 101 115.
Oladinrin, O.T., Arif, M., Rana, M.Q., and Gyoh, L., 2022. Interrelations between construction ethics and innovation: a bibliometric analysis using VOSviewer. Construction Innovation, 10.1108/CI 07 2021 0130
research on carbon footprint: A scientometric review. Environmental Impact Assessment Review, 89, 10.1016/j.eiar.2021.106571
Shukra, Z.A. and Zhou, Y., 2021. Holistic green BIM: a scientometrics and mixed review. Engineering, Construction and Architectural Management, 28 (9), 2273 2299. Tamala, J.K., Maramag, E.I., Simeon, K.A., and Ignacio, J.J., 2022. A bibliometric analysis of sustainable oil and gas production research using VOSviewer. Cleaner Engineering and Technology, 7, 10.1016/j.clet.2022.100437
N.H., and Chau Khun, M., 2021. A scientometric review of geopolymer concrete. Journal of Cleaner Production, 10.1016/j.jclepro.2020.12435
Makabate, C.T., Musonda, I., Okoro, C.S., and Chileshe, N., 2022. Scientometric analysis of BIM adoption by SMEs in the architecture, construction and engineering sector. Engineering, Construction and Architectural Management, 29 (1), 179 203.
Risteska Stojkoska, B.L. and Trivodaliev, K. v., 2017. A review of Internet of Things for smart home: Challenges and solutions. Journal of Cleaner Production, Ruiz10.1016/j.jclepro.2016.10.006Zafra,A.,Benghazi,K.,and
Lokshina, I. v., Greguš, M., and Thomas, W.L., 2019. Application of integrated building information modeling, iot and. In: Procedia Computer Science. Elsevier B.V., 497 502.
Proceedings of the PAQS Congress 2022, 12th 13th September 2022, Singapore Institute of Surveyors and Valuers, Singapore
Key words Building Information Modelling, Quantity Surveying profession, fundamental recipe 1 Introduction According to Husien et al. (2021), the construction sector is both an important tributary of the world economy and a key resource for the local economy's entire product. This is backed further by Alaloul et al. (2021), who noted that the construction sector contributes significantly to a nation's GDP, which is why the development of the construction industry in each country is critical to the country's economic prosperity. Nonetheless, a number of difficulties, such as fragmented project delivery methods, prolonged delays, cost overruns, and disagreements among construction players, have had a detrimental influence on the construction sector (Eastman et al, 2008). As a result, construction firms have devised a number of strategies and methods, such as introducing design and build procurement methods, project web sites, 3D CAD tools, and many more, to mitigate the concerns that have been identified. Although all of these approaches tend to increase the speed with which information is sent, they are still unable to totally eradicate the issues associated with paper based communication methods, as
The traditional building process may no longer be appropriate, necessitating a shift to another option. Previous experts have emphasised that the transition to big technological growth entails dangers, problems, and possibilities for the building sector. The construction sector is now bound towards Building Information Modelling (BIM), where the phenomena of inflexible culture and strong resistance to transformation is well known. Furthermore, the challenge of transformation in the construction industry is more than just the fact that the fundamental principles of an organisation must be altered. This study intends to offer the secret formula for being a driving force in the implementation of BIM within the Quantity Surveying profession.
Theconclusions ofthis study are intendedto highlight themajorsignificant elements as recipes of driven forces on BIM into the Quantity surveying profession.
Nadzirah Zainordin (corresponding author), email: Nadzirah@ucsiuniversity.edu.my UCSI University, Malaysia Wai Kuen Wong UCSI University, Malaysia Sui Lai Khoo UCSI University, Malaysia Abstract
The objective of this research are to further analyse the benefits, constraints, and anologies of driving BIM into the Quantity Surveying profession. There are 36 index papers that have been utilised as a pilot journal for the systematic review which fall within 10 years (2012 to 2021).
Recipes in Manoeuvering Building Information Modelling (BIM) to Quantity Surveying Profession
57
Table 1 and Figure 1 shows the benefits of BIM implementation in the construction industry. In total, 20 scholars have been referred to. After reviewing all of the papers, the benefits of BIM may be divided into eight categories: time, cost, quality, design, communication and
The speed of development in the construction sector is increasing, while the quality of construction is improving as a result of rapid development and science and technology inventions (Zhang et al, 2021). There are several innovative technologies available today that may be used in building projects. Building Information Modelling is one of the useful technologies (BIM). According to Haron et al. (2017), BIM is one of the methods used by construction organisations to efficiently monitor and manage projects. According to Alaloul et al. (2018), the BIM consists of five primary characteristics: visualisation, coordination, simulation, optimization, and plotting capacity. Since BIM enable the construction projects to be designed and managed digitally through the virtual three dimension building model, hence, Ahlam et al. (2021) stated that BIM is a type of revolutionary technology. According to Haron et al. (2017), in order to efficiently apply BIM in construction projects, reliable solutions are necessarytotransmitinformationacrossthevarioussoftwaretoolswhilealsoenablingefficient coordination and monitoring procedures amongst construction stakeholders. As a result, in this paper, further discussion on the benefits of BIM, the Constraints Factors to BIM implementation, and the analogies of BIM in order to improve BIM implementation in the construction industry.
58 Proceedings of the PAQS Congress 2022, 12th 13th September 2022, Singapore Institute of Surveyors and Valuers, Singapore described by Abdullah et al (2016). For example, the building sector is still dealing with challenges such as the inability to identify parametric capacity, disputes, and constructability, among others. In other words, the conventional construction process may no longer be acceptable, necessitating a shift to another option. However, Ahlam et al. (2021) emphasised that the shift towardbig technological progress includes dangers, problems, andpossibilities forthebuilding business. The dangers and challenges may not cause the building sector to collapse, but they will most likely cause society to react more slowly (Rajnai et al., 2017). This means that before transitioning to a new practise, construction practitioners must comprehend all of the potential risks and challenges andbepreparedto accept both risks andchallenges. Accordingto scholars, one of the most helpful sophisticated technologies employed in the building sector is Building Information Modelling (BIM). Several developed and developing countries have embraced BIM to varying extents (Othman et al., 2021). Some European nations, such as the United Kingdom and the United States, have mandated BIM deployment for building projects in their respective countries. Asian countries, such as Singapore, have attained at least 50% BIM implementation, whereas Oceania countries, such as Australia, have attained 42% BIM adoption. The majority of prior academics' findings highlighted a lack of information on BIM implementation in the Quantity Surveying (QS) profession as a primary hindrance to not embracing BIM. QS has the lowest BIM adoption rate among professions, at only 3%, owing to a lack of understanding of both software and hardware BIM solutions (Ali et al., 2013). Even though most governments in various nations have required BIM adoption for all government projects, it is still not making the playoffs, particularly in industries controlled by the private sector rather than the public sector (Quek, 2012). As a result, this paper may go on to address benefits, constraints factors, and anologies of BIM. These may lead to the development of a pre conceptual framework for better understanding and manuevring BIM in the QS profession.
2.1 The Benefits of Building Information Modelling
2 BIM to Quantity Surveying Profession
After that, followed by the fifth highest frequency which is 17 for cost benefit. According to Shibani et al. (2021), Penahi et al. (2020), Koptsopoulou (2020), Samimpay et al. (2020), and Saka et al. (2020), using BIM might minimise the entire cost of a building project. At the same time, BIM can help to avoid cost overruns (Haron et al., 2017). This is due to BIM's ability to deliver an excellent integration of design and cost (Abd Hamid et al., 2018). In other words, the client's budget will not be surpassed. Furthermore, respondents from the Saber et al. (2020)
Adoption of BIM in construction projects, according to Koptsopoulou (2020), Samimpay et al. (2020),Sakaet al.(2020),andSaberet al.(2020),couldminimisethetimerequiredtocomplete the project. The design process may be accelerated by utilising BIM since it ensures that all project stakeholders understand and accept the design as soon as feasible (Chan et al., 2019).
For example, if the contractor is able to supply the relevant information about the site as required in BIM, the design team might proceed with the design activity faster and deliver feedback to the contractor in a shorter period of time than in the traditional method (Memon et al., Besides2014).that, the second highest frequency is quality benefits which has 19 frequencies.
According to Shibani et al. (2021), Penahi et al. (2020), Koptsopoulou (2020), Samimpay et al. (2020), and Saka et al. (2020), using BIM might minimise the entire cost of a building project. At the same time, BIM can help to avoid cost overruns (Haron et al., 2017). This is due to BIM's ability to deliver an excellent integration of design and cost (Abd Hamid et al., 2018). In other words, the client's budget will not be surpassed. Furthermore, respondents from the Saber et al. (2020) and Alufohai (2012) studies believe that BIM may successfully lower project costs and contribute to cost savings. While the design benefit has the third highest frequencies of 18. According to Haron et al., BIM will transform the design and construction process for construction projects (2017).
According to Al-Ashmori et al. (2020) and Eastman et al. (2011), the implementation of BIM technology will cover all aspects of the project's design, construction, and operation. The findings of studies such as Hire et al, (2021), Doan et al (2020), Saka et al (2020), Abd Hamid (2018), and Alufohai (2018) show that BIM may enhance design conceptualization and visualisation (2012). This advancement can increase construction stakeholders' knowledge of the design since the 3D model connected with all critical information can be viewed before the real construction begins (Saka et al., 2020). Aside from that, BIM is quite beneficial for developing conceptual design, detailed drawings, and material selection. This is owing to the fact that BIM can handle the problem of specification drafting and client decision making, particularly in material and finish choosing.
Proceedings of the PAQS Congress 2022, 12th 13th September 2022, Singapore Institute of Surveyors and Valuers, Singapore collaboration, safety, minimising disputes, and sustainability. Table 1 shows the frequency of each. The most often reported benefit among the eight key benefits is time benefit, which has been acknowledged by all 20 scholars.
The fourth highest frequency is communication and collaboration benefit which has 17 frequencies. BIM can improve multi party communication and collaboration, as specified by Shibani et al (2021), Belay et al (2021), Othman et al (2021), Hire et al (2021), Ern et al (2020), Penahi et al (2020), Samimpay et al (2020), Saka et al (2020), Saber et al (2020), Al Ashmori et al (2020), Gamil (2019). Communication between construction stakeholders such as architects,engineers,designers,andcontractorsissimple(Doanetal,2020;Memonetal,2014; Succar, 2009). The rationale for this is that BIM facilitates the interchange and interoperability of information across parties (Koptsopoulou, 2020; Al Ashmori et al, 2020; Ilhan et al, 2013).
59
After cost benefit is sustainability benefit which has 10 frequencies. BIM also contributes to the long term viability of projects (Shibani et al, 2021; Hadi, 2020). For those construction players concerned about sustainability, BIM technology might be utilised to do environmental orenergyanalyses (Saka et al, 2020). BIM adoptionis thought to increaseproject sustainability (Doan et al., 2020). The second lowest frequency is 9 for safety benefit. According to Hire et al. (2021), Shibani et al. (2021), Saka et al. (2020), and Al Ashmori et al. (2021), BIM aids safety management by facilitating site planning analysis (2020). Furthermore, BIM permits the inclusion of safety precautions and factors that may be simulated to improve building site safety (Chan et al., 2019). As a result, this contributes to the safety of the personnel on site. The lowest frequency is 8 for minimizing disputes benefit. BIM can minimise disputes among construction stakeholders (Gamil et al., 2019). Because BIM reveals all of the reasons of disagreements and enhances transparency and communication among construction players, the occurrence of disputes may be reduced (Azhar, 2011). Other benefits of BIM implementation includelessclaims,disputes,andlitigationrisks,accordingtothefindingsofBelayetal.(2021) and Lahiani et al. (2020). Furthermore, according to Samimpay et al., BIM might minimise losses and claims (2020).
60 Proceedings of the PAQS Congress 2022, 12th 13th September 2022, Singapore Institute of Surveyors and Valuers, Singapore and Alufohai (2012) studies believe that BIM may successfully lower project costs and contribute to cost savings.
BIM Benefits Authors Time Cost Quality Design andCommunication Collaboration Safety disputeMinimising Sustainability 1. Othman et al (2021) 2. Belay et al (2021) 3. Hire et al (2021) 4. Shibani et al (2021) 5. Al Ashmori et al (2020) 6. Saber et al (2020) 7. Saka et al (2020) 8. Hadi (2020) 9. Doan et al (2020) 10. Samimpay et al (2020) 11. Koptsopoulou (2020) 12. Penahi et al (2020) 13. Ern et al (2020) 14. Chan et al (2019) 15. Gamil et al (2019) 16. Ismail et al (2019) 17. Abd Hamid (2018) 18. Haron et al (2017) 19. Memon et al (2014) 20. Alufohai (2012) Total Times Referred 20 17 20 18 19 9 8 10
Table 2 and highlighted in Figure 2, summarises the literature review on the constraints factors to BIM implementation in the construction sector. There are a total of 21 articles that have been referred to. Based on the literature analysis, the challenges to BIM adoption are classified into six categories: financial, technology, people, management, legal, and government. Table 2 shows that people are the most often reported impediment, with 15 scholars mentioning it. The second highest frequency are financial barriers and management barriers which both have the same frequency of 13 out of 21. The third highest frequency is management consists of 12 times referred. The study from Saka et al. (2020) mentioned that the construction firms would be reluctant to work on BIM projects due to the cost and lack of trained staff in their firms
61 Proceedings of the PAQS Congress 2022, 12th 13th September 2022, Singapore Institute of Surveyors and Valuers, Singapore Table 1: Key benefits of Building Information Modelling
The next highest frequency is 9 which is legal. A standard code of practices and guidelines are necessary to standardize new output and allow efficient communication among the project stakeholders (Haron et al., 2017). Therefore, the BIM practice is likely to face problem when there is lack of standard and guidelines. Folow by the fourth highest frequency is 8 which is technology. This is caused by some of the construction firms are still using the old version software and equipment which is not updated with current technology requirements (Abd Hamid et al., 2018). The lowest frequency is 4 which is the government. The lack of support and motivation from government its one of the issues and the study from Haron et al (2017) stated that the construction players had expectation of government support such as financial subsidy to implement BIM. Hence, the lack of support is one of the constraints factors into the BIM implementation.
Figure 1: Benefit of BIM most times referred by previous scholars

2.2 The Constraints Factors to Implementing Building Information Modelling (BIM)
BIM Constraints factors Authors Financial Technology People Management lLega Government 1. Ahlam et al (2021) 2. Othman et al (2021) 3. Saka et al (2020) 4. Gamil et al (2019) 5. Abd Hamid et al (2018) 6. Meganathan et al (2018) 7. Vass et al (2017) 8. Alhumayn et al (2017) 9. Haron et al (2017) 10. Diaz (2016) 11. CIDB (2016) 12. Liu et al (2015)
Table 2: Constraints factors to implementing
3. Building Information Modelling (BIM) is a method of information sharing between different parties using information technology or a technique with the elements of technology, organization and management

2.3 The Analogies of Building Information Modelling BIM anologies obtained from researchers range from 2017 to 2021. Table 3 summarises the anologies of BIM. After reviewing all anologies from various scholars, it can be concluded that BIM is morethanjust atool orsoftware; it is a process oftransformingthe constructionprocess to an integrated digital manner process by developing a three dimensional model that provides all necessary information andenables all constructionplayers to achieve better cooperationand communication throughout the project's life cycle, ensuring project success.
5. Building Information Modelling (BIM) is one of the most creative processes that help continuous improvement in the construction industry to achieve better cooperation between different sections and ensuring successful project delivery Samimpay et al. (2020)
4. Compared to the traditional 2D drafting tools, BIM is an integrated process that enables architects, engineers, contractors and owners to perceive, from the predesign phase, what their building will look like and more importantly, how it will perform. Lahiani et al. (2020)
Tee et al. (2021)
No BIM understanding Authors 1. Building Information Modelling (BIM) is a process that transforms construction process from fragmental traditional practices to an integrated digital manner process. Othman et al. (2021)
62 Proceedings of the PAQS Congress 2022, 12th 13th September 2022, Singapore Institute of Surveyors and Valuers, Singapore 13. Franco et al (2015) 14. Navendren et al (2014) 15. Masood et al (2014) 16. Gardezi et al (2014) 17. Smith (2014b) 18. Lindblad (2013) 19. Davies et al (2013) 20. Newton et al (2012) 21. Hosseini et al (2011) Total Times Referred 13 8 15 12 9 4
2. BIM is defined as “a model of building information that provides full and necessary information to support all life cycle processes and that can be directly interpreted by computer applications Manzoor et al. (2021)
Figure 2: Constraints factors of BIM most times referred by previous scholars
63
Teng et al. (2018)
Table 3: Analogies of Building Information Modelling
6. BIM is a latest approach towards transforming stakeholder’s thinking about how technology can enhance the level of construction and safety control
Figure 3: Pre conceptual model the recipes in maneuvering BIM to QS profession 3
Proceedings of the PAQS Congress 2022, 12th 13th September 2022, Singapore Institute of Surveyors and Valuers, Singapore No BIM understanding Authors
Zaini et al. (2020)
Chan et al. (2019)
10. BIM is a software model that can be used in project planning, design, monitoring and control among construction project group stakeholders in order to ensure project success. Haron et al. (2017)
7. BIM is a tool of data communication and spatial analysis for integrating data acquisition, exchange, and visualization during the construction project life cycle
Pre-Conceptual Model Recipes in maneuevering Building Information Modelling (BIM) to Quantity Suerveying profession can be further explaining via pre conceptual model in Figure 3 below. A better understanding on the benefits of BIM and the emerging in the 2 factors which are the constraints factors as well as an understanding to the analogies of BIM may further leading to a succes of BIM implementation especially to QS profession.

8. Building In formation Modelling is not just a designing tool but a system to manage the project during its life cycle.
Zoghi et al. (2020)
4
Methodology
There are 36 index papers that have been utilised as a pilot journal for the systematic review which fall within 10 years (2012 to 2021). Table 4 and Figure 4 below showing the frequency on the table used to reflect on the 3 main sub heading discuss earlier in 2.1, 2.2 and 2.3. From Figure 4, the most frequent year
9. BIM is a technology transforming how buildings are designed and constructed. At the same time,it can facilitate multi disciplinary coordination whilst integrating 3D design, analysis, cost estimating and construction scheduling
oN Item 2012 2013 2014 2015 2016 2017 2018 2019 2020 2021
As previously mentioned in detail, it is critical to understand the benefits of BIM, the constraints factors, and the parallels underlying BIM deployment in order to lead a successful implementation of the BIM itself. As the Quantity Surveyor profession expands in terms of services, changing away from conventional or traditional methods andtoward construction 4.0, it is critical that the core information be equipped to the Quantity Surveyor himself.
Conclusions
Because BIM will provide several advantages to the construction sector, the hurdles to BIM implementation must be removed as soon as feasible by using effective techniques to improve BIM implementation. All construction practitioners must collaborate to enhance BIM implementation so that the construction industry may reap the full benefits of BIM technology.
Building Information Modelling (BIIM) is a process of transforming the construction process to an integrated digital manner by developing a three dimensional model that provides all necessary information and enables all construction players to achieve better cooperation and communication throughout the project's life cycle, ensuring project success.
BIM advantages for the construction sector may be classified into eight categories: time, cost, quality, design, communication and cooperation, safety, reducing disputes, and sustainability.

On the other hand, the barriers to BIM implementation in the construction industry can be dividedintosixcategories:financialbarriers,technologybarriers,peoplebarriers,management barriers, legal barriers, and government barriers, while strategies to improve BIM implementation in the construction industry can be divided into seven categories based on roles: government, professional bodies or individuals, higher learning institutions, social media, construction organisations, and construction firms.
64 Proceedings of the PAQS Congress 2022, 12th 13th September 2022, Singapore Institute of Surveyors and Valuers, Singapore 1. Benefits 1 0 1 0 0 1 1 3 9 4 2. factorsConstraints 2 2 4 2 2 3 2 1 1 2 3. Analogies 0 0 0 0 0 1 1 1 4 3 Table 4: Frequency of journal referred according to the year of publication Figure 4: Frequency of journal used parallel with the year of publication 5
To conclude that, the recipes in maneuvering Building Information Modelling (BIM) to
7 References Abd Hamid, A. B., Taib, M. M., Razak, A. A., & Embi, M. R. (2018, April). Building information modelling: Challenges and barriers in implement of BIM for interior design industry in Malaysia. In IOP Conference Series: Earth and Environmental Science (Vol. 140, No. 1, p. 012002). IOP Publishing. Abdullah, M. and Ibrahim, Y.M. (2016), Building information modeling, paper presented at 3 day workshop/annual general meeting of the Nigerian institute of quantity surveyors”, available at: http://niqs.org.ng/wp content/uploads/2016/ Ahlam, B. Q. A., & Rahim, Z. A. (2021, February). A Review of Risks for Bim Adoption in Malaysia Construction Industries: Multi Case Study. In IOP Conference Series: Materials Science and Engineering (Vol. 1051, No. 1, p. 012037). IOP Publishing.
Alaloul W S, Liew M S, Zawawi N A W A and Mohammed B S 2018 Industry Revolution IR 4.0: FutureOpportunities andChallenges in ConstructionIndustryMATEC WebConf.203 1 Alaloul,7 W. S., Musarat, M. A., Rabbani, M. B. A., Iqbal, Q., Maqsoom, A., & Farooq, W. (2021). Construction Sector Contribution to Economic Stability: Malaysian GDP Distribution. Sustainability, 13(9), 5012. Al Ashmori, Y. Y., Othman, I., Rahmawati, Y., Amran, Y. M., Sabah, S. A., Rafindadi, A. D. U., & Mikić, M. (2020). BIM benefits and its influence on the BIM implementation in Malaysia. Ain Shams Engineering Journal, 11(4), 1013 1019.
Alhumayn, S., Chinyio, E. and Ndekugri, I. (2017), “The barriers and strategies of implementing BIM in Saudi Arabia”, WIT Transactions on The Built Environment, Vol. 169, pp. 55 67.
Ali, K. N., Syed Ibrahim Al Jamalullail, S. N. N. & Boon, T. C. (2013). Building Information Modelling Awareness and Readiness. Alufohai, A. (2012, May). Adoption of building information modeling and Nigeria’s quest for project cost management. In FIG Working Week (pp. 6 10)
6 Acknowledgments
We would express our sincere thank you to School of Architecture & Built Environment, UCSI University for a tremendous support toward this research study. To all the contributor directly and indirectly.
Belay,S.,Goedert,J.,Woldesenbet,A.,&Rokooei,S.(2021).EnhancingBIMimplementation in the Ethiopian public construction sector: An empirical study. Cogent Engineering, 8(1),
65 Proceedings of the PAQS Congress 2022, 12th 13th September 2022, Singapore Institute of Surveyors and Valuers, Singapore Quantity Surveying profession its to have a clear understanding on fundamental knowledge of Building Information Modelling (BIM) itself.
Azhar, S. (2011), “Building information modeling (BIM): trends, benefits, risks, and challenges for the AEC industry”, Leadership and Management in Engineering, Vol. 11 No. 3, pp. 241 252.
Eastman, C., Teicholz, P., Sacks, R. and Liston, K. (2008), BIM Handbook: A Guide to Building Information Modeling for Owners, Managers, Designers, Engineers, and Contractors, 2008. 21, John Wiley and Sons, New Jersey.
Olawumi, T. O., & Ho, A. M. (2019). Perceived benefits of and barriers to Building Information Modelling (BIM) implementation in construction: The case of Hong Kong. Journal of Building Engineering, 25, 100764. Chen, S. Y. (1998). The application of the engineering fuzzy set theory, 2nd Ed., Defense Industry Press, Beijing, China, 90 100, 113 pp. Construction Industry Development Board (CIDB) (2016), Malaysia Building Information Modelling report, ISBN 978 967 0997 08 7. CIDBMalaysia.
Hosseini, M. R., Azari, E., Tivendale, L., & Chileshe, N. (2011). Barriers to adoption of building information modelling (BIM) in Iran: Preliminary Results. In proceedings of the The 6th International Conference on Engineering, Project, and Production Management (EPPM2015) (pp. 384 394).
66 Proceedings of the PAQS Congress 2022, 12th 13th September 2022, Singapore Institute of Surveyors and Valuers, Singapore Chan,1886476.D.W.,
Gamil, Y., & Rahman, I. A. R. (2019). Awareness and challenges of building information modelling (BIM) implementation in the Yemen construction industry. Journal of Engineering, Design and Technology. Hadi, Z. S. (2020). A Review paper on Benefits of BIM Adoption to Improve project performance in Iraqi Construction Industry. Int. J. Contemp. Appl. Res, 7. Haron, N. A., Raja Soh, R. P. Z. A., & Harun, A. N. (2017). Implementation of Building Information Modelling (BIM) in Malaysia: A Review. Pertanika Journal of Science & Technology, 25(3). Hire, S., Sandbhor, S., Ruikar, K., & Amarnath, C. B. (2021). BIM usage benefits and challenges for site safety application in Indian construction sector. Asian Journal of Civil Engineering, 22(7), 1249 1267.
Eastman C, Teicholz P, Sacks R and Liston K (2011). BIM Handbook: A guide to building information modeling (BIM) for owners, managers, designers, engineers and construction (New Jersey: John Wiley and Son Inc)
Davies, R., & Harty, C. (2013). Measurement and exploration of individual beliefs about the consequences of building information modelling use. Construction management and economics, 31(11), 1110 1127. Diaz, P.M. (2016), “Analysis of benefits, advantages and challenges of building information modelling in construction industry”, Journal of Advances in Civil Engineering, Vol. 2 No. 2, pp. 1 11.
Doan, D.T.,GhaffarianHoseini,A.,Naismith,N.,Ghaffarianhoseini,A.,Zhang,T.,& Tookey, J. (2020). Examining critical perspectives on building information modelling (BIM) adoption in New Zealand. Smart and Sustainable Built Environment.
Int J Eng Innov Technol 2013;3(4):373 9. Ismail, N. A. A., Adnan, H., & Bakhary, N. A. (2019, May). Building Information Modelling (BIM) adoption by quantity surveyors: a preliminary survey from Malaysia. In IOP Conference Series: Earth and Environmental Science (Vol. 267, No. 5, p. 052041). IOP Koptsopoulou,Publishing.M. (2020). Cost and Benefit Analysis of BIM Implementation in Construction Lahiani,Projects.M.(2020, November). Benefits of BIM implementation in the French construction industry. In IOP Conference Series: Earth and Environmental Science (Vol. 588, No. 4, p. 042055). IOP Publishing. Lindblad, H. (2013). Study of the implementation process of BIM in construction projects: Analysis of the barriers limitingBIM adoption in the AEC industry. (Unpublished Master’s Thesis). University of Stockholm, Sweden. Retrieved from http://kth.diva portal.org/smash/get/diva2:633132/FULLTEXT01
67 Proceedings of the PAQS Congress 2022, 12th 13th September 2022, Singapore Institute of Surveyors and Valuers, Singapore Husien, I. A., Borisovich, Z., & Naji, A. A. (2021). COVID-19: Key global impacts on the construction industry and proposed coping strategies. In E3S Web of Conferences (Vol. 263, p. 05056). EDP Sciences. Ilhan B, Yaman H. Meta analysis of building information modeling literature in construction.
Memon, A. H., Rahman, I. A., Memon, I., & Azman, N. I. A. (2014). BIM in Malaysian construction industry: status, advantages, barriers and strategies to enhance the implementation level. Research Journal of Applied Sciences, Engineering and Technology, 8(5), 606 614. Newton, K., & Chileshe, N. (2012). Awareness, usage and benefits of building information modelling (BIM) adoption the case of the South Australian construction organisations. Management, 3, 12. Othman, I., Al Ashmori, Y. Y., Rahmawati, Y., Amran, Y. M., & Al Bared, M. A. M. (2021). The level of building information modelling (BIM) implementation in Malaysia. Ain Shams Engineering Journal, 12(1), 455 463.
Liu, D. H. (2006). “Efficiency analysis for two phase combination tender model.” Proceedings of 2006 International Conference on Construction & Real Estate Management, Vol. 1, 174Manzoor,179 B., Othman, I., Gardezi, S. S. S., & Harirchian, E. (2021a). Strategies for Adopting Building Information Modeling (BIM) in Sustainable Building Projects A Case of Malaysia. Buildings, 11(6), 249. Martinez, J. C. (1996). “Stroboscope state and resource based simulation of construction processes.” Ph.D. Diss., Civil & Envir. Engrg., Univ. of Michigan, Ann Arbor, MI, 518 pp, <http://www.strobos.ce.vt.edu/>.
Meganathan, S. and Nandhini, N. (2018), “A review on challenges involved in implementing building information modeling in construction industry”, International Research Journal of Engineering and Technology, Vol. 5 No. 1, e ISSN: 2395 0056.
68
Proceedings of the PAQS Congress 2022, 12th 13th September 2022, Singapore Institute of Surveyors and Valuers, Singapore Penahi, S., & Jaralla, Z. (2020). Challenges and benefits of BIM implementation at public clients:: A systematic review. Quek, J. K. “Strategies and frameworks for adopting Building Information Modelling (BIM) for Quantity Surveyors,” Appl. Mech. Mater., vol. 174 177, pp. 3404 3419, 2012
Rajnai Z and Kocsis I 2017 Labor Market Risks of Industry 4.0, Digitization, Robots and AI 343 6 Saber, N. I., & Wali, K. I. (2020). A Study of Current situation, Difficulties, and Advantages of implementing BIM in the Construction Sector in Northern Iraq. Zanco Journal of Pure and Applied Sciences, 32(2), 93 106. Saka, A. B., & Chan, D. W. (2020). Adoption and implementation of building information modelling (BIM) in small and medium sized enterprises (SMEs): a review and conceptualization. Engineering, Construction and Architectural Management. Samimpay, R., & Saghatforoush, E. (2020). Benefits of Implementing Building Information Modeling (BIM) in Infrastructure Projects. Journal of Engineering, Project & Production Management, 10(2). Shibani, A., Bhavsar, A., Hassan, D., & Saidani, M. (2021). Investigating the Benefits of BIM for Mid Rise Timber Buildings in Canada: A Qualitative Study
Ziwen Liu (corresponding author), zwliu001@suss.edu.sg School of Science and Technology, Singapore University of Social Science, Singapore Lu Chang Peh, lukepehlc@suss.edu.sg School of Science and Technology, Singapore University of Social Science, Singapore
With the outbreak and spread of COVID 19 pandemic, the built environment (BE) industry is facing severe restrictions such as safe management measures at the workplace. As a result, there is increasing adoption of digitalisation in the BE sector to counteract against the inconvenience, or more rightly, disruption caused by the pandemic. Globally, digitalisation is recognised as one of the key enablers in BE sector to improve productivity, transparency, and connectivity throughout the value chain of the project. It enables collaborative work and increases efficiency through the intelligent use of data and analytics. It is espoused that digitalisation is not simply the implementation of digital tools, and it should be viewed from a holistic perspective. As digitalisation is more widely accepted in the BE industry, it is pertinent to establish an overall framework to guide the digitalisation transformation of the BE industry. Based on an in depth review of relevant research on the digital transformation, this study examines and reflects on the strategic framework of digital transformation, and systematically expounds it with the HDTF. The proposed HDTF consists of three layers: business and application layer (BL), data layer (DL) and technology layer (TL). BL integrates relevant cost elements such as 5D BIM quantification tools and digital cost management solutions; DL combines cost related data into a common data environment to link stakeholders and different construction phases; TLincludes BIM graphicstechnology, artificialintelligence, data security and other emerging technologies. Together, these three layers form the HDTF, which vision is to make data structured, online, and intelligent. The HDTF was subsequently validated through several real projects. The results show that projects which adopted HDTF have improved data transmission and collaboration. In addition, the proposed HDTF is a foundation for understanding the impact of digital transformation at the enterprise, project, and individual levels.
Proceedings of the PAQS Congress 2022, 12th 13th September 2022, Singapore Institute of Surveyors and Valuers, Singapore
Glodon Company Limited, Malaysia Abstract
Keywords built environment, cost management, digital transformation, framework, integrated digital delivery (IDD), quantity survey.
Myke Ong, myke.ong@cubicost.com
Glodon Company Limited, Malaysia
Nazirul Fariq, nazirul.fariq@glodon.com
Driving digital transformation in the built environment industry: A proposed holistic digital transformation framework (HDTF) in cost management
69
1.1 Digitalisation in built environment (BE) sector
In the first stage “strengthening the Foundation”, there are three key questions, Can the current practice bedigitised? Arewetaking theadvantage oftechnologies and IT? Arewepromoting innovativethinking? For thesecondstage “developmentofdigitalopportunities”, there aretwo key questions: Can we develop new services or products quickly and radically to get ahead? Are we fully leveraging efficiency potentials of digitalisation? Whereas the last stage consists of two key questions: Are there new competitors that are disrupting current business model with latest technology? Are new profit pools emerging? (Meffert and Swaminathan, 2017)
According to a 2017 report by the McKinsey Global Institute, the construction industry is one of the largest sectors of the world economy with the annual expenditure on construction related goods and services reaching 10 trillion USD (Barbosa et al., 2017a). However, the construction industry is one of the most challenging and complex industries in many countries (Mahalingam et al., 2010) and is known for the fragmentation of the specialisations as the construction process involved multiple stakeholders (Dainty, 2006). The construction industry has intractable productivity problems and is lagging behind other industries in the adoption of digital technologies (Barbosa et al., 2017b), but on the other hand, the McKinsey report indicates that the construction industry has huge potential for digitalisation, productivity and growth. It would be an understatement to say that the BE sector has been disrupted by the COVID 19 pandemic. The BE sector has been hit hard by movement restrictions, supply chain disruptions and project delays caused by the coronavirus pandemic, but there is a silver lining that the disruption has become a catalyst and trigger of the long awaited change. There is an realisation by industry and companies alike that trends such as digital transformation, supply chain re engineering, increasing use of off site construction and an increased focus on sustainability will become more evident, and companies that adapt to these trends early will recover more InquicklySingapore, the building environment (BE) sector is the key pillar industry and it contributed approximately 14.6 billion SGD to the country’s GDP in 2021 (Hirschmann, 2022). However, due to its relatively complex construction environment and long construction time, the BE industry is notorious for a lack of integration of project processes or entities, and this has a negative impact on project performance. (Baiden et al., 2006). Henceforth, there is a need to shift gears and focus more on digital technologies to drive productivity in the construction industry. In this context, the Building and Construction Authority (BCA) has released
Many sectors around the world have embraced digital transformation and are constantly integrating innovation intotheirbusinesses. However, compared with other industries, the built environment (BE) sector faces unique challenges and has yet to fully reap the benefits of digitalisation.
70 Proceedings of the PAQS Congress 2022, 12th 13th September 2022, Singapore Institute of Surveyors and Valuers, Singapore 1 Introduction
Digitisation, also known as digital enablement, is the process of converting from analog to digital form (Gartner Glossary : Digitization, 2022), while digital transformation is defined as the utilising disruptive technology to boost productivity, value creation, and social welfare (Ebert and Duarte, 2018). Digital transformation leverages opportunities presented by technology from IT to advanced analytics, sensors, robotics, 3D printing and many other. Meffert and Swaminathan (2017) claim that the three stages that make up the foundation of digital transformation are as follows: 1. strengthening the foundation; 2. development of digital opportunities; and 3. building new ecosystems. Additionally, a number of crucial questions for each of the three stages are further explained.
However, previous studies have been about IDD and developing 5D BIM solutions for construction cost management. There seems to be a dearth of studies on holistic framework to support all QS activities. Hence, this study aims to establish a holistic framework based on a survey of 12 companies to address this knowledge gap.
IDD, which is made possible by Building Information Modeling (BIM) and Virtual Design and Construction (VDC), uses cutting edge info communications technology (ICT) and smart technologies to fully integrate processes and stakeholders along the value chain (BCA, 2020)
2 Literature Review
The literature review process is vital to establish a comprehensive understanding of digital transformation strategy for cost management in the built environment industry. The scientific literature in the field has undergone massive development in recent years. Several studies have been conducted on digitalisation in cost management. For instance, Aibinu and Venkatesh (2014) investigated the progress of BIM of QS in Australia through surveys and interview and found that overall BIM adoption in quantity surveying (QS) professionals was low, and summarised 11 barriers to BIM adoption in Australia Vigneault et al. (2020) created an innovative 5D BIM framework for construction cost management using a systematic review approach and in depth interviews with experts, and the framework outlines the options that best satisfy the needs for cost management techniques throughout various project phases. On the other hand, a number of studies have summarised the use of IDD. For example, Hwang et al. (2020) identified 32 digital and cloud technologies in IDD’s four phases and reported that 38.71 per cent of organisations utilised IDD technology in all four IDD phases. In addition, Liu et al. (2021) used scientometric analysis and IDD thematic discussion to summarize 10 digital use cases of BIM sustainability in four phases of IDD.
The BE industry is heavily fragmented with its stakeholders working in the data silos. According to Snyder et al. (2018), 96 per cent of project data produced goes unused and 30 per cent of engineering and construction companies are using point solutions that do not integrate with one another. In addition, McKinsey pointed out that BE industry is moving towards platform era from a fragmented, point solution driven and project based industry (Bartlett et al., 2020). Integrated platforms can provide improved operational process visibility and integration with other technologies to gather data across an ecosystem. Therefore, the propsoed HDTF has considered an integrated cost management platform as the overall architecture to enable all project data to be connected, structured, and aggregated to form big data. In addtion, it allows visualisation, application and sharing of data between all stakeholders in real time. It is equally important that the HDTF for cost management is collaborative and accessible to all stakeholders in all project lifecycle phases. Through the value chain that connect all the stakeholders in a unified platform, it creates an open and shared digital ecosystem, whereby every stakeholder can find its own positioning in the ecosystem to collaborate and share data.
71 Proceedings of the PAQS Congress 2022, 12th 13th September 2022, Singapore Institute of Surveyors and Valuers, Singapore Construction Industry Transformation Map (ITM), which envisages an advanced and integrated sector by leveraging on the emerging digital technologies. The Construction ITM has the following three key trusts: Green buildings, Design for Manufacturing and Assembly (DfMA)and IntegratedDigitalDelivery(IDD),aiming tohastenthebuiltenvironmentindustry towardsmanufacturing, digitalprocessesandavalue orientedoutcomeapproach (BCA,2020).
3 Proposed HDTF framework
This covers design, fabrication and assembly on site, together with the operation and maintenance of buildings.
•
72 Proceedings of the PAQS Congress 2022, 12th 13th September 2022, Singapore Institute of Surveyors and Valuers, Singapore
3.1 Business operations and data applications layer (BL)
In BL, all processes in whole project lifecycle will be managed seamlessly and collectively. Table1 showsthe quantity surveying scopeofservices stated bythe national bodiesof quantity surveying as such bodies are representing the most relevant standards to the national context (International Organization for Standardization, 2020). Total of eleven national bodies of quantity surveying relevant to the practice in Asia Pacific region stated these eleven core services are typically being conducted by the quantity surveyors. The services include the followings: SS1 Establish cost appraisal and benchmarking; • SS2-Develop cost plan; SS3 Produce tender estimate; SS4 Develop bills of quantities or cost schedules;
•
The proposed HDTF consists of three layers: business operations and data applications layer (BL), data layer (DL) and technology layer (TL). BL integrates relevant cost elements such as 5D BIM quantification tools and digital cost management solutions; DL combines cost related data into a common data environment (CDE) to link stakeholders and different construction phases; TL includes BIM graphics technology, cloud computing, big data, AI, data security and other emerging technologies. Together, these three layers form the HDTF, whose vision is to make data structured, online, and intelligent. The proposed HDTF was developed based on literature review and existing guildlines. The HDTF has the following three crucial layers, as shown in Figure 1: • Business Operations and Data Application Layer (BL) • Data Layer (DL) • Technology Layer (TL) Figure 1. Proposed holistic digital transformation framework
•

73 Proceedings of the PAQS Congress 2022, 12th 13th September 2022, Singapore Institute of Surveyors and Valuers, Singapore • SS5 Develop and maintain cost data; • SS6 Produce tender document; • SS7 Conduct tender evaluation and report; • SS8 Develop and maintain cash flow forecast; • SS9 Valuate interim payment; • SS10 Advise and valuate variations; and • SS11 Prepare final account. Therefore, BL in the proposed framework consists of these core services recommended by national bodies of quantity surveying. National Bodies of Quantity Surveying Quantity Surveying Scope of Services Pre Contract Post Contract Stage SS1 SS2 SS3 SS4 SS5 SS6 SS7 SS8 SS9 SS10 SS11 Royal Institution of Chartered Surveyors (RICS) √ √ √ √ √ √ √ √ √ √ √ Australian Institute of Quantity Surveyors (AIQS) √ √ √ √ √ √ √ √ √ √ √ Royal Institute of Surveyors Malaysia (RISM) √ √ √ √ √ √ √ √ √ √ √ China Cost AssociationEngineering(CCEA) NA NA NA NA NA NA NA NA NA NA NA The Hong Kong Institute of Surveyors (HKIS) √ √ √ √ √ √ √ √ √ √ √ Institution of Surveyors, Engineers and Architects, Brunei (PUJA) NA NA NA NA NA NA NA NA NA NA NA Japanese Association Quantity Surveyors (JAQS) √ √ √ √ √ √ √ √ √ √ √ The New Zealand Institute of Quantity Surveyors (NZIQS) √ √ √ √ √ √ √ √ √ √ √ Ikatan Quantity Surveyor Indonesia (IQSI) NA NA NA NA NA NA NA NA NA NA NA Institute of Quantity Surveyors Sri Lanka (IQSSL) NA NA NA NA NA NA NA NA NA NA NA Canadian Institute of Quantity Surveyors (CIQS) √ √ √ √ √ √ √ √ √ √ √ Philippine Institute of Certified Quantity Surveyors (PICQS) √ √ √ √ √ √ √ √ √ √ √ Singapore Institute of Surveyors and Valuers (SISV) √ √ √ √ √ √ √ √ √ √ √ Fiji Institute of Quantity Surveyors (FIQS) NA NA NA NA NA NA NA NA NA NA NA
74 Proceedings of the PAQS Congress 2022, 12th 13th September 2022, Singapore Institute of Surveyors and Valuers, Singapore National Bodies of Quantity Surveying Quantity Surveying Scope of Services Pre Contract Post Contract Stage SS1 SS2 SS3 SS4 SS5 SS6 SS7 SS8 SS9 SS10 SS11 Korea Institution of Quantity Surveyors (KIQS) NA NA NA NA NA NA NA NA NA NA NA Africa Association of Quantity Surveyors (AAQS) √ √ √ √ √ √ √ √ √ √ √ The Association of South African Quantity Surveyors (ASAQS) √ √ √ √ √ √ √ √ √ √ √ Table 1. The quantity surveying scope of services stated by the national bodies of quantity surveying Note: National bodies with no information of quantity surveying scope of services were stated not available (NA). 3.2 Data layer (DL) Since cost data is the main element in the proposed framework to drive the digital transformation in cost management, there are three key characteristics to be fulfilled in this framework (Glodon, 2021) as per the followings: • Structured Data must be collected in accordance with master data and standard data system • Online Data must be integrated, multi dimensional and collaborative in real time • Intelligent Data can be translated into intelligence using algorithms, advanced data analytics and deep learning to drive consequential decision making, The content and classification of cost data are divided into the followings: • Project Data Budgetary cost data, contractual cost data, construction cost data and final account data • Management Data Work templates, operational standards, etc. 3.3 Technology layer (TL) To understand why integration of technologies play a vital role in supporting the technology layer in the framework, we analysed the case studies published in the Glodon Digital Cost Management 2021 White Paper (Glodon, 2021) and Table 2 summarises the key technologies adopted in their digital transformation strategies. Item Company Role Big Data Cloud GraphicsBIM AI 1 Company A Developer √ √ √ 2 Company B Developer √ √ 3 Company C Developer √ √ 4 Company D Consultant √ √ √
Big Data Processing
Based fromTable2,itcanbeseenthatall thetechnologiesrelatedto bigdata,cloud computing, BIM graphic technology, and AI were used in the organisations of the construction industries.
In another case studies, Company M also verified in one of their residential building developments in Hebei, China that there are proven advantages harnessed from their own big data. The development consists of 9 blocks of 32 storey apartment with contract value RMB 520million. By using data analytic to replace the labour intensive way of extracting data and compiling cost analysis for individual block, the work efficiency is improved by 60 per cent. Moreover, the data analysis can be flexibly calibrated and viewed in different dimension, greatly increased the accuracy of result. And the data for different project stages can be easily accessible and analysed in real time, saving 80 per cent of time compared to cross checking amongst multiple spreadsheets.
3.3.1
75 Proceedings of the PAQS Congress 2022, 12th 13th September 2022, Singapore Institute of Surveyors and Valuers, Singapore 5 Company E Consultant √ √ √ 6 Company F Consultant √ √ 7 Company G Consultant √ √ √ √ 8 Company H Consultant √ √ 9 Company J Consultant √ √ √ 10 Company K Consultant √ √ 11 Company L Consultant √ √ 12 Company M Contractor √ √ √
The case studies also further validated that the use of big data processing and analytic tools to the interconnected data generated from a multitude of sources is crucial to translate into business intelligence and drive better decision making.
For instance, Company D has established a data analytic platform to archive, process and analyse data collected automatically from over 3000 projects completed using the cloud platform, including unit rates (6 million items), and material prices (2 million items). The data analysis has provided insightful cost benchmark, indicative price information to guide employees in advising the clients on how to keep the project budget on track throughout the whole project lifecycle. Not only it has significantly improved the productivity, but it has also created values in the quality of their services to the clients.
Another example is Company A, a China developer based in Shandong, has established their own big data from more than 60 completed residential developments and chose one of their new mixed development projects as pilot project to utilise the data. Using centralised cost data libraries established and automated AI assisted data analytic built in cloud solution, the work efficiency for compilation of project budget has been improved by 70 per cent compared to conventional method of hard key prices of each item in Excel files. Moreover, the information submitted for budget control use are more precise.
Table 2 Key technologies adopted by companies in digital transformation strategy
76 Proceedings of the PAQS Congress 2022, 12th 13th September 2022, Singapore Institute of Surveyors and Valuers, Singapore 3.3.2
Company G, an engineering consulting firm specializing in EPC main contracting and consulting services based in Beijing, China has leveraged the AI learning in providing accurate insights on cost effectiveness and predictive analytics based on their own big data of cost indices to their clients. With the assistance of AI and big data, they have successfully transformed their consulting business, sped up the efficiency of business operations by 60 per cent and greatly improved the customer experience (Glodon, 2021).
4 Conclusion In the overall architecture of this proposed HDTF for Cost Management, first of all, the use of cloud computing capabilities can empower and transform the conventional business operations
Data is structured and standardised as systematic data storage and quick data lookup anytime anywhere is facilitated easily on cloud platforms.
Theyinefficient.adopteda
3.3.3 Artificial Intelligence (AI)
Cloud Computing
Leveraging the cloud computing technology of BIM 5D platform, all stakeholders can collaborate and share a single source of information based on a unified data warehouse in real time. Every participant is cognizant of the project’s overall status holistically, including design changes, approval, issues arising, etc, by accessing a web based project dashboard.
A McKinsey study (2018) also mentioned that there is a growth of use cases of artificial intelligence (AI) and advanced analytics in global construction technology industry ecosystem (Bartlett et al., 2020).
The case studies involving 12 Chinese organisations ranging from governance body, developers, consulting firms and contractors have shown that integration of data can be achieved effectively using cloud computing technology.
cloud platform in this project to manage lifecycle costing and the result was very promising as this project had recorded lesser change orders, the lowest expenses, completion ahead of schedule by three months, and cost savings of approximately RMB 350 million, compared to another two ongoing projects undertaken during the same period.
In a case study on a tobacco factory project by Company K cost management was one of the crucial tasks in this project due to involvement of multiple layers of subcontractors; design was not optimal and susceptible to changes; traditional cost management using Excel are labour intensive, time consuming and inconvenient for data lookup as data are not interconnected, therefore making the evaluation of project budget against the actual cost become cumbersome and
Cloud platform also enables easy data transfer and sharing amongst collaborators of project in an integrated cloud platform on site and off site, hence improving collaboration between all stakeholders in early stage, optimising design to reduce changes during the construction, and increasing the productivity on site.
From our findings from the case studies, 50 per cent of the companies has included artificial intelligence (AI) in their data analytic platform to maximize the advantages of big data.
5
77
Proceedings of the PAQS Congress 2022, 12th 13th September 2022, Singapore Institute of Surveyors and Valuers, Singapore into the online application. Secondly, the technology layer collects and integrates all the elements and data from all the project lifecycle phases through BIM graphics technology to translate the information into visualisation. Leveraging big data and AI, the information can be cleaned, processed and analysed to form a structured data layer. These interconnected data layers will be flowing and feeding the business operation layer, creating a cycle of data collection and applications within the ecosystem. Combining big data with advanced analytics and predictive applications, it transforms data into business intelligence and insights. Last but not least, the integrated BIM cost management platform serves as the last piece of puzzle to complete the framework by integrating BL, DL and TL under a unified platform for better collaboration and sharing of data amongst all stakeholders.
Acknowledgement
The authors would like to express their gratitude and appreciation to Glodon International Pte Ltd for their support in this research project. Special appreciation to Andy Zhang and Kimy Zhong for facilitating this research collaboration.
6 Disclaimer The opinions and recommendations expressed in this paper are the authors’ personal opinions and do not necessarily represent the official position of any organisation. This paper does not endorse any software in any capacity. The authors shall not be liable for any reliance on, or misinterpretation of any information contained in this paper.
Aibinu, A., Venkatesh, S., 2014. Status of BIM adoption and the BIM experience of cost consultants in Australia. J. Prof. Issues Eng. Educ. Pract. 140, 1 10. https://doi.org/10.1061/(ASCE)EI.1943 5541.0000193
Barbosa, F., Woetzel, J., Mischke, J., Ribeirinho, M.J., Sridhar, M., Parsons, M., Bertram, N., Brown, S., 2017a. Reinventing Construction: A Route To Higher Productivity. Mckinsey Glob. Insititute 20. Bartlett, K., Blanco, J.L., Fitzgerald, B., Johnson, J., Mullin, A.L., Ribeirinho, M.J., 2020. Rise of the platform era: The next chapter in construction technology. McKinsey Co. 9.
7 References Baiden, B.K., Price, A.D.F. and Dainty, A.R.J. (2006), “The extent of team integration within construction projects”, International Journal of Project Management, Vol. 24 No. 1, pp. 13 23. https://doi.org/https://doi.org/10.1016/ j.ijproman.2005.05.001
This paper also aligns with the BCA’s BIM roadmap in promoting BIM adoption to the construction industry stakeholders in the whole building life cycle, Construction Industry Transformation Map (ITM) to leverage on the emerging digital technologies and Singapore’s Smart Nation agenda in the need to embrace the digital revolution to become a world class and tech driven nation. At the global level, this paper supports the 2030 agenda for sustainable development in building resilient infrastructure, promoting inclusive and sustainable industrialisation and fostering innovation.
Proceedings of the PAQS Congress 2022, 12th 13th September 2022, Singapore Institute of Surveyors and Valuers, Singapore BCA, 2020. Construction Industry Transformation Map [WWW Document]. URL https://www1.bca.gov.sg/buildsg/construction industry transformation map ITM (accessed 7.20.22). Ebert, C., Duarte, C.H.C., 2018. Digital Transformation. IEEE Softw. 35, 16 21. Gartnerhttps://doi.org/10.1109/MS.2018.2801537Glossary:Digitization[WWWDocument],
An evaluation of the applicability of 4D CAD on construction projects. Autom. Constr. 19, 148 159. Meffert,https://doi.org/10.1016/j.autcon.2009.11.015J.,Swaminathan,A.,2017.Digital@Scale:
2022. . Gart. Inc. URL technology/glossary/digitization#:~:text=Digitizationhttps://www.gartner.com/en/information
78
is the process of,changes to the process itself. (accessed 7.14.22).
Glodon, 2021. Digital Cost Management White Paper Ideology. Hirschmann, R., 2022. Gross domestic product (GDP) of the construction industry of Singapore from 2012 to 2021 [WWW Document]. URL https://www.statista.com/statistics/625473/gdp of the construction industry in singapore/ (accessed 7.10.22). Hwang, B.G., Ngo, J., Her, P.W.Y., 2020. Integrated Digital Delivery: Implementation status and project performance in the Singapore construction industry. J. Clean. Prod. 262, 121396. Internationalhttps://doi.org/10.1016/j.jclepro.2020.121396OrganizationforStandardization,2020.National Standardization Strategies. Liu, Z., Lu, Y., Shen, M., Peh, L.C., 2021. Transition from building information modeling (BIM) to integrated digital delivery (IDD) in sustainable building management: A knowledge discovery approach based review. J. Clean. Prod. 291, 125223. Mahalingam,https://doi.org/10.1016/j.jclepro.2020.125223A.,Kashyap,R.,Mahajan,C.,2010.
The playbook you need to transform your company. John Wiley & Sons, Inc., New Jersey. Snyder, J., Menard, A., Spare, N., 2018. Big data = big questions for the engineering and construction industry. Fmi. Vigneault, M.A., Boton, C., Chong, H.Y., Cooper Cooke, B., 2020. An Innovative Framework of 5D BIM Solutions for Construction Cost Management: A Systematic Review. Arch. Comput. Methods Eng. 27, 1013 1030. https://doi.org/10.1007/s11831 019 09341 z
Keywords
smart cities, sustainable, resilient, BIM, education 1
Introduction Cities are evolving and the requirements fast becoming different from city to city. Variations could be due to economic, political and social factors. But one common issue is that because of the rapid growth in requirements of these smart, sustainable and resilient cities (SSRCs), there is a need for new thought leadership and skills to design and build these cities. The Institute of Higher Learnings (IHLs) and Government bodies are hard at work forming new courses to ensure that students and young working adults who have enrolled for Continual Education Programs, are equipped with new knowledge and skills that have now become imperative for this young, vibrant and emerging space.
This paper also provides an insight to what the author sees, working with the technologist which is then translated to roles that will be needed in the construction industry in the short term.
79
Smart, Sustainable and Resilient Cities: Evolving Brains and Brawn
The world is seeing a shift in roles as we move into the decarbonization age, that heralds the dawn of smart and sustainable cities and the use of technologies and data. But many aspects and roles of the Construction Industry are remains incognito and stagnant and not evolved, giving rise to the challenge of bridging the ever widening gap. As a practitioner with one foot in the core construction business and the other in the new disruptive technologies and roles, this paper seeks to examine what are the new roles are that are needed in the Construction Industry, giving a road map of what must be addressed now in Universities and Institutes so that the Construction Industry can remain relevant and on par with the technology and the demands of the world such as climate change, smart technologies, sustainability and resilience.
But what really goes on in designing and building a smart, sustainable and resilient city? Well, I can say that there needs to be new skills emerging that have one leg in Construction and Building and the other leg in sustainability and resiliency. The two legs would have to be supported by a good knowledge on smart technologies and the high-level system architecture and delivery of it. This analogy is simple. If one only has Building and construction background, he or she would miss out in understanding what smart technologies can support and even how sustainable designs can play a more important part. Likewise, if a Technology person sells his inspiring technology, it will only be based on what the product can offer, and not being able to accommodate and platform it to what the designers want or what the sustainable engineer needs. It is just a technology company and nothing more.
Proceedings of the PAQS Congress 2022, 12th 13th September 2022, Singapore Institute of Surveyors and Valuers, Singapore
Seah Hsiu Min Eugene; eugene.seah@surbanajurong.com ; isaiah5410@surbanajurong.com
Surbana Jurong, Surbana Technologies Pte Ltd, Threesixty Cost Management
Abstract
Design and maintenance of Smart, Sustainable and Resilient Cities needs a new breed of Designers, planners, sustainable consultants with resiliency understanding and have the knowledge and experience on the technology and digital front which includes but not limited to solution architecture and delivery. When an individual possesses these 3 basic knowledge and background, that executive will be a solid contributor to these new and emerging cities. He or she will be able:
b) to haveagood understanding thebuildingcanbedesignedforGreenMarkoranyrating tools required (e.g. LEED, True Waste, Infrastructure Sustainability and the like) and how can passive and active design and technology can be balanced harmoniously.
80 Proceedings of the PAQS Congress 2022, 12th 13th September 2022, Singapore Institute of Surveyors and Valuers, Singapore
c) to have a good understanding on the use of resiliency tools as nature based designs and resilient engineering such as floods simulation using compound data, taking into consideration key parameters such as rain, high tide, winds, draining and platform levels, to name a few. This can be backed up by complex simulations in digital twins
a) to effectively contribute to the city’s design e.g. using Biomimicry and design for deconstruction to have an energy efficient building that contributes zero waste to Pulau Semakau (waste dump),
So what are the team members and the skills needed to design, build, put in the technologies and run such SSRCs in the world? There are some of the very high level suggestions
During the planning and design stage, designers and planners will have to consider, social, cultural, environment and economic needs of these cities. They must plan for the different types of infrastructures that will be coming in the next decade, such as electric vehicles and autonomous vehicles. New concepts such as Zero Waste, Zero Carbon design, Super low or Net zero energy buildings, building as material banks , design for deconstruction ,have to be duly considered and added into the main stream design using code of practices for cities , biophilic designs and bio mimicry.
d) to adopt design technologies such as Building Information Modelling (BIM) to capture recycling index of buildings and embodied carbon, forecasting operational carbon through forecasting and designing and building efficiently through Integrated Digital Delivery (IDD), and lastly, e) to have a good understanding on smart digital technologies in the market to underpin the design of the building and city. This smart digital technologies would include but not limited to cloud platforms, system architecture, smart cities project delivery, use of IoT sensors and to be able to bring all these together to support points a) to d), able to visualize it into a digital twin which can be visualized in an Integrated Command and Operation Center. These requirements have formed the genesis to a new discipline, and I call it the Smart, Sustainable, Resilience City Executives or SSRC Executives for short. Let’s discuss more.
1) Planning and Design
2 Bringing Together the Team for SSRCs
When we deal with technology companies that handles systems, it is common to see break downs such as “item” or “lump sum”. I call this a black hole where the client will not know how the cost is being spread and broken down to the various heads of cost and cost centers. In the Building World, we have Cost Engineers and Quantity Surveyors to look into this and the SSRC Executive will need to have the skill and knowledge to breakdown cost properly so that Clients will be able to understand where the cost comes to, as well as understand the Contractual issues that may arise.
IT contracts and Construction contracts are somewhat similar. There are variations on both types of contracts for instance and there are liquidated damages. Just like construction contracts, there is a need to put down the assumptions when it comes to building the cost for systems and sensors.
81 Proceedings of the PAQS Congress 2022, 12th 13th September 2022, Singapore Institute of Surveyors and Valuers, Singapore Building Designers have to be aware of different needs by clients who want international certifications such as Wells International, Spire by UL and Ture Waste by US GBC. Each client has different needs and requirements and will have some link to Smart Cities and Technologies. For instance, Wells International, as part of the requirement,requires Developers to monitortheindoorenvironment and air quality and have them published in an application given to the tenants and users.
When SSRC Executives are knowledgeable in Sustainability and Resiliency, they will be able to work not only in enterprise systems, but also participate in Indoor Environment Quality requirements and even support rating tools. As discussed before, technology is needed to monitor Waste products in True Waste and indoor environment quality for Wells International for instance.
Carbon is also the in thing now and there is a needed to ensure that when we design and maintain building and cities, we are able to use technologies to monitor embodied
This is whereSmart Cities Executives comesin todesign applications andplacesensors in buildings to capture these data, sends the data to environment and sustainable design consultants to interpreted and embellish the design of the space to improve the quality of results. From this example, you can appreciate that the different roles and disciplines are multifarious and there is a need for a SSRC Executive to coordinate this aspect.
Once additional knowledge needed would be the ability to carry out cost benefit analysis, life cycle costing and to apply financial instruments to show payback and return of investment for smart cities implementation. As previously mentioned, there is a need for the SSRC executives to know what capital cost is, what constitutes to the different considerations for operations cost such as hosting cost in the cloud, maintenance cost and telecommunication cost. There is also additional skill needed to create a technology value stack. This is because when the capital and operation cost are only spread over one service or platform, the dollar value would be much higher juxtapose if we can spread the cost over several services or platforms.
3) Sustainability and Resilience
2) Cost and Contract management
82 Proceedings of the PAQS Congress 2022, 12th 13th September 2022, Singapore Institute of Surveyors and Valuers, Singapore carbon, operational carbon, recycling of material use (Recycling index of buildings) and even how materials can be reused under Building as Material Banks.
5) Technology, Technology Architecture.
I feel that the for the ideation and design thinking stage and the stage of presenting ideas, the SSRC Executives with the base discipline in the construction industry and an additional background of sustainability, resiliency, digital and technology, would be best suited to frame the approach and ideas to be put across. Then the system architecture, solutions and delivery can then follow up. The importance is to ensure that the discussion, knowledge transfer and ideation during the concept stage to integration with the physical world, must happen to with this new breed of individuals. I often say in jest with the Smart Cities team that this new role is like a “Professional Story Teller” or Professional Story Crafter”, a person able to present and illustrate effectively the solutions for Smart, Sustainability and Residency Cities, in a format that is understandable to thetraditionaldesigners andplanners andablefacilitate workshops to gather problem statements and requirements.
6) Digital Twins and Integrated Command and Operations Center (ICOC)
4) Data Science and Engineers
InSmart,SustainableandResiliencyCities,therewouldcertainlybeuseofdigitaltwins and ICOCs. That would bring about new roles and skill sets to create the visualization of digital twins, the creation of the widgets, adaptors and connectors to link platforms
SSRC Executives have an eye on sustainability and resilience, they are in a very powerful space to shape the future with data.
Floods can be monitored through flood sensors that feeds data directly into models that can be used for future forecast which can be illustrated and visualized in a digital twin of a Oncecity.the
There would be a greater need to have data engineers and scientist for smart cities development. With all the data points gathered, the work of the data engineers and scientist are important to get the data through to the sustainability and residency engineers to interpret so that they can redesign spaces for better sustainability and environmental results. That would mean that Data Engineers and Scientist would have to work closely with facilities management, security, sustainability and environmental specialist. It would be interesting to see how future curriculum at the institutions of higher learning and institute of technical education embellish their syllabus to incorporate such specialism.
Itis amustthatSSRCExecutiveshaveastrongbackgroundinTechnology Architecture and Delivery. They must be able to design how systems come together and are delivered. But because of the need to integrate more with Buildings Designers and Cities planners, there needs to be a new design thinking of combining experience and knowledge of the various fields and disciplines. The question would be what would have a heavier need in background knowledge? Should a Construction Industry Practitioner be the base and then venture into technology or the other way round?
In addition, there would be new skills sets needed to have individuals working in the ICOC that would enable them to take in such data, integrate them across a “single pane of glass”, and act on information given.
The point I am also trying to make is that the role of the Quantity Surveyor will evolve. Not only is the core Quantity Surveying Practice and Procures are important to the core, the profession has to involve into a broad prospective of specialism and then able to bring this together, thinking not in silos by lateral thinkers adding value to the client. This would include but not limited to the areas of sustainability, resilience, specialized contract and construction Law,smart citiesdesign andplanning,digitalandtechnology, digitalproject management,data science and programming.
The world is changing faster than we think. The profession needs lateral thinking quickly or else it will be overtaken by others. With the evolving brain and brawn, lets bring in the SSRC Executives into the Quantity Surveying training and practice.
83 Proceedings of the PAQS Congress 2022, 12th 13th September 2022, Singapore Institute of Surveyors and Valuers, Singapore to the digital twin so that real time data can be visualized in the digital twin that is visualized in the ICOC.
There would also be new skills needed to design and build such ICOCs, following standards such as ISO 11064: Ergonomic Designs for Contract Centers.
3 Conclusion I have put up these 7 skillsets that I feel would be needed for future Smart, Sustainable and Resilient Cities. These “executives” would need to have a mixed knowledge, background and experience in these various requirements but have a base in at least a Building, Engineering or Technology. These SSRC Executives would need to work together with the current traditional building professionals and builders so that the eventual product would see an integration of all these disciplines. If not, such cities would see silos of design and design thinking that are not integrated which may lead to dysfunctional cities one way or the other. Institutes of Higher Learning would have to also embellish their current syllabus and perhaps have specialized electives to produce graduates that are able to effectively contribute to designing and building the future smart, sustainability and resilient city of the future.
When combined with the skills from the Data engineers and scientist, some automated recommendations and processes can follow through, making the ICOC more effective.
Lastly, there would be a need for project delivery specialist who can program management and project manage such projects. They again will be one foot in the construction world and the other in technology, able to integrate into the requirements of construction authorities submission, client consultant meetings and construction technical meetings, together with technology implementation and delivery.
7) Project Management and Delivery
Environmental and Thermal Comfort Assessment of Different Wall Types for a School Building During Pandemic
De La Salle University, Manila, Philippines
De La Salle University, Manila, Philippines
Abstract
Keywords building information modelling (BIM), life cycle analysis (LCA), life cycle cost analysis (LCCA), sustainability, thermal comfort 1 Introduction Since the onset of the SARS Cov 2 or COVID 19 pandemic, different guidelines on the proper ventilation ofenclosedspaces havebeen createdto control therateofinfection.Oneareawhere ventilation strategies are strictly enforced is the educational system as the return to in person learning poses a risk of spreading the virus among vulnerable children. The Department of
Ryan Chan (corresponding author), ryan_chan@dlsu.edu.ph
De La Salle University, Manila, Philippines
As schools return to face to face learning, different ventilation strategies are being implemented to reduce the risk of infection from Covid 19. To test the effectiveness of these strategies and to investigate the impact of building design in the context of sustainability and livability, the integration of Life Cycle Analysis (LCA) and Thermal Comfort Assessment can be applied. As such, this study aims to assess the indoor air and thermal quality as well as the environmental impact of different school building designs during the pandemic. Building Information Modeling (BIM) was used to efficiently apply Life Cycle and Cost Analysis (LCCA) and thermal comfort simulation to a 4 story building located in Manila, Philippines. The environmental impact, construction cost, thermal comfort, and local mean age of air (LMA) of the school building were computed and compared using different wall materials namely concrete hollow blocks (CHB), drywall, foamed concrete, and foamed geopolymer with varying ventilation strategies, namely air conditioning, natural ventilation, and the combination of both. The result of LCCA shows that despite its high cost value, the construction of foamed geopolymer walls can reduce fossil fuel consumption and carbon dioxide emission up to 50% and 36%, respectively. Results from the thermal comfort assessment show that the impact of wall type on comfort varies with the adopted ventilation strategy wherein a smaller difference is observed in naturally ventilated cases. Moreover, the combination of both strategies consistently yielded better indoor air quality than natural ventilation alone. Apart from these findings, the paper presents a framework whereby sustainable,safe,andthermallycomfortableenvironmentscanbedesignedthroughBIM,LCA, and thermal comfort assessment. Overall, the study showed that using foamed geopolymer concrete with air conditioning improves the sustainability and comfort of the school building while the addition of natural ventilation makes it significantly safer during the pandemic.
Jason Maximino Ongpeng, jason.ongpeng@dlsu.edu.ph
84
Emmanuel Atienza, emmanuel_atienza@dlsu.edu.ph
Proceedings of the PAQS Congress 2022, 12th 13th September 2022, Singapore Institute of Surveyors and Valuers, Singapore
The integration of Building Information Modelling with Life Cycle Analysis (BIM LCA) can be used for modeling energy usage, thermal flow, safety measures (Motawa & Carter, 2013), and more efficient quantity/schedule take-off for sustainability assessment of a building. With the model development using BIM, construction players can optimize environmental management, social responsibility, and economic solution to achieve sustainability in the industry.
Predicted mean vote (PMV) and predicted percentage of dissatisfied (PPD) are unitless values that measure thermal comfort. PMV is based on a seven point thermal sensation scale that ranges from 3 to +3 where negative values indicate a cold environment while positive values indicate a warm environment. As such, one way of quantifying thermal comfort is by having a
85 Proceedings of the PAQS Congress 2022, 12th 13th September 2022, Singapore Institute of Surveyors and Valuers, Singapore Education (DepEd) has emphasized the importance of natural ventilation by requiring all classrooms to use openings at all times (DepEd 2021). A notable concern of this, however, is the reduction of thermal comfort, specifically in classrooms that use air conditioning. Poor thermal comfort negatively impacts student performance and poses a risk to their health (Zomorodian et al., 2016). Therefore, proper balance between the implementation of COVID 19 protocols and thermally comfortable design in schools must be investigated. One way of achieving this is through BIM.
2 Literature Review 2.1 Thermal Comfort Assessment
BIM is one of the emerging technologies in the construction industry. It is widely used for achieving moreefficient project management andimprovedquality monitoring. Theincreasing number of studies related to the application of BIM in construction processes considering three different aspects naming economic, social, and environmental only indicates its potential in the field of sustainability (Safari & AzariJafari, 2021). With the interoperability of BIM functions, designers can easily conduct analysis and investigation of the sustainability of the building. In addition, engineers and other stakeholders can evaluate and then utilize eco friendly materials and energy efficient systems for the improvement of overall building performance (Haruna et al., and actual usage of building materials and energy supply are linked to environmental impacts (Yang et al., 2022). One of the tools that can be used to systematically evaluate the entire life cycle of a building and to identify and calculate its impacts on the three aspects of sustainability is the Life Cycle Assessment (LCA) (Ongpeng et al., 2020). LCA is a widely recognized method for a systematic evaluation of building sustainability (Soust Verdaguer et al., 2022). It is used to calculate the environmental impact of all materials, methodologies, and services throughout the building life cycle (Ata Ali et al., 2021), however, the quantification of materials and schedule is still a challenge.
The2021).production
Theterm thermal comfort is typicallyusedto describeaperson’s satisfaction towardsa thermal environment (ASHRAE 2010). Thermal comfort can be used as a criterion for designing structures since it is often associated with the energy efficiency of a building (Yang et al 2014) and the wellbeing of occupants (Manchanda and Steemers 2012). A challenge of thermal comfort assessment, however, is quantifying comfort given that it is a qualitative measure that varies from person to person. As such, different thermal comfort prediction models have been developed. In this study, Fanger’s PMV PPD model was utilized as it is one of the most widely adopted thermal comfort models.
A simulation based approach to thermal comfort assessment was utilized in calculating the average PMV and PPD of the classroom. Simscale, a cloud based thermal simulation software, was used in conjunction with Revit 2020 to integrate BIM and thermal comfort assessment.
86 Proceedings of the PAQS Congress 2022, 12th 13th September 2022, Singapore Institute of Surveyors and Valuers, Singapore sample population rate their level of comfort with this scale. Fanger simplified this process by estimating the average vote of the sample population. This estimate is known as the PMV, the equation of which was derived based on the heat loss of a human body (Gao et al 2017).
2.2 Life Cycle Analysis (LCA)
PPD=100 95e 003353PMV4 02179PMV2
LifeCycleAssessment (LCA)was first utilizedinthe1960s totackleissues in theconsumption of natural resources and energy usage (Vigovskaya et al., 2017). The first general methodological framework for LCA was published in 1997 by International Organization for Standardization (ISO), which is the ISO 14040. The LCA was defined as an evaluation of input and output materials or processes, and potential environmental impacts within the life cycle of a product or a system. According to ISO 14040, the LCA framework is consisting of 4 phases as shown in Figure 6: 1) the goal and scope definition where the purpose, intention, and applications of the study are indicated by functional units, impact categories, and system boundaries,2)thelifecycleinventory(LCI)where theinputandoutputmaterialsandprocesses involved is determined, and the data collection was described, 3) in life cycle impact assessment (LCIA) phase, all environmental impacts are identified and its significance is evaluated, and lastly, 4) interpretation where the findings that are connected to other three phases are evaluated to come up with the conclusions and recommendations of the study.
From this equation, it can be seen that PPD ranges from 5% to 100% based on the measured PMV. This characteristic of the PPD index wherein it cannot reach 0% accounts for the difference in preference between individuals which makes it practically impossible to satisfy all occupants (Markov 2002).
3.1 Thermal Comfort Assessment
The application of LCA in the construction industry became evident from the beginning of the 21st century up to recent studies (Vigovskaya et al., 2017) Bribián et al. (2011) used LCA to compare most used building materials such as bricks, tiles, insulation materials, cement, concrete,andwoodproduct,witheco friendlymaterials.Thecradle to gravelifecycleofevery 1 kg of material was considered which includes material manufacture, transportation, construction and demolition, and final disposal. The authors used the Ecoinvent database for the data collection and focused on three different impact categories namely primary energy demand, global warming potential, and water demand. Interpretation of LCI and LCIA leads to the conclusion that the utilization of eco friendly methodologies, innovations, and techniques in manufacturing construction products could significantly reduce the impact of the industry.
Moreover, the parameters that affect PMV include personal factors like clothing and metabolic rate as well as environmental factors like temperature, air velocity, and humidity (Morejón et al. 2020). On the other hand, PPD measures thermal comfort based on occupant acceptability. Specifically, it estimates the percentage of occupants who are dissatisfied; hence, a lower PPD is typically preferred. To calculate PPD, the following equation is used.
3 Methodology
87 Proceedings of the PAQS Congress 2022, 12th 13th September 2022, Singapore Institute of Surveyors and Valuers, Singapore
Case Wall Type Occupants Ventilation Strategy 1 CHB 36 AC 2 CHB 36 NV 3 CHB 36 AC w/ NV 4 CHB 20 AC 5 CHB 20 NV 6 CHB 20 AC w/ NV 7 FG 36 AC 8 FG 36 NV 9 FG 36 AC w/ NV 10 FG 20 AC 11 FG 20 NV 12 FG 20 AC w/ NV Table 1. Thermal Comfort Simulation Runs
Figure 1. Classroom model
Figure 1 shows the model of a standard classroom in De La Salle University Manila which was used in this study. An interior classroom on the second floor of the three storey building was selected; hence, there are two (2) exterior faces to which the different wall types are applied. Heat transfer through the other four (4) faces is negligible since adjacent rooms are assumed to have the same temperature. Apart from PMV and PPD, the local mean age of air (LMA) was also calculated through Simscale to test the effectiveness of the ventilation strategies in circulating the indoor air.
Thermal comfort assessment was conducted on twelve (12) design cases. As seen in Table 1, the study considered concrete hollow blocks (CHB) and foamed geopolymer (FG) for wall types, 36 and 20 students for the number of occupants, and air conditioned (AC), naturally ventilated (NV) and the combination of AC and NV for ventilation strategies. The selected number of occupants represents the maximum design capacity of the classroom and the capacity considering the mandatory one (1) meter distance between seats during the pandemic. On the other hand, the ventilation strategies compare the traditional AC setup to the mandatory setup with NV. To accuratelysimulatetheimpact ofwall types onthermal comfort, thethermal properties, namely thermal conductivity, convective heat transfer coefficient, and emissivity, of the CHB and FG walls were obtained from literature and are summarized in Table 2.

Convective Heat Transfer Coefficient ��/��2�� 10.2086 Guo et al., 2011 Dylewski & Adamczyk, 2003 FG w/ Plaster Both Sides EffectiveConductivityThermal ��/���� 0.5420 Jing Liu et al., 2014
Goal and Scope Definition
88 Proceedings of the PAQS Congress 2022, 12th 13th September 2022, Singapore Institute of Surveyors and Valuers, Singapore Element Property Unit Value Reference CHB w/ Plaster Both Sides
Convective Heat Transfer Coefficient ��/��2�� 7.5188 Cao et al., 2018
Cement Plaster Emissivity 0.92 Spodek & Rosina, 2014 Table 2. Summary of Material Thermal Properties 3.2 Life Cycle Analysis 3.2.1
Thecarbondioxideemissionandfossil fuel consumptionwereassessedfor theconcretehollow blocks (CHB) wall and were compared to that of drywall, foamed concrete, and foamed geopolymer wall. The study sets the cradle to gate assessment for the system boundaries, explaining the impact from the extraction of the raw materials to the factory gate which excludes the use and disposal. Different materials such as cement, fly ash, sand, alkali activators, and gypsums were considered in producing the four walls as shown in Figure 2.

Figure 2. The cradle to gate life cycle of the four walls
EffectiveConductivityThermal ��/���� 0.6198 Asadi et al., 2018 Basrawi et al., 2013
Proceedings of the PAQS Congress 2022, 12th 13th September 2022, Singapore Institute of Surveyors and Valuers, Singapore Materials Quantity Unit DistanceTransport(km) (Densitykg /��3) StrengthCompressive(MPa)
FoamedGeopolymer 1.00 ��2 1256.46 7.65 Fly Ash 63.49 Kg 4.80 Sodium Silicate 14.82 Kg 9.20
89
Gypsum Board 2.00 Pcs 5.00 Metal Track 1.00 Pcs 5.00 Metal Studs 8.00 Pcs 5.00 Screw 14.00 Pcs 5.00 Rockwool Insulation 1.00 Pcs 5.00
Specific data and processes within these phases are collected from the literature whereas the design mixture and properties of foamed concrete came from the study of (Arunkumar et al., 2018), while foamed geopolymer came from the study of (Triwiyono et al., 2021). On the other hand, the standard estimates method was used to quantify the materials needed for the construction of CHB and drywall. The functional unit being considered is one (1) square meter of the wall, with a similar density, compressive strength, and heat transfer coefficient value which defines the specific function and use of the walls. The considered processes for the life cycle of the four (4) different wall types include input data such as extraction of raw materials, energy consumption, and transportation. Table 3 shows the properties and materials used to construct the four partition walls.
Sodium Hydroxide 7.41 Kg 9.20 Foaming Agent 600.00 L 9.20 Steel Bars 7.90 Kg 3.20
CHB Wall 1.00 ��2 1441.66 3.45 4” CHB 13.00 Pcs 15.70 Cement 80.00 Kg 8.40 Sand 0.06 ��3 9.70 Water 61.00 Kg Steel Bars 2.00 Pcs 3.20 Drywall 1.00 ��2 862.00 3.15
Foamed Concrete 1.00 ��2 1037.00 6.50 Cement 57.80 Kg 8.40 Fly Ash 57.80 Kg 4.80 Water 52.00 Kg Foaming Agent 23.10 Kg 14.20 Steel Bars 7.90 Kg 3.20
Table 3. Summary of Materials, Transport Distance, and Properties
Considering cradle to gate, the emission factors from the production, energy consumption, and transportation of the materials and processes for the construction of one (1) square meter CHB, gypsum drywall, foamed concrete, and foamed geopolymer wall were gathered from the SimaPro database. In addition, the distances for the transportation of materials to their corresponding location are also considered as shown in Table 3. This data was used for the computation of emissions from every material transport wherein the distance (in km) is multiplied by the weight of material (in kg) and the GHG emission factor.
4 Findings and Discussion
Building Information Modelling
In this study, BIM Autodesk Revit 2020 Software was used to model and quantify the total area of the interior partition wall of a four story school building. The extracted data from the software were used for the determination and comparison of environmental impact and thermal comfort using concrete hollow blocks (CHB), gypsum drywall, foamed concrete, and foamed geopolymer wall.
The impact of using different wall types is most significant when only AC is used, but the number of occupants dictates which wall type provides better comfort. When all 36 seats in the classroom are occupied, the PPD of the FG case was lower by 0.14% which means that FG performed better. When occupancy is limited to 20students however, the PPD of the CHB case was lowerby 0.30%. This observationcanbeattributedto thePMVwhichis negative,meaning that the room is colder than neutral. Since FG is a better insulator than CHB, the use of FG resulted in a PMV that is further from neutral. Overall, the impact of wall type on thermal comfort is almost negligible when NV is present. The impact of occupancy is more significant than wall type with PPD decreasing by up to 9.45% from the reduction of 16 students in the NV case. In contrast to wall type, the impact of occupancy is more significant when NV is present. According to Fanger’s model, the percentage of dissatisfied increases as PMV deviates from neutral; hence, a neutral PMV is typically desired. Different acceptable ranges for PMV are therefore adopted to test the adequacy of thermal comfort, one of which is from 0.5 to +0.5 as stated in ASHRAE 55. Based on the results in Table 4, only cases with AC and full occupancy comply with the acceptable range. Hence, implementing the guidelines of the DepEd results in asignificant reductionin thermalcomfortandfailureto complywiththestandardsofASHRAE 55. However, studies have shown that due to certain factors, Fanger’s model can fail to reflect the actual thermal comfort of the occupants. One such factor is climate as occupants in warm climates prefer colder than neutral (De Dear and Brager, 1997). Hence, the use of FG for the casewith 20students and AC canbejustified evenifthePPDis lowerthanits CHB counterpart
Life Cycle Inventory
3.3
90 Proceedings of the PAQS Congress 2022, 12th 13th September 2022, Singapore Institute of Surveyors and Valuers, Singapore 3.2.2
Excluding the cases with AC and reduced occupancy, cases with FG consistently yielded lower or almost equal PPD to their CHB counterparts. For cases with NV, PPD varied by ± 0.01% which shows that thermal comfort is practically the same between FG and CHB classrooms.
SimaPro Software, aligned with ISO Standards was utilized for the comparison of the environmental impact assessment of all wall types. ReCiPe method will be used to identify the categories where the most significant impact values will be observed.
4.1 Thermal Comfort Assessment
Figure 3 shows the impact of the three (3) ventilation strategies on the measured PPD at different portions of the standard CHB classroom with full occupancy. PPD was most uniform in the fully AC setup (Case 1) with areas closer to the air conditioning unit (ACU) being more comfortable. However, there are two (2) localized areas with high PPD directly in front of the ACU. This is due to the air from the ACU being concentrated at these points, making them too cold. In contrast, the fully NV setup (Case 2) has a significantly higher PPD throughout the room with students on the second row from the front of the classroom being the least comfortable. It can be observed that PPD is high between the columns of students since air cannot properly circulate through these areas. The same observation is seen in the AC and NV setup (Case 3); however, PPD has significantly decreased with the addition of cold air from the ACU. The high PPD areas in front of the ACU that were observed in Case 1 are also no longer present. This can be attributed to the openings which caused the cold air from the ACU to circulate across the room.
Figure 4 shows the measured LMA at different portions of the CHB classrooms with full occupancy. As seen in Table 4, NV has a notable impact in reducing LMA which signifies improved ventilation and reduced risk of infection. Moreover, the combination of AC and NV consistently yielded a lower LMA than NV alone which makes it the best ventilation strategy in terms of safety. In contrast, the impact of wall material is almost negligible. For the fully AC setup, LMA is significantly high at the front of the classroom. This indicates a stagnation zone where there is poor circulation of air and therefore a high risk of infection. In the fully NV setup, the stagnation zone is reduced due to the staggered arrangement of the doors and windows which caused the air to move sideways. Nonetheless, an area with high LMA is still observed in the front corner of the classroom. This stagnation zone disappears in the AC with NV setup. In both NV setups, students in the first and second rows are at highest risk of
91 Proceedings of the PAQS Congress 2022, 12th 13th September 2022, Singapore Institute of Surveyors and Valuers, Singapore since a colder than neutral environment is typically preferred in tropical climates like the Philippines. In fact, Anand et al. (2016) found that occupants in tropical climates find a PMV between 1 to +1 to be comfortable. Nonetheless, cases with NV still fall outside this range, the closest and most comfortable scenario being case 12 or FG at reduced occupancy with AC and NV. Case PMV PPD (%) LMA (s) 1 0.448 10.93 412.40 2 1.433 47.68 21.07 3 1.189 36.08 19.57 4 0.563 12.92 429.80 5 1.239 38.24 18.00 6 1.106 32.10 17.27 7 0.440 10.79 411.70 8 1.434 47.69 21.07 9 1.189 36.07 19.55 10 0.576 13.22 429.90 11 1.239 38.24 18.00 12 1.106 32.09 17.26
Table 4. Summary of Results from Thermal Comfort Assessment
Figure 3. PPD for case 1 (top left), case 2 (top right), and case 3 (bottom left)


Figure 4. LMA for case 1 (top), case 2 (center), and case 3 (bottom)
92 Proceedings of the PAQS Congress 2022, 12th 13th September 2022, Singapore Institute of Surveyors and Valuers, Singapore contractingtheviruswhilein thefully AC setup, thehighest riskarethosein thecolumnclosest to the door. Overall, indoor air quality in terms of LMA is dependent on the ventilation strategy with the AC and NV performing the best among the three.
93 of the PAQS Congress 2022, 12th 13th September 2022, Singapore Institute of Surveyors and Valuers, Singapore
Figure 5. Impact on global warming and fossil resource scarcity categories

Proceedings
Using the ReCiPe model’s midpoint impact assessment in SimaPro Software, the resulting values of each wall type were normalized in order to analyze the degree of contribution of each impact category, namely global warming, ozone depletion, ionizing radiation, human health, and terrestrial ecosystems ozone formation, fine particulate matter formation, terrestrial acidification, freshwater, and marine eutrophication, terrestrial, freshwater and marine ecotoxicity, human carcinogenic and non carcinogenic toxicity, land use, mineral, and fossil resource scarcity, and water consumption. Based on the result, all wall types exhibit notable impact values in terrestrial ecotoxicity and the least values in the stratospheric ozone depletion category. Most of the impact categories show that the environmental impact of drywall is greater than the three other wall types. Significant values had been observed in the six environmental impact categories: fossil resource scarcity, land use, human non carcinogenic toxicity, human carcinogenic toxicity, terrestrial ecotoxicity, and global warming. Drywall exhibitsamoresignificantimpactonfossilresourcescarcity,humannon carcinogenictoxicity, human carcinogenic toxicity, and terrestrial ecotoxicity categories, while foamed concrete wall to land use and global warming. In the global warming category, the amount of greenhouse gas generated by the four different types of walls considering three emission sources namely fossil fuel, bio based resources, and land use change was investigated. Results show that foamed concrete emits around 171.76 kg ����2 eq of carbon dioxide which is almost 14%, 23%, and 19% greater than the ����2 emission emanatedby CHB, drywall,andfoamedgeopolymer,respectively. Theemissions comingfrom the raw and secondary materials used for each wall were also examined. Findings show that the production of cement is responsible for around 46% of the total ����2 emission of CHB wall, 33% came from Rockwool insulation for gypsum drywall, 40% came from cement with fly ash production for foamed concrete wall, and 39% from the foaming agent for foamed geopolymer wall. On the other hand, the amount of fossil fuel consumed in the production and construction of CHB wall, which is around 33.73 kg oil eq, is 12% and 38% greater than the other two types of walls that uses aluminosilicate rich materials: foamed concrete and foamed geopolymer wall. This is because, according to (Fadayini et al., 2021), the production of raw materials used in the cement industry is highly dependent and based on fossil fuels. However, with the considered transportation distance from the material source or supplier to the manufacturing plant and project site, drywall consumed an estimated amount of 35.01 kg of oil eq, which is the highest value among all wall types.
4.2
Life Cycle Impact Assessment
The mandatory implementation of natural ventilation in classrooms has a strong implication on thermal comfort. In tropical countries like the Philippines, a fully air conditioned classroom still provides better comfort over a naturally ventilated classroom. The use of alternative wall materials with higher thermal resistance can improve thermal comfort but the impact of this is less significant when natural ventilation is used. Nonetheless, the results have shown that using foamed geopolymer with air conditioning yielded the most comfortable classroom. Wall material, however, has practically no impact on the local mean age of air. The adopted ventilation strategy primarily governed the local mean age of air with the air conditioned and naturally ventilated setup providing the best indoor air quality. Apart from having the lowest mean age of air, this ventilation strategy reduced the presence of stagnation zones. Results from the life cycle impact assessment have been also carried out to investigate the environmental impact of all wall types. Considering the cradle to gate life cycle, the environmental impact values of CHB, drywall, foamed concrete, and foamed geopolymer were distributed to all 18 impact categories and significant values have been observed in the six categories namely fossil resource scarcity, land use, human non carcinogenic toxicity, human carcinogenic toxicity, terrestrial ecotoxicity, and global warming. In this study, the global warming category was assessed via quantification of ����2 and oil equivalent generated and consumed by the walls. Overall, the foamed concrete wall gave the greatest contribution to global warming having computed impact values of 171.76 kg ����2 eq emission and 29.60 kg oil eq consumption, next is the CHB wall with 148.18 kg ����2 eq and 33.73 kg oil eq, while the foamed geopolymer wall exhibited the least contribution at 139. 88 kg ����2 eq emission and 20.91 kg oil eq consumption. The resulting values obtained in this study indicate that the materials and processes used within the life cycle of a product or methodology are one main factor that causes negative impacts on the environment.
Thickness of Wall Insulations and Their Thermal Performance for Buildings in Malaysian Climate. InternationalJournal of Automotive and Mechanical Engineering, 8(1). http://dx.doi.org/10.15282/ijame.8.2013.11.0099
94 Proceedings of the PAQS Congress 2022, 12th 13th September 2022, Singapore Institute of Surveyors and Valuers, Singapore
5 Conclusions
6 References American Society of Heating, Refrigerating and Air Conditioning Engineers. (2010). Thermal Environmental Conditions for Human Occupancy. Atlanta, GA Arunkumar, C., Srinivasa Senthil, S., & Vinith Kumar, N. (2018). Experimental Study on Mechanical and Thermal Behavior of Foamed Concrete. Materials Today: Proceedings, 5(2), 8753 8760. https://doi.org/10.1016/J.MATPR.2017.12.302
Asadi, I., Shafigh, P., Hassan, Z. & Mahyuddin, N. B. (2018). Thermal Conductivity of Concrete A Review. Journal of Building Engineering. 20, 81 93. Atahttps://doi.org/10.1016/j.jobe.2018.07.002Ali,N.,PenadésPlà,V.,MartínezMuñoz, D., & Yepes, V. (2021). Recycled versus non recycled insulation alternatives: LCA analysis for different climatic conditions in Spain. Resources, Conservation and Recycling, 175. Baswari,https://doi.org/10.1016/J.RESCONREC.2021.105838F.,Ibrahim,H.,Taib,M.,&Lee,G.(2013).Optimum
Haruna, A., Shafiq, N., & Montasir, O. A. (2021). Building information modelling application for developing sustainable building (Multi criteria decision making approach). Ain Shams Engineering Journal, 12(1), 293 302. https://doi.org/10.1016/J.ASEJ.2020.06.006
Fadayini,https://doi.org/10.1016/j.jclepro.2014.07.042O.M.,Madu,C.,Oshin,T.T.,Obisanya, A. A., Ajiboye, G. O., Ipaye, T. O., Rabiu, T. O., Akintola, J. T., Ajayi, S. J., & Kingsley, N. A. (2021). Energy and Economic Comparison of Different Fuels in Cement Production. Cement Industry Optimization, Characterization and Sustainable Application Gao,https://doi.org/10.5772/INTECHOPEN.96812S.,Wang,Y.A.,Zhang,S.M.,Zhao,M.,Meng, X. Z., Zhang, L. Y., Yang, C. & Jin, L. W. (2017). Numerical Investigation on the Relationship Between Human Thermal Comfort and Thermal Balance Under Radiant Cooling System. Energy Procedia, 105. Guo,https://doi.org/10.1016/j.egypro.2017.03.640L.,Guo,L.,Zhong,L.&Zhu,Y.(2011).
Manchanda, S., & Steemers, K.(2012).EnvironmentalControl andtheCreationofWell being. Sustainable Environmental Design in Architecture. Markov, D. (2002). Practical Evaluation of the Thermal Comfort Parameters
95 Proceedings of the PAQS Congress 2022, 12th 13th September 2022, Singapore Institute of Surveyors and Valuers, Singapore Bribián,I.Z.,Capilla,A.V.,&Usón,A.A.(2011).Lifecycleassessmentofbuildingmaterials: Comparative analysis of energy and environmental impacts and evaluation of the eco efficiency improvement potential. Building and Environment, 46(5), 1133 1140.
Dylewski, R. & Adamczyk, J. (2014). The Comparison of Thermal Insulation Types of Plaster with Cement Plaster. Journal of Cleaner Production, 83, 256 262.
Cao,https://doi.org/10.1016/J.BUILDENV.2010.12.002V.,Pilehvar,S.,SalasBringas,C.,Szczotok,A.,Bui, T., Carmona, M., Rodriguez, J., & Kjøniksen, A. (2018). Thermal performance and numerical simulation of geopolymer concrete containing different types of thermoregulating materials for passive building applications. Energy and Buildings, 173, 678 688. Departmenthttps://doi.org/10.1016/j.enbuild.2018.06.011ofEducation.(2021).OperationalGuidelines
on the Implementation of Limited Face to Face Learning Modality
Jing Liu, M., Alengaram,U.,Jumaat, M., & Mo, K.(2014).Evaluation ofthermalconductivity, mechanical and transport properties of lightweight aggregate foamed geopolymer concrete. Energy and Buildings, 72, 238 245. https://doi.org/10.1016/j.enbuild.2013.12.029
Thermal Conductivity and Heat Transfer Coefficient of Concrete. Journal of Wuhan University of Technology Material Science, 26(4), 791 796. https://doi.org/10.1007/s11595 011 0312 3
Morejón, M., Hernández, J., Castilla, C., Gómez, E., Alonso, J. & Martínez, F. (2020). Experimental Study and Analysis of Thermal Comfort in a University Campus Building in Tropical Climate. Sustainability, 12 (21), https://doi.org/10.3390/su12218886
Thermography to Historic Building Investigation. Journal of Architectural Conservation, 15(1), 65 81. Triwiyono,https://doi.org/10.1080/13556207.2009.10785040A.,Sulistyo,D.,&Agustini,N.K.A.(2021).
K. B., & Tan, R. R. (2020). Multi criteria decision analysis for energy retrofit in buildings. Chemical Engineering Transactions, 81, 79 84. https://doi.org/10.3303/CET2081014
Zomorodian, Z., Tahsildoost, M., & Hafezi, M. (2016). Thermal comfort in educational buildings: A review article. Renewable and Sustainable Energy Reviews, 59, https://doi.org/10.1016/j.rser.2016.01.033
Mechanical Properties and Thermal Conductivity of Fly Ash-Based Geopolymer Foams with Polypropylene Fibers. Applied Sciences, 11(4886). Vigovskaya, A., Aleksandrova, O., & Bulgakov, B. (2017). Life Cycle Assessment (LCA) in building materials industry. Yang, L., Yan, H., & Lam, J. (2014). Thermal comfort and building energy consumption implications A review. Applied Energy, 115, Yang,https://doi.org/10.1016/j.apenergy.2013.10.062X.,Hu,M.,Tukker,A.,Zhang,C.,Huo, T., & Steubing, B. (2022). A bottom up dynamic building stock model for residential energy transition: A case study for the Netherlands. Applied Energy, 306. https://doi.org/10.1016/J.APENERGY.2021.118060
96 Proceedings of the PAQS Congress 2022, 12th 13th September 2022, Singapore Institute of Surveyors and Valuers, Singapore Motawa, I., & Carter, K. (2013). Sustainable BIM-based Evaluation of Buildings. Procedia Social and Behavioral Sciences, 74, 419 428. Ongpeng,https://doi.org/10.1016/J.SBSPRO.2013.03.015J.M.C.,Rabe,B.I.B.,Razon,L.F.,Aviso,
Safari, K., & AzariJafari, H. (2021). Challenges and opportunities for integrating BIM and LCA: Methodological choices and framework development. Sustainable Cities and Society, 67, 102728. https://doi.org/10.1016/J.SCS.2021.102728
Soust Verdaguer, B., Bernardino Galeana, I., Llatas, C., Montes, M. V., Hoxha, E., & Passer, A. (2022). How to conduct consistent environmental, economic, and social assessment during the building design process. A BIM based Life Cycle Sustainability Assessment method. Journal of Building Engineering, 45, 103516. Spodek,https://doi.org/10.1016/J.JOBE.2021.103516J.,Rosina,E.(2009).ApplicationofInfrared
Khai Sheng Yang, ky40@hw.ac.uk Heriot Watt University Malaysia, Malaysia Abstract Sustainable buildings are designed not only to reduce environmental impacts but also to promote health and wellbeing. A range of studies illustrated that user behaviours can significantly affect the performance of sustainable buildings in meeting the goals. Significant performance gaps are found if users fail to conform with the ways sustainable buildings are designed to. It is therefore critical to examine if the prevalent sustainable building solutions meet the evolving needs and expectations of people. This paper explored the relationships between users and environment in sustainable buildings and determine its user environment interactions. A survey method was used to collect data from users of selected sustainable buildings. The results show that respondents generally agree sustainable building solutions can enable meaningful user environment interactions and improve user satisfactions. User environment interactions can be greatly promoted if users are provided an authority to adapt to changes in response to different building conditions and external factors. The findings however showed that there is a gap in existing sustainable building systems to capture the implications of users’ behaviours on the building usage pattern in adaptation to its environment. The paper demonstrated the importance of examining user environment interactions in sustainable buildings to advance the goals of sustainable development. With an improved understanding of user environment interactions, a more people centric approach can therefore be built into the development of sustainable buildings and unlock the next level values of sustainable built environment.
Keywords Sustainable buildings, people centric, user environment interactions.
A Key to Make Sustainable Buildings People Centric: Userenvironment Interactions
1 Introduction
97
Proceedings of the PAQS Congress 2022, 12th 13th September 2022, Singapore Institute of Surveyors and Valuers, Singapore
The construction sector has been recognized as a main contributor to climate change and greenhouse gases emissions. According to United Nations (2019), approximately 28% of energy related CO2 emissions are released from buildings. Following increased concerns over environmental issues and climate change, various sustainability initiatives has been launched regionally and globally. Net zero buildings and sustainable buildings are advocated as the building standards for new and existing building stocks to counteract the environmental impacts, thus driving sustainability transition into the construction industry. The benefits of sustainable buildings go beyond the environmental considerations. In addition to a reduction inenergyconsumptionandcarbonfootprints,sustainablebuildingsalsoprovideabetterquality of living and promote health and wellbeing of people.
Cheng Siew Goh (corresponding author), c.goh@hw.ac.uk Heriot Watt University Malaysia, Malaysia
The significance of human factors as a function of the achievement of sustainable buildings is evidently illustrated. It is imperative to have a better understanding of user expectations, attitudes, perceptions, and behaviours by interrelating human factors with the physical performance of buildings (Rebelo and Soares 2022). However, human factors are not widely integrated into sustainable solutions of built environments. It is vital to move out of the “environmental thinking box” to assess the building sustainability. There is a clear need to understand user environmental interactions to examine the capability of sustainable building solutions in meeting the evolving needs and expectations of people. To bridge the gaps, this paper explores the interrelationships between users and environment in sustainable buildings and examines user environment interactions in affecting the building sustainability goals.
98 Proceedings of the PAQS Congress 2022, 12th 13th September 2022, Singapore Institute of Surveyors and Valuers, Singapore
The performance of sustainable buildings is strongly related to the management and operation strategies which require dynamic control and monitoring (Kern et al., 2016). An understanding of the roles of users in meeting the targets of sustainable buildings is called upon. Numerous research works have demonstrated that users’ behaviours often play an important role in determining theeffectiveness ofbuilding solutions (Kern et al., 2016; Macintosh andSteemers, 2005; Pisello, Piselli, and Cotana, 2015; Rebelo and Soares, 2022). A post occupancy evaluation conducted by Macintosh and Steemers (2005) found that the building thermal efficiency solutions which optimises the balance of mechanical and natural ventilation have resulted in more energy use, due to the negligence of designers in considering the implications of users’ behaviours and perceptions and the users’ misunderstanding of building strategies.
The effect of human attitudes on the efficacy of building system is also by acknowledged by Pisello et al. (2015) in which human behaviours overtake physical retrofits in the thermal energy efficacy. Rebelo and Soares (2022) also stressed that building characteristics are proven to be insufficient as determinants but user behaviours and socio economic factors. Considerable performance gaps could be observed when users fail to conform with the ways sustainable buildings are designed to.
By incorporating sustainable design solutions that enhance the link of physical conditions of built environments with nature, sustainable buildings increase indoor environmental quality and improve occupants’ health and well being. Previous studies (Lee and Guerin, 2010; Liang et al., 2014) have demonstrated the values of sustainable buildings in ensuring a more pleasant indoor environment, assuring health and wellbeing of occupants, and increasing productivity and work efficiency. In a broader sense, sustainable buildings emphasise a holistic system approach ofcreatingvaluechains along thelife cyclebymeetingtheenvironmental challenges, assuring economic viability and developing the social capital. Nevertheless, the quality and performance of sustainable buildings are not necessarily consistent. Increasing post occupancy studies revealed lower performance in sustainable buildings than predicted. Newsham et al. (2009) revealed that around 28 35% of LEED buildings used more energy per floor area than their individually matched buildings in the 2003 Commercial Building Energy Consumption Survey database. On one hand, Goh also (2014) found some certified green buildings failed to deliver the desired sustainability goals during post occupancy stage, where wind turbine failed to harvest and generate wind energy as planned. On the other hand, Conniff (2017) also reported that refurbished green apartment buildings in Germany missed the predicted energy savings by 5 28%, while fifty leading edge modern buildings in United Kingdom were reported to use up to 3.5 times more energy than the design had allowed for and produce approximate 3.8 times the predicted carbon emission.
Relationships Between Users and the Environment in Sustainable Buildings
Proceedings
Sustainable building solutions are designed based on the concept of active user participation for optimised building performance. The traditional consideration of regarding users as passive occupants fails to empower building users appropriate environmental control to support human activities and reduce energy consumptions in sustainable buildings. Users are expected to appreciate the values and functions of sustainable buildings, hence providing high commitments to achieve the goas of sustainable buildings.
2.1 User-environment Interactions in Sustainable Buildings
Sustainable buildings integrate passive design strategies such as natural ventilation, natural sun light and thermal mass in the building systems to enhance the building occupants’ comfort, while minimising environmental impacts. Any variations of the surrounding environment can directly influence the indoor environmental quality in sustainable buildings. An interactive building system is introduced to allow users to respond to changing conditions in the surroundings for meeting the required comfort and demands. Simple interventions can be done by giving access to users to manual controls of building systems, opening or closing of switches, adjustable curtains and windows, etc. Furthermore, users can also be empowered to be accounted for reducing water and energy consumption in sustainable buildings, with an integration of adjustable control in water and energy systems. Sustainable solutions allow users to directly interact with the environment by using the control systems to adjust external environmental conditions based on their perceived needs. According to Cole et al. (2008), there is a conceptual shift to create a comfortable building environment by taking into consideration psychological, societal and users’ behavioural perceptions. This shift allows designers of sustainable building to integrate more solutions allow direct user engagements and interactions. Brager and Dear (2000) described that natural ventilation of buildings should be more adaptive to suit different environmental conditions for users because
99 of the PAQS Congress 2022, 12th 13th September 2022, Singapore Institute of Surveyors and Valuers, Singapore
2
To capture the relationships between users and the environment, understanding the users’ perception and cognition is of importance. Gifford (2002) stated that building users often have their own environmental perceptions in which the data they received is reinterpreted based on how their knowledge is stored, transformed, organised, forgotten and recalled. Individuals and organisations have different concerns and expectations towards sustainable built environments and these specific concerns might affect their attitudes and behaviours during the building occupancy. Identifying users’ perceptions, cognition and expectations helps to improve the design and operation of sustainable building solutions. It takes into the account users’ behaviours on the performance of sustainable buildings over the life cycle. The relationships between users and built environments change over time and there are diversified needs and expectations of users towards sustainable buildings. It is crucial to examine users’ expectations, understanding and knowledge. According to Leaman and Bordass (2007), users would be more tolerant when sustainable buildings design (e.g. windows and thermostats) do not meet their expectations, sinceusersfullyappreciatetheactualwayofthesystemsordesignworkandtheirfunctionality. This is a manifestation of the importance of users’ understanding and knowledge in contributing to optimized performance of sustainable buildings. Appropriate interventions incorporated in sustainable buildings can enhance user-environment interactions within the environments to align their initiatives to meeting the sustainability goals.
100 Proceedings of the PAQS Congress 2022, 12th 13th September 2022, Singapore Institute of Surveyors and Valuers, Singapore naturally ventilated buildings have accounted to be more diverse in indoor temperatures comparedtoconventionalair conditionedbuildings.Theirfindingssuggestthatadvancedheat balance models of thermal comfort should be proposed to allow a greater extent of user environment interactions so that users can modify their behaviour and gradually adapt their expectation to match the environment.
Oneofthegoalsofsustainablebuildingsistoincreaseusers’abilityofresilienceandadaptation to the climate change. Rather than emphasising on uniformity of building performance, a dynamic demand-control based building system is often necessitated in sustainable buildings. This shifts the way buildings used to perform by emhasising on dynamic interactions between users and environments. Varying behavioural aspects are considered in sustainable building design to allow users creating contextualized environmental conditions that suit to their needs. Engaging and empowering users the control of space is important for their habitual occupation, physical safety and psychological wellbeing. User behaviours are shaped by designers as users are required to make some changes to adapt themselves to environments. If the building system drives a change in users’ habitual actions or methods, users would feel intruded due to a loss of personal space or freedom. According to Motalebi (2006), the socialisation process makes individuals learn certain behaviours on the way they use specific spaces and react to stimuli of the environment. Hence, individuals usually behave based on their definition of the events, stimuli and spaces in accordance with the cultural value of their environment. Improved sustainability performance can be achieved with proper architecture, interior design and space planning strategies by understanding environmental psychology of users. In order to identify sustainable building users’ needs during the design phase. Behavioural social sciences in environmental design help to align sustainable building projects with current societal tendencies but also to predict future aspects of the sustainable design for future development. The users’ behavioural aspects have to be taken into account along with the environmental consideration. According to Motalebi (2003), this information must be emphasised and transformed from the social scientific terminologies to the languages of design. Sustainable buildings should be designed in a way of creating an environment that can communicate with its users and reflect the users’ needs. The bilateral relationship between users and the sustainable built environment is of importance as the physical environment often brings numerous effects to building users’ who are constantly contacting it and influencing their Thebehaviours.incorporation of Information and Communication Technology (ICT) in sustainable buildings helps to promote the relationship between users and the environment. ICT can act as a transformation tool of encourage societal aspects in sustainable buildings. ICT provide ease to users to control the physical environment by using remote control, monitoring devices and teleservices. This increases the conscious of building users to adopt more environmentally friendly behaviours and attitudes that cater for a wide range of user needs in operating sustainable buildings. Interactive building solutions offer an opportunity for the users to control their environmental footprint and change their behaviours in responding to the environmental targets of sustainable buildings. An interaction display of up to date building achievements on energy consumption andcarbonfootprint wouldmaketheenvironmentaleffortsvisibletousers. Energyinformation and feedback in sustainable building solutions present an opportunity to building users to make necessary adjustments to the environment by changing their behaviours and attitudes in using the buildings. Building information systems, instructional signage and experiential building
101 Proceedings of the PAQS Congress 2022, 12th 13th September 2022, Singapore Institute of Surveyors and Valuers, Singapore systems including smart real-timeweb-based feedback,kiosks, metres, etcallow building users to easily understand and take control of sustainable buildings performance. In Petersen et al. (2007)’s study, Oberlin College in Ohio has introduced an automated data monitoring system in their hall of residence to allow the building users to check on their energy and water usage. This real time feedback has resulted in a reduction of electricity consumption by 55% as compared to the implementation of conventional metre readers. This has shown that interactive building solutions can involve users in a more active interaction with the environment by making necessary adjustments to the physical conditions for the environmental performance goals.
3 Methodology
A survey was developed to collect data from users of selected sustainable buildings. There were two sections in the survey. Section 1 was structured to gather the demographic informationofrespondentsincludingtheirbackgroundandexperienceinrespectivesustainable buildings. Section 2 solicited data to determine the extent to which users environment interactions are captured in sustainable buildings. A five point Likert scale was used to investigate the level of agreement of users to the described scenario or statements, where the lowest scale indicated strong disagreement and the highest scale show strong agreement.
4 Findings and Discussion Frequency distribution analysis was used to identify the user environment interactions in sustainable buildings and to determine a rank order based on the mean values of the scores. The typical duration of occupying sustainable buildings was investigated. The durations could have an impact, directly and indirectly, on the user perceptions, attitudes and behaviours in sustainable buildings.
This section presents the methodology of a survey study that includes 1) the survey design and 2)theprocess ofdatacollectionandresults interprtations.Becausethestudyaims to investigate the user perceptions and their interatons in sustainable buildings, the study invited users of two selected sustainable buildings to participate in the survey. Both buildings are certifed green buildings by Green Buildng Index, Malaysia.
Because of practicality, free of access and universal accessibility, a web based questionnaire, Google Form was chosen. Data collection took about 4 weeks in the period from February to March 2022. The survey was distributed to 100 respondents using emails and 41 responses were received. This gives to the response rate of 41% which is considered satisfactory for a sample more than 45 respondents. According to ASHRAE (2013), the response rate must be higher than 35% for samples of more than 45 respondents.
3.1 Questionnaire design
3.2 Data collection
Figure 2 presents the extent of agreement of user environment interactions provided in sustainable buildings. From the results, majority respondents (88%) agree or strongly agree that sustainable building solutions enable meaningful user environment interactions and improve user satisfactions. As illustrated in Table 1, it obtained a mean value of 4.07 with the standard deviation of 0.755. User environment interactions can generally be promoted in sustainable buildings since users are given opportunities to adapt to changes in response to different building conditions and external factors.
102 Proceedings of the PAQS Congress 2022, 12th 13th September 2022, Singapore Institute of Surveyors and Valuers, Singapore
Sustainable buildings can allow users interact with the physical environment by giving them the control over lighting, ventilation and thermal comfort systems. Control over lighting systems was rated highly with an average score of 4.15, followed by ventilation systems (3.88) and thermal comfort systems (3.85). Over 80% users agreed that the presence of appropriate lighting control in sustainable buildings enable them to align the physical environment to their lighting needs. As compared to the lighting control, ventilation and thermal comfort systems do not gain wide agreements among users in which 73% and 68% agreed to have adequate control to interact with the building ventilation and thermal comfort systems. The findings can be linked to the adoption of centralized air conditioning systems in sustainable buildings for energyefficiencypurposes.Thecentralizedairconditioningsystemhasremovedsomecontrols from end user interfaces, thus resulting in lower user engagement. Embarking on the adaptive comfort theory, the thermal comfort level varies from one person to another. The changeable parameterswithno fixedcomfortlevels couldset morechallengesinidentifyingpreferredlevel of thermal comfort.
Thereis alowerlevel ofagreementthatsustainable buildings provideclearinstructions to users to operate and manage the buildings, with a mean value of 3.76. Around 61% respondents agreed that sustainable buildings promote user experience without triggering forced adaptive responses. A blend of automatic and manual systems in sustainable buildings scored a mean value of 3.76 with a standard deviation of 0.94. It was agreed by 61% respondents in triggering user environment interactions. The findings suggested that there could be a gap in existing
Figure 1. Typical duration of users spending time in sustainable buildings in terms of day per working week and hours per day.
More than half of the respondents (58.5%) spent more than 3 days in a week while around 41.50% respondents spent less than 3 days. The results indicated that there is change of user’ usage pattern in sustainable buildings following the COVID-19 pandemic outbreak. Data was collected in during the recovery period of COVID 19 and some organisations may not resume to 100% physical work condition as it was before the pandemic. Majority respondents. (78%) spent less than 12 hours in sustainable buildings in a day.

Control over thermal comfort according to needs 3.85 1.108
Clear instructions on building operation… Dynamic systems with automatic building… Encouraging users to interact with the… Capture and display usage data to change… User environment Interactions in Sustainable Buildings
Strongly disagree Disagree Neutral Agree Strongly agree
103
Proceedings of the PAQS Congress 2022, 12th 13th September 2022, Singapore Institute of Surveyors and Valuers, Singapore sustainable building systems to capture the implications of users’ behaviours on the building usage pattern in adaptation to its environment. Only 56% respondents agreed sustainable buildings capture and display usage data to promote environmental behaviour. Up to date building performance may not be captured and communicated effectively to users as it was rated the lowest with a mean score of 3.63.
Clear instructions on building operation and management 3.76 0.969 Dynamic systems with automatic building systems and an appropriate level of demand control 3.76 0.943
Control over lightings according to needs 4.15 0.727
Capture and display usage data to change environmental behaviour 3.63 1.09
Control over ventilation systems according to needs 3.88 0.927
Figure 2. User environment interactions perceived by users in sustainable buildings Mean DeviationStandard Enable meaningful user environment interactions 4.07 0.755
Encouraging users to interact with the environment without forced adaptative mechanisms 3.83 0.972
Table 1. Mean values and standard deviations of user environmental interactions in sustainable buildings Differences in human factors need to be acknowledged in sustainable buildings needs to be acknowledged in the very early stage of building life cycle. Capturing the users’ interactions and perceptions with the physical environments can be made via people centric approaches. A people centricapproach is aholisticmethodthatemphasisetheunderstanding ofhumanfactors and their interactions with building systems to maximise human wellbeing and overall system performance in sustainable buildings. Taking people centric approach, it optimises the ability 0 5 10 15 20 25 30 35 40 45 Enable meaningful user-environment… Control over the ventilation systems… Control over thermal comfort according to… Control over lightings according to your…
104 Proceedings of the PAQS Congress 2022, 12th 13th September 2022, Singapore Institute of Surveyors and Valuers, Singapore of sustainable built environment to harmonise with surrounding environments through sensory design for improved user environment interactions. In response to a dynamically changing environment, users tend to maintain the surrounding environments in a homeostatic condition to provide a good level of comfort, wellbeing and health.
6 Acknowledgement
7 References ASHRAE. 2013. ANSI/ASHRAE Standard 55 2013, Thermal environmental conditions for human occupancy. American Society of Heating. Refrigerating and Air Conditioning Engineers, Inc. Cole, R. J., Robinson, J., Brown, Z., & O’shea, M., 2013. Re contextualizing the notion of comfort. In Comfort in a Lower Carbon Society (pp. 25 38). Routledge.
Gifford, R., 2007. Environmental Psychology: Principles and practice. Allyn and Bacon, Boston. Goh, C. S., 2014. Development of a capability maturity model for sustainable construction. HKU Theses Online (HKUTO). Kern, A. P., Antoniolli, C. B., Wander, P. R., Mancio, M., & González, M. A. S., 2016. Energy and water consumption during the post occupancy phase and the users' perception of a commercial building certified by Leadership in Energy and Environmental Design (LEED). Journal of Cleaner Production, 133, 826 834. Leaman, A., & Bordass, B., 2007. Are users more tolerant of ‘green’buildings?. Building Research & Information, 35(6), 662 673. Lee, Y. S., and Guerin, D. A., 2010. Indoor environmental quality differences between office types in LEED certified buildings in the US. BuildingandEnvironment, 45(5), 1104 1112. Liang, H. H., Chen, C. P., Hwang, R. L., Shih, W. M., Lo, S. C., and Liao, H. Y., 2014. Satisfaction of occupants toward indoor environment quality of certified green office buildings in Taiwan. Building and Environment, 72, 232 242.
The work is supported by School of Geoscience, Engineering, Infrastructure and Society (EGIS), Heriot Watt University Malaysia under the EmGRS 2021/2022 Project “Optimising the Performance of Sustainable Buildings via Human centric Design”.
5 Conclusions
The paper demonstrated the importance of examining user environment interactions in sustainable buildings to advance the goals of sustainable development. With an improved understanding of user environment interactions, a more people centric approach can therefore be built into the development of sustainable buildings and unlock the next level values of sustainable built environment.
Proceedings of the PAQS Congress 2022, 12th 13th September 2022, Singapore Institute of Surveyors and Valuers, Singapore Macintosh, A. and Steemers, K., 2005. Ventilation strategies for urban housing: Lessons from a PoE case study, Building Research and Information, 33(1), pp. 17 31. doi: Motalebi,10.1080/0961321042000322771.G.H.,2003.Environmental
Newsham, G. R., Mancini, S., & Birt, B. J., 2009. Do LEED certified buildings save energy? Yes, but…. Energy and Buildings, Vol 41 Issue 8, pp 897 905. Pisello A.L., Piselli, C. and Cotana, F., 2015. Influence of human behavior on cool roof effect for summer cooling, Building and Environment, 88(2015), pp. 116 128. doi: Rebelo,10.1016/j.buildenv.2014.09.025.F.,&Soares,M.(Eds.).,2022.
Psychology,anewknowledgeforarchitectureandurban design. Journal of fine arts. University of Tehran publication, (10), 65.
105
Advances in ergonomics in design, usability & special populations: Part II. AHFE International (USA).
Rider Levett Bucknall Auckland, New Zealand
Keywords embodied carbon, carbon emission, carbon reduction framework, sustainable construction, 1
Senarathna DR (corresponding author), randima.senarathna@op.ac.nz
106
Otago Polytechnic Dunedin, New Zealand
Hislop JJ, joshua.hislop@nz.rlb.com
Otago Polytechnic Dunedin, New Zealand
Abstract Reducing the embodied carbon (EC) in the construction industry is vital to national and global requirements for carbon reduction. The New Zealand (NZ) construction industry has so far focused on reducing energy consumption. However, the construction industry also needs to focus more on what strategies can be implemented to reduce EC. Initiatives so far include EC rating systems and tools focusing on environmental product declarations (EPDs) and life cycle analysis (LCA). The literature illustrates that commercial building materials comprising reinforcing steel, clay bricks, ready mixed concrete, rubble, cement mortar and aluminium were found to contribute 94% of the total EC in the building. Industry professionals from the NZ construction industry and EC consultants were approached to ascertain the extent that EC isconsideredduringdesigndevelopmentandtheassociatedkeydriversandbarrierstoreducing EC. Findings in NZ construction indicate that EC is calculated on a handful of NZ construction projects with design solutions seldom selected based on their EC. Cost and time required are current key barriers to calculating and reducing EC and the lack of a standardised fit for purpose tool for calculating EC. Early involvement of contractors during the design stage using a standardised approach may help to provide a more accurate EC calculation, and the greater adoption and capacity to supply low EC alternatives may help to reduce their costs and avoid delays in their supply.
Proceedings of the PAQS Congress 2022, 12th 13th September 2022, Singapore Institute of Surveyors and Valuers, Singapore
Introduction Are the buildings responsible for global warming? Carbon dioxide (CO2), the leading greenhouse gas (GHG), contributes to about 80% of the global warming effect. (Lashof and Ahuja, 1990) The complete carbon footprint of a building is a key contributor to GHG emissions. Atruezero carbonbuilding wouldaccount forandoffset both itsoperational carbon (OC) as well as its embodied carbon (EC), the carbon used to construct the building. (NZGBC, n.d. 2021) Most EC emissions are upstream or ‘upfront’ of building occupancy and are primarily related to materials manufacturing. This includes the extraction of raw resources, manufacturing of building products, and transportation of those products. (MBIE, 2020) GHG emissions due to material manufacturing, use and disposal are more significant than perhaps many people realise. EC calculations are estimates, not absolutes which makes it hard to have a reliable source to obtain accurate and reliable data (O’Connor, 2020). Priority has generally
Embodied carbon reduction: insight into the maturity of the New Zealand construction industry
Finnie D, david.Finnie@op.ac.nz
2 Literature Review
The production and construction stage consists of five major elements in the European Standards EN 15804 and EN 15978 to calculate EC in buildings. The majority of EC used in a project lifecycle is shown under modules A1 5 in table 1 below.
The NZ Ministry of Innovation and Employment (MBIE) defines operational carbon that is attributed to operational energy consumption during the building’s lifetime and EC which is attributed to building materials, which includes impacts from material extraction, manufacturing, and transportation, as well as building construction, maintenance, replacement of building components, demolition/deconstruction and disposal. The EC percentage is significantly higher than operational carbon in a building's life cycle. (MBIE 2020) This proportionately is shown in figure 1 below.
107 Proceedings of the PAQS Congress 2022, 12th 13th September 2022, Singapore Institute of Surveyors and Valuers, Singapore been given to reducing energy consumption by most scholars but not the EC in the process, and a lack of literature specifically focused on EC. Global approaches like the Paris agreement are in place to limit warming to 1.5°C and subsequently be reduced to zero before the end of the century. (UNFCC, 2015) This research aims to study the local construction industry approach to reducing EC in New Zealand (NZ) commercial construction. In 2020, the construction industry in NZ accounted for 20% of the nation’s carbon emissions. The main contributor is the EC emissions related to material production and energy use in buildings. (Wu et al. 2022) Targeted findings will help inform support strategies for EC reduction in NZ construction, such as developing a fit for the purpose carbon calculator for consistent use across the industry. Findings can also inform the NZ government about the extent EC is being reduced in the construction and infrastructure sectors. This study is limited to NZ commercial construction projects, and the residential and infrastructure projects are excluded. The research provides valuable insight into industry perceptions on the extent that EC is being calculated and reduced in commercial construction projects. It is proposed that further research could include a survey questionnaire to widen the sample base with questions based on these interview findings.
Since greenhouse gases (GHG) are the main contributor to global carbon emission, to meet global GHG reduction goals, infrastructure and buildings must decarbonise before 2050 (IPCC 2018). The built environment sector is responsible for generating approximately 40% of global energy related GHG emissions, and 11% is generated by the manufacturing of materials (IEA 2019). Given that buildings contribute around 40% of GHG emissions worldwide, it is critical that architecture, engineering, and construction (AEC) professionals understand their role in reducing the sector’s carbon footprint (McKinsey & Company, 2020). NZ identifies this percentage as 20% of its total carbon emission through the energy and material used in buildings. (MBIE 2020) This makes calculating the EC of building systems crucial in reducing the carbon footprint of buildings.
0 10 40 50 2060 30 Use
Table 1. Scope of the LCA of buildings (Source: EN 15978 (CEN 2011))
Building lifecycle andProductConstruction End of life Benefits and Loads ReplacementMaintenanceand Operational carbon Embodied carbon (kgCOemissionsCarbon 2 e) Operationalemissions
Cradle
B7


Among the materials used in the construction process, concrete is the most widely used building material, with more than 20 billion tons produced every year, that is 2,268 kilograms every year produced for every person on the planet (Falzon, 2020). This is second only to materials produced and handled by humans, and number one is water (Falzon, 2020). Concrete is more than other regularly used materials that contribute to EC, such as glass, wood, steel, or any other metal. Concrete is a built up of cement water and aggregate. For every tonne of cement produced, one ton of CO2 is admitted into the air atmosphere (Falzon, 2020). A significant percentage of the said productions will also end up as waste concrete and other concrete wastes during and after construction in a project life cycle (Senarathna 2021). stage (years)
Cradle to Grave : Modules A1 to A5 + B1 to B5 + C1 to C4 Cradle to Cradle : Modules A1 to A5 + B1 to B5 + C1 to C4 +D
Cradle to Practical Completion : Modules A1 to A5
108 Proceedings of the PAQS Congress 2022, 12th 13th September 2022, Singapore Institute of Surveyors and Valuers, Singapore Figure 1. Operational and EC emissions over the life cycle of a building (LETI, 2020) Product stage Constructionstage Use stage End of life stage andBenefitsloadsstage A1 A2 A3 A4 A5 B1 B2 B3 B4 B5 C1 C2 C3 C4 D supplymaterialRaw Transport Manufacturing Transport Installation&Construction Process Use Maintenance Repair Refurbishment Replacement andDeconstruction demolition Transport processingWaste Disposal RecyclingRecoveryReuse
Operational Carbon B6 Operational Energy Operational Water to Gate : Modules A1 to A3
As buildings contribute around 40% of GHG emissions worldwide, it is critical that architecture, engineering, and construction (AEC) professionals understand their role in reducing the sector’s carbon footprint (McKinsey & Company, 2020). If today’s building construction initiatives become more sustainable; this will require considerable improvements to incorporate the use of assessment tools. Sustainability assessments are no longer used solely for marketing purposes. Instead, project scopes are increasingly guided by sustainability objectives (Varnäs et al., 2009; Walker & Brammer, 2009). Construction professionals may calculate EC used across all five modules during the design stage planning of projects. Again this highlights the importance of effective EC calculation. This is supported by Schlueter and Thesseling (2009), who found that sustainability decisions are mostly done in preparing the project at the early design stages. Clear targets for building performance and environmental impacts should beset from the initial design for more sustainable buildings (ALwaer and Clements Croome, 2010). This is to avoid extensive modifications required at later stages to meet the specific performance criteria (Schlueter & Thesseling, 2009). Further early resolutions with the contractor’s involvement allow parties to decide the design strategies in advance. Two stage early contractor involvement (2S ECI) involves engaging contractors to work with the client’s design team, an emerging concept also to improve the project efficiency (Finnie, et al. 2019). This early involvement can include considering the alternative use of materials by involving the head contractor and their supply chain in value management and whole lifecycle costing of building material alternatives (Finnie, et al. 2019). This makes gauging the perceptions of project managers, design consultants, and contractors valuable in determining the extent of EC calculation and reduction and its efficacy in reducing EC.
Environmental/ sustainability rating systems such as LEED and BREEAM help designers with sustainable building design by providing indicators and benchmarks, and such voluntary rating systems assist in comparing design options (Berardi, 2011). There are now specialist consultants who specialise in calculating EC. Indeed, Ariyaratne and Moncaster (2014) discuss how existing environmental assessment methods require specialist knowledge in the early stages of design development to be successful. Several assessment tools exist (Poveda and Lipsett, 2011), including a variety of LCA software tools and multiple datasets of the
Rating systems and tools
Studies have found that environmental or sustainability rating systems tools assist decision making in setting goals, benchmarking, and comparing design alternatives. Environmental impacts of construction products may be communicated through environmental product declarations (EPDs) (Waldman et al., 2020). These are used primarily for comparing products. Allproductsmustmeetthepreconditionsofequivalentfunctionalityandcontributiontooverall building impacts for those comparisons to be fair and reasonable. Pomponi and Moncaster (2018) provide the following production process of materials (cradle to manufacturing) (see Table 1) The assessment of EC in buildings has grown as a research field due to the prospect of climate change and global warming. However, EC research must become more established and understood for the science behind it to reach maturity. The assessment information is limited due to either being incomplete or hard to verify and replicate through comparing across multiple projects (Pomponi and Moncaster, 2018).
2.2
109 Proceedings of the PAQS Congress 2022, 12th 13th September 2022, Singapore Institute of Surveyors and Valuers, Singapore
Industry initiatives
2.1
MBIE(2021)evaluates a formulatedapproach to reducing EC from abuilding byhaving inputs at different building life stages as follows; kg CO2 e = m2 x kg material/m2 x kg CO2 e/kg material kg CO2 e Whole of life embodied carbon m2 Size of new building kg material/m2 Use of construction materials & products kg CO2 e/kg material Carbon emissions from the construction materials & products
NZ’s approach via MBIE framework objectives focuses on the three factors resulting in EC. It aims to improve comparing the EC of building materials is key to an effective EC reduction strategy, build efficiency, material efficiency and carbon intensity in a broader view. The use of low carbon building materials was suggested, and the increased use of alternative materials with lower EC was found to be a key carbon emissions mitigation strategy. (Giesekam et al. 2015) Reusing and recycling materials have been found important in reducing energy and resources over an extended period. (Senarathna, 2021; Kumanayake, 2018). This is further supported by numerous studies that show that the use of recycled and reused materials can significantly reduce the EC of a building (Çelik and Altan, 2017; Gorgolewski, 2008; Gao et al., 2001). Therefore, there is a need to study the extent to which EC is considered and calculated in NZ construction projects. EC savings can be utilised during both the design and construction stages, which contrasts with operational emissions savings delivered during building use.
2 (Scheuer et al., 2003) University Michigan, USA 75 7,300 246.58*
Timber can be used instead of concrete and steel to lower EC. This is a sustainable approach in a context like NZ, where timber is mainly available along with the existing forestry strategies.StudiesshowthatsustainablysourcedtimberintheUnitedKingdomwouldtypically reduce EC by 20%. Furthermore, approximately 2.5% EC reduction can be achieved when aggregates are locally resourced. (WARP, 2015) Table 2 below presents global studies and compares the operational carbon emissions against the floor area of commercial buildings. No. Reference Type buildingof Location span/yearLife Gross floor area/m2 /(kg.mGHG/Carbonemissions 2 CO2 per year)
4 (Wu et al., 2012) University Liaoning,China 50 36,500 318.64
110 Proceedings of the PAQS Congress 2022, 12th 13th September 2022, Singapore Institute of Surveyors and Valuers, Singapore environmental impacts of building materials. Tools such as ATHENA, BEES 4.0, ENVEST 2, SimaPro, etc., provide a relatively easy to use approach to determining the life cycle impacts of buildings (Dixit et al., 2012). However, scant research exists in determining the extent that such tools are being used or about industry satisfaction with them.
1 (Biswas, 2014) University AustraliaWestern 50 4,020 70.80*
3 (Kofoworola and Gheewala, 2008) Office Bangkok,Thailand 50 60,000 20.00*
5 (Kua and 2012)Wong, Commercial Singapore 30 52,094 108.30*
The incorporation of EC in NZ construction projects appears to be a new and emerging territory, with infrastructure projects being slightly ahead due to their larger budgets. Steel and concrete appear to be major contributors to EC, requiring greater attention. This compares with research done overseas (Falzon, 2020) explained that “Concrete is the most used building material with more than 20 billion tons produced every year, that is 2,268 kilo grams every year produced for every person on the planet”. Also, the case study included in the literature above (Kumanayake et al., 2018) explains that concrete is one of six materials that make up 94% of the total EC in the three story commercial office building. The Royal Institute of
111
Note: *GHG values are given (kg.m 2 CO2eq per year)
A case study on a three story commercial office building by (Kumanayake et al., 2018) found that the EC of the material phase was much higher at 629.6kgCO2/m2 of the gross floor area of the commercial building. Reinforcing steel was found to have a disproportionately high EC content relative to its insignificant material mass of 0.19%. This contributed to an EC of 6.31% and indeed has the highest EC among all materials considered in the study which is 9.16kgCO2/kg). Again concrete and steel were found to contribute the most EC. Among materials considered, six materials, namely reinforcing steel, clay bricks, ready mixed concrete, rubble, cement mortar and aluminium, were found to be responsible for 94% of the total EC in the three story commercial office building.
Semi structured interviews provided the flexibility to explore questions in depth using a qualitativeapproach(DeVaus,2001). Thepurposiveinterviewsamplecomprisedofoneclient, threehead contractorswhoworkwithinsustainability orientedprojectsandtwoECconsultants who are in the capacity of consulting on pre and post contract stages to achieve EC reduction.
4 Findings and Discussion 4.1 Awareness of EC calculation and reduction
Table 2: Global studies on life cycle carbon emissions
An exploratory qualitative research method through interviews with industry practitioners was the methodology adopted to conduct the research. The literature review focused on the progressiveEC frameworks initiatedinothercountries to help provideabasis forthequestions.
The client was based in Dunedin, two contractors and one EC consultant were based in Auckland,oneEC consultantwas basedin Wellington, andonecontractorwas in Christchurch.
3 Methodology
The two EC consultants had experience ranging from 7 20 years, and three head contractors possess 15 30 years in the construction industry. All interviewees held senior positions within their respective organisations and had nationwide awareness of what was happening within their firms. The questions abstract the interviewee’s knowledge of EC reduction, current and future strategies that their firms have adopted to reduce EC during project development, including the assessment tools used to calculate EC, and the associated drivers and barriers to EC reduction in NZ at present. Discussions with interviewees were based on completed or ongoing projects incorporating or incorporating EC reduction. Findings provide insight into the extent to which EC is calculated and reduced in NZ commercial construction and indicate the level of industry maturity in this regard.
Proceedings of the PAQS Congress 2022, 12th 13th September 2022, Singapore Institute of Surveyors and Valuers, Singapore 6 (Kumanayake,Luo,2018) University Ratmalana, Sri Lanka 50 5,967 31.81
All head contracts and one EC consultant have been involved in construction projects that incorporated EC calculation. One EC consultant had helped a NZ construction company develop a sustainability team to work on a large scale new build. They had also completed all third partyreviews onall LCAs completed.Additionally,oneheadcontractorspokeabout their company completing the first four star GreenStar rated supermarket in NZ. They had also completed five low carbon timber buildings across NZ. The reduction of EC on five ongoing projects was all driven by clients. Clients will do what they want, and head contractors can only suggest using materials with low carbon to reduce EC. Clients on the five projects were certain about including materials that are lower in carbon and wanted to be an example of what to use and do regarding EC.
Interviewees expressed a sound awareness of EC reduction. However, there appears to be a range of approaches to EC pricing methodologies and tools used to calculate EC. Client appetite for reducing EC can also present a barrier in convincing them to invest more time and cost toward what is currently perceived as more risky design alternatives. The cost and time required to calculate low EC comparisons and the potential additional cost of adopting EC alternatives appear to be the main challenges, along with supply chain capacity to meet the
All interviewees exhibited a sound knowledge about EC reduction based on experiences on their projects and the leading materials that contribute to EC. Interviewees agreed that the fundamental approach to EC reduction in the NZ construction industry is demonstrating the assessment to the clients with the aid of calculations. The EC consultants widely adopt ISO14067 2018 to evaluate and quantify EC. All interviewees agreed that the three primary materials that contribute the highest EC in construction are concrete, steel, and aluminium. This supports findings from overseas literature by Falzon (2020) and Senarathna (2021) that thesethreematerials arethehighest EC contributors. All interviewees said that theyunderstood the three main materials used in NZ construction that contribute to EC being concrete, steel, and aluminium. Client interest in the EC used on their buildings appears to be growing, and this supports findings from overseas that project scopes are increasingly guided by sustainability objectives (Varnäs et al., 2009; Walker & Brammer, 2009). Interviewees seemed aware of their role in calculating EC. This supports the argument by (McKinsey & Company, 2020) that construction professionals should understand their role in reducing the sector’s carbon footprint. However, there appears to be inconsistency within NZ construction around the tools and strategies used to measure and calculate EC. This is perhaps unsurprising given the range of EC calculators available.
112 Proceedings of the PAQS Congress 2022, 12th 13th September 2022, Singapore Institute of Surveyors and Valuers, Singapore Chartered Surveyors (RICS), recommend focusing on the high-impact materials ‘carbon hotspots’ which include concrete and steel.
4.2 Challenges
Another head contractor mentioned they have two projects in which they are incorporating EC impact. One is likely to move away from using low carbon products due to Covid 19; the client isextremelyworriedabouttheeffect ofcostescalationandmaterial delaysontheirprogramme. The head contractor explained how a few clients have been moving away from utilising sustainability in buildings due to uncertain times regarding Covid 19 and the global pandemic. Some clients need a project built as soon as possible; with undesirable delays and additional costs, they do not see the objective of incorporating EC into new projects. Unfortunately, cost escalation and material delays appear to be key barriers to adopting strategies to lower EC impact, and Covid 19 appears to be a significant contributor to such barriers.
113 Proceedings of the PAQS Congress 2022, 12th 13th September 2022, Singapore Institute of Surveyors and Valuers, Singapore demand for low EC systems and materials. To this end, the contractors interviewed felt that consultants could be difficult to convince to adopt low EC alternatives.
Thehead contractorwas employedthrough2S ECI.However,bythetimetheywereappointed, detaileddesignwasnearlycomplete,minimisingtheirinvolvementindesigndevelopment.The client acknowledged that the head contractor should probably have been engaged early in the project to add value true through 2S ECI. The client reported that EC was not calculated during value management exercises at the design stage and that it was difficult to obtain clear cost comparisons between using the CLT and LVL. Then during construction, the project incurred delays due NZ only having one sole supplier of CLT and LVL. Since the project was completed, the client confirmed that there are now two suppliers. There was frustration about not being able to import from overseas suppliers due to barriers in obtaining building consent for projects using CLT and LVL. The client said that the tertiary building probably incurred a cost premium for incorporating sustainable design solutions, which included both the use of the CLT and LVL, but it was difficult to confirm the premium. The client expects that cost comparisons will become more accurate as the market builds capacity and head contractors are more proactive regarding low EC calculations.
Providing sufficient time to calculate and compare EC across materials appears crucial in reducing carbon emissions. Finnie et al. (2021) emphasises early contractor involvement (ECI) in the client’s design team in terms of project and contractual efficiency. One of the contractors interviewed felt they were ahead of the curve when it comes to EC calculation. The contractor with experience in civil and commercial construction said that civil construction projects have a relatively higher budget than commercial construction, which helps drive the conversation on EC. They had also been asked by two major clients to be introduced during the early design phase of projects to use their relationship with their supply chain to help reduce EC as much as possible from an early stage. Such involvement also allows lead in time to start manufacturing and securing a price early to give the client a realistic budget required for a project. Previous studies (Finnie, AMEER Ali and Park, 2019; ALwaer & Clements Croome, 2010; Schlueter and Thesseling, 2009) also support the importance of getting involved in the early stages of Anotherdesign.
key issue appears to be the inconsistent use of EC calculation tools. To calculate EC, both head contractors used carbon calculator tools. All three head contractors and their companies were using carbon calculators and the information available for EPDs. However, it was felt that such tools' reliability could vary between project scenarios. One EC consultant mentioned that there are limitations to using the local calculator as it can only be utilised in specific scenarios. This highlights how assessment information can be limited due to incomplete or challenging to verify and replicate data to compare across multiple projects (Pomponi and Moncaster, 2018). This aligns with findings by Gonzalez and Navarro (2006) that a careful selection of materials is required to reduce EC. One EC consultant mentioned that there are limitations to using the local calculator as it can only be utilised in certain scenarios. This highlights how assessment information can be limited due to incomplete or hard to verify and replicate data to compare across multiple projects (Pomponi and Moncaster, 2018). However, this might be compared to the industry drafting their construction contracts due to a lack of standard form contracts for consistent application. The use of cross laminated timber (CLT) and laminated veneer lumber (LVL) is growing material selection in NZ. Those provide low EC and more sustainable alternative to steel and concrete. Both materials were used on a five storied tertiary accommodation building structure and floors in the Otago region. The client’s sustainability objectives drove this transformation.
The head contractor’s estimate on another project calculated the cost variance of adopting a timber structure instead of steel to be between a 5 10% increase in the overall contract sum. The consultant said that they tend to add additional costs to account for the risks of the building with low EC alternatives, emphasising the use of more timber to reduce EC. The consultant estimated that projects could cost between 20 25% higher when using EC reduced materials.
Interviewees said that the pricing difference between the contractor and consultant is purely due to risk and uncertainty. This is supported by the contractors perceiving a lack of a standard fit for purpose tool to calculate EC despite a range of available tools. It was held that as more projects focus on reducing EC, this will help to increase the accuracy of these estimates to understand the actual cost differences in NZ. Wider adoption may also reduce the cost per unit of low EC alternatives. For example, it was held that concrete suppliers were good at providing environmental product declarations (EPDs). However, when the demand for low EC fell off, low EC concrete came at a high expense.
114 Proceedings of the PAQS Congress 2022, 12th 13th September 2022, Singapore Institute of Surveyors and Valuers, Singapore
4.3 Opportunities to improve EC reduction
Three head contractors were incorporating EC reductions in current projects, and their companies were also pricing and measuring EC for new builds and renovations. One head contractor said they were “starting to use less steel in buildings and more LVL instead or as well.” As a business, they set to achieve their in house goals around carbon through reducing diesel vehicles, plants, air miles and power. They further provided that “changingonesix story office building from concrete and steel to timber is the equivalent to four years of our company’s carbon footprint.” This aligns with findings by Gonzalez and Navarro (2006) that a careful selection of materials is required to reduce EC. While reducing their own EC impact, they were also trying to influence their clients for a wider sustainability impact.
Another head contractor said that their company had done some internal research to determine the extent of EC in the buildings they construct. Like many others, they realised that they use a lot of concrete, steel, and aluminium, which are high contributors to EC. Their head office was focusing on their corporate goals to "build less or build smarter, less being less EC materials, and better ideas or build smarter and use lower EC materials.” This supports prior studies that EC can be reduced by using fewer materials (Kumanayake, 2018) and using materials with lower EC (Giesekam et al., 2015), such as replacing steel and concrete with timber.
One common approach used to reduce EC expressed by interviewees is the use of more cross laminated veneer (CLT) and laminated veneer lumber (LVL) in place of steel in buildings or a combination of both. One consultant had conducted a draft study and observed that four years of their company’s carbon footprint could eliminate just by changing one of their proposed six storied office buildings from concrete and steel to timber. Improving EC reduction may require educating clients about the benefits and requirements, and this may be guided in NZ by the Whole of Life Embodied Carbon Emissions Reduction Framework released in August 2020. (MBIE, 2020) While reducing their own EC impact, one consultant was also trying to influence their clients for a broader sustainability impact. This means convincing clients to invest more time in early planning to calculate EC and for achieving Green Star accreditation, which provides a scoring system for sustainability measures and provides a Net Zero Carbon Roadmap for Aotearoa (NZGBC, n.d. 2021), and to ensure sufficient time for off-site manufacturing of structural systems.
According to Andrew Eagles, chief executive of the NZ Green Building Council: “This is a great announcement for New Zealanders, the building industry, and efforts to slash climate change pollution…Buildings make up around one fifth of New Zealand’s carbon emissions, and the government and public sector are the largest owner and occupiers of buildings inthe country making this a hugely significant shift that could be a tipping point transforming the entire industry.”
115
While commendable, this policy initiative requires the infrastructure to design and construct Green Star accredited sustainable buildings. At present, the government policy to Green Star accredits all government buildings over NZD 9 million may be adding more significant supply chain pressures to what already appears to be an already under supplied market of timber alternatives for commercial buildings in NZ. Again, growing the supply of CLT and LVL appears to present an opportunity in terms of lowering the cost of low EC alternatives and improvingthecapacity to supply. Furthercost effectiveopportunities to reduceEC ofbuilding construction can include evaluating leaner designs, designing out waste, reusing materials and selecting materials with low EC over the project life cycle. Quantifying these savings can be done when evaluating design alternatives; this can be form part of a carbon efficient plan (WARP, 2014). 5 Conclusions
This study has provided insight into the extent of EC calculation and reduction in NZ commercial construction projects. There appears to be sound awareness of EC calculation and reduction from the sample of industry practitioners interviewed and which materials contribute most to EC. Challenges include a lack of appetite from clients to adopt more sustainable design solutions, which may add an estimated 5 24% to the project’s total build cost. However, as more
Proceedings of the PAQS Congress 2022, 12th 13th September 2022, Singapore Institute of Surveyors and Valuers, Singapore Their workshops were led by an engineering consultant who asserted that they are leading this space in NZ; “workshops were extremely helpful to measure EC on projects and also to have a step in the right direction to gain knowledgewith EC in the construction industry.” Based on the interviews conducted, it appears that going forward, costs of low EC design alternatives mightbereducedbyintroducingmoreCLTandLVLsupplierseitherthroughtheirintroduction in NZ or through providing a pathway to importing systems from overseas. Calculating cost comparisons might also be made more accurate by incorporating a common EC calculation tool in value management exercises during the design stage with the early engagement of the head contractor and their supply chain. This is supported by the frustration expressed by contractors about the lack of any fit for purpose EC calculation tool, the need to involve contractors early, and the difference in perceived cost differentials of incorporating low EC design alternatives between consultants and contractors. The cost of low EC alternatives such as low EC concrete may also be reduced through its greater use. This supports interview findings that client education represents an opportunity to achieve lower EC in commercial construction projects. The NZ government is taking the lead in more sustainable building designs. According to the NZ Green Building Council (NZGBC, 2021), from 1 April 2022, new non residential government buildings with a capital value over $25 million have to meet a minimum Green Star rating of five. Further, the same standard will apply to government buildings with a capital value of over $9 million from 1 April 2023.
116 Proceedings of the PAQS Congress 2022, 12th 13th September 2022, Singapore Institute of Surveyors and Valuers, Singapore sustainable designs are adopted, the cost of low EC alternatives, such as low EC concrete, may reduce. Similarly, building capacity to produce more CLT and LVL within NZ or allowing its importation from overseas may help to reduce costs compared to steel and concrete, making its pricing more accurate, and helping to avoid delays in the supply chain. Other barriers include a perceived lack of any standard fit for purpose tool for calculating EC, despite a range of EC calculating tools available. A standard fit for purpose tool may help to provide more consistent and accurate calculation of low EC design solutions.
Further opportunity exists to start conversations about EC and educate clients about the associated environmental harm of EC and climate change early in the design stage. Sufficient time is required for this. Involving contractors early, such as through 2S ECI, may help improve the accuracy when calculating the costs of adopting low EC design alternatives by involving the head contractor’s supply chain in cost calculations and providing the client with a more accurate construction programme and budget. The importance of timing and price accuracy is crucial to EC calculation and reduction of EC. It also enables early ordering of materials, something particularly relevant as the industry experiences supply chain delays due to Covid 19 disruption, and vital for NZ being more remote to the global market and relying on overseas importing of some materials. Finally, the consistent use of EC data with environmental product declarations (EPDs)and LCAsmayhelp to determine thebest materials for the specific building in terms of EC reduction. Opportunities exist to develop a fit for purpose EC calculation tool and educate clients and consultants about EC reduction. Further, the time and resources required to calculate EC during the design stage can be reduced by the benefits of ECI. It will provide more readily available low EC systems and materials to help reduce costs and mitigate project delays resulting from supply chain bottlenecks.
Further research could include widening the interview sample or conducting a survey questionnaire to establish better the extent that EC is calculated and reduced across the NZ construction sector and to help determine the industries' needs toward lowering Ec in construction. These findings may help inform decision makers of public and private funded construction projects through direct application and education via design and construction diplomas and degrees.
Available from: https://nmafpublic.s3.amazonaws.com/files/2020/506/1611612594527 CA Embodied Carbon.pdf
Berardi,U.,2012.Sustainabilityassessmentin theconstructionsector: ratingsystems andrated buildings. Sustainable development, 20(6), pp.411 424.
6 References Alwaer, H. and Clements Croome, D.J., 2010. Key performance indicators (KPIs) and priority setting in using the multi attribute approach for assessing sustainable intelligent buildings. Building and environment, 45(4), pp.799 807.
Ariyaratne, C.I. and Moncaster, A.M., 2014. Stand alone calculation tools are not the answer to embodied carbon assessment. Energy Procedia, 62, pp.150 159.
Biswas, W.K., 2014. Carbon footprint and embodied energy consumption assessment of building construction works in Western Australia. International Journal of Sustainable Built Environment, 3(2), pp.179 186.
Altan, M.F., 2017. Evaluation of Risk in Turkish Construction Sector. Journalof Sustainable Construction Materials and Technologies, 2(2), pp.120 131. CEN, 2011. EN 15978:2011: Sustainability of construction works Assessment of environmental performance of buildings Calculation method. International standard. European Committee for Standardization (CEN). CEN. 2019. EN 15804:2012+A2:2019: Sustainability of construction works. Environmental product declarations. Core rules for the product category of construction products BSI British Standards. European Committee for Standardization (CEN). De Vaus, D.A.V.I.D., 2001. The context of design. Research design in social research, 279 Dixit, M.K., Fernández Solís, J.L., Lavy, S. and Culp, C.H., 2012. Need for an embodied energy measurement protocol for buildings: A review paper. Renewable and sustainable energy reviews, 16(6), pp.3730 3743.
Gayantha,D.W.K.andSenarathna,D.R.,2018.Semi PublicSpaceImpactofTraditionalSpace Planning on thes of Contemporary Sri Lankan Houses. Falzon G, 2020. [Video] Why We Should Turn CO2 into Concrete[Video]. TEDx Talks. YouTube. https://youtu.be/oNrHu7E1u5U
Finnie, D., Improving 2 stage early contractor involvement lessons from New Zealand. Gao, W., Ariyama,T.,Ojima,T.andMeier,A.,2001.Energyimpacts ofrecyclingdisassembly material in residential buildings. Energy and buildings, 33(6), pp.553 562. Giesekam, J., Barrett, J.R. and Taylor, P., 2016. Construction sector views on low carbon building materials. Building research & information, 44(4), pp.423 444.
González, M.J. and Navarro, J.G., 2006. Assessment of the decrease of CO2 emissions in the construction field through the selection of materials: Practical case study of three houses of low environmental impact. Building and environment, 41(7), pp.902 909. Gorgolewski, M., 2008. Designing with reused building components: some challenges. Building Research & Information, 36(2), pp.175 188.
117 Proceedings of the PAQS Congress 2022, 12th 13th September 2022, Singapore Institute of Surveyors and Valuers, Singapore Cameron, L., 2020. Data to the Rescue: Embodied Carbon in Buildings and the Urgency of Çelik,Now.B.and
IEA, 2019. Global Status Report for Buildings and Construction 2019, IEA, Paris https://www.iea.org/reports/global status report for buildings and construction 2019 IPCC, 2018: Summary for Policymakers. In: Global Warming of 1.5°C. An IPCC Special Report on the impacts of global warming of 1.5°C above pre industrial levels and related global greenhouse gas emission pathways, in the context of strengthening the global response to the threat ofclimate change, sustainable development, and efforts to eradicate poverty [Masson Delmotte, V., P. Zhai, H. O. Pörtner, D. Roberts, J. Skea, P.R. Shukla, A. Pirani, W. Moufouma Okia, C. Péan, R. Pidcock, S. Connors, J.B.R. Matthews, Y. Chen, X. Zhou, M.I. Gomis, E. Lonnoy, T. Maycock, M. Tignor, and T. Waterfield (eds.)].
Pomponi, F. and Moncaster, A., 2018. Scrutinising embodied carbon in buildings: The next performance gap made manifest. Renewable and Sustainable Energy Reviews, 81, pp.2431 2442.
Kofoworola, O.F. and Gheewala, S.H., 2008. Environmental life cycle assessment of a commercial office building in Thailand. The International Journal of Life Cycle Assessment, 13(6), pp.498 511. Kua,H.W. and Wong,C.L.,2012.Analysingthelifecyclegreenhousegas emissionandenergy consumption of a multi storied commercial building in Singapore from an extended system boundary perspective. Energy and buildings, 51, pp.6 14.
O’Connor J, 2020. What can we do about embodied carbon? What Can We Do About Embodied Carbon? [Online]
Poveda, C.A. and Lipsett, M.G., 2011. A rating system for sustainability of industrial projects with application in oil sands and heavy oil projects: origins and fundamentals. Journal of Sustainable Development, 4(3), p.59. Scheuer, C., Keoleian, G.A. and Reppe, P., 2003. Life cycle energy and environmental performance of a new university building: modeling challenges and design implications. Energy and buildings, 35(10), pp.1049 1064. Schlueter, A. and Thesseling, F., 2009. Building information model based energy/exergy performance assessment in early design stages. Automation in construction, 18(2), pp.153 Senarathna,163.
.
D.R. and Perera, B.L.S.H., 2021. Managing concrete wastes by implementing contemporary construction practices in Sri Lanka.
118 Proceedings of the PAQS Congress 2022, 12th 13th September 2022, Singapore Institute of Surveyors and Valuers, Singapore Cambridge University Press, Cambridge, UK and New York, NY, USA, pp. 3-24, doi:10.1017/9781009157940.001
Kumanayake, R. and Luo, H., 2018. Life cycle carbon emission assessment of a multi purpose university building: A case study of Sri Lanka. Front. Eng. Manag, 5, pp.381 393. Kumanayake, R., Luo, H. and Paulusz, N., 2018. Assessment of material related embodied carbon of an office building in Sri Lanka. Energy and Buildings, 166, pp.250 257. Lashof, D.A. and Ahuja, D.R., 1990. Relative contributions of greenhouse gas emissions to global warming. Nature, 344 (6266), 529 531.
LETI, 2020. Embodied Carbon Primer: Supplementary guidance to the Climate Emergency Design Guide. UK 2020 MBIE, 2020. Whole of Life Embodied Carbon Emissions Reduction Framework: Building for climate change programme, MBIE, NZ https://www.mbie.govt.nz/dmsdocument/11794 whole of life embodied carbon emissions reduction framework NZGBC. 2021. Government green building commitment gets national and international applause. Available from: https://www.nzgbc.org.nz/Story?Action=View&Story_id=739
FINAL PRO095 009 Embodied Carbon Annex.pdf Wu, H., Liang, H., Roy, K., Harrison, E., Fang, Z., De Silva, K., Collins, N., and Lim, J.B.P., 2022. Analysing the Climate Change Potential of Residential Steel Buildings in New Zealand and Their Alignment in Meeting the 2050 Paris Agreement Targets. Buildings, 12 (3), 290. Wu, H.J., Yuan, Z.W., Zhang, L. and Bi, J., 2012. Life cycle energy consumption and CO2 emission of an office building in China. The international journal of life cycle assessment, 17(2), pp.105-118.
on Climate Change, 2015. Adoption of the Paris agreement. Varnäs, A., Balfors, B. and Faith Ell, C., 2009. Environmental consideration in procurement of construction contracts: current practice, problems and opportunities in green procurement in the Swedish construction industry. Journal of cleaner production, 17(13), pp.1214 1222. Waldman, B., Huang, M. and Simonen, K., 2020. Embodied carbon in construction materials: a framework for quantifying data quality in EPDs. Buildings and Cities, 1(1). WARP, 2015. Cutting embodied carbon in construction projects, Waste and resource action program, UK https://greenbuildingencyclopaedia.uk/wp content/uploads/2015/11/WRAP
Proceedings of the PAQS Congress 2022, 12th 13th September 2022, Singapore Institute of Surveyors and Valuers, Singapore Toitū, E. and NZGBC, n.d. Zero carbon buildings. 2021 Available from: Unitedhttps://www.nzgbc.org.nz/zerocarbonNations.FrameworkConvention
119
Proceedings of the PAQS Congress 2022, 12th 13th September 2022, Singapore Institute of Surveyors and Valuers, Singapore
120
BKAsiaPacific (Singapore) Pte. Ltd., Singapore Wong Yi Min, wongym21@yahoo.com
Vincent Leong Poh Man, vleong@bkasiapacific.com
Smart Cities What Technologies Can Eventually Do in the Built Environment
Singapore Institute of Surveyors and Valuers, Singapore Abstract Cities have been actively exploring the possibilities of deploying a plethora of smart city solutions to drive greater urban resilience. As cities start to reopen their economies and people return to work, we wish to have green and smart buildings like a giant N95 facemasks, protectingoccupants fromharmfultoxinsthemomentyoustepinside.Whatcontributetosmart cities other than deploying of technologies would be the implementation of circular economy and creating a smart building that improve occupants lives with the use of technology like a smart city and gives wellness to the occupants. Becoming a smart city is not a goal but a means to an end. The entire point is to respond more effectively and dynamically to the needs and desires of residents. Today 55% of the world’s population lives in urban areas, but by 2050 almost 70% of the world will. Technology is simply a tool to optimize the infrastructure, resources and spaces they share. Findings on how smart buildings can lead to smart cities and howit improves health andproductivityof theoccupants wouldbe shared. Thetraditional roles of Quantity Surveyors have evolved tremendously to accommodate green and smart buildings in conjunction with new roles. These changing roles in relation to making buildings smart, green and liveable include sustainability strategy development, consulting in green building rating system, etc. Quantity Surveyors are required to progressively hone their skills and knowledge of new and emerging building materials that allow him to advise on the cost of developments and inform the design team on the parameters of efficiencies, design factors and life cycle costing assessment (value engineering and cost worth models).
1 Introduction In retrospect, “smart cities” has long been a fashionable policy research area with multiple cities collaborating with the private sectors to apply the use of technology across public infrastructures. In most developed countries, the government has recognized the importance to speed up the whole of nation level digitalization across industries. Smart facility management, internet of things (IoT), surveillance, security and circular built environment are becoming the hallmarks of smart cities as they create technologically advanced, safe and liveable urban environments despite times of pandemic.
Smart buildings are essential parts of a scalable smart city, providing key building blocks for the centralized management and operation of services like electricity, gas and water in order to
Key words circular built environment, green, life cycle costing, smart cities, wellness.
Other than the IoT, we should investigate what contribute to smart cities other than deploying of technologies. The authors look into smart buildings which further compliment to the goal of smart cities as a whole. A smart building should also improve occupants lives with the use of technology like a smart city but gives wellness to the occupants.
2.1 What Entails Smart Cities?
Smart cities add digital intelligence to existing urban systems, making it possible to do more with less. Connected applications put real-time, transparent information into the hands of users to help them make better choices. These tools can save lives, time, reduce waste, and even help boost social connectedness. When cities function more efficiently, they also become more productive places to do business. As cities get smarter, they are becoming more liveable, more responsive, and today we are seeing only a preview of what technology could eventually do in the urban environment. A similar concept, smart eco city, proposes that the city should be ecologically healthy, using advanced technologies and having economically productive and environmentally efficient industries, have a responsible and harmonious systematic culture, a physically aesthetic and functionally living landscape.
Generally, a smart city revolves around data and more specifically, integrating that data together in order to generate insights. The growing number of Internet of Things (IoT) applications and devices, for instance, as well as sensors, security cameras, digital kiosks, have ushered in a new age of big data based everything. Gathering the data alone is not enough. It’s through the intelligent use of analytics and application, which provides value and allows cities and centralized command and control platform to help monitor, manage and control systems across its disparate communities.
121
Proceedings of the PAQS Congress 2022, 12th 13th September 2022, Singapore Institute of Surveyors and Valuers, Singapore help reduce consumption and cost. Ultimately, individual smart buildings are a critical part of a smart city’s collective and collaborative ecosystem. The idea of smart buildings is not new; there is hard wired intelligence in essentially every structure with wireless connectivity or central climate control. Expanding that idea citywide of making a single structure safer and more energy efficient, has potentially world shaping consequences.
2 What Makes a City “Smart”?
Buildings have been traditionally seen as physical structures with on premises solutions focusing on the building operations. However, due to technology advancements and the emergence of IoT, buildings have transformed into interfaces between the users of the building and the wider community around the building. From an operational point of view, buildings are moving towards becoming self adaptive or autonomous, with prescriptive maintenance mechanisms enabled by machine learning. With all buildings required to be net zero carbon by 2050 to meet the goals of the Paris Agreement, the demand for smart buildings is only increasing. Government policies, teamed with financial incentives for companies to invest in smart buildings, are crucial to help transition toward accessing major energy savings whilst improving energy services. Smart buildings contribute to smart cities as most of the time people spend their time indoor hence buildings should not be disregarded.
2.2 What is the Role of a Quantity Surveyor in Smart Cities Development?
2. Understanding various green building rating tools in the world and criteria such as EDGE Certification, LEED, BREEAM and Green Mark;
The QS should be well educated with sound knowledge on the environmentally friendly technologies and innovations in smart cities and buildings and keep up to date of the new and emerging building materials and technologies that allow him/her to advise on the cost of developments and inform the design team on the parameters of efficiencies, design factors and concepts. The QS often support in avoiding over specification, minimise energy use through recommending new technologies, reduce waste by avoiding the intensive use of materials etc.
The authors recommend that QS can rise to the challenges by:
The role of a Quantity Surveyor (QS) is evolving to keep abreast with the sustainable needs and new technologies including smart cities and smart buildings. Developer now engages with the QS at the very early stage of a development and way before any construction has taken place to utilise their expertise in the feasibility, design and planning stage to achieve the best Atvalue.the conception stage of the construction project, a QS will produce a schedule of all the materials to be used during the project. It is at this point that the QS can ensure sustainable materials are used in the smart buildings. Sustainability has long been associated with additional cost, but the QS will look at the long term value although some of the materials may be more costly in the short term. The QS can look at other ways to promote sustainability in smart buildings e.g. look at how to reduce build times, minimise wastage and to use pre assembly wherever possible.
Moving forward, as cities start to reopen their economies and people return to work, installing green building technologies in shopping centres, offices, factories and other shared spaces can help to limit the spread of the virus within them and stand them in good stead against future disease outbreaks. Thus, there will be a stronger preference for buildings with wellness and environmental features. We can imagine green and smart buildings as giant N95 facemasks, protecting occupants from harmful toxins the moment you step inside.
3. Understanding the sustainable designs and integration of smart buildings (including knowledge of sustainable materials, latest green products and technologies);
4. Smart buildings and green buildings costing;
5. Life cycle costing and assessment (including value engineering and cost worth models).
1. Understand what is required for smart buildings and green buildings;
Proceedings of the PAQS Congress 2022, 12th 13th September 2022, Singapore Institute of Surveyors and Valuers, Singapore
122
Not every city needs to be engineered from the ground up to be smart. Instead, older buildings and cities can be retrofitted in smaller but important ways. Smart buildings often allow their owners and operators to extract better data out of the structures and make continuous tweaks to their energy consumption. In the longer term, new buildings can further shrink their carbon footprint and aid in disease prevention by maximising natural ventilation or making use of innovative ventilation systems that are already deployed in cities.
The future of cities is smart. Intelligent buildings that would have been unimaginable a few decades ago are now a reality and will be crucial to the development and success of sustainable smart cities. From home and office to transport and utilities, smart cities will begin to take shape, as advances in IoTandAIbringtogethersmart buildings,smart powergrids,andelectric vehicle (EV) charging to form a new smart society ecosystem that is increasingly interconnected and efficient.
The role of a QS is evolving to keep abreast with the sustainable needs and new technologies including smart cities and buildings. Sustainability has long been associated with additional cost, but the QS will look at the long term value and look at other ways to promote sustainability in smart buildings e.g. look at how to reduce build times, minimise wastage and to usepre-assembly whereverpossible. The QS should bewell educatedwithsound knowledge on the environmentally friendly technologies and innovations in smart cities and buildings and keep up to dateofthenewandemergingbuilding materials andtechnologies thatallowhim/her to advise on the cost of developments and inform the design team on the parameters of efficiencies, design factors and concepts.
Dominika Czerwinska (2017), How green buildings can help achieve the Sustainable Development Goals, Eco Business Newsletter, [Online] http://www.eco business.com/opinion/how green buildings can help achieve the sustainable development goals/ [Accessed: July 2020]
Becoming a smart city is not a goal but a means to an end. Today, buildings account for 40% of global carbon dioxide emissions, an even bigger carbon footprint than transportation. Cities consume an extraordinary amount of energy; lighting alone accounts for an average of 30% to 40% of municipal electricity budgets. A smart city could help curtail those numbers, increasing energy efficiency while significantly reducing its carbon footprint.
For centuries, many buildings were designed and constructed in a similar way. They were the product of industrial processes, functionally inert and unresponsive to the changing environment. Ultimately, to increase the value associated with and generated by big buildings, architects and designers must embrace a building and planning proposition that goes beyond steel or concrete. Our structures must become living objects more attuned to the environment and the needs of those within. This will help lead to smarter cities that are more responsive to individual and collective needs.
As the world evolves into smart cities, it is inevitable that QS has to change the way they work traditionally. An effective QS wears many hats in the new era and are required to treat the discovery,specification,quantification,andimplementation ofsmart infrastructurefrom cradle to grave in a project cycle. QS who double up as technologists or facilities managers can contribute to data conversations; empathise with clients better and provide pragmatic solutions.
123 Proceedings of the PAQS Congress 2022, 12th 13th September 2022, Singapore Institute of Surveyors and Valuers, Singapore
4 References Amol Shimpi (2019), Emerging Technologies Are Changing the Built Environment and The Nature of Skills, The Economic Times [Online]. https://www.google.com.sg/amp/s/m.economictimes.com/small biz/sme sector/emerging technologies are changing the built environment and the nature of skills/amp_articleshow/69068480.cms [Accessed: September 2020]
3 Conclusion
Nick Easen (2017), Construction: an industry ripe for tech disruption, Business Innovation [Online]. https://www.raconteur.net/business innovation/construction an industry ripe for tech disruption [Accessed: November 2020]
Planning & Construction News (2017), The Future of the Built Environment: What Factors Are Reshaping the Industry? [Online]. http://www.pbctoday.co.uk [Accessed: December Sumana2020]
Proceedings of the PAQS Congress 2022, 12th 13th September 2022, Singapore Institute of Surveyors and Valuers, Singapore
Rao, 2019, The Benefits of AI In Construction [Online]. https://constructible.trimble.com/construction industry/the benefits of AI in construction. [Accessed: July 2020]
WIRED INSIDER, Can Smart Buildings Lead to Smart Cities [Online] https://www.wired.com/wiredinsider/2019/11/can smart buildings lead smart cities/ [Accessed: February 2021] Andreas Renz and Manuel Zafra Solas, 2016. World Economic Forum, Journal of Shaping the Future of Construction A Breakthrough in Mindset and Technology. World Green Building Council, About Green building, How Can We Make Our Buildings Green [Online]. https://www.worldgbc.org/about green building [Accessed: February Zafirah2021]Zein, 2019, Beyond Going Green, the Built Environment Seeks to Improve Health [Online] https://www.eco business.com/news/beyond going green the built environment seeks to improve health/ [Accessed: January 2020]
Mullin, Andrew (2017), ‘The New Age of Engineering and Construction Technology’ McKinsey & Company, Capital Projects & Infrastructure.
124
The conducive working environment to improve employees’ productivity- a case study from mental wellbeing’s perspective
Keywords employees’ productivity/self efficacy, work from home, workplace environment, greenery in office 1
The work from home (WFH) arrangement brought on by the pandemic has worsened the fear about employees’ productivity. This paper investigates the relationship between the workplace environment and the employees’ productivity/self efficacy and job performance from the mental wellbeing perspective. A group of employees are surveyed to identify their preference over WFH arrangement. A psychological analysis will be performed to determine their productivity/self efficacy. Furthermore, the employees who are identified with better productivity/self efficacy will be interviewed to understand factors which make the working environment more conducive in order to increase their productivity, factors such as greenery in office, green building features will be discussed.
125
Proceedings of the PAQS Congress 2022, 12th 13th September 2022, Singapore Institute of Surveyors and Valuers, Singapore
Claire Zhang Pei (corresponding author), clairezhang79@hotmail.com Singapore Institute of Surveyors and Valuers
Introduction
The Covid 19 pandemic has fundamentally shifted the way in which people work. The work from home (WFH) arrangement brought on by the pandemic has worsened the fear about employees’ productivity. Before Covid 19, employers were hesitant about incorporating telecommuting policy, with concern on the negative impact on employees’ productivity/self efficacy. After more than 2 years of WFH and hybrid working, some studies finds out the WFH boom will lift productivity in the United States economy by 5 per cent, mostly because of savings in commuting time. (https://www.straitstimes.com/business/economy/yes working from home makes you more productive us study finds). With study showing that the expectation of employees have changed (https://www.pwc.com/asiapacific hopes and fears 2022) 93% of Singapore employees prefer to continue to work remotely / hybrid) remote and hybrid working is here to stay.
Ruiwu Li, O2WORK Pte Ltd Singapore Lei Feng National University of Singapore, Singapore Abstract
Prihadi 2021concluded the implication of WFH policy during the pandemic will not negatively affect the workers‟ efficacy, as long as they believe that their presence holds significant meaning for the society, and that they feel that they are included in their social circle. WFH might physically alienated individuals and isolate them from each other; nevertheless, interrelationships among them, supported by social media activities, can always keep them believe that they matter, and therefore they will not lose their belief that they can do their work Lawell.nge and Kayser 2022 suggested within an office environment, an employer can create an atmosphere that promotes performance and supports employee health by regulating office space, reducing distractions and noise, physically supporting colleagues or providing optimal technical equipment. The same is true for employees. The level, as well as the amount, of support decreases dramatically when working from home.
2 Literature Review
The literature review was carried out to investigates the relationship between the workplace environment and the employees’ productivity/self efficacy and job performance. A new study from New York, USA says the WFH boom will lift productivity in the United States economy by 5 per cent, mostly because of savings in commuting time. (https://www.straitstimes.com/business/economy/yes working from home makes you more productive us study finds). However, some other study finds the WFH is bad for productivity. According to the study, employers may get more work done at home, but they would have better ideas at the office (https://www.washingtonpost.com/outlook/2021/09/24/working home productivity pandemic remote/)
The debate on the relationship between the workplace environment and the employees’ productivity/self efficacy are controversial. This paper investigates the relationship between the workplace environment and the employees’ productivity/self efficacy and job performance from the mental wellbeing perspective.This paper adopted the General Self Efficacy Scale (GSE) developed by Schwarzer and Jerusalem (1995) to measure the employees’ productivity/self efficacy and job performance from the mental wellbeing perspective. GSE is correlated to emotion, optimism, work satisfaction. The scale is a self report measure of self efficacy. For the GSE, there are 10 items and each item has the scale from 1 to 4. The total score ran GSE between 10 and 40, with a higher score indicating more self efficacy. The GSE score is calculated by adding all scores of the 10 items together. The 10 items under GSE has been appended under Appendix.
3 Methodology This paper’s research aim is to investigates the relationship between the workplace environment and the employees’ productivity/self efficacy and job performance from the mental wellbeing perspective. A group of employees are surveyed to identify their preference over WFH arrangement. A psychological analysis will be performed to determine their
126 Proceedings of the PAQS Congress 2022, 12th 13th September 2022, Singapore Institute of Surveyors and Valuers, Singapore
However Tesla chief exective Elon Musk demanded all Tesla and SpaceX works give up the comforts of WFH and return to office. Cuntless business leaders get frustrated at trying to coax their workers back to the office. What is the mistery of the work environment and worker’s productivity? This paper investigates the relationship between the workplace environment and the employees’ productivity/self efficacy and job performance from the mental wellbeing perspective.
127 Proceedings of the PAQS Congress 2022, 12th 13th September 2022, Singapore Institute of Surveyors and Valuers, Singapore productivity/self efficacy. Furthermore, the employees who are identified with better productivity/self efficacy will be interviewed to understand factors which make the working environment more conducive in order to increase their productivity, factors such as greenery in office, green building features will be discussed.
An analysis has suggested those chosen WFH over work from office have an average GSE score of 39.5 while those chosen work from office have an average GSE score of 33.8. This is about 16.83% higher. The finding here suggests those respondents who preferred WFH have a significant higher GSE score compared with those preferred work from office. Further research might need to be conducted to understand if WFH arrangement will have negative or positive impacts on the employees’ self efficacy.
5 Conclusions
A group of 16 members of a co sharing office service provider have responded the survey and joined the research.
The average GSE score for this study is 35.5. There are 9 out of the 15 respondents had a GSE score higher than that. This group of respondents are invited to discuss the factors which make the working environment more conducive to increase the self efficacy/ productivity. 67% of them think greenery in office can help them to increase their self-efficacy/productivity. This groupof respondents thinkairquality, lightingquality, acoustics,good air conditioning system are important factors for work environment. In details, they think the air con temperature do not need to be set to low and they think low temperature is not conducive and will jeopardise the self efficacy and productivity. For the group had GSE score lower than the average score, 100% of them think greenery in office can help them to increase their self efficacy/ productivity. However, all of them do not think specific factors related to working environment are important for them to improve their efficacy. Rather they rank some other factors like co workers’ attitude, company atmosphere and comfort as the important factors to their efficacy.
4 Findings and Discussion
The case study mixed method (CS MM) research design (Guetterman and Fetters, 2018) was chosen. The case study design might involve collecting both qualitative and quantitative data to create a more complete understanding of case/phenomena. Based on the research aim, we used a single-case study in a particular organization which offers co-sharing office services to invite their members to join the research. A survey has been conducted to understand their preference over WFH arrangement The GSE scale will be used to measure their productivity/self efficacy and job performance from the mental wellbeing perspective. A analysis will be conducted to identify if those prefer WFH will have higher GSE score and last but not the least the employees who are identified with better productivity/self efficacy will be interviewed to understand factors which make the working environment more conducive in order to increase their productivity, factors such as greenery in office, green building features will be discussed.
Data from the research revealed that those chosen WFH over work from office have 16.63% higher average GSE score than those chosen work from office. The group of respondents who have higher than average GSE score think air quality, lighting quality, acoustics, good air conditioning system are important factors for work environment. In details, they think the air
limitation of our study is that since this is a case study, and the sample size of the questionnaire survey was low, the results cannot be generalised. Therefore, without conducting further research in different contexts with a higher number of participants it can only be hypothesised WFH arrangement might not have negative impacts on office worker’s self efficacy/productivity. And office workers with higher self efficacy/productivity think the working environment have impacts on their self efficacy/productivity. Nevertheless, further studies in various contexts and a higher number of participants would be needed to confirm this claim. 6
128
This research surveyed the members of O2WORK Pte Ltd. O2WORK Pte Ltd is providing eco friendly co sharing space in Singapore.
Fetters, M. D. (2018). Two methodological approaches to the integration of mixed methods and case study designs: A systematic review. American Behavioral Scientist, 62(7), 900 918.
Acknowledgement
Proceedings of the PAQS Congress 2022, 12th 13th September 2022, Singapore Institute of Surveyors and Valuers, Singapore con temperature do not need to be set to low and they think low temperature is not conducive and will jeopardise the self efficacy and productivity. For the group had GSE score lower than the average score, all of them do not think specific factors related to working environment are important for them to improve their efficacy. Rather they rank some other factors like co workers’ attitude, company atmosphere and comfort as the important factors to affect their Theefficacy.major
7 References Schwarzer, R., Jerusalem, M. (1995). Generalized Self Efficacy scale. In J. Weinman, S. Wright, & M. Johnston, Measures in health psychology: A user’s portfolio. Causal and control beliefs (pp. 35 37). Windsor, UK: NFER NELSON. Prihadi, K. D., Lim, E S.Z., Chan, K. C., Lee, S. M.H., Ridwan, A. 2021, Efficacy of working from home among urban professionals in Malaysia during the pandemic: The robust predictive role of mattering International Journal of Public Health Science (IJPHS) Vol. 10, No. 1, March 2021, pp. 215~220 _role_of_matteringamong_urban_professionals_in_Malaysia_during_the_pandemic_The_robust_predictivehttps://www.researchgate.net/publication/349890197_Efficacy_of_working_from_home_ Lange, M and Kayser, I. 2022 The Role of Self Efficacy, Work Related Autonomy and Work Family Conflict on Employee’s Stress Level during Home Based Remote Work in Germany Int. J. Environ. Res. Public Health 2022, 19(9) https://www.mdpi.com/1660Guetterman,4601/19/9/4955/htmT.C.,&
129 Proceedings of the PAQS Congress 2022, 12th 13th September 2022, Singapore Institute of Surveyors and Valuers, Singapore 8 Appendix

130
Rider Levett Bucknall, Singapore Rachel Wong Chyn Lin, rachel.wong@sg.rlb.com
Rider Levett Bucknall, Singapore Chan Lei Onn, lo.chan@sg.rlb.com
Rider Levett Bucknall, Singapore Chew Jin Jeak, diana.chew@sg.rlb.com
Proceedings of the PAQS Congress 2022, 12th 13th September 2022, Singapore Institute of Surveyors and Valuers, Singapore Effects of Disruption on Construction Materials
Rider Levett Bucknall, Singapore Chin Wei Sun, ws.chin@sg.rlb.com
Rider Levett Bucknall, Singapore
Abstract
Stanley Chang Hon Wah, stanley.chang@sg.rlb.com
The construction industry plays a crucial role in supporting Singapore’s economy and its growth. However, from the onset of 2020, this industry was crippled by the impact of COVID 19. From labour crunch to supply chain disruptions, the industry struggled to keep up with the rapid changes caused by COVID 19 which resulted in lengthy delays on projects and new developments were put on hold or scrapped. Information gathered through the published articles, show that COVID 19 has disrupted major supply chains, transportation (logistic), laboursupplyand otherrelatedissues aroundtheglobe.This has ledtotheshortageofimported constructionmaterials andforeign labourin thelocal manufacturingandconstruction, resulting in delays on new developments. The aim of this paper is to explore the impacts of construction materials shortage in Singapore’s construction industry caused by the COVID 19 pandemic. A COVID 19 TemporaryMeasure Act 2020(COTMA)was introducedbyBuilding Construction Authority (BCA) to the construction industry in June 2020 which reliefs the contract parties through the extension of project timeline, co sharing of qualifying cost and foreign manpower cost. With the aid of COTMA and the improvement of the COVID 19 situation around the world, the supply chain of construction material is gradually recovering. However, contractual parties in a construction project will still need to find ways to manage the project’s budget as material cost continue to fluctuate. Planning with Building Information Modeling (BIM) and Design for Manufacturing and Assembly (DfMA) can be adopted to mitigate material costs increase.Theroadtorecoveryfortheindustryremainsalonganddifficultone,industryplayers will be required to place effort and emphasis on addressing the new obstacles and challenges that come in order to remain resilient.
Keywords cost, cotma, disruption, escalation, materials
Additionally, this paper will focus on studying on how to better manage or optimise construction materials to minimize the overall project costs by the following ideas:
2.1 Impact of COVID-19 on the Construction industry
COVID 19 has affected many industries in the world to which the construction industry was not exempted as the construction industry can be greatly influenced by the economic cycles.
One of the reasons why the construction industry was affected is due to the increase in prices of building materials (GEP, 2020).
With the focus of the impact of COVID 19 on Singapore’s Construction Industry, it can be observed from Singapore’s Gross Domestic Product decreasing from 3.7 (2019) to 2.7 (2020) (New Zealand Foreign Affairs & Trades, 2021) and the construction industry’s contribution to the Singaporean GDP has greatly reduced from S$18.09B to S$11.5B which was an approximate 57.3% (Figure 1).
According to Zhu (2022), it was reported that the high costs of building materials will continue for the rest of 2022 and as the Linesight director quoted, it is possible that the construction costs will only stabilize in 2023. A method of quantifying the effects of COVID 19 towards the construction industry would be through the study of Tender Price Index (TPI).
2 Literature Review
1. Planning with Building Information Modeling (BIM)
This paper will be focused on the construction industry in Singapore; studying the recent TPI trends and construction material price fluctuations for concrete and steel.
2. Design for Manufacturing and Assembly (DfMA)
Today, as the world slowly recovers from the effects of the pandemic, the construction industry is still plagued with challenges caused by the rising construction cost. The project costs may be directly affected by (but not limited to) the increased building material costs and also the delays caused by the current logistical situation, which, in effect, affects the project timeline and the requirement of implementing Extension of Time and Liquidated Damages.
131 Proceedings of the PAQS Congress 2022, 12th 13th September 2022, Singapore Institute of Surveyors and Valuers, Singapore 1 Introduction
Since 2019, the global pandemic, COVID 19, has greatly disrupted the world economy, affecting many industries including the construction industry. Many construction projects are facing disruptions to their project timeline caused by supply chain disruption, increasing costs and uncertainty in the global economy.
132 Proceedings of the PAQS Congress 2022, 12th 13th September 2022, Singapore Institute of Surveyors and Valuers, Singapore
TPI evaluate the changes in tender prices with consideration to most of the components (Goh, 2005). This typically includes the cost for producing the output of construction activities (Goh, 2005). TPI also helps clients and tenderers evaluate how the building tender prices are changing. Additionally, it is important to note that TPI can help the industry to determine the level of individual tenders, time adjustments, pricing, cost planning, predicting cost trends and general comparisons (Kissi, 2016). According to Table 1, there are indications of several factors which will affect the tender price index:
Table 1 Factors Influencing Tender Prices of Construction Works (Kissi, 2016)

Figure 1 Chart of Gross domestic product (GDP) of the construction industry of Singapore from 2012 to 2021(in billion Singapore dollars) (Hirschmann, 2022)
2.2 Tender Price Index (TPI)

Thisstudywillfurtherfocusontwomajorconstructionmaterial[concrete &steel(Lucia,2022; Kumar, 2022; Krishna, 2022)] prices and their fluctuations between the year 2019 to 2021 but excluding the year 2022 which has been further affected by war in Ukraine
Below is a general introduction to PPI and observation to building materials and supplies PPI from Oct 2019 Dec 2021 before focusing on the fluctuation in prices for steel and through the Producer Price Index for concrete.
2.3 Construction Materials: Concrete & Steel
It can be observed that TPI is affected by many factors apart from material costs. Macegroup (2021) recognizes that the recent TPIs had significant changes due to the increase in material prices and labour costs. Furthermore, the Ukraine Russia War also negatively influences the tender price index in the construction sectors as energy prices soar leading to an increase in the cost of material fabrication (Joanna, 2022).
2.4 Producer Price Index (PPI)

Figure 2 Producer Price Index (Wallstreeetmojo Editorial Team, 2022)
Refer to the Chart (Figure 3) below for information regarding the fluctuation of PPI for Building Materials and Supplies.
133
Proceedings of the PAQS Congress 2022, 12th 13th September 2022, Singapore Institute of Surveyors and Valuers, Singapore
The PPI can be used to measure the rate of changes in product costs sold by producer over a period (Wallstreeetmojo Editorial Team, 2022).
A method to which specific material price fluctuations can be observed would be through their producer price index, which will be investigated in the next section.
134 Proceedings of the PAQS Congress 2022, 12th 13th September 2022, Singapore Institute of Surveyors and Valuers, Singapore
2.4.1
Figure 4 Graph of Steel Rebar Average Price (2018 2022) (Investing.com, 2022)
Figure 3 Chart of Producer Price Index by Industry: Building Material and Supplies (Oct 2019 Dec 2021) (Fred Economic Data, 2022)
According to the chart (Figure 5) below, in October 2019 (pre pandemic impact), the PPI for Building Materials and Supplies was only 136.300. In December 2021, it was shown that the PPI has increased to 161.966. In 2 years, the PPI has increased by approximately 18.83%.

In October 2019 (pre pandemic impact), the PPI for Building Materials and Supplies was only 152.400. In December 2021, it was shown that the PPI has increased to 199.890. In 2 years, the PPI has increased by approximately 31.16%.
According to the chart (Figure 4) below, the price for Steel Rebar in October 2019 was USD$440.57 and USD$697.81 in December 2021. Based on this information, it can be observed that there was an increase of approximately 58.39% in price.

2.4.2 Building Materials: Concrete
Building Materials: Steel
2.5.1 Planning with Building Information Modeling (BIM)
BIM can be used to track progress accurately and monitor the financial performance of the project (Moura, no date; Ireland, 2020). Estimated costs are more accurate and allow better planning in management of orders and supply chains (Moura, no date; The Architecture Designs, 2021). Refer to the below tables (Table 2 4) for the savings that BIM can provide in project duration and concurrently project costs.
2.5 Methods to Better Optimize and Management Project Costs:
135 Proceedings of the PAQS Congress 2022, 12th 13th September 2022, Singapore Institute of Surveyors and Valuers, Singapore
Figure 5 Chart of PPI by Industry: Concrete Contractors, Nonresidential Building Work (Oct 2019 Dec 2021) (Fred Economic Data, 2022)

BIM is a collaborative process that allows all parties of a construction team to be able to plan, design and construct a building or structure based on one platform (Lorek, 2022; The Architecture Designs, 2021). Information stored within BIM is actionable which can be useful in improving accuracy, expressing design intent and most importantly (with the context of cost management), reduce change orders and field coordination problems (Lorek, 2022).
Table 2 The difference in project life cycle time in conventional and BIM methods (Moh et.al, 2020)

136 Proceedings of the PAQS Congress 2022, 12th 13th September 2022, Singapore Institute of Surveyors and Valuers, Singapore
Table 3 Costs of conventional methods workers (Moh et.al, 2020)

2.5.2 Design for Manufacturing and Assembly (DfMA)
DfMA is a construction methodology that is aimed to increase construction productivity by taking a holistic approach to a project focusing on prefabricating components (BuildTech Asia, This2021).method is adopted with the objective to lower costs (BuildTech Asia, 2021; Tan 2021), making assembly easier (BuildTech Asia, 2021), reducing labour requirement (BuildTech Asia, 2021), improved workmanship (BCA, no date; Leong, 2020) and reducing construction periods (BCA, no date; Tan 2021; Leong, 2020).
The Singaporean government has recently encouraged the adoption of this methodology in 2020, with the focus of achieving 70% adoption rate in the Built Environment by 2025 (Buildtech Asia, 2021; Sweet 2020). The Singapore government has invested S$120M into Singapore’s Public Sector Construction Productivity Fund (PSCPF) to promote DfMA techniques (Sweet, 2020; Leong, 2020). Thereafter, it was confirmed in 2021 that the
Table 4 Costs of BIM methods workers (Moh et.al, 2020)

The table above is an extract of TPI Compilation by SISV exclusive of unpredictive costs such as thefollowingfrom eachindividualfirm/group. Theconsiderations taken to compilethis data are as follows:
Proceedings of the PAQS Congress 2022, 12th 13th September 2022, Singapore Institute of Surveyors and Valuers, Singapore
Among the technologies that are in line with DfMA are the following:
e) Prefabricated Mechanical Electrical and Plumbing (MEP) System (BCA, no date); and
f) Structural Steel (BCA, no date).
3
d) Prefabricated Bathroom Units (BCA, no date);
b) Mass Engineered Timber (Buildtech Asia, 2021);
137
c) Prefabricated Prefinished Volumetric Construction (Buildtech Asia, 2021);
a) Advanced Precast Concrete System (Buildtech Asia, 2021);
Singaporean Built Environment has been steadily adopting this methodology, keeping on track to achieve the goal of 70% in 2025 (Buildtech Asia, 2021).
Currently, no information has been published that directly discuss the savings DfMA is able to provide in the Singaporean Construction Industry. Findings 3.1 Singapore TPI Figure 6 Construction Tender Price Index Compilation

Based on aS$100M project, thecosts belowareindicativeoftheaveragefluctuation ofaverage concrete and steel prices from Oct Dec 2019 to Dec 2021. Table 5 Average Fluctuation of concrete and steel prices Oct Dec 2019 = 100% Years/Months Jan-Mar Apr-Jun Jul-Sept Oct-Dec Jan-Mar Apr-Jun Jul-Sept Oct-Dec (%) 0.00 0.00 (%) -0.22 -0.30 -0.30 -0.41 -0.71 -0.50 -0.53 4.71 (%) 0.00 2.65 9.86 10.00 27.63 45.72 53.74 54.23 Concrete Steel
138 Proceedings of the PAQS Congress 2022, 12th 13th September 2022, Singapore Institute of Surveyors and Valuers, Singapore
Arcadis : Excludes piling, substructure works and external works. It is based on private sector projects handled by the company.
LandedPrivateResidentialAECOMNon
: Excludes any price for piling and mechanical and electrical services. This TPI commences from Year 2007 and reflects the movement of Main Contract prices in tenders on selected AECOM's residential projects for the respective period.
RLB : Excludes piling and mechanical and electrical services. It is compiled based on tender returns on projects handled by the company.
Considerations:
BCA : Excludes piling, substructure works, external works and mechanical and electrical services. For building works which include public residential, private non landed residential and commercial office. HDB : Includes building works, piling, external works and mechanical and electrical services. It is compiled based on the tender prices received for HDB’s construction works. The index reflects the price movements in construction materials, equipment, manpower and elements of competition, risk and profit allowance by contractors. The index excludes project specific design features and provisions in order to achieve a like to like comparison across different quarters and reflects movement of tender prices due to external factors.
FluctuationPrice2019
3.2 CONCRETE & STEEL PRICE FLUCTUATIONS
FluctuationPrice2020
FluctuationPrice2021
Based on the chart and table above, it can be observed that there was an increase of average TPI of 19% from 2019 to 2021 and 7% from 2021 to 1Q 2022. However, it is important to note that the increase from 2021 to 2022 may not be indicative of the effects solely caused by the pandemic as the Ukraine War has also affected construction material costs. However, as discussed before, TPI cannot reflect completely the increase in construction material costs as it considers other items indicated in Table 1. Therefore, key materials such as concrete and steel need to be further investigated in the next section.
Based on the case study above the percentage increase of 17.6% is consistent with the TPI increase of an average 19% from 2019 to 2021 as shown in the findings in section 3.1. The difference of 1.4% could be attributed to other factors such as the ordinary inflation of other building materials not studied in the example above.
Level1 Level2 Level3 Level4 Amount(S$) 10,000,000.00$ 12,600,000.00$ Concrete (9%) 1,323,000.00$ Reinforcement(36%) 5,292,000.00$ Formwork (15%) 2,205,000.00$ StructuralSteel(40%) 5,880,000.00$ 14,700,000.00$ 14,400,000.00$ 10,080,000.00$ 23,520,000.00$ 100,000,000.00$ Material(70%) LabourMaterial(30%)(70%)Mechanical& Electrical(48%) TOTAL Copper(30%) Othermaterials(70%) Structural(50%)BuildersWork (42%) Labour(30%) Preliminaries(10%) Architectural(50%)
139
Proceedings of the PAQS Congress 2022, 12th 13th September 2022, Singapore Institute of Surveyors and Valuers, Singapore
Based on the findings, there were price increases on the following components from the 2019 to 2021. The table below outlines the price increases of the various elements and its impact on the case study.
In both building materials, it can be observed that there was a slight decrease in material prices during the peak of the pandemic in 2020 when most of the world has entered a lockdown. However, it can be seen in 2021, there was a sharp increase in prices over a short period It was indicative that there has been a price increase of approximately 10% for concrete and 54.23% for steel in the past 2 years from pre pandemic prices.
Applying the above findings to a case study of a standard construction project, with the assumption that the project value is S$100 million.
Based on information found, the price increase for concrete (18.83%) is higher than RLB’s findings (10%). However, steel rebar information was found to be 58.39% which is close to RLB’s findings of 54.23%.
3.3 CASE STUDY
Table 6 Cost distribution of a construction project
Builders Work Mechanical&Electrical TOTAL
140 Proceedings of the PAQS Congress 2022, 12th 13th September 2022, Singapore Institute of Surveyors and Valuers, Singapore 7 Element price increase
Notwithstanding that there is a continual increase on the construction material prices, it will be very injudicious to cease all construction activities until the prices have been stabilised as it will be detrimental for the GDP for all countries and the global economies will be disrupted Infurther.view of the above it is sensible to explore some potential ways to help in cost savings and expedite construction progress. BIM can be a possible measure to help in cost saving of around 2% 5% yet construction progress can be accelerated. DfMA can be another method to help expediting the construction activities so that the project can start to generate income as soon as the construction is completed. Referring to the case study in section 3.3, the use of BIM can shorten the project duration by approximately 20% which translates to approximately S$2,000,000.00 savings in preliminaries cost. The use of DfMA can also shorten the project duration by about 10% which can result in savings of approximately S$1,000,000.00.
4
Table
Description Price increase (%) Additionalcost(S$) Percentage increase over totalprojectvalue (%) Labour 30% 3,780,000.00$ 3.8% Concrete 10% $ 132,300.00 0.1% Reinforcement 54% $ 2,857,680.00 2.9% Labour 30% 4,320,000.00$ 4.3% Copper 65% $ 6,552,000.00 6.6% $ 17,641,980.00 17.6%
Conclusion In conclusion, it is rather unlikely that the material prices have reached their peak, nor will they stabilise or drop for at least another two to three years. Not forgetting that the World is facing more uncertainty today than ever before. We are not only dealing with the ongoing pandemic but there are more complex issues i.e. Ukraine War and Taiwan China conflict which will continue to shake the globe. It can be demonstrated from Figure 6: Construction Tender Price Index Compilation that there is a rise of 7% even for a short period from 2021 to 1Q 2022.
Despite the fact that the world is struggling with inflation and material fluctuation, the demand for properties, ie residential and office, is still growing strong as people are looking for such spacestoaccommodatetheneedsofworkingfrom home(WFH)whilebusinessesareexploring reducing office spaces in the CBD area to make ways for more foreign investors but to create hubselsewheretobetterconnectwithemployees.PPVCcanbeanotherpossiblemethod,which is proven to be a success in countries or regions such as Singapore and Hong Kong Special Administrative Region where they can rely on places nearby, ie Malaysia and Mainland China to fabricate materials offsite and to ship to the end points. With that the labour cost can be reduced and help to achieve cost savings of 3% 5% for the overall construction costs.
GEP (2020). The Impact of COVID 19 on Building Materials | GEP. [online] Available at: https://www.gep.com/blog/strategy/the impact of covid 19 on building materials.
Fathi, M. and Jamil, A. (2016). The integration of lean construction and sustainable construction: A Stakeholder perspective in analyzing sustainable lean construction strategies in Malaysia. Procedia Computer Science, 100, pp.634 643.
141 Proceedings of the PAQS Congress 2022, 12th 13th September 2022, Singapore Institute of Surveyors and Valuers, Singapore 5 References BCA. n.d. Design for Manufacturing and Assembly (DfMA). [online] Available at: <https://www1.bca.gov.sg/buildsg/productivity/design for manufacturing and assembly dfma> [Accessed 12 August 2022].
Goh, B.H., (2005). The dynamic effects of the Asian financial crisis on construction demand and tender price levels in Singapore. Building and Environment, 40(2), pp.267 276. Investing.com. 2022. Steel Rebar Futures Historical Prices Investing.com. [online] Available at: <https://www.investing.com/commodities/steel rebar historical data> [Accessed 15 August 2022]. Ireland, R. (2020). BIM and existing buildings. [online] RICS. Available at: https://ww3.rics.org/uk/en/journals/built environment journal/bim and existing buildings.html [Accessed 18 Jul. 2022].
Fred Economic Data. 2022. Producer Price Index by Industry: Building Material and Supplies Dealers. [online] Available at: <https://fred.stlouisfed.org/series/PCU44414441> [Accessed 15 August 2022].
Construction News (2022). Price inflation: how clients and contractors can work together. [online] Construction News. Available at: https://www.constructionnews.co.uk/agenda/opinion/price inflation how clients and contractors can work together 14 07 2022/ Divya, D. (2021). What are the barriers to BIM implementation? [online] BIM Services. Available at: https://www.bimservicesindia.com/blog/what are the barriers to bim implementation/ [Accessed 14 Jul. 2022].
BuildTech Asia. 2021. Singapore Government Makes a Big Push Towards DfMA BuildTech Asia. [online] Available at: <https://buildtechasia.com/singapore government makes a big-push-towards-dfma/> [Accessed 12 August 2022].
Escilowski, J. (2021). Escalating construction costs not likely to slow. [online] Beca. Available at: https://www.beca.com/ignite your thinking/ignite your thinking/october 2021/escalating construction costs not likely to slow [Accessed 15 Jul. 2022].
Blundell, S. (2019). World’s tallest modular tower complete in Singapore. [online] Planning, BIM & Construction Today. Available at: https://www.pbctoday.co.uk/news/mmc news/clement canopy/60142/ [Accessed 26 Jul. 2022].
Fred Economic Data. 2022. Producer Price Index by Industry: Concrete Contractors, Nonresidential Building Work. [online] Available at: <https://fred.stlouisfed.org/series/PCU23811X23811X> [Accessed 15 August 2022].
142 Proceedings of the PAQS Congress 2022, 12th 13th September 2022, Singapore Institute of Surveyors and Valuers, Singapore Joanna (2022). The Russia-Ukraine Conflict’s Effect on Singapore’s Construction Sectors. [online] Available at: https://www.renotalk.com/article/russia ukraine effect singapore Sweet,NurNewM.S,Moura.Macegroup.com.Lucia,Lorek,Leong,Kumar,Krishna,Kissi,scalates%2Csectors#:~:text=As%20the%20conflict%20between%20Ukraine%20and%20Russia%20econstructionE.ed.,(2016).AConceptualFrameworkTowardstheDevelopmentofTenderPriceIndex.40.2022.14ImportantBuildingMaterialsusedinconstruction.[online]CIVILREAD.Availableat:<https://civilread.com/buildingmaterials/>[Accessed15August2022].E.,2022.MaterialsUsedInConstructionListOf72BasicItems.[online]ProCivilEngineer.com.Availableat:<https://procivilengineer.com/materialsusedinconstruction/>[Accessed15August2022].G.,2020.Parliament:Constructionsectortodigitalisebuildingprocessestoboostproductivity.[online]TheStraitsTimes.Availableat:<https://www.straitstimes.com/politics/parliamentconstructionsectortodigitalisebuildingprocessestoboostproductivity>[Accessed10August2022].S.(2019).WhatisBIM(BuildingInformationModeling).[online]Trimble.com.Availableat:https://constructible.trimble.com/constructionindustry/whatisbimbuildinginformationmodeling.Z.(2022)PopularMaterialsUsedinConstruction-ConstructionResourcesBlog.[ONLINE]Availableat:https://constructionresourcesblog.com/popularmaterialsusedinconstruction/.[Accessed15August2022].(2021).Materialpriceinflationdrivestenderforecastincrease.[online]Availableat:https://macegroup.com/perspectives/210620marketviewq22021.(n.d.).7ReasonstoUseBIMonYourFutureConstructionProjects.[online]Availableat:https://resources.hexagonppm.com/articlesblogs/7reasonstousebimonyourfutureconstructionprojects[Accessed26Jul.2022].KandM.P,D(2021).WasteMinimisationinIndianConstructionSectorbyApplyingLeanConstructionPrinciples.InternationalJournalonDesignandManufacturingTechnologies,8(2),pp.1014ZealandForeignAffairs&Trade(2021).[online]Availableat:https://www.mfat.govt.nz/assets/TradeGeneral/TradeMarketreports/SingaporesConstructionIndustryAugust2021.pdf.Sholeh,M.,Fauziyah,S.andRadianKhasani,R.,2020.EffectofBuildingInformationModeling(BIM)onreducedconstructiontimecosts:acasestudy.E3SWebofConferences,202,p.02012.R.,2020.Singaporetospend$139mpromotingmodularanddigitalconstructionGlobalConstructionReview.[online]GlobalConstructionReview.Availableat:<https://www.globalconstructionreview.com/singapore-spend-139m-promoting-modular-anddigital/>[Accessed12August2022].
Proceedings of the PAQS Congress 2022, 12th 13th September 2022, Singapore Institute of Surveyors and Valuers, Singapore Tan, S., 2021. How DfMA changes the building game. [online] RSP. Available at: <https://rsp.sg/perspective/how dfma changes the building game/> [Accessed 10 August The2022].Architecture Designs. (2021). The Benefits of and Barriers to BIM Adoption: A Detailed Study. [online] Available at: https://thearchitecturedesigns.com/benefits of and barriers to bim adoption/ [Accessed 20 Jul. 2022].
Wallstreetmojo Editorial Team, 2022. Producer Price Index. [online] WallStreetMojo. Available at: <https://www.wallstreetmojo.com/producer price index/> [Accessed 15 August 2022].
143
Keywords building cost, exchange rates, purchasing power parity, quantity surveying
1 Introduction Globalisation, according to The Council of Europe (2022), describes a variety of economic, cultural, social, and political changes that have shaped the world over the past 50 odd years. It is theever closingeconomicintegrationofall countries oftheworld resultingfrom theincrease in volume as well as variety of international trade in goods and services, the cheaper cost of transport, the growing of international capital, the growth in the global labour force and the acceleration in the use of technology.
Construction Cost Comparison Across Borders: The role of Purchasing Power Parity
Abstract
144 Proceedings of the PAQS Congress 2022, 12th 13th September 2022, Singapore Institute of Surveyors and Valuers, Singapore
With the onset of globalization, countries’ borders have blurred, and it has been found that companies investing in propertystartedto look at suitablemarkets abroad.Oneof theproblems in this regard is the comparison of building cost in different countries, for example a UK company wanting to invest in South Africa. The purpose of the paper will therefore be to investigate the different factors that play a role in the comparison of construction cost of different buildings, such as building methods, fluctuating exchange rates, regional factors, etc. Data collection methods was to source the construction cost of high rise buildings in different countriesfrominternationalpublicationsbyreputablecompaniessuchasTurnerandTownsend and Rider Levett Bucknall (RLB) who regularly publishes the cost of different building types across the world. Also, a 19 storey building is priced quarterly by three South African quantity surveying firms in different areas of the country. The average cost of this building was compared to that of similar buildings in Australia using average exchange rates (ZAR vs. AUD), as well as applying Purchasing Power Parity (PPP) factors. The main findings are that it is very difficult to make a direct comparison of the construction cost between different countries because such comparisons result in vast cost differences. If, however PPP factors are introduced, it results in a more realistic comparison. The paper’s contribution to practice is that the introduction of PPP conversion factors to the quantity surveying fraternity in South Africa can lead to more accurate estimates of building costs for overseas clients. It is therefore recommended that the value of using PPP factors be conveyed to practicing quantity surveyors as well as to quantity surveying students.
Discussion
Hoffie Cruywagen, hoffie.cruywagen@up.ac.za Department of Construction Economics, University of Pretoria, South Africa
As a result of globalisation, companies investing in the property market have also started to look at suitable markets abroad. 2 of the problem
145 Proceedings of the PAQS Congress 2022, 12th 13th September 2022, Singapore Institute of Surveyors and Valuers, Singapore
3 Delimitations
Furthermore, foreigners can purchase property (mostly residential) in South Africa with some limits, with most of these investments taking place either in the Western Cape and Gauteng provinces. Various real estate brokers and companies assisting with the transfer of money from overseas countries to South Africa, has websites advertising their services.
Considering globalisation as discussed above, the question is whether the South African property industry will also be able to attract overseas investors. According to Gordon (no date) there is little that is “global” about the world of international real estate. Gordon (no date) motivates this statement by indicating that when it come to the number of countries involved in cross border real estate, it comes mostly from eight to ten countries, and is directed towards 20 to 25 countries.
Another delimitation is that the case study will only be one type of building compared with a similar building in Australia.
Statements are made on these websites such as “With the strength of the Rand (South African currency; ZAR) waning against global currencies, buyers from abroad will certainly make a sound investment” (The Agency Group, 2021). Another quote states that “The exchange rate is highly favourable for foreign investors” (Domisa Treasury, 2021).
Oneofthecrucialaspects whenlookingatpropertyinvestment,isthecostofbuildings.Briefly, especially when looking at the local currency (ZAR) against other currencies such as the USD, GBP, AUD etc. it seems that it will be “cheap” to construct properties. At the time of drafting this paper, the ZAR traded at R17.21 against the USD, R11.83 against the AUD and R20.57 against the GBP (exchangerates.org.uk, 2022), confirming the notion of South Africa as being “cheap”.
The paper will only look at the difference in building cost between countries and no other factors that may have an influence on investment decisions by other countries will be looked at. Such issues maybethestability ofthelocal government, corruption,procurementstrategies, statutes, municipal regulations, etc.
Even if South Africa is not one of these main players, it remains, despite structural changes, a destination conduciveto investment. TheUS Department ofState(2021)mentionin this regard that South Africa is a comparatively low risk location in Africa, which is the fastest growing consumer market in the world. The US Department of State (2021) also states that Google (US) invested approximately USD 140 million and Pepsico over USD 1 billion in South Africa in 2020. Another US company, Ford, announced a USD 1 billion investment, including the expansion of its Gauteng manufacturing plant in January 2021. Although not all of the above investments will be in property, it is safe to assume that a large part of the money will be used for acquiring and building various types of property.
This paper will look at the varied factors that play a role in the comparison of construction cost in South Africa compared to those of other countries.
146 Proceedings of the PAQS Congress 2022, 12th 13th September 2022, Singapore Institute of Surveyors and Valuers, Singapore 4 Literature review
Figure 1. USD/ZAR 365 day history: July 2021 to July 2022 (Exchangerates.org.uk)

One of the reasons for this is that exchange rates often fluctuate in the short term. Best (2010) quotes Koskela et al. (2002) who indicate that exchange rates are only relevant to tradeable goods and services, whereas construction projects are very seldom tradeable in the usual sense, as such projects remain fixed in the location where they are constructed.
4.2 Difference in the measurement of floor areas of buildings
Whenthecostofbuildingsisdetermined,theindustrymustrelyuponaproject’sratepersquare meter/foot as the necessary figure to compare value. According to Trabucco and Miranda
The literature review will cover aspects that may have an influence on the calculation of building cost.
Vermande and van Mulligan (1999) suggest that “exchange rates do not indicate the comparative value of currencies in the production of goods and services”.
Figure 1 shows the fluctuation of the USD against the ZAR over the period July 2021 to July 2022 to illustrate the volatility of the exchange rate.
4.1 Exchange rates When comparing costs of buildings between different countries, it must be expressed in the same currency before any comparison can be made. The easiest way to, for example, convert building cost expressed in ZAR to AUD, would be to use the annual average exchange rate between the two countries. The literature, however, indicate that exchange rates are unsuitable for converting the cost or value of construction in different countries to a common base.
Trabucco and Miranda (2019) mention that when measuring floor area, the practices and regulations of the local governing bodies are being relied upon. They give an example of the problem that this can present when a North American building has an Asian developer and a European architect a scenario which is becoming increasingly common.
• Labour: availability and quality of labour, unemployment rate, labour unions, labour turnover and motivation of workers may change in different regions.
Furthermore, when comparing cost per m2 between two properties, such differences can have major impacts on the comparative analysis of properties. Such a difference in numbers may be attributed to local market regulations and not the actual value of space.
4.3
The cost of similar buildings in the same country can differ due to a range of factors, such as the following (Parameswaran et al. 2019):
• Siteconditions:thiscanbeduetopoorgroundbearinglimitneedingeitherpilingand/or deep excavations and imported filling • Availability of building material: if a building project is situated in a rural area and far away from suppliers of material, the higher transportation cost associated with longer distances can push up the cost
• Weather: normally building cost in coastal areas are costlier than in inland areas due to the need to construct, among others, cavity walls,
Smith (2015) states that the lack of global standards inhibits the development and identity of the project cost management profession and sites as an example that there is no common way of expressing cost per square meter, both in terms of the cost definition and the floor area.
147 Proceedings of the PAQS Congress 2022, 12th 13th September 2022, Singapore Institute of Surveyors and Valuers, Singapore (2019) these calculations rely upon the fact that the primary figure in any analysis is based on a precise, unbiased, and unambiguous measurement. This, unfortunately, is not possible because most countries have their own unique method for measuring property areas.
4.4 Building methods
Building methods differ from country to country for several reasons. According to Sawhney et al. (2004) there can be significant regional differences between construction materials and methods as well as between the acceptable level of finishes and tolerances of the product. An example is given by Sawhney et al. (2004) of residential construction in North America where lumber (or timber) is the prime structural component, but less frequently used in other parts of the Thisworld.isnot only true for the structure of buildings, because it is only one part of the comparison.
The cost of heating, ventilation and air conditioning equipment is just as important; not only the comparative cost of the equipment, but also whether such equipment is needed. Air conditioning units would, for instance, always be installed in buildings in countries with a warm climate but would be irrelevant in cold regions.
Regional factors
Trabucco and Miranda (2019) quote Jones Lang LaSalle’s study where it was calculated that the deviations in floor area measurements can vary up to 24%, depending on the location.
5 Literature review: Purchasing Power Parities
When looking to compare local construction cost with those of other countries, the easiest way is to look for cost data from published sources. Cost consultants who regularly publish such information are Turner and Townsend, Rider Levett Bucknall (RLB), AECOM, Rawlinsons, EC Harris (now part of the Arcadis Group) and the like.
The International Comparison Program (ICP) according to the World Bank (2015) is a worldwide statistical initiative led by the World Bank under the auspices of the United Nations Statistical Commission. Meikle (2011) states that the ICP is responsible for the production of Purchasing Power Parities (PPP) for both national GDP and for sub components of GDP. PPPs are alternatives to market exchange rates and are intended to reflect differences in price levels across countries more accurately (Meikle, 2011).
Eurostat (2012) indicates that PPPs are there to serve both as currency converters as well as spatial price deflectors. They convert different currencies to a common currency and, in this process, equalisethe currency’spurchasing power byeliminatingthe differences in pricelevels between the countries. In their simplest form according to Eurostat (2012), PPPs are nothing more than price relatives that show the ratio of the prices in currencies, of the same goods or services, in different countries. Eurostat (2012) gives the following example to illustrate this: if the prices of a litre of Coca Cola is 2.30 euros in France, and 2.00 dollars in the USA, then the PPP for Coca Cola between France and the USA is the ratio 2.30 euros to 2.00 dollars, or 1.15 euros to the dollar. This means that for each dollar spent on Coca Cola in the USA, 1.15 euros would have to be spent in France to obtain the same volume of Coca Cola, PPPs are widely used to convert national account data, such as GDP, into a common currency, while also eliminating the effect of price level differences between countries (World Bank, 2015). Construction is a significant component of the overall GDP level PPPs produced by the World Bank as part of the ICP (Best, 2012). Best (2012) further states that if PPPs are used to convert construction cost to a common base, then cost is really measured in what can be called “construction dollars” where one such dollar buys a similar amount of construction in each country.
Best (2010) indicates that the idea behind PPPs can be traced as far back as the 16th century and is based on the simple proposition that “The price of a good or service, once prices are converted to a common currency, should cost the same in different countries”. This, according to Pakko and Pollard (1996) quoted by Best (2010), is the so called “Law of One Price”.
Best (2012) states that typically such costs are published as a promotional exercise rather than a rigorous comparison, usually with disclaimers. A typical disclaimer, as quoted by Best (2012), will read as follows: “Costs given are average prises for typical buildings; they provide no more than a rough guide to the probable cost”. This issue will be discussed in more detail later in the paper when actual cost comparisons are done.
148 Proceedings of the PAQS Congress 2022, 12th 13th September 2022, Singapore Institute of Surveyors and Valuers, Singapore 4.5 Information sources
Table 2. Converting currency using PPPs In order to verify the rates for South Africa, especially because only two sources could be found, a standard building has been costed in both South Africa and Australia. The quantities
As stated before, the aim of the paper is to compare the construction cost of a multi storey residential building between South Africa and Australia. Firstly, published information was consulted to obtain the average rates per m2 of such buildings in the two countries. A total of four publications could be found that published rates per m2 for residential buildings in Australia. These sources did not all published exactly the same information; one source published rates for 7 cities across Australia, one source published rates for three cities and one source published rates for three regions. All these rates were in Australian Dollar per square meter. The last source published average rates for two Australian cities, but in US Dollars per m2. For this paper, the average rate per m2 for all the above buildings was calculated.
(incostAustralian/m2AUD) (incostAustralian/m2USD) (incostAfricanSouth/m2ZAR) (incostAfricanSouth/m2USD) cost)Australian(RSADifferencecostvs buildingResidential 3,663 2,544 14,043 1,959 + 23%
The average rates per m2 in the local currencieswere converted to a rate per m2 in USD in order to compare the rates after using applicable exchange rates and PPP conversion indicators (the PPP conversion indicators published by the OECD are measured in terms of the national currencies per USD). In all instances, figures were used relevant to the 4th quarter of 2021.
(incostAustralian/m2AUD) (incostAustralian/m2USD) (incostAfricanSouth/m2ZAR) (incostAfricanSouth/m2USD) cost)Australian(RSADifferencecostvs
149 Proceedings of the PAQS Congress 2022, 12th 13th September 2022, Singapore Institute of Surveyors and Valuers, Singapore 6 Methodology
7 Findings and discussion
Table 1 shows AUD converted to USD by using an exchange rate of 1.38, while for South Africa an exchange rate of 14.86 was used (Exchangerates.org.uk, 2022) From this table it seems, when comparing the results, that the South African cost is much cheaper than that of Australia.
buildingResidential 3,663 2,654 14,043 945 +181%
For South Africa, only two sources could be found that published reliable information. One was a local, annual publication (in South African Rand per m2), while the other was a global publication where rates for South African buildings were given in US Dollars.
Table 1. Converting currency using exchange rates In Table 2, AUD was converted to USD by using a PPP factor of 1.44, while a PPP factor of 7.17 was used for South Africa (source of PPP factors: Eurostat OECD, 2022). The results are much more realistic than those in Table 1, with South Africa now showing to have a building cost rate per m2 that is 23% less than that of Australia.
150
As indicated before, the building items were measured in Australia, and due to differences in building methods as previous discussed, not all items could be priced in South Africa. The major differences stem from the use in the Australian example of steel internal columns with cladding, precast concrete support beams, hollow core plank flooring and steel sheeting as permanent flooring.TheseitemsweresubstitutedforSouthAfricanpurposeswith35to50MPa in situ reinforced concrete columns, beams and floor slabs, due to precast concrete seldom being used as structural elements in South Africa. Cape Town Durban Johannesburg Average Residentialbuilding 377,949,585 393,031,770 395,271,781 388,751,045
If the average cost of the priced building is converted to a rate per m2, it amounts to ZAR 12,058/m2 which is lower than the published rates in Tables 1 and 2. In comparison, the priced rate for the Australian building is also lower, but by a smaller margin. (incostAustralian/m2AUD) USD)/m2nAustraliacost(in (incostAfricanSouth/m2ZAR) (incostAfricanSouth/m2USD) cost)cost(AustralianDifferencevsRSA buildingResidential 3,351 2,328 12, 058 1,681 + 38%
Table 3. Cost of residential building priced in South Africa in ZAR
Proceedings of the PAQS Congress 2022, 12th 13th September 2022, Singapore Institute of Surveyors and Valuers, Singapore for this building were calculated by a well-known quantity surveying firm in Australia and these quantities were priced by quantity surveyors in the offices of the firm in various cities across Australia. The same items were priced in South Africa by the local subsidiary of the Australian firm in Johannesburg, Cape Town and Durban. The building was a 19 storey residential building in Melbourne, with 235 units totalling a gross floor area of 32 241m2 .
Discussion: It is not surprising that South African building costs are cheaper than that of Australia. One of the key aspects for this is the state of the South African economy which, according to Statistics South Africa (2022) has never returned to its initial levels of economic growth before the 2007/2008 global monetary crisis that has led to job losses of about one million. This led to a cut throat tender climate in the construction industry where contractors submit unrealistic tender bids in order merely to survive. This scenario has continued after the Covid 19 pandemic where a large number of projects are still kept on hold. Other contributing factors to South Africa being cheaper than Australia are the low cost of labour, energy and transport compared to that of most other countries.
Table 4. Converting currency of priced building using PPPs
What is surprising is the difference between the published South African construction rates and that of the calculated example. These rates were priced independently by three offices in different areas of the country, based on recently received tenders, and the totals submitted by the three offices were close, ranging from 3% to +2% of the average; mostly due to regional differences between the three cities. It can therefore be assumed that the average rate is Itaccurate.isdifficult to speculate why the published rates are higher, but it may be attributed to a risk factor that was built into the rates due to not having an abundance of information available.
2022. Foreign property investment in South Africa. Online. Domisa.co.za/foreign exchange south africa/foreign property investment in south africa/. Accessed: 22 July 2022
Eurostat,2012.Eurostat OECDmethodologicalmanualonpurchasingpowerparities. Eurostat methodological working and papers. Eurostat, 2022. Eurostat-OECD. Purchasing power parities (PPP): Total, national currency units/US Dollar, 2000 2021. Accessed: 22 July 2022 Exchange Rates,2022. Exchange rate conversiontables.Exchangerates.org.uk/USD AUD 09 10 2021 exchange rate history.html
Gordon, J.L., No date. The expanding world of cross border real estate. Zell/Lurie Real Estate center, Wharton University of Pennsylvania. Meikle, J., 2011. A new approach to international construction price comparison, 5th Technical advisory group meeting, April 18 19. Washington DC.
The aim of the paper was to investigate the role of PPPs when comparing building cost of different countries.
151 Proceedings of the PAQS Congress 2022, 12th 13th September 2022, Singapore Institute of Surveyors and Valuers, Singapore 8 Conclusions
It has been established that although there are various organisations that publish average costs of different building types in different countries, there are a number of factors that play a role in the estimating of such costs. Care should therefore be taken when sourcing rates, and it is advisable to rather use priced rates of actual buildings.
9 References Best,R.,2010.Usingpurchasingpowerparityto assessconstructionproductivity. Australasian Journal of Construction Economics and Building, Volume 10 (4). Best, R., 2012. International comparisons of cost and productivity in construction: A bad example. Australasian Journal of Construction Economics and Building, Volume 12 (3), 82 Domisa88.Treasury,
It is suggested that this topic can further be investigated by using a larger sample of different buildings (e.g. office buildings, shopping centres, etc.), and that the practice where a typical building is priced by quantity surveying firms in different locations of the various countries, also be expanded.
When comparing actual costs of high rise residential buildings in different countries; in this instance Australia and South Africa, it became clear that using exchange rates tend to give skewed results. If, however, PPPs are used to determine and compare the countries’ building rates, a much clearer picture can be obtained.
Although a small sample was used for the calculations, it can be expected that the cost of residential high rise buildings (and probably most other buildings as well) is substantially cheaperin South Africacomparedwith Australia, andtherefore, whenlookingat building costs alone, South Africa seems to be an attractive market for overseas investors.
Trabucco, D. and Miranda, W.D. 2019. Measuring floor areas of buildings: problems of consistency and a solution. Journal of civil engineering and architecture. Volume 13, 107 114. David Publishing Turner & Townsend. 2021. International construction market survey, 2021. www.turnerandtownsend.com. Accessed 20 July 2022 U.S. Department of State. 2022. 2021 Investment climate statements: South Africa. Online: state.gov/reports/2021 investment climate statements/south/Africa/. Accessed: 20 July Vermande,2022
Fundamentals of purchasing power parities. International Comparison Program, Development Economic Data Group, The World Bank. Washington, DC.
Sawhney, A., Walsh, K. D. and Brown, A. 2007. International comparison of costs for the construction sector: towards a conceptual model. Civil Engineering and Environmental Systems. Volume 21 (3). Taylor and Francis Group.
H.M. and van Mulligen, P H. 1999. Construction cost in The Netherlands in an international context. Construction management and Economics. Volume 17 (3). WorldRoutledgeBank.2015.
Smith, P. 2015. Global professional standards for project cost management. Proceedingsofthe 29th World Congress: International Project Management Association (IPMA). 30 September 1 October, Panama, 2015. The Agency property group. 2022. Investing in property in South Africa. Online: theagencygroup.co.za/news/. Accessed: 22 July 2022 The Council of Europe. 2022. Globalization. Online: Accessed: 21 July 2022.
152
Proceedings of the PAQS Congress 2022, 12th 13th September 2022, Singapore Institute of Surveyors and Valuers, Singapore Parameswaran, T., Jayawickrama, T.S., Melagada, D.G. 2019. Analyzing the impact of location factors on building cost in Sri Lanka. ProceedingsoftheInternationalConference on Industrial Engineering and Operations Management, Bangkok, Thailand. March 5 7, Rider2019Levett Bucknall, 2021. Riders Digest: compendium of cost information. RLB.com
153
Keywords
Whereas design and build (D&B) or traditional procurement may suit straightforward new builds with desktop studies or shorter workshops that tend to focus more on cost reduction based on detailed design. This is important for clients, head contractors, or lead consultants who typically drive VM practices. Getting VM strategies wrong risks disengagement when sub consultants(architectsandengineers)feelthattheirdesignischallengedandunclearlength and number of VM workshops creep their costs, or subcontractors feel frustrated when providing alternatives that are not adopted. The cost and time required for VM workshops can also outweigh the benefits achieved. VM has become more crucial as costs escalate and the supply of labour and materials becomes less certain throughout Covid 19 disruption. Optimising VM strategies across the sector should help improve productivity, by better aligning costs with projects end users’ needs. This insight into industry perceptions is expected to inform project managers both of public and private projects and construction procession educators.
College of Engineering, Construction and Living Sciences, Otago Polytechnic, Dunedin, New Zealand Joshua Cockroft, joshua.cocroft@naylorlove.co.nz
College of Engineering, Construction and Living Sciences, Otago Polytechnic, Dunedin, New Zealand Abstract Value management (VM) represents a methodical approach to optimising project objectives relative to costs. Methods range from desktop studies to facilitated workshops. Qualitative data was obtained through interviews with a client’s consultant project manager, two head contractors, and one specialist subcontractor to determine how VM practices are being implemented and perceived challenges and opportunities to maximising VM going forward.
Naylor Love, New Zealand Randima Senarathna, Randima.Senarathna@op.ac.nz
Proceedings of the PAQS Congress 2022, 12th 13th September 2022, Singapore Institute of Surveyors and Valuers, Singapore Value management practices in New Zealand commercial construction David Finnie (corresponding author), david.finnie@op.ac.nz
Construction procurement, early contractor involvement, value management.
1 Introduction
The construction industry operates many of its projects on tight timeframes, and even leaner margins. With current material scarcity and continual price escalations in the Covid 19 environment, there is a clear need for project stakeholders to focus on how they can deliver projects that are on time, within budget, and most importantly, to the client’s satisfaction. The
The procurement strategy and VM methodology should be considered together in terms of project size and complexity. Two-stage early contractor involvement (2S-ECI) with VM workshops that consider value more holistically by incorporating e.g., buildability and risk management, and client sustainability goals, may best suit complex building alterations.
Theprojectprocurement pathwayandVMmethodologyshouldbeconsideredtogetherinterms of project size and complexity and market conditions. VM practices can be used to better align project objectives to client needs at optimalcost. However, arangeof VMmethodologiesexist, from desktop studies to extensive and repeated facilitated VM workshops that involve supply chain. Involving supply chain requires a form of early contractor involvement (ECI) procurement such as two-stage ECI (2S-ECI) or design and build (D&B). Whereas VM practices are more associated with cost cutting exercises once traditional lump sum tenders close for complete detailed design.
2.1 What is value management? Value Management (VM) can trace its origins back to the years following the second World War. In the face of material scarcity and shortages, Lawrence D Miles an engineer at the
Optimising VM strategies across the sector should help to improve productivity, by better aligning costs with projects end users’ needs. This insight into industry perceptions is expected to inform project managers both of public and private projects and construction procession
2 Literature Review
Theeducators.construction
industry is one of the largest contributors to the New Zealand economy, with approximately 6.2% of real GDP being attributed to the sector (MBIE, 2020). Therefore, the opportunity to achieve gains through improving productivity is great. However. success relies upon the delivery of projects that effectively return sustainable profit margins to contractors and consultants, as well as tangible value for money to the client. One such philosophy that aims to achieve the best balance between cost and benefit is VM.
A review of previous literature is provided. Then the research methodology is presented. Data is then analysed and discussed. Finally, conclusions and opportunity are provided.
This study explores how VM practices are being implemented on New Zealand commercial construction projects, and to further elucidate the perceived barriers to using VM, the challenges faced, and benefits that VM offers. This was done through qualitative data analysis of interviews with key project stakeholders, comprising a client’s consultant project manager, two head contractors, and one specialist subcontractor. This fills gaps identified in the existing literature, include the interrelation between the parties, the involvement of subcontractor or specialist subcontractors, and the willingness of parties to participate in VM.
154 Proceedings of the PAQS Congress 2022, 12th 13th September 2022, Singapore Institute of Surveyors and Valuers, Singapore principles of value management (VM) provide strategies and tools that can be employed to balance the cost to benefits ratio on a project.
This is important for clients, head contractors, or lead consultants who typically drive VM practices. Getting the strategy wrong risks disengagement downstream when sub consultants (architects and engineers) feel that their design is challenged with cost unclear regarding the length and number of VM workshops or subcontractors feel frustrated when providing alternatives that are not adopted. Moreover, the cost and time required for VM workshops can sometimes outweigh the benefits achieved. Where a simple desktop study may suffice or no VM for straightforward new builds but miss potential to add value on large complex projects.
155
VM in construction is the practice and methodology of identifying, rationalizing, and refining projectcosts.Each costisweighedagainstthewantsandneedsofthekeystakeholders,whether that is the client or the end user. The aim is to achieve optimal value for money of the product being delivered. However, value is a subjective principle, and includes both monetary and non monetary factors. In construction, value can be defined as the ratio of the perceived benefits weighted against actual expenses required to achieve them. VM can, therefore, be defined as thephilosophy and practiceofensuringthatthis ratio is balancedso that end usersareprovided with the best possible product, that best meets their needs and wants (RICS, 2017; Shen and Yu, 2012). Within the regulatory framework of New Zealand, VM is defined as “a structured and analytical process which seeks to achieve value for money by providing all the necessary functions at the lowest cost consistent with levels of quality and performance” (Standards New Zealand, 1994). Therefore, VM should not be viewed purely as a “conflict oriented design review, cost reduction, or standardization exercise”, but rather as a means to achieve maximum value which is described as “a required level of quality at the least cost, the highest level of quality for a given cost, or from an optimum compromise between the two” (Kelly & Male, VM1993).is sometimes regarded as being synonymous with cost reduction, however, this is not the case. Although value management normally does result in the reduction of the cost, the aim is not to reduce cost but to improve value. Therefore, the process essentially involves the elimination of unnecessary costs imbedded in designs without reducing the level of functional quality. Improved value can be achieved in three ways: providing for all required functions, but at a lower cost; providing enhanced functions at the same cost; or providing improved function at a lower cost (Cartlidge, 2018). There can be several elements in any project that contribute to poor value and that need to be addressed (Yu & Shen, 2016). For example: poor communications, outdated standards or specifications, lack of needed experts, unnecessarily restrictive design criteria, scope of changes for missing items, lack of needed information (Norton and McElliott, 1995).
2.2 Importance of value management
Construction, like other industries, must make use of limited resources to deliver a suitable product that is fit for purpose. These limited resources include but are not limited to the client’s budget, time, labour, and raw materials. Most often, cost and time overruns are attributed to project failure. In a recent survey of international construction projects, it was determined that approximately 86% of construction projects ran over budget, and that almost 90% of projects incurred cost overruns (Flyvbjerg, et al., 2018). The key factors linked to cost overruns have been broadly grouped in to two categories: contractor’s site management, and financial management. (Rahmin, et al., 2013). A recent survey of New Zealand construction projects further determined the most influential factors that affect cost overruns. These are; market and industry conditions (i.e., competition, resource availability, boom and bust cycles), the regulatory regime in New Zealand (Building Act, Building Code, local by laws), the key
Proceedings of the PAQS Congress 2022, 12th 13th September 2022, Singapore Institute of Surveyors and Valuers, Singapore General Electrical Company, pioneered a system that looked to reduce the cost of the products manufacturing whilst not reducing the overall quality or functionality. His system, which was coined “value analysis” (VA), was based upon the theory that value can be expressed as the ratio between the cost of and the worth of the function. (Barton, 2018). This philosophy has evolved over time and has also been called "value engineering” (VE). The principles of VA, VE, and more recently VM, have been applied to multiple industries since their inception, including manufacturing, engineering, technology (Zimmerman and Hart, 1982) and more importantly (for the purposes of this research), construction.
156 Proceedings of the PAQS Congress 2022, 12th 13th September 2022, Singapore Institute of Surveyors and Valuers, Singapore stakeholders’ perspectives (i.e.: the influence of client, consultants, contractors and their respectiveinputandroles),project characteristics(siteaccessibility,project complexity,supply chain, method of procurement, use and availability of technology), and macroeconomic dynamics (global economic trends, employment, labour costs, inflation) (Zhao, et al., 2019). So, from this list of factors, it is apparent that there are many VM considerations that that can be analysed in terms of project VM. Because there are so many ways that VM can be applied, there are multiple methodologies that can be employed.
The workshops follow a systematic job plan (Yu & Shen, 2016) consisting of seven phases. The first phase, orientation, establishes the client’s needs and wants to determine the objective and the desirable characteristics of the project. It establishes what ‘value’ means to the client. These are the key drivers of the project and will determine where value management can best be achieved across the project. This is followed by phase two whereas much information is gathered as possible to identify the function of the whole project or parts of the project. Then the creative phase of the value management process begins speculation. The team and value management consultants generate ideas for the project. This is followed by analysis and evaluation (phase four). Evaluation techniques are used to determine the ‘best’ ideas that have been developed. The selected ideas are then considered in detail, including technical and economic feasibility and viability (phase 5). The refined ideas that come out of this phase are carriedforwardtothefinalproposalincludingworkingdrawings,calculations,andcosts(phase 6). Finally, the presentation of these findings is made to the Client (phase 7).
A range of tools exist for use in the workshop setting. These include, brainstorming, Delphi, questionnaires, SWOT (strength, weakness, opportunity, threat) analysis, interviews, and FAST (functional analysis system technique). Delphi (and other questionnaire methods), involve multiple rounds of survey and questionnaire collection to generate a consensus on what stakeholders find the most important key drivers. Desktop and group methods such as SWOT and FAST attempt to identify the internal and external factors that may have an influence on a project, and generally, participants will try to plan or make contingencies for the perceived weakness and threats that exist (Leigh, 2009). The current literature shows that these techniquesareusedcommonlyforconstruction(Helms, M.M andNixon, J, 2010)andthat they
2.3 Common VM approaches
The 40 hour workshop is the most comprehensive VM process and takes five working days to complete. It is time consuming and expensive but can provide excellent results. A shorter version of 1 2 days is often preferred as an alternative as it involves less time and resources up front. The VM workshop brings together the major stakeholders who have the expertise to identify and solve the problem. One of the keys to successful VM workshops is the selection of a multidisciplinary team with different backgrounds and attitudes. Apart from ensuring that all the necessary technical expertise is present, this is likely to introduce differing views and solutions to the problems being studied. This team works under the direction of a facilitator whose role it is to review the project and ensure that all the team members understand the client’s requirements and develops a cost effective solution (Cartlidge, 2018).
There are several different ways the VM process can be implemented. The level of risk involved in the project is a consideration (Constructing Excellence, 2015). For high risk, high value projects a full VM procedure is almost always justified. For high risk, low value and low risk, high value projects, desktop VM studies will often suit, provided there is input from all stakeholders. For low risk, low value projects a VM exercise is not usually necessary.
2.4 Challenges to value management
Previousdevelopment.studieshave identified further factors that can inhibit VM practices. A recent survey of contractors found the most common challenges faced when attempting VM implementation include: team obstructions (unwillingness of parties to participate and difficulty getting started,
to consider can include sustainability, whole life cycle costing (WLCC), risk management, and lean construction. Sustainability is concerned with the preservation of finite resources, and therefore shares principles with VM. In earlier studies, sustainability was listed as one of the factors identified during VM workshops (Zainul, Abidin and Pasquire, 2005).
Challenges faced adopting VM fall into one of three categories, human factors (client/ contractor relationships, effective communication methods, and the differing levels of understanding ofVM principles),project evolution (changes as aproject takes place),and costs (both financial and time) (Curlan et al., 2016). As construction projects progress the opportunity to add value through VM diminishes. Maximum benefits can be achieved earlier in the project (Norton & McElligot, 1995). Therefore, parties must be willing to participate in VM practices during design development stage to see the most benefit, and not when issues become apparent. The form of procurement strategy, such as such as two stage early contractor involvement (2S ECI) and design and build (D&B) can therefore support VM through involving contractors during design development. Finnie, AMEER Ali, and Park (2019) found through interviewing 23 construction professional across New Zealand, that the optimal time to involve contractors through 2S-ECI is typically after concept design and some detailed design
Since then, sustainability has been a focus in New Zealand particularly with the establishment of the New Zealand Green Building Council (NZGBC), whose vision (relating to value management in particular) is to produce building that are sustainable and healthier for New Zealanders (NZGBC, 2021). A recent international study showed that VM principles were applied across several projects to help reduce or eliminate unnecessary activities or materials that negatively affect sustainability, as well as promote sustainability principles (Aghimien et al., 2018). A similar approach that covers many of the key aspects of VM and sustainability is Whole Life CycleCosting(WLCC).This aims to account forall the costs from the initial design phase through to eventual demolition or ‘cradle to the grave’). WLCC requires significant amounts of design phase planning, and therefore benefits from VM methods. By aiming to reduce costs across the project lifecycle and minimising operating costs, WLCC takes a similar approach to considering sustainability. A recent analysis critically analysed the practices employed by both approaches and found many cross over points and similarities (Lateef et al., 2013).
157 Proceedings of the PAQS Congress 2022, 12th 13th September 2022, Singapore Institute of Surveyors and Valuers, Singapore can be used collectively to deliver successful projects (Parraga et al., 2014) (Tavana et al., Objectives2012).
Lean aims to reduce the waste generated by inefficient supply chains, methods, or poor design by eliminating non-value adding activities. A paper from the early 2000’s based on Australian construction projects identified some of the key contributors to waste being poor quality documentation, weather, unclear drawings, poor designs, design changes, and unclear specifications (Alwi etal., 2002). These variables are often covered in VM workshops, and can be identified, reduced, and potentially eliminated. More recent technology in construction such as Building Information Modelling (BIM), has helped to identify reductions in labour, material usage, and wastage on site by identifying potential buildability clashes (Bryde et al., 2013).
158
3 Methodology
The use of VM appears to have grown in New Zealand. An article published in BuildMagazine outlined how VM was being implemented on several large scale projects, including the major redevelopment of the Ohakea Air Base (Waterhouse, 2007). The cost of building in New Zealand has been increasing steadily over past couple of decades. This includes both building costs and professional services (Statistics New Zealand, 2021). Events like the leaky homes’ crises of the early 2000s, had detrimental impacts on the construction industry and ultimately led to price increases, either through increased regulation, or material prices (BRANZ, 2018).
With the economic effects of COVID 19 resulting in labour and material shortages, high cost inflation, and material delays (Radio NZ, 2022). VM practice are particularly needed to avoid delays in the supply chain and help ensure optimal value for the costs paid.
Data was collected through semi structured interviews face to face, online, or telephone, and analysed using a qualitative analysis approach. Qualitative analysis focusses more on the meaning of the data collected, rather than the frequency or quantity of the data. The advantages of this style of research include the ability to capture the participants feelings and opinions of the research topic, it allows for greater interpretation of context specific topics, and it also allows the researcher to capture not only verbal cues, but non verbal cues which may offer further insight into the respondents’ attitudes and feelings. However, drawbacks of this approach include the variability in quality of responses, over generalization of responses to fit one narrative, and the amount of time required to collect a statistically significant data sample (Rahman, 2017). For this research project, the focus is to capture the opinions, attitudes, and feelings of respondents towards value management, and to capture the subjective advantages and disadvantages of value management rather than to represent statistical significance of the data. Therefore, qualitative methods are more effective in this space than quantitative methods.
Proceedings of the PAQS Congress 2022, 12th 13th September 2022, Singapore Institute of Surveyors and Valuers, Singapore misconception of implementation costs), study obstructions (lack of value engineering culture in companies, lack of professionalism, lack of guidance or framework), implementation difficulties (unwillingness to apply findings or principles, cost oriented procurement approaches, lack of management support), and conceptual problems (that VM is too theoretical) (Kissi et al., 2016). Receptiveness to VM adoption may depend on stakeholders’ experiences. For example, first time buy in can be difficult (Jaapar et al., 2012). For international projects, the difficulties in using VM stem from a lack of local understanding, context, and appreciation for different value systems, thus hindering the effectiveness of VM workshops (Curlan etal., 2016). The scopeof VM applicationcantherefore vary. For example, Daddow and Skitmore (2004) found that VM use in Australian construction tended to focus more on risk management than wholistic value.
2.5 Trends in New Zealand
The 10 semi structured interview questions aimed to first establish the participant’s understanding of the topic matter, their experience in using value management, and the types of approaches being used throughout the process. Questions were then designed to elucidate the attitudes of the respondents towards VM as whole, for example, their interpretation of the relationships between parties, how invested parties were in the VM processes, and finally the perceivedchallengesandbenefitsofVM.Eachofthequestionswereopen ended,andtherefore facilitated free flowing conversation. An effort was made when formulating these questions as to avoid double barrelled questions or vague questions.
Q1. What is your understanding of value management principles and their application?
This type ofapproachhasbeen shownto be advantageous ifextendeddiscussions develop that may extend beyond the questions asked and highlight other areas of interrogation that were not initially clear at the outset of the research project (Harvey Jordan & Long, 2001), allowing for follow up probe questions. Further to this point, the guidelines for semi structured interviews set out by Harvey Jordan & Long (2001), provide that effective interviewing requires adequate preparation time before hand, especially when limited responses are given to questions or when deciding the most effective probe question techniques. An effective interviewer should be able to draw upon their knowledge of the subject to provide prompts and cues to elicit deeper responses from the respondent. Therefore, prior to the commencement of interviews, a review of the data collected to date (literature review, other interview responses) was carried out to ensure that sufficient talking points were remembered ahead of the interview. The disadvantages of the semi structured interview are also well documented, particularly around the time commitment required to first conduct the interview, and secondly to transpose and interpret the responses given. In addition to this, the non quantitative approach to data collection can make drawing meaningful conclusions difficult, especially if only a handful of interviews are conducted (Wholey et al., 2010).
Q2. To what extent are value management principles being used during the preconstruction stage?
Q3. How do you decide which projects are key candidates for value management?
Q5. What value management strategies and principles are being used?
Q8. What operational benefit has been obtained by implementing value management on construction projects?
Q4. Is value management driven by the contractor, the consultants, or the client?
Q6. How receptive are all parties to being involved in, and implementing value management strategies?
Q7. What are the key challenges or barriers to the successful implementation of value management strategies?
159 Proceedings of the PAQS Congress 2022, 12th 13th September 2022, Singapore Institute of Surveyors and Valuers, Singapore
Q9. What commercial benefit has been obtained by implementing value management on construction projects?
Q10. How likely are you to employ value management on future construction projects?
Due to the restrictions and difficulties around in person interviews due to Covid 19 disruption, most of these interviews were conducted either over the phone, or via Microsoft Teams. On the surface, this may seem disadvantageous, as telephone and internet based interviews diminish the impact of visual cues that can be interpreted during in person interviews, however literature does suggest that this format encourages greater agenda driven conversation (Novick, 2008). This method may make respondents feel more comfortable disclosing confidential or commercially sensitive information with some degree of anonymity (Cachia and Millward, 2011).
Data was collected through a combination of obtaining a recording of the conversation (with the consent of the respondent), as well as noting key points raised during the conversation. It was important that notes were taken during the interviews to capture context and record ideas that arose during the conversation. This dual pronged interview technique allowed for free flowing conversation, whilst capturing all the pertinent data, and synthesizing original ideas that arose from the interview conversation.
Four semi structured interviews were conducted with two head contractors, a consultant project management firms, and an interiors fitout specialist subcontractor, all located in Otago New Zealand. All had considerable experience in VM. A description of the respondents, and an indication of their respective business sizes are shown in table 1 below.
Dunedin Medium Respondent 3 Clients’ consultant project manager (PM) Dunedin Large Respondent 4 Head contractor #2 Dunedin Large Table 1: Interview sample
3.2 Ethics approval
Respondent ID Role of Respondent Location of Respondent Company Size * Respondent 1 Head contractor #1 Dunedin Large Respondent 2 Specialist subcontractor: interior fitout company plasterboard, insulation, steel stud, aluminium partitions,ceilingssuspendedetc.
4
*Company size is based on MBIE classification for company size and number of FTE employees (MBIE, 2019).
160 Proceedings of the PAQS Congress 2022, 12th 13th September 2022, Singapore Institute of Surveyors and Valuers, Singapore
3.1 Profile of interview sample
Findings and Discussion
This project involved the use of human participants for the purposes of semi structured formal interviews. Therefore, in line with the Otago Polytechnic guidelines, full OPREC ethics approval was granted for the conducting of these interviews. The ethics application, including the information sheet, consent form, and interview questions were reviewed and approved by OPREC on the 22nd of August 2021, prior to any interviews being conducted. In the interests of anonymity, and to avoid disclosing information that could be deemed commercially sensitive, the names and companies of the respondents is concealed. Each respondent will be referred to as per Table 1.
The interviews yielded consistent and informative data that tended to agree with previous studies. The responses of each interviewee to the questions are thematically analysed and discussed in relation to the existing body of knowledge.
Q1. Understanding of VM principles: The interviews generally demonstrated a good understanding of VM principles. Each interviewee described VM as a refinement of the project design to best deliver on the clients brief in the most cost-effective way. This aligns with the definition by Standards New Zealand (1994). Both head contractors said that the VM process had to be timed correctly, i.e., not too
Q3. Rationale for applying VM to a project Head contractor 1 provided that the rationale for VM generally centred around the client’s budget and those clients commonly request VM to bring the project back within budget. Head contractor 2 added that VM is also used on projects where there was deemed a higher commercial risk to the company so that efficiencies could be harnessed either through cost savings to the contractor and the client and efficiencies in the construction programme. This supports findings by Daddow and Skitmore (2004) who found VM commonly focused on risk management. The PM added that the design process and VM should be carried out together, through constant cost checking exercises at each stage of the design process. Again, the procurement pathway adopted was identified as one of the key determiners of VM application. The subcontractor felt that the limitation in the scope of their package allowed them to employ their expertise and offer multiple solutions to the client (via the head contractor), and that they commonly did this as a matter of course with their preferred head contractors to achieve mutual benefits.
Proceedings of the PAQS Congress 2022, 12th 13th September 2022, Singapore Institute of Surveyors and Valuers, Singapore early in the design phase (concept), and not too late (detailed design) to be most effective. This agrees with Norton & McElliot (1995) about the importance of timing and aligns with Finnie, AMEER Ali, and Park (2019) that the optimal time to engage contractors through 2S ECI is generally after concept design and part detailed design development. The specialist subcontractor described VM as the introduction of alternative methodologies or materials as a means of achieving the clients brief in a more cost effective manner.
161
Q4. Which parties drive VM?
Q2. Extent of VM during pre construction:
The lead of VM practices depends on the procurement pathway adopted. VM practices may be led by the client’s project manager during design development under 2S-ECI, the head
All interviewees agreedthat VMwas being used extensively duringthepre constructionphase. The recent market conditions imposed by COVID 19 (material shortages and delays, project shutdowns, cost escalations) were cited by all interviewees as one of the major drivers of undertaking VM for almost all projects in the current market. The PM highlighted the importance of developing a business case for all projects, and that VM was inherent in that process.
Both contractors provided that in a competitive market, effective VM could make the difference between securing a job or not. This demonstrates a variant of VM where contractors use VM as a cost engineering exercise during tender preparation. This is also exemplified by the specialist subcontractor who said that they were able to leverage their expertise in their specialist trade during VM process to provide recommendations to the head contractor when tendering for work. The selected procurement pathway also impacts the application of VM, for example, both head contractors discussed how the collaborative approach of 2S ECI procurement was conducive to effective VM. This was echoed by the PM, who said that VM has become more common, including under D&B procurement.
Q5. VM strategies being used: For the contractors, the most used strategy in VM was the use of workshops. These workshops allowed the client, consultants, and contractor to meet and definitively determine the project objectives. Contractor 1 was a strong proponent of carrying out focussed discipline specific workshops, i.e., structural, architectural, and mechanical workshops, to ensure that only the relevant parties were present at each meeting. This allowed all parties to remain engaged and focussed on the design discussions that directly related to their scope of work. Both contractors felt that workshops are the best method of determining the client’s “shopping list” of musthaves, and key deliverables. From the perspective of the PM, their approach focussed more on cost value costing exercises and value engineering. Depending on the stage of their client’s design, they were able to offer value management in different ways. For example, in the early design stage or concept stage, the focus was on the bulk and location and comparing metre squared rates. As the design evolved, and more costs became set, the focus could then shift to valueengineeringthe fitout oftheproject, or the external envelope.This process wouldinvolve collaboration with the client, confirming their needs as the design evolves, and would eventually involve the head contractor. From the subcontractor’s point of view, their involvement in workshops or design analysis was limited, they generally offered alternative solutions to the contractor, who would then take them on to the client. The subcontractor noted that any direct interface with the client in the VM process was limited or non existent.
Head contractor 1 believed that the type of procurement was key in determining who front footed the process. They provided that all parties were more invested and generally more collaborative under 2S ECI. This is supported by Finnie, AMEER Ali, and Park (2019) who found that 2S ECIboth relied on and could build trust across the interdisciplinary project team. They also said that they had more influence in VM processes under D&B where they employed their consultant team. In head contractor 2’s experience the client usually requested and drove VM through the involvement of their project management consultant. The PM supported this and felt that all parties had a vested interest in VM being applied efficiently and without workshops dragging out unnecessarily, particularly design consultants who expended their costs during workshops and design rework. The subcontractor, who routinely incorporated VM elements into their trade package found that they were able to drive VM in tenders, and subsequently provide the contractor with a competitive advantage.
Q6. Receptiveness and attitudes of parties towards VM: Interviewees agreed that the most receptive parties in VM were the client, the contractor, and the lead-consultant because they obtained the most benefit. According to head contractor 1 there was a risk of design consultants, such as architects, structural engineers becoming disengaged due to the additional time spent reworking their design. This was echoed by the PM who said that designers were often uncomfortable with the number of re designs required, with a lack of clarity around who pays their additional costs. This was supported by the subcontractor who said that they often offered VM alternative solutions, but that architects were often reluctant to change specifications. They speculated that this could be due to the architect being unwilling to expend further time and cost and that architects could be tied into relationships with manufacturers by specifying their products or systems. This exemplifies the challenge identified by Curlan et al (2016) regarding project changes and the cost and time required/
Proceedings of the PAQS Congress 2022, 12th 13th September 2022, Singapore Institute of Surveyors and Valuers, Singapore contractor during D&B procurement, or contractors during their preparation of tender bids under traditional procurement through cost engineering to gain competitive advantage.
162
163 Proceedings of the PAQS Congress 2022, 12th 13th September 2022, Singapore Institute of Surveyors and Valuers, Singapore
Design consultants may feel threatened and become disengaged through what may seem endless rounds re working their own design. Specialist contractors may also become disengaged when providing cost alternatives that are not adopted by the design team. Often designs are based on specifications provided by the architect’s preferred specialist subcontractors. The specialist subcontractor interviewed speculated that this may why the design alternatives are often not adopted by the design team, despite being cost advantageous. Interviewees agreed that theprocurementpathway shouldsupporttheVMmethodology. Either through 2S ECI, D&B or traditional. And that VM is more relevant in the current market conditions of labour and material scarcities. However, it remains unclear what VM method should be used or whether VM is necessary at all, per project. Nor the tools to use, such as SWAT or Lean. Or how to use them.
Timing required for VM appears a key challenge to using VM. All interviewees expressed the importance of balancing the time and resource spent on VM practices with the potential gains achieved. From both head contractors’ perspective, the key barrier to VM being successful on a project was the sheer amount of upfront time and cost that was necessary to get a project over the line. This could take anywhere from 6 12 months from early design to developed design for construction. The potential for adversarial relationships between the contractor and consultantsriskeddrawingouttheprocess.Headcontractor1saidthattheshortvalidityperiods in trade quotes in the current market often expired before the VM process could be completed, therefore requiring re pricing. Subsequent increases in material and labour costs risked of outweighing the benefits through VM. According to the PM, a key challenge is the competing commercial interests of each party. For example, the contractor wants to pass as much risk on to the client as possible and vice versa. The contractor seeks to maximise costs, whilst keeping it palatable with the client, to offset their commercial risk. Vague scope can lead to unnecessary time spent on re design and re costing. They highlighted the importance of managing the client’s expectations in the process. Both head contractors, and the PM noted that without effective risk management strategies in place, that the benefits of VM could easily be negated. All interviewees expressed the importance of balancing the time and resource spent on VM practices with the potential gains PMsachieved.may demonstrate added value to the client through facilitating VM. Contractors can use VM for competitive commercial advantage using value engineering during their tender submissions, or trough demonstrating their VM capability in 2S ECI. However, it is often less clear who pays the designers for time spent re working their design.
Q8. VM Benefits: Both head contractors felt that the greatest benefit was the ability to sequence their works more efficiently, and this had a positive impact on the construction programme. The collaborative nature of the process allowed the contractor to fully understand the client’s situation and their motivations, and therefore plan activities to minimize their time spent on site. This supports findings support Finnie, AMEER Ali, and Park (2019) that 2S ECI can improve project planning regardless of the pre construction services offered by contractors, and Finnie and Smith (2021) that 2S ECI supports better planning and carrying out exploratory work to reduce issues during construction. Furthermore, the collaboration with specialist subcontractors and
Q7. Key barriers and challenges to VM:
164 Proceedings of the PAQS Congress 2022, 12th 13th September 2022, Singapore Institute of Surveyors and Valuers, Singapore the use of BIM also reduced the number of service clashes, and reduced buildability issues.
Q10. Likelihood of using VM on future projects: All interviewees said that they would be using VM principles on future projects. The PM pointed to the evolution and availability of BIM and how it will help make will make VM a more iterative process, streamlining cost checking exercises. This is described by Bryde et al (2013). Given market conditions imposed by COVID 19, all interviewees agreed that expertise in the VM can help mitigate the effect of what are regular and significant cost increases. Overall,interviewees wereoptimisticabouttheuseofVMmovingforward,particularlyaround companies growing their VMcapabilitiesandimprovingbusiness reputations andsecurefuture work, particularly through 2S ECI. This advantage is documented by (Turner & Riding, 2015).
The PM felt the greatest benefit comes from the innovations that VM practices promote, particularly related to WLCC for government projects. This supports the critical comparison between VM and WLCC by Lateef et al., (2013). From the subcontractor’s perspective, the greatest operational benefit was labour efficiencies, less time spent on site, and subsequently lower preliminary and general (P&G) costs, plus improved business reputation.
Q9. Commercial benefits of VM: The main goal of contractors is to increase their profit margins whilst maintaining a strong relationship client relationship through effective project delivery. Both contractors said that VM on previous projects had led to savings on labour through alternative materials identified in workshops or alternatives proffered by subcontractors. They also discussed the advantages of negotiating with clients through 2S ECI and agreeing favourable commercial terms. This generally meant an open book pricing approach. This therefore helped to secure the work without the need for tendering on the open market. Rahman & Alhassan (2012) described negotiating work through an ECI open book approach as a beneficial to contractors and that VM was key in enabling this. In addition to this, the success of the contractors in the VM space was particularly valuable in securing future negotiated work. From the viewpoint of the PM, thecommercialcertaintyachievedthroughusingVMwasthemostimportantbenefitidentified.
Being able to convert projects from concepts into full blown construction was made easier through the collaborative VM process. They also felt that the increase uptake of VM strategies by construction companies in New Zealand would give the market more confidence to employ VM on future projects.
5
Finnie, AMEER Ali, and Park (2019) also described contractors working to improve their preconstruction services to help secure future work through 2S ECI.
The use of off site manufacturing (pre cast concrete, pre manufactured components) also improved efficiencies. Contractor 1 said that they had noticed that the overall quality of the work completed on projects that employed VM was better with reduced rework. This supports findings by Mosey (2011) that 2S ECI can iron out issues and reduce issues onsite.
Conclusions
The VM methodology should be specified in each consultants’ contracted scope of work. That way each consultant can estimate the cost of attending workshops and making design changes, giving transparency to consultant fees. Their contracts should also make clear who pays if workshops run over. That means the estimated number of workshops and technology used, such as BIM, needs to be decided before employing design consultants.
Theneedtobalancetime investedinVMwiththelikelybenefits,andbalancingcompetinginterests is key to VM success. The client’s PM should decide the VM methodology and the procurement strategy together because they support each other. Where appropriate, 2S ECI or D&B should involve contractors before detailed design specifications are decided. This may improve buy in from both architects and specialist subcontractors. A model for establishing the best VM methodology per project and the tools used, could improve productivity by optimising value whilst mitigating unnecessary design rework.
Further research could involve wider interviews and developing a VM model and testing it using the Delphi technique to survey interviewees to reach consensus across the interview sample. This would triangulate the findings through a blended qualitative and quantitative research methodology.Thisstudyispart ofa largerproject andfurtherresearchisplannedby theleadauthor in this space for future publication.
Proceedings of the PAQS Congress 2022, 12th 13th September 2022, Singapore Institute of Surveyors and Valuers, Singapore
Similarly, Finnie, AMEER Ali, and Park (2020) argued that the scope of contractors’ pre construction services should be specified in a pre construction service agreement (PCSA) (Finnie, AMEER Ali, and Park, 2021). As part of their study, they developed a standard form PCSA for use in New Zealand construction. It is currently freely available to members of the Society of Construction Law New Zealand (SCLNZ).
6 References Aghimien, D., Oke, A., and Aigbavboa, C., 2018. Achieving Sustainability in Construction through Value Management. Proceedings of the International Conference on Industrial Engineering and Operations Management: Paris, France, July 26 27, 2018. Alwi,http://ieomsociety.org/paris2018/papers/455.pdfS.,Hampson,K.,andMohamed,S.,2002.Non-Value
165
Construction Projects. In Proceedings International Conference on Advancement in Design, Construction, Construction Management and Maintenance of Building Structure, pp: 270 278, Bali. Barton,R., 2018. Historical OverviewofValueManagement(Doctoral dissertation).Available from: https://nanopdf.com/download/historical overview of valuemanagement_pdf# Bryde, D., Broquetas, M., & Volm, J.M., 2013. The project benefits of Building Information
This study has provided insight into industry perceptions on the efficient use of VM used on New Zealand commercial construction projects. Findings are limited by the number of interviews conducted. Expanding the number of interviewees would help bolster these findings.
These findings can inform such construction professions as project management, quantity surveying, architecture, and engineering. Both by direct industry application and through tertiary degrees and diploma programmes in architecture, engineering, and construction. The findings also add to the growing academic body of knowledge in procurement, VM, and 2S ECI. Findings are particularly relevant given the growing use of VM in industry.
Adding Activities in Australian
Helms,HarveyFinnieFinnieFinnieDaddow,Constructinghttps://doi.org/10.3846/13923730.2014.945950Curlan,Cartlidge,aCachia,https://d39d3mj7qio96p.cloudfront.net/media/documents/SR375_Buildingquality_issues__A_literature_review.pdfM.,andMillward,L.,2011.Thetelephonemediumandsemistructuredinterviews:complimentaryfit.QualitativeResearchinOrganizationsandManagement6(3):265-277.https://doi.org/10.1108/17465641111188420D.,2018.NewAspectsofQuantitySurveyingPractice(4thed.).Oxford:Routledge.N.,Cekic,Z.,andTorbica,Z.,2014.UseofValueManagementWorkshopsandtheCriticalSuccessFactorsinIntroducingLocalExperienceontheInternalConstructionProjects.JournalofCivilEngineeringandManagement.22(8):10211031.Excellence.,2015.Value.Retrievedfromhttp://constructingexcellence.org.uk/wpcontent/uploads/2015/03/value.pdfS.,&Skitmore,M.,2004.ValueManagementinPractice:AnInterviewSurvey.ConstructionEconomicsandBuilding,4(2),1118.Retrievedfrom:https://epress.lib.uts.edu.au/journals/index.php/AJCEB/article/view/2927D,AmeerAliN,andParkK.,2021,February.Earlycontractorinvolvement:areviewofpreconstructionserviceagreements.ProceedingsoftheInstitutionofCivilEngineersManagement,ProcurementandLaw,10.1680/jmapl.20.00038D,AmeerAliN.&ParkK.,2019.Improving2stageearlycontractorinvolvement:lessonsfromNewZealand.Paperpresentedatthe22ndPacificAssociationofQuantitySurveyorsCongress,KuchingSarawak,Malaysia.http://www.paqs2019.com/sites/default/files/201909/HW6%20%20Improving%202Stage%20Early%20Contractor%20Involvement%20Lessons%20From%20New%20Zealand%20%20David%20Finne%20.pdfD,andSmithJ(2021)Casestudyoftwostageearlycontractorinvolvement(2SECI)usedforseismicupgradesatQueenstownairportNewZealand.PaperpresentedattheRoyalInstitutionofSurveyorsMalaysia(RISM)InternationalResearchConference,27March2021.Jordan,S.,andLong,S.,2001.Theprocessandpitfallsofsemistructuredinterviews.CommunityPractitioner74(6):219221.M.M.,andNixon,J.,2010.ExploringSWOTanalysiswherearewenow?Areviewofacademicresearchfromthelastdecade.JournalofStrategyandManagement.3(3):215251.https://doi.org/10.1108/17554251011064837
International Journal
of
166 2022, Singapore Institute Surveyors and Valuers, Singapore Modelling. of Project Management, 31 (7): 971 980 BRANZ.,https://doi.org/10.1016/j.ijproman.2012.12.0012018.Buildingqualityissues:ALiterature
Review.
Proceedings of the PAQS Congress 2022, 12th 13th September
Radio NZ., 2022. Construction material shortages, price hikes plague building industry. https://www.rnz.co.nz/news/business/460620/construction material shortages price hikes plague building industry Rahman, I. A., Memon, A. H., and Karim, A. T. A., 2013. Significant factors causing cost overruns in large construction projects in Malaysia. Journal of Applied Sciences. 13 (2): 286 293.
2019. Defining Small Business: Recommendations for the New Zealand Small Business Council for the Minister of Small Business. Retrieved from: https://www.mbie.govt.nz/assets/defining smallbusiness.pdf
Ministry of Business Innovation and Development., 2020. Construction Fact Sheet July 2020. Retrieved from: https://www.mbie.govt.nz/dmsdocument/11600 constructionfactsheet july 2020 Mosey, D., 2011. The strengths of early contractor procurement. Society of Construction Law UK, 171. Retrieved from: https://www.scl.org.uk/papers/strengths early contractor NewprocurementZealandGreen
167 Proceedings of the PAQS Congress 2022, 12th 13th September 2022, Singapore Institute of Surveyors and Valuers, Singapore Jaapar, A., Maznan, N.A., and Zawawi, M., 2012. Implementation of Value Management in Public Projects. Procedia Social and Behavioral Sciences. 68: 77 86. Kelly, J., and Male, S., 1993. Value Management in Design and Construction. (1st ed.) UK: Kissi,RoutledgeE.,Boateng, E.B., Adjei Kumi, T., and Badu. E., 2016. Principal component analysis of challenges facing the implementation of value engineering in public projects in developing countries. International Journal of Construction Management.17 (2) Lateef,https://doi.org/10.1080/15623599.2016.1233088A.,Iskandar,B.S.,andRidzuan,P.D.,2013.A
Building Council., 2021. Our Vision. Retrieved 6th June 2021 from: https://www.nzbgc.org/about us and membership/our vision
Norton, B and McElligot, W.C.,1995.ValueManagementin Construction.(1st Ed.)NewYork, USA: Macmillan Publishers. Novick, G., 2008. Is there a bias against telephone interviews in qualitative interviews? Researching in Nursing and Health 31 (4): 391-398. https://doi.org/10.1002/nur.20259
Parraga, M.M., Gonzalez Cancelas, N., and Soler Flores, F., 2014. DELPHI SWAT Tools UsedinStrategicPlanningofthePortofManta.Procedia SocialandBehavioralSciences. (162): 129 138. https://doi.org/10.1016/j.sbspro.2014.12.193
Critical Review of Value Management and Whole Life Cycle Costing on Construction Projects. Engineering. Leigh, D., 2009. SWOT Analysis. Handbook of Improving Performance in the Workplace (1): Ministryhttps://doi.org/10.1002/9780470592663.ch24ofBusinessInnovationandDevelopment.,
Turner, N., and Riding, M., 2015. Early Contractor Involvement in Australia: Learnings from Transfield Service Projects. Small Enterprise Research 22(2 3): 173 184, Waterhouse,https://doi.org/10.1080/13215906.2015.1061724P.,2007.UsingValueManagement
to Optimise Project Outcomes. Build. Wholey,http://www.buildmagazine.org.nz/assets/PDF/B101-50ValueManagement.pdfJ.S.,Hatry,H.P.,andNewcomer,K.E.,2010.HandbookofPracticalProgramEvaluation(3 rd Ed.) USA: Jossey-Bass. Yu, A., & Shen, Q., 2016. Value management in construction and real estate: methodology and applications. New York: Routledge. Zainul Abidin, N and Pasquire, C.L., 2005. Delivering sustainability through value management: Concept and performance overview. Engineering, Construction and Architectural Management. Zhao, L., Wang, B., Mbachu, J., and Liu, Z., 2019. New Zealand Building Project Cost and Its Influencing Factors: A Structural Equation Modelling Approach. Advances in Civil Engineering. https://doi.org/10.1155/2019/1362730
Shen, Y., and Yu, A.T.W., 2015. Value Management in Construction and Real Estate Methodology and Application (1st Ed.) UK: Routledge. Standards New Zealand., 1994. AS/NZS 4183: Value management. Wellington, New Zealand: Standards New Zealand. Statistics New Zealand., 2021. Construction costs keep rising. Retrieved from: https://www.stats.govt.nz/news/construction costs keep rising
168 Proceedings of the PAQS Congress 2022, 12th 13th September 2022, Singapore Institute of Surveyors and Valuers, Singapore Rahman, M.S., 2017. The Advantages and Disadvantages of Using Qualitative and Quantitative Approaches and Methods in Language “Testing and Assessment” Research: A Literature Review. Journal of Education and Learning 6 (1): 102 112. Rahman M., and Alhassan A., 2012. A contractor’s perception on early contractor involvement. Built Environment and Asset Management (2): 217 233 Royalhttps://doi.org/10.1108/20441241211280855InstituteofCharteredSurveyors,2017.Value
Management and Value Engineering (1st Ed.) London, UK: Black Book Working Group. Shen, Q., and Liu, G., 2003. Critical Success Factors for Value Management Studies in Construction. Journal of Construction Engineering and Management. 129 (5). https://doi.org/10.1061/(ASCE)0733 9364(2003)129:5(485)
Tavana, M., Pirdashti, M., Kennedy,D.T.,Belaud, J.P.,Behzadian,M., 2012.AhybridDelphi SWOT paradigm for oil and gas pipeline strategic planning in the Caspian Sea basin. Energy Policy. (40): 345 360. https://doi.org/10.1016/j.enpol.2011.10.020
169
Proceedings of the PAQS Congress 2022, 12th 13th September 2022, Singapore Institute of Surveyors and Valuers, Singapore Zimmerman, L.W., and Hart, G.D., 1982. Value Engineering: A Practical Approach for Owners, Designers and Contractors (1st Ed.) New York, USA: Van Nostrand and Reinhold Co.
National University of Singapore, Department of the Built Environment, Singapore Tay En Rong, Stephen, stephen.tay@nus.edu.sg
Keywords hybrid working, quantity surveyors, work environment preferences, working from home, working from office.
170 Proceedings of the PAQS Congress 2022, 12th 13th September 2022, Singapore Institute of Surveyors and Valuers, Singapore
The recent COVID 19 pandemic has changed many companies’ office work arrangements to hybrid work arrangements. As society shifts towards hybrid work models, hybrid working is becoming the new norm. The main objective of the study is to investigate Quantity Surveyors’ (QS) attitudes towards hybrid working. Data was obtained through snowball sampling using Google Forms to contacts working in the industry. The attitudes used in the study consists of the top three reasons for liking or disliking hybrid working, conduciveness, and productivity of the working environment. Data cleaning was conducted on the 43 responses collected which resulted in 31 valid responses. Based on the 31 responses, 71% of QS surveyed prefers to work in a hybrid working environment. The results of the study show that the top three reasons for liking hybrid working are: 1) Reduced Transportation Hours, 2) Flexibility, and 3) Reduced Expenses. Conversely, the top three reasons against hybrid working are: 1) Longer Working Hours, 2) Socialising Issues, and 3) Work Environment Issues. In addition, when compared to males, it was found that female QS perceived their homes to be more productive and conducive than their offices. However, when comparing within the same gender, there was no significant difference observed in perceived conduciveness and productivity between the home and office work environment. The results provide deep insights on employees' work preference, to better attract and retain talent in the industry.
Employees’ attitudes towards Hybrid Working A study of Quantity Surveyors in Singapore Guo Yunting (presenting author), e0417704@u.nus.edu
1 Introduction Due to the Coronavirus (COVID 19) pandemic and the government restrictions on Safe Management Measures (SMM) at workplaces, the number of people working from home in Singapore has increased significantly. Since Singapore exited Circuit Breaker (CB) on 1 June 2020, Phase 2 Heightened Alert and other SMMs were established to prevent the spread of COVID 19 at workplaces (Ministry of Manpower 2021). From 14 May 2021, Work from Home (WFH) became the default arrangement for employees in Singapore (Ministry of Manpower 2021). Today, even though COVID 19 restrictions were eased, WFH still exist in Singapore (Lim 2022). To provide greater flexibility and enhance the well being of employees, it was reported that more companies prefer hybrid work arrangements over remote working completely (Lim 2022). The Singapore National Employers Federation's (SNEF) also
National University of Singapore, Department of the Built Environment, Singapore Lian Khin Ming Jonathan (corresponding author), jonathan.lian@nus.edu.sg
National University of Singapore, Department of the Built Environment, Singapore Abstract
The transition towards HW became more prevalent in Singapore companies after COVID 19. In this section, it explains the new work arrangement normal, HW, occurring in the society today, as well as the advantages and disadvantages of HW, and possible future arrangements that can be implemented through reviewing past literatures.
2.1 Hybrid Working
In the recent years, organisations around the world began to normalise work environments towards adopting hybrid work model, an arrangement which provides employees flexibility with working remotely or working physically in the office (Lenka 2021). In the Australian
2 Literature Review
According to The Psychology of Attitudes, “attitudes” is defined as the extent of disfavour or favour expressed through evaluations from a psychological tendency (Eagly and Chaiken 2007). The definition used in this study will be consistent with past studies, which is then used to document individual QS’ opinions and views towards HW.
171 Proceedings of the PAQS Congress 2022, 12th 13th September 2022, Singapore Institute of Surveyors and Valuers, Singapore suggested companies to implement flexible work arrangements to cater for the diverse needs of employees (Lim 2022). Within the construction industry, the construction cost and contract consultants, also known as Quantity Surveyors (QS), perform an important role to assist clients in obtaining value for money in construction projects (Singapore Institute of Surveyors and Valuers 2022). As QS employees may also be assigned with various flexible work arrangements, the aim of this study is to explore QS attitudes towards Hybrid Working (HW) arrangements. The findings of the study will better allow employers to understand QS employee’s needs and requirements such as their preferred working environment, which includes working from home (WFH) or office and HW, as well as to understand the kind of work environment that can result in increased work efficiency and effectiveness of Singapore QS.
1.2 Research Problem Due to COVID 19 and various governmental regulations, HW has become more common in Singapore companies. However, there are few studies conducted on HW and there were no studies, to the best of the authors’ knowledge, conducted on HW for QS in Singapore. To address the identified research gap, this paper aims to bridge the knowledge gap of HW for Singapore QS. The overall aim of the paper is to explore the impact of the new normal with HW on QS working in Singapore.
1.1 Research Definition
The data in this study were obtained by an electronic survey using Google Forms and sampled through contacts. The objective of the study is to investigate QS attitudes towards HW.
The term “Hybrid Work Model” is defined as the combination of working remotely and physical working in the office (Lenka 2021, Grzegorczyk et al 2021). However, some research papers had classified “Hybrid Working” under the same definition as WFH. In this paper, the definitions are integrated and HW refers to employees who work partly in the physical office environment and partly remote (at home or from another workspace).
1.3 Research Methods & Objectives
2.3 Gender, Conduciveness & Productivity of Hybrid Working Past research had found that WFH is conducive for families to attain greater balance between work and life (Dockery and Bawa 2018). However, it was reported that scientists which requires hands on work are unsuited for WFH (Liu 2020). Comparing conduciveness of WFH amongst gender, a research conducted in Singapore found no difference in work conduciveness between male and female caregivers (Danker et al 2022). However, it was reported that male non caregivers found WFH to be significantly less conducive than female non caregivers who
172 Proceedings of the PAQS Congress 2022, 12th 13th September 2022, Singapore Institute of Surveyors and Valuers, Singapore construction industry, hybrid teams, also known as partially virtual teams, were being increasingly utilised as people were dispersed geographically across various time zones (Hosseini et al 2017). Although the trend shifts towards HW, it was reported that hybrid work model is dependent on the nature of the job (Beck and Hensher 2021, Vyas 2022). For instance, finance and corporate management services may be conducted from home while in person involvement professions such as front line and agriculture services are unable to work remotely (Dingel and Neiman 2020). This resulted in remote working being highly dependent on the tasks required of the employee (Vyas 2022). As such, the hybrid work model is introduced as a combination of telework and office work with considerations on risks involved, effectiveness and resources available (Raghavan et al 2021). Post COVID 19, HW will become the new norm (Raghavan et al 2021, Vyas 2022). Some companies that are supportive of adopting this new norm includes Amazon, Google, Microsoft, and Siemens AG (Vyas 2022). While caveats of WFH such as lack of social interaction and collaboration remains, a hybrid work environment which combines WFH and working from office can help to address the barriers (Beck and Hensher 2021).
As HW consists of WFH, which is defined as working from home on one or more days a week (Afrianty et al 2022), the relevant content from the literature review comprising of advantages and disadvantages of WFH will be discussed in this paper. The advantages of WFH includes 1) time flexibility, 2) reduction in commute time, 3) work life balance, 4) ability to retain and attract employees, and 5) enhanced commitment of employees and improvement of workflows (Afrianty et al 2022).
The disadvantages of WFH include work life balance issues, availability of workspaces for WFH, differing non paid labour while engaging in WFH and technological issues (Beck and Hensher 2021). A study conducted in Singapore on WFH revealed that the biggest challenge was the inability to leave work after working hours, insufficient social interaction with work associates and difficulty of obtaining trust in a working relationship (Mathews et al 2022). A study conducted in Australia had also reported that 17.5% of their employees during COVID 19 had increased their working hours when WFH (Biddle et al 2020). Some other challenges of WFH in India includes managing teams, lag in service delivery, requiring resources and training in IT, requiring softwares to enable WFH and that some employees’ homes were uncomfortable, unsuitable, and disruptive (Afrianty et al 2022). However, in Europe, the main benefits of WFH consists of work life balance, improved work efficiency and greater work control while the drawbacks include work uncertainties, home office constraints and inadequate tools (Ipsen et al 2021). This differs from past studies where benefits of WFH includes better work life balance. This may be because the transition of home into a work environment has brought work loads into homes and free times to work, inhibiting work life balance of individuals (Vyas 2022). Given the advantages and disadvantages of WFH, these may be reasons to why individuals like or dislike HW.
2.2 Advantages and Disadvantages of Hybrid Working
The sampling method used in this study was based on non probability sampling, where there is no random selection in the sample selected and the selection was based on the researcher’s subjective judgment (Berndt 2020). In this study, the method adopted involves snowball sampling by reaching out to contacts working in the industry through Google Forms. Past studies of snowball sampling had revealed that participants in the sample grow with time and this method is used when researchers had difficulty reaching to desired population (Sedgwick 2013). The primary data collection tool utilised for this research is survey questionnaires (Draugalis et al 2008). This study was approved by the Department Ethics Review Committee before data was obtained.
173 Proceedings of the PAQS Congress 2022, 12th 13th September 2022, Singapore Institute of Surveyors and Valuers, Singapore WFH (Danker et al 2022). In another study conducted in South Africa, it was found that males find WFH more conducive as woman may be the main caregiver and that she may be required to care for the family, thereby positioning WFH as less favourable (Sucheran and Olanrewaju Research2021). on HW had also highlighted that due to flexible work arrangements, certain employees may think that they are more productive as they can better manage their time and location while others may have trouble WFH due to disruptions from their family or children at home (Vyas 2022). According to research conducted on 16,000 employees at Ctrip, a NASDAQ listed financial services company from Shanghai, it was reported that a 13% increase in performance was observed when employees WFH (Bloom et al 2015). The firm had also attained increased productivity within 20% to 30% and economise $2,000 per year for each WFH employee (Bloom et al 2015). This finding aligns with past studies that reported how WFH can increase productivity (Prasetyaningtyas et al 2021, Vyas 2022). Although studies had reported that remote working increase efficiency and lowers burnout risk, there were also papers that highlight reduced productivity in females and those with lower pays within the United Kingdom (Kitagawa et al 2021). It was reported that the declined mental well being was strongly associated with decreased productivity (Kitagawa et al 2021). Furthermore, Wang et al (2021) had found that in remote working, reduced productivity was observed when participants procrastinate, cyberloaf and were less disciplined. When comparing against gender, it was found that females were likely to have lower work productivity when WFH (Feng and Savani 2020). In contrast to past literature reviews, Afonso et al (2021) and Nayak and Pandit (2021) had reported that male teleworkers had lower productivity. However, a study conducted in Singapore found that gender is not a significant factor (Danker et al 2022), which contrasts with the aforementioned research.
Empirical research reported that although work life balance does not positively impact employeeproductivity, WFHhas positiveimpacts onjob satisfaction,whichimpacts employee productivity positively (Prasetyaningtyas et al 2021). Past research had also highlighted that there was a positive and strong correlation between work conduciveness and productivity (Danker et al 2022). The research reported lower productivity and conduciveness levels for male non caregiver while a survey conducted by Deloitte reported that females can better habituate and were more content when WFH (Danker et al 2022). However, these may be subjective (Deole et al 2021). In Japan, WFH productivity was reported to be lower than the working from office (Morikawa 2022). As the research conducted were on general professions where there was little research conducted on HW for the QS profession in Singapore, to fill the research gap, this study will use conduciveness and productivity levels of Singapore QS to examine their attitudes towards HW. 3 Methodology
Q5h. How conducive is your OFFICE working environment?
Question Number Question Q5g. How conducive is your HOME working environment?
A 5-Point Likert scale ranging from 1 (Very unproductive) to 5 (Very productive) and 1 (Very unconducive) to 5 (Very conducive) were used in this study to measure self perceived productivity and conduciveness in home and office environments respectively. This scale method was obtained from past survey questionnaires determining teleworking characteristics (Nakrošienė et al 2019, Tejero et al 2021). This method was similarly employed in a study conducted on Singapore teleworkers to measure their productivity levels on a 5 Point Likert scale (Danker et al 2022). As such, both productivity and conduciveness scales employed this 5 Point Likert scale even though the conduciveness of working environments was classified under productivity level in other papers (Danker et al 2022). Qualitative data on 1) areas of improvement for HW and 2) whether would HW help to attract and retain talents in the QS sector were also collected. Although many had indicated HW is useful in retaining and attracting QS, due to the page limits, the qualitative data findings will not be discussed in this paper.
174 Proceedings of the PAQS Congress 2022, 12th 13th September 2022, Singapore Institute of Surveyors and Valuers, Singapore
4 Findings and Discussion
This section discusses the findings of the study based on the survey collected from Full Time QS working in Singapore.
Table 1. List of questions in survey for QS to indicate Level of Agreement using a 5 Point Likert Scale from “Very unconducive” (1) to “Very conducive” (5) and “Very unproductive” (1) to “Very productive” (5) respectively
The attitudes measured in the study includes the top 3 reasons in descending order for liking and/or disliking HW, conduciveness of home and/or office work environments, as well as their productivitylevels when working from homeand/oroffice.Thet test was usedfor significance testing. The Jeffreys Awesome Statistics Package (JASP) was used in this study to generate the various tests results (Kelter 2020) as it was used in previous studies for involving t tests, ANOVAs, contingency table analysis and linear regression models (Love et al 2019). Several past studies have also used JASP in their research (Han et al 2018, Kelter 2020, Kovari 2018, Love et al 2019). In addition, the open source nature of JASP allows for comprehensive statistical analysis without having to incur software costs in the study. In this study, QS from government agencies and private QS companies were engaged in the survey. The age of these participants ranges from 24 to 65 years old. The survey consisted of demographic questions and questions relating to their attitudes towards HW. This includes obtaining the top 3 reasons of liking and top 3 reasons of disliking HW, as well as obtaining their conduciveness and productivity levels when engaging in HW through a 5 Point Likert scale. Table 1 shows the list of questions for HW within the survey.
Q5j. In your opinion, what is your productivity when working in the OFFICE?
A total of 43 survey results were collected from QS in Singapore. After data cleaning, a total of 31 out of 43 participants’ survey response were used for analysis on HW factors. Only these 31 participants (72.1%) response were valid as they have engaged in HW in the past 6 months. Based on the survey results collected, 22 out of these 31 QS respondents (71%) selected “Hybrid Working” as their preferred working environment. This result illustrates that most QS
Q5i. In your opinion, what is your productivity when working from HOME?
4.1 Overview
H1 QS attitudes on Conduciveness is significantly affected by Gender.
Hypothesis Description
H2 QS attitudes on Productivity is significantly affected by Gender.
4.2.1
Past studies had conducted independent sample t tests to evaluate perceived effectiveness of WFH with gender for workers WFH in Singapore and it was found thatthere was no significant difference obtained between male and female workers (Danker et al 2022). However, in our study, we found that females perceive their homes to be more conducive and productive than males. Frequency tables (refer to Tables 3 to 6) were used to list the top 5 reasons for liking and disliking HW for the respective gender in the following sub sections.
Gender and Top 3 Reasons for Liking/Disliking Hybrid Work
The main top 3 reasons for Liking HW for both genders were firstly, reduced transportation hours, secondly, flexibility, and thirdly, reduced expenses. Table 3 illustrates the frequency table for females who Like HW. The top 3 reasons were reduced transportation hours, flexibility, and reduced expenses. Table 4 shows the frequency table for males who Like HW. The top 3 reasons were firstly, reduced transportation hours, flexibility, and better time management.Fromthefrequencytables,weobservedthatforbothfemaleandmale,QShaving reduced transportation hours and flexibility in HW were the critical first and second reasons for their favour towards HW. The third reason for liking HW varies amongst gender where females tend to like HW due to reduced expenses on matters such as reduced transportation costs. In contrast, males find that they had better time management when engaging in HW. Comparing to the total top 3 reasons of liking HW and that as the sample skewed towards females, the reasons obtained for liking HW are skewed towards reduced transportation hours, flexibility, and reduced expenses.
Factors Frequency Reduced Transportation Hours 14 Flexibility 7 Reduced Expenses 7 More Rest Hours 4 More Time for Family 3 Table 3. Frequency of Females Liking HW Factors Frequency Reduced Transportation Hours 5 Flexibility 5 Better Time Management 3 Lower Exposure to COVID 19 2 Socialising 2 Table 4. Frequency of Males Liking HW
175 Proceedings of the PAQS Congress 2022, 12th 13th September 2022, Singapore Institute of Surveyors and Valuers, Singapore prefer HW as compared to the other work models. As past studies had found significant differences between the different genders and their productivity and conduciveness level, our study also explores if there is a significance between QS Gender and their attitudes in the context ofSingapore.Hence,thefollowing hypotheses weredevelopedforthevariousattitudes towards HW (refer to Table 2).
Table 2. Summary of Hypotheses
4.2 Gender and QS Attitudes
176
This is consistent with Danker et al (2022) where the majority of surveyed respondents in Singapore appreciated the reduced cost and time saved on transportation. This was similar to the reasons found from our study on liking HW. The advantages of WFH such as time flexibility and reduced transportation hours from past study also supports the reasons why QS in Singapore likes HW (Afrianty et al 2022). While the general top 3 reasons for Liking HW consists of reduced transportation hours, flexibility and reduced expenses, respondents may like HW because of its advantages.
Factor Frequency Longer working hours 6 Work environment issues 3 Socialising issues 2 IT issues 2
Findings from Mathews et al (2022) revealed that the top 3 challenges for WFH in Singapore includes “Not being able to unplug from work after working hours”, “Lack of social interaction with colleagues” and “Developing mutual trust between employer and employee”. While the general top 3 reasons for Disliking HW in our research includes longer working hours, socialising issues and work environment issues, the findings by Mathews et al (2022) supports
The main top 3 reasons for Disliking HW for both genders are firstly, longer working hours, secondly, socialising issues and thirdly, work environment issues. Table 5 illustrates the frequency table for females who Dislike HW. The top 3 reasons were socialising issues, communication issues and longerworking hoursas well as transportationissues. Table6shows the frequency table for males who Dislike Hybrid Working. The top 3 reasons were longer working hours, work environment issues, socialising/IT issues. In general, the responses for top 3 reasons for disliking HW were lesser as compared to liking HW. From the frequency tables, we found that for both female and male respectively, longer working hours and socialising issues were their main reasons towards disliking HW. However, the number of males who found socialising important were less as compared to females. This might be due to more responses collected from females. While females find communication, work life balance and transportation issues factors that caused them to dislike HW, the reason for males are the work environment and IT issues. This might be because female QS prefers more interaction and reduced transportation to better cater work life balancing while engaging in HW. As compared to the total top 3 reasons for disliking HW, longer working hours and socialising issues were the main factors for both genders. However, as the sample is more skewed towards female participants, factors such as communication issues occurred more frequently in females than males. Moreover, due to the skewed sample, work environment issue was ranked second for males but fifth for females.
Proceedings of the PAQS Congress 2022, 12th 13th September 2022, Singapore Institute of Surveyors and Valuers, Singapore
Factor Frequency Socialising issues 6 Communication issues 4 Longer working hours 4 Transportation issues 4 Work environment issues/ Inconvenient/ Work life balance issues 3 Table 5. Frequency of Females Disliking HW
Communication issues/ Work life balance issues/ Less flexibility/ Long screen hours/ Less productive/ Too many meetings in a day/ Psychological problems/ Difficulty in managing staffs 1 Table 6. Frequency of Males Disliking HW
4.2.4
4.2.3
Thefindingsfromthisstudymainlydepictsthatgenderwillnotsignificantlyaffecttheattitudes of QS. The survey results in Table 9 also show that on average, for both genders, QS had a perceived working conduciveness of 3.87 when working from home as compared to working from office (office productivity of 3.81). Additionally, when comparing the average perceived
Gender Hypothesis p value Female Productivity of home is significantly different from office at 5% level of significance 0.158 Male 0.792 Table 8. Female and Male Productivity
4.2.2
Average Perceived Conduciveness and Productivity
In this study, a one tailed t test was used to test the hypothesis of gender against the conduciveness of home and/or office working environments. The test results of females and males on the conduciveness of work environment are shown in Table 7. The results shows that conduciveness of home is not significantly different from office at a 5% level of significance for females at p = 0.135. Similar results were obtained between males and the conduciveness ofworking environment where conduciveness ofhomeis not significantlydifferent from office at a 5% level of significance for males at p = 0.827.
Gender Hypothesis p value Female Conduciveness of home is significantly different from office at 5% level of significance 0.135 Male 0.827
Gender and Conduciveness of working environment
177 Proceedings of the PAQS Congress 2022, 12th 13th September 2022, Singapore Institute of Surveyors and Valuers, Singapore our findings on disliking WFH. As people find it challenging to unplug from work after work hours while WFH, participants may dislike HW due to the increase of their working hours. The analysis of our findings can be supported by a study conducted in Australia where 17.5% of the employees had their working hours increased when engaging in WFH during COVID 19 (Biddle et al 2020). A survey collected in South Africa had also supported our findings where 52% of their respondent strongly agreed with long working hours being a disadvantage of remote working (Sucheran and Olanrewaju 2021). Participants in our survey had also mentioned socialising issues which includes not being able to socialise with people in the workplace and not getting much interactions with colleagues. This was also aligned with the study conducted in Singapore on another challenge of WFH lack of interaction with their work associates (Mathews et al 2022). From the data collected on reasons of liking and disliking HW and with most of the QS preferring to work in a hybrid environment, the Hybrid WorkModel shouldbe adoptedas it reaps onthebenefits of WFH and working from the office, as well as reducing the negative impacts of WFH.
Gender and Productivity
Table 7. Female and Male Conduciveness
It was observed in Table 8 that for females, the productivity when working from home was not significantly different from office at a 5% level of significance at p = 0.158. Similar results were obtained for male productivity where working from home was not significantly different from office at a 5% level of significance at p = 0.792.
178 Proceedings of the PAQS Congress 2022, 12th 13th September 2022, Singapore Institute of Surveyors and Valuers, Singapore
Average 3.87 3.81 3.94 3.84
Table 9. Average Perceived Conduciveness and Productivity for Both Genders using a 5 Point Likert Scale from “Very unconducive” (1) to “Very conducive” (5) and “Very unproductive” (1) to “Very productive” (5) respectively Gender
ConducivenessAverage(Home) ConducivenessAverage(Office) ProductivityAverage(Home) ProductivityAverage(Office)
Female 4.05 3.75 4.10 3.80 Male 3.55 3.91 3.64 3.91 p value 0.06 0.71 0.04 0.58
Dockery and Bawa (2018) had found that WFH is conducive for families. However, scientists WFH reported unconducive working environments as the work was practice oriented (Liu 2020). When comparing conduciveness of remote working with gender, Danker et al (2022) mentioned no difference in work conduciveness was found between the female and male caregivers. Results in Danker et al (2022) support our findings where statistically insignificant data was observed for conduciveness amongst genders (refer to Table 7). However, in contrary to our findings, Sucheran and Olanrewaju (2021) found males WFH conducive, and this may be because males are not the main caregiver.
ConducivenessAverage(Home) ConducivenessAverage(Office) ProductivityAverage(Home) ProductivityAverage(Office)
Table 10. Average Perceived Conduciveness and Productivity for Respective Genders using a 5 Point Likert Scale from “Very unconducive” (1) to “Very conducive” (5) and “Very unproductive” (1) to “Very productive” (5) respectively
productivity, working from home is 3.94 while working from office is 3.84. When comparing against the different gender, it was found that females had an average perceived conduciveness of 4.05 while males had an average perceived conduciveness of 3.55 when WFH. The average perceived conduciveness of females and males working in the office is 3.75 and 3.91 respectively. While the average perceived productivity of females and males WFH is 4.10 and 3.64 respectively and working from office is 3.80 and 3.91 respectively. These are shown in Table 10.
The results from Tables 9 and 10 indicate that on average, as compared to males, female QS perceived their homes to be more conducive and productive than their offices. The study found that female productivity for working from home is statistically different from males at p value, 0.04. Whencomparing within thesamegender,therewerenostatistically significant difference found between home and office work environment for perceived productivity and conduciveness (refer to Table 7 and 8).
Although Prasetyaningtyas et al (2021) and Vyas (2022) reported that WFH can increase productivity, the statistically insignificant results (refer to Table 8) when comparing within the same gender on productivity from our study agrees with Danker et al (2022) where the effects of remote working on productivity, satisfaction and health were insignificant for gender. However, the results on perceived productivity for females is found to be statistically higher when WFH as compared to working in office (refer to Table 10). As compared to males, the productivity averages of working from home is higher for females. This is consistent with findings from Afonso et al (2021), which reported lower productivity for male teleworkers when compared to females. This ran contrary to Nayak and Pandit (2021) where they reported
4.3 Sector Analysis Table 11 illustrates additional t tests on additional variables to examine the significance between gender and environment. It was found that only Gender and Home Conduciveness as wellasProductivityinthePrivateSectorhadsignificantresultswhilegovernmentsectorresults were not applicable due to the small sample size collected. In the private sector, conduciveness does not statistically vary between home and office at a 5% significance level. It was found that using a one tail t test, females have significantly higher conduciveness score than males when WFH at a 5% significance level (p value = 0.048). Conversely, when comparing the conduciveness of office environment, it was found that female conduciveness is not significantly higher than males (p value = 0.649). In the private sector, productivity also does not significantly vary between home and office (p value = 0.860). Similar to the results on conduciveness, the productivity of females in the private sector has significantly higher productivity scores than males for the home when using a one tail test (p value = 0.032). Subsequently, it was found that females do not have significantly higher productivity scores than males in the office environment (p value = 0.558).
179 Proceedings of the PAQS Congress 2022, 12th 13th September 2022, Singapore Institute of Surveyors and Valuers, Singapore male telecommuters can better achieve desired productivity than females and that female telecommuter who are single have the least productivity. Afonso et al (2021) had explained that disadvantages of teleworking may be reasons leading to the low productivity of male Inteleworkers.general,a HW arrangement which combines both WFH and working at office may apply to Singapore QS since none selected the option “Unproductive” in the survey when working from either of the two environments. Moreover, on average, female QS perceived their homes to be more productive and conducive than their offices while males find working at office to be more productiveandconducivethanWFH.Althoughthe productivityoffemalesWFHisstatistically higher than males (refer Table 10), this may be subjective. While past research reported higher productivity for teleworkers WFH (Afrianty et al 2022), another study reported higher productivity when working from the office (Morikawa 2022). For instance, Morikawa (2022) reported that in Japan, WFH productivity is lower than when working from office. Therefore, those with higher productivity WFH should engage in WFH more while others with higher productivity working from office should work more in the office. This was also supported by Beck and Hensher (2021) whereit was reportedthat HWis dependent onthe job’snature. Vyas (2022) also agrees that WFH is highly dependent on the employee’s task. As such, a HW arrangement that allows employees to choose the dates to work in office and WFH may be useful in improving their productivity levels. Furthermore, findings from Wang et al (2021) had revealed that procrastination, cyberloafing and being less disciplined reduce productivity of surveyed participants in remote working. However, our findings based on the data collected from QS in Singapore showed that remote working does not significantly affect their productivity when comparing within the same gender (refer to Table 8). In fact, the average productivity of females working from home in our study is higher than the productivity of working from office (refer to Table 10). As the results may be due to individual factors, the working environment may not be a factor which influence their productivity and that most QS can be productive in both environments.
While most of the findings in this paper were mostly statistically insignificant, it was observed
5 Conclusion In conclusion, QS surveyed in Singapore prefer HW due to its WFH benefits such as reduced transportation hours, flexibility, and reduced expenses. However, the drawbacks of HW such as longer working hours, socialising issues and communication issues should not be ignored. When comparing within the same gender, there was no significant difference observed in perceived conduciveness and productivity between the home and office work environment.
180 Proceedings of the PAQS Congress 2022, 12th 13th September 2022, Singapore Institute of Surveyors and Valuers, Singapore Factor Environment Hypothesis p-value Conduciveness
As no research was conducted on caregiving duties in this study, the results of higher conduciveness level of females being at home in this study (refer to Table 10) may be because female QS are not the primary caregiver, and no caregiving duties were required at home.
Table 11. Conduciveness and Productivity of Females and Males in Home or Office Environments within the Private Sector
The results in this study also show that on average, males had lower productivity level when working from home (refer to Table 10). Our findings were contrary to Feng and Savani (2020) where they found that females WFH are likely to have lower productivity. The results obtained in this study may be because male QS may not require caregiving duties as past studies of male non caregivers were reported to have similar lower productivity and conduciveness environment (Danker et al 2022). Reasons such as Internet connectivity and noise levels may also be factors that influence one’s conduciveness when WFH (Sucheran and Olanrewaju 2021). Further research may be conducted in this field to explore the significance of caregiver duties of QS and the effects on the work environment they are in.
Home Perceived conduciveness of home for females is significantly higher than males at a 5% level of significance. 0.048 Office Perceived conduciveness of office for females is significantly higher than males at a 5% level of significance. 0.649 Productivity Home Perceived productivity of home for females is significantly higher than males at 5% level of significance 0.032 Office Perceived productivity of office for females is significantly higher than males at 5% level of significance 0.558
In Tables 7 and 8, it was observed that there were no significant results obtained in the same gender when comparing home against office conduciveness and productivity levels. When comparing against different genders (refer to Table 11), significant results were found in females for both conduciveness and productivity when they WFH. Our findings in Table 11 illustrate that females perceiving their homes to be more conducive and productive than males disagree with a study conducted in South Africa revealing males find WFH more conducive than female (Sucheran and Olanrewaju 2021). In contrast to Sucheran and Olanrewaju (2021), our study agrees with Danker et al (2022) where significant results were obtained between conduciveness of home environment and gender. It reported that male non caregivers find WFH significantly less conducive than females while the non caregivers have significantly higher conduciveness when engaged in WFH as compared to caregivers (Danker et al 2022).
Beck, M. J., and Hensher, D. A. (2021). What might the changing incidence of Working from Home (Wfh) tell us about future transport and land use agendas. TransportReviews, 41(3), 257 261. https://doi.org/10.1080/01441647.2020.1848141
181
In general, the results provide deep insights on employees' work preference, and this can better allow employers to understand QS employees, thereby attracting or retaining them in the industry. In all, the future work arrangements could utilise these results to better retain talents in the built environment industry. Moving ahead, companies may consider adopting Hybrid Work Model as it is a preferred work arrangement for majority of the QS (71%), and it reaps the benefits of WFH and working at office.
Acknowledgement
Proceedings of the PAQS Congress 2022, 12th 13th September 2022, Singapore Institute of Surveyors and Valuers, Singapore that women perceived the home environment to be more conducive and productive than men at a5%level ofsignificance.Results from thestudy areconsistent with some studies forgender and productivity. There were limitations faced in this study, which includes the low sample size obtained from the government sector. Another limitation lies in the small sample size obtained which is not representative of all QS professionals in Singapore. Furthermore, a relatively small amount ofdatawas obtained from government sectorQS andthathaveresulted in the inability to generate useful data for the study, but could be an option for future work as the sample size increases. Time was also one of the limitations towards obtaining more information for the study.
We would like to express our gratitude to Quantity Surveyors and Contract Managers for participating in the survey and all those who helped to make this paper possible.
Berndt, A. E. (2020). Sampling methods. Journal of Human Lactation, 36(2), 224 226. Biddle,https://doi.org/10.1177/0890334420906850N.,Gray,M.,Jahromi,M.,andMarasinghe, D. (2020). Changes in paid and unpaid activities during the COVID 19 pandemic: Exploring labour supply and labour demand. Https://Csrm.Cass.Anu.Edu.Au/Research/Publications/Changes Paid and Unpaid Activities during Covid 19 Pandemic Exploring Labour https://openresearch Bloom,repository.anu.edu.au/handle/1885/213187N.,Liang,J.,Roberts,J.,andYing,Z. J. (2015). Does working from home work? Evidence from a chinese experiment *. The Quarterly Journal of Economics, 130(1), 165 218. https://doi.org/10.1093/qje/qju032
6
7 References Afonso, P., Fonseca, M., and Teodoro, T. (2021). Evaluation of anxiety, depression and sleep quality in full time teleworkers. Journal of Public Health, fdab164. Afrianty,https://doi.org/10.1093/pubmed/fdab164T.W.,Artatanaya,I.G.,andBurgess, J. (2022). Working from home effectiveness during Covid-19: Evidence from university staff in Indonesia. Asia Pacific Management Review, 27(1), 50 57. https://doi.org/10.1016/j.apmrv.2021.05.002
Grzegorczyk,2020-0202M., Mariniello, M., Nurski, L., and Schraepen, T. (2021). Blending the physical andvirtual:Ahybridmodelforthefuture ofwork (Research Report No. 14/2021). Bruegel Policy Contribution. https://www.econstor.eu/handle/10419/251067
Han, H., Park, J., and Thoma, S. J. (2018). Why do we need to employ Bayesian statistics and howcan we employit in studies ofmoral education?: Withpractical guidelinesto use JASP for educators and researchers. Journal of Moral Education, 1 19. Hosseini,https://doi.org/10.1080/03057240.2018.1463204M.R.,Zavadskas,E.K.,Xia,B.,Chileshe,N.,andMills,A.(2017).Communications in Hybrid Arrangements: Case of Australian Construction Project Teams. Engineering Economics, 28(3), 290 300. https://doi.org/10.5755/j01.ee.28.3.13791
182 Proceedings of the PAQS Congress 2022, 12th 13th September 2022, Singapore Institute of Surveyors and Valuers, Singapore
020
Kitagawa, R., Kuroda, S., Okudaira, H., and Owan, H. (2021). Working from home and productivity under the COVID-19 pandemic: Using survey data of four manufacturing firms. PLOS ONE, 16(12), e0261761. https://doi.org/10.1371/journal.pone.0261761
Ipsen, C., van Veldhoven, M., Kirchner, K., and Hansen, J. P. (2021). Six key advantages and disadvantages of working from home in europe during covid 19. International Journal of Environmental Research and Public Health, 18(4), 1826. Kelter,https://doi.org/10.3390/ijerph18041826R.(2020).AnalysisofBayesianposterior significance and effect size indices for the two sample t test to support reproducible medical research. BMC Medical Research Methodology, 20(1), 88. https://doi.org/10.1186/s12874 00968 2
Dockery, A. M., and Bawa, S. (2018). When two worlds collude: Working from home and family functioning in Australia. International Labour Review, 157(4), 609 630. Draugalis,https://doi.org/10.1111/ilr.12119J.R.,Coons,S.J.,andPlaza, C. M. (2008). Best practices for survey research reports: A synopsis for authors and reviewers. American Journal of Pharmaceutical Education, 72(1), 11. https://doi.org/10.5688/aj720111
Dingelhttps://doi.org/10.2139/ssrn.3792236J.I.,andNeimanB.(2020).How
Deole, S. S., Deter, M., and Huang, Y. (2021). Home sweet home: Working from home and employee performance during the covid 19 pandemic in the uk. SSRN Electronic Journal
Feng, Z., and Savani, K. (2020). Covid 19 created a gender gap in perceived work productivity and job satisfaction: Implications for dual career parents working from home. Gender in Management: An International Journal, 35(7/8), 719 736. https://doi.org/10.1108/GM 07
Danker, T. N., Yap, H. L., Zalzuli, A. D., Ho, H. F., and Ang, J. (2022). Surviving work from home: Observations from singapore. Journal of Police and Criminal Psychology, 37(2), 407 422. https://doi.org/10.1007/s11896 021 09461 y
Eagly, A. H., and Chaiken, S. (2007). The advantages of an inclusive definition of attitude. Social Cognition, 25(5), 582 602. https://doi.org/10.1521/soco.2007.25.5.582
many jobs can be done at home? Journal ofPublic Economics, 189, 104235. https://doi.org/10.1016/j.jpubeco.2020.104235.
183
Nakrošienė, A., Bučiūnienė, I., and Goštautaitė, B. (2019). Working from home: Characteristics and outcomes of telework. International Journal of Manpower, 40(1), 87 101. https://doi.org/10.1108/IJM 07 2017 0172 Nayak, S., and Pandit, D. (2021). Potential of telecommuting for different employees in the Indian context beyond COVID 19 lockdown. Transport Policy, 111, 98 110. https://doi.org/10.1016/j.tranpol.2021.07.010
Lenka, D. R. (Mahapatra). (2021). Unique Hybrid Work model The future of remote work. PalArch’s Journal of Archaeology of Egypt / Egyptology, 18(7), 2687 2697. Lim,https://archives.palarch.nl/index.php/jae/article/view/8694K.(26April,2022).
Love, J., Selker, R., Marsman, M., Jamil, T., Dropmann, D., Verhagen, J., Ly, A., Gronau, Q. F., Šmíra, M., Epskamp, S., Matzke, D., Wild, A., Knight, P., Rouder, J. N., Morey, R. D., and Wagenmakers, E. J. (2019). JASP: Graphical Statistical Software for Common Statistical Designs. Journal of Statistical Software, 88(2), 1 17. Mathews,https://doi.org/10.18637/jss.v088.i02M.,Phoa,F.,Hou,M.,andLim, E. (2022). ATTITUDES TOWARDS WORK AND WORKPLACE ARRANGEMENTS AMIDST COVID 19 IN SINGAPORE [IPS Working Papers No. 45, National University of Singapore]. https://lkyspp.nus.edu.sg/docs/default source/ips/working paper 45_attitudes towards work and workplace arrangements amidst covid 19 in singapore MinistryofManpower.(24May,2021). IncreasedEnforcementofSafeManagementMeasures at Workplaces during Phase 2 (Heightened Alert). Retrieved from Ministry of Manpower: https://www.mom.gov.sg/newsroom/press releases/2021/2405 increased enforcement of smm at workplaces during phase 2 %20so.alert#:~:text=Under%20the%20latest%20advisory%20for,from%20home%20must%20doheightened Morikawa, M. (2022). Work‐from‐home productivity during the COVID‐19 pandemic: Evidence from Japan. Economic Inquiry, 60(2), 508 527. https://doi.org/10.1111/ecin.13056
Proceedings of the PAQS Congress 2022, 12th 13th September 2022, Singapore Institute of Surveyors and Valuers, Singapore Kovari,A. (2018).Using JASP in statistical evaluation basedonan eye-tracking analysis. 2018 9th IEEE International Conference on Cognitive Infocommunications (CogInfoCom), 000237 000240. https://doi.org/10.1109/CogInfoCom.2018.8639885
Liu,20SNEF,employers%20interviewed%20by%20TODAY%20said.,Majority%20of%20firms%20to%20keep%20hybrid%20work%20approach%2C%20as%1882486#:~:text=AdvertisementK.C.(2020).Scientificlossesandgainsduringthecovid19shutdown.
AmericanJournal of Ophthalmology, 220, A7. https://doi.org/10.1016/j.ajo.2020.07.018
Majority of firms to keep hybrid work approach, as SNEF advises against reverting to pre pandemic arrangements. Retrieved from Mediacorp Pte Ltd, Today: https://www.todayonline.com/singapore/most firms hybrid work employees well being drop plans
F. (2021). Factors associated with work life balance and productivity before and during work from home. Journal of Occupational & Environmental Medicine, 63(12), 1065 1072. Vyas,https://doi.org/10.1097/JOM.0000000000002377L. (2022). “New normal” at work in a post COVID world: Work life balance and labor markets. Policy and Society, 41(1), 155 167. https://doi.org/10.1093/polsoc/puab011
Wang, B., Liu, Y., Qian, J., and Parker, S. K. (2021). Achieving effective remote working during the covid‐19 pandemic: A work design perspective. AppliedPsychology, 70(1), 16 59. https://doi.org/10.1111/apps.12290
Singapore Institute of Surveyors and Valuers. (2022). About Quantity Surveying. Retrieved from Singapore Institute of Surveyors and Valuers: https://www.sisv.org.sg/qs about.aspx
184 Proceedings of the PAQS Congress 2022, 12th 13th September 2022, Singapore Institute of Surveyors and Valuers, Singapore Prasetyaningtyas, S. W., Heryanto, C., Nurfauzi, N. F., and Tanjung, S. B. (2021). The effect of work from home on employee productivity in banking industry. Jurnal Aplikasi Manajemen, 19(3), 507 521. https://doi.org/10.21776/ub.jam.2021.019.03.05
Raghavan, A., Demircioglu, M. A., and Orazgaliyev, S. (2021). Covid 19 and the new normal of organizations and employees: An overview. Sustainability, 13(21), 11942. Sedgwick,https://doi.org/10.3390/su132111942P.(2013).Snowballsampling.
BMJ, 347, f7511. https://doi.org/10.1136/bmj.f7511
Sucheran, S., and Olanrewaju, O. A. (2021). The Effect of Remote Working on Employees Productivity Levels in South Africa. Proceedings of the International Conference on Industrial Engineering and Operations Management Rome, Italy, 13. Tejero,http://ieomsociety.org/proceedings/2021rome/313.pdfL.M.S.,Seva,R.R.,andFadrilanCamacho,V.F.
The Hong Kong Institute of Surveyors; City University of Hong Kong, China Seki Ka Ching CHAN, kcchan527 c@my.cityu.edu.hk City University of Hong Kong, China Dharma Angkasa ANGKY, angky2cv@yahoo.co.uk
Royal Institution of Surveyors Malaysia; University College Sedaya International, Malaysia Abstract Under the Digital Age, the industry has to shift from traditional practices to a new practice centered on digital technologies, whereas this phenomenon is known as digitalization.
Mohamed HUMDHAN, humdhan.mohamed@utamacon.com.bn
Identification of Digitalization Characteristics for the Surveying PracticesacrossthePAQSCountryMembers
China Engineering Cost Association; Beijing University of Civil Engineer and Architecture, China Nadzirah Binti ZAINORDIN, nadzirah@ucsiuniversity.edu.my
185
Florence Yean Yng LING, bdglyy@nus.edu.sg
The Building Surveyor’s Institute of Japan, Japan Hong ZHANG, zhanghong@bucea.edu.cn
University of Cape Town, South Africa Haelly HAMID, haelly.hamid@rayya.id Ikatan Quantity Surveyors Indonesia, Indonesia
National University of Singapore; Singapore Institute of Surveyors and Valuers, Singapore Masato YOKOZAWA, yokozawa.masato@obayashi.co.jp
Proceedings of the PAQS Congress 2022, 12th 13th September 2022, Singapore Institute of Surveyors and Valuers, Singapore
Pertubuhan Ukur, Jurutera dan Arkitek, Negara Brunei Darussalam, Brunei
viaanInterviewSurvey Mei yung LEUNG, (corresponding author) bcmei@cityu.edu.hk
Quantity surveyors are the key party involved in the construction sector, and their existing
Ikatan Quantity Surveyors Indonesia, Indonesia Paul BOWEN, paul.bowen@uct.ac.za
2 Literature Review
2.1 Practices of Quantity Surveyors
Quantity surveyors are the cost managers of construction projects with competent understanding towards all aspects of construction across the life cycle of a building, as well as strong capabilities to deal with cost, quality and value matters with varying client needs (RICS, 2018). In the construction projects they play a vital role in preparing feasibility studies, development economics analyses, cost planning and control, estimation, valuation, procurement, contract documentation and administration, project and financial management, life cycle costing, and dispute settlements (Dada and Jagboro, 2012).
The construction industry is known as one of the most information-intensive industries (Toole, 2003). Across the life cycle of a construction project, from inception to demolition, all participants involved are information reliant (Baldwin et al, 1999). A plethora of documents and technical data are involved in every construction stage, which emphasizes the importance of information communication among project team members to achieve effective collaboration and deliver asatisfactory project outcome. Theindustryis still heavilyreliant onthetraditional means of communications (Mohamed and Stewart, 2003), resulting in low productivity and poor project management (Wu et al, 2017). With application of modern information technologies, digitalization is considered as a potential solution to facilitate the exchange and management of information (Rivard et al, 2004).
Keywords characteristics, digitalization, performance, quantity surveyor, software.
Digitalization refers to the intensive changes within the economy and society brought about by the creeping uptake and amalgamation of digital technologies, including information and
Whiletheconstructionindustryisembracingdigitalization,therolesofquantitysurveyorshave to be diversified covering various management techniques such as cost and financial management, risk management, project management, and construction management in order to keep pace with rapid changing technologies in the industry (Chandramohan et al, 2022). As new challenges and opportunities are emerging, quantity surveyors must be equipped with new skills and competencies to confront them (Dada and Jagboro, 2012).
186 Proceedings of the PAQS Congress 2022, 12th 13th September 2022, Singapore Institute of Surveyors and Valuers, Singapore practices may alter under digitalization. This study identifies the characteristics of digitalization and the relevant construction project performance. An international interview survey was conducted in Brunei, China, Hong Kong, Indonesia, Japan, Singapore and South Africa. A total of 26 variables were investigated through the survey, including 16 digital variables and 10 performance variables. The digital variables were further sub divided into four dimensions: Work Preparation, Information Updating, Information Presentation, and Information Exchange. At the same time, the performance variables were categorized into two groups: Process Performance, and Final Performance. The results can be used to understand the current practices of digitalization in the industry across the countries in the Pacific Asia.
As a result, a more advanced practice of quantity surveying can be suggested. An ongoing large scale survey of current practice is stongly recommended.
1 Introduction
2.2 Digitalization
4.1 Software Application Results showed that certain software could attain a high level of continuity, as they were in use across various development stages. For instance, Singapore applied Revit and South Africa used QSPlus from Design to Tendering stages. Indonesia relied on Glodon products for Design, Estimation, Tendering, and Construction tasks. South Africa utilized DimensionX from Design to Construction stage, while both Indonesia and Singapore used iTWO costX. From Estimation to Construction stages, Buildsoft, Vico Office and Cubit Estimating were applied in Brunei, Hong Kong and Singapore respectively. Across Estimation to Maintenance stages, Japan relied on their in house systems while South Africa applied WinQS. BuildSpace was adopted in Brunei from Tendering to Maintenance stages. Last but not least, Microsoft Excel is the most popular software in all development stages for all countries. Nevertheless, China preferred not keeping the same software in use. It was also notable that only Hong Kong respondents mentioned cloud computing software during Construction stage, which should be one of the dominant innovations in digitalization.
4.2 Digitalization Characteristics
A total of 26 variables were identified and categorized into six major aspects. They are sub divided into four categories (see Table 1). They follow the workflow of quantity surveyors
4 Findings and Discussion
187 Proceedings of the PAQS Congress 2022, 12th 13th September 2022, Singapore Institute of Surveyors and Valuers, Singapore communication technologies (ICT) and digital innovations (Casini, 2021). The concept of digitalization is different to digitization. Rather than converting different languages of communication into binary and computational language (Hamelink, 1997), digitalization should be rebuilding the existing operations from a new perspective with the use of digital technologies (Päivi et al, 2017). With the development of ICT, digital technologies started to emerge and entered the market of consumer electronics during the 1980s (Hamelink, 1997). With an eagerness to explore the possibilities of digital technologies and seek a more powerful system to handle information, the term ‘digitalization’ was first introduced in the North American Review in 1971 (Schallmo and William, 2018). In the 21st century, construction firms started seeing the opportunities of digital technologies when the concept of digitalization appeared in Construction 4.0. With growing popularity and a reduction in operating costs (Peansupap and Walker, 2005; Rivard et al, 2004), theindustryis nowmovingtowardsdigitalizationwith increasing digitalapplications driving the “physical to digital to physical” transformation (Craveiro et al, 2019).
3 Methodology In this exploratory study, an international interview survey was administrated to a selection of quantity surveyors and participants of digitalization in seven different PAQS member countries, namely, Brunei, China, Hong Kong, Indonesia, Japan, Singapore, and South Africa from April 2022 to August 2022. Among a total of 48 interview responses, 6 (12.5%), 5 (10.4%), 7 (14.6%), 11 (22.9%), 7 (14.6%) 4 (8.3%), and 8 (16.7%) were from Brunei (BR), China (CN), Hong Kong (HK), Indonesia (ID), Japan (JP), Singapore (SG), and South Africa (SA), respectively. The interview focused on the software used in the development stages of a project. Respondents were asked about the input and output of the software, and invited to rank its performance based on a 7 point Likert type scale (from 1: extremely poor to 7: extremely good).
Tailorability HK 3 : The flexibility is higher than other software, because you can tailor made (say, summary, list or table) by yourself.
Shareability JP 2 : Data linkage with fabricators is possible, but follow up on operational aspects (rules, etc.) is difficult.
ID 1 : It doesn’t always integrate well with design software used by architects and engineers.Table1.
Some Excerpts for the Digital Variables
Extensibility JP 4 : In house development of proprietary tools for analysis, such as plug ins, etc.
InteroperabilityHK 6 : It has little interoperability with other software
D1. Work Preparation
Simplicity SA 1 : It has kept relatively simple, relatively affordable and intuitive. It's not too difficult to learn.
Convertibility SA 8 : You measure in 2D, use the 3D system or for just the 3D modeling more for checking that you know your quants and that type of thing.
Comparability BR 1 : Assist to find discrepancies HK 1 : Hence, when we are using TAS to do tender analysis, we can use the software to do the comparison
Adaptability SG 1 : Software does not follow closely QS Practices and Procedures.
Reliability ID 1 : It is too easy for staff to rely on the software, and not consider what information is being output.
D4. Information Exchange
Note: BR Brunei; CN China; HK Hong Kong; ID Indonesia; JP Japan; SG Singapore; SA South Africa 4.2.1 Work Preparation Before the work commences, quantity surveyors have to clarify whether the software has significant prevalence in the market, whether the software is simple to use, whether the software has achieved localization matching with the needs of local quantity surveyors, and
Manifestation Key Excerpts Digitalization Characteristics
Real operabilitytime CN 2 : It can also output various types of operating data in real time on the construction sites.
Compatibility SG 2 : At this stage, the software can not show any connection to the procurement method. SA 4 : However, now it's (DimX) very much more compatible with QS plus.
Extractability CN 3 : This software mainly calculates the results by input related images and dates.
Traceability JP 2 : Difficult to manage revision history
Editability ID 1 : It can be easily modified as designs developed. SG 4 : Dependency on the software, marked up filed can only be edited in the same software.
Popularity HK 7 : Secondly, there are many BIM software in the current market, but no one actually know which software would be used in the future.
188 Proceedings of the PAQS Congress 2022, 12th 13th September 2022, Singapore Institute of Surveyors and Valuers, Singapore starting with checking the availability of software, processing information and generating new results, presenting the results, and finally passing the files on to other project participants.
JP 1 : We use AutoCAD because it is widely used in the world.
D2. Information Updating
D3. Information Presentation Classification JP 2 : Easy to use item classification and tabulation functions because the software is specialized for creating itemized statements.
Information Updating
In terms of extensibility, the findings indicated that some software was able to provide space for Application Programming Interface (API) with commensurate flexibility, while some were not (HK group). Companies would use basic interfaces for simple projects (HK group), develop in house proprietary tools including different plug ins (ID group), buy plug ins for complex projects (HK group), to obtain high extensibility and mobility during the operation.
189 Proceedings of the PAQS Congress 2022, 12th 13th September 2022, Singapore Institute of Surveyors and Valuers, Singapore whether extensions is catered for by the software. Therefore, four characteristic factors have been explored in this study, namely, popularity, simplicity, adaptability, and extensibility.
Most respondents pointed out that software in their companies could attain classification (BR, CN, HK, ID, and JP groups). However, a respondent in CN group revealed that the software needed to be improved for its function of item classification. Meanwhile, respondents mentioned less on comparability. Since providing comparison is not a major practice for quantity surveying and requires subjective opinions, involvement of software is rather less. Another characteristic is reliability. The results revealed that software with poor reliability
4.2.2
Most respondents mentioned that there was no software having huge popularity and being commonly adopted in the industry (HK, JP, ID, and SA groups). Companies were concerned about whether the software would be weeded out in the future due to low popularity (HK group). On the other hand, most respondents were satisfied with the simplicity of the software (CN, HK, ID, JP and SG groups). At the same time, some respondents claimed that the software did not relate to local quantity surveying practices and that the adaptability was low (HK and SG groups), while other respondents from the ID and SA groups thought that the functionality was already enough for their quantity surveying practice thus attaining fairly high adaptability. To achieve higher adaptability, additional investment would be required for the companies to make the software localized and best fit for company use (HK group).
After processing the information, quantity surveyors need to present the information in a clear and understandable format. The software is, thus, required to classify a large pool of data into groups (e.g., sorting, segmentation), comparebetweenseveral pieces of information,andcheck the reliability of the software operation.
Results indicated that software currently did not perform well in tailorability with the least number of excerpts mentioned by the fewest countries. Without templates or customization capabilities in the software, users have to deal with settings every time and the work efficiency will be low. Meanwhile, respondents from most of the countries mentioned that the software in their work could reach editability (HK, ID, JP, SG, and SA groups) and traceability (BR, CN HK, JP, and SA groups). However, a respondent from the SG group pointed out that poor editability existed as mark up could only be done in the same software. A respondent from the JP group also claimed that the management of revision history was difficult. Comparatively, respondents focused less on extractability and convertibility. Most respondents did not regard them as concrete functionalities but treated them as fundamental.
Tofacilitatequantity surveying practice,softwareshould beableto tailor maketemplates (e.g., BQ forms), manage the state of information being editable (e.g., lock BQ items), extract quantities from drawings/models, generate new output based on existing information, and trace the history record or state of a work item along the project lifecycle.
Information Presentation
4.2.3
simplificationProcess SA 5 : The software makes life simpler in the standard stuff. It makes life simpler where you don't need to set up a full format.
Comprehensiveness HK 5 : It can achieve the same result, but the approach is less comprehensive. SG 2 : The software can provide better performance by having a comparatively holistic perspective to present the design.
4.3 Project Performance Project performance indicators can be sub-divided into two categories: process performance and final performance. Process performance refers to the effectiveness and efficiency of processes in construction projects, while final performance refers to that of the final outcome of construction projects. Some excerpts against each variable are listed in Table 2.
communicationEffective ID 1 : Another benefit is that in the event of staff changes it is easy to handover
Respondents generally suggested that the software can digest common file formats in the market achieving a high degree of interoperability. However, respondents in the HK group mentioned that one of the software packages could only digest the files from another specific software; and one of the ID group respondents was not satisfied with the poor performance of software to integrate with other design software.
190 Proceedings of the PAQS Congress 2022, 12th 13th September 2022, Singapore Institute of Surveyors and Valuers, Singapore would run slow when handling too much information (HK and SG groups). Moreover, a respondent from the ID group preferred not to rely too much on software in order to maintain the status quo of their current quantity surveying practice.
P1. Process Performance Project managementCN 1 : Characteristic wise, it remains high guidance value for on site construction and strong controllability of project construction funds and progress with complex modeling process.
4.2.4 Information Exchange
Once their work is completed, quantity surveyors have to send the files to other team members forthenext stageprocedures. To enhanceteam communicationandcollaboration,thesoftware has to employ functionality to share information within the software, update information in real time, be compatible with different systems, hardware and versions, and interoperate with different software. In terms of shareability, results revealed that digitalization practice including cloud based computing (BR and HK groups) were able to tackle problems associated with conventional practice such as limited support file size (HK group), while a respondent from SG group remained concerned about slower operation of software to handle too many drawings. In general, respondents were satisfied with the functionality of software to update information in real time (real time operability), as pointed out by respondents from most of the countries (CN, HK, ID, and SG groups). Likewise, compatibility is also considered as a digitalization parameter. Respondents from different groups (CN, HK, JP, SG, and SA groups) appreciated the connection of software amongst different systems and technologies, while some other respondents expressed the problems of information linkages between software versions (JP group) and connection issue to the existing approaches (SG group).
Manifestation Key Excerpts Project Performance
Respondents were basically satisfied (CN and HK groups), as software could provide strong guidance value and facilitate project management in on site construction. Likewise, digitalization should be able to simplify the current practice achieving process simplification. Some repetitive work could be reduced such as copying of bills or preparing the page format for tender addenda (HK group) i.e., using it as a template for next time (SA group).
Client satisfaction SA 6 : What does the client want? They want an accurate estimate, they don't care about what's happening on the site and they would want the final account that they see coming.
Number of errors CN 4 : On the characteristic wise, this software remains some real good parts such as quickly and accurately evaluating whole scale of the project.
Clear presentation BR 1 : Visual Representation Productivity ID 11 : Once the data collected, it can make higher productivity for revisions.
Table 2. Some Excerpts for the Performance Variables
Note: BR Brunei; CN China; HK Hong Kong; ID Indonesia; JP Japan; SG Singapore; SA South Africa
Trust HK 3 : When I would like to claim payment after receiving the file, I, as a contractor, don’t fully trust him. Because I don’t know his measurement, we are not based on the same model.
4.3.1
Process Performance
Some respondents mentioned that software could present a holistic approach for quantity surveyors achieving high comprehensiveness (HK and SG groups), while a respondent from the JP group was not satisfied with the incomprehensive software functionality to cover the scope of work. Through digital transfer, it was less likely to miss any information, thus achieving more effective communication (HK group). Results showed that software helped create linkages among project team members and the handover of tasks was easier, leading to an effective communication amongst the team members (ID and SG groups).
4.3.2 Final Performance
191 Proceedings of the PAQS Congress 2022, 12th 13th September 2022, Singapore Institute of Surveyors and Valuers, Singapore P2. Final Performance Time SA 8 : Dimension X and programs like it, they drastically improve the speed in which you can measure and do takeoffs.
Respondents from all groups agreed that they had attained time saving through software in terms of tender addenda, data entry, and quantity take off. However, as some software were not able to perform certain functionalities (HK group), it could be a waste of time having to make manual adjustments. Meanwhile, software can enhance accuracy of measurement by eliminating human arithmetical errors (all groups). Nevertheless, results attested that a significant number of errors existed in models without standardization for modelers’ approaches (HK and JP groups). At the same time, an unsatisfactory result was that firms did not trust the software functionality to generate an accurate result, which required additional checking or hardcopy submission (HK and SG groups). Besides, the output of software can be performed with a clear presentation in various ways of expression. By clearly presenting a 3D model in a visualized way (BR, CN, HK and SG groups), clashes could be easily detected. Due to the transparency in the calculation process, it was easier for bulk checking or adjustment as well (HK group). In sum, most respondents mentioned that a higher productivity was reached by the use of software (BR, HK, ID, JP, SG,
The work described in this paper was fully supported by a grant from the PAQS in 2022.
5 Disposition Model
Figure 1. Disposition Model for the Digitalization Process
6 Conclusions
Acknowledgement
8 References Baldwin, A.N., Thorpe, A., and Carter, C., 1999. The use of electronic information exchange on construction alliance projects. Automation in Construction, 8(6), 651 662. https://doi.org/10.1016/S0926 5805(98)00110 1 Casini, M., 2021. Construction 4.0: Advanced Technology, Tools and Materials for the Digital Transformation of the Construction Industry. Woodhead Publishing. Chandramohan, A., Perera, B.A.K.S., and Dewagoda, K.G., 2022. Diversification of professional quantity surveyors’ roles in the construction industry: the skills and
A proposed digitalization process model was then developed based on the findings from the interview survey. The model indicates 16 digitalization characteristics in four categories affecting 10 performance indicators in two main groups as shown in Figure 1. It will form the basis for a more detailed questionnaire survey of quantity surveyor digitalization practices.
7
192
In this study, data were gathered from a relatively small sample of quantity surveyors which may not reflect the full picture of current digitalization practice in quantity surveying. Since part of the data was collected by completed interview forms, there is the possibility of subjective biases during the note taking process. Future studies are suggested to adopt contextual data analysis by collecting scripts and conducting cross checking by data analysis software to obtain more objective results. Based on an interview study of software applications for quantity surveying practice during different development stages, this study identified various digitalization characteristics into four major dimensions: work preparation, information updating, information presentation, information exchange; and two types of performance (i.e., process performance and final performance). In order to understand the impact of the digitalization characteristics on the surveying practices, further studies on a quantitative study across the countries are strongly recommended.
Proceedings of the PAQS Congress 2022, 12th 13th September 2022, Singapore Institute of Surveyors and Valuers, Singapore and SA groups). Hence, digital transformation can lead to higher output with lower input to enhance productivity, and obtain client satisfaction (BR, HK, and SA groups).

Päivi P., Maarit T., Jukka K., and Susanna T., 2017. Tackling the digitalization challenge: how to benefit from digitalization in practice. International Journal of Information Systems and Project Management, 5(1), 63 77. https://doi.org/10.12821/ijispm050104
Craveiro, F., Duarte, J.P., Bartolo, H., and Bartolo, P.J., 2019. Additive manufacturing as an enabling technology for digital construction: A perspective on Construction 4.0. Automation in Construction, 103, 251 267. https://doi.org/10.1016/j.autcon.2019.03.011
Dada, J.O., and Jagboro, G.O., 2012. Core skills requirement and competencies expected of quantity surveyors: Perspectives from quantity surveyors, allied professionals and clients in Nigeria. Construction Economics and Building, 12(4), 78 90. Hamelink,https://doi.org/10.5130/AJCEB.v12i4.2808C.J.,1997.Newinformationandcommunication technologies, social development and cultural change (Vol. 86). Geneva: United Nations Research Institute for Social Mohamed,Development.S.,and
Toole, T.M., 2003. Information Technology Innovation: A View of Large Contractors. In Conference: Construction ResearchCongress 2003,March19 21,2003, Honolulu,Hawaii, United States. https://doi.org/10.1061/40671(2003)132
Peansupap, V., and Walker, D., 2005. Factors affecting ICT diffusion: A case study of three large australian construction contractors. Engineering, Construction and Architectural Management, 12(1), 21 37. https://doi.org/10.1108/09699980510576871
Stewart, R.A., 2003. An empirical investigation of users' perceptions of web based communication on a construction project. Automation in Construction, 12(1), 43 53. https://doi.org/10.1016/S0926 5805(02)00039 0
RICS, 2018. Pathway guide: Quantity Surveying and Construction. London: RICS. Rivard, H., Froese, T., Waugh, L.M., El Diraby, T., Mora, R., Torres, H., Gill, S.M., and O’Reilly, T., 2004. Case Studies on the Use of Information Technology in the Canadian Construction Industry. Journal of Information Technology in Construction, 9, 19 34. Schallmo, D.R.A., and Williams, C.A., 2018. Digital Transformation Now!. Springer International Publishing. https://doi.org/10.1007/978 3 319 72844 5_2
Wu, G., Zhao, X., and Zuo, J., 2017. Relationship between Project’s Added Value and the Trust Conflict Interaction among Project Teams. Journal of Management in Engineering, 33(4), 4017011. https://doi.org/10.1061/(ASCE)ME.1943 5479.0000525
193 Proceedings of the PAQS Congress 2022, 12th 13th September 2022, Singapore Institute of Surveyors and Valuers, Singapore competencies required. International Journal of Construction Management, 22(7), 13741381. https://doi.org/10.1080/15623599.2020.1720058
Australian Institute of Quantity Surveyors, Australia Abstract The Australian Institute of Quantity Surveyors (AIQS) has been publishing building price information for 60 years, holding to a tradition that members find it of value. However, little research has been conducted to assess whether the data is fit for purpose and provides value to the end users. The objective of this research was to develop a deeper understanding of user expectations of building price data produced by AIQS.
Citra Ongkowijoyo, citra.ongkowijoyo@deakin.edu.au
The research offers new insight into the interplay between published data providers and its users. The outcome from this study is a better understanding of what is valued by users, and how quantity surveying (QS) professionals could improve the price data to aid better business
The Value of Price Data for Quantity Surveying Professionals in Australia
Alexia Nalewaik, dralexia@earthlink.net American University, Measurement & Evaluation, United States
194
The research data was collected from semi structured interviews with data users. The data was then analysed via a content analysis technique using NVivo software. The study revealed that the AIQS price data has been used for a variety of purposes, including: cost planning, assessing tender competitiveness, and benchmarking.
Argaw Gurmu, , argaw.gurmu@deakin.edu.au Deakin University, School of Architecture and Built Environment, Australia
Deakin University, School of Architecture and Built Environment, Australia Wenying Yao , W.Yao@mbs.edu
Anthony Mills (Corresponding author), anthony.mills@deakin.edu.au Deakin University, School of Architecture and Built Environment, Australia
Proceedings of the PAQS Congress 2022, 12th 13th September 2022, Singapore Institute of Surveyors and Valuers, Singapore
Anthony Lieberman, alieberman@aiqs.com.au
Thedecision-making.paperoffers
practical help to those involved in, developing or improving, construction price information. It is also a step toward innovative ways of providing better information, which can be used to enhance the QS services to the benefit of their clients.
University of Melbourne, Business School, Australia
The Building Cost Index (BCI) and Current Construction Cost that currently appear in the AIQS journal have their origins in the earlier journals produced by both former QS associations. Both institutes produced journals, and an agreement was reached to merge the journals into one publication, which included a comprehensive costing section. (AIQS, 2008) p. 271
195
Keywords Price
1 Introduction
2 Background In1971, AIQS was formedbyamergeroftwoquantity surveyorprofessional institutions.Prior to merging, both the Institute of Quantity Surveyors of Australia (IQSA) and the Australian Institute of Quantity Surveyors Incorporated (AIQS Inc.) realised the importance of producing regular publications to promote the interests of the profession. (AIQS, 2008)
Proceedings of the PAQS Congress 2022, 12th 13th September 2022, Singapore Institute of Surveyors and Valuers, Singapore indices, forecasting, building economics, decision making.
2.1 History of Current Construction Costs
Prior to the 1971 merger, AIQS published a magazine entitled “The Building Economist”. The first article on price indices appeared in the June 1962 edition, followed by updates in November 1966, May 1968, and May 1969. (AIQS, 2008) p. 275. After the merger AIQS created a new journal, also called “The Building Economist”. This was managed by members of the earlier formed Interim Council, (AIQS, 2008) p. 197
Prior to the merger in 1971, IQSA publication entitled “The Quantity Surveyor” was the first to produceinformation onconstruction price. In September1955, Mr M Aeriawrote anarticle on building price, which became a regular feature that published a schedule of Current Construction Costs. The price information published proved to be of great interest to subscribers. In March 1958, circulation rose significantly and subscribers included quantity surveyors, architects, engineers, contractors, government departments, technical schools, and allied institutes. “The Quantity Surveyor” continued to be published until the merger of the institutes in February 1971. (AIQS, 2008) p. 271
The Australian Institute of Quantity Surveyors (AIQS) is a respected and influential advisory body on the impact of price in the built environment sector. AIQS currently has an opportunity to be more vocal in assisting public understanding of the outlook for building prices Deakin University was commissioned to undertake a review of price information currently published by AIQS. The aim of the research project was to examine the usefulness and value of building price data published by AIQS. This included a review of price data produced in the past, and speculate about what opportunities could be pursued in the future.
2.2 History of the Building Cost Index
The current AIQS Building Cost Index (BCI) includes indices for five Australian cities, and an average weighted index (AWA) and covers the period from 1971 to the present. The index table also includes a forecast for one year ahead, based on data included in the BRIX survey (see next paragraph). Forecasts are reviewed quarterly and revised, if necessary (AIQS, 2008) p. 275. The information is based on observations and input from a variety of sources, including the BRIX Survey and “expert” opinions of local AIQS chapter representatives. AIQS states
The review of price construction price information price provided an opportunity to examine a number of issues related to building price publication and use. In particular, this includes the importance of building price data, sources of cost data, and forecasting of cost data.
Building price data is essential information used in the construction industry by both owners and contractors, and has several elements of importance. Firstly, building price information supports contractors and their supply chains by generating price information used to guide construction budgets for the client (Robson et al., 2016). Secondly, it is used by various stakeholders (e.g., builders, contractors, and owners) during preliminary costing practices to understand the trends of building pricing, which then supports pricing and cost control in rational decision making. Thirdly, building pricing is an important aspect in controlling supply and demand with industry. Forthly, a building price index can be used to mitigate unnecessary economic losses from speculation by developers and builders. In Australia, commercial building price is one of the most direct and scientific reflections of construction industry conditions. As such, building price fluctuates with the impact of the domestic economy, the degree of competition in the market, and other factors. Approximately one third of contractors believe that variability in construction price, is one of the most important risks that impact their profits (Ervin, 2007). Moreover, construction price movements has adverse impacts on both public and private owners (Shahandashti and Ashuri, There2013).
196
Proceedings of the PAQS Congress 2022, 12th 13th September 2022, Singapore Institute of Surveyors and Valuers, Singapore that the index is produced as a matter of interest to readers and subscribers, and is not intended to be relied upon for costing any building project.
are several factors that affect Australian building price indices. One of the biggest categories of factors is macroeconomic, such as (Jiang et al., 2013); (i) The growth in national income and size of population which leads to an increase in demand for construction, as well as an increase in construction shortages, (ii) unemployment rates and interest rates, and (iii) variation of construction activity.
Intheearly1990s,theAIQSVictoriaChapter’sprivatesurveybecameundervaluedbyquantity surveyingfirmsandnearlycollapsed.ItwasatthattimethatAnthonyMills (theauthor)became the co ordinator of the survey; he began research into the effectiveness of the survey results compared to price deflators produced by the Australian Bureau of Statistics (ABS). The research showed that sentiment indicators were reasonably accurate, and the results were easily understood by users. This information has been used to provide the quarterly update of prices published in the AIQS publication.
3 Literature Review
3.1 Importance of Building Price Data
The Building Research Index (BRIX) started in Melbourne in 1967 as a private information sharing exercise between quantity surveying firms. The objective of the survey was to promote discussion on issues that affected the movement of building prices. At that time, there were very few published indicators of general building price movement (AIQS, 2008) p 277
2.3 Building Research Index (BRIX)
AIQS has been publishing cost information for many decades, however in that time many other firms have also commenced producing similar information both in Australian and overseas. As a result, the market has expanded with many organisations producing building price information as an advisory service or for promotion of the firm. This appears to be an international trend. A desktop study of price data publications was conducted to understand the market, product format, and product cost. These included:
The inability to predict building price in a timely manner, can undermine the value of capital investments. Indeed, owners and contractors make key strategic decisions about individual projects and capital investment programs based on forecasted prices. Therefore, the ability to have timely and accurately forecast of building price is fundamental for an efficient construction industry. (Flyvbjerg et al., 2002, Grau et al., 2014, Oberlender and Trost, 2001, Isidore and Back, 2002, Mulva and Dai, 2012, Back and Grau, 2013, Kim and Reinschmidt, Construction2011).
197 Proceedings of the PAQS Congress 2022, 12th 13th September 2022, Singapore Institute of Surveyors and Valuers, Singapore Construction world-wide is criticized forits high priceand lowpredictability (Best and Meikle, 2015). Further, this issue is exacerbated by the frequent fluctuation of building prices, which is often difficult to forecast (Wang et al., 2013). Therefore, the development of a robust scientific forecasting model of building price is needed. The construction of an accurate and reliable building price index is critically important for practitioners to understand the movement in the construction market, as well as in the broader economy, in order to limit exposure to risk (Liang et al., 2018).
• Rider Levett Bucknall (Global) • Davis Langdon (Global) • WT Partnership (Global) • Turner & Townsend (Global) • Rawlinsons (Australia) • Slattery (Australia) • Australia Construction Industry Forum (Australia) • Australian Bureau of Statistics (ABS) (Australia) • Gleeds (India)
3.2 Other Sources of Building Price Data
price forecasts have significant impact on investment decisions in construction projects (Wang et al., 2013). The accurate prediction of building prices facilitates more accurate bids and help prevent under or over estimation (Ashuri and Lu, 2010). Even a small improvement in the accuracy of forecasting building prices can have a large impact on a multimillion dollar projects (Shahandashti and Ashuri, 2013). Moreover, predicting construction price as accurately as possible is essential, considering the low profit margin in construction budgets.
•
3.3 Price Forecasting
•
Forecasting encompasses a set of practices and techniques with the aim of generating reliable predictions of cost (Jarnagan 2009; Lukas 2008; PMI 2011). Even though a forecasting technique cannot guarantee accurate predictions (Chen and Zhang 2012; Kim et al. 2003; Vargas 2003), differences in accuracy among distinct forecasting techniques have been identified in past research (Back and Grau, 2013)
The Australian Construction Industry Forum (ACIF) produces a range of forecasts of building activityforavariousbuildingtypes.Theinformationrelatestothevalueofworkdone(activity) and is not price data. However, the activity forecasts have strong links to price, the data is produced for each capital city in Australia, making it a useful guide to the prediction of price demand (ACIF, 2021) .
•
A number of large quantity qurveying (QS) firms produce information on building prices. However, the most commonly used price data publication is the Rawlinsons Australian Construction Handbook. It contains information on unit prices, elemental building price, and price indices, for an extensive range of building types across all Australian capital cities. The data is produced annually, and subscribers to the Handbook receive quarterly updates throughout the year. The index is based on re pricing a standard Bill of Quantities (BoQ) containing about 150 items and is fully re priced once or twice each year; quarterly updates are achieved by applying a subjectively derived inflation factor to all items.
Predictions are a fundamental measure in the capital investment industry, setting expectations of project outcomes, which drive key decision making (Grau and Back, 2015) Industry
The ABS produces a range of price information related to the construction industry. The ABS is the official government authority charged with data collection and is the most reliable measure of economic activity in Australia. The ABS collects information that relates to Producer Prices comprising labour and material prices, and price deflators for adjusting construction activity data across a range of building types.
•
The desktop studies included a brief history of each publication, their objectives, types of information published, publication frequency, and other relevant information. More information about key publications in Australia is detailed below.
•
•
•
•
198 Proceedings of the PAQS Congress 2022, 12th 13th September 2022, Singapore Institute of Surveyors and Valuers, Singapore National Construction Cost Centre & BCISM (Malaysia) Building and Construction Authority (Singapore) Craftsman Book Co (USA) Saylor Communications (USA) Marshall & Swift (USA) Richardson (USA) RS Means Company (USA) Building Cost Information Services (UK)
Accurate prediction of building prices is essential for the construction industry. Price variation can affect the decision of construction contractors, property investors, and related financial institutions (Jiang et al., 2013). Amorereliableforecastingmodelofbuildingpriceswould therefore help construction developers and contractors to ensure adherence to their budget and financial commitments. It is widely agreed that up to date building price information produced by AIQS provides a good marketing tool for the profession as a whole.
Past experience with AIQS cost data, and the BRIX survey, has shown the collection of raw data is the single biggest challenge in maintaining the databases. While AIQS member’s firms have considerable goodwill towards AIQS, they do not derive any financial benefit from participation in data collection Indeed, some firms may consider their data to be proprietary information, and possibly unwilling to share it. In addition, the onerous collection of data, requiring a 12 week turnaround for publication, creates a substantial demand on QS time and resources. In the end, any data collected needs to be carefully cross validated before publication The updating of the information mostly falls on a small number of volunteers, who are often overwhelmed by the task, making it a difficult task to remain current.
4
The next section of this paper describes how the research data was collected to examine the value of the cost data to users, and to explore those types of information that are most useful in making business decisions.
3.4 AIQS Challenges with Construction Cost Data
Methodology This research used an exploratory approach, with data derived from semi structured interviews of end users. Semi structured interviews are a verbal interchange where one person, the interviewer, attempts to elicit information from another person by asking questions. Although the interviewer prepares a list of predetermined questions, semi structured interviews unfold in a conversational manner offering participants the chance to explore issues they feel are
199 Proceedings of the PAQS Congress 2022, 12th 13th September 2022, Singapore Institute of Surveyors and Valuers, Singapore practitioners rely on up-to-date price indices, which when combined with price index forecasting becomes the foundation for making decisions on behalf of both the project and the allocation of resources within the organization. However, longer prediction periods mean a greatercorresponding prediction error.This dueto thedifficulties in accounting forfutureprice changes, due to the ever changing economic circumstances. Understanding the future movement of building prices is crucial not only for construction companies but also for investors, to establish appropriate pricing strategies and target returns over time.
The way forward is not clear, the current publication of cost data in now what is known as the Built Environment Economist quarterly publication, has been a feature of AIQS for over 60 years; the decision to continue or discontinue publication needs to be made carefully. It may be possible to reduce the scale and scope of the data published. It also may be conceivable to come to an arrangement with existing providers of cost data, such as Rawlinson’s, or it may be worthwhile to develop a new process which allows raw data to be collected more efficiently. Theresearchteam and referencegroup carefully consideredtheongoing publicationofexisting cost data in its current format and scope understanding that, if change was deemed necessary, then the design of a new collection process would need to be decided upon, including the type and style of outputs.
Table 1 Interviewee Characteristics
The semi structured interviews highlighted several themes that emerged from the discussions. These themes was extracted from the interview transcripts, In general, they were divided into thr following categories; i) What do users see as the value of the information? ii) Is the information considered trustworthy and reliable? iii) How do you use the Unit Price, Square Metre Rate, and Building Cost Index?, and iv) what should be changed or added to improve the data?
5
The semi structured interviews each lasted between 40 and 60 minutes, andeach interview was recorded and transcribed. The transcripts were then loaded in NVivo software, which was used to assign a code or theme. The software then collected all quotes based on the assigned code and produced a table of comments. The table of comments was used at the basis for discussion below.
200 Proceedings of the PAQS Congress 2022, 12th 13th September 2022, Singapore Institute of Surveyors and Valuers, Singapore important. (Longhurst, 2010) This approach semi-structured was considered most appropriate considering that there were a limited number of viewpoints in this context. To explore the issues, a set questions were developed based on the overall objectives of the research project
All the expert professionals had between 15 50 years of work experience and were recruited on a voluntary basis in compliance with the research ethics policies of Deakin University. Interviewees were all qualified QS’s and AIQS members; each candidate was selected based on their different perspectives (See Table 1). They each had an understanding of the usefulness of information, and also were aware of similar price data that was published by other sources.
The first theme that interviewees addressed was related to their perception of how well used the information was by industry stakeholders.
A Professional QS is a director of an international consulting firm.
B Building estimator/Cost planner who worked for a major construction company J Former state public servant who ran the government's cost planning department
N Building consultant, arbitrator, adjudicator, and expert witness, who consulted to clients involved in building disputes.
5.1 What is the perceived value of the cost information?
Toselect the participants, an experiencedbuilding construction expertwas contactedand asked to nominate other experienced professionals who may be willing participate in the interviews
Interviewee Code Perspective
Findings and Discussion
A broad panel of users were identified, who had (1) knowledge or expertise in using construction cost data, and (2) extensive experience in the construction industry. After contacting several suitable individuals, four persons were identified that each had diverse viewpoints on the AIQS cost data.
Interviewee A also lamented that, although the AIQS cost data was available to many in industry, only members of AIQS received it for free as part of their annual membership fee. He went on to say that very few people outside of AIQS actually ever used the data. This was based on his view that while the cost of a non member subscription to the magazine was not expensive,someofthedatawasavailablefromothersourcesthatwasfreeofcharge.Therefore, there were many potential users of the data that just did not bother purchasing a subscription to the AIQS magazine. Interviewee B suggested the data was very detailed and, if users were to seek out this type of information, they would tend to go to other sources. He went on to suggest that the alternative to AIQS cost data is the Rawlinson’s handbook, which is “more comprehensive and not much more expensive to purchase”. In addition, Interviewee B said the Rawlinson’s data was availableelectronically, whichhadtheadvantageofbeingeasytoaddtotheirinternalcomputer databases. As a result, it was very easy for some users to simple purchased Rawlinsons, instead of the AIQS cost data.
On the other hand, Interviewee N was sole practitioner who was primarily engaged in legal work. From his perspective, he suggested that both the AIQS cost data and Rawlinson’s were not expensive (around AU $400 each). As an AIQS member, he was able to obtain the AIQS data as part of his membership, but he also purchased the Rawlinson’s book each year. He did not believe the cost of purchasing the data would put anyone off buying all the available published data, and that once obtained it was of great value to any practitioner. From his perspective as an arbitratorand expertwitness,he stated“thecourtsacceptedbothpublications as legitimate sources of industry relevant cost data, they do not question the (authenticity) of the data.”
201 Proceedings of the PAQS Congress 2022, 12th 13th September 2022, Singapore Institute of Surveyors and Valuers, Singapore
Interviewee A stated that the information was useful to construction clients attempting to understand thebest timetocommenceabuilding.Inthesecircumstances clients ask themselves “Where do think we’re really going? Is the market inflation going to stop in next few months, should I hold off on my development, or is this something that will continue for the next three to five years, and so should I just go for it now?”
5.2 Is the data considered to be reliable?
The second round of questions asked each respondent to consider whether the AIQS cost data was a reliable indicator of market prices. As previously mentioned, Interviewee N stated the data was considered valid in legal cases. His experience suggested the stakeholders did not question the reliability of the data itself but were likely to know the context in which the information was applied. For instance, he suggested the cost data was related to new work only and did not apply to the refurbishment of existing buildings. He also went on to say the cost data was based on an average of all buildings, and thus was not necessarily related to a specific project that had unique conditions which made it an individual case.
Interviewee M, a building estimator, believed the data was reliable, but suggested it would not be a substitute for cost data that they derived in house from their own projects. The information in the magazine was believed to be credible but sanitized in such a way that users did not know project(s) that it was based on. He suggested that, because the data sources were not explicitly identified, the prices tended to be generous (conservative) and applicable to a range of projects. Hestatedthat,iftheAIQScostdatawasusedinatendersubmission,thefirmwouldbeunlikely to win the project if the tender selection was based on the lowest bid. He concluded that prices published by AIQS and Rawlinson’s were on the high end of the spectrum of all prices in the
5.3 How useful is the Building Cost Index, Unit Price, and Square Metre Price,?
Interviewee A said the information was subjective in that no individual project was repriced, and instead the index was based on a consensus of sentiments expressed by the contributors. In addition, the cost index was forecasted for one year in advance, and therefore informed by the bullish and bearish perspectives of the contributors. Interviewee A was at one time responsible for determining the BCI, and indicated the final index was a subjective assessment of a range of data that was informed by market expectations from private forecasters. The BCI was, thus, the result of both art and science, and was assumed to apply to the average of all building costs at a single point in time.
The third round of questions asked each respondent to comment on the AIQS Building Cost Index (BCI), Unit Price, and Square Metre Price. All the respondents stated the BCI was the most important piece of information published in the BCI section of the publication.
5.3.2 Should the BCI be updated using a standard pricing model?
The next theme was prompted from the ones above. Interviewees were asked whether the BCI should be based on a less subjective approach, using a standard cost model of a real building.
Interviewee A worked for an international cost consultancy that routinely repriced a range of building price models. The models were generated from actual buildings that were clearly understood. This process was described as “bottoms up pricing”, because the index was developed using several unit prices that were weighted differently for each building type. He went on to say that “at the moment we’re pricing a basket, it’s of a typical medium rise office building within the metropolitan area. We clearly know and understand the context of what is being priced” However, he also indicated that once the cost models had been repriced, the Directors of the firm lookedclosely at the priceindexwith aviewto refining theindexto reflect theirsubjective impression of the market environment.
IntervieweeJ worked for both Federal andStategovernments whousedasimilarstandardprice model approaches. He indicated this standardised methodology was more robust than the current approach and had the advantage of showing how prices varied between individual building types, and across geographical locations.
5.3.3
Unit Price
The most detailed information published by AIQS is the unit price information. This information relates to typical BoQ rates for detailed components of the building. For example, the price of constructing a masonry wall, or supplying and fitting an internal door. This information is the most time consuming data to update due to the huge volume of data
Building Cost Index
202 Proceedings of the PAQS Congress 2022, 12th 13th September 2022, Singapore Institute of Surveyors and Valuers, Singapore market. As a result, the AIQS information was at best, a guide to the cost of construction, and not an accurate indicator of the cost of any particular project.
5.3.1
Nevertheless, Respondent B said that his firm did believe thatAIQS is highly professional and has a good reputation for producing cost data. He suggested that his contracting firm did use AIQS and Rawlinson’s data when there was a gap in their internal database. Under these circumstances, the published information was considered useful.
How useful is the price per Square Metre Area data?
However, Interviewee B did say, when uncommon work came up that was outside what was collected in their internal database, he did refer to the unit rates as a guide. He referred specifically to mechanical and electrical services, which were assigned to specialist subcontractors and were normally not part of builders’ work. This made it difficult to know the true price of this work in the marketplace.
203 Proceedings of the PAQS Congress 2022, 12th 13th September 2022, Singapore Institute of Surveyors and Valuers, Singapore published. All respondents agreed that it would be a difficult task to ensure that all data is correct and accurate at the time of publication
The Square Metre Area data published refers to the full price of the buildings by type. The prices were expressed as price for each square metre of Gross Floor Area (GFA). This information was prepared using an international cost planning standard (ICMS, 2017) and could be directly compared with similar buildings in other cities and countries.
Interviewee N, who was a sole practitioner, also privately undertook construction development work. This was neatly described as follows: “While it’s not accurate (information), you sometimes go for the square metre rate as a ballpark figure to get an agreement to proceed with a project” He commented that the prices were at a high level, instead of granular, and were therefore very useful to big picture clients. In those circumstances, he said the Square Metre Rates formed the basis of their construction budgets, and the AIQS data could be very useful.
Interviewee A worked for a large consultancy firm and admitted he “had neveractuallylooked at those rates”. He went on to say he did not know if they were correct or not because he did not know how the rates were derived. He said that it was difficult to “get a feel” of their accuracy. Interviewee A further commented that their internal company databases contained similar information; as a result, no one in his office felt the need to rely exclusively on the AIQS unit price data.
Interviewee N had a different perspective on the value of the unit price information. He occasionally needed information about detailed prices of parts of the building. In these circumstances, he would consider the information provided by AIQS and Rawlinsons and provide expert advice on what he believed to be most relevant cost to the case under consideration by the court. This information would then be considered and possibly incorporated into the judgement.
Interviewee B had, in the past, been involved in the updating of the unit price information for one of the AIQS state chapters. He lamented that, due to the large volume of data, it was difficult to find volunteers to review the prices on a regular basis. This presented a potential risk to both quantity of data and quality of publication, which could be mitigated only through more formal arrangements for staffing resources.
Finally, Interviewee J, who had been employed as a public servant, noted that many State governments around Australia no longer require BoQ to be provided with their tender proposals. As a result, in most jurisdictions, detailed tender price information is not available. He believed it was a challenge to ensure that the information published was an accurate representation ofthe current market price. Finally, hewent onto statethat “AIQSmagzinerates were useful when they first published 60 years ago, but as soon as Rawlinsons started publishing (Unit Prices), they lost their gloss ” 5.3.4
The AIQS price information is currently published quarterly, and interviewees were asked to consider whether this was appropriate. The alternate source of information from Rawlinsons is published annually, with a single rate adjustment updated quarterly. All interviewees said AIQS did not need to publish any more frequently than quarterly and were ambivalent about six monthly or annual updates.
In the 60 years since AIQS first started publishing price data, many other firms have begun publishing similar information. All interviewees indicated that they purchase the Rawlinsons handbook, which contains similar information to that published by AIQS Interviewee B, who managed a team of building estimators, said “I get a digital subscription to Rawlinsons. The annual cost us about $400 for the digital subscription. I get six licences a year, and that’s pretty cheap in the scheme of things. But you know what’s the best part about it? They’ve done very good job. Included in the digital subscription, is a snipping tool, and while can’t print from it, you can add data to our internal database. I take my hat off to them and say well done!”
5.4.1 How often should data be updated and published?
The interviewees were also asked to reflect on the data published by AIQS and consider the best forecast horizon for construction prices. AIQS currently publishes a yearly forecast of its Building Cost Index. ACIF does not publish information on building prices, but does create forecasts of construction activity for five years. Interviewee N summed it up by saying that “although the ACIF forecast is for five years, I think that is quite long For me, one to two is the most useful.”
5.4.3
Interviewee N was asked if he saw Rawlinsons as a competitor to AIQS data. He answered “No, it's supplementary. The way I see it, they’re both complementary.”
Other Information
5.4 What other market information is be useful?
Thenextsetofquestionsrelatedtootherinformationthatwasnot currentlyproducedbut would be useful. Interviewee B, who was a building estimator, believed the work of specialist subcontractors was difficult to understand. He stated that “Building services, vertical transportation, and the like, were difficult to price. If we could engage someone to help us to
5.4.2 Other Providers of Cost Information
Interviewee A said, “people always want to know about markets information, even if the markets is flat. People want to know if is it still going to stay flat, or is it going to tick down, or tick up? I think that regular updates of what the market is seeing in the recent quarter (is useful). Also, a forecast going forwardwould be ofinterest. It’s always an interesting topic for everybody in the industry, and even to some of those who aren’t in our industry”
204 Proceedings of the PAQS Congress 2022, 12th 13th September 2022, Singapore Institute of Surveyors and Valuers, Singapore
Interviewee A, who had access to his firm's internal databases, commented that “weveryrarely use it because …we’ve got our own data that we use internally, but we do find it handy for the outliers, so it might be the price of bullet proof glass, or the price of an unusual building that we don’t normally come across ”
Respondents did believe AIQS are highly professional and have a good reputation for producing accurate price data. Industrial stakeholders did use AIQS and Rawlinsons data when there was a gap in their internal database; under these circumstances, AIQS information was considered useful.
• What should be changed or added to improve the value of the data?
Interviewees believed the work of specialist nature was often difficult to appreciate. They mentioned that it was difficult to price building services such as vertical transportation and mechanical and fire services. They suggested that industry specialists could be engaged to help describe the nature cost of price movements.
6 Conclusions
6.1 Future Research
The above information summarised above represents the main themes that impact the usefulness of the building price information published by AIQS. In the future, these themes will be used to develop a questionnaire to collect responses from a wider range of users of the data. It is hoped the survey will assist AIQS understand how to improve the value of the cost data publication. Future survey themes will include:
• What is the use of Unit Price, Square Metre Rate, and Building Cost Index?
• Is the information considered trustworthy and reliable?
The interviewees suggested the AIQS cost data was useful to some stakeholders but not widely used outside of AIQS membership. While it was free to members, the low cost of other alternative price data was not prohibitive, and any sophisticated user could readily purchase any alternative price data that was available, in particular Rawlinsons. There was a sense that members of the general public, or non sophisticated users, may find the detailed price data difficult to understand, but (even if it were useful) they would more likely purchase the Rawlinsons data because it was more comprehensive and relatively inexpensive.
205 Proceedings of the PAQS Congress 2022, 12th 13th September 2022, Singapore Institute of Surveyors and Valuers, Singapore understand the services cost, that would be a massive improvement (to the published data). As you know it’s a large portion of a project now, and it’s a bit of a dark art. It’s difficult to get price information from those (specialist subcontractor) guys.”
The unit price information was not widely used, with one respondent suggesting he had never seen it used. On the other hand, respondents reported the Square Metre Rates were valuable and mostly used as benchmarking information against their own internal databases. The Building Cost Index was of interest to many quantity surveying professionals, and to the industry more generally. One respondent stated that even if the index did not move, it was useful to know the market was flat. As a result, it was clear the Building Cost Index was the most widely utilized piece of information. AIQS currently forecasts the index for one year in advance. Respondents indicated that, because of the time taken to design and plan most buildings, two or more year forecasts would be more useful.
ICMS 2017. International Construction Measurment Standards: Global Consistency in Presenting Construction Costs. London, UK: International Construction Measurement Standards Coalition. Isidore, L. J. & Back, W. E. 2002. Multiple Simulation Analysis for Probabilistic Cost and Schedule Integration. Journal of Construction and Engineering Management, 128, 211 219.
Grau, D. & Back, W. E. 2015. Predictability Index: Novel Metric to Assess Cost and Schedule Performance. Journa of Construction Engineering Management, 141, 04015043.
How to protect profit as material prices rise. Puget Sound Business Journal. Flyvbjerg, B., Holm, M. s. & Buhl, S. 2002. Underestimating Costs in Public Works Projects: Error or Lie? Journal of the American Planning Association, 68, 279 295.
Acknowledgement
7
The authors would like to recognise the generous assistance of AIQS, who provided funding for this research. In particular, we would like to highlight the support of Grant Warner, Mark Chappe FAIQS, CQS, and Stephan Warne FAIQS, CQS from the AIQS Board. In addition, the authors would like to acknowledge the expert professional advice from Adam Robinson MAIQS, CQS, Domenic Schiafone MAIQS, Hugh Mackie MAIQS, CQS, Bradley Marino MAIQS, CQS, John Stranger FAIQS, John Drillis FAIQS, CQS, and Norman Faifer FAIQS, CQS, 8 References ACIF 2021. Australian Construction Market Report November 2021. Canberra, ACT: Australian Construction Industry Forum. AIQS 2008. The History of Quantity Surveying in Australia, Canberra, ACT, Australian Insitute of Quantity Surveyors. Ashuri, B. & Lu, J. 2010. Time Series Analysis of ENR Construction Cost Index. Journal of Construction and Engineering Management, 136, 1227 1237. Back,E.&Grau,D.2013.Four castingforearlypredictability. ImplementationResource,291 Best,2. R & Meikle, J. 2015. Measuring Construction: prices, output and productivity,
206 Proceedings of the PAQS Congress 2022, 12th 13th September 2022, Singapore Institute of Surveyors and Valuers, Singapore AIQS has been producing building cost information for 60 years, and in that time it has never been comprehensively reviewed for fitness of purpose. AIQS has now decided the time is right to re examine the value of the information, with a view to change the way it is developed and published, or even to cancel the publication. It is also possible the data could be repurposed to provide new opportunities to promote the role of the quantity surveying professional to a broader market.
Ervin,Routledge.E.2007.
Grau, D., Back, E., Abbaszadegan, A. & Sirven, R. The predictability index A novel project performance metric to assess the early prediction of cost and time outcomes. Proc., Construction Research Congress 2014, 2014. 2306-2314.
Liang, J., Reed, R. & Crabb, T. 2018. The contribution of spatial dependency to office building price indexes: A Melbourne case study. Journal of Property Investment Finance, 36, 232 247. Longhurst, R. 2010. Semi structured Interviews and Focus Groups. In: CLIFFORD, N., French, S. & Valentine, G. (eds.) Key Methods in Geography. Los Angeles: Sage. Mulva, S. P. & Dai, J. 2012. Performance assessment. ConstructionIndustryInstitute,Univ. of Texas at Austin, Austin, TX Oberlender, G. D. & Trost, S. M. 2001. Predicting Accuracy of Early Cost Estimates Based on Estimate Quality. 127, 173 182. Robson, A., Boyd, D. & Thurairajah, N. 2016. Studying ‘cost as information’ to account for construction improvements. Construction Management and Economics, 34, 418 431. Shahandashti, S. M. & Ashuri, B. 2013. Forecasting Engineering News Record Construction Cost Index Using Multivariate Time Series Models. Journal of Construction and Engineering Management, 139, 1237 1243. Wang, S., Shi, H. & Zhang, J. Commercial Housing Price Index Forecast Based on the Gray Model. ICCREM 2013, 2013. 1070 1077.
Proceedings of the PAQS Congress 2022, 12th 13th September 2022, Singapore Institute of Surveyors and Valuers, Singapore Jiang, H., Xu, Y. & Liu, C. 2013. Construction Price Prediction Using Vector Error Correction Models. 139, 04013022. Kim, B C. & Reinschmidt, K. F. 2011. Combination of Project Cost Forecasts in Earned Value Management. Journa of Construction Engineering Management, 137, 958 966.
207
Keywords Uncertainty, trust management, competency, skill shortage, client 1 Introduction COVID 19 poses great public health and economic risks to all nations, irrespective of their economic profiles. The pandemic reduced the gross domestic product by up to 10% in some economies. For instance, in 2020, 8.8% of global working hours were lost relative to the fourth
The COVID 19 pandemic has brought new obstacles to the construction sector that have never been seen before. The construction management culture and landscape have been changed by the coronavirus disease (COVID 19). While the pandemic has altered the roles and duties of the professionals in the construction sector, new roles and duties are emerging and expanding the skill shortages. Through an open ended survey questionnaire, the emerging roles and duties of quantity surveying organisations were investigated. The data revealed that post pandemic, the competencies of quantity surveyors in construction management, claim management, cost management, material management, time management, and contract administration will see a significant increase in the construction sector. Commercial, site and client management functions would be added to the profile of roles and duties of the consultant quantity surveyors moving forward. The quantity surveyors also had to expand their knowledge of digitalisation. This study adds to thebodyofknowledgeonsustainability andreimaginingtheroles andduties of quantity surveying organisations in the aftermath of the pandemic toward better service delivery. Inductively, the main findings of this study have wide applications to quantity surveyingpractisein and outsideofNigeriaandto otherprofessionalsintheconstructionsector globally. Quantity surveyors have traditionally performed many of the roles and duties. However, the pandemic has broadened and deepened the demand for the roles and duties significantly.
208
Paul Anavhe (Corresponding author), panavhe@yahoo.com CPD Partnership Limited, Kaduna, Nigeria. Shalini Sanmargaraja Faculty of Engineering and Green Technology, Universiti Tunku Abdul Rahman, Kampar, Perak, Malaysia. Olatoyese Oni Faculty of Engineering and Green Technology, Universiti Tunku Abdul Rahman, Kampar, Perak, Malaysia.
Proceedings of the PAQS Congress 2022, 12th 13th September 2022, Singapore Institute of Surveyors and Valuers, Singapore
Reimagining the quantity surveying practice in the post COVID-19 pandemic AbdulLateef Olanrewaju Faculty of Engineering and Green Technology, Universiti Tunku Abdul Rahman, Kampar, Perak, Malaysia.
Abstract
Construction companies have reopened and are operating alongside a virus that has remained athreattoeveryone.Mostcountriesopentheconstructionsectorstoprovidetheneededsupport
2.1 Impact of covid 19 on the construction sector
209 Proceedings of the PAQS Congress 2022, 12th 13th September 2022, Singapore Institute of Surveyors and Valuers, Singapore quarter of 2019, equivalent to 255 million full-time jobs (ILO, 2021). This amounts to US $3.7 trillion, or 4.4% of global gross domestic product (ILO, 2021). Government debt was equivalent to around 80% of GDP in many economies. The pandemic has had varying degrees of impact on various economic sectors. Hospitality, entertainment, construction, and education are among the industries that have suffered the most. The impact of COVID 19 on the construction sector is huge, complex and sophisticated. During the height of the pandemic, which lasted about two years, all construction projects except those considered extremely necessary for national security stopped operations, and construction site operatives were asked to stay at home, most without pay, support, or compensation. Foreign construction workers were left in limbo and asked to vacate their hostels that were provided by the contractors. The construction sector is already facing a lot of problems, including labour shortages, worsening health and safety practises, poor productivity, shortage of materials, poor access to sites, shortage of machineries and tools (Olanrewaju, et al., 2021). These challenges require a paradigm shift in theconstructionandconstructionmanagementprocessesandprocedures. The pandemic disrupts the conventional duties, functions, obligations, and responsibilities of the stakeholders in the construction sector and the working culture. Multiple research projects are beginning to investigate the performance, productivity, and profitability of construction during thepandemicand measures to reduceits impact ontheglobalconstructionsectors(Olanrewaju, et al., 2021; and Ling, et al., 2021). However, because the pandemic has had a differential impact on construction and construction management and various practices, there is a need to examine how the pandemic has disrupted the duties, obligations, and responsibilities of the various stakeholders in an effort to provide information on the new norm in the sector. Hansen et al. (2021) examined the responses of quantity surveyors to the pandemic. The quantity surveyors responded by examining the contract documents, addressing disputes using alternative dispute resolutions, using digital tools, and requiring contractors to substantiate claims on how the pandemic has affected their productivity. However, this research reimagines the nature of services that quantity surveyors would provide post pandemic based on the lessons learned during the pandemic. This information is very useful to the sector. For the quantity surveyors, it would provide an opportunity for more knowledge acquisition to provide the needed value added services, especially during uncertainty in the future. This is against the background of the skill shortage in the construction sector during the pandemic. The skill shortage of quantity surveyors is the most critical in the construction sector, especially during the pandemic (RICS, 2022).
2 Background to the study and conceptual framework
A new coronavirus disease (COVID 19) is a contagious disease spread by a newly found coronavirus. The coronavirus is thought to have originated in a market in Wuhan, China, in December 2019. It is a respiratory virus, and the main symptoms are dry cough, fever, and chills. The virus is predominantly transferred through droplets produced by coughs, sneezes, or exhales from an infected person. Victims can also be infected by inhaling the virus if someone is too close to the COVID 19 carrier. So far, 500,186,525 COVID 19 cases have been confirmed, with 6,190,349 deaths, and a total of 11,294,502,059 vaccine doses have been delivered (WHO, 2022). It might take up to 5 years for economies to make significant improvements.
Various measures, such as contact tracing, isolation, and social distance, were developed to flatten the COVID curve, but the pandemic's impact on construction remained unprecedented.
210
The construction sector is highly impacted by the pandemic. The pandemic has delayed projects by a significant margin due to a shortage of personal protective equipment, materials, equipment, and craft workers. Based on a survey conducted by the Associated General Contractors of America, 68% of the survey respondents reported that clients have asked them to halt or cancel projects (AGC, 2020). In Malaysia, compliance costs of health and safety regulations to prevent the spread of the disease increased the costs of projects by more than 20%, reduced site productivity by up to 50%, and the pandemic caused a 40% skill shortage (Olanrewaju et al., 2021). Thepandemic reduced constructionoutput by28.6%,and about 90% of the projects suffered cost overruns. Projects may be delayed by up to 270% in Singapore (Ling et al., 2022). In Nigeria, disputes and claims have increased by some 80% due to the COVID 19 pandemic (Olanrewaju, et al., 2022). More than 80% of construction projects in Indonesia were suspended, delayed, terminated, or cost overrun (Hansen et al., 2021). Based on data from 70 medium sized construction projects in the UK, the COVID 19 significantly caused projects to bedelayedandledto a 15%productivityloss (ConstructionManager,2020).
The construction sector is one of the massive job losses in hard hit sectors (ILO, 2021).
While investments in public projects will increase, it may take some time for the residential sector to improve. However, due to labour and material shortages, contract termination by the government, and supply chain disruption, both the public and private sectors' operations would be impacted. In an effort to minimise losses and increase profit, many construction companies have already suspended or counselled contracts and projects. The impact of COVI 19 could mean that construction companies will have to seek alternate means of financing to complete ongoing projects. Construction companies, the contractors in particular, will face low demand for construction projects, for both private and public projects, especially as the government’s deficit and debt increase. Some construction businesses may be able to continue operating due to their experience and backlog of projects from before the COVID 19 issue. However, in the long run, they will be impacted by low demand and a lack of resources. Generally speaking, construction companies with high debt levels run the risk of failing; subcontractors run the risk ofceasingoperationsforlackoffunding;andconstructionmanagementpractices particularly contract management, contract administration, and procurement management run the risk of failing. Many of the contact provisions currently in place are insufficient to deal with COVID 19 related issues. While many construction companies may invoke a force majeure clause to avoid loss or legal action, it might not be a strong enough defence. As a result, numerous renegotiations are needed between construction companies, clients, sponsors, legal counsel, and regulatory organisations. In addition, the pandemic will have an impact on international projects and contracts due to the fact that many nations have passed laws and regulations to control COVID 19's spread and effects. The majority of the clauses in the new laws and regulations differ from those that are in effect when contracts are signed.
In addition, the introduction and implementation of new codes and regulations during the pandemic increased contractors’ expenses and reduced their profit margins. For instance, contractors spent a lot of unbudgeted costs on purchasing personal protective equipment (masks, gloves, sanitizers, test kits) for their staff and site operatives. Contractors are also
Proceedings of the PAQS Congress 2022, 12th 13th September 2022, Singapore Institute of Surveyors and Valuers, Singapore foreconomicrecovery.Thepost-lockdownpresentsagreatchallengetotheglobalconstruction sector as it moves to recover from the effects of the COVID 19 pandemic. The construction sector is one of the unique sectors that cannot be entirely shutdown during the pandemic because it provides essential services to the economy. This is made more complex because there is less opportunity to work from home and the sector remains largely labour intensive.
Proceedings of the PAQS Congress 2022, 12th 13th September 2022, Singapore Institute of Surveyors and Valuers, Singapore required to pay health inspectors for site visits. Most companies arrange for special food vendors for their staff and site operatives. A lack of skilled labour raises project costs and productivity. Contractors' and suppliers’ arrears were not honoured. Companies that hire plants and equipment cannot move their machinery from sites, even with accumulated debt owned by the contractors. During the pandemic, clients overpay for projects due to poor productivity, and main contractors and subcontractors suffer from increasingly low profit margins. Contractors spend more on salaries and benefits to attract skilled workers to work for them. The project consultant also made alternative arrangements that were tedious and expensive to visit sites. Many have moved their offices to their homes.
211
2.2 Quantity surveyors: an overview Quantity surveying is practised worldwide. According to the Royal Institute of Chartered Surveyors, "Quantity surveyors are the cost managers of construction." They are involved in the feasibility, design, construction, and operational phases of construction projects. Quantity surveyorsarealso activelyinvolvedin theprocurementofexpansion,renovation,maintenance, and demolition of constructed facilities. They are familiar with all aspects of construction throughout the life of a structure or facility (RICS, 2015) and advise on a project's strategic planning. The quantity surveyor’s advice on strategic planning of projects. For instance, they advise clients on whether to construct or not to construct, and when and how to consider the client value system. Quantity surveyors play an important part in the effective completion of projects, regardless of the procurement procedures used. The quantity surveyors' potential and importance have increased as a result of modern procurement strategies. Today, quantity surveyors are expanding their services to include petrochemicals, manufacturing, automobiles, mining, telecommunications, shipping, transportation, and agriculture. The culture of elasticity and adaptability of the quantity surveyors, as well as changing client requirements, is driving the diversity in service delivery of the quantity surveyors. Like other experts in the built environment, the COVID 19 influences and disrupts the services of quantity surveyors. For instance, before the pandemic, consultant quantity surveyors would spend about 60% of their time in the office and the remaining 40% on the sites. The revised would be the case for the contractor’s quantity surveyors. The manufacturers’, clients', and suppliers’ quantity surveyors also spent a significant part of their time on the sites. In particular, during the pandemic, the time spent by quantity surveyors is significantly reduced, which has affected site visits and physical meetings. On site visits and meetings are significant aspects in construction and project management because it is regarded that data derived from face to face interactions is morereliable,accurate,and unbiased.Many clients maynot appreciate their quantity surveyors relying on the clerk of work to prepare a valuation for payment to the contractors. The structure of the services that quantity surveyors provide has been impacted, at least in the last two years. While there is a surge in demand for some of the services, new duties, functions, and responsibilities are rising in some cases, to the extent that an acute skills shortage has been created. The skill shortage of quantity surveyors is not new, but it escalated as a result of the pandemic. According to the latest report, most RICS members reported that the skills of quantity surveyors may hold the construction sector back from returning to its pre pandemic productivity level (RICS, 2022). The survey revealed that the skill shortage is due to the complex nature of the roles and duties that quantity surveyors provide. While there are fewer quantity surveyors in the market, some of the available ones are not familiar with the expected changing roles and duties demanded from them. Therefore, this research is needed to fill this gap.
3
Research Design and data analytics
Proceedings of the PAQS Congress 2022, 12th 13th September 2022, Singapore Institute of Surveyors and Valuers, Singapore
The data for this study were gathered using a qualitative method. Ethnographic, naturalistic, anthropological, or participant observer research are examples of qualitative research techniques. The qualitative research technique looks at variables in their natural environment and collects thorough information using open ended inquiries. Researchers can gather detailed information about aphenomenonandexplainit usingnon numerical datathat is analysedusing narrativeordescriptiveapproaches. Inqualitative research,a variety ofdata collectionmethods are utilised, including case studies, ethnography, grounded theory, interviews, open ended questionnaires, focus groups, content analysis, audio recordings, and picture analysis. However, in this study, closed ended and open ended questionnaires were used. The closed ended survey technique was used mainly for the demographic data. The aim of this research is based on an open ended survey. The method is used for this research due to a lack of extant research and to collect "natural data" with strong validity. An open ended questionnaire allows participants to react in their own terms rather than presenting them with a fixed selection of possible answers. The validity of open ended research findings is high. The Bag of Words (BoW) was used for initial data analysis. In other words, a bag of words is used for feature extraction, or extracting features from textual data. The method is used to solve problems in language modelling and document classification. The model was developed using Orange software. The technique is concerned with the count and frequency of occurrence of words in a document regardless of their location in the document. It is useful for feature extraction or featureencodingindocuments.BoWisoneoftheversatiletextual miningtechniquesofnatural language in which variable length texts are converted to fixed length vectors. However, BoW does not recognise the semantics of the words in a document. Therefore, further qualitative data analysis was conducted. Although there is no set procedure for conducting qualitative research, there are several well known strategies and stages that can be followed to provide reliableandvalidresults(Olanrewajuetal.,2022).Inthisstudy,thefollowingstepsweretaken: a) Familiarization, b) Identifying a thematic framework, c) Textual coding, d) Review codes, e) Revise or combine themes, f) Mapping (i.e., figures) and interpretation
212
Although COVID-19 has been discussed in the construction management literature, there is little research on how COVID 19 affects quantity surveying practise in the construction sector. Therefore, this study is not guided by any well established ideas in the literature but rather by practise and experience. This paper reports a study that investigated the changing roles and duties of quantity surveyors in the Nigerian construction sector. The Nigerian construction sector is large with a contribution of about 4%, or ₦ 2,448,716.21 million in 2020 and 2,524,386.15 million in 2021,to theGDP at constant price (NBS,2022). Thedata also revealed that construction contributed 9.99% to nominal GDP in the fourth quarter of 2021, higher than the 8.40% it contributed a year earlier and higher than the 9.26% it contributed in the third quarter of 2021 (NBS, 2022). There are many professionals in the Nigerian construction sector. Quantity surveyors are vital members of those professions, for without them, many projects would be delayed, abandoned, unnecessarily expensive, with poor standards, and many clients and contractors would meet in court to settle their disputes.
213 Proceedings of the PAQS Congress 2022, 12th 13th September 2022, Singapore Institute of Surveyors and Valuers, Singapore
Year Less than 5 years 5 10 years 11 15 years 16 20 years More than 20 years
The snowballing technique was used to administer the survey questionnaire. Snowballing is a data collection approach in which a survey is administered to respondents who are available, accessible, and willing to participate in the research. The approach is appropriate when sufficient information on population size and sample frame is not available. For example, quantity surveyors that received the forms were requested to forward the forms to their colleaguesorfriendsthatwerecompetenttorespondtothesurvey.However, whilethefindings may lack external validity, they can be representative when there are a significant number of respondents. As a result, the underlying concept is that if enough data are gathered and objectivity is maintained, the results are generalisable to the population and beyond. The co author administered the surveys to the respondents via the Nigerian Institute of Quantity Surveyors' media platform. The survey was launched on 4/12/2021 and opened until 15/01/2022. Respondents were asked to describe the roles and duties they would be expected to perform post pandemic based on the lessons learned during the pandemic based on recent evidence.
Table 1. Your work experience (year) in the construction sector
Frequency (%) 4.9 12.2 15.9 17.1 50.0
4 Analysing and interpretation of the results of the survey
The online survey form was administered to more than 300 quantity surveyors. Because snowballing was used, the exact number of survey forms administered is not known. However, by the cut off date, 84 responses were received after several reminders.
More than 95% of the respondents have worked in the construction sector for more than 5 years, and 70% have between 10 years and 20 years of work experience (Table 1). Half of the respondents have more than 20 years of work experience. Almost 80% of the quantity surveyors are involved in the upstream and downstream segments of the construction sector (Table 2). The respondents are affiliated with the leading quantity surveying organisations in and outside of Nigeria. Most of the respondents held strategic or senior management positions in the organisations they worked for or at (Figure 1). Figure 2 contains the communication platforms used by the quantity surveyors, and the social networking applications that quantity surveyors used more frequently to support their services during the pandemic are numerous (Table 3).
Data analysis was carried out in this study using descriptive and synchronisation techniques. Descriptive analysis involves presenting data in a straightforward format that may be easily interpreted. Data is summarised using graphical explanations, tabular descriptions, and statistical comments. A literature review is used to support the qualitative data acquired throughout the synchronisation process.
3.1 Data Analysis Method
4.1 Analysing the respondents’ profile and practices
214 Proceedings of the PAQS Congress 2022, 12th 13th September 2022, Singapore Institute of Surveyors and Valuers, Singapore Organization Consultantsurveyorsquantity Contractors suppliersMaterial Other Frequency (%) 54.8 22.6 19.0 3.6 Table 2. Type of organization
Table 3 Social networking applications use by the respondents during the pandemic
Figure 2 Communication platforms used during the pandemic 4.2 The emerging roles and duties of the quantity surveyors post pandemic A BoW model was developed for the data obtained. Stop words were used as part of the textual clearing process. In the pre processing, tokenization, normalisation, and filtering were used.
Binary was selected to estimate frequency and IDF for document frequency. The bag of words generates 463 tokens and 299 types. The Euclidean distance was for regularization. Figure 3 displays the BoW model for the emerging roles of quantity surveyors post pandemic. The model revealed that the pandemic has led to a lot of disputes, claims, cost overruns, disruptions to projects' budgets and schedules, resource shortages and fluctuation, and monitoring projects. It is also obvious that active clients' involvement and understanding are strategic even though the need for risk evaluation is also necessary. Because of these problems, especially immediately post pandemic, there is a need for significant dispute resolution measures. Claim
302520151050 Principal Partner Partner SeniorSurveyorQuantity ManagingDirector Project Manager Other 100806040200 Zoom MicrosoftTeams Google Meet Skype Microsoft 365 Dropbox
Figure 1. Respondent’s position Application WhatsApp Facebook Google+ Linkedin Instagram Email Twitter Other Frequency(%) 45.88 11.18 10.00 7.10 5.29 5.29 4.71 10.59
215
Figure 3. Bag of words model of emerging roles of quantity surveyors post pandemic

Figure 4 depicts the 15 thematic roles and responsibilities of quantity surveyors following the pandemic. Quantity surveyors must embrace value added tools, skills, and knowledge in order to remain competitive. To deliver value added services, quantity surveyors must be involved in both the downstream and upstream sides of the supply chain and the construction market at both the strategic and operational levels. Appendix I contains word for word descriptions of the summary of roles and emerging roles of quantity surveyors following the pandemic. A Pareto analysis indicates that four of the roles and duties explain 80% of the total services. The main emerging role of the quantity surveyor is claim management. The global construction sectoris facing a shortage ofskills, lowproductivity,shortage of materials, delaysand shortage of machineries, which has led to disputes (Olanrewaju, et al., 2021). These challenges would cause disputes and conflicts and would lead to claims. Hence, it is not surprising that claim management, settling of disputes, and conflict resolution would be critical services that quantity surveyors need to provide, especially after the pandemic. In fact, the data revealed that disputes and claims have increased by some 80% due to the COVID 19 pandemic. The cost of disputes in the construction sector is very significant for stakeholders. Based on research involving many countries, Acardis (2021) found that the pandemic has exacerbated construction disputes and that more than 75% of projects encountered disputes and claims that are specific to COVID 19. Furthermore, the global construction claims amounted to 46.3% of the planned project costs (HKA, 2021). Therefore, it is not surprising that quantity surveyors’ roles and duties in claim management are required. Disputes are unresolved disagreements or resolved claims that may result in litigation in the courts. A disagreement often arises about what the contractors consider their entitlement in the form of money or time, but which the clients perceive otherwise and see as an unnecessary expense.
Proceedings of the PAQS Congress 2022, 12th 13th September 2022, Singapore Institute of Surveyors and Valuers, Singapore management,[re] forecastingofbaselines are requiredand contract clauses wouldbeexamined to address some of the problems facing projects during the pandemic. The rate of application of technologies (i.e., digitisation) would increase. However, because BoW considers only the count and frequency of words in the document regarding the semantic and order, moving forward, further qualitative analysis was conducted (see Appendix I) and on the basis of which thematic analysis was presented in figure 3.
216 Proceedings of the PAQS Congress 2022, 12th 13th September 2022, Singapore Institute of Surveyors and Valuers, Singapore
The pandemic affected project costs. The data revealed that the COVID pandemic has increased project costs by more than 40%. This figure is similar in other countries (Ling et al., 2021). Even though, traditionally, cost management is a function of quantity surveying. However, the pandemic increases the cost of projects due to poor productivity, shortage of key resources, delays, and other reasons. Hence, the completion cost of projects becomes very critical in order to minimise cost overrun. It is not a matter of avoiding cost overruns but of reducing the impact of collaborative strategy and resource management.
Figure 3. Thematic analysis of emerging roles and duties of the quantity surveyors

Material costs constitute a significant part of the construction costs, which may be up to 60% in most cases. However, during the pandemic, construction materials are also in short supply and expensive (Ling et al., 2021). Materials were wasted during the pandemic, and manufacturers could not operate. The supply chain is disrupted by labour and material shortages and the termination of contracts by the government. The material shortages led to an increase in project costs. However, because of the shortage and cost of materials, many contractors were forced to import materials, which were often expensive as compared to the local materials. The delivery period would also affect the cost of the projects. All of these require the expertise of the quantity surveyors to ensure that cost overrun is cut to a minimum and the project schedule is brought into focus. Therefore, it may not come as a surprise to find that for the project to be completed within budget, the quantity surveyor’s involvement in material delivery is increasing.
While some sites were allowed to operate during the pandemic, many others were shut down. Most governments only allow about 50% of sites to operate, and only 50% of the workers are allowed to enter sites. The lack of accessibility to sites also impact quantity surveyors’ activities and services. Hence, technologies are deployed to many sites to monitor the project
217 Proceedings of the PAQS Congress 2022, 12th 13th September 2022, Singapore Institute of Surveyors and Valuers, Singapore
The data also revealed that construction management functions are increasingly becoming prominent for the quantity survey to perform. Construction management aims to improve the quality of relationships among parties and to accept the objectives of the projects (Radosavljevic and Bennett, 2012). The responsibilities of construction managers are to both the clients and the construction team. To the client, construction management is a service that provides a client with total management of the client value system (e.g., schedule, quality, cost, safety, etc). The quantity surveyors are expected to perform outside of the cost management functions and advise on procurement strategies. In this arrangement, the client enters into a contract with the trade contractors and the quantity surveyors as the client’s representative and coordinates the services of the other members of the design and construction teams. Although the traditional procurement strategy remains dominant, construction management and management contracting strategies are increasingly replacing it. COVID 19 is accompanied by a lot of problems. Every construction project has a contract document that specifies the pricing, terms, conditions, timetable, and scope of the work to be completed,as well as anyotherjob specificinformation.Aconstruction contract contains more than one document. To avoid a breach of contract, it is important that all agreements and conditions in documents are adhered to by both the contractors and clients. However, the pandemic disrupts construction activities and procedures to the extent that the scope of work, drawings, conditions, agreements, and specifications of many projects are changed. The new conditions and regulations require a lot of responsibilities on the part of the quantity surveyors to rewrite the terms to comply with the new conditions and regulations. Besides, this role empowers the quantity surveyors as the contract administrators or managers. Conventionally, architects are the contract administrators of building contracts and engineers for engineering contracts. Lately, however, quantity surveyors, project managers, and construction managers are performing these roles. The contract manager is a client representative and is paid for by the client. The contract manager or contract administrator performs two functions, namely agency functions and decision making functions. In discharging these functions, quantity surveyors need to be independent, impartial, honest and fair to the contractors and suppliers. In these positions, the quantity surveyors will give advice on variation, assess claims, certify payment to the contractors and suppliers for loss of expenses, and award extensions of time, among other roles.
During the pandemic, a lot of renegotiations of the contracts were conducted, which resulted in re evaluating the client value systems. This may impact the size of the projects and the cost of the projects. Client management entails strengthening the relationship between the client and contractors, in particular, and the project team, in general. The relationship requires compellingstrengthening duringuncertaintiesto enhancethe confidenceof theclient to honour payment and understand the essence of the contractor’s claims. Client management is about trust, confidence, communication, transparency, and assurance. The absence of which affects the progress of the project. It goes beyond completing projects on time and within budget, to achieving expected quality standards, and achieving a systemic client value system (Olanrewaju, 2013). Client management involves making sure that changes in the projects due to the impact of the pandemic are verified and approved by the clients. It also includes advising clients on payment schedules, interest on borrowed money, and other criteria within the client value system. The value systems of the entire client organisation were re examined to reduce without compromising other criteria of the organization's value systems. Like never before, these roles are critical to avoiding disputes and conflict, project abandonment, or unused completed projects. The entire impact of the pandemic, especially on the cost of the project, would affect the client organisations. During the pandemic, a lot of clients interfered with the construction activities more than usual. While some clients want to take possession of the projects, some clients cannot take possession of their completed projects due to movement restrictions and other health and safety regulations that the government enacted. A lot of variation orders were issued because of the pandemic awareness by the clients. The design and configuration of the buildings can reduce or increase the spread of similar viruses in the future. However, all of the cost implications, which the client needs to be educated carefully on the consequences of their decision, especially during the uncertainty, need to be properly Commercialdocumented.management
appears to be a new role for quantity surveyors, which is expected, though. The corporate client expects the quantity surveyors to provide services on the business opportunities and profile of the profit margin on the projects. The demand for many construction projects, especially offices, commercial buildings (i.e., malls, etc.) and luxury residential units, is seriously impacted by the pandemic. With the changing profile of the working culture, many organisations now require staff to work from home. Many office buildings have been vacant for some time, and high cases of property overhang have been reported globally. As a result, clients are demanding that the quantity surveyors provide guidance on the lease agreement and rental prices on completed and ongoing projects to maximise profit margin. However, it is surprising that the quantity surveyors did not include building maintenance management, refurbishment, and renovation. A lot of vacant buildings have decayed due to lack of use and maintenance during the pandemic. The low demand for office buildings would be accompanied by significant refurbishment of the buildings. Many of the offices and commercial buildings have been refurbished into residential buildings.
218 Proceedings of the PAQS Congress 2022, 12th 13th September 2022, Singapore Institute of Surveyors and Valuers, Singapore productivity and progress of work and to conduct meetings. Many deployed tools like drones, on site cameras, and 3D modelling for monitoring project performance and online meetings were conducted using platforms like Zoom, Microsoft Team, and Google Meet. Quantity surveyors are now relying on digital tools to provide value added services. Only specific services that require onsite visits would demand physical site visits. This would save a lot of the quantity surveyors’ time and expenses. Quantity surveyors have been very traditional in their service delivery, which has hampered their productivity. In fact, in many countries, e tendering is still not popular. To maximise the potential of technology, the quantity surveyor must learn how to use it.
The pandemic demands the quantity surveyors to have close contact with the site productivity and resource planning to reduce the extent of cost overrun to prevent certifying less or more than what thecontractors orsuppliers areentitled dueto multipleandexcess variationorfailure to grant the necessary extension oftimethat the contractorsdeserve. It may bearguedthat there is a need for quantity surveyors to spend more time on site to provide fair and reliable reports.
219 Proceedings of the PAQS Congress 2022, 12th 13th September 2022, Singapore Institute of Surveyors and Valuers, Singapore
Financial management functions will remain as part of the core services that the quantity surveyors provide. However, it would include new aspects. For instance, to include an accurate estimate of cash flow from the contractors and suppliers and cost control toward ensuring successful completion of the project within budget. Many contract conditions were violated or broken during the pandemic in order to comply with the safety management policy enacted by governments or organisations. In many cases, parties failed to arrive at an amicable resolution or agreement, which thereby led to litigation. The quantity surveyors, being the experts in construction contract and procurement functions, are required to provide initial "legal" advice to parties prior to proper case filling if the case is not settled "onsite" (e.g., using the ADR technique). Despite recognising that litigation is not the best method to address claims, it still remains a major method of resolving claims. However, the pandemic escalates the nature and extent of the expert witness services that quantity surveyors conventionally provide. This will continue to be required for some time, especially as construction contracts are becoming more complex.
5
Research implications and limitations
Although where the contractor has a site quantity surveyor, the consultant quantity surveyors may interact and exchange information, their interest is in the contractors. It is only natural that they would protect the interests of the contractors and not those of the clients. However, adequate information management and the use of digital tools may help. Most of the projects, especially small and medium sized projects, do not leverage the use of the technologies well to a large extent. It is not surprising that information management comes out to be important because many claims arise whose settlement depends greatly on proper documentation. The parties relied heavily on up to date and accurate records to file or reject claims. Accordingly, to justify a claim, for example, numerous records of site meetings, progress reports, invoices, receipts, and conversations are required.
This research has contributed to the little but growing body of knowledge on the impact of COVID 19 on construction management practice. The findings would constitute part of the foundation research on the competency of quantity surveyors. However, a major limitation of this research is probably the sample size. However, because an open ended survey is used for the data collection, it is obvious that the respondent size is sufficient, more so because the positions and work experience of the respondents are strategic and high. It would be interesting if future research could investigate the emerging roles and duties. Future research should examine roles and duties quantitatively. Information is fundamental to the successful completion of projects. Before the pandemic, a lot of information was available in the offices, sites, and from colleagues. Making sure that all parties have access to valid information is paramount. The quantity surveyors had to adapt to alternative means of collecting valid data to makeinformed andunbiaseddecisions becauseit maybedifficult to justifyrelying onthework of contractors whose interests they are protecting or working for. Nor will a contractor rely on information from the subcontractor’s representatives to pay the subcontractors without appropriate verification. In practical terms, it is necessary for quantity surveyors to continuously upskill their competencies in order to be able to perform the emerging services in order to provide value added services. Academic institutions offering quantity surveying
7 References AGC (Associated General Contractors, 2020) AGC Coronavirus Survey Results (May 4 7, 2020). [Accessed 25 June 2020]
Hansen, S., Rostiyanti, S. F., Rizaldi, R., & Andjarwati, C. (2021). Quantity Surveyors’ Response to the COVID 19 Outbreak: A Mixed Method Approach. In Journal of the Civil Engineering Forum (Vol. 1000, No. 1000).
ILO (International Labour Organization, 25 January 2021) ILO Monitor: COVID 19 and the world of work. Seventh edition Updated estimates and analysis.
220 Proceedings of the PAQS Congress 2022, 12th 13th September 2022, Singapore Institute of Surveyors and Valuers, Singapore programmes should revise their programme structures and syllabi to reflect the increasing demand for the services of quantity surveyors.
Constructionhttps://www.agc.org/sites/default/files/2020_Coronavirus_SixthEdition_total.pdfManager(23June2020)COVID19Causingextra15%productivityloss on UK sites. Available at.https://www.constructionmanagermagazine.com/covid 19 causing extra 15 productivity loss on uk sites/ [Accessed 25 June 2020]
EIC (European International Contractors2020) COVID 19 and the Global Construction Business. https://www.eic federation.eu/covid 19 and global construction. Gavrilov, G., Simov, O., & Trajkovik, V. (2020, September). Analysis of Digitalization in Healthcare: Case Study. In International Conference on ICT Innovations (pp. 202 216).
Springer, Cham.Olanrewaju, A. Sanmargaraja, D., & Kean, B. K. (2022). Big data and construction management. Techies, 14, 05 07.
6 Conclusion The expanding and emerging roles and duties of quantity surveyors are happening at a time when there is a greater shortage of quantity surveyors. This research investigated the emerging roles of quantity surveyors’ post pandemic based on the lessons learned during the pandemic. The consultant quantity surveyors now rely on the clerk of works and suppliers for information on what is happening on the construction sites, especially for the preparation of the interim valuation for the periodic payment. This synergy requires high level collaboration and trust management. This can be complemented by the use of technology. While face to face interaction would be dominant, there is greater flexibility in the working culture in the construction sector. This may lead to problems without a high level of trust between the client and quantity surveyors. Many will still be working remotely, and technologies will be in high demand. This research has contributed to the sustainability of quantity surveyors as a result of their culture of adaptability and elasticity. The understanding of the roles and duties of quantity surveyors would reduce skill shortages. To reduce project costs and shorten project duration, quantitysurveyorsneedtosharpentheircompetenciesincost,claim,andcontractmanagement. Quantity surveyors should be involved in the procurement and delivery of materials and components. This function should not be left entirely to contractors. The consultant quantity surveyors will be familiar with the material suppliers. Configuration management should be leveraged for information management. Client organisations should be [re] educated while the project is in progress. The impact of cost and shortage of materials should be discussed with the client organisation continuously, and the consequences of delayed payment and variation should be brought to the attention of the client organisation continuously.
221 Proceedings of the PAQS Congress 2022, 12th 13th September 2022, Singapore Institute of Surveyors and Valuers, Singapore WHOWorldSanmargaraja,RICSRadosavljevic,NBC43.Olanrewaju,Olanrewaju,Ling,e/wcms_767028.pdfhttps://www.ilo.org/wcmsp5/groups/public/@dgreports/@dcomm/documents/briefingnot.F.Y.,Zhang,Z.,&Yew,A.Y.(2022).ImpactofCOVID19PandemiconDemand,Output,andOutcomesofConstructionProjectsinSingapore.JournalofManagementinEngineering,38(2),04021097.A.,AbdulAziz,A.,Preece,C.N.,&Shobowale,K.(2021).EvaluationofmeasurestopreventthespreadofCOVID19ontheconstructionsites.Cleanerengineeringandtechnology,5,100277.A.,&Anahve,P.J.(2015).Dutiesandresponsibilitiesofquantitysurveyorsintheprocurementofbuildingservicesengineering.ProcediaEngineering,123,352360.Olanrewaju,A.A.(2013).Acriticalreviewofvaluemanagementandwholelifecostingonconstructionprojects,InternationalJournalofFacilityManagement,Vol.4,No.1,pp1212(NationalBureauofStatistics,February2022)NigerianGrossDomesticProduct.ReportQ42021.Issue32:QuarterFour,2021.www.nigerianstat.gov.ngMandBennett,J(2012)Constructionmanagementstrategies:Atheoryofconstructionmanagement.WestSussex:JohnWileyandSonsLtd.(RoyalInstitutionofCharteredSurveyors,09May2022)Isthecostofmaterialsholdingbackconstruction?Availableat:https://ww3.rics.org/uk/en/modus/builtenvironment/construction/isthecostofmaterialsholdingbackconstruction.html[Accessed18May2022]D.,Olanrewaju,D.&Kean,B.K.(2020).ImplementationofArtificialIntelligence(AI)intheconstructionindustryduringtheCOVID19pandemicinMalaysia.Techies,10,1922.Bank(June2020)GlobalEconomicProspects.WorldBankGroupFlagshipReport.2020InternationalBankforReconstructionandDevelopment/TheWorldBank.ISSN:10148906.(WorldHealthOrganizatione,2022)WHOCoronavirusDisease(COVID19)Dashboard.Retrievedfromhttps://covid19.who.int/.[asof8:36pmCEST,14April2022]
computing
cost
Review
in terms
Arbitration ✔ ✔ Claims
cost
Application
may
✔ ✔ By
the
will
and management ✔ ✔ ✔ ✔ ✔ Managing
Cost
✔ ✔ ✔ ✔ Resource
bill
the
Dispute resolution which can only be resolved by the Quantity
Quantities specifications ✔ ✔ ✔ ✔ 1. Dispute resolution 2. Preparation of Contractual Claims 3. Contract administration and Project management etc. 1. Dispute resolution 2. Preparation of Contractual Claims 3. Contract administration and Project management etc. ✔ ✔ ✔ ✔
Interpretation of contractual and legal resolution, time scheduling, costs of project acceleration prolongation monitoring on fluctuations of existing contract. educating the party involved need to understand the terms of management of technology Planning Scheduling, planning and control, target completion strategy planning scarce resources of projects in a way that the client's aspirations of achieving its project objectives are still met. planning, cost control will arise which call role of Surveyor. Surveyor Surveyor of with of
and
the contract ✔ ✔ ✔ ✔ Project
and
contract
Quantity
matters Dispute
compliance
222 Proceedings of the PAQS Congress 2022, 12th 13th September 2022, Singapore Institute of Surveyors and Valuers, Singapore 8 Appendix Appendix 1:
Summary of roles of emerging roles of the quantity surveyors post pandemic
because of the
from award Procurement
and cost checks ✔ ✔ ✔ ✔ ✔ ✔ Fluctuations
The role of Quantity
claims ✔ ✔ ✔ ✔ ✔ Project
for the
Please identity the roles of quantity surveyors that see greatest increase pandemic construction management claim management commercial management information management toolsdigital management site management programme management material management time management management client management litigation financial management project management
223 Proceedings of the PAQS Congress 2022, 12th 13th September 2022, Singapore Institute of Surveyors and Valuers, Singapore Timely assessment of cost implications of change requests resulting from impact of the pandemic Cost monitoring and control ✔ ✔ ✔ ✔ Arbitration, assessment of claims, Visit to construction sites, resolution of disputes, assessment of abandoned jobs marketing post contract admin ✔ ResolvingValuation Claims Cost control Cost advise ✔ ✔ ✔ ✔ Construction/Project Management; Dispute Management/Resolution Construction Risk Management ✔ ✔ ✔ ✔ Appendix 1: Summary of roles of emerging roles of the quantity surveyors post pandemic (Cont’d) Please identity the roles of quantity surveyors that may see greatest increase because of the pandemic construction management claim management commercial management information management toolsdigital cost management site management programme management material management time management contract management client management litigation financial management project management 1. Value Engineering 2. Dispute resolution ✔ ✔ ✔ ✔ Assessing claims. Pricing to cater for the new normal. Market survey ✔ ✔ ✔ More Technical know how and trainings Price Economist, technology ✔ ✔ ✔ The use of BIM and other software We have a shift in the way we carry out our duties working at home valuation is currently depending on the Clark of work ✔ ✔ ✔ Assessment of fluctuations and ensuring qualities and specifications are not compromised. Site visits for joint valuations ✔ ✔ ✔ ✔ ✔
224 Proceedings of the PAQS Congress 2022, 12th 13th September 2022, Singapore Institute of Surveyors and Valuers, Singapore
1. Cost controlling 2. Claim management ✔ ✔ ✔ ✔ ✔ ✔ Feasibility studies, project cost management, ✔ ✔ ✔ ✔ 1. The QS understands the construction processes, and knows the universe of documents that frame the obligations of both parties; 2. The QS is uniquely positioned to understand the deliverables of the 3.contractTheQS is a bridge between the engineering and legal functions, to the benefit of the project
Early engagement of the QS throughout the lifecycle of a project from planning to closeout, and not just when there’s a dispute will safe both time and money. This way, costly disputes could be avoided. * The QS will ensure that the contract drawn up is realistic. He’ll be on top of what the project actually requires. He’ll know where the potential problems are going to be, well in advance ✔ ✔ ✔ ✔ ✔ ✔ ✔ ✔
Aspect of project management Advice on best procurement method and choice of contractor ✔ ✔
Be abreast of materials price fluctuations and labour within applicable localities. And hence do justice on differing conditions and therefore solving problems on either sides of the divide. Sharp rating techniques ✔ ✔ ✔ ✔ ✔ ✔ ✔ Post contract administration. Evaluation of claims. Project management. ✔ ✔ ✔ ✔
The roles of a quantity surveyor are as projectfollows:scheduling, supply chain, tendering, cost controlling, and claim management.
commercial
information
claim
Appendix 1. Summary of roles of emerging roles of quantity surveyors pandemic (Cont’d)
the
construction management management management management management managementsite management
Please identity the roles of quantity surveyors that may see greatest increase because of the pandemic
toolsdigital cost
225 Proceedings of the PAQS Congress 2022, 12th 13th September 2022, Singapore Institute of Surveyors and Valuers, Singapore
post
programme ementmanag material
time management contract management client management litigation financial management project management Variations, fluctuations, contractual claims, adjustments of provisional quantities etc.. BIM, Drones, GIS etc ✔ ✔ ✔ ✔ ✔ ✔ ✔ Costing variation claims Increase preliminary costing Nil ✔ ✔ ✔ ✔ Preparation of Claims Alternative Dispute Resolution Contractservices Auditing etc. Same as above ✔ ✔ Dispute resolution, feasibility study, viability study, Dispute resolution, feasibility study, viability study, ✔ ✔ ✔ ✔ ✔ Settlement of claims ✔ Mediation, Claim management and Project Management Claim management and Arbitration ✔ ✔ Project Cost feasibility study, Project budget, Cost Planning and Preparation of Claims Arbitration ✔ ✔ ✔ ✔ To ensure the contractor is pay on time by timing valuing the work done ✔ ✔ ✔ ✔ *Budgeting*Motivation*Planning*Forecasting *Budgeting*Motivation*Planning*Forecasting ✔ ✔ ✔ ✔ ✔ To calculate claims & expenses Additional services such as material schedule ✔ ✔
Negotiation of labour Purchase of materials Use of materials Pre and post contract roles ✔ ✔ ✔ ✔ Arbitration ✔
They will seve as mediators,Cost controllers and advice clients on the best possible ways to handle there projects within budget. Enough awareness by means of conferences or providing a common social platforms,to enlighten especially the younger Quantity Surveyors on the modern ways to handle projects which could be cost effective,less the frequency of disputes and even with higher delivery standards generally. ✔ ✔ ✔ ✔ ✔ ✔ Ability to work within the clients budget. ✔ ✔ Adjusting the rates ✔ ✔ ✔ ✔ Claims administration, contract admin, cost advise Pricing of works ✔ ✔ ✔
Proceedings of the PAQS Congress 2022, 12th 13th September 2022, Singapore Institute of Surveyors and Valuers, Singapore
Dispute resolutions duties ✔ ✔ The quantity surveyor is to play that important role of construction cost expert puting into account the situation of the pandemic. Same as above but, with more of digitalization. ✔ ✔ ✔ ✔ ✔ ✔
Please identity the roles of quantity surveyors that may see greatest increase because of the pandemic construction management claim management commercial management information management toolsdigital cost management site management programme management material management time management contract management client management litigation financial management project management
Appendix 1. Summary of roles of emerging roles of the quantity surveyors post pandemic (Cont’d)
Traditional QS roles and technology based QS roles Technology based QS roles ✔ ✔ ✔ ✔ ✔ Contract administration processes
226
of the PAQS Congress 2022, 12
Cost RiskArbitratorManagementAnalyst Project ProjectResourceSoftwareestimates/forcasttechnologyapplicationschedulingmonitoring ✔ ✔ ✔ ✔ ✔ ✔ ✔
and
227
Singapore
Dealing with ManagementClaimsofcontract with uncertainty Cost modelling in uncertainty prone future projects ✔ ✔ ✔ ✔ ✔
Arbitration and mediation Arbitration and mediation ✔ ✔ Create an understanding that the pendamic is transient and not permanent. It go with time. There had been such economic downturns before. More on cost plan and cost control all through the conception and completion of projects. ✔ ✔ ✔ ✔ Budget be more thorough and reflective on the current demands. Cash flow should take cognisance of individual activity demand on the project, instead of merely distributing cash flow across the project. There should be more advocacy on quantity surveying services to the public generally. There should be retraining and retraining for best practices. Localities differences be accommodated. Ethical rules be strictly adhered to. NIQS and QSRBN should have more synergy and avoid areas of conflicts. ✔ ✔ ✔ ✔
September 2022, Singapore
There should be an integrated project delivery system that will limit the physical activity especially during the procurement phase. BIM should be adopted and eventually implemented in construction projects ✔ ✔ ✔ ✔ ✔
Consideration is made on contract and a certain amount of money paid to contractor to cushion the hardship. Transmission through working materials ✔ ✔ ✔ ✔ ✔ ✔
Proceedings th 13th Institute Surveyors Valuers,
of
Lump Sum Contracts in Uncertain Times: How do we Make our Construction Contracts Future Proof?
C&W Services (S) Pte Ltd, Singapore/Philippines
Soon enough, borders were closed, movements were restricted, and for a moment the world stood stillas wewatchtheevents unfoldright beforeoureyes. In aneffortto containthespread, we saw our projects freeze in time, machineries on idle, workers gone and the cacophony of noise so typical in construction sites is no more. Stillness. Quiet.
Keywords Construction contract, lump sum contract, procurement. 1 Introduction Pandemic, wars, hostilities words we only read in our construction contracts but did not expect to experience in the course of its performance. In a span of several months from the time the WHO declared the corona virus pandemic in March 2020, the world we know was turned upside down and transformed in a way that is unrecognizable.
Jose Carlo Padilla, josecarlo_padilla@yahoo.com
Fastforwardto2022, whenwearejustrecoveringfromthedevastatingeffectsofthepandemic, another world event occurred. And all of a sudden, we are in the brink of another catastrophic event which could leadto anotherworldwar,fortunatelyit did not but its effects arefelt outside
Abstract The globalisation of the world economy means countries are becoming more reliant on each other for the supplies of goods and services, and in turn, making the entire supply chain vulnerable to disruptions. The need to maintain open boarders was apparent when countries started closing off their boarders after the declaration of World Health Organisation in March 2020 of the novel corona virus pandemic. The restrictions in the movement of both people and goods has disrupted the global supply chain which resulted in high inflation, increased demands, and decreased supply. Just as we are recovering from the devastating effects of the pandemic, the Russian invasion of Ukraine resulted in a barrage of sanctions from different countries which again has devastating impacts on the global supply chain. The pandemic and the political instability had delibitating effects on the construction industry with the contractors incurring loses at best and their contracts being frustrated at worse. The lump sum contract, arguably the most common form of construction contract, is examined in this paper. It is the belief of this paper that until the attitude towards risk shifts, the lump sum contract may not survive this ever changing times. The purported inflexibility of the lump sum contract, when put in today’s context, put the parties at risk the contractors terminating the construction contract and the employer with an incomplete project and unmet requirements. This paper believes that for this form of contract to be viable in the future, it needs to change in a way that it spreads the risk to both parties in the construction contract.
228 Proceedings of the PAQS Congress 2022, 12th 13th September 2022, Singapore Institute of Surveyors and Valuers, Singapore
2
229 Proceedings of the PAQS Congress 2022, 12th 13th September 2022, Singapore Institute of Surveyors and Valuers, Singapore far and beyond the war zone. The embargos and sanctions issued against Russia has further exacerbatedthe already strainedglobalsupplychain.Suchis thestateoftheworld in anutshell.
2.1 Inflation & Construction Indices
The past couple of years proved that change is necessary especially in these uncertain times. With thefragilityoftheinstitutionsthatsurroundstheconstructionmarket andits susceptibility to succumb to these factors through increase in costs, the lump sum contract has proven to be inflexible to accommodate these changes. In places where inflation is at its highest, contractors are left to take in the additional costs with no recourse in the contract. Both parties, the employer,and thecontractor,in seeking to protect theirfinancialinterests are left onastandstill and in a fixed lump sum contract where no remedy for fluctuations is provided, the contractor is left to bear all these costs to their detriment. In this case, the risk of the contractor becoming insolvent is high and the employer may end up an incomplete project. Add to that risks of disputes arising from these parties is increasing. Hence, we are left with the question, is the fixed price lump sum contract the future of contracting? Literature Review
Globalisation of the world economy means countries are becoming more reliant on each other for the supplies of goods and services, and in turn making the entire supply chain vulnerable to disruptions. The need to maintain open borders and preserve peace among nations became increasingly apparent because when these are threatened, the supply chain becomes volatile and this results to uncertainty.
Construction costs, over the past years, has been on an upward trajectory. As the world enter the post pandemic reality and live with the sanctions imposed due to the Russo Ukrainian war, a semblance of normalcy typically seen in the days prior to these events are becoming more obvious. The construction indices, however, do not show any sign of going back to their pre pandemic levels. The forecasts are nothing but grim. In an article published by the business times, Linesight, a multinational cost consultancy firm expects that the prices of steel will remain high and the expectation of downward trajectory only to be seen in 2023 (Zhu, 2022). This projection is similar to the position taken by another consultancy firm, Arcadis. The Arcadis report posits that the inflationary environment caused by the geopolitical tensions has created an uncertain and volatile market. The report also acknowledges the increased risk brought about by the pandemic and the war, and as a result the industry is facing difficulty in predicting construction costs (Beard, 2022).
At the height of the pandemic, the volume of construction projects significantly decreased which created a competitive market that resulted in lower bids. As we enter a post pandemic world, a resurgence of construction projects which were stalled and put on hold in the past two years is seen. This resurgence does not only affect the risk appetite of the tenderers, it also greatly affects the supply chain. The pressure put on by the increased demand in both materials andlabourputstheconstructionmarketatriskofshortageswhichmayresult inagain,increased costs.
Change is not new to the industry. For the past several years, the construction industry is experiencing a revolution. The climate crisis has served as a catalyst for change, with the constructionindustryaccountingfor40%oftheglobalcarbonemissions,itgoeswithoutsaying that the construction industry must change. And it has and is continuously doing so.
3 Methodology In answering the research question posted by this paper, the author conducted a qualitative research approach which included review of existing literature that discusses the problem area. The literature that was reviewed includes previous scholarly research outcomes showing the trends of the construction prices, case laws, textbooks, journals, and commentaries published online.
230 Proceedings of the PAQS Congress 2022, 12th 13th September 2022, Singapore Institute of Surveyors and Valuers, Singapore A study conducted in the United States showed that inflation in construction is on an unprecedented rise. Zarenski, in his study, found that the inflation for non residential building rosefrom an averageof4.4%in 2019to 9%in 2021(Zerensky, 2022).Similarly,forresidential buildings the average 5.3% inflation in 2020 sharply increased to 14% in 2021. This rate is the highest since 1978. This trend is not exclusive to the United States alone.
The inflation and rise in construction indexes are felt around the globe and puts pressure on longtermcontractsenteredintobeforethepandemicandwhosecontractperiodextendsbeyond this. In a fixed price lump sum contract, and where no price adjustment provisions in the contract to account for increased costs, the contractor is left to bear all these additional costs.
2.2
In the Philippines, a publication issued by the Philippine Statistics Authority shows that the Construction Materials Price Index is also on the rise in the National Capital Region. In March 2021 the price index for the construction materials is at 1.2, for the same period in March 2022 it increased to 4.8 (Mapa, 2022).
Another measure of the movement in construction prices is through the Tender Price Index (TPI). In Singapore, the published TPI serves as benchmarks in terms of movements of construction related trades such as manpower, materials, equipment, risk, and profit allowance by contractors among others (SISV, 2022). The circular on construction TPI issued by the Singapore Institute of Surveyors and Valuers also showed an upward trend. In the circular, the Building and Construction Authority shows an increased TPI in the first quarter of 2022 at 126.5 as compared to 117.1 in 2021.
Construction projects, with substantial amount of procurement values and contract sums, takes years to complete. This puts the parties at risk, especially the contractor, to price escalations or fluctuations in the course of the performance. Cost certainty for the employer and accuracy for the contractor play an important role in achieving their financial objectives. In these circumstanceswhereinflationisrising,theeasiest waytotransferthisriskis withthecontractor accepting them through a lump sum fixed price contract. Without a fluctuation clause the contract sum is certain, save for variation orders. This in turn creates the possibility of having more costly price proposals since the contractor has to account for risks that are unforeseeable, including inflation. The employer may end up with a contract with higher cost certainty but not necessarily with the best value. And thus brings the question back, are lump sum contracts still the future of contracting?
Effects of Rising Costs
Findings
Hence, the greater the cost certainty is, the more advantageous it is for the employer.
231 Proceedings of the PAQS Congress 2022, 12th 13th September 2022, Singapore Institute of Surveyors and Valuers, Singapore 4
Klee argues that in a controlled economy, prices were formed artificially and that the perceived fixed nature of the price i.e., it being immune to changes induced by the market, has allowed governments to use fixed prices as indicators to regulate the consumption of the general public (Klee, 2015). This notion when put in the context of construction contracts, which are usually long term endeavors, appears to be incompatible and the only way for the tenderer to allocate this risk is through increasing their margin which may result in higher tender proposals. One way to counter this is through risk sharing, if the parties agree to share the risks of costs fluctuations, the probability of getting more competitive tender proposals is increased.
4.2 The Price Proposals
Taschereau JJ , in the case of The King v. Pradis & Farley, held that the expenses incurred for
and Discussion
Risks typically associated with construction contracts are allocated to the employer and contractor, and to third parties such as insurers. If the contractor, in the event of an unforeseen risk occurring, and fails to mitigate the effects arising out of that occurrence, may have a negative impact on the contract, and in extreme cases may lead to the premature termination of the contract. Thus, understanding how price proposals are calculated would lend insights how to navigate and adopt in these uncertain times. While there is a plethora of methods in calculating the price of a construction project, the most common way of doing this is by determining the unit cost of a specific scope of work and then adding a percentage of margin (Klee, 2015). This margin may include unforeseen site conditions, inflation,overheads, profits, among others.
Another facet of why employers tend to prefer fixed price contract is because of cost certainty. More often than not, employers’ resort to financing to fund their construction project. This process may include negotiating the terms of their loan from financial institutions that would lend them the required funds for the project. And as a result of this, the lenders or financial institutions monitor not just the employer’s behavior but that of the contractor as well. How the parties comply with the terms of their construction contract such as management of variations and calculation of the contract price will be looked at by the lenders (Klee, 2015).
One of the biggest risk a contractor may take in submitting a price proposal is the unforeseen site conditions. In cases where adverse site conditions are encountered, in a lump sum contract, these all falls within the contractor’s risk. In a construction contract where a contractor guarantees that it can build something, and then encounters issues in the course of building it, then the costs incurred because of the issues shall be borne by the contractor. This is the best illustration of a lump sum contract the contractor bears all the risk in the cost of performance (Kelley, 2013). While this scenario appears to be cruel, it is the position of the court.
4.1 The Price Risk and Cost Certainty
Understanding how a price proposal is determined would lend us an understanding on how the risks are allocated between the parties. Construction projects are typically long term endeavors which may take years from planning until completion. In the early stages of planning, the employer has very limited information on the risks that would have an impact on the project. This is where the challenges emerge. The absence of clear guidelines in establishment of the contract is at best problematic, add to this the ambiguity in the terms of the contract, this might be potentially the cause of a dispute (Klee, 2015).
FIDIC Red Book 2017, while not expressly defines the scope of the contract price, the effect of Clause 14, by implication is that unless otherwise provided in the contract, the contract price shall not be adjusted.
(c) Procurement process is less complicated. In procuring a lump sum fixed price contract, the employer issues a full set of tender documents to the tenderers which contains all necessary information that would allow the tenderers submit a price based on the full set of documents. This will result in a fairly accurate tender analysis allowing the evaluation of the tenders to be less complicated and straight forward.
232
While it is clear why lump sum contract’s popularity is justified with its advantages, it is not perfect. Lump sum contracts can be viewed negatively because of the following:
4.3 Nature of Lump Sum contracts Lum sum contract otherwise known as fixed price contract or stipulated sum is a type of constructioncontract wherethecontractor price theworks basedon well definedspecifications and scope of work. Because a lump sum contract is priced based on specific documents which lays out the details of the project and on drawings which shows the extent of the works to be carriedto bringtheproject to completion,it is deemedto beinclusiveofall theworks identified in the contract documents, save for of course, variations.
Unforeseen site conditions and price fluctuations when taken solely by the contractor may lead to an increase in the price of tenders.
Lump sum contracts gained popularity because of the following:
(a) The price risk is assumed by the contractor and therefore relieves the employer of this risk. Absent any instructions to vary and any allowance for adjustments due to material fluctuation, the awarded contract sum will not change. And this is very attractive for employers who have limited budgets because the cost certainty is relatively high. Lump sum contract is also beneficial to a contractor because the opportunity to increase profit margins is always present. For projects which are cost driven, price certainty is top priority and lump sum contract provides this. Save for changes i.e., design and unforeseeable events, the contract price will remain to be unchanged until completion of the project.
(b) Payment is made on regular intervals. Lump sum contracts are paid in predetermined instalments i.e., monthly, or weekly. This allows the employer to properly plan the schedule of payments which may lead to financing of the project easier. In so far as the contractor is concerned this is advantageous because cashflow is reliable and easily predicted. For example, FIDIC Red Book 2017 provides in subclause 14.4(a) allows the contractor to submit a Schedule of Payments specifying the instalments to which the contract price will be paid.
Proceedings of the PAQS Congress 2022, 12th 13th September 2022, Singapore Institute of Surveyors and Valuers, Singapore unforeseen difficulties are considered included in the amount of tender and that the contractor has the legal obligation to perform the contract for the price the parties has agreed upon.
Lump sum contract is so popular that standard conditions of contracts are drafted specifically for this type of contract. For example, Construction Industry Authority of the Philippines in Clause 12(1) of its Uniform General Conditions of Contract provides that the bid submitted by the Contract shall include all things necessary to bring the works to completion including the costs for remedying defects and shall cover all the Contractor’s obligation under the contract.
233 Proceedings of the PAQS Congress 2022, 12th 13th September 2022, Singapore Institute of Surveyors and Valuers, Singapore
(b) Time. Lump sum contracts are based on a well defined set of documents that lays out the scope and the specifications of the works in case of a single stage traditional procurement, and employer’s requirements in case of a design and build procurement. Preparation of these documents takes time and may result in a longer tender process, and for a time sensitive project, this might not be the ideal scenario. And even after the selection of the successful tenderer, the drawings must still be finalized before any construction works can commence.
4.4
Rise and fall clauses remedies this by allowing the parties to adjust their contract sum using a mechanism in the construction contract. A clause that allows the contract sum to change together with the fluctuations of the market is usually included where it is unreasonable for the contractor to assume the increase in costs due to inflation (Barker, 2009).
(c) Documentation. As with any project, the best way to avoid disputes is through proper documentation be it on tracking of changes, instructions that has been issued, or submission of notice. A poorly documented contract may lead to disputes arising out of changes to the scope, inconsistent requirements, and interpretation of contract terms. This is no different in a lump sum contract, with the volume of the documents involved, inconsistencies and gaps between several sets of documents are bound to occur. And a dispute may arise as to the true characterization of a work i.e., a contract work or a variation work. Despite these drawbacks, lump sum contracts have been one if not the most popular mode of contracting. This popularity was threatened when uncertainty in the market hit the construction industry and contractors where left scrambling for solutions to mitigate their loses. And most lump sum contracts do not allow for adjustment of contract price other than those stated in the contract. The perceived inflexibility and rigidity of lump sum contracts when contrasted with the ever changing landscape and volatility of the construction market, makes it risky for both parties to the construction contract. In other words, if the costs of the materials and labor increase during the performance of the contract, the contractor is not entitled for additional costs arising out of this increase.
Rise and Fall Clauses
In a lump sum contract the contractor bears all the risk on costs in the performance of the contract including the unforeseen fluctuations in price for labor and materials (Kelly, 2013).
Rise and fall clauses existed during the Second World War but gained popularity in the 1970s and 1980s during the height of inflation (Cope, 2021). Since then, the market has stabilized, and these were overlooked for many years. Interest in rise and fall clauses has picked up as stakeholders struggle to find solutions to cushion the rapid increase in price of construction materials (Vincent, 2022).
Construction projects are often long term endeavors with contract periods spanning over a coupleorseveralyears.Andtakingintoconsiderationinflationandotherfactorsthatmayaffect the pricing of the works including increase in labor cost, the contractor may submit a price proposal that is potentially higher to cover these uncertainties. Risk sharing, through the
(a) Price Risk. In a lump sum contract, the Contractor bears most of the price risk, this might in turn affect the price proposals i.e., increased tender prices. A contractor that is profit driven may increase its tender prices to account for unforeseeable risks that will become their burden if those events occur.
Cost certainty is often one of the employer’s objectives when entering into a construction contract and fluctuation clauses seems to be incompatible with this objective. In a time where inflation is at its highest, it can be argued that by introducing a fluctuation clause in the construction contract may pose some benefit to the employer. By removing the pressure brought about by inflation and other price increases to the contractor, the possibility of the employer of receiving more competitive tenders is increased (Vincent, 2022).
Fluctuation clauses or rise and fall clauses must be clearly drafted to avoid any ambiguities as to their interpretation. If enforcement of a rise and fall clause was put into question before an adjudicator, and in the process the adjudicator commits an arithmetical error in arriving at the amount, the court will refuse to vacate the adjudicators finding and the same would be binding to the parties (Amey v County of Herford, 2016). These cases illustrate that indeed, there is a real benefit in a correctly drafted fluctuation clause.
Support and preference for rise and fall clauses or fluctuation clauses dissipated when the market stabilized and when its enforcement was put into question. These clauses appear to be attractive but are not without controversy. A poorly drafted rise and fall clause may lead to legal challenges as to its interpretation, and worse, may be rendered unenforceable. In an Australian case, the reference dates included in the clause are incorrect and its interpretation leads to an unreasonable inflation of the contract sum. That lead the court to go back to what were the parties’ intended and ultimately decided on which interpretation is correct (Lewis Construction v. SEA of Queensland, 1973).
234 Proceedings of the PAQS Congress 2022, 12th 13th September 2022, Singapore Institute of Surveyors and Valuers, Singapore addition of rise and fall clauses could potentially result in competitive price proposals. Rise and fall clauses are not new in the construction industry, in fact the International Federation of Consulting Engineers (FIDIC) Standard Form of Contract includes such a clause.
4.5 Cost plus Contracts
A contract where the employer agrees to pay the contractor the costs it incurred in performing the contract and an additional percentage to represent the overheads, profits, and other fees is also known as a cost plus contract (Uff, 2017). This form of contract is another alternative to the traditional lump sum contract. Unlike in a fixed lump sum contract where the price risk is borne entirely by the contractor, the cost plus allocates the risk to the employer which includes the cost of the work including any fluctuations in costs of materials and labor (Kelly, 2013). In this form of contract, variation would play little to no role because any changes would be included in the costs that the contractor would reimburse. While this form may not be suitable in certain projects, it may prove to be advantageous for a contract whose scope of work is difficult to ascertain. Aversion to this form is primarily coming from employers who wants cost certainty and perceives this form as tantamount to signing a blank cheque in favor to the contractor (ICE, 2011).
A typical rise and fall clause include a formula which forms the basis of the adjustment. The formula is typically made up of four elements: the contract price that is the subject of adjustment, the applicable price indices, a risk buffer, and reference dates (Vincent, 2022).
Cost plus contracts, as compared to the traditional fixed lump sum contracts, involves shorter procurementprocessand workscouldcommenceafterthetermsofthecontracthasbeenagreed such as the costs that are reimbursable and the costs that are not, and the additional ‘plus’ cost applied to each and every reimbursement. While there are different iterations of the cost plus
6 References
While both parties’ aim is to complete the project, they have different motivations: with the employerkeeping thecosts withintheapprovedbudget andthecontractormaintainingits profit margin. It can therefore be argued that a fairer risk allocation in construction contract may result in a more accurate price proposals and thus mitigating the possibility of inflated pricing due to uncertainty (Aw & Siong, 2021). While lump sum contracts would still be the dominant form of contract, shifting away from a fixed price contract might prove to be beneficial with both of the parties focusing not too much on the costs but on the project as a whole.
Amey Wye Valley Ltd v The County of Herefordshire District Council EWHC 2368 (TCC, Baker2016)E.
5 Conclusions Fixing the price of a construction contract undoubtedly has its advantages, for instance if the employer is an agent of the government where project financing and loans are involved in funding. In this scenario, the price definitely becomes a political issue (Klee, 2015) especially when the only requirement is how competitive the price is. In reality however, price is almost never certain because of changes to either the scope of works, specifications, or both. And it seems that the only question would be the willingness of the employer to tolerate such changes to the contract sum. Moving away from a fixed lump sum contract would benefit both the employer and the contractor.
By making the contract price protean rather than fixed, increases the likelihood of the completion of the project. In an inflationary market, such as the one we have today, by not allowing the contractor to claim for price fluctuation because of the lack of legal basis, the changes of the contractor losing money and eventually going bankrupt is high. This was seen in the unfortunate closure of Greatearth Construction Pte Ltd in Singapore. And this leaves the employer with an unsatisfied contract, long liquidation process, and recission of the contract.
235
https://decisions.scc csc.ca/scc csc/scc csc/en/item/8426/index.do
Proceedings of the PAQS Congress 2022, 12th 13th September 2022, Singapore Institute of Surveyors and Valuers, Singapore set up, the main is that costs are difficult to predict and this might be one of the biggest drawbacks of this form of contract.
et al. (2009) FIDIC Contracts: Law and Practice. London: Informa Law from Routledge
Lewis Construction (Engineering) Pty. Ltd. v The Southern Electric Authority of Queensland (Supreme Court of Queensland, 1973)
Finally, the current state that the market is in, where uncertainty is rife and volatility is commonplace,risksharingwouldbethe key as the market navigates its way throughthefuture.
In a fixed lump sum contract, procured through single stage traditional procurement where the tender documents are finalised from drawings to specifications to bills of quantities and schedules of works, a mere addition of a fluctuation clause would mean a great deal. Risk sharing in terms of cost for both parties may result in the employer receiving more competitive proposals because the risk of price fluctuations is now shared by the parties.
The King v. Pradis & Farley Inc. SCR 10 (Supreme Court of Canada, 1942).
Finity J. (2022) Construction Contracts: Understanding the 5 Main Contract Types [Online] Available at: https://www.levelset.com/blog/lump sum contract/ (Accessed: 9 June 2022)
Simonson K. (2022) 2022 Construction Inflation Alert [Online] Available at: https://www.agc.org (Accessed: 28 June 2022)
Bailey J. & Turrini M. (2016) Lump Sum Contracts: Not always certain? [Online] Available at: https://www.lexology.com/library/detail.aspx?g=449b3d98 ae2c 4d56 b292 3d1d42ceae07 (Accessed: 14 June 2022)
Clancey J. (2021) Lump Sum Contracts: Advantages, Disadvantages & When to Use [Online]. Available at: https://www.netsuite.com/portal/resource/articles/accounting/lump sum contracts.shtml (Accessed: 21 June 2022)
Zarenski E. (2022) Construction Inflation Analysis for National Data [Online] Available at: https://edzarenski.com (Accessed: 30 June 2022)
Mapa D. (2022) Construction Materials Retail Price Index (CMPRI) in the National Capital Region (NCR) [Online] Available at: https://www.psa.gov.ph (Accessed: 28 June 2022)
236 Proceedings of the PAQS Congress 2022, 12th 13th September 2022, Singapore Institute of Surveyors and Valuers, Singapore Klee L. (2015) International Construction Contract Law. First Edition. London: John Wiley & Sons Ltd Hughes W. et.al. (2015) Construction Law & Management. Fifth Edition. New York: RamseyRoutledgeV.et.al. (2011) ICE manual of construction law. First Edition. Great Britain: Latimer Trend & Company Uff J. (2017) Construction Law. Twelfth Edition. London: Sweet & Maxwell Denny’s N. & Clay R. (2015) Hudson’s Building and Engineering Contracts. Thirteenth Edition. United Kingdom: Sweet & Maxwell Kelly G.(2013)ConstructionLaw:An IntroductionforEngineers, Architects, andContractors. First Edition. New Jersey: Wiley & Sons Bryan et.al. (2011) Do’s and Don’ts: Common mistakes in... lump sum contracts [Online]. Available at : https://www.bclplaw.com/en US/insights/do s and don ts common mistakes in lump sum contracts.html (Accessed: 21 June 2022)
Beard A. (2022) The Year of Inflation: International Construction Costs 2022 [Online] Available at: https://www.arcadis.com (Accessed: 28 June 2022)
Scalisi T. (2022) Lump Sum Contracts: The Pros & Cons for Construction [Online] Available at : https://www.levelset.com/blog/lump sum contract/ (Accessed: 14 June 2022)
Oakland Business Review (2015) Three Common Construction Contracts [Online] Available at: https://www.wendel.com/publication/three common construction contracts/ (Accessed: 14 June 2022)
237
Vincent Y. (2022) ‘Rise and Fall Clauses in Construction Contracts’ [Online] Available at : https://vincentyoung.com.au (Accessed on 19 July 2022)
Zhu M. (2022) ‘High material prices to remain a drag on Singapore construction this year: report’ [Online], Available at: https://www.businesstimes.com.sg/ (Accessed on: 1 July 2022) Aw K. & Siong SC (2021) ‘ Covid’s lessons for the construction industry [Online] Available at: https://www.businesstimes.com.sg (Accessed on 1 July 2022)
Cope M. (2021) ‘What is a rise and fall clause and why might you use one?’ [Online] Available at: https://masterelectricians.com.au (Accessed on 19 July 2022)
ICE Manual of Construction Law (2011) London: ICE Publishing
Proceedings of the PAQS Congress 2022, 12th 13th September 2022, Singapore Institute of Surveyors and Valuers, Singapore
BIM, BIM QTO framework, project cost estimating, quantity surveying (QS).
A comparison between traditional quantity take-off practices vs BIMbased quantity take-off (BIM-QTO)
Glodon International Pte Ltd Lu Change Peh, lukepehlc@suss.edu.sg
Taki Eddine Seghier, taki@ucsiuniversity.edu.my
Faculty of Engineering, Technology and Built Environment, UCSI University, Malaysia Jason Wong, jason.wong@global.glodon.com
School of Science and Technology, Singapore University of Social Science, Singapore Ziwen Liu (corresponding author), zwliu001@suss.edu.sg
Keywords
238
School of Science and Technology, Singapore University of Social Science, Singapore Abstract Over the past 150 years, quantity surveying (QS) professionals have played an integral role in the built environment sector. Quantity surveying is a scientific procedure where QS experts measure, control, manage, and add value to the cost aspect of a building project. In traditional measurement practice, the accuracy of QS measurement is highly dependent on the sophisticated measurement rules understood by QS professionals. However, it is well knowledge that the conventional measurement method has significant shortcomings: 1. Manually tracking changes in 2D drawings is time consuming and frequently results in more mistakes; 2. The involvement of numerous project stakeholders poses a risk of miscommunication; 3. Project decision-makingabout thebudget andtimelinemaybeimpacted by the lack of project visualisation. With the emergence of BIM, the BE industry is transcending into a new era. BIM offers geometry and non geometry data to facilitate the QS professionals to measure quantities and directly retrieve quantities and measurement data from BIM to estimate costs. Hence, this study aims to design and deploy a BIM based quantity take off framework to facilitate automating the cost estimation process. The framework includes several key activities: intelligently converting BIM models into cost models, capturing and acquiring quantities from cost models and dynamically generating cost reports and project data analysis. This proposed framework has been validated in several projects in Southeast Asia. According to the feedback that the framework enables to centralize all project information into a unified common data environment (CDE) which allows project stakeholders to work collaboratively and effectively. The benefits of adopting the framework include improved accuracy of cost estimates, reduced manpower, enhanced communication and collaboration, and better insight into the project. Therefore, the BIM QTO framework is presented as an essential guideline for QS professionals to enhance their business strategy by harnessing/ leveraging the BIM model and CDE.
Proceedings of the PAQS Congress 2022, 12th 13th September 2022, Singapore Institute of Surveyors and Valuers, Singapore
Introduction
Nevertheless, many construction companies still use 2D drawings and manual excel based spreadsheets to input data and prepare tenders regarding project trades which often results in difficult to manage time consuming tasks and error prone outputs (Rajabi etal., 2015; Seghier et al., 2019)
With the emergence and proliferation of BIM, the built environment industry is transcending to a new era. In the domain or field of quantity surveying (QS), BIM offers geometry and non geometry data to facilitate QS professionals to measure quantities and directly retrieve quantities and measurement data from BIM to estimate costs. This study aims to design and deploy a BIM based quantity take off (BIM QTO) framework to facilitate the automation of the cost estimation process. The proposed BIM QTO framework includes several key activities: 1) intelligently converting BIM models into cost models, 2) capturing and acquiring quantities from cost models and 3) dynamically generating cost reports and project data analysis. This proposed framework has been validated in several building projects in Southeast Asia. According to the users’ feedback, the proposed BIM QTO framework enables the centralization of all project information into a unified common data environment (CDE) which allows project stakeholders to work collaboratively and effectively. The benefits of adopting theBIM QTOframework includeimprovedaccuracyofcost estimates, reducedmanpowerand costs, enhanced communication and collaboration, and better insight into the project. Therefore, theBIM QTO frameworkis presentedas an essential guidelineforQS professionals to enhance their business strategy by harnessing/ leveraging the BIM model and CDE.
239 Proceedings of the PAQS Congress 2022, 12th 13th September 2022, Singapore Institute of Surveyors and Valuers, Singapore 1
2 Literature Review Building Information Modelling (BIM) is considered among the most adopted solutions in the architecture, engineering, construction and operation (AECO) industry (Azhar et al., 2011; Eastman, 2011). BIM is a methodology of collaborative work that enables stakeholders to model and manage project information effectively through the project lifecycle (Koseoglu et al., 2018). BIM workflows and tools have been proven more efficient and productive in building design and construction, including cost estimation (BIM 5D), which is particularly interesting to quantity surveyors. BIM process and workflow platforms can extract the geometrical and non geometrical properties from the BIM model, which are essential for cost estimation, procurement and production planning in the AEC projects (Aram et al., 2014).
According to SISV, some of the principal roles of a quantity surveyor include providing financial and contractual advice, bill of quantities, life cycle costing, project cost control and forecasting, feasibility and land procurement. The goal of a QS is to minimise the cost and risk of a construction project and enhance value for money, while still achieving the required legal standards and quality, including ensuring statutory building regulations are met, and the QS is considered to have played an integral role in the built environment (BE) sector for more than a century, and the technical process of QS, during which QS professionals measure, control, manage and add value to the cost’s aspect of a building project has over the years, become well established and sophisticated. However, it is widely recognised and conceded that there are some drawbacks to the traditional measurement process: 1. It requires manual tracking of changesin2Ddrawinganditisatime consumingprocessthatoftenleadstomoreinaccuracies; 2. Risk of miscommunication exists due to various involvement of project stakeholders; 3. In addition, the lack of visualization of the project may affect the decision making process of the project budget and schedule.
It can be concluded from the literature that BIM based approaches have become more popular among cost engineers and quantity surveyors due to their potential to automate the process of MTQ accurately (Hartmann et al., 2012; Liu et al., 2014). However, a holistic, integrated frameworkforBIM basedcostestimationisstilllacking.Therefore,thisstudyseekstodevelop a BIM based framework for cost estimation able to intelligently convert BIM models into cost models, capturing and acquiring quantities from cost models and dynamically generating cost reports and project data analysis.
Researchers have investigated and developed different workflows and methods to support decision making and automate the cost estimation process in different stages of the building lifecycle. For example, Babatunde et al. (2020) conducted a quantitative study to investigate how BIM based detailed cost estimating software is used by quantity surveyor consultants in Nigeria. The findings revealed that about 50 per cent of quantity surveying consulting firms areawareofBIM’spotentialforcostestimation,buttheystillhavenotadoptedityet.Similarly, Nguyen et al. (2022) conducted a questionnaire survey and a case study to investigate the current challenges facing BIM based QTO for cost estimation methods. The results revealed four significant challenges for BIM based QTO: 1) low reliability and accuracy in data input.
Choi et al. (2015) developed a QTO workflow and a prototype system based on the Open BIM approach to enhance the efficiency and accuracy of cost estimation during the early design stage. The findings showed that the proposed QTO system helped to improve schematic estimation consistency by reducing risk factors and shortening the time required. Rajabi et al. (2015) developed a workflow to use BIM for QTO in case no detailed Building model is available. They created logic based on defined norms and standards, replicating the commodities' required quantities. Fazeli et al. (2021) proposed a semi automated BIM based cost estimation system that facilitates the estimation of the project cost in multiple design scenarios. The results showed an acceptable level of accuracy in cost estimation of the architectural discipline. Alzraiee (2020) developed a system for cost estimation for building projects where Structured Query Language (SQL) was used as an interoperable information management system that effectively connects cost data with BIM elements. The comparison study of the output of the developed system versus the manual cost estimation revealed that both outputs are practically the same. Still, the efforts to prepare a BIM based cost estimate were significantly shorter than the traditional method. Aram et al. (2014) established a framework for a knowledge based system to implement model based QTO and cost estimation (CE). The system represented BIM model information in a format compatible with QTO and CE tasks. The authors claimed that the system enables estimating the properties of product features absent from BIM models, particularly in the precast concrete industry.
3 Research Gaps Quantity Surveying (QS) is the process of controlling and managing construction project costs. QS measurement is based on sophisticated measurement rules that are only understood by experienced practitioners. It is well known that the traditional QTO process is a tedious and time consuming process. The present manual calculation method is time consuming and there are human errors in the whole calculation process The traditional QTO process consists of five key steps, as illustrated in Figure 1. Each step of a traditional QTO has its own limitations: 1.
2) different types of information are required for the BIM model at different cost estimation stages, 3) limitedinteroperabilitybetweenthe cost estimation andBIM authoringsoftware, and 4) changes and updates in the information of the BIM model as projects progress.
240 Proceedings of the PAQS Congress 2022, 12th 13th September 2022, Singapore Institute of Surveyors and Valuers, Singapore BIM-related research for MTQ and cost estimation has increased drastically in recent decades.
Figure 1. Traditional measurement method for QS.
While, compared with the traditional QTO method, adopting 2D based measure software improves the productivity for QS practitioners. The workflow of 2D based measure software is shown in Figure 2, which includes four steps 1. Reading drawing: most of 2D based measurementsoftware arebased onoriginal drawingsource formats, such as CAD,PDF, JPEG and etc; 2. Measure length/area quantity: Estimated quantification area through ditto points, transpose rough estimates to excel table for tabulation of quantities defined, and it not consider QS standard of measurement rules for quantities generated; 3. Create formula and deductions: differential settings and format based on individual preference, may not be easily comprehendible by other QS; 4.Generate report from excel: quantity summary report may differ from individual QS submission.
Figure 2. 2D based measurement software for QS.
The traditional approach of QTO involves several tools and papers being used by QS practitioners to carry out their duties. For example, having scale rules to get the measurement on the printed layout drawings. With the measurement carefully taken and measured, QS has to transfer this information into Excel spreadsheets for further process of final quantities. This process will be repeated for every element to be measured to complete the QTO. Often, the measuredquantitieshavetobecheckedrepeatedlytoassuretheircorrectness.Thus,thehuman error occurrence rate is rather high.
4 Proposed BIM-based quantity take-off (BIM-QTO)
241 Proceedings of the PAQS Congress 2022, 12th 13th September 2022, Singapore Institute of Surveyors and Valuers, Singapore
Read Drawing: Black and white lines layout, making reading of plan drawings, it is difficult to comprehend; 2. Using scale ruler to measure length: rough estimate due to potential inaccuracy of scale factors; 3. Tabulated dimension in excel: differential excel format based on individual QS preference and practices. It is also inconsistency in dimension tabulation between different QS.
With the advancement of 5D BIM development in the construction industry, digitalization is starting to sip in countless companies in their daily working processes. Especially during the pandemic COVID 19, many have taken a leap into using digital tools to improve their productivity at work. It has been demonstrated that integrating 5D BIM into QTO work yields positive results, particularly in the quantity surveying industry. Read drawing Using scale rule to lengthmeasure dimensionsTabulate in excel spreadsheet Use excel to create formula & deductions Generate report from excel Read drawing quantitylength/areaMeasurein2Dsoftware Create formula and deductions Generate report from excel
Figure 3. Proposed BIM based quantity take off framework. The proposed BIM based quantity take off (BIM QTO) comprises three main steps, as shown in Figure 3. Whereas, the quantity can be easily obtained with the BIM QTO. Elements can now be picked or identified in a short time frame. From one of the ME company QSs, it is shown that having a BIM 5D helps improve their productivity by more than 50%. A job that was requiring 2 manpower finished in 10 days, is now completed by only 1 manpower in 5 days. In another company working on an Infrastructure project, a 33% of productivity increase is acquired by adopting the BIM 5D into the tender. The process has mitigated the need for physical apparatus or tools to acquire certain quantities manually. BIM eases the process of QTO, real time parametric data allows automated readjustment of quantities anytime. With the build in formula for most of the standard parameters (e.g., concrete volume and formwork area), these quantities can be obtained automatically once the elements are picked or identified in the software. Generally, the entire QTO process could have a time saving of 30% to 60% depending on the scope of work.
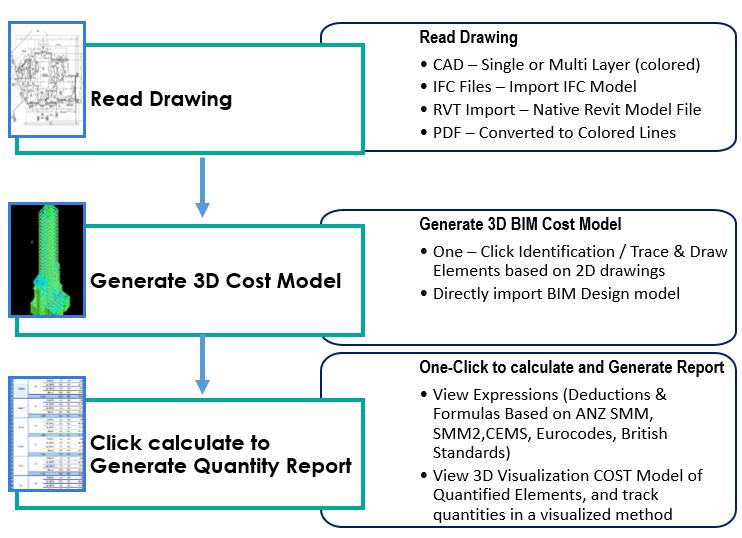
For example, according to SMM2 rules, the formwork of a wall has to be split in its calculation when the formwork of the wall is higher than 3.5m in height. BIM QTO is able to calculate this automatically whenever the model has been built. Whereas, if this is to be done manually,
242 Proceedings of the PAQS Congress 2022, 12th 13th September 2022, Singapore Institute of Surveyors and Valuers, Singapore
In addition, BIM QTO has the capability to integrate the local standard required by the Singapore authority. For instance, the Singapore Method of Measurement (SMM2) and many other standards are widely used by QS in QTO in the construction sector. Having this standard integrated into the software, quantities acquired from the software will be having more assurance in terms of quantity accuracy. Compare the conventional method, whereby QS has to input some important element parameters manually into respective Excel cells first, then, QS must formulate the formula that is required by the standard which includes all these parameters to acquire the final quantity. As a result, this process is highly cumbersome and error prone.
Unfortunately, various issues such as over measure elements or overlapping elements could be easily missed by QS in many scenarios. With BIM QTO, it allows multipleQTO (e.g. 3D QTO model) to combine together as 1 project thus generating a more accurate QTO result. When models combine together as one, auto deduction and validation will take place to eliminate errors automatically by the software.
The native BIM model has been starting to emerge during the project tender stage. The file is being distributed, QS can use it for their own QTO purposes. In order to utilize the native BIM file, QS will need to have the knowledge of operating the native software to acquire quantity. Unfortunately, the quantity acquired from native BIM needs to be processed to suit QS requirements. For example, to consider deduction according to SMM standards. Models developed by the modeller are mainly for aesthetic purposes which, would have several misses in detail. As a result, further development on top of the native BIM is necessary.
In a project with approximately GFA more than 10,000 m2, the QTO work could be handled by multiple QS to achieve a quicker result. When this is happening, the appointed QSs will divide the scope among themselves, and their individual QTO will then combine all together in the end (usually in excel in the conventional method). In the ideal situation, this final combined quantity shall include the consideration of the scope of work of different QS.
Traditionally, QS has to make use of physical drawing to discuss with other parties. This process requires excellent visualization and a good amount of working experience to understand the root issue of a certain subject. Sometimes, sketches have to be made in the process of discussion to support the ideas. 3D elements can be visualized directly. Detailed breakdown calculations including the deduction in relation can be reviewed. This ease the entire discussion to resolve a specific issue especially when certain clashes have been met between construction elements. If this technology is utilized in the design process, it will minimize the amount of variation faced during the project as discrepancies are eliminated. One QS commented that utilizing the BIM QTO improves the quality of the discussion and drives the decision making effectively from the management.
For example, if there is any overly measure of the columns across the floor, QS will be notified by the system and adjust accordingly to resolve the issue. This enhances the result reliability produced by a QS. The capability of auto detect errors further brings out another benefit of using BIM QTO enhancing the handling of information and coordination between parties. In the course of the entire project, discrepancies and design issues are often the subjects of many discussions.
QS has to consider all of the formulas by themselves, as Excel would not do this automatically unless sophisticated formula has been developed for different calculations in Excel before.
243 Proceedings of the PAQS Congress 2022, 12th 13th September 2022, Singapore Institute of Surveyors and Valuers, Singapore
Other than having correct calculation, validation of the information also placed high importanceonQTOaswell.QShasto confirmthe informationusedinthecalculationiscorrect by working through the sea of information multiple times. This method of manual checking is a time consuming process with a chance of miss out error proofing. Thus, QS often spend an ample amount of time to assure their calculation. This issue is then resolved by using BIM QTO. With actual 3D modeling as part of the QTO working processes, BIM-QTO is able to performthemodel validationautomaticallyandprompttheuserifthereis anyinvalidmodeling.
Having BIM QTO, technology can be developed to accept the native model directly. Once, the model is imported, the native BIM model will be processed and converted into the BIM cost model which is usable by QS for QTO purposes. This again further speeds up the QTO process by eliminating the further development process as previously mentioned.
An established company started its digitalization action in 2012, since then, its QTO process has been converted from 2D CAD drawings into 3D BIM model’s take off. The transition has proven to boast a 0.2% error margin in comparison to traditional methods that obtain a 5% error margin in half the time frame.
Consultant A Accurate QTO and real time cost data management Empowering all stakeholders to collaborate seamlessly and BetterefficiencyInsights into the project for decision making 30%
Contractor D Reduces the amount of time spent for QTO up to 70% compared to manual calculation method Reducing the risk of miscalculation Seamless Communication 70% Table 1. Summary table 6 Acknowledgement
244 of the PAQS Congress 2022, 12th 13th September 2022, Singapore Institute of Surveyors and Valuers, Singapore
Contractor A Visual Enhancement helps in reducing the risk of missing out on elements during QTO 25%
Contractor B Collaborative among the BIM software helps to enhance the efficiency of the project. Approx. 30%
Contractor C Ability to abstract quantities automatically with just a few clicks from a range of 2D drawings. Having the built in local measurement rules in the software and auto deductions helps us achieve accurate estimation results and allow us to complete large scale projects with less time Enablesconsumed.realtime collaboration between various project Providingstakeholders.accurate QTO Results 35%
Proceedings
5 Conclusion
The following five companies as shown in Table 1 have validated the proposed BIM quantity take off framework. Based on their feedback, all the companies reported that BIM QTO brought some improvements and increased productivity Company Benefits ImprovementProdQTOuctivity
The first author and corresponding author gained support from the USCI University Research Excellence & Innovation (REIG) with reference number: REIG FETBE 2022/020.
Alzraiee, H. (2020), “Cost estimate system using structured query language in BIM”, International Journal of Construction Management, Taylor & Francis, Vol. 0 No. 0, pp. 1 13. Aram, S., Eastman, C. and Sacks, R. (2014), “A knowledge based framework for quantity takeoff and cost estimation in the AEC industry using BIM”, 31st International Symposium on Automation and Robotics in Construction and Mining, ISARC 2014 Proceedings, No. ISARC, pp. 434 442.
All authors would like to thank Glodon International Pte Ltd to support this research project. Special thanks to Andy Zhang and Kimy Zhong for facilitating this research collaboration.
245 Proceedings of the PAQS Congress 2022, 12th 13th September 2022, Singapore Institute of Surveyors and Valuers, Singapore
The opinions and recommendations expressed in this paper are the authors’ personal opinions and do not necessarily represent the official position of any organization. This paper does not endorse any software in any capacity. The authors shall not be liable for any reliance on, or misinterpretation of any information contained in this paper.
Azhar, S., Carlton, W.A., Olsen, D. and Ahmad, I. (2011), “Building information modelling for sustainable design and LEED ® rating analysis”, Automation in Construction, Vol. 20 No. 2, pp. 217 224. Babatunde, S.O., Perera, S., Ekundayo, D. and Adeleye, T.E. (2020), “An investigation into BIM based detailed cost estimating and drivers to the adoption of BIM in quantity surveying practices”, Journal of Financial Management of Property and Construction, Vol. 25 No. 1, pp. 61 81.
Choi, J., Kim, H. and Kim, I. (2015), “Open BIM based quantity take off system for schematic estimation of building frame in early design stage”, Journal of Computational Design and Engineering, Elsevier, Vol. 2 No. 1, pp. 16 25.
Eastman, C.M. (2011), BIM Handbook : A Guide to Building Information Modeling for Owners, Managers, Designers, Engineers and Contractors, 2nd ed., Wiley, Hoboken, NJ.
9 References
Hartmann, T., Van Meerveld, H., Vossebeld, N. and Adriaanse, A. (2012), “Aligning building information model tools and construction management methods”, Automation in Construction, Elsevier B.V., Vol. 22, pp. 605 613.
7 Funding
8 Disclaimer
Fazeli, A., Dashti, M.S., Jalaei, F. and Khanzadi, M. (2021), “An integrated BIM-based approach for cost estimation in construction projects”, Engineering, Construction and Architectural Management, Vol. 28 No. 9, pp. 2828 2854.
Rajabi, M., Bigga, T. and Bartl, M.A. (2015), “Optimization of the quantity take off (QTO) process for mechanical, electrical and plumbing (MEP) trades in tender estimation phase of the construction projects”, 32nd International Symposium on Automation and Robotics in Construction and Mining: Connected to the Future, Proceedings, available at:https://doi.org/10.22260/isarc2015/0022.
Liu, H., Lu, M. and Al Hussein, M. (2014), “BIM based integrated framework for detailed cost estimation and schedule planning of construction projects”, 31st International Symposium on Automation and Robotics in Construction and Mining, ISARC 2014 Proceedings, No. July, pp. 286 294.
Nguyen, T.Q., Lou, E.C.W. and Nguyen, B.N. (2022), “A theoretical BIM based framework for quantity take off to facilitate progress payments: the case of high rise building projects in Vietnam”, International Journal of Building Pathology and Adaptation, No. 2019, available at:https://doi.org/10.1108/IJBPA 10 2021 0139.
Seghier, T.E., Ahmad, M.H. and Lim, Y. (2019), “Automation of Concrete Usage Index (CUI) assessment using computational BIM”, Vol. 6 No. 1, pp. 23 30.
246 Proceedings of the PAQS Congress 2022, 12th 13th September 2022, Singapore Institute of Surveyors and Valuers, Singapore Koseoglu, O., Sakin, M. and Arayici, Y. (2018), “Exploring the BIM and lean synergies in the Istanbul Grand Airport construction project”, Engineering, Construction and Architectural Management, Vol. 25 No. 10, pp. 1339 1354.
A Discussion on how QSs Manage Project Cost Deliverables in the Digital Age Singapore’s Perspective
Claire Zhang Pei (corresponding author), clairezhang79@hotmail.com
Abstract Digitalisation has changed project delivery in the Built Environment (BE) sector. Quantity Surveyors (QSs) usually manage project delivery particularly cost management in the various stage of project development. The concept of Metaverse has created a virtual world which coexists with our real world. When digital assets, Non Fungible Tokens and blockchain technologyhavebecomethehype,QSswhotraditionallyknownaspersonin chargeforfinance related matters in the BE sector could evolve themselves to manage the cost estimation, construction stage interim payment and other cost management tasks via digital twins of physical buildings by tapping on blockchain technologies and smart contract. This paper discusses how QSs could make use digital models (BIM models) of the building to manage project cost estimate before construction stage and subsequently, manage the construction interim payment through blockchain technologies or smart contract.
247 Proceedings of the PAQS Congress 2022, 12th 13th September 2022, Singapore Institute of Surveyors and Valuers, Singapore
Keywords Blockchain, Cost Managemnt, Digitalisation, Quantity Surveyors.
Singapore Institute of Surveyors and Valuers
1 Introduction
Building and Construction Authority Singapore has identified Integrated Digital Delivery (IDD) as one of the key thrusts in the Construction Industry Transformation Map (ITM). https://www1.bca.gov.sg/buildsg/digitalisation/integrated digital delivery idd IDD is the use of digital technologies to integrate work processes and connect stakeholders working on the same project throughout the construction and building life cycle. This includes design, fabrication and assembly on site, as well as the operations and maintenance of buildings. IDD builds on the use of Building Information Modelling (BIM) and Virtual Design and Construction (VDC), which have been implemented in many projects over the past few years.
When digital technologies go viral in the BE sector, digitalisation has changed the project delivery in the Built Environment (BE) sector. Quantity Surveyors (QSs) usually manage project deliveryparticularlycost managementin thevariousstageofproject development. This paper discusses how QSs could make use digital models (BIM models) of the building to manage project cost estimate before construction stage and subsequently, manage the construction interim payment through blockchain technologies or smart contract.
Dakhli, Z. et al 2019 conducted a case study to reveal a potential cost savings from blockchain deployment. Ye, X. et al 2020 proposed a framework for the automated payment via Building Information Modeling (BIM), Linked Data, Smart Contract and Blockchain technologies.
Kim, K. et al 2020 examined blockchain applications in construction industry. Project Cost/Change Management’, ‘Contract Bidding and Formation’, and ‘Procurement Evaluation’ are emerged as top three candidates for blockchain application with high applicability and impact. Regarding the knowledge area, ‘Procurement Management’ and ‘Cost Management’ are identified as the main blockchain application areas with high applicability and impact.
3 Methodology
The literature suggested the potential of application of blockchain and smart contract in the construction industry for project cost and payment management. However there are no studies to explore in metaverse, how digital asset operators facilitate use of blockchain, crypto as a means of payment for tangible goods and services and how QSs could learn themselves from these practices to manage the cost estimation, construction stage interim payment and other cost management tasks digitally by tapping on blockchain technologies and smart contract.
The literature review was carried out on journal papers, conference papers, and other sources including web pages among others to explore blockchain, smart contract and their application in construction project cost management.
2 Literature Review
Theresearchmethodologyofthis study comprised ofthreesteps. Following aliterature review, search rules were used to filter the research papers related to blockchain, smart contract and their application in the construction industry for project cost and payment management. Afterwards, a screening process was carried out to explore how digital asset operators facilitate use of blockchain, crypto as a means of payment for tangible goods and services in the metaverse. Afterwards a thorough use case analysis to identify the potential applications of blockchain and smart contract in the project cost and payment management in the construction industry.
248 Proceedings of the PAQS Congress 2022, 12th 13th September 2022, Singapore Institute of Surveyors and Valuers, Singapore
4 Findings and Discussion
The literature suggested the potential of application of blockchain and smart contract in the construction industry for project cost and payment management.
The concept of Metaverse has created a virtual world which coexists with our real world. When digital assets, Non Fungible Tokens and blockchain technology have become the hype, when digital asset operators facilitate use of blockchain, crypto as a means of payment for tangible goods and services, QSs who traditionally known as person in charge for finance related matters in the BE sector could evolve themselves to manage the cost estimation, construction stage interim payment and other cost management tasks digitally by tapping on blockchain technologies and smart contract.
Perera, S. et al 2020 discussed the impact of blockchain as a potential disruptive technology in the construction industry. The exploration revealed that due to the exponential uses of blockchain, investments involved, and a number of start up businesses contributing to Industry 4.0, blockchain indeed have a credible potential in the construction industry.
5 Conclusions Literature has suggested blockchain technologies and smart contract has great potential to be applied in construction industry. Building Information Modeling (BIM) and digitalisation have enabled the construction industry to integrate “cost” into a BIM model, budget and cash flow planning and cost controlling and with all these digitalised the adoption of blockchains and smart contract into the construction project cost and payment management are highly possible to be implemented in the construction industry. Futhermore, Singapore is a vibrant and innovativefinancialcentrein theregion andprovidedahighlyconducive FinTechenvironment to the construction industry to explore blockchain and smart contract and their applications in the construction industry.
Proponents of the metaverse say these virtual worlds will soon become ubiquitous, with real business use in commerce, marketing, entertainment and media, training, manufacturing and healthcare (https://www.straitstimes.com/opinion/metaverse harmful hype or fantastic Infuture).Singapore, Monetary Authority of Singapore (MAS) regulates digital assets related services and service providers. Unlike other countries, e.g. Thailand, Indonesia banned digital asset operators from facilitating use of crypto as a means of payment for goods and services prerequisitetoDakhli,afterpaymentnecessaryandopportunitiesThefirmssec(https://www.reuters.com/world/asia-pacific/thailand-ban-use-digital-assets-payments-april-20220323/,https://www.cnbc.com/2022/01/25/indonesianregulatorbansfinancialfromfacilitatingcryptosales.html)innovativeFinTechenvironmentinSingaporeisconduciveforBEfirmstoexplorethetotaponblockchaintechnologiesorsmartcontracttomanagetheprojectcostpaymentforconstructionprojects.Ye,X.etal2020highlightedthatpaymentissuesareintheconstructionindustry,oftenmanifestedbyhighlevelsofarrearsandlongtermdelays.Anautomatedpaymentcouldbeasolutiontospeedupthepaymentprocesssuccessfulcompletions.Z.etal2019investigatedandconcludedthatblockchainisbeingsuggestedasawayreducetransactioncostsbyeliminatingtheneedforintermediariestobuildtrustasaforsuccessfullyexecutedagreements.
249 Proceedings of the PAQS Congress 2022, 12th 13th September 2022, Singapore Institute of Surveyors and Valuers, Singapore
Perera, S. et al 2020 suggested late payments and cash flow related issues are a few of the key issuesidentifiedinmostconstructionprojects.Theconstructionindustryhasachainedpayment settlement culture, and default settlement durations, which are much higher than the other industries. Over and above the long settlement period, there is a substantial amount of payment delays in the construction industry. These result in additional costs to cover delays in payment, causing the contract price to be inflated to cover the cost of finance. Smart contract enabled blockchain applications with automated payments can effectively be used to resolve these issues. On the other hand, due to trust issues, clients have concerns in buying materials directly from the suppliers resulting in involvement of a third party such as a bank or a financial institution which leads to additional costs related to transaction costs, taxes among others. Implementation of a smart contract enabled blockchain payment application can provide more trust in the transaction as automation allows greater enforceability of the contract. The client can directly buy products from the supplier, making an initial payment at the ordering stage and once the products are delivered to site, the full payment can be released to the supplier in an automated process, which is initiated and controlled through a smart contract.
250
Ye, X., Sigalov,K., König,M 2020 Integrating BIM and cost included information container with Blockchain for construction automated payment using billing model and smart contracts. 37th International Symposium on Automation and Robotics in Construction (ISARC 2020) d_payment_using_billing_model_and_smart_contracts.html_and_cost_included_information_container_with_blockchain_for_construction_automatehttps://www.iaarc.org/publications/2020_proceedings_of_the_37th_isarc/integrating_bim
020 0188 x
Proceedings of the PAQS Congress 2022, 12th 13th September 2022, Singapore Institute of Surveyors and Valuers, Singapore
References Perera, S., Nanayakkara, S., Rodrigo, M.N.N., Senaratne, S., and Weinand, R.,2020
Blockchain technology: Isit hypeorreal in theconstructionindustry? JournalofIndustrial Information Integration 17 (2020) 100125.
Dakhli, Z., Lafhaj, Z., Mossman, A., 2019 The Potential of Blockchain in Building Construction. Buildings 2019, 9, 77; doi:10.3390/buildings9040077 %20deviation%20of%201.26%255309/9/4/77/htm#:~:text=The%20results%20revealed%20a%20potential,a%20standardhttps://www.mdpi.com/2075.
Kimhttps://www.sciencedirect.com/science/article/abs/pii/S2452414X20300017,K,Lee,G.,Kim,S.,2020AStudyontheApplicationofBlockchainTechnology in the Construction Industry. KSCE Journal of Civil Engineering volume 24, pages 2561 2571 (2020). https://link.springer.com/article/10.1007/s12205

