
Tin Oxide Deposited By Spray Pyrolysis Technique and Annealed In Open Air
S. Abdullahi, A. U. Moreh, B. Hamza, M. A. Wara, H. Kamaluddeen, M. A. Kebbe, U. F. MonsuoratAbstract: Fluorine doped tin oxide thin (FTO) films prepared by spray pyrolysis technique at a substrate temperature of 573K. The films deposited were 100 nm thick. After the deposition, the films were then annealed at different annealing temperatures of 423K, 573K and723K respectively in open air. The optical parameters of the prepared films as transmittance, optical energy gap, refractive index, extinction coefficient, porosity, packing density and the dielectric constants were found to be influenced by varying the annealing temperatures.
Keywords: FTO, annealing in open air, spray pyrolysis, porosity, packing density, dielectric constant.
I. INTRODUCTION
SnO2 is an n-type semiconductor material. Because of its good adsorptive properties and chemical stability, it can be deposited onto glass, ceramics, oxides, and substrate materials of other types. It has a high melting point and good transmission, and does not easily react with oxygen and water vapor in the air, so it has a high specific volume and good cycling performance. Gas sensors based on SnO2 thin films are used to detect a variety of hazardous gases, combustible gases, industrial emissions, and pollution gases. In addition, SnO2 thin films are also used for film resistors, electric conversion films, heat reflective mirrors, semiconductor– insulator–semiconductor (SIS) heterojunction structures, and surface protection layers of glass. At present, its most common application is as the anode material of solar cells. [1] Consequently, it has been widely used in many optoelectronic devices as a transparent conductive layer. For example, it can be used in light emitting diodes (LED), solar cells and flat panel displays [1-4]. Much effort has been dedicated to investigate FTO thin films over the past decades.
Numerous works have been reported concerning doped and undoped tin oxide thin films using various preparation methods such as sputtering [5-6], Inkjet printing technique [7], Aerosol assisted chemical vapor deposition (AACVD) [8], Sol gel [9], Atmospheric-pressure plasma deposition system [10], Spray pyrolysis [11-12] Among these, spray pyrolysis is well suited for the preparation of doped tin oxide thin films because of its simple and inexpensive experimental arrangement, ease of adding various doping materials, reproducibility, high growth rate and mass production capability for uniform large area coatings [13]
II. EXPERIMENTAL
Fluorine doped tin oxide (FTO) films were prepared on glass substrate at a substrate temperature of 723K for fluorine doped (0.05) by a spray pyrolysis technique using KM – 150 spray machine under ambient atmosphere. The spray solution prepared from tin tetrachloride penthydrate (SnCl4. 5H2O) dissolved in distilled water at concentration of 0.1M and ammonium fluoride (NH4F) was added into the solution for fluorine doping. The deposition parameters were the same for the series of films.
ISSN 2350-1030
of
(IJRRPCS) Vol. 1, Issue 2, pp: (1-7), Month: October 2014
March 2015, Available at: www.paperpublications.org Page | 1 Paper Publications
International Journal
Recent Research in Physics and Chemical Sciences
-
Department of Physics, Usmanu Danfodiyo University, Sokoto, Sokoto, Nigeria.
International Journal of Recent Research in Physics and Chemical Sciences (IJRRPCS)
Vol. 1, Issue 2, pp: (1-7), Month: October 2014 - March 2015, Available at: www.paperpublications.org
The deposition temperature and solution flow rate were maintained at 723K and 1.5ml/min respectively. Other parameters were kept constant. Film thickness of 100nm was deposited on the glass substrate at a nozzle – substrate distance of 11.0cm. The growth rate was approximately 25nm/min. The film thickness was measured using a Taly step profilometer (roughness detector with a stylus Taylor Hobson model).
Four samples were prepared and labeled as FTO-303: as deposited sample, FTO-423: sample-annealed at 423K, FTO573: sample annealed at 573K, and FTO-723: sample annealed at 723K, all in open air. Three samples designated as FTO-423: sample-annealed at 423K, FTO-573: sample annealed at 573K, and FTO-723F2, were taken to a furnace one after the other and heated at of temperatures 423 K 573 K and 723 K respectively for one hour in open air.
The optical measurements of the SnO2: F thin film are calculated from the transmittance and absorbance spectrum at normal incidence over the range (172 – 1000 nm), by using UV-VIS spectrophotometer type (Avantes Avaspec 2048 model).

III. RESULTS AND DISCUSSION
A. Optical Transmittance
Fluorine doped tin oxide thin films were successfully deposited on to glass substrate and the films were very transparent. This may be attributed by the formation of the Fermi level in the conduction band [14]. Fig. 1 shows the optical transmittance spectra in the visible light region (380 nm- 750nm) for samples annealed at different temperature. From the graph, the film annealed at 473 K exhibits highest transmittance in the range of 500nm – 750nm with a maximum transmittance of 87%. This is in a good agreement with the results obtained by [14] where the FTO films annealed at 573 K shows high transmittance above 80%. On the other hand, film annealed at 473 K shows the lowest transmittance. Nevertheless, all samples exhibit more than 70% of transmittance in the visible light region. The transmittance for all annealed samples rises with increasing wavelength. The ripples as shown in the transmittance spectra may result from the interference of light, since they show waveforms that are characteristic of the interference light [14]. The results indicate that there is an increase in the transmission spectra as the samples were annealed at different temperatures. This increase may be ascribed to the decrease in surface defects due to post annealing treatments [15].
B. Refractive Index, n and Extinction Coefficient, k
Optical constants of FTO films which are: refractive index, n and the extinction coefficient, k were calculated from transmission and reflectance spectra. The refractive index of FTO films can be obtained with the following equation [16]:
n = (1)
where n is the refractive index and R is the reflectance. The extinction coefficient, k is given by [12,17]:
k = (2)
ISSN 2350-1030
Page | 2 Paper Publications
Fig.1. Transmittance spectrum for as-deposited FTO and annealed FTO at various temperature.
International Journal of Recent Research in Physics and Chemical Sciences (IJRRPCS)
Vol. 1, Issue 2, pp: (1-7), Month: October 2014 - March 2015, Available at: www.paperpublications.org
where is the absorption coefficient of the film, and is the wavelength of light
Fig. 2 a and 2b shows the variation of refractive index and the extinction coefficient with wavelength. It can be seen that, the refractive index decreases with the wavelength according to the behavior of reflectance spectrum. The values of n were in the range of 1.41 – 1.68 and enhanced with the annealing temperature. This decrease in refractive index with increase in wavelength confirms the semi conductor behavior of the films [17]. In addition, the extinction coefficient was 0.02. However, the extinction of coefficient in this study was found very small and this similar behavior also found as in [9] which shows the FTO is transparent in the visible light spectrum.


C. Analysis of the Absorption Coefficient
The absorption coefficient can be obtained from the measured transmission spectra, T according to the following equation [15]:
(3)
Where A is the absorption and d is thickness of the film.
The graph of absorption coefficient as a function of photon energy has been shown in Fig.3. The graph shows the absorption coefficient is related to the photon energy, since as the photon energy increases, the absorption edge shifted and broadened to high energy. At very low wavelength (high energy) absorption is observed due to the domination of fundamental band-gap, and for higher wavelength, high reflection is observed due to the released of free electrons [14]. It
ISSN 2350-1030
Page | 3 Paper Publications
Fig. 2a. Refractive index of FTO thin films with annealed at different temperatures.
Fig. 2b. Extinction coefficients of FTO thin films with different annealing temperature
International Journal of Recent Research in Physics and Chemical Sciences (IJRRPCS)
Vol. 1, Issue 2, pp: (1-7), Month: October 2014 - March 2015, Available at: www.paperpublications.org
can be seen that the as-deposited films have higher absorption coefficient than the annealed films. This implies that the asdeposited films have high ability to absorb light within the visible region than the other samples annealed at different temperatures. The absorption coefficient of the FTO films is shown in table I
TABLE I. Absorption coefficient of FTO films annealed at different temperatures
Fig. 3. Variation of absorption coefficient with wavelength at different temperatures.

D. Optical Energy Band Gap
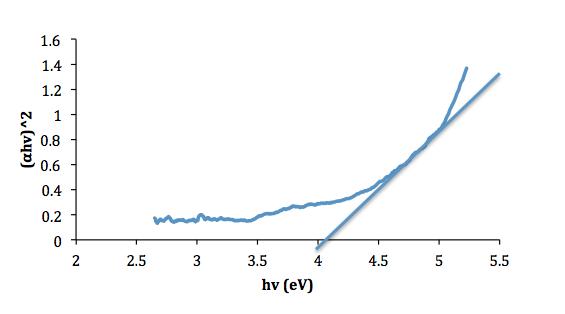
Based on the findings of [14], the excitation of electron from valence band to conduction band by absorption of photon energy can occur in two ways usually either in direct or indirect transitions. The energy band gap of the film can roughly be determined by the transmittance spectra. According to the Tauc relation [2, 16], the absorption coefficient is given by :
( h )2 = A( h -Eg) (4)
Where (cm-1) is the absorption coefficient, h (J.s) is Plank’s constant, (Hz) is the frequency of the photon, A is the edge parameter (constant), and Eg (eV) is the band gap energy.
The direct optical band gap was determined from the plot of ( h )2 versus h extrapolated the linear portion of the curve to h equals to zero. The energy band gap of the films lies between 3.7eV – 4.0eV. The value of optical energy gap increases with increasing annealing temperatures for all samples. This is due to the growth of grain size and the decrease in defect states near the bands and this is turn increased the value of Eg [18]. The value of the energy band gap for each sample is shown in table II
TABLE II: Energy band gap of FTO annealed at different temperatures
ISSN 2350-1030
Page | 4 Paper Publications
Sample Absorption Coefficient, (cm-1) FTO-303 0.0032 FTO-423 0.0022 FTO-573 0.0017 FTO-723 0.0024
Sample Energy Band Gap, Eg(eV) FTO-303 3.80 FTO-423 3.90 FTO-573 4.00 FTO-723 4.05


ISSN 2350-1030 International Journal of Recent Research in Physics and Chemical Sciences (IJRRPCS) Vol. 1, Issue 2, pp: (1-7), Month: October 2014 - March 2015, Available at: www.paperpublications.org Page | 5 Paper Publications
Fig. 3a. ( h )2 as a function of photon energy for FTO thin film (F1) at room temperature
Fig. 3b. ( h )2 as a function of photon energy for FTO thin films at 423K temperature
Fig. 3c. ( h )2 as a function of photon energy for FTO thin films at 573K temperature
Fig. 3d. ( h ) 2 as a function of photon energy for FTO thin films at 723K temperature
E. Porosity and the Parking Density Table III. shows the values of the porosity and the parking density of all the samples. These were generated from (19).
The maximum porosity is found to be 71.52 corresponding to sample FTO-423 while the minimum is 47.48 for sample FTO-723. Based on this, FTO-723 is least porous compared to other samples. This confirms that the refractive index, parking density and porosity are strongly dependent on the annealing temperature.
IV. CONCLUSION
Fluorine doped tin Oxide (FTO) thin films have been successfully deposited using spray pyrolysis technique and the four optical parameters of films at different annealing temperatures were successfully measured. All samples exhibit high transmittance more than 70% in the visible light spectrum. Refractive index was in the range of 1.41 – 1.68 and the absorption coefficients were in the range of 0.002 – 0.003cm-1. Energy gap of FTO was found to be increasing with increasing in annealing temperature while the photon transition was allowed direct transition.
REFERENCES
[1] Rahal, B. Said., and B. Boubaker, “The effect of the film thickness and doping content of SnO2: F thin films prepared by the ultrasonic spray method” Journal of Semiconductors. Vol. 34 No. 9, PP 1- 5, 2013.
[2] Welekar N.R., and AmrutaV.M. (2014), “Effect of annealing on physical properties of CBD synthesized nanocrystalline FeSe thin films” Materials Science in Semiconductor Processing. 27 (2014) PP 280–287, 2014.
[3] Iwan, T. Igor, Maciej S., Bartosz B., Grzegorz P., Schab-Balcerzak E, “Optical, electrical and mechanical properties of indium tin oxide on polyethylene terephthalate substrates: Application in bulk-heterojunction polymer solar cells” Materials Science in Semiconductor Processing. 24 (2014) PP 110–116, 2014.
[4] X.Zhou, Peng C, Zhenlong W, Feng X, Guofeng Y, Bin L, Chongbin T,Lin Z, Rong Z, Youdou Z, “Influence of thermal annealing on electrical and optical properties of indium tin oxide thin films” Materials Science in Semiconductor Processing. 26 (2014) PP 588–592, 2014.
[5] M. Kang, K. InKoo, C, Minwoo and W. K. Sok, “Optical Properties of Sputtered Indium-tin-oxide Thin Films” Journal of the Korean Physical Society, vol. 59, no. 5, pp. 3280-3283, 2011.
[6] P.B. Singh, K, Rakash, K. Ashwani, G. Jyotshana, P.S. Sunder and R.C. Tyagi, “Effect of annealing on properties of transparent conducting tin oxide films deposited by thermal evaporation”. Journal of pure and applied physics. Vol. 51, no. 2013, pp. 558 – 562, 2013.
[7] W. Samad, M. S. Muhamad, S. Ashkan and A. Y. Mohd, “Structural, Optical and Electrical Properties of Fluorine Doped Tin Oxide Thin Films Deposited Using Inkjet Printing Technique” Sains Malaysiana vol. 40, no. 3, pp. 251–257, 2011.
[8] A. M Jafar, A. Kiffah, L. R. Farhan and K. F. Ibrahim, “Fabrication and Characterization of Fluorine-Doped Tin Oxide Transparent Conductive Nano-Films”. International Journal of Innovative Research in Engineering & Science, vol. 6, no. 2, pp. 49-58, 2013.
ISSN 2350-1030
Page | 6 Paper Publications
= ( ) (5) ( ) ( ) ( ) ( ) (6)
Sample n Porosity (%) Parking density FTO-303 1.47 66.54 1.09 FTO-423 1.41 71.52 1.07 FTO-573 1.46 67.38 1.09 FTO-723 1.68 47.48 1.09
International Journal of Recent Research in Physics and Chemical Sciences (IJRRPCS) Vol. 1, Issue 2, pp: (1-7), Month: October 2014 - March 2015, Available at: www.paperpublications.org
Porosity
TABLE III Values of refractive index, Porosity and parking density
International Journal of Recent Research in Physics and Chemical Sciences (IJRRPCS)
Vol. 1, Issue 2, pp: (1-7), Month: October 2014 - March 2015, Available at: www.paperpublications.org
[9] S. Wu, Y. Shuai, S. Liyi, Z. Yin, F. Jianhui, “Preparation, characterization and electrical properties of fluorinedoped tin dioxide nanocrystals” Journal of Colloid and Interface Science vol. 346, no. 2010, pp. 12–16, 2010.
[10] Tsai and C. Huang, “Surface Treatment and Characterization of Indium–Tin-Oxide Thin Films Modified Using Cyclonic Atmospheric-Pressure Plasma” Japanese Journal of Applied Physics, vol. 52, no. 2013, pp. 1-7, 2010.
[11] Tatar, T. Guven and D. Bahattin, “Effect of substrate temperature on the crystal growth orientation and some physical properties of SnO2: F thin films deposited by spray pyrolysis technique”. Rom. Journ. Phys Vol. 58, no. 1
2, pp. 143
158, 2013.
[12] Russo and G. Z. Cao, “Fabrication and characterization of fluorine doped tin oxide thin films and nanorods arrays via spray pyrolysis”. Applied physics. Vol. 9, no. 2008, pp. 311 – 315, 2007.
[13] S. A. Yousif and Jenan M. A, ”Structural, Morphological and Optical Characterization of SnO2: F thin films prepared by Chemical spray Pyrolysis” International Letters of Chemistry, Physics and Astronomy 13 (2013) 90102, 2013.
[14] S. Baco, C. Abdullah and Yassin F, “Study on Optical Properties of Tin Oxide Thin Film at Different Annealing Temperature” Journal of Science and Technology, PP 61-71, (2013), Unpublished, saturi@ums.edu.my.
[15] A. Gholizadeh and N. Tajabor, “Influence of N2- and Ar-ambien tannealing on the physical properties of SnO2: Co transparent conducting films”, Materials Science in Semiconductor Processing. 13 (2010) PP 162–166, 2014.
[16] Yousaf S. A. and Ali S, “The effect of fluorine doping on optoelectronic properties of tin dioxide films”. Coden Jnsmac. Vol. 48, no. 1&2, pp. 43 – 50, 2009
[17] Al-Ofin H. H., Abdel-Raheem M. M., Ateyyah M. Al-Baradi, “Structural and optical properties of Al2ZnO4 thin films deposited by D.C. sputtering technique”, Journal of non-oxide glasses. 3: 3 (2012) pp39 – 54, 2012.
[18] Nasir E. M., Iqbal S. N., Alias M.F.A, “Characterization of Cadmium Tin Oxide Thin Films as a Window Layer for Solar Cell” International Journal of Application or Innovation in Engineering & Management (IJAIEM). Vol. 2, no. 9, 2013.
[19] Gulen M, Yildirim G, Bal S, Varilci A, Belenli I and Oz A: Role of annealing temperature on microstructural and electro- optical properties of ITO films produced by sputtering. J. Mater Sci: Mater Electron. DOI 10.1007/s10854012-0768-8,
ISSN 2350-1030
Page | 7 Paper Publications
–
–