
Investigation of Curie Point Depth, Geothermal Gradient and Heat Flow over parts of the Lower Benue Trough using Aeromagnetic Data
1Department of Science Laboratory Technology, Federal College of Agriculture, Ishiagu, Nigeria;
2&4Department of Industrial Physics, Enugu State University of Science and Technology, Nigeria;
3Department of Physics, University of Agriculture and Environmental Sciences, Imo State, Nigeria;
5Department of Physics, Nnamdi Azikiwe University, Awka, Nigeria.
DOI: https://doi.org/10.5281/zenodo.7365096
Published Date: 26-November-2022
Abstract: The assessment of variations of the Curie isotherm of an area provides valuable information about the regional temperature distribution at depth and the concentration of subsurface geothermal energy. Aeromagnetic data was successfully used for determining the curie point depth, geothermal gradient and heat flow over the area. The study area lies within the Southern portion of the Lower Benue Trough and consists of sheet 303 (Abakaliki sheet) and sheet 314 (Ugep Sheet). The area is delineated by Latitudes 5o 30' and 6o 30' N and Longitudes 8o 00' and 8o 30' E. Graphs of the logarithms of amplitude (spectral energy) against frequency were plotted and the linear segments from the low frequency portion of the spectral drawn from the graphs. Results of the spectral analysis estimated the depth to centroid to range from 4272 m to 6111 m, while the depth to top boundary ranges from 612 m to 1002 m. Curie point depth shows that the curie isotherm based on the spectra analysis lies between the depth of 7.8 km to 11.3 km and an average of 9.9 km across study area. Geothermal gradient of the area ranges from 51.3 OC/km to 74.4 OC/km with an average value of 59.4 OC/km. The heat flow for the study area ranges between 128.3 and 186 mW/m2 with an average of about 148.5 mW/m2. The variation of heat flow within the earth is as a result of the lithological variations observed from one region to another within the earth crust. Therefore, the results of geothermal resources provide vital information on the sustainable power source over the study area.
Keywords: Geothermal, Spectral Analysis, Curie Point Depth, Heat Flow, Gradient.
1. INTRODUCTION
Depth to magnetic source is based on the principle that a magnetic field measured at the surface can be considered an integral of magnetic signatures from all depths. The power spectrum of the surface field can be used to identify average depths ofsource ensembles (Spector and Grant, 1970).This is essential inorder to estimate depths to basement (sedimentary thicknesses) across geological area. Aeromagnetic survey is to investigate the subsurface geology based on magnetic anomalies in the earth’s magnetic field resulting from the magnetic properties of the underlying rocks (Onuba et al. 2008).
The Benue Trough in Nigeria possesses a geological complex that can be assessed using aeromagnetic survey to estimate the depth to magnetic source. The Benue Trough in Nigeria possesses a geological complex that can be assessed using aeromagnetic survey to estimate the depth to magnetic source. The Benue Trough of Nigeria however is an elongated rifted depression that trends NE – SW from the South, where it merges with the Niger Delta, to the north where its sediments are part of the Chad Basin successions. The origin and evolution of the Benue Trough is now well documented (Wright, 1976; Nwachukwu, 1972; Olade, 1975, 1976; Petters, 1978; Ofoegbu, 1985b). The major component units of the Lower Benue Trough include the Anambra Basin, the Abakaliki Anticlinorium and the Afikpo Syncline. The study area which is within the Abakaliki and Ugep is characterized by a zone of lead-zinc mineralization, pyroclastic rocks and brine (Ofoegbu, 1985b).
International Journal of Recent Research in Physics and Chemical Sciences (IJRRPCS)
Vol. 9, Issue 2, pp: (11-21), Month: October 2022 – March 2023, Available at: www.paperpublications.org
Spectral analysis has successfully been applied in interpretation of aeromagnetic data (Bhattacharyya, 1966; Spector, 1968; Mishra and Naidu, 1974; Hahn and Mishra 1976). The power spectrumof the surface field has been used to identify average depths of source ensembles (Spector and Grant, 1970). This technique can be used in identification of the characteristic depth of the magnetic basement, on a moving data window basis, merely by selecting the steepest and therefore deepest straight-line segment of the power spectrum, assuming that this part of the spectrum is sourced consistently by basement surface magneticcontrasts. Adepthsolutioniscalculated forthepowerspectrumderived fromeachgridsub-set,andlocated at the centre of the window. Overlapping the windows creates a regular, comprehensive set of depth estimates (Alasi et al. 2017).
Aeromagnetic data for determining the curie point depth, geothermal gradient and heat flow over an area utilizes the principle that the magnetic field measured at the surface can be considered an integral of the magnetic signatures from all depths. The power spectrum of the surface field can be used to estimate the average depth to basement (sedimentary thickness) across the geological area. The assessment of variations of the Curie isotherm of an area provides valuable information about the regional temperature distribution at depth and the concentration of subsurface geothermal energy (Tselentis, 1991).
The study area lies within the southern portion of the Lower Benue Trough and consists of sheet 303 (Abakaliki sheet) and sheet 314 (Ugep Sheet). The area is delineated by Latitudes 5o 30' and 6o 30' N and Longitudes 8o 00' and 8o 30' E. In order to contribute to a better understanding of the anomalous structures in the southern portion of the Lower Benue Trough, we have considered the use of spectral analysis of the aeromagnetic data over Abakaliki and Ugep areas to compute the variations of heat flow within the area.
Geology of the Study Area
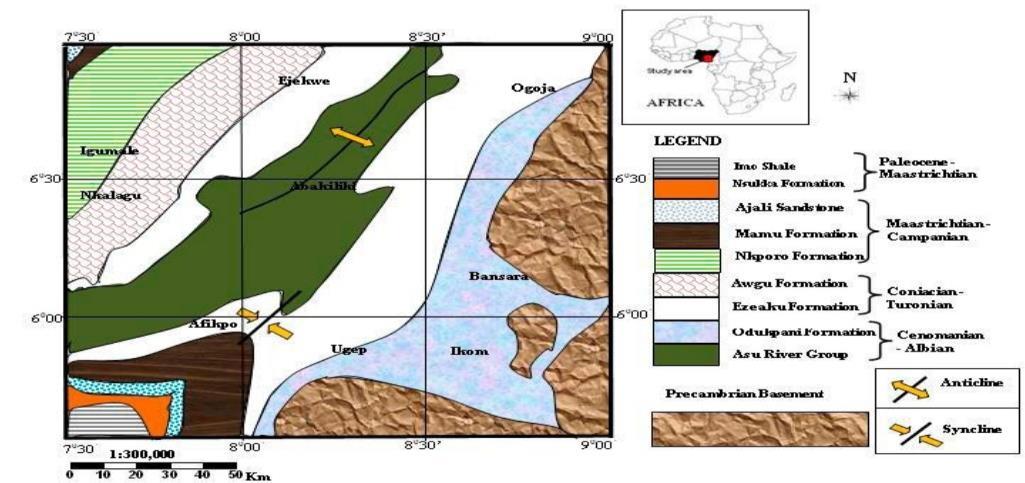
The geology and evolution of the Lowe Benue Trough is now fairly well documented (Nwachukwu, 1972; Olade, 1975; Ofoegbu, 1985b). The Lower Benue Trough is underlain by a thick sedimentary sequence deposited in the Cretaceous. The major component units of the Lower Benue Trough include the Anambra basin, the Abakaliki Anticlinoriumand the Afikpo Syncline. The oldest sediment of the sequence belongs to the Asu River Group (Figure 1) which unconformably overlies the Precambrian basement complex that is made up granitic and magmatic rocks (Ofoegbu and Onuoha, 1991). The Asu River Group whose type outcrops in Abakaliki has estimated thickness of about 2000 m (Ofoegbu, 1985a) and is Albian to Cenomanian. It comprises of argillaceous sandy shales, laminated sandstones units and minor limestones with an inter fingering of mafic volcanic (Nwachukwu, 1972). The shales are fissile and highly fractured. In the vicinity of the study area, the shales are associated with pyroclastic rocks and brine (Okezie, 1965; Uzuakpunwa, 1974). Deposited on top of those Asu River Group sediments in the area is the Upper Cretaceous Eze- Aku shale.
The Turonian Eze-Aku shales consist of nearly1000 mof calcareous flakyshales and siltstones, thin sandyand argillaceous limestones and calcareous sandstones (Reyment, 1965). The Eze-Aku shales sits unconformably over the Precambrian Gneiss to the north of Ugep and its conformably overlain by the Semonian sandstones and Upper coal beds along Ugep (Obi et al. 2010). The Nkporo shales are the youngest unit of the sequence and overlies the Eze-Aku shales unconformably. They are Campanian-Maaestrichtian in age and are mainly marine in character, with some intercalations of sandstones.
International Journal of Recent Research in Physics and Chemical Sciences (IJRRPCS)
Vol. 9, Issue 2, pp: (11-21), Month: October 2022 – March 2023, Available at: www.paperpublications.org
2. MATERIALS AND METHODS
Digitized aeromagnetic data sheets 303 (Abakaliki) and 314 (Ugep) were acquired from Nigerian Geological Survey Agency (NGSA). These data were acquired along a series of NW-SE flight line with a spacing of 500 m and flight line spacing (infill) of about 250 m while the tie lines were at about 5000 m interval. The geomagnetic gradient was removed from the data using the International Geomagnetic Reference Field (IGRF). The covered area was about 6050 km2. The contoured data of total magnetic field intensity (TMI) contains both the regional and residual anomalies (Figure 2). The regional fields were removed from the TMI data to obtain the resultant residual aeromagnetic anomaly data (Figure 3) and their digital terrain models employing WingLink and Surfer 10 software at interval of 15 nT.
Six profiles were taken cutting across anomalous features in the area under study. The anomalies identified on these profiles were subjected to spectral analysis. In order to carry out the spectra analysis of the aeromagnetic data, the study area was divided into blocks containing 18 x 18 data points. In doing this, it was necessary to ensure that essential parts of each anomaly were not cut off by the blocks. Care was also taken to ensure that each block contained more than one maximum, as suggested by Hahn and Mishra (1976). To achieve this, a few of the blocks were made to overlap each other. Graphs of
International Journal of Recent Research in Physics and Chemical Sciences (IJRRPCS)
Vol. 9, Issue 2, pp: (11-21), Month: October 2022 – March 2023, Available at: www.paperpublications.org
thelogarithms ofamplitude(spectralenergy) against frequencywere plottedandthelinear segments fromthelowfrequency portion of the spectral drawn from the graphs. The gradient of the linear segments was computed and the depths to the basement were determined using the equations according to Negi et al. (1983); Ikumbur et al. (2013); Akanbi and Fakoya (2015):
Slope (M1,M2) = ������������ �������� 1.1
Zt = -��1⁄4�� 1.2
Z0 = - ��2⁄4�� 1.3
Where M1 is the slope of the depth to top boundary and M2 is the slope of depth to the centroid.
Zt and Z0 are respectively the depth to top boundary and depth to centroid.
Curie point depth (Zb) = 2Z0 - Zt 1.4
Geothermal gradient = ���� ���� = �� ���� = �� ����������������������������ℎ (℃km-1) 1.5
Heat flow (q) = ƛ( �� ����) (mwm-2) 1.6
= ƛ(Geothermal gradient)
�� Is the curie temperature and ƛ is the coefficient of thermal conductivity, both �� and ƛ depends on the area. The curie temperature (��) is approximately 580℃ for igneous rock while the coefficient of thermal conductivity (ƛ) for igneous rock is also given as 2.5wm-1C-1 (Spector and Grant, 1970; Turcotte and Schubert, 1982; Okubo et al. 1985; Tanaka et al. 1999).
3. RESULTS AND DISCUSSION
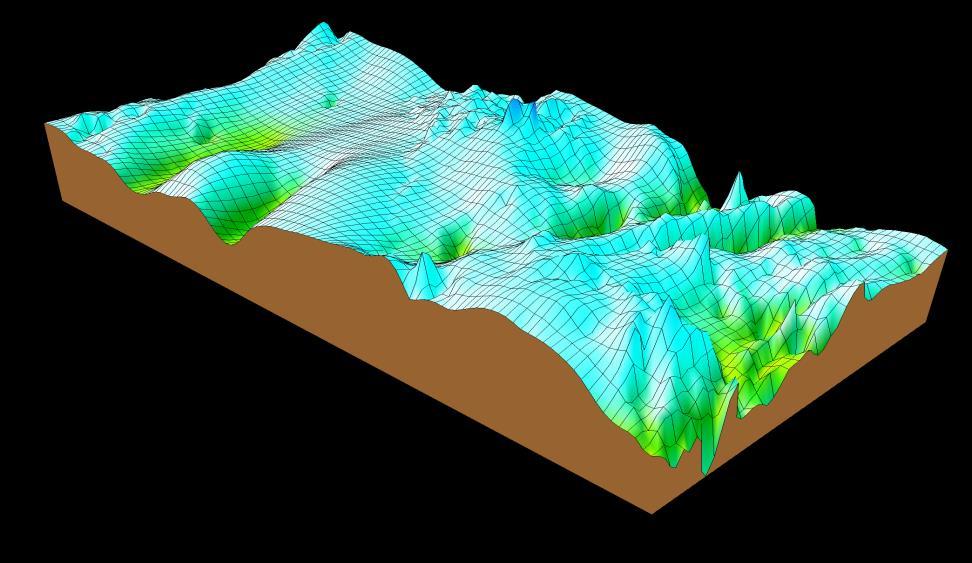
The aeromagnetic field map over the area was characterized by a series of local anomalies, but the regional fields have been removed from the observed field to obtain the residual anomaly map (Figure 3). It emphasizes the expressions of local features, and removes the effects of large anomalies or regional influences. The lines help to delineate the predominant trends of the subsurface (lineament) structures in the studied area as shown in Figure 3. The data is processed (or transformed) such that the edge of a causative bodyis located beneath a maximum in the grid. The structural trends revealed from the polynomial surfaces of first degrees have a preponderance of NE-SW and NW-SW directions. The 3D spatial location of structures and their edges is also shown in Figure 4. The 3D residual surface map results help to quantify the different magnetic responses of structures located in the shallow and deep sedimentary sections in the basement. The 3-D surface map also show a linear depression with sedimentary accumulation trending E-W.
International Journal of Recent Research in Physics and Chemical Sciences (IJRRPCS)
Vol. 9, Issue 2, pp: (11-21), Month: October 2022 – March 2023, Available at: www.paperpublications.org
Figure 5 shows the pseudo-colour images of the aeromagnetic data of the TMI. The upward continuation process attenuates shorter- wavelength, shallowly source anomalies and emphasizes more deeply on source, large scale features. Upward continuation of the TMI data set emphasizes the abundance of magnetic materials down to mid-crustal levels, constrained by the depth at which the curie temperature destroys rock magnetism. Undulations in the upward continuation magnetic field are suggested to affect topography on a magnetic basement rocks and structures in the area. Removal of part of the high frequency content of the magnetic field has shown that the mid crustal level appears to be more circular than it does intheunprocessedTMIimage. Thiscircularanomalyisdelimitedbylargescale magnetictroughs.Deeplysourced magnetic features, which are apparent in these upward continued images, are the NE and NW trending magnetic discontinuities (i.e. structures).
For the spectral determination of depths, across the study area, the slope method of interpretation was deployed. The study area was divided into eighteen blocks (18 blocks containing 18 km × 18 km). In doing this, adequate care was taken so that essential parts of each anomaly were not cut by the blocks. In order to achieve this, the blocks were made to overlap each other. Graphs of the logarithms of magnitude (spectral energies/Amplitude An) against frequencies (frequency n) obtained for various blocks were shown in Fig. 6-11. From the slope of the spectrum segments, the estimated depths to top boundary and depth to centroid are shown (Table 1).
Figure 11.
of depth
Result of the spectral analysis (Table 1) estimated the depth to centroid to range from 4272 m to 6111 m, while the depth to top boundary ranges from 612 m to 1002 m. Estimates of the depth to centroid is represented by the first segment of the spectrum. This reflect the Precambrian basement of the study area. This result is in agreement with that of Okiyi et al. (2021) who obtained a depth to the top of the magnetic source to range between 0.45 km to 1.90 km and centroid depth of 4 km to 7.87 km.
Table 1: Summary of estimates of curie point depth, geothermal gradient and heat flow over the study area.
The Curie depth was determined from the spectral depth value using the slope method, the sedimentary thickness estimate of the study area from the spectral depth shows two type of lower layer boundaries of magnetized rocks, the curie depth point corresponds with the point depth with high temperature which causes the loss of magnetism in rocks. The Curie point depthshows that the curie isothermbased on the spectra analysis lies betweenthe depthof7.8 kmto 11.3 kmand an average of 9.9 km across study area. A plot of curie point depth against geothermal gradient is displayed in figure 12, this shows the depth variation at which rocks losses their magnetism due to temperature within the subsurface of the study area.
Figure 12. A plot of curie point depth against geothermal gradient
The Geothermal gradient of the area ranges from 51.3 OC/km to 74.4 OC/km with an average value of 59.4 OC/km. The values ranges for the area shows negligible vast range between the minimum and the maximum value, and it can also be observed that the areas with higher Geothermal gradient are dominated by high frequency anomalies compared to others, this is due to the presence of high level near surface intrusive within these areas as shown in the residual anomaly map and the first upward continuation anomaly maps. Curie point depth therefore has an inverse relationship with geothermal gradient as areas with deeper curie depth points were seen to have lower geothermal gradient.
The over pressured formations at depths are associated with higher geothermal gradients. The heat flow therefore gives us the idea of heat energy distribution in the subsurface. A plot of curie point depth against heat flow are shown in figure 13. The heat flow for the study area ranges between 128.3 and 186 mW/m2 with an average of about 148.5 mW/m2. The variation of heat flow within the earth is as a result of the lithological variations observed from one region to another within the earth crust, since heat is from radioactive elements. Specifically, by the decay of elements such as potassium, uranium and thorium. The amount of earth temperature increases with depth, this indicates heat flowing fromthe earth to the surface.
A comparison of the geothermal gradient and the heat flow plot shows that the areas with high geothermal gradient were also observed to have a higher values of the heat flow whereas areas with high heat flow rate are observed to have a shallow curie point depth and vice-versa. Areas with much lithological intrusive and high structural activities are considered to have high rate of heat flow. This result is in agreement with Elshalom and Emmanuel (2022) who obtained Curie Point Depth values to range from 7.956 km to 11.172 km, with a mean of 9.452 km, Geothermal Gradient of 51.916 OC/km to 72.901 OC/km at an average of 61.893 OC/km and heat flow of 129.789 mW/m2 to 182.252 mW/m2 at an average of 154.983 mW/m2
4. CONCLUSION
Geothermal resources supply vital information on the sustainable power source represented by the Earth's internal heat. Quantitative and the qualitative method of interpretation have been deployed in the cause of the study. The results obtained fromtheplottingofcuriepoint depthagainstgeothermalgradientand heatFlowshowsthatthecuriepointdepthisshallower at higher heat flow. The result from the 3D residual surface map help to quantify the different magnetic responses of structures located in the shallow and deep sedimentary sections in the basement. The 3-D surface map also show a linear depression with sedimentary accumulation trending E-W. Upward continuation of the TMI data set emphasizes the abundance of magnetic materials down to mid-crustal levels, constrained by the depth at which the curie temperature destroys rock magnetism. More so, regions, where the Curie isotherm is relatively high in the crustal surfaces, are often regions of high flow with promising areas for geothermal energy potentials. The study area is therefore considered as a potential reserve zone for geothermal energy resources. The result is similar to that of Okiyi, et al. (2021) on evaluation of geothermal energy resources in parts of South Eastern sedimentary basin, Nigeria. It is also in agreement with that obtained by Anyadiegwu and Aigbogun (2021) on curie point depth, heat flow and geothermal gradient determined from analysis of aeromagnetic data over parts of the lower Benue Trough and Anambra basin, Nigeria. This validates the authenticity and the accuracy of the result gotten from a non-direct measurement of heat flow using the aeromagnetic data.
REFERENCES
[1] Akanbi ES, Fakoya AD (2015). Regional magnetic field trend and depth to magnetic source determination from aeromagnetic data of Maijuju area, North-Central, Nigeria. Physical Sci. Int. J. 8(3): 1-13.
[2] Alasi, T. K., Ugwu, G. Z. and Ugwu, C. M. (2017). Estimation of sedimentary thickness using spectral analysis of aeromagnetic data over Abakaliki and Ugep areas of the Lower Benue Trough, Nigeria. International Journal of Physics Sciences. 12(21): 270-279.
[3] AnyadiegwuFC, AigbogunCO(2021).Curiepointdepth,heatflowand geothermal gradientdetermined fromanalysis of aeromagnetic data over parts of the Lower Benue Trough and Anambra Basin, Nigeria. J. Appl. Sci. Environ. Manage. 25 (10): 1821-1831.
International Journal of Recent Research in Physics and Chemical Sciences (IJRRPCS)
Vol. 9, Issue 2, pp: (11-21), Month: October 2022 – March 2023, Available at: www.paperpublications.org
[4] Bhattacharyya BK (1966). Continuous spectrum of the total magnetic field anomaly due to a rectangular prismatic body. Geophysics,31: 97-121.
[5] Elshalom CO, Emmanuel KA (2022). Delineation of geothermal energy potentials in parts of Calabar Flank, South Eastern Nigeria using aeromagnetic data. World Scientific News. 164 (2022) 77-107.
[6] Hahn AK, Mishra DC, (1976). Depth estimation of magnetic sources by means of Fourier amplitude spectra Geophysical. Prospecting, 24: 287-308.
[7] Ikumbur EB, Onwuemesi AG, Anakwuba E, Chinwuko AI, Usman AO, Okonkwo CC (2013). Spectral Analysis of Aeromagnetic Data over Part of the Southern Bida basin, West- Central Nigeria. Int. J. Fundamental Physical Sciences, 3(2): 27-31.
[8] Mishra DC, Naidu PS (1974). Two-dimensional power spectral analysis of aeromagnetic fields. Geophysical Prospecting, 22: 345-353.
[9] Negi J, Agrawal P, Rao K (1983). Three-dimensional model of the Koyna area of Maharashtra State (India) based on the spectral analysis of aeromagnetic data. Geophysics, 48(7): 964-974.
[10] Nwachukwu SO (1972). The tectonic evolution of the southern portion of the Benue Trough, Nigeria. J. Min. Geol. 11: 45-55.
[11] Obi DA, Okereke CS, Obei BC, George AM (2010). Aeromagnetic modelling of subsurface intrusive and its implications on hydrocarbon evaluation of the Lower Benue Trough, Nigeria. Eur. J. Sci. Res., .47(3): 347-361.
[12] Ofoegbu CO (1985b). A review of the geology of the Benue Trough, Nigeria. J. Afr. Earth Sci. 3: 293-296.
[13] Ofoegbu CO, Onuoha KM (1991). Analysis of magnetic data over the Abakaliki Anticlinorium of the Lower Benue Trough, Nigeria. Marine and Petr. Geol. 8: 174-183.
[14] Ofoegbu, CO (1985a). A review of the geology of the Benue Trough of Nigeria. J. Afr. Earth Sci. 3: 283-291.
[15] Okezie CN (1965). The Abakaliki Pyroclastics. Rept. Geol. Surv. Nig. (Unpubl.).
[16] Okiyi IM, Selemo AI, Ibeneme SI, Olorunfemi MO, Adikwu SA (2021). Estimation of Lineaments and structures as indices of mineralization in parts of southeastern Nigerian Sedimentary basin of Nigeria. Journal of Earth and Atmospheric Research. (In Press).
[17] Okubo Y, Graf RJ, Hansen RO, Ogawa K, Tsu H (1985). Curie point depths of the island of Kyushu and surrounding area, Japan. Geophysics. 50: 481-489.
[18] Olade MA (1975). Evolution of Nigeria’s Benue Trough (aulacogen): a tectonic model. Geol. Mag. 112: 575-583.
[19] Olade MA (1976). On the genesis of the lead-zinc deposits in Nigeria’ Benue Rift (aulacogen): A re-interpretation. J. Min. Geol. 13(2), 20 – 27.
[20] Onuba LN, Onwuemesi AG, Anudu GK, Chiaghanam OI, Ifelunni CD (2008). Interpretation of aeromagnetic anomalies over Benue Trough, Northeastern, Nigeria. Journal of Natural and Applied Sciences. 9: 1-12.
[21] Onuba LN, Onwuemesi AG, Egboka BC, Anudu GK, Omali AA (2013). Review of hydrocarbon prospects in the Lower Benue Trough, Nigeria: Adapted from extended abstract prepared in conjunction with oral presentation at AAPG Annual Convention and Exhibition, Pittsburgh, Pennsylvania.
[22] Onuba LN, Onwuemesi AG, Egboka BC, Anudu GK, Omali AA (2013). Review of hydrocarbon prospects in the Lower Benue Trough, Nigeria: Adapted from extended abstract prepared in conjunction with oral presentation at AAPG Annual Convention and Exhibition, Pittsburgh, Pennsylvania.
[23] Petters SW, (1978). Stratigraphic Evolution of the Benue Trough and Its Implications for the Upper Cretaceous Paleogeography of West Africa. The Journal of Geology. 86(3), 311
322.
[24] Reyment RA (1965). Aspects of Geology of Nigeria. Ibadan University Press, Bull. Geol. Surv. Nig.
International Journal of Recent Research in Physics and Chemical Sciences (IJRRPCS)
Vol. 9, Issue 2, pp: (11-21), Month: October 2022 – March 2023, Available at: www.paperpublications.org
[25] Spector A (1968). Spectral analysis of aeromagnetic maps. Unpubl. Ph.D. Thesis, University of Toronto, Canada.
[26] Spector A, Grant FS (1970). Statistical models for interpreting aeromagnetic data, Geophysics, 25:293-302.
[27] Tanaka A, Okubo Y, Matsubayashi O (1999). Curie point depth based on spectrum analysis of the magnetic anomaly data in East and Southeast Asia. Tectonophysics 306: 461-470.
[28] Tselentis, GA (1991). An attempt to define Curie depth in Greece from Aeromagnetic and heat flow data. PAGEOPH, 136(1): 87-101.
[29] Turcotte DL, Schubert G (1982). Geodynamics: Applications of continuum physics to geological problems. Cambridge University Press, New York, 450.
[30] Uzuakpunwa BA (1974). The Abakaliki pyroclastics, Eastern Nigeria: new age and tectonic implications. Geol. Mag. 111:761-769.
[31] WrightJB(1976).OriginsoftheBenueTrough acritical review.In:Kogbe CA(ed)GeologyofNigeria.Elizabethan Publication Co., Lagos, 313-318.