13 minute read
Malaysian mission


MALAYSIAN MALAYSIAN MALAYSIAN MISSION MISSION MISSION


Well completion design with inflow control devices (ICDs) is one of the important steps in efficient field development planning. It has a strong influence on not only the production profile but also the economics. Technology advances, in conjunction with drilling capabilities, have significantly improved well productivity and enhanced hydrocarbon recovery.
Reservoirs developed with horizontal wells face various challenges, such as early water and gas breakthrough, leading to reduced oil recovery. This is often the result of a variation in the reservoir properties, including the fluid and petrophysical properties, layer pressure and fluid contacts. Several studies assert that such challenges can be mitigated by deploying advanced well completions to manage the reservoir fluid influx along the wellbore and therefore optimise the performance of wells.1 – 6
In addition, research suggests the application of autonomous inflow control devices (AICDs) to control water or gas production acts as a type of insurance policy against geological and dynamic reservoir uncertainties to reduce the risk and variation in the expected oil production profiles.7
In 2018, Tendeka successfully performed an infill development campaign for PETRONAS-Malaysia to improve production with the first delivery of its FloSure AICD completion in a complex offshore oil reservoir in Sarawak, northwest of Borneo.8 The field itself had been producing for more than 45 years (Figure 1).


Fuziana Tusimin, Latief Riyanto and Norbaizurah Ahmad Tajuddin, PETRONAS, and Mojtaba Moradi, Raam Marimuthu and Michael
Konopczynski, Tendeka, reveal how the well performance of a complex oil reservoir offshore Sarawak was optimised by autonomous inflow control device technology.


The chosen horizontal well, Well-A, was drilled in a very thin formation, with the oil rim averaging a thickness of 13 ft (the thinnest AICD application to date). The well intersects two geological layers with diff erent properties. A large gas cap and an aquifer are located above and below the well. In addition, oil production from this well was expected to be reduced significantly due to a high probability of early water and gas breakthrough, potentially within days or weeks.
It was therefore critical to optimise the stand-off distance from gas-oil contact (GOC) and oil-water contact (OWC) to ensure sustainable long-term production from Well-A and to identify suitable technology to minimise the anticipated threat.
The workflow comprised: Pre-drilling studies, including AICD flow loop testing. Well candidate selection. Flow performance evaluation (static/dynamic modelling). Post-drilling analyses involving real-time completion design, history matching and comparison of production data with neighbouring wells.
Based on the off -set wells, structural uncertainty was anticipated to be 25 ft true vertical depth subsea (TVDSS), which is greater than the oil column thickness. This made building the deviation angle while drilling and landing the horizontal well in the thin oil column challenging.
The maximum dogleg severity (DLS) of the openhole horizontal section had to be limited to 3˚/100 ft or less to reduce running forces and bending stresses during lower completion installation, especially for the screen and swell packer installation. This was confirmed through torque and drag analysis.
Completion equipment, including the AICD and screens, had only been purchased for a 1400 ft horizontal length. Due to the unique nature of the devices, using additional material from other projects to make up a longer horizontal section was not an option. The final horizontal length was therefore limited by the material readiness.
A significant diff erence between the prognosed and actual permeability in one of the subunits was observed, despite good well control at the Well-A location. This impacted the planned completion strategy for the subunit. Fast, real-time decisions, based on the actual data, were needed to optimise the completion design.
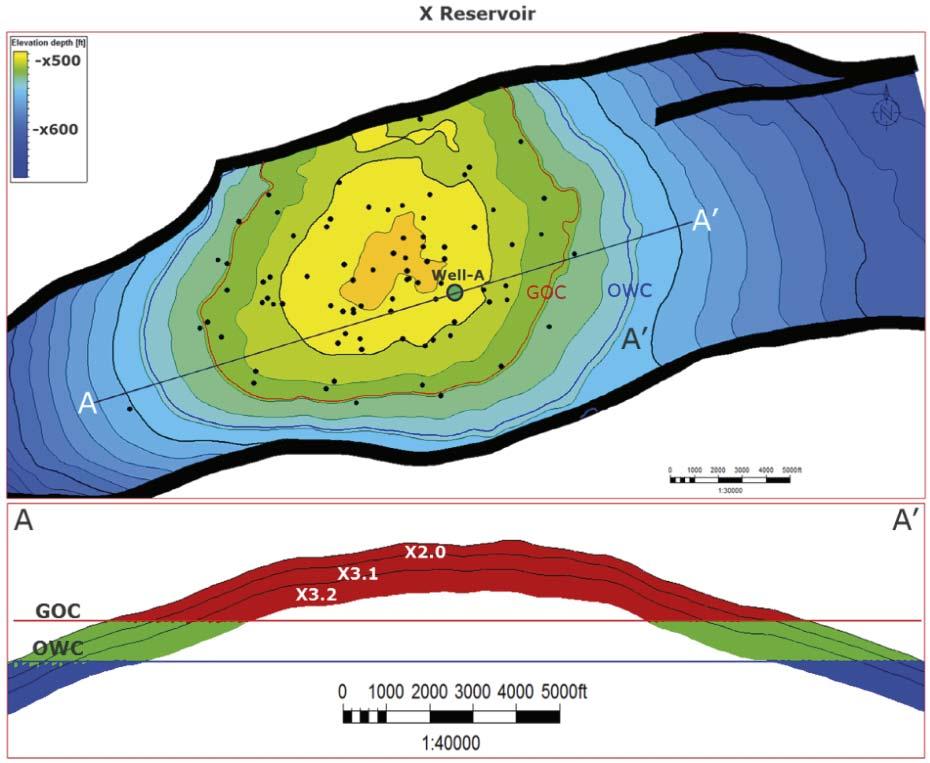
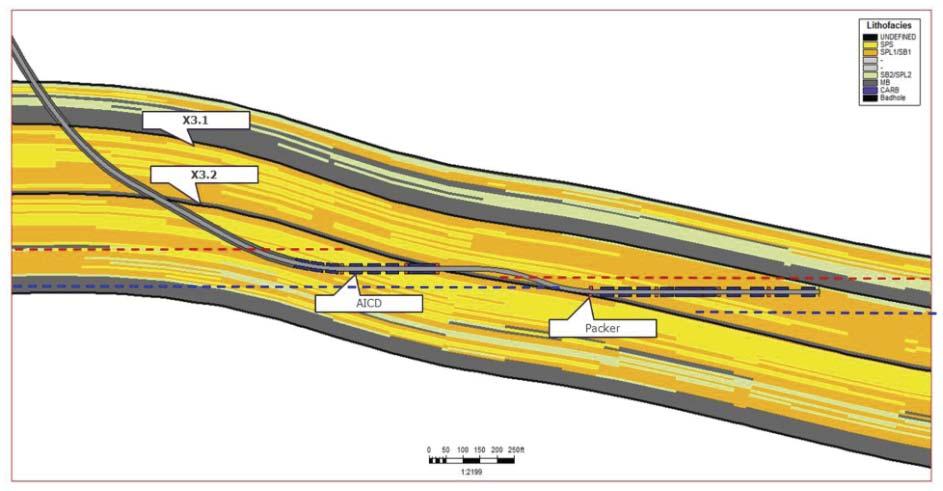
Figure 1. Structure map with well penetrations in reservoir X and cross-section of reservoir X.
Figure 2. Construction of FloSure AICD.
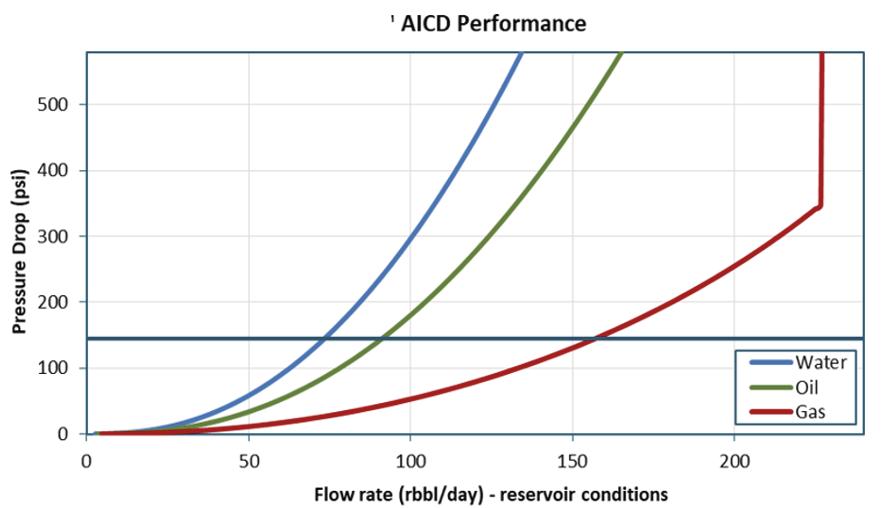
Figure 3. AICD performance prediction for single phase oil at 0.4 cP, water and gas.
Balancing the influx of reservoir fluids
Like an ICD, the AICD (Figure 2) is designed to balance the influx of reservoir fluids, thus delaying the production of unwanted eff luents prior to their breakthrough (proactive solution). However, once breakthrough occurs, the device restricts the production of unwanted eff luents with lower viscosity, such as gas in light oil applications and both gas and water in viscous oil production (reactive solution).
Fluid enters the device through an orifice in the top plate. This impacts the levitating disk and disperses fluid radially between the disk and the top plate, before turning around the periphery of the disk to exit the device through an array of ports at the bottom of the device.
The pressure drop experienced by fluid flowing through the AICD is a function of the volumetric flow rate and the viscosity and density of the fluid. The degree of flow restriction is a result of the position of the levitating disk, while the disk position is determined by the balance of three principal forces: a change in momentum force; a force created by the frictional pressure drop of the fluid flowing through the device; and a ‘lift ing’ force created by a reduction in pressure of the fluid moving at high velocity in the gap between the disk and the top plate, as described by Bernoulli’s equation of constant energy.
Field B employs 7.5 mm AICD valves to match device performance to the well flow rate requirements. In field B, the oil viscosity is 0.67 cP, water is 0.37 cP and gas is 0.02 cP. When gas or water flows through the AICD valve at the same drawdown the velocity of the water and gas will increase, and hence reduce the dynamic pressure and levitate the disk towards the inlet to choke the flow.
The AICD valve is assembled as part of the sand screen joint. The size of the device is interchangeable at the rig site if the calibration modelling using the actual log data acquired aft er drilling suggests something diff erent than expected. Dynamic reservoir simulations are required to quantify the production benefits of the AICD completion over field life.
Figure 3 shows the single phase AICD performance curve at reservoir X conditions.
Several production scenarios depicting the unwanted fluids breakthrough were simulated to quantify the performance of the well with the AICD completion in later life and, in turn, design an optimised AICD completion.
Well completion design process
Based on a petrophysical study, a thick shale section was expected from 6907 – 7187 ft . The X3.2 reservoir is estimated to have a 5 ft stand-off from the OWC at the heel location of the well and is prone to early water breakthrough. Meanwhile, the top of the X3.1 reservoir is closer to the GOC, with high gas saturation over 60% observed from 7187 – 7667 ft depth. This section of the wellbore is also susceptible to early gas breakthrough.
Blanking off this high gas zone would be the ideal solution to mitigate early production of gas. The mid and toe section of the X3.1 reservoir contain good saturation of oil, which necessitates more AICD joints to be placed in these sections for improved well production.
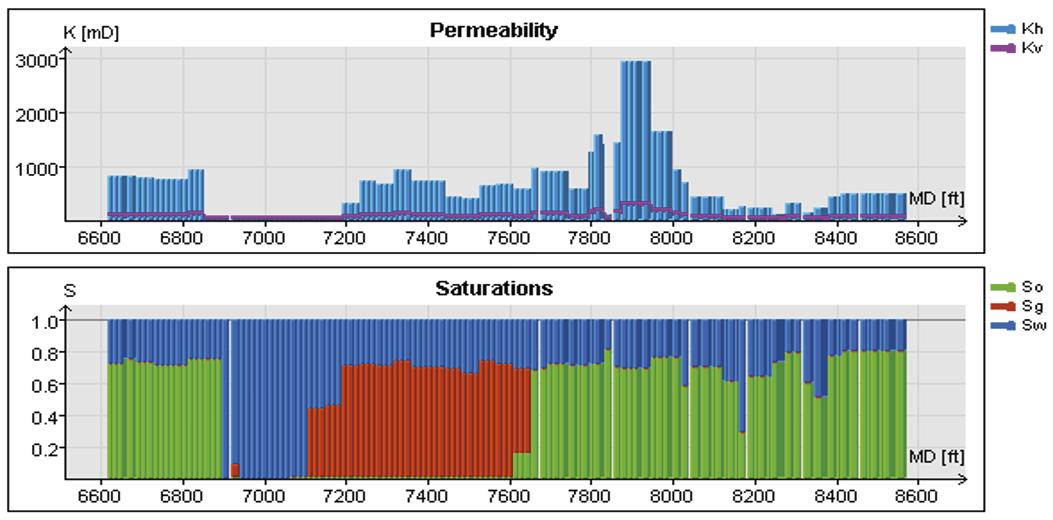
Figure 4 shows the near wellbore reservoir properties obtained from logs aft er reaching target depth (TD). The reservoir permeability averaged 1000 mD, with a high permeability zone observed at 7852 – 8032 ft .
The observed reduction in oil rim thickness at Well-A necessitated re-evaluation of the remaining recoverable reserves and well placement strategy. First, an analytical study identified the need for a new drainage point in the south-east area of reservoir X. Secondly, a fit-for-purpose dynamic model was constructed to meet the following objectives: Understand the impact of a thinner than expected oil rim on recoverable reserves. Optimised stand-off distance from GOC and OWC in Well-A. Design of the AICD well completion.
A segmented well model was created in the reservoir dynamic simulation model to represent the proposed AICD placement. The investigation used multiple parameter sensitivities to evaluate the impact on oil production from thinning of the oil leg column, and the timing and extent of early water and gas breakthrough. Based on the analysis, the optimised horizontal depth placement is 1/3 stand-off distance from the GOC and 2/3 from OWC, in order to sustain well life and recover the new estimated reserves.
Multiple simulation runs were completed to test the sensitivity of production rates and recovery eff iciency to the number of AICDs and packer placement for the horizontal section segmentation. Oil, gas and water production rates were compared at two time-steps: initial and at end of well life. This found that the gas/oil ratio (GOR)
Figure 5. Initial AICD placement along the horizontal section of Well-A.
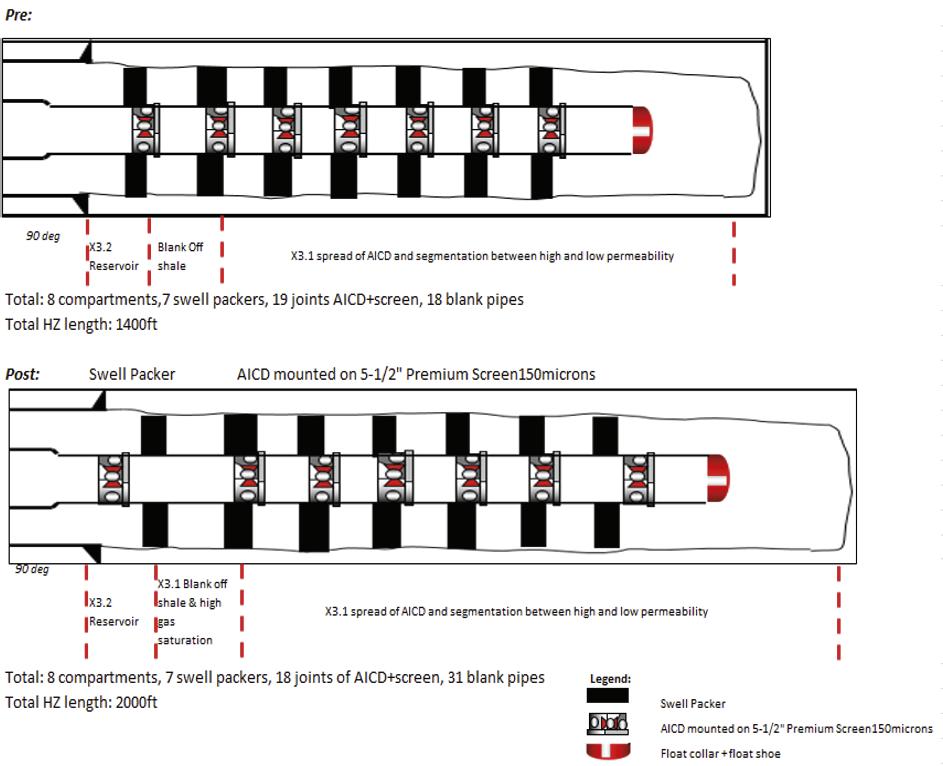
Figure 6. Pre-drill and post-drill over completion diagram of Well-A.
can be reduced by 46% compared to a standalone screen completion aft er gas breaks through. Oil production can be increased by up to 50% with constant downhole rate control via two AICDs mounted on each joint of 5 1/2 in. 150-Micron premium sand screen.
In addition, a segmentation analysis recommended the creation of seven producing compartments with seven swell packers to achieve better inflow control. For the upper completion, the tubing size is 3 1/2 in. and is equipped with a gas lift mandrel to kick-off the well for production. The initial design for Well-A is shown in Figure 5.
The application of real-time reservoir mapping-while-drilling enabled the evaluation of the oil column thickness in both the X3.1 and X3.2 reservoir subunits. The oil rim in X3.2 was shallower than prognosed and was interpreted to be 17 ft thick, while the oil rim in X3.1 was deeper than what was seen in Well-B and was interpreted to have a thicker oil column of 25 ft .
Well-A was drilled until the final target depth (FTD) with a total horizontal length of 2000 ft . Additional 5 1/2 in. blank liner joints were secured, which enabled the completion of the additional horizontal length. Using the post drilling results, a real-time inflow control simulation was rerun to confirm the final placement of AICDs prior to the completion operation.
For the analysis, several scenarios were simulated by manipulating the late-time fluid saturation to mimic breakthrough scenarios and observe AICD performance along the horizontal section. The inflow control simulation considered the possibility of early water breakthrough from X3.2 as a result of the 5 ft stand-off from OWC at the heel, as well as early gas breakthrough at the top of X3.1 and the significant permeability diff erence along the horizontal penetration within the X3.1 subunit. The strategy was to limit AICD joints in the X3.2 subunit to restrict the water inflow, to blank-off the high gas saturation zones in X3.1 and to limit AICD joints at the high permeability intervals.
To evaluate the AICD performance at late life, several completion designs were considered to examine the functionally of the AICD completion design and quantify the impact on well productivity. As a result, the final completion design was better compared to the pre-drill plan. A total of seven swell packers and 18 AICD joints were installed. Figure 6 shows the completion diagram between pre-drill and post-drill of Well-A.
Results
Well-A was successfully drilled within the thin oil rim, optimally placed and completed with an advanced AICD completion that was designed using a strategy based on the integration of fit-for-purpose and innovative approaches, incorporating the appropriate application of FloSure AICDs. The drill-in and completion fluids were unloaded from Well-A to establish communication between the wellbore and reservoir. It was able to flow at an instantaneous rate of 3140 bpd of liquid with 8% water cut. Gas production was also monitored to measure AICD eff ectiveness; initial readings were low and comparable to the solution GOR. Subsequently, the dynamic model was updated with observed contacts, well trajectory and final completion. Several withdrawal scenarios for diff erent liquid production rates were performed. Greater withdrawal rates result in increased pressure drawdown and consequently earlier water coning. Log-log plots of the simulated water-oil ratio (WOR) and the time derivative of WOR illustrate how a higher withdrawal rate exacerbates water coning. Therefore, controlling Well-A drawdown is one way to mitigate coning and thereby sustain oil production for a longer period.
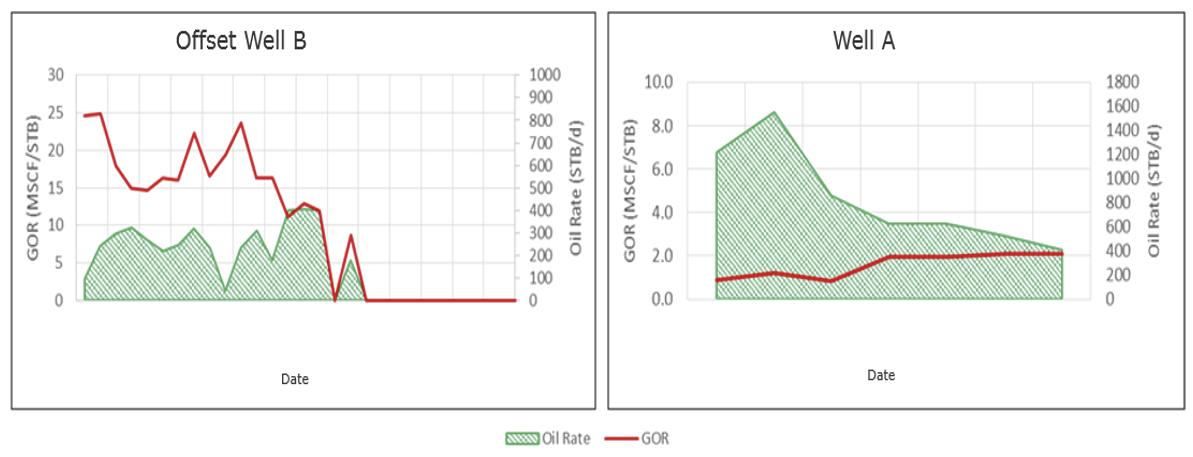
Figure 7 shows the performance comparison of Well-A, completed with FloSure AICDs, and Well-B, completed with another completion technology. Although Well-B showed significant GOR reduction (from 25 000 ft3/stock tank barrel to less than 1000 ft3/stock tank barrel) at initial testing of production life, it was later shut-in due to excessive gas production. However, Well-A is still producing at a high oil rate while maintaining a stable GOR of 2000 ft3/stock tank barrel.
Tendeka’s FloSure AICD completion ensures balanced contribution from all reservoir sections and limits gas and water production. This enables the operator to implement an optimum reservoir drainage strategy that capitalises on the ability of the AICD downhole flow control to react autonomously based on dynamic well conditions – restricting the flow of unwanted eff luents – without the need for control lines and surface control systems.
The technology has delivered a 200% increase in oil production while reducing the GOR by up to 90% and water cut up to 50%, compared to several off set wells with various other completions.
References
1. AHMAD, F., AL-NEAIMI, A.K., SAIF, O.Y., CHANNA, Z., IWAMA, H.,
SARSEKOV, A., EL-SAYED, H.S., KONOPCZYNSKI, M., ISMAIL, I.M., and
ABAZEED, O., ‘Rejuvenating a High GOR, Light Oil Reservoir Using AICD
Completion Technology for Gas Control’. Society of Petroleum Engineers.
SPE-183486-MS (November 2016). 2. DOWLATABAD, M.M., ‘Novel Integrated Approach Simultaneously Optimising
AFI Locations Plus Number and (A)ICD Sizes’. Society of Petroleum Engineers.
SPE-174309-MS (June 2015). 3. HALVORSEN, M., MADSEN, M., VIKØREN MO, M., ISMA MOHD, I., and GREEN, A.,
‘Enhanced Oil Recovery on Troll Field by Implementing Autonomous Inflow
Control Device’. Society of Petroleum Engineers. SPE-180037-MS (April 2016). 4. MORADI, M., KONOPCZYNSKI, M., MOHD ISMAIL, I., and OGUCHE, I., ‘Production
Optimisation of Heavy Oil Wells Using Autonomous Inflow Control Devices’.
Society of Petroleum Engineers. SPE-193718-MS (December 2018). 5. MOHD ISMAIL, I., CHE SIDIK, N.A., SYARANI WAHI, F., TAN, G.L., TOM, F., and
HILLIS, F., ‘Increased Oil Production in Super Thin Oil Rim Using the Application of Autonomous Inflow Control Devices’. Society of Petroleum Engineers.
SPE-191590-MS (September 2018). 6. DOWLATABAD, M.M., MURADOV, K.M., and DAVIES, D., ‘Novel Workflow to Optimise Annular Flow Isolation in Advanced Wells’. IPTC-17716-MS (December 2014). 7. DOWLATABAD, M.M., ZAREI, F., and AKBARI, M., ‘The Improvement of
Production Profile While Managing Reservoir Uncertainties with Inflow
Control Devices Completions’. Society of Petroleum Engineers. SPE-173841-MS (April 2015). 8. AHMAD TAJUDDIN, N.B., DAN, H.X., TUSIMIN, F., KAWAR, S., RIZA FEISAL, S.M.,
WAHID ALI, N.A., SHAH, J.M., RIYANTO, L., HUSSAIN, M., A’AKIF FADZIL, N.A., and
SAKDILAH, M.Z., ‘Successful Monetisation of an Extremely Thin Oil Rim and
Slanted Contact Reservoir, Offshore Malaysia, through Emerging Technologies and Innovative Concepts’. SPE-196513-MS (October 2020).