08 Mutual funds were wildly profitable last year, so the govt is taxing them. Here’s why it could mean the PSX is in for big investments
12 Walls rules Pakistan’s ice cream economy with an iron fist. Could Omore have an opening this year?
20 What is the reality of Pakistan’s defense budget? Maria Mansab
21vInside the Defence Budget: Has inflation hit the military?
23 Will fiscal year 2025 be a better year for the private sector?
25 Textile mills in Pakistan are exporting their used machinery in the midst of an industry crisis. How did they get here?
Publishing Editor: Babar Nizami - Editor Multimedia: Umar Aziz Khan - Senior Editor: Abdullah Niazi
Editorial Consultant: Ahtasam Ahmad - Business Reporters: Taimoor Hassan | Shahab Omer
Zain Naeem | Saneela Jawad | Nisma Riaz | Mariam Umar | Shahnawaz Ali | Ghulam Abbass
Ahmad Ahmadani | Aziz Buneri - Sub-Editor: Saddam Hussain - Video Producer: Talha Farooqi Director Marketing : Mudassir Alam - Regional Heads of Marketing: Agha Anwer (Khi) Kamal Rizvi (Lhe) | Malik Israr (Isb) - Manager Subscriptions: Irfan Farooq Pakistan’s #1 business magazine - your go-to source for business, economic and financial news. Contact us: profit@pakistantoday.com.pk

Mutual funds were wildly profitable last year, so the govt is taxing them.
Here’s why it could mean the PSX is in for
The goal of the budget proposals might be to increase tax revenue but it can have a real impact on the shift taking place in the mutual fund industryBy Zain Naeem
The recent budget proposals that have been made have had one thing in the forefront all along. Tax revenue generation and maximization. With IMF targets to meet and a surplus to be shown,
the budget has been designed with that fact in mind. One of the proposals that has been made is to tax the mutual fund industry. The purpose of the taxation is to tax a stream of revenue and income which has earned high amounts of the profits in the last year.
From June 2023, banks and fixed income securities have earned record high profits due
to the high level of interest rate. This has been matched by the stock exchange which has also seen a return of almost 92% for the same period. As mutual funds have invested in these two asset classes, they have earned healthy returns.
Now it seems there is a move to tax some of the fixed income mutual funds while equity funds are left unscathed. What are mutual funds?
What is the new budget proposal and what long term impact can this tax have on the mutual fund industry of the country? Let Profit explain it all.
Mutual funds are investment vehicles that are usually operated by Asset Management Companies (AMCs) which carry out the task of earning a return for their investors. These AMCs constitute a mutual fund based on the investment strategy which is defined initially in the offering document and this becomes the sales brochure which is pitched to an investor.
Based on the investment needs of an investor, they weigh the risk and return inherent in the fund and then decide whether they want to invest or not. Once they hand over the funds to the AMC, the company collects all these funds and then invests it based on the recommendation of its Investment Committee. The Investment Committee does not take decisions based on “vibes” and has to justify each recommendation and investment based on credible data. Once the decision is made, the AMC then goes onto actually investing in the assets that conform to its investment mandate.
Just like the investor has initially invested with the company, they can choose to invest more from time to time or look to redeem their investment by asking the company to do so. The investor only interacts with the AMC and communicates with them when they need to carry out an investment action. Similarly, the fund will also look to change its investments in different assets based on which assets have fallen out of favour or do not conform to their mandate and buy new ones which seem more attractive or undervalued based on their research and due diligence. Their main task is to keep balancing the portfolio of funds on a regular basis to make sure their initial investment mandate is being pursued.
So is there only one type of mutual fund?
No. Based on the investment mandate, the mutual fund industry can be divided into a fixed return category or an income fund, balanced fund, index or commodity tracker fund, equity fund and lastly a fund of funds. This means that rather than being limited to one class of asset, mutual funds can invest across a myriad of asset choices available to them to meet the needs of its investors. The reason that funds are categorized by the Securities and Exchange Commission of Pakistan (SECP) is due to the fact that their investment mandate is dictated by what assets and what weightage they can invest in.
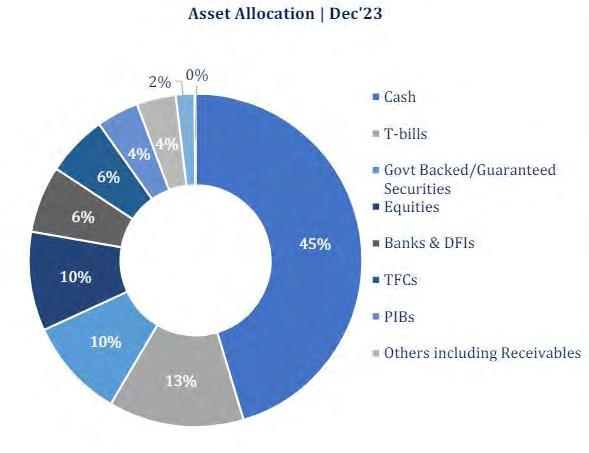
An income fund is a fund which is supposed to provide a function of a constant income for their investor. Imagine a pensioner who has retired and needs a constant stream of income which will allow him to meet his daily expenditure needs. The investment has already been made and the investor needs to make sure that they are able to earn a constant return with the initial investment being safe and them earning a return on top of that. The investor has little room to take risk and cannot afford to see a negative return as that will be detrimental to him. The income fund invests in government backed and highly secure securities which have little risk and a limited return. Recently, the fact that policy rate has been around 22% means that income funds in Pakistan have been able to earn an average return of 22%. Compared to bank return, this seems like a much more attractive investment as this would lead to a higher return for the investor. Income funds are supposed to invest 25% in liquid cash reserves and instruments to meet their liquidity requirements.
Abalanced fund is a fund which is allowed to invest in income generating assets while also allowing for investment in equities. SECP mandates that a balanced fund can invest between 30% to 70% of its assets in equities while the remaining can stay income generating securities like government securities. As the stock exchange saw staggering returns since July, balanced funds earned an average
return of 65% in Pakistan till June of 2024.
Index fund or a commodity fund is a fund which invests in a specific asset. An index fund will invest in the equities that make up the KSE-100 index to replicate the returns earned by the index. A similar fund can be a gold fund where the AMC invests in gold and then as the price of gold moves, so does the price of the fund and its units. Rather than investing in the asset directly, an investor can earn similar returns and leave the decision making up to the experts. In the last year, the index tracker funds yielded a return of 70% which is close to the actual return of the index of 92%.
An equity fund is considered to be on the other end of the spectrum as they are allowed to hold equities and are mandated to at least hold 70% of their assets in the form of an equity investment. These can be considered to be the most risky investments and can yield the highest return for the investors as well. With that being said, there is also a chance of making a negative return and actually losing money on your investment if the market takes a turn against the fund’s expectations. Investors who can afford to lose money on their investment choose these funds as they are fine with losing some money with a chance that they will earn a return higher than the fixed income funds. In the last year or so, equity funds earned an average return of 90% till date.
The last type of fund is the fund of funds.
As the name suggests, it is a fund which invests in funds rather than an asset directly. Mutual funds are investments which are seen to be less volatile as compared to assets as the diversification of the portfolio allows the returns to be smoothed out to an extent. These funds can be considered a further smoothening of the returns that are earned by the funds themselves as well. On average, these funds earned a return of 50% in the last 12 months.
If an investor feels that these funds are not compliant to their Islamic values, funds have also started to issue units for Shariah compliant funds which can be invested in by people who are skeptical in investing in conventional funds. Shariah complaints funds also encompass the same types of funds as discussed earlier.
Mutual funds make sense for an investor who is either not privy to the economic level information in relation to the capital markets or does not want to think about his investments on a regular basis. They feel it is better to hand over this responsibility to someone else who has better tools and knowledge at their disposal. They would have an army of researchers and a group of people who can read the tea leaves and make a better decision in their place.
Similarly, the fund can invest across a variety of assets and allow an investor to get exposure in assets which might not be available to small investors which can unlock returns which are not available to the investor usually. In addition to that, the market for mutual funds is liquid which means they can sell or buy units from the AMC whenever they want and there will always be a buyer when they want to sell their units.
So what is the cost of having access to this plethora of knowledgeable people? Who says there is free lunch?
The biggest disadvantage of investing in a mutual fund is that the costs will be charged regardless of the fact that the fund makes a positive or negative return. AMCs have their bills to pay and their managers’ salaries to take care of which means that they will still charge you additional costs even if the fund suffered a loss. In addition to that, there is a lack of control as investors have little say in where and how the funds are invested. The most they can do is sell their investment once they feel their investing needs are not being met.
The data available to an investor is always lagged when it comes to a mutual fund. An investor might see that the return earned by the fund was high in the last year. Based on that, they assume that next year will be anoth-
er stellar year. The performance of the past has no bearing on future performance and that is a caveat which is always parrotted by the mutual funds themselves. This means that a mutual fund might suffer a loss after an amazing year as the workings of the economy cannot be predicted or forecasted beforehand. This is a risk that is being taken when investment is being carried out in a mutual fund.
In addition to these disadvantages there are objectives costs that are deducted by the AMC based on different calculations. These deductions have an impact on the return earned as they are taken away from the returns.
So what are the costs that are actually taken by the fund?
The most basic cost that is levied is the management fee. This is the fee that the management company charges from the investors which is a percentage of the net assets that the fund has under its own management. Normally these vary between 1.5% to 2.5% in Pakistan. When taken in context of billions of rupees in net assets, the end figure becomes huge. AMCs charge management fees from each fund that they are managing and running. These management fees add up and become part of the AMCs earnings. The funds don’t need to beat the market or even make a profit to qualify for management fees. These are unavoidable and have to be paid.
Back end load and front end load are fees that are charged from the investor based on different goals that the fund wants to achieve.
Front end load is charged when the investor invests in a fund. The fund manager does not want any new investment to come into the fund due to which they want to place a penalty on the investors investing in. A front end load of 2%, for example, would mean that the fund will invest Rs 98 rather than the Rs 100 that the investor gave to the AMC. A fund manager might place such a load as it would discourage an investor from investing.
A back end load is charged when the investor is redeeming or selling his investment in the fund. If a fund manager does not want to see investments moving out, he might place such a load as it will discourage the investor from taking his investment away. A 2% back end load charge will mean an investor will only see Rs 98 redeemed from an investment which was at Rs. 100 at redemption.
Other than these, there are also fees like brokerage fees, SECP related fees, trustee fees and rating agencies fees which are charged from the investor and paid by the AMC allowing it to operate in a free manner.
Lastly, there is a spread or a gap between what the fund is selling its units for and buying them back for. Consider an exchange rate quoted by a bank. The bank will sell you a dollar for Rs 300 and buy it back from you at Rs 299. If you buy from the bank and sell it back, you have ended up making a loss of Re. 1. This is the same with mutual funds. In order to buy or sell a unit of a fund, the only customer and seller is the AMC itself. This means they quote a selling price and a buying price. The spread between the two prices is the additional cost that is borne by the investor.
Till now, one of the biggest attractions investors to the mutual funds was the fact that they were seen as being a tax relief for the investors. The SECP even promoted mutual funds as a way to avoid higher levels of taxation. Consider the different scenarios that were available to investors. An investor who wanted to invest in the stock market, for example, could buy a stock for lets say Rs 10. Now when the stock increased to Rs 11 and the investors sold it, the investor had to pay capital gains tax applicable at 15%. If they invested in a stock fund, they would have to pay a tax rate of 12.5%. This tax went down to 10% if the dividend income earned by the stock fund was more than the capital gains it had earned.
Similarly, the investor had a chance to deposit this money into a bank account. Once he earned profit on debt, he would be liable to pay a tax of 15%. For a mutual fund, the taxation on the dividend that was paid out by the mutual fund was charged a tax rate of 15% as well. However, this created an opportunity to arbitrage as the investor was able to earn more when he was getting dividends from a fund which was primarily earning interest income or profit on debt. The new proposal would see the dividend income being taxed at 25% which would eliminate this arbitrage.
Even though this seems like a simple move, there can be an impact of this move which will see many funds move from fixed income based investment towards equity investments. In order
to keep providing a tax holiday and relief to their investors, mutual funds will be moved to invest in equity and the stock market in order to decrease their income from profit on debt by buying dividend yielding stocks and stocks which provide income through capital gains.
The SECP provides a band of percentages within which a fund can allocate its funds.

Income funds are mostly reliant on debt related securities and need to have 25% in cash reserves meaning they have to invest 75% of their funds in securities which are deriving their income from debt or profit from debt. These funds would have little choice but to see their withholding tax charged at a higher rate. One thing that can be done in order to avoid the taxation is to not give out any dividends and allow investors to sell their mutual fund units in case they need to liquidate some of their investment. The Berkshire Hathaway model so to say.
Other funds like a balanced fund, equity fund or even fund of funds would look to invest as much as they can in stocks and equities in order to reduce the tax burden. Mutual funds have to make them look attractive to an investor and one of the most attractive aspects of any such investment is the tax relief that they can offer. This proposal means that investors would still want to be wooed by the funds and the funds will alter their asset mix in order to make sure this advantage is not lost.
The biggest gainer from such a situation will be the stock market which will see renewed interest and investment from the mutual fund industry. Funds which might have taken it easy by parking their funds in safe and secure investments will now look to venture into the stock market and this renewed vigor will bring in more investment in a stock market that is already reaching new highs. This might be one of the unintended consequences of the tax proposal being made but it can have lasting effects in the market for months to come. n


Launched in 1995, Walls climbed over local players to the top and has fended off any attempts at competition. Could that change?By Abdullah Niazi
In 2009, the streets of Lahore were hit by an orange storm. All over the city smartly dressed men in orange shirts and caps driving orange ice cream cycles were found in small caravans. riding across the city.
And that wasn’t all.
Television adverts, billboards, banners, flyers, lucky draws, and every manner of traditional marketing technique was loudly trying to sell Omore ice cream. On the surface it seemed nothing more than the launch of a new brand of marketing. But in the background was a struggle between a Pakistani conglomerate and an MNC. By launching Omore, Engro was looking to take on Unilever in Pakistan.
You see in 2009, Pakistan’s ice cream market was ruled entirely by Walls, which had been introduced into the country by Unilever nearly 15 years prior.
In the years since its arrival in Pakistan, Walls set out on an expansionary path in major Pakistani cities, absorbing their competition such as Polka and becoming the top dog in the sector. By the year 2000, their dominance was undisputed and unchallenged. The launch of Omore by Engro Foods was the first real competition anyone had threatened Unilever and Walls with. There was a feeling at the time that even though Walls could not be routed, they could be seriously hurt and brought down a notch or two.
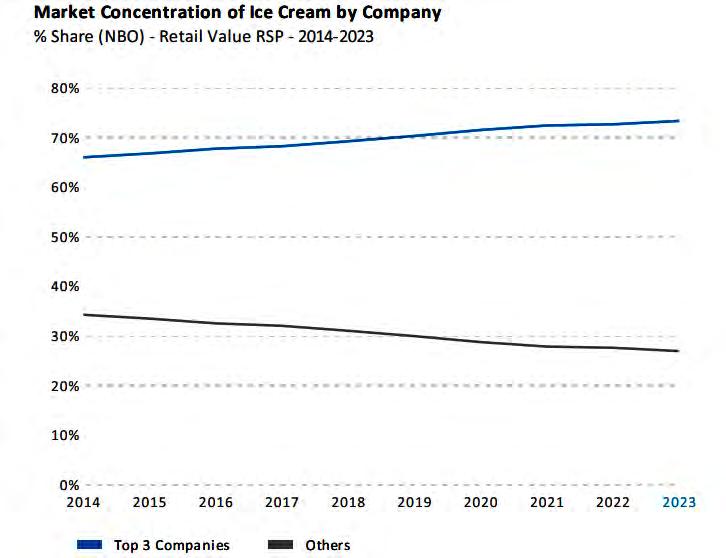
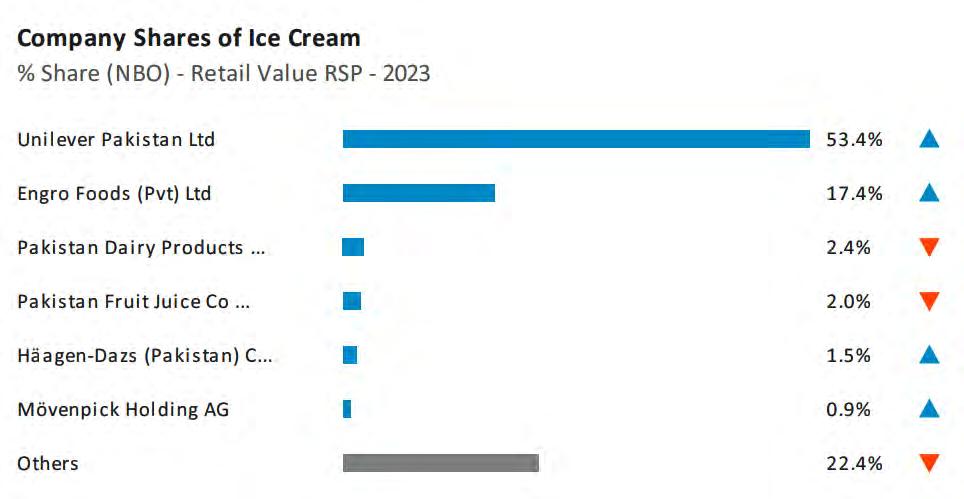
That plan hasn’t quite played out. According to the latest data available for the ice cream sector, Walls continues to control a simple majority of retail sales in the ice cream sector. With a selection of different brands and types of ice cream, Walls leads with 53.4% of the overall retail market share which was worth over Rs 50 billion in sales in 2023. Omore is firmly placed in second place, but it isn’t a close second with 17.4% of share in overall market sales. There are other players too. Igloo is a leader in some small areas while Hico has made most of its business by selling tubs of ice cream particularly to restaurants, and while they thrive in this small niche, they are not a major player.
It is clear Walls has been a dominant force over the past thirty years. Not only has this brand of ice cream remained the leader
in the ice cream market, it has also seen off some concentrated efforts to dethrone them. Omore has also not done badly for itself. While their initial strategy to get neck and neck with Walls hasn’t worked out, they have been biding their time with great patience maintaining the market share that they do have. Now, a very unique opportunity might be there for Omore to get a leg up. But first, let’s look at how we got here and what the state of the industry looks like.
In 1995, the ice cream industry in Pakistan was taking an interesting turn. The major players on the market were Hico, which had been operating since the 1950s, Igloo, and Polka. The first two were traditional ice cream manufacturers that sold out of shops and made gelato. At this point in time, ice cream was not really part of the retail business. Shops sold ice cream both in individual servings and in larger ones, but fridges were difficult and expensive to keep in retail stores which is why ice cream was sold separately.
And while Hico and Igloo did sell ice cream in the form of wrapped bars and small packaged cups, the real pioneer of this side of the business was Polka. Polka ice cream was Pakistan’s first national and well-known ice-cream brand. It was set up by Mr. Azhar Ansari who had previously worked for Igloo ice-cream of Chittagong. Mr. Azhar Ansari, along with his brother Zakir Ansari, decided to set up an ice-cream plant in West Pakistan. Using bank loans, they set up a plant each in Lahore and Karachi, where Polka sold and distributed its products throughout the country.
Polka brought a lot of innovations to the industry in Pakistan. They had pop-up stores in Lahore and Karachi, their packaging 3was colourful, and they aired a number of iconic television ads. They also brought a very unique set of flavours, and in particular their Pop Cone modelled after the Cornetto sold in foreign countries became quite popular.
But in 1995 Polka’s quick rise to the top was to stop dead in its tracks. Seeing the evolving nature of ice cream in Pakistan, Unilever decided to enter the market. They were already present in Pakistan in the form of Lipton and other household names, so their introduction of Walls was going to be historic.
There was also a lot of excitement surrounding this. Put the time frame in its context. The cold war was over, Pakistan was undergoing some form of democracy or the other, and an influx of foreign brands were coming into the country as the country was swept up in globalisation fever. The first prominent international chain of any statutes established in Pakistan was Pizza Hut in 1993. In 1997, the American fast food chain KFC set up its first branch in Pakistan and was quickly followed by McDonalds opening its first branch in September 1998. Both fast food giants started operations in Lahore. In the middle of this, the launch of Walls was another item of curiosity. Walls came to Pakistan in 1995 establishing the Wall’s factory on MultanRoad in Lahore. Fully equipped with state of the art machinery.
The ice cream company owned by Unilever has a fascinating story of its own. Born in the United Kingdom in 1786, Walls actually started off as a meat company. The Walls family was in the business of butchery, and had cold storages all over the country which they used to store their meat. But they had noticed very quickly that the demand for meat was lower in the summer month. Because of the blazing sun, meat would go bad very quickly and in the early 1900s refrigerators were not common in homes. People would either buy small quantities to consume immediately or not buy at all. This meant Walls had massive cold storages available to them in the summer months that were underutilised.
In 1914, a young Thomas Walls took over the company at the age of 19 after his father died. Up until this point, the elder Walls had dealt with the issue simply by firing employees during the summer months and bringing them back to work in the winters. The new owner took stock and noticed they wouldn’t have to get rid of their staff if they could figure out a use for their cold storages other than meat. That is where the idea of a line of ice creams was born.
Thomas Walls himself did not get to start the idea. Soon after he took over the company the second world war broke out and the idea was shelved. When Unilever acquired what they thought was a meat company in 1922 after the war, they found plans for the ice cream idea and thought it was a good bet. And that is how Walls ice creams first hit the mar-
As the demand for premium and exotic flavours increased, international brands like Walls and Ben & Jerry’s entered the Pakistani market, bringing a new wave of innovation and variety. These brands introduced unique flavours and packaging, appealing to a younger demographic and setting new trends in the industry
In recent years, the ice cream industry in Pakistan has witnessed unprecedented growth and expansion, fueled by a combination of factors such as aggressive marketing, strategic branding, and product diversification. Brands like Omore have capitalized on the trend towards dairybased ice cream, tapping into the growing consumer preference for natural and traditional ingredients
In the early 1990s, the ice cream market in Pakistan was dominated by local brands offering traditional flavours such as vanilla, chocolate, and strawberry. Brands like Igloo and Hico were among the pioneers in the industry, catering to the growing demand for frozen treats
With changing consumer preferences and a growing focus on quality and authenticity, artisanal and gourmet ice cream brands started gaining popularity in the Pakistani market. Brands like Chaman Ice Cream and Cold Stone Creamery offered bespoke flavours and personalized experiences, attracting a niche segment of customers willing to pay a premium for high-quality products

ket. By the 1950s, Unilever had shut down the meat business and Walls became an exclusive ice cream company.
By the time Walls arrived in Pakistan, it was a company with a gritty back story and the backing of one of the largest conglomerates in the world. Polka was toast. Still they resisted and refused an immediate offer to be acquired. Despite their best efforts, Polka could not beat back the massive marketing campaigns, price wars, and new products that Walls had to offer. In fact, Polka had been the company that introduced Pakistan’s iconic ice cream tricycles that go neighbourhood to neighbourhood selling the frozen desserts. Even though by 2000 Walls ended their own tricycles in most parts of the world, they introduced them in Pakistan when they launched in 1995 to compete with Polka and still run the tricycles to date, although the fleet has been significantly reduced.
Feast was one of the first Products introduced by Wall’s in 1995 and to date remains one of the most popular treats that Wall’s has to offer. By 1998, Polka knew they had been beaten and came back to the negotiating table. The company was acquired by Walls through
a merger, and brands like Jet Sport, Choc Bar, and Pop Cone were acquired by them when they bought Polka.
And for a few years that is how it went by. Other brands such as Hico and Igloo stayed in their lane (even though Walls did hit the market with deep freezers at retailers and tubs of their own ice creams, but the others were able to keep up). Walls was the undisputed King and their ice creams ruled all over the country. Then came the 2009 introduction of Omore.
Engro Foods Limited formally launched its dairy-based premium quality ice cream, starting its sales from Lahore due to the city’s proximity to the plant and would spread its network in a phased manner to become a national player soon. The brand had started with 24 different formats and flavours. Aiming to bring innovation to the ice cream category, Omore introduced the first three flavoured ice-lolly in Pakistan called Lick-a-flavour. For this purpose, Engro Foods was running a stateof-the-art plant located in Sahiwal. The new
ice cream company also went on an aggressive marketing campaign.
And this wasn’t just any old company, it was backed by one of the largest companies in Pakistan. FrieslandCampina Engro Pakistan Limited (FCEPL) is a publicly listed company, incorporated in Pakistan. The Holding Company holds 39.9% shareholding in FCEPL. The principal activity of FCEPL is to manufacture, process and sell dairy products, beverages, ice cream and, from 2009 onwards, frozen desserts.
But Walls remained unbothered. In fact, their leadership at the time expressed the hope that this would end up improving their sales.
You see ice cream falls in a category of what is known as “fun money”, meaning people buy this product with disposable income to have a bit of leisure. The company’s branding needs to be youthful, exciting, and evoking a good time. “It is the biggest blessing for existing ice cream manufacturers!” claimed Khayyam Rajpoot, the Brand Director for Walls in 2009 when Omore was first launched. Customers willing to part with fun money have a wide array of options to choose from. They constantly need to be convinced and

1948
Gourmet Ice Cream: Established as one of the oldest and most recognized ice cream brands in Pakistan, known for its premium quality and wide range of flavours.
1952
Hico is founded and started with a small shop on Mall Road and a focus on daily, dairy-based ice cream set to revolutionise the ice cream market.
1987
Polka Ice Cream launches, offering premium artisanal ice cream made with high-quality ingredients.
1995 Walls is launched in Pakistan
1998
Igloo Ice Cream emerges as a popular choice for budget-friendly yet delicious ice cream options.
2004
Igloo managed to position itself as a budget-friendly option as it entered the market and captured a significant share with its affordable yet delicious ice cream offerings.
2009
Engro Foods launches Omore ice cream
2010
Benazir Kulfa: A speciality brand focusing on traditional Pakistani ice cream flavours, Benazir Kulfa has carved a niche for itself in the industry.
2020
Omore Gelato introduces authentic Italian gelato to Pakistani consumers, catering to a growing demand for artisanal frozen desserts.
reminded to buy ice cream. “So far Walls has been the only brand that spends a significant amount on advertisements on TV, in magazines and other mass media,” explained Khayyam. “When they (Omore) launch nationally, there will be more ads for ice creams and that would translate into more overall demand,” he concludes. Khayyam’s optimism is not completely unfounded. Total sales of branded ice cream stand between 70 and 80 million litres and even according to competitor estimates more than 60 per cent of that volume is bagged by Walls. “Walls is synonymous with ice cream,” Khayyam said, citing that when an ice cream cart or ‘trike’ pulled into a neighbourhood and played the brand’s familiar jingle, everyone knew the ice cream man had arrived.
Omore also had an uphill task. Walls has managed to develop a strong working relationship with retailers since it started operations in 1997. A lot of these retailers had gotten their first deep freezers through Walls, and would have to be convinced to sell other brands as well. Still, Omore had already made big waves among potential consumers with their marketing campaign.
The only problem was that Omore was trying to model themselves on Walls. They had made a big splash and had also launched many products that were there to directly compete with the range Walls had to offer. They made similar TVCs, and the hope was that they could out-market and out-price Walls. But other than the initial excitement about
a new brand, there was nothing that set Omore apart from Walls significantly, which is why consumer patterns returned towards Walls very quickly. That did not mean Omore failed to make a dent, but it worked out for walls because the overall sale of ice cream also increased.
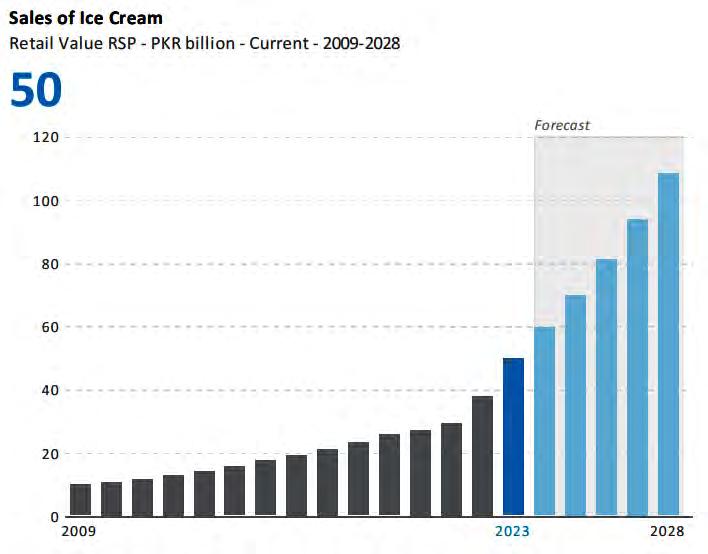
In 2009, the total retail sales of ice cream were under Rs 20 billion. By 2023 they had grown to Rs 50 billion. The growth has been steady mostly, and the real uptick took place over the past couple of years due to inflationary pressures, since we only know the retail sales and not the volume of ice cream being sold overall.
Last year saw an increase in the value of retail sales in the ice cream sector. Retail value sales increase by 31% in current terms in 2023 to Rs 49.6 billion. Take-home ice cream is the best performing category in 2023, with retail value sales increasing by 34% in current terms to Rs 9.3 billion. Retail sales are set to increase to a current value CAGR of 17% (2023 constant value CAGR of 9%) over the forecast period to Rs 108 billion according to a Euromonitor report.
Walls is the undisputed King in the middle of this with over 53% of the total sales, giving Unilever a retail revenue of over Rs 25 billion in 2023 from their ice cream segment. In comparison, Omore
has around 17.4% of the total retail revenue which comes out to around Rs 8.7 billion in the year 2023. In comparison, other companies have much smaller numbers with Hico at 2% recording revenue sales worth around Rs 1 billion.
Other factors have been explained in the graphs:
According to one industry high-up, despite the challenges posed by economic factors, there has been a noticeable increase in the visibility and availability of ice cream products across various channels. This increased presence has contributed to raising awareness and driving sales. Return on investments (ROIs) are being achieved, indicating a positive trend in the industry. On one hand, there is a grow-
ing market with increased consumer interest and spending. On the other hand, the decrease in disposable income poses challenges for sustained growth. The demand for luxury items like ice cream has been impacted. However, this shift has also led to an increase in sales of impulse products, which are more affordable. While volume sales may not be as high, there has been growth in terms of value and overall market performance.
But what about the brands other than Omore and Walls that are part of this industry? Just take a look at Hico.
To find out more about this, Profit spoke to Assistant Brand Manager at HICO
Ice Cream, Uzair Mateen who gave insights on the ice cream industry and particularly how the brand has performed and evolved over the years.
Hico started with a basic vision to provide 100% pure dairy ice cream to consumers eschewing the use of vegetable fats. In the early years, with minimal competition in the market, Hico’s focus on organic growth and quality quickly gained traction among consumers. Slowly but steadily, the brand expanded its reach and solidified its position as a trusted name in the ice cream industry. Uzair stated that the main financial key indicators are revenue, profits, market visibility and market share. Over 70 years, the brand has propelled its annual revenue to an impressive Rs 5 billion in 2023. The profitability was around Rs 11.2 million in terms of sales for the same year. With that being said, Hico has a majority market share for dairy ice cream as compared to Glory, King and Yummys.
Not only that, the shift towards digital marketing and increased visibility has played a crucial role in driving sales and revenue. By deploying freezers in various stores, enhancing brand awareness through digital and conventional mediums, and focusing on consumer engagement, brands like Hico, Omore, and Walls have been able to connect with a wider audience and drive growth. As of 2023, Hico has deployed around 9000 freezers nationwide which stood at 1000 freezers in 2019. “The more visibility you have, the more your retail network grows,” stated Mateen, adding that the value growth was 5% more in 2023 as compared to 2022.
And this is what our story boils down to. Profit is in a tricky situation doing this story. The tricky situation is that the latest date we have available is from 2023. Now, normally this data would be recent enough. Especially since we are only a few months into 2024. The only problem is that a major shift has occurred in consumer preferences since October 2023.
As a result of the horrors in Gaza and the Occupied West Bank, many in Pakistan have chosen to boycott MNCs. Last month Profit did a similar story regarding the sales of carbonated drinks in Pakistan, and we had said initial reports are emerging that there will be a further dip in the amount that these MNCs are able to sell in Pakistan. This may mark a watershed moment. In our story on carbonates, we pointed out how there was no real local competition to Coke Pakistan and Pepsico, but drinks like Cola Next and Sufi Cola were emerging as having broken some of the market
due to the boycott. This is the case in a market where there is no clear local competitor.
In the ice cream market, there is a very clear and strong local contender in the shape of Omore which is 100% a Pakistani conglomerate. The only issue is that Walls is not on the top of people’s boycott lists the same way as Coke and Pepsi are, since it does not evoke the same globalisation rhetoric. Similarly, other Unilever products have not seen a major hit. What we have seen with other products is local companies strongly marketing their localness to appeal to the masses. Omore has not launched any such strategy, but it will be interesting to see how consumer patterns have or haven’t shifted in this sector when the numbers come in next year.
The biggest overall industry problem is inflation at the moment. Consumers in low- and middle-income groups are cutting back on non-essential purchases due to the cost of living crisis in Pakistan. Inflation continues to rise in 2023 putting pressure on household budgets.Some disposable incomes are unable to stretch to ice creams. This is a luxury product,although many consumers are opting to trade down to more affordable options. Manufacturers have had to raise prices of ice cream due to inflation, rising costs related to cold chain storage (including providing refrigeration to stock products),and taxes on imported brands. Larger players such as industry leader Unilever and second-ranked Engro Foods (Pvt) Ltd (Omore) have been better able to address these issues due to their greater financial strength and economies of scale which has helped them to maintain their attractive pricing. Nevertheless, the average unit price of ice cream is set to further rise in 2023, leading to a substantial increase in current value sales.
The landscape is dominated by a few major players, which include, Hico, Walls, Omore, Yummys and Igloo each catering to different regions within the country. Hico has a strong presence in Punjab, Igloo is prominent in Sindh, and Yummys serves a distinct market segment. Despite the dominance of these established brands, the industry has seen new entrants such as Glory and King, signalling a shift in the competitive dynamics. The hot summer season in Pakistan drives significant demand for ice cream, making it one of the most sought-after products during these months. This seasonal demand has encouraged various brands to capitalise on the trend, with newcomers successfully positioning themselves in the market.
The historical evolution and brands
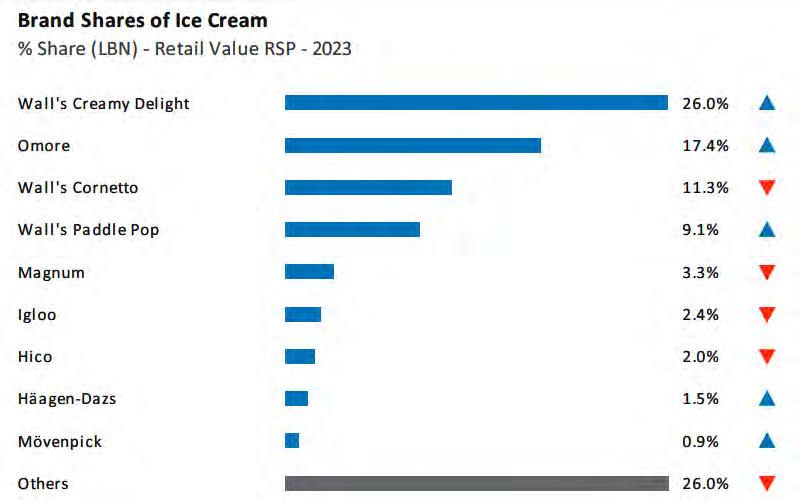
adapting to changing market dynamics and evolving consumer preferences have led to the diversification of product offerings, with brands introducing innovative products to cater to different consumer segments. For instance, Hico has diversified its product range to include impulse products like Swirls, Cone, Chocbar, Creamy Pop, and the premium range, Indulge. This strategic product differentiation targets various consumer groups, including families, kids, and the premium segment.
Although brands have emerged and catered to the growing demand for delicious frozen treats. However, along with the growth and popularity of ice cream, there have been regulatory challenges that brands have had to navigate to ensure compliance and maintain the quality and safety of their products.
One of the key regulatory requirements for ice cream brands in Pakistan is the percentage of fat that must be present in their products. This regulation aims to standardise the quality of ice cream and ensure that consumers are getting a product that meets certain nutritional standards. Additionally, the Food and Fast-Moving Consumer Goods (FMCG) industry in Pakistan is subject to regulations that prohibit the use of hazardous materials in food products, including ice cream. Brands must adhere to strict guidelines to ensure that their products are safe for consumption and do not pose any health risks to consumers.
Maintaining cleanliness in the manufacturing plants is another crucial aspect of regulatory compliance in the ice cream industry. Brands must follow strict hygiene standards to prevent contamination and ensure the safety of their products. This includes regular inspections and adherence to sanitation protocols to uphold the quality and integrity of the
manufacturing process.
Furthermore, the approval of ingredients and flavours used in ice cream is a vital regulatory requirement that brands must meet. Ensuring that only permitted ingredients are used in the production process is essential to guarantee the safety and authenticity of the final product. Compliance with these regulations not only demonstrates a brand’s commitment to quality but also builds trust with consumers who rely on the brand to deliver safe and delicious ice cream products.
In terms of legal challenges, branding and intellectual property rights are significant considerations for ice cream brands in Pakistan. Protecting trademarks and logos is essential for establishing a unique brand identity and preventing infringement by competitors. “Brands must invest in legal resources to secure their intellectual property and defend against any unauthorised use of their branding assets,” Mateen pointed out.
One of the most significant hurdles that companies in the frozen foods sector have had to overcome is transportation. Ensuring that ice cream products are transported at the right temperature to prevent melting and spoiling, managing loading and unloading processes, and maintaining cold storage facilities have posed constant challenges for businesses operating in this industry. It is no secret that the logistics of moving these frozen treats from production facilities to distribution centres and retailers require “precision and efficiency”. Cold storage facilities are vital for preserving the freshness and texture of ice cream products, necessitating investment in advanced refrigeration systems. Timely deliveries to retailers are crucial to prevent stockouts and meet market demand, requiring a reliable and efficient distribution network. n


There are many myths that surround the defense budget.
This is the reality
Pakistan’s defense budget has long been a subject of significant scrutiny and speculation. Amid widespread misconceptions and debates, it is crucial to separate fact from fiction regarding the allocation and impact of defense spending. Contrary to the popular belief that 7080% of the national budget is consumed by military expenditure, the reality is far different.
As we delve into the details, it becomes clear that Pakistan’s defense spending is both modest and strategically managed. For the fiscal year 202324, the defense budget was initially set at 12.47% of the total Rs 14.46 trillion budget. For the fiscal year 2024-25, the defense budget constitutes 11.23% of the total budget. With the overall budget set at Rs 18.877 trillion, the allocation for defense stands at Rs 2,122 billion, with a share of 87.77% earmarked for non-military expenditures.
To put this in perspective, India’s defense budget for the same period is an overwhelming $75 billion, which is almost 10 times higher than Pakistan’s defense budget of $7.59 billion.
Due to the perception of an ever-increasing defense budget, data from the Stockholm International Peace Research Institute (SIPRI) shows a steady decline in Pakistan’s defense spending since the 1990s. For fiscal year 202425, defense allocation is just 1.7% of GDP, reflecting a disciplined approach to military expenditure. This is set against a backdrop of global military spending reaching $2,443 billion in 2023, marking a 6.8% increase from 2022, the steepest rise since 2009. Leading this surge are the United States, China, and Russia, with India being the fourth largest military spender globally at $83.6 billion.
According to the Pakistan Economic Survey 2023-24, defense spending as a percentage of GDP has decreased since 2020. It shows that defense spend-
The writer is a scholar of international affairs
ing was 2.6 percent of GDP in 2020, but decreased to 2.4 percent in 2021, 2.1 percent in 2022, 1.7 percent in 2023, and has been kept consistent at 1.7 percent in 2024. For 2025, defense spending has been retained at 1.7 percent of GDP, indicating no change in the share allocated to the military.
It is important to mention here that the defense budget is not exclusively spent on the Pakistan Army. It is distributed among the three branches of the armed forces. For the fiscal year 2024-25, the budget distribution is as follows: 47.50% for the Pakistan Army, 21.30% for the Pakistan Air Force, 10.80% for the Pakistan Navy, and 20.30% for inter-services organizations. Notably, this allocation has remained fairly consistent since 2019.
Furthermore, the total defense budget for 2024-25 stands at PKR 2,122 billion, with allocations as follows: PKR 815 billion for employee-related expenses, PKR 513 billion for operating expenses, PKR 548 billion for procurement of arms and ammunition (both domestic and imports), and PKR 245 billion for civil works.
Furthermore, Pakistan’s per-soldier expenditure averages USD 13,400. In comparison, India’s per-soldier expenditure is USD 42,000, Saudi Arabia’s is USD 371,000, Iran’s is USD 23,000, and the United States is USD 392,000. It is important to consider that these countries have significantly larger economies than Pakistan.
It is pertinent to mention here that Pakistan’s rival, India, spent $75 billion on its defense. Likewise, Saudi Arabia spends $55 billion, China $293 billion, and Iran $24 billion. In comparison, Pakistan spends only $7.59 billion. Additionally, Pakistan’s defense expenditure is 22 percent less than the global average. Over the last six years, Pakistan’s defense budget has decreased from $10.2 billion to $6.3 billion in dollar terms, while India’s has increased by 35 percent over the same period.
Despite the decline in the defense budget, the combat capability of Pakistan’s military has not been affected. According to the Global Firepower Index, Pakistan’s military ranks among the top 10 of the world’s most powerful armies, even though it ranks 23rd in defense expenditure. The substantial reduction in Pakistan’s defense budget is alarming but despite this, Pakistan’s armed forces are demonstrating their full potential with limited resources. All propaganda and speculations about a huge defense budget are baseless. The Pakistan Army is tackling all internal and external threats. Undoubtedly, our armed forces are providing the best and most professional defense services to the country at nominal expenses.
The defense budget of Pakistan is a complex subject with numerous myths and realities. While the budget allocation may seem substantial, it is balanced across various branches and necessities, ensuring the military’s effectiveness without overwhelming the national budget. It is well known that the country’s defense budget is dependent on the country’s geo-strategic environment. Pakistan’s current security environment faces challenges on the western and eastern fronts, as well as domestic terrorism. Given the security environment, the defense budget allocated for 2024-25 appears to be appropriate and consistent.
The Pakistan Armed Forces exemplify the optimum utilization of taxpayers’ money, consistently delivering exceptional results within the confines of allocated resources. Despite operating within relatively modest budgets, they have demonstrated remarkable efficiency and effectiveness in fulfilling their defense and security responsibilities. This prudent management of funds ensures that every rupee is maximized, showcasing their commitment to excellence and national security. The armed forces’ ability to achieve substantial outcomes with limited financial resources stands as a testament to their strategic planning, resourcefulness, and unwavering dedication to serving the nation.
The dollar value of the military budget in the last four years has not only reduced, but has reduced significantlyBy Shahnawaz Ali
One of the cornerstones of traditional “anti-establishment” politics has been Pakistan’s defence budget. The most significant matter that is brought up normally is the allocation for the military is far too high at the expense of other sectors of the economy.
For this story, we will set aside the debate regarding how much should be allocated for military spending in a country like Pakistan. Instead, let’s look at a different factor: The yearly increase in the military budget. This year, in the federal budget proposal, the amount of money proposed under defence expenditure has been raised by 15% marking a Rs 280 billion increase in the budget. The defence services head of the expenditure has been allocated a total of Rs 2.128 trillion for the upcoming fiscal year. This means that the defence services alone now account for 12% of Pakistan’s federal expenditure. This expenditure, as a percentage of Pakistan’s GDP now stands at almost 2% of the GDP.
But the increase is not quite what it may seem. Despite the increase, the military has not been immune to inflationary pressures. The
question is what has been the real value of the military budget over the last four financial years? Has it gone up as much as we think it has? How much inflation has hit the military in real terms? And what does the rising trend in the military budget signify?
To make a righteous comparison one first needs to understand what the military budget is, its different components, and how it is divided.
The infamous defence budget called the “Defence Affairs and Services” is the main head under which defence expenditure is put. In this there are two sections, Defence Administration and Defence Services. Defence Administration, as the name suggests is only a small part of the job and hence only sets the exchequer back by Rs 6.78 billion. Meanwhile Defence Services is the main job, and Rs 2.212 trillion have been allocated for this purpose alone.
According to the documents revealed by the finance division, the only detail of this expense is given in four different types of expenditures. Employees related expenses
which account for a major chunk of the military budget at Rs 815 billion. This mainly includes the salaries of defence personnel including the army, airforce and navy.
Other heads under the defence budget are operating expenses, physical assets and civil works. The amount of money allocated for each of these in the FY25 is 513 billion, 512 billion, and 244 billion respectively.
What most readers would be surprised to find out is that in the true sense of the word, the defence expenditure is not just the defence affairs and services, but includes other expenses accounted for in other parts of the budget. Apart from the approved defence budget head, an additional Rs 662 billion, almost 65% of Pakistan’s entire pension bill is also allocated for military pensions, as per the budget documents. Moreover, the ministry of defence budget contains a separate head for cantonment boards developments while a separate head for educational institutions inside the cantonment boards is allocated under its respective ministry.
Additionally for the past two years, a trend of revising the military budget upwards has been seen after the budget figure was approved, we will take the proposed figure as the budget for the entire year. In FY24, the defence budget was
estimated to be 1.81 trillion in the proposed budget but was later revised to Rs 1.84 trillion, a 1.6 % increase. Similarly in FY23 Rs 1.57 trillion was allocated for defence affairs and services, however the federal government ended up spending in excess of 1.59 trillion under this head.
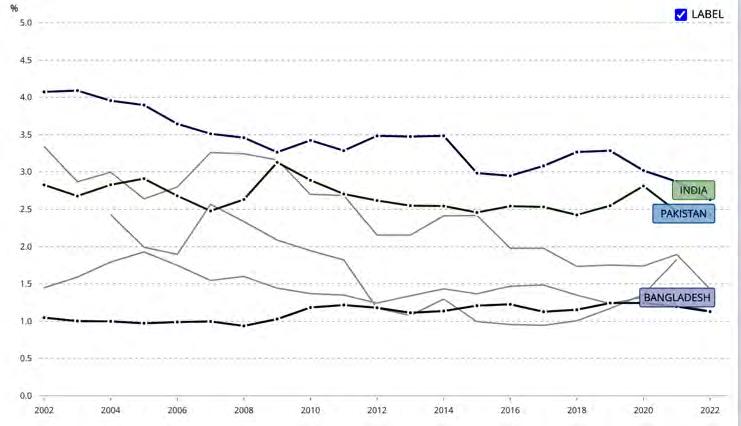
There is one other thing that the reader needs to know, if they are to understand their country’s military budget. And that is that the military budget is not always truly representative of how exposed a country is due to its defence spending. A country could be spending more than $100 billion on its military but have significantly less exposure due to various reasons. One of those reasons is the military expenditure as a percentage of GDP. While the defence expenditure as a percentage of GDP has come down in the last few years, Pakistan is still ahead of its neighbours and peers when it comes to defence.
According to the Pakistan Economic Survey 2023-24, defence spending as a percentage of GDP has decreased since 2020. It shows that defence spending was 2.6 percent of GDP in 2020, but decreased to 2.4 percent in 2021, 2.1 percent in 2022, 1.7 percent in 2023, and has been kept consistent at 1.7 percent in 2024. For 2025, defence spending has been retained at 1.7 percent of GDP, indicating no change in the share allocated to the military.
However, according to the World Bank, these numbers are a bit different. Since the WB follows a dollar based approach, Pakistan’s GDP military expenditure as a percentage of GDP was recorded at 2.6% in 2022. The number is neither small, in real terms nor small compared to our peers. As of FY22, in the south asian subcontinent, Pakistan spends the most percentage of its GDP on defence.
For the remaining two years of the world bank data, the dollar value has appreciated by a great extent and the GDP has not grown enough. This means that the figures of the next two years do not look up as positively as the Pakistan Economic Survey suggests. Pakistan is also the top
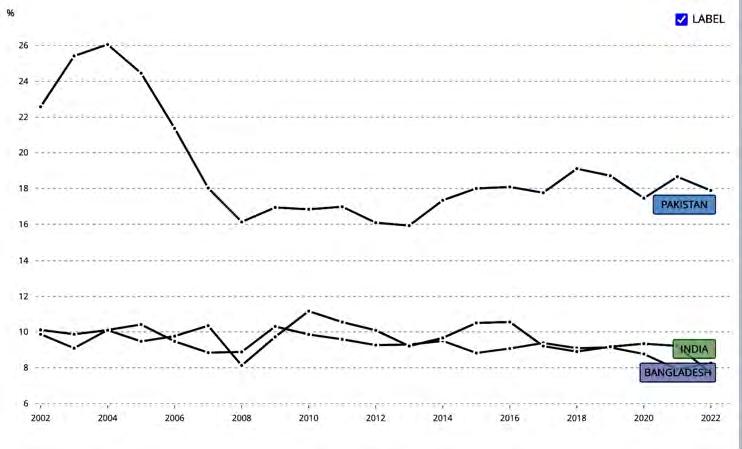
country in this neighbourhood to spend on defence as a percentage of total government spending. For the past 20 years Pakistan has managed to stay upwards of 15%, the highest in the region. It is also important to note that a large chunk of Pakistan’s budget is non-combat budget. What is a non-combat budget? Within the defence budget there is generally a distinction between combat and non-combat budget. For example, global military expenditure in the preceding year was the highest ever recorded in the history of the world in one single year. However, that is mainly accounted for in the combat budget.
As the name suggests, non-combat budget refers to expenses that are recurring. Expenses related to support and administration of the armed forces. It is also important to note that the part of this budget allocated towards combat is also not small. Since a lot of the military equipment and training is considered as a part of the combat expense.
The combat budget is primarily focused on enhancing operational readiness and defence capabilities. Meanwhile the non-combat budget addresses the broader administrative, logistical, and welfare needs of the military personnel.
When we talk about the expenditure in dollar terms, it is unfair to gauge the increase in the military budget in rupee terms. Even though the rupee value of the budget has increased, the military not only imports the latest combat technology but the military personnel who are being paid in rupee terms are also as susceptible to the inflation as a common man is. This means that the reliance of this budget on the dollar value is as strong as the country’s reliance on the dollar.
Surprisingly, the dollar value of the military budget in the last four years has not only reduced, but has reduced significantly. Over the last six years, Pakistan’s defence budget has decreased from $10.2 billion to $6.3 billion in dollar terms. While rivalling countries with bigger economies spend tenfold, Pakistan struggles to keep up with its current expenditure level in dollar terms each year. This would automatically lead to an increase, sometimes an even larger one in rupee terms. This is in fact one of the reasons why the military feels the need to expand its budget every year, during the middle of the year.
While the allocation, budgeting and tax collection in this budget places a huge question mark on the very viability of this budget, a case for increasing the military budget can be made quite easily.
The case against, on the other hand, is an ideological one. With close to 40% of the population under the poverty line and exorbitant taxation both direct and indirect, making life difficult for the common man, how much consolidation of the military budget should the government warrant? Unfortunately, as mentioned earlier, the case is a difficult one to make, in more ways than one. n

It would seem that the long battle with inflation is finally coming to an endBy Mariam Umar
It seems that the long battle with inflation is finally coming to an end as the Monetary Policy Committee (MPC) of the State Bank of Pakistan (SBP) kicked off its monetary easing cycle and reduced the policy rate by 150 basis points on June 10, 2024, from 22% to 20.5%.
The analysts anticipated a rate cut of 100 basis points while the secondary market had already incorporated the expectation of rate cuts since October 2023. As per Topline Securities, the benchmark lending rate 6M KIBOR was trading at 20.68% as of June 10, which was 132 basis points lower than the policy rate of 22%. At the same time, as per JS Global, the spread between the policy rate and the 3-month tenor yield had widened to nearly -193 basis points, trading at 20.7%. “Historically, the 3-month yield typically trades at a premium of around 50 basis points to the policy rate,” reads JS Global report.
The MPC noted that while the significant decline in inflation since February was broadly in line with expectations, the May outturn was better than anticipated earlier. The Committee assessed that underlying inflationary pressures are also subsiding amidst a tight monetary policy stance, supported by
fiscal consolidation. This is reflected by continued moderation in core inflation and ease in inflation expectations of both consumers and businesses in the latest surveys. Headline inflation in May clocked in at 11.8% from 17.3% in April. The core inflation clocked in at 14.2% in May as compared to 15.6% in April. Disinflationary trends, however, were driven by the high base effect and the recent decline in food and fuel prices.
This positive shift in real interest rates, now around 10%, gave the SBP the room to reduce the policy rate.
Despite the optimistic outlook, the MPC acknowledged potential upside risks to the near-term inflation outlook due to upcoming budgetary measures and uncertainty regarding future energy price adjustments. Nevertheless, the committee believes that the cumulative impact of earlier monetary tightening will keep inflationary pressures in check. It is also noteworthy that this is the first rate cut in four years, since June 26, 2020.
The policy rate was hiked to an all-time high of 22% at the end of June 2023 as the International Monetary Fund (IMF) mandated the central bank to maintain an appropriately tight monetary policy to bring down inflation. It is also worth noting that this is the first rate cut in four years since June 26, 2020.
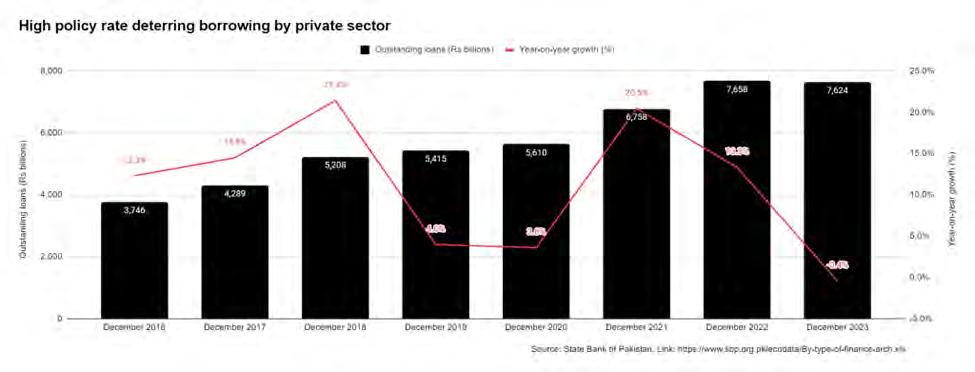
While tight monetary policy has helped anchor inflation expectations, it has also severely impacted the overall business environment. As per a report by Dawn, the interest rate needs to come down to 15% to enable Pakistani exporters to compete in the export market. Similar sentiments have been echoed by bankers and industry experts to Profit stating that projects above 15% are not viable. “These kinds of interest rates for long-term funding are a major impediment. Project financing at 2526% interest rate is not viable.”
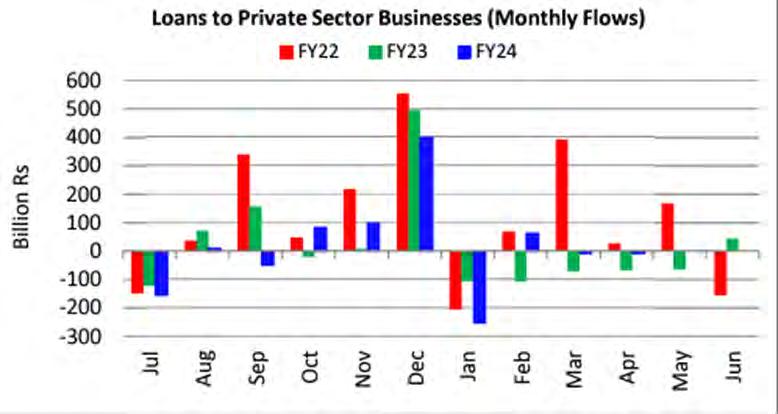
As a consequence of the high policy rate, credit to the private sector dwindled down. Banks channelled available liquidity towards government securities instead of lending to the risky private sector to avoid asset quality deterioration. Consequently, lending to the private sector fell by 0.4% year-on-year for the first In almost over a decade in 2023. Historically, there has usually been a double-digit growth in advances to the private sector. Moreover, lending to the private sector has remained muted in the fiscal year 2024.
The current rate cut gives some leeway to the private sector. Some of the highly leveraged
sector has a debt to equity ratio of 0.53 times due to capital intensive nature of business and owing to frequent expansions. “Amongst the companies, we believe, companies like Mughal Steels (MUGHAL), Agha Steels (AGHA), and Amreli Steels (ASTL) will get benefit in the range of 5-22%”, read Topline Securities report. “Theoretically, amongst the companies, we believe, DG Khan (DGKC), Pioneer Cement (PIOC), Bestway Cement (BWCL), and Fauji Cement (FCCL) to have a positive impact of 3-5% per annum”, read the report.
Source: SBP
sectors include textile, steel, cement and pharmaceutical. Rate cut will have a positive impact on their financial performance as finance costs will decline.
The textile sector has a debt-to-equity ratio of 0.89 times, making it one of the top beneficiaries. Besides, as per Topline Securities, the textile sector’s fixed rate/subsidised loans
were also repriced to market rates in December 2022. Companies like Gul Ahmed Textile Mills, Nishat Chunian, Nishat Mills, and Interloop will benefit from the rate cut and their earning per share might improve by 3-6% in fiscal year 2025.
Similarly, the steel sector is trading at a debt-to-equity ratio of 0.70 times, while cement
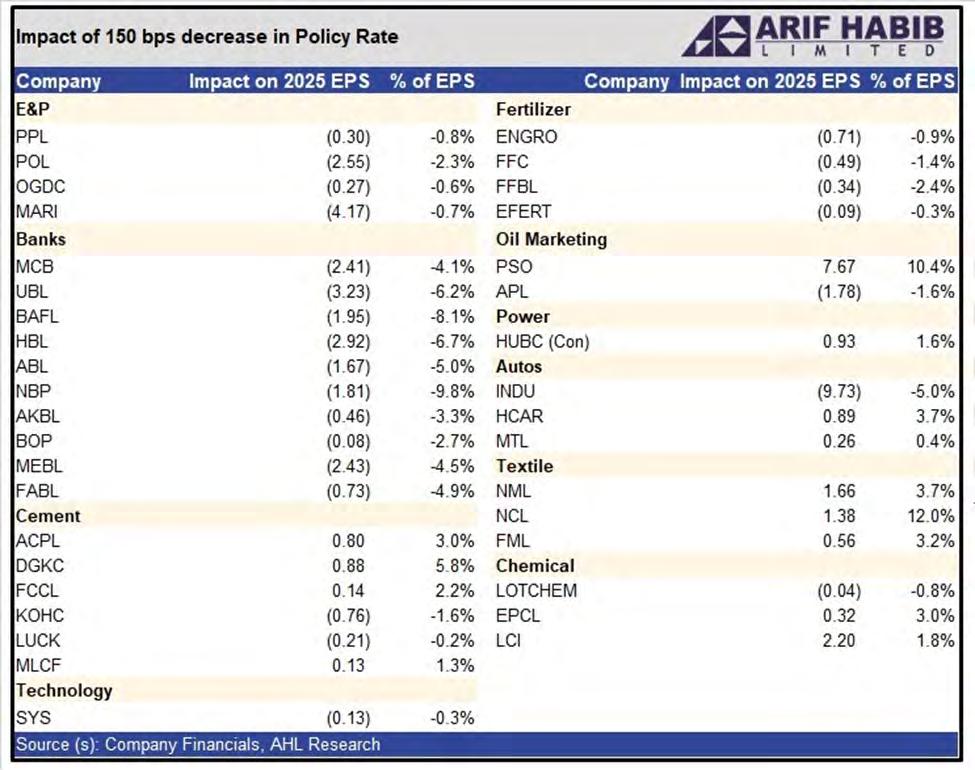
However, just two days after the central bank kicked off monetary easing, the federal government presented the budget for the fiscal year 2024-2025. The government has set a challenging tax revenue target of Rs13 trillion, a jump of around 40% from the current year. In a bid to appease the IMF to strengthen the case for a new bailout deal, the government has found ways to increase revenues to reduce fiscal deficit. The government has raised taxes that will help raise additional revenues of Rs3.8 trillion in line with the IMF demands.
The government has increased taxes on salaried, non-salaried class, real estate, retailers, vehicles, removed general sales tax (GST) exemptions and slapped taxes on milk and milk products, mobile phones, and tier-1 retailers of branded stores at 18%. Moreover, the government has also made changes in tax regime for exporters from full and final tax of 1% to normal tax (29% along with applicable super tax). Textile sector accounts for major exports. “This shift is expected to significantly affect the profitability of the sector by 20-35%. Company wise, we believe (Interloop Limited) will get the highest hit of 30-35% on profits, followed by Nishat Mills and Gul Ahmed 15%-18%”, states a Topline securities budget analysis report.
All of these measures, while would help with fiscal consolidation, might also lead to increase in demand destruction. Essentially, the room that monetary easing created for the private sector businesses, is squeezed out as reduced demand would result in lesser consumer spending, and hence lower sales for the businesses.
Concluding up, fiscal year 2025 presents a mixed outlook for Pakistan’s private sector. While the monetary easing offers some relief, but the government’s new budget measures could counteract these benefits by increasing taxes and potentially reducing consumer demand. As the private sector navigates these changes, the balance between monetary easing and fiscal consolidation will be crucial in determining the overall economic impact. n

Textile mills in Pakistan are exporting their used machinery in the midst of an industry crisis.
How did they get here?By Shahab Omer
It has come to this. In the midst of a growing crisis for the country’s once thriving textile industry, Pakistani mills are exporting their used machinery to countries such as Afghanistan,
Indonesia, and others in the South American continent.
The textile industry has come to a point where millers are selling their machines to other countries because their manufacturing capacity is very high and the demand for their product is in the dumps.
There seems to be some disagreement within the industry regarding where these machines are being exported to. Reliable market reports have indicated that a large chunk is being sent to Afghanistan, which has initiated operations with 30,000-40,000 spindles based on the used spindles exported from Pakistan.
However, other players have claimed the share sent to Afghanistan is not the most significant.
Iftikhar Mohiuddin of Hussnain International, a company dealing in the global trade of textile machinery, contests the notion that a significant portion of used machines is being exported to Afghanistan.
What it does boil down to, and what Mr Mohiuddin acknowledges, is that used textile machines are being exported to Afghanistan. Not only this but Pakistan’s used textile machinery is also being exported in significant numbers to South and North America and Indonesia.
“For instance, if we talk about the Saif Group from Khyber Pakhtunkhwa, which is a major textile group, they are not exporting their used machines to Afghanistan. Instead, their sold machines are coming to Faisalabad, where some local textile mills are using them. Although, geographically, Afghanistan is closer to Saif Group than Faisalabad,” he said.
Iftikhar also attributes the rapid shutdown of Pakistan’s spinning mills to high electricity costs, unresolved issues among textile company owners, flawed government policies, and the lack of incentives. He informed Profit that most textile industry machines in Pakistan are being scrapped, with about seventy percent of used machines ending up as scrap.
This is because over the past two decades Pakistan’s textile sector has seen a shocking downfall.
There was once a time when textile was the undisputed King of Industries in the country. The country had a steady domestic supply of high grade cotton and plenty of clients not just in the Gulf but also in Europe and the United States that relied on Pakistan’s ability to produce clothes fast and export them. It is no wonder then that textiles are still the largest export oriented sector in the country. In fact, 2005 marked a milestone year for Pakistan with GMO cotton seeds being introduced in the country, and the highest ever recorded cotton production of over 1.4 crore bales.
But in the nearly twenty years since, something has gone wrong. Here is a sobering fact. Two decades ago, Pakistan’s cotton was in demand globally. However over those 20 years, countries such as Bangladesh, Vietnam and Cambodia have all surpassed Pakistan. In 2003, when Pakistan’s textile exports were $8.3 billion, Vietnam’s textile exports were $3.87 billion, Bangladesh’s were at $5.5 billion. Now Vietnam is at $36.68 billion and Bangladesh is at $40.96 billion, while Pakistan is struggling to hit $25.3 billion in 2022.
The reasons for this are manifold. Per-
haps most significant in contributing to this was the energy crisis of 2008. Between 2007-8 Pakistan was hit by the global recession. The textile industry faced challenges due to high energy costs, rupee depreciation vis-à-vis the US $ and other currencies, and a high cost of doing business. As a result, there was a reduction in the number of textile mills operating in the country from about 450 units in 2009 to 400 units in 2019.
It was in this vacuum that countries like Bangladesh and Cambodia made their own space. That is until now. In the past few years, there were many hopes that Pakistan would come out of this crisis.
Chief among this was what happened during the COVID-19 pandemic, Pakistan implemented a ‘smart lockdown’ which allowed its textile operations to continue, unlike in countries like Bangladesh. This strategy led to a boost in Pakistan’s GDP in 2021. As per the figures and details obtained from All Pakistan Textile Mills Association (APTMA) the textile and apparel exports from Pakistan have seen significant shifts recently. Between FY20 and FY22, exports increased from $12.5 billion to $19.3 billion, supported by a $5 billion investment in upgrading and expanding manufacturing facilities. This investment aimed to add another $5 billion in annual exports and create 300,000 to 500,000 new jobs.
There was also a notable shift towards high value-added goods, moving away from traditional exports like yarn and grey cloth. The value addition has increased, with every unit of cotton input now being converted to 3.9 units of value-added exports, compared to 2.5 units a few years ago.
But it seems the brief resurgence was just an anomaly of the pandemic. In the year 2023, despite textile manufacturers making big bucks, textile exports in terms of volume actually dipped by 15% to $16.5 billion, influenced by the withdrawal of the RCET amid a broader macroeconomic crisis. High energy costs, constituting 12-18% of total input costs, are a significant burden. An increase in power tariffs from 9 cents/kWh to 14 cents/kWh drastically reduced profitability, impacting major textile exporters. Despite these efforts, the textile exports in FY 2023 fell by 15% to $16.51 billion, failing to reach the $24 billion target. A major issue is the sector’s focus on exporting raw materials rather than developing own brands and customer-focused strategies, essential for gaining a global market share. High power tariffs are a critical issue, with any increase beyond 12.5 cents/kWh causing a significant impact on the export sector. This leads to shutting down of existing units, halting investment in expansion, and a decline in production and exports.
The problems have essentially remained
the same. Key issues include demotivated employees, inadequate pay structures, and reliance on outdated production methods. These are exacerbated by a lack of innovation, insufficient training, and a need for modern manufacturing techniques to compete internationally.
“Even this scrap is not sold cheaply due to the quality of iron used in machines from the eighties and nineties, making them valuable despite their age. There is a difference in the quality of iron used in machines from that era and today’s machines, and also in their rates. For example, if a textile miller bought a machine for Rs 5 lakhs in the nineties, it is now being sold for Rs 12 lakh as scrap. This was just an example to explain. Now, you can imagine that the textile industry not only had full production from this machine over the past thirty years but is also selling it today at high prices. However, there has indeed been a difference in the value of money then and now,” he added.
Another expert in the textile sector, associated with a federal government institution and wishing to remain anonymous, agrees that textile mills are rapidly shutting down. This expert stated that whether the machinery is new or old, it is being exported to countries such as the USA, Oman, Afghanistan, Indonesia, and several others as scrap due to the high production costs making it difficult for mills to operate.
“No matter how valuable their machinery is, it is useless to them at this point, and they are selling it for very low prices,” he said.
Various circles within the All Pakistan Textile Mills Association (APTMA) believe that the current government is not friendly towards the textile sector. Despite daily meetings between textile mill owners and the government, no results have emerged. They acknowledge that the period from 2018 to 2022 was a golden era for Pakistan’s textile sector due to the regional competitive tariff, despite some objections during that period.
According to these circles, the current government views the textile sector through a political lens, assuming that a significant part of Pakistan’s textile sector still supports the Pakistan Peoples Party and that most textile industries in Khyber Pakhtunkhwa support Pakistan Tehreek-e-Insaf. This assumption has led to dissatisfaction within the textile sector regarding the current budget, with fears that many of Pakistan’s textile mills will shut down in the next one or two years if the situation remains unchanged. n