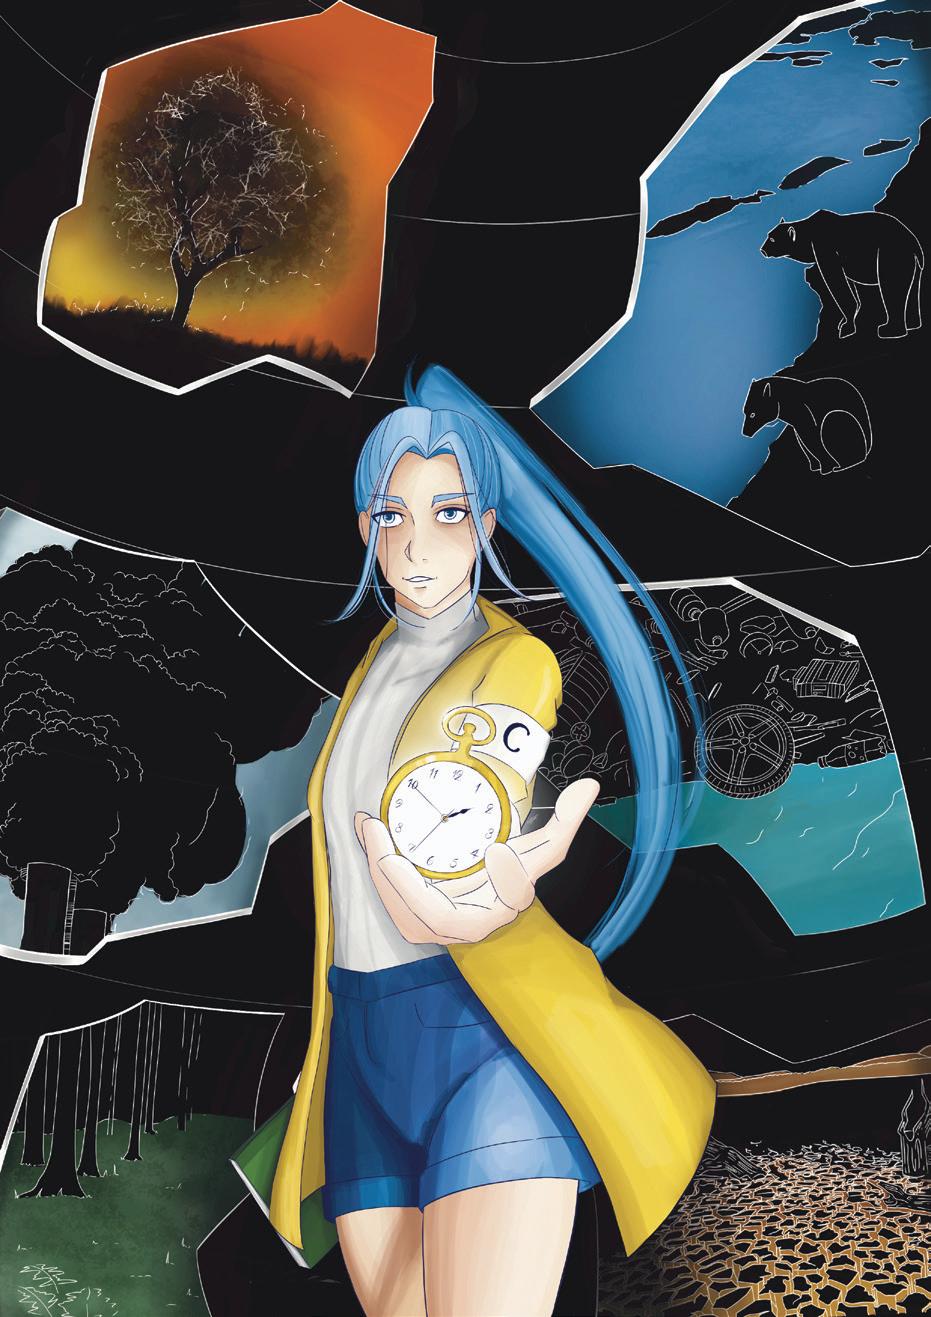
Picture the past. Change the future. The Past Global Changes (PAGES) project is pleased to announce a new paleoscience magazine for teenagers and young adults.
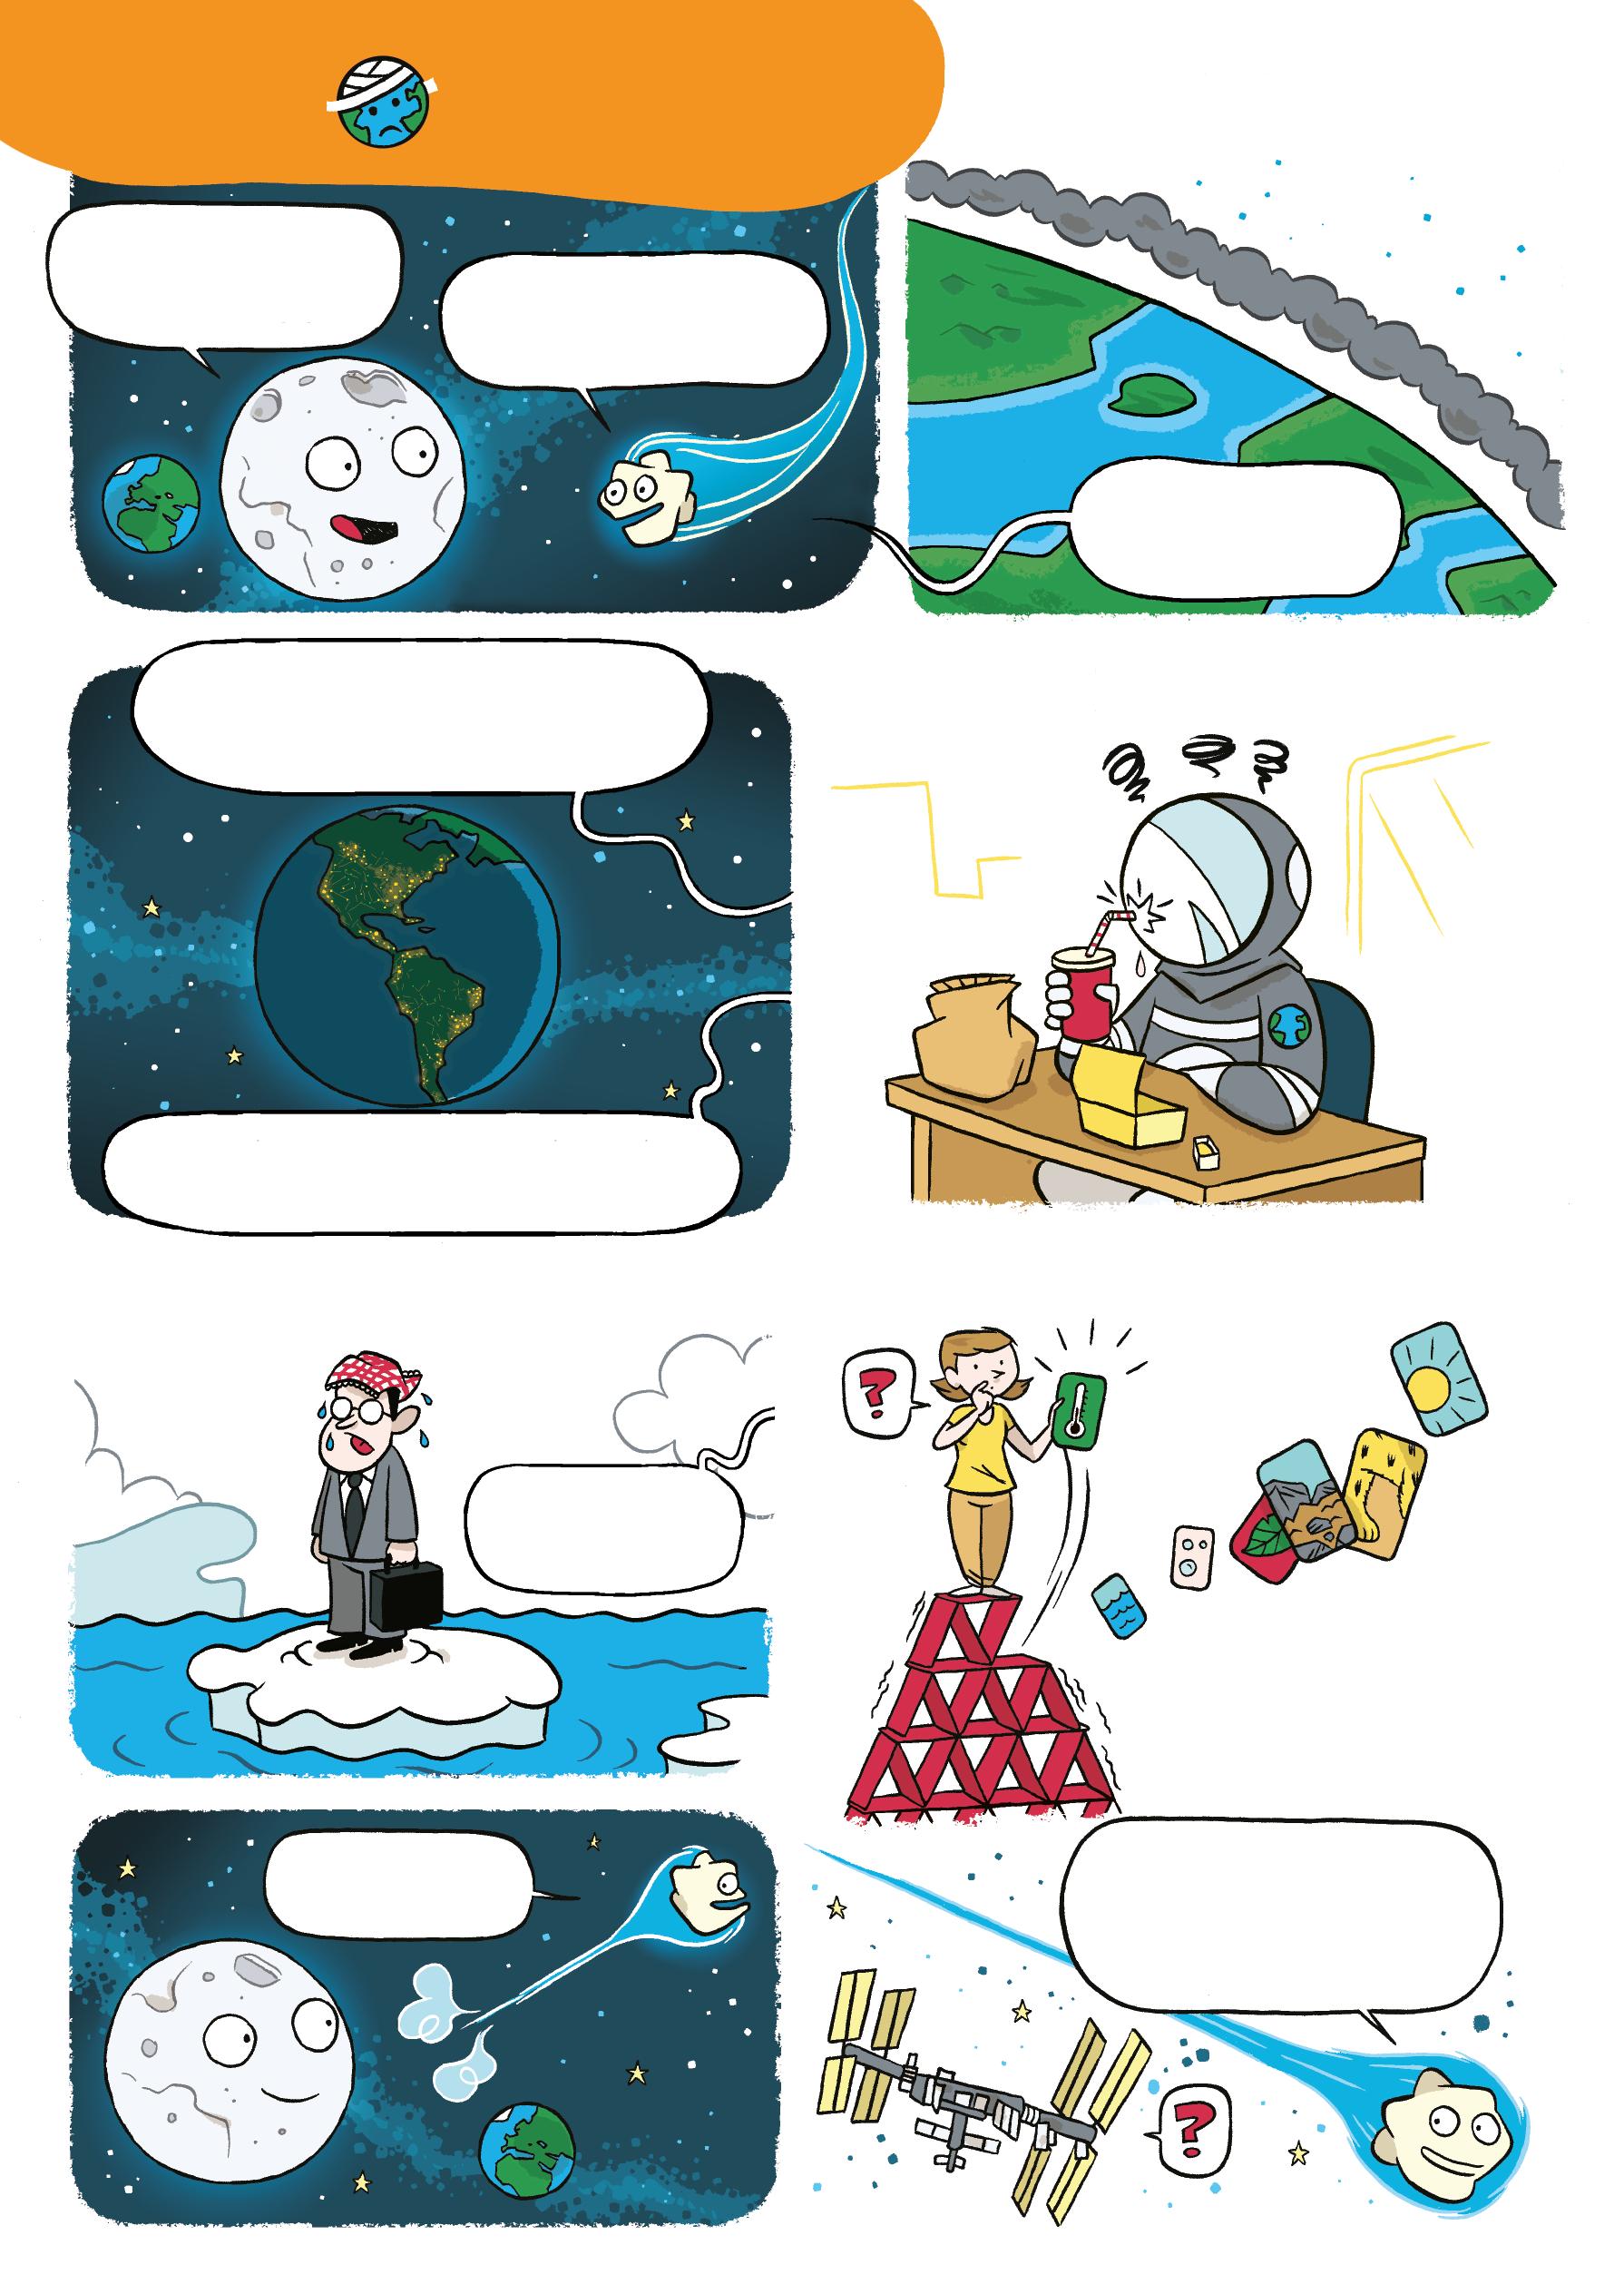
Past Global Changes Horizons highlights science of the past, written in an easy to understand, visual format, for those interested in, and wanting to learn more about, environmental issues and global climate change. The objective is to make readers aware that looking to the past, through the science of the past, can help us better understand the current environmental crisis, and what can be done to help Earth’s future.
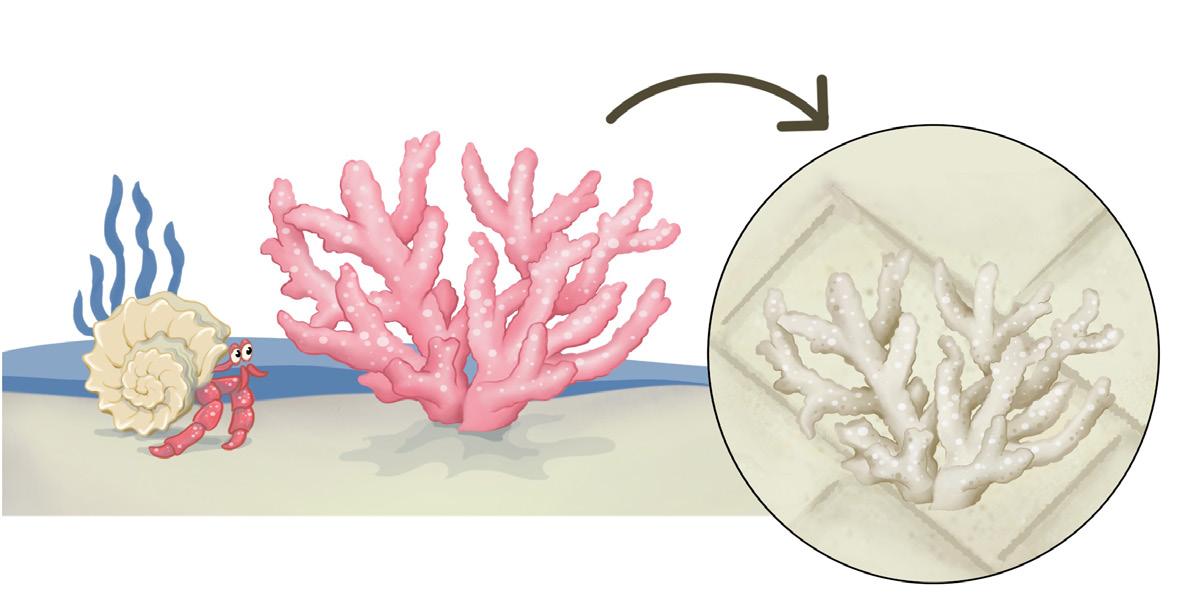
Each of the 18 contributions in this first issue addresses a scientific question and includes appealing and understandable figures or images, without sacrificing scientific rigor. Tips and suggestions for further research and discussion topics are also included, meaning Horizons is not only designed for students but also potentially for teachers.
Find out more: http://pastglobalchanges.org/products/13180