
POLITECNICO DI MILANO
School of Architecture Urban Planning Construction Engineering
Laurea Magistrale(equivalent to Master of Science) Architecture-Building Architecture
Academic Year 2021 / 2022
RESEARCH CENTER IN MILANO INNOVATION DISTRICT
A gate to the future
Authors:
Ardit Dobroshi 964039 Tomas Kedhi 965761 Yüksel Özle Oğuz 963463
Supervisor: Prof. Francesca Battisti
Co-Supervisors: Prof.Grigor Angjeliu Prof.Massimilano Nastri Prof.Giovanni Dotelli Prof.Francesco Romano
2
3
table of contents


INTRODUCTION 1.1 MIND : Milano Innovation District 1.2 Arexpo 1.3 Main Anchors 1.4 Accesibility 1.5 West Gate 2. URBAN STRATEGY 2.1 Urban Cut 2.2 Urban Morphology 2.3 MIND Site Analysis 2.4 East Gate Analysis 2.5 Master Plan 2.5.1 References 3. BUILDING DESIGN 3.1 Design Process 3.1.1 Morphology 3.1.2 Circulation 3.1.3 Functional Distribution 3.2 Case Study : Typological Series 3.3 Ground Floor as a “Common Ground” 3.4 Exhibition and Working Spaces 3.5 Laboratory Design 3.5.1 Case Study: Philosophy of Lab Design 8 12 10 14 16 18 20 22 24 25 29 32 33 38 40 41 42 45 46 50 52 60 68 70
0. ABSTRACT 1.

3.5.2 Types of Laboratories
3.5.2.1- Type 1: Experimental Laboratory
STRUCTURAL
Structural
SERVICES
5.1 Concept 5.2 Winter heat load analysis 5.3
load
5.4
76 80 82 85 92 99 100 107 113 110 115 116 118 120 122 124 132 134 136 140 144 148 151 147 154
3.5.2.2- Type 2.1: Research Laboratory 3.5.2.3- Type 2.2: Research Laboratory 3.6 Building Envelope 3.6.1 Cantilever Facade 3.7 Roof Design 3.8 Manifesto 4.
DESIGN 4.1
Concept 4.2 Cross Laminated Structural Design 4.2.1 Secondary Beam Design 4.2.2 Primary Beam Design 4.2.3 Typical Floor Load Calculation 4.2.4 Column Design 4.2.5 Structural drawings 4.3 Cantilever Design 4.3.1 Secondary Beam Design 4.3.2 Truss Design 4.3.5 Structural drawings 5.
DESIGN
Summer heat
analysis
Producers
5.5 HVAC system 5.6 Gravity drainage system 5.7 Service drawings 6. SUSTAINABLE DESIGN 6.1 Sustainability 6.2 Climate Analysis 6.3 Solar Analysis 6.4 Lighting Analysis 6.4 Materials 7. CONCLUSION 8. BIBLIOGRAPHY 9. CITATIONS 10. SITOGRAPHY 11. LIST OF FIGURES 172 165 157 178 180 181 185 186 189 196 198 204 208 210
ABSTRACT
The Milano Innovation District dates to the time the city of Milan got elected to host Expo 2015. The end of the Expo was followed by a series of designs to transform the site into a center of knowledge and enterprise; to establish an ecosystem for social and economic development.
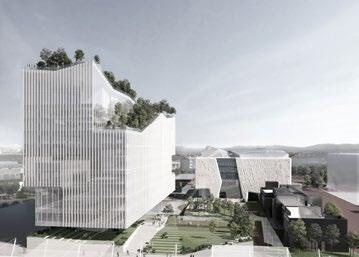
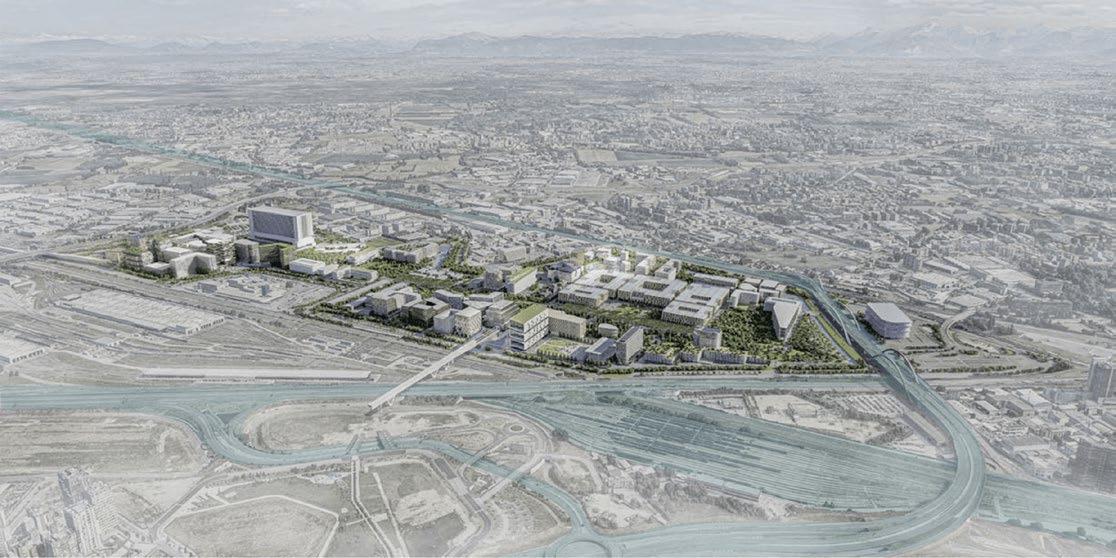
The backbone of the district is the decumano; a long artery that functions as an urban connector. It starts at the western gate and ends at the eastern one, where our intervention is centered. After a thorough understanding of the site, we aimed our design towards establishing a proper ending of the masterplan. Our starting point was the transformation of the area surrounding the new university campus into a park dedicated to sports and technology. Subsequent to this, we enclosed the east gate through the creation of a new building mass. The strategic location close to the new university and to the existing human technopole gave perfect ground for the development of a center dedicated to the research of natural science.
MIND is founded on several principles that serve as pillars for the architecture of the site. We have implemented such principles also in the design of the research center. First and foremost, the ‘common ground’ was one of the key elements on which we based our design. The ground floor is conceptualized as a translucent and flexible space, fully accessible by the public.
In contrast, the laboratories in the above levels feature a more enclosed design. A consistent repeated layout is distributed through the upper floors, consisting of incubated rooms, wet experimentation rooms, dry areas, individual working spaces, as well as open co-working areas.
Another design principle that is persistent throughout the MIND district is the accessible green roof. The creation of terraces can offer a remarkable experience of the site. In this design, the roof was an integral element that defined the morphology of the building. Since the starting point of our intervention was the park, we aimed to use the roof of the research center as a continuation of the masterplan. Along with the cross-laminated structure, the green roof is also aimed at lowering the carbon footprint of the building and thus increasing its sustainability.
In conclusion, our intervention aims at creating a unique space that brings together different disciplines of life. A work environment where new innovative ideas are generated and shared. The integration of such architecture into a new landscape gives birth to a new and more refined urban fabric.
Key words: flexibility, sustainability, green sloped roof, urban conclusion, common ground,
8
ESTRATTO
Il Milano Innovation District risale all’epoca in cui la città di Milano fu eletta ad ospitare l’Expo 2015.
La fine dell’Expo internazionale ha visto un susseguirsi di proposte progettuali col fine di trasformare il sito in un centro di conoscenza e impresa, creando così un ecosistema per lo sviluppo sociale ed economico
Il quartiere ha come spina dorsale il Decumano, una lunga arteria che funge da connettore urbano, il quale trova l’inizio nella porta occidentale andando a terminare in quella orientale: qui si concentra il nostro intervento. Dopo un’approfondita analisi del sito, abbiamo deciso di intervenire con la trasformazione dell’area, che circonda il nuovo Campus universitario, in un parco dedicato allo sport e alla tecnologia. Successivamente, abbiamo delimitato la porta est attraverso l’introduzione di un nuovo volume edilizio che funge da centro di sviluppo, dedicato alle scienze naturali, frutto della considerata posizione strategica vicino alla nuova Università e al Tecnopolo umano.
Il MIND si fonda su diversi principi che abbiamo incorporato nella progettazione del nostro progetto. Il progetto ha come concetto base il “common ground”, ovvero la realizzazione del piano terreno come uno spazio traslucido e flessibile, completamente accessibile al pubblico.
Al contrario, i laboratori situati nei livelli superiori, presentano un design più chiuso formato da locali incubatori, locali di sperimentazione umida, aree asciutte, spazi di lavoro individuale e anche aree open space dedicate al co-working.
Il tetto verde accessibile è un altro principio che, attraverso la creazione di terrazze, può offrire una notevole esperienza del sito. In questo progetto il tetto serve come un elemento integrante che definisce la morfologia dell’edificio. Poiché il punto di partenza del nostro intervento era la progettazione dell’area sportiva e quella di tecnologia , abbiamo utilizzato la copertura del centro ricerche proprio come una continuazione del parco. Insieme alla struttura in legno, il tetto verde mira anche a ridurre il carbon-footprint e quindi ad aumentare la sostenibilità dell’edificio.
In conclusione, il nostro intervento mira a creare uno spazio unico che riunisca diverse discipline della vita. Un ambiente di lavoro in cui vengono generate e condivise nuove idee innovative. L’integrazione di tale architettura in un nuovo paesaggio dà vita a un nuovo e più raffinato tessuto urbano.
Parole chiave: Flessibilita, sostenibilita, tetto verde inclinato, conclusione urbana, piano terra comune.
9
10
introduction

1
MIND: Milano innovation district
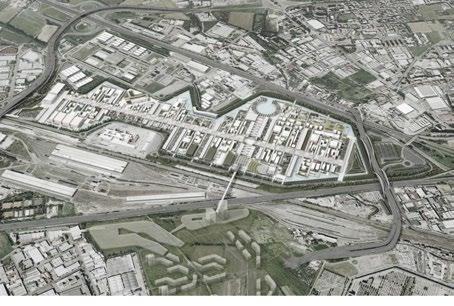
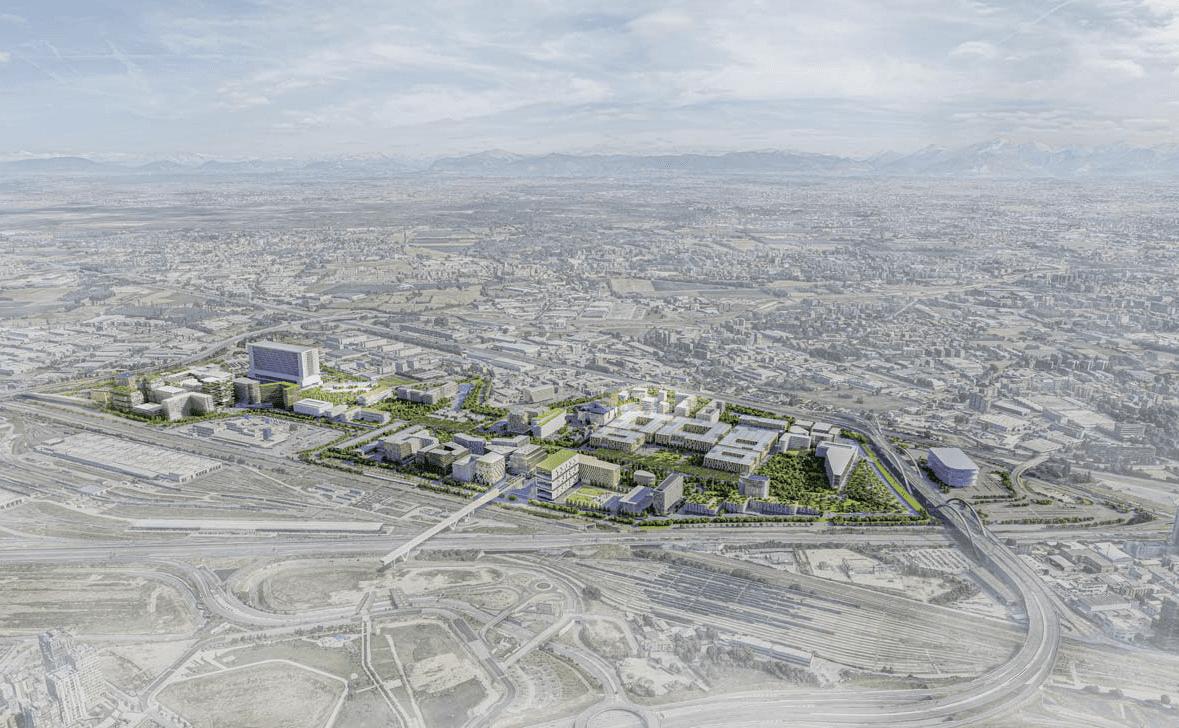
MIND Milano Innovation District is the unique Italian hub of scientific excellence and district of the city. It is a sizable, modern multinational neighborhood. Anyone who innovates conducts research is welcome to this hub of sustainable growth, as are institutions, businesses, and people’s lives. It is located northwest of Milan’s suburban area with a surface of around one million square meters. The new project adopted the robust intercontinental aspiration and further cooperation with public and private partners: Arexpo and Lendlease. They aspire to create a new evolution to the whole master plan. The matter of the most significant importance is to take care of the quality of the spaces by preserving them.
MIND is located in a well-planned position in Milan that is easily accessible by urban transportation. The project’s objective is to answer not only to the economy’s growth but also to face and give solutions to challenges such as a sustainable environment, hospitality, and socio-economic incorporation. The area is divided into three main parts: West Gate, MIND Village, and East Gate. While always on the changeover, Arexpo has managed to keep the site alive by hosting numerous social activities.The MIND is now a new ongoing situation that will host areas of science, innovation, knowledge, sport, habitation, and business. In brief, it is a city of the future where life and innovation coexist and is a place of new conception.
12
Fig 1: MIND site with surrounding - Carlo Ratti Associati (CRA)
MIND:Milano Innovation District
A City For the Environment
Sustainability depends on discovering ways to protect the environment, but it also depends on cutting expenses and developing a vibrant community. Cities can leave a net zero footprint for a better sustainable world through planned infrastructure, public green areas, smart garbage collection, and more. Milano Innovation District is a Zero-Carbon district with its renewing construction techniques, optimizing resources, and making room for nature and vitality. Mind`s responsibility is to develop a district powered entirely by certified renewable sources, starting with on-site solar energy.
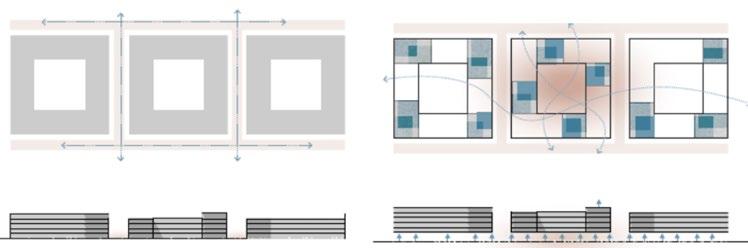
Common Ground
The idea of common ground is to create a single, expansive ecosystem open to interpersonal interchange. It aims to provide the best living conditions for the present, and future generations, forming the foundation of the entire district. It is one of the inspirational design concepts considered during the Research Center for Natural Sciences study. Traditionally the ground attack on the buildings observes the urban space between private courtyards and public streets. (Figure 4) Buildings are raised and separated at the common ground to grant permeability and assemble a constant public space. (Figure 5)
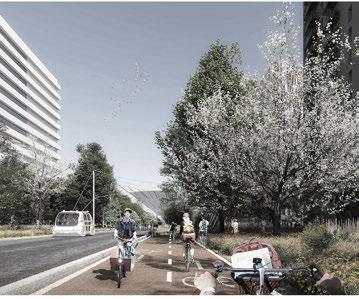
A Car Free District
Milano Innovation District`s surrounding scenery is breathtaking, and green can be seen on the facades and in the spaces between the buildings. Along the Decumano, the linear green park, tree-lined path, bicycles, and electric cars travel, and small animal colonies and pods find refuge in the waterways. A broad perspective of sustainability assumes the global goals for addressing climate catastrophe. On the other hand, the local viewpoint focuses on the happiness that a specific location can produce. MIND aims to develop to meet both needs.
13
Fig 2: Waterfront - MIND
Fig 3: External spaces - MIND
Fig 4: Traditional Ground Level, MIND
Fig 5: Common Ground, MIND
Fig 6: Bicycle roads, MIND
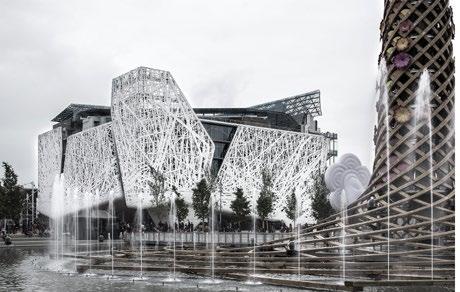
Fig 7: West gate, MIND
MIND:Milano Innovation District
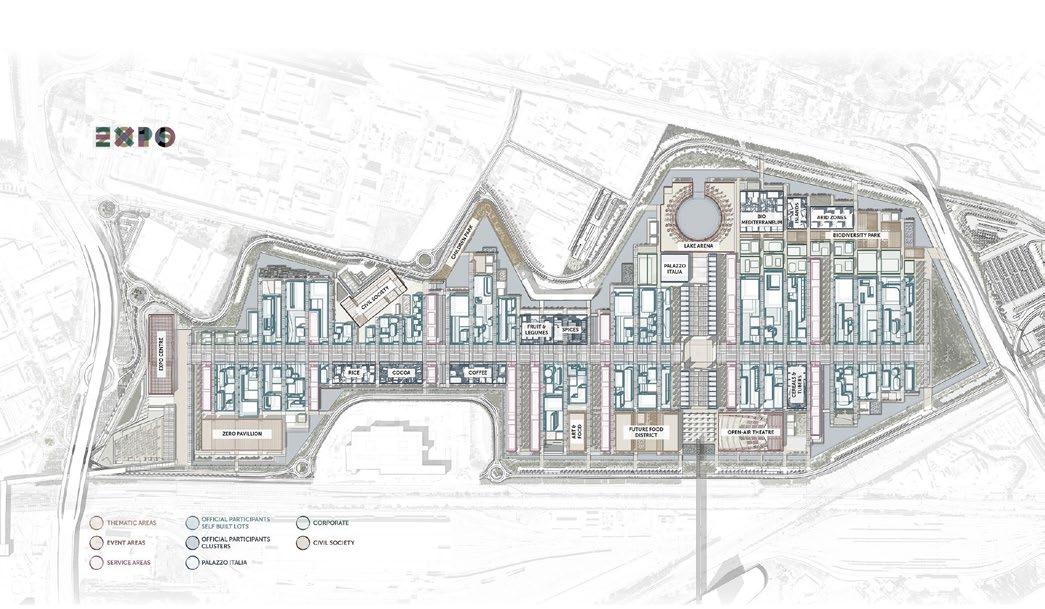
The site is under the ownership of a private company named Arexpo. In 2011, Arexpo s.p.a. was established to acquire the land for the 2015 Milan Universal Exhibition. The place hosted the 2015 Universal Exposition (Expo 2015) in the past, having 141 countries addressed and visited by twenty-one million people Currently, Arexpo is in charge of developing and implementing the strategic

MIND : A Public Private Partnership
A strategic project for Lombardy Region and Italy
“Strong strategic vision and solid, efficient management skills.”
vision for constructing a cutting-edge, international Science, Technology, and Innovation Park.Arexpo’s shareholders are primarily public institutions. Italian Government (39.28%), Lombardy Region Government (21.05%), Milan (21.05%), Fiera Milano Foundation (16.80%), Milan Metropolis (1.21%) and the Municipality of Rho (0.61%).
in delivering large-scale urban regeneration projects”
They aspire to convert the area into a science, technology, and innovation district. Their Expo model is collaborating with public and private anchors for future developments.
Lendlease is a leading infrastructure group with operations in Australia, Asia, Europe, and America.They desire to create places that enrich people’s lives worldwide.

14
arexpo
Fig 8: Map of Expo 2015 Site,Arexpo
MIND continues the World Expo 2015 Legacy
Arexpo
“Trustworthiness
2011-2015
Arexpo is the owner of the land that is destined to host the universal exposition (Expo 2015) in 2021, The exposition gathers more than a hundred countries together and attracts tens of millions of visitors.
2015
The task changes with the end of the exposition. Encouraged by the ideas of innovation and research, Arexpo is assigned to reinvigorate the entire masterplan.
2017
The aspiration of the project is improved with ‘’multilateral talks between different sides. A 99-year-old concession was proposed and later awarded to Lendlease by Arexpo.
2018-2019
The masterplan of MIND is accelerated and strengthened inspired by cooperation between partners. It will attract the idea of having the science faculties of UNIMI – University of Milan.
2016-2017
The site had been open to events and collaborations until the start of construction to keep it active and not empty. Simultaneously the first agreement is reached with Human Technopole – life sciences and IRCSS health hub.
2022Still today the site is under development by Arexpo and Lendlease. Milano innovation district aims to become the focal point not only Milan but also in Italy.
15
Development of the Area : 2011- Present
Fig 9: Map of Expo 2015 Site, MIND
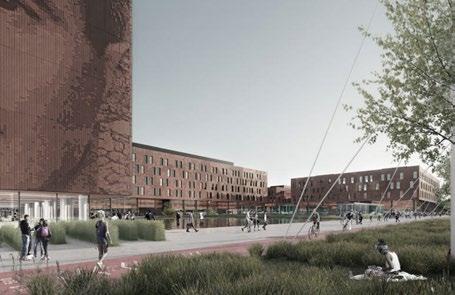
Fig 10: Unimi,Carlo Ratti Associati
Fig 11: The Italian Pavilion, Expo 2015, Inexhibit
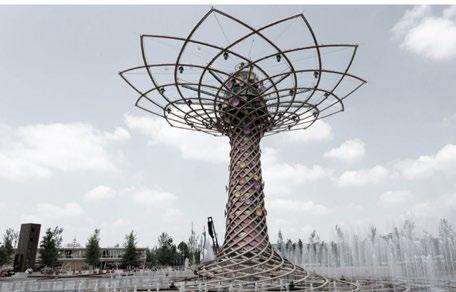
Fig 12: The three of life, Arexpo
Arexpo
Galeazzi Hospital
Completion: 2022
Under construction, hospital with over 500 beds
West Gate
Completion: 2023-26
Commercial Workspace, Build-to-Rent, Industrial, Hotel and Retail
Human Technopole
Operational - Completion: 2024 Life Sciences Research Centre
Mixed use zone 3 Completion: 2031
Commercial Workspace, Build-to-Rent, Industrial, Hotel and Retail
Unimi - University of Milan Completion: 2025 University of Milan’s Science Campus
Mind Merlata Stop
Completion: 2024/2025
Location of Second Metro Stop
16
main anchors Main
Fig 13: Functional Map with anchor buildings - MIND
Anchors
Public Anchors Services

17
Public Anchors
Fig 14: Galeazzi Hospital, MIND Fig 15: Innovation Hub, MIND
Fig 17: Human Technopole, MIND
Fig 19: WG Common Ground, MIND
Fig 16: WG Common Ground, MIND
Fig 22: WG Common Ground, MIND
Fig 20: Horizon Retail Building, MIND Fig 21: Residential Building, MIND
Main
Fig 18: Zenith Multipurpose Building, MIND
Anchors
Galeazzi Hospital,University of Milan, Human Technopole
Offices,Co-working and incubators, Residential Retail,Hospitality,Cultural
Rho is a city and a municipality in the metropolitan city of Milano in Lombardy, Italy. Proved by archaeological artifacts found, the city of Rho is one of the oldest areas to be inhabited in the region of Lombardy. Rho is known for being a busy city with numerous industries. The city has a population of fifty thousand inhabitants. It is known for hosting the universal exposition in 2015 (Expo 2015), and the Milan Fair (Fieramilano), which is the largest of its type in Europe.
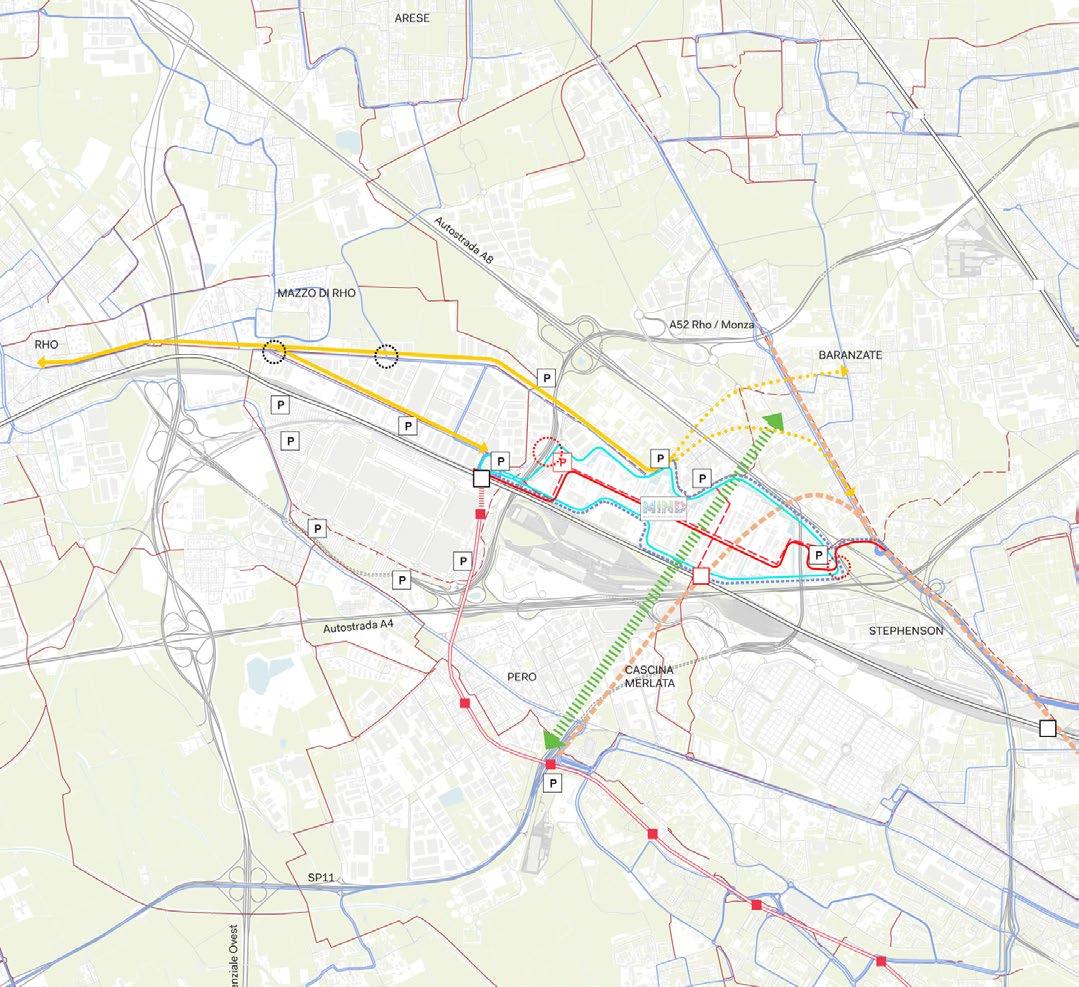
The metropolitan city of Milano has plentiful and diverse urban transportation.The Azienda Trasporti Milanesi (ATM), Milano’s public transportation agency serves the option to navigate through tramways, busses, metros, and trains. A new station will be extended to reach the Milano innovation district, through the first metro line (M1). In addition to that, it is possible to reach the site through the subway M1 and train to Milano’s Fair which is close to the site.
Airport Connections: 20 min to Milano Malpensa,30 min to Milano Linate,45 min to Bergamo Orio al Serio Urban Connections :30 min to the city center of Milan,10 min to Garibaldi Transport Interchange, 1 hour from Turin, Brescia and Parma stations
Railway Connections: Direct connection to main European corridors,3 hours connection to Rome,1 hour connection to Bologna 55 min connection to Turin,2 hours connection to Venice,4 hours connection to Zurich
18
A4 - C.Merlata A4 Zara-Expo ex SS11-A8 Merlata Metro Stop
Accesibility Urban Level Accesibility : Fig 23: 3D view, MIND
accesibility
Fig 24: Transport Insfracture,MIND, Systematica

Baranzate- Molino Dorino cross connection

Line M1 - Line M6
19
Accesibility

20
west gate West Gate
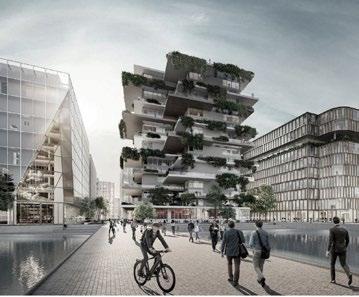
Fig 25: West Gate visualization, MIND
The area of West Gate will be the place of multifunctional activities. It is divided into four main functions: Hospitality, living, working and having social activities. The Innovation Hub at the West Gate will bring together the work and the joy where each floor is different from the subsequent.
It will contain diverse spaces such as private offices and coworking spaces, depending on the mood innovators will be able to think alone or brainstorm with a group. Moreover, Zenith, the multipurpose building will allow experts and specialists to operate freely with its flexibility.
The West Gate’s objective is to be exhilarating for the workers, and innovators.The Molo building dedicated to multipurpose use will also have laboratories for researchers and that will further strengthen the objective of sustainability with its refreshing architecture.
The West Gate will have a connection point called the common ground that will bring together the public and private areas, residents, and workers. The numerous activities provided, will bring together the youth and elderly into the common ground and beyond.
21
West Gate
Fig 26: Map of West Gate site with surrounding, MIND
22
urban strategy

2
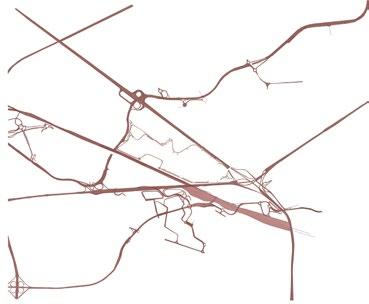
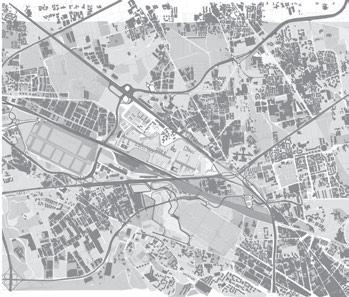
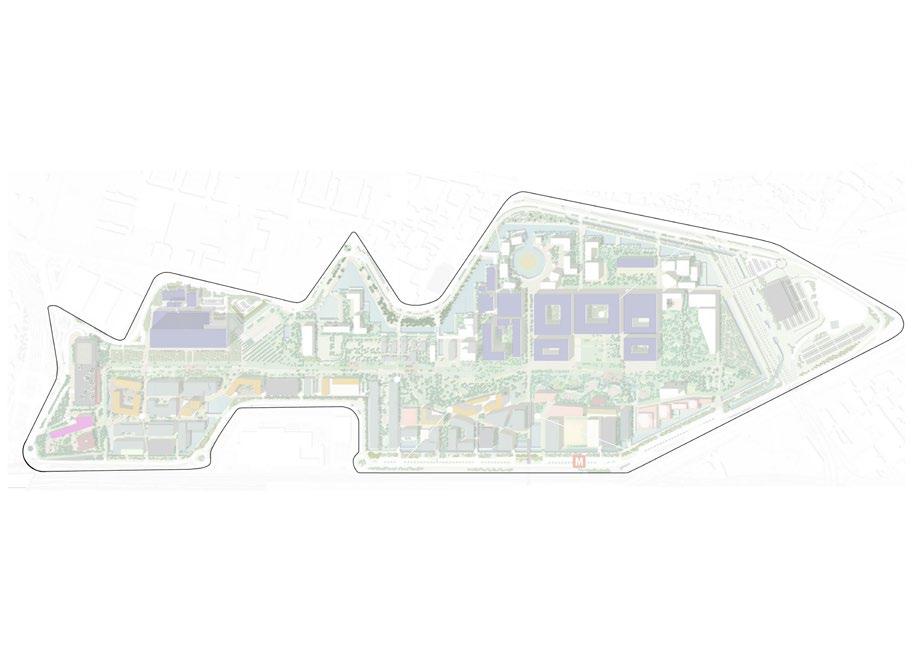
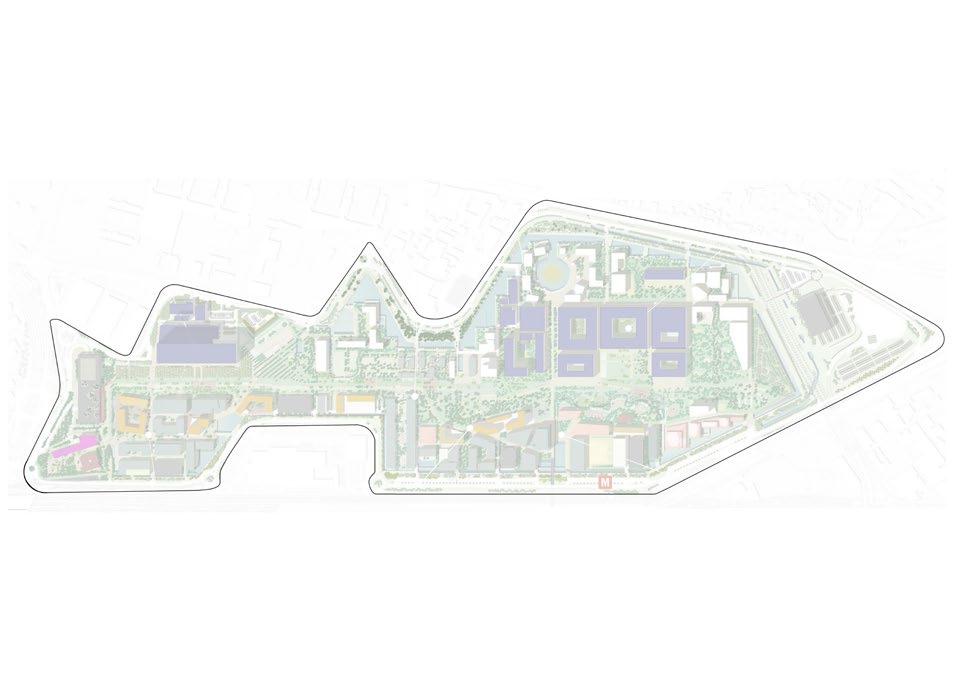
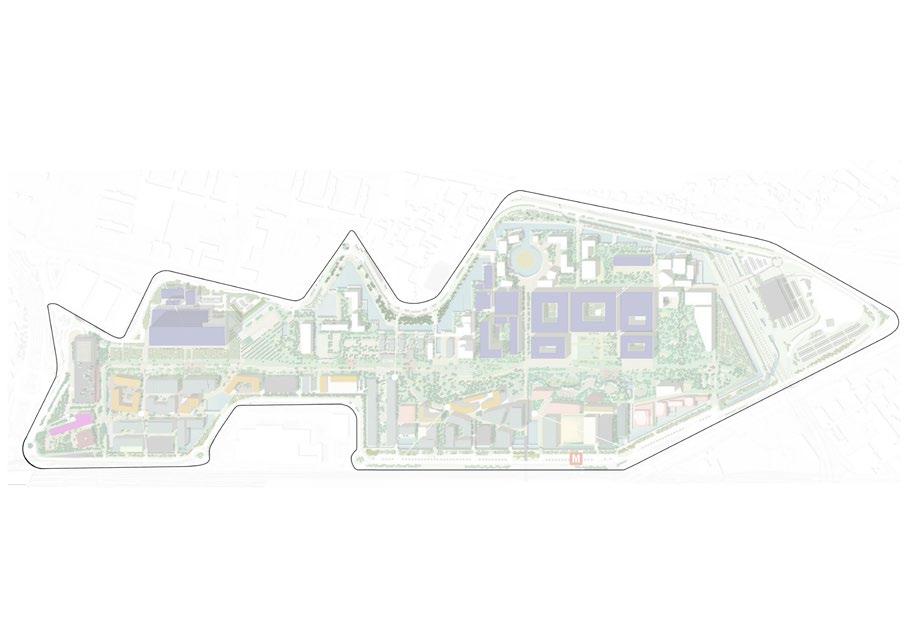
The urban cut aims to investigate the “morphological potential” of the project site, starting from the interpretative analysis of the relationship it has with the rest of the city and, especially, with the urban sector where it fits. The map highlights the main urban connections of MIND site with its surrounding.
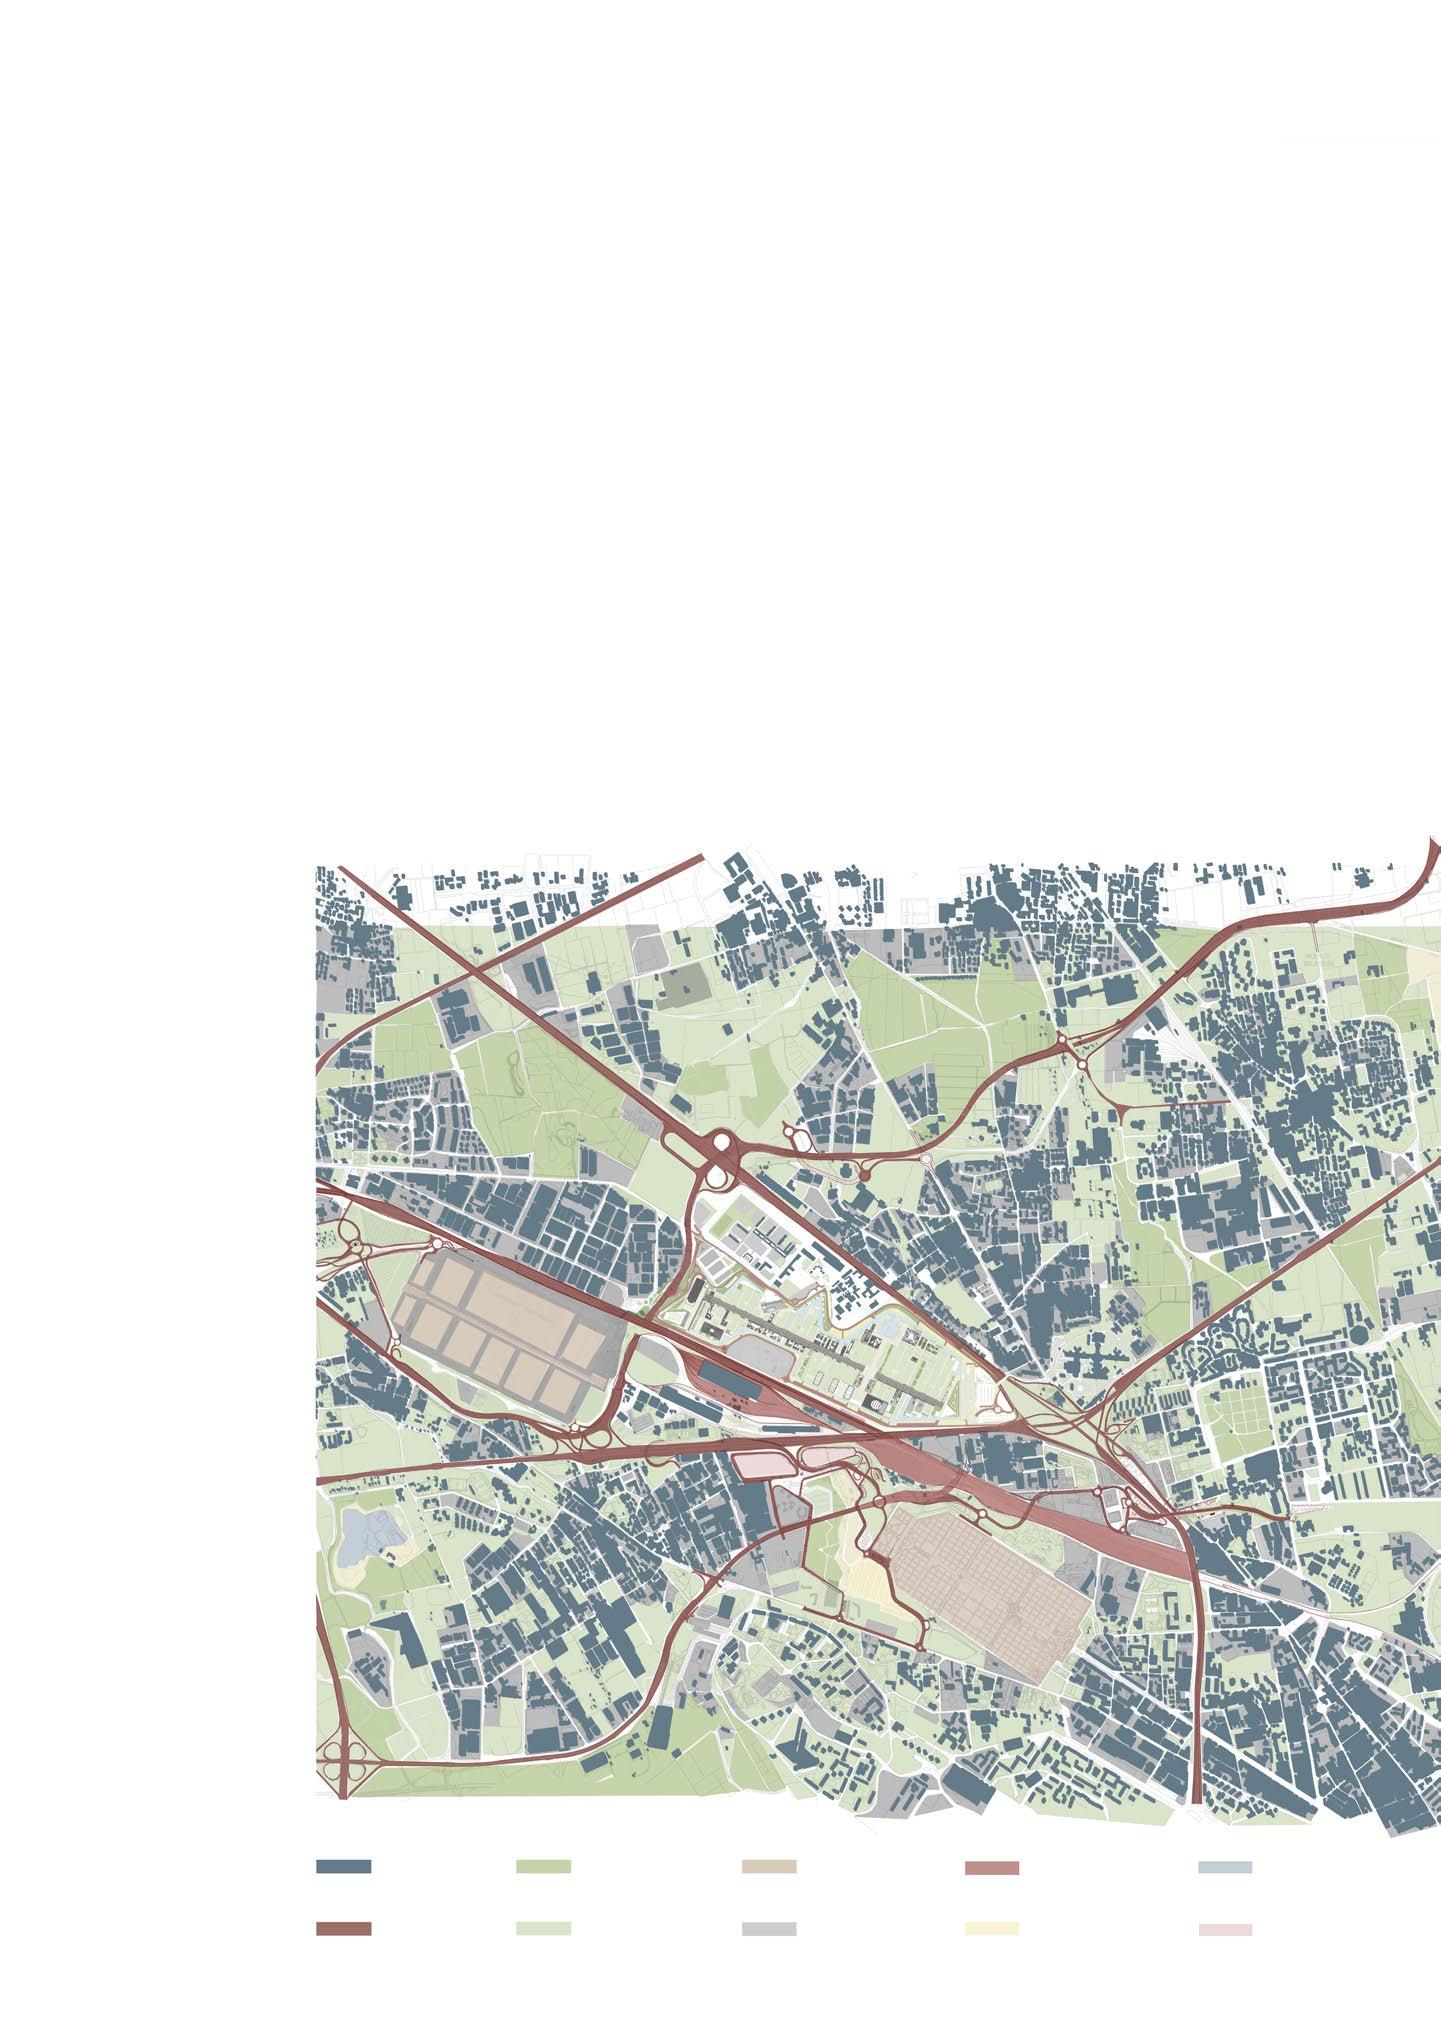
Fig 27: Urban cut, Authors


Urban Cut

Buildings Transportation Parks Greenery Focal points City blocks Railways Agricultural areas Construction areas Water
urban cut
The morphological study was executed to understand the pattern of MIND and its surrounding, with the aim of measuring the morphological differences within the overall urban setting and their reciprocal dialectics. The understanding of the relationships between the intervention site and overall contexts has then assumed an essential role in founding the modifications introduced within MIND’s approved master plan and setting the rules of our urban design strategy. The first part of the study is concentrated on the connection between roads, green areas,
blocks, and the main axes within “MIND’s urban cut”. The area is located at a strategic infrastructural node in the northern part of Milano Metropolitan City. A green “texture” characterizes the environment all around, and the main grids are based on territorial connections of the site. Also, there is a main diagonal grid-axis that frames the borders of the future Milano Innovation District site, as highlighted in the roads’ map clearly. Urban blocks have not only various size, orientations, and types, but also reveal different types of yards, terraced houses,
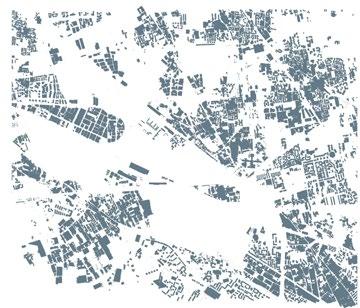
urban morphology
and large-scale industrial buildings providing a heterogeneous “inventory”. The second part of the investigation, focused on the morphological analysis of MIND’s official masterplan, starting from grids, building blocks, and site-perimeter analysis to an inventory of the blocks, interpreted as redefined wider compounds including fabrics responding to the main morphological rules. Extracting portions from the master plan and observing each piece allows for exploring all the site qualifications well.
25
Fig 28: Grids, MIND, Authors
Fig 31: Roads, MIND, Authors Fig 32: Buildings,MIND, Authors Fig 33: Perimeter,MIND, Authors
Fig 30: Greenery, MIND, Authors Fig 29: Blocks, MIND, Authors
Urban Morphology
“Understanding urban morphology is a prerequisite to an awareness of urban aesthetics and a layer of meaning to townscapes” Michael Barke
The urban context maps allow the reading - based on selected “thresholds” of 1956, 1972, and 2021 - of the urban growth characterizing the urban sector wherein MIND is rising and how the site’s relationships with the context have historically defined and evolved. The sequence of maps is mainly aimed at showing
the morphological structure of MIND’s site and surroundings, and its modifications since the mid of last century. According to MIND location in the north-western sector of metropolitan territory of Milan, the main concentrating zones are the municipalities of Rho, Pero, Garegnano, Cagnola, and Baranzate. In 1956, the population was denser in Garegnano, Cagnola, and the eastern part of these zones. In between 1956-1972 the western part of the urban sector started developing, also effect of industrialization, and economic development of the city.
26
The transformation of the urban context starting from 1956
Urban Morphology
Fig 34: Morphology map (1956) ,MIND, Authors
As we approached 1972, we observed that the density has increased, especially in the southern and northern parts.Another essential aspect is increasing density towards the eastern part. Between 1972 and 2000, the territory framed in the map was affected by several vital evolvements. Among them, the Bovisa district developed during this timeline, being involved in an urban transformation process wherein the opening of Politecnico di Milano-Bovisa Campus in 1989 was the main driver. Moreover, during the last phase of the period taken into consideration, a further profound urban and territorial change involved the
qualification of the Rho-Pero exhibition platform, the areas of the former Alfa Romeo of Arese, those of Bovisa as well, the areas around the new infrastructural nodes, the “cluster” of Mazzo di Rho and via De Gasperi, up to those of City Life, of the old fairgrounds, to those of Porta Nuova. In fact, during this period, the linear conurbation of Sempione was strengthened with the completion of the Turin-Milan high-speed railway line, the Passante Ferroviario and the infrastructural upgrades planned for the 2015 Expo, providing a new level of accessibility and connections.
27
Urban
Fig 35: Morphology map (1972) ,MIND, Authors
Morphology
In particular, the “foundation” of the Expo 2015 site generated further transformations of the borders of the future MIND, which enlarged and became denser. The World Exhibition left as a heritage a new ecologically-sound urban area with great infrastructure, fully better integrated with the site and its surrounding.
In addition to Expo development, between 2016 and 2017, regeneration ideas for the entire area gained currency. One of the topics was to open the site for improvements and make it a center of innovation and research. Afterward, from 2017 to the present, the studies on MIND Master Plan began, and the idea of an innovation district vitalized all the surroundings of the site.
28 Urban Morphology
Fig 36: Morphology map (2021) ,MIND, Authors
MIND site analysis
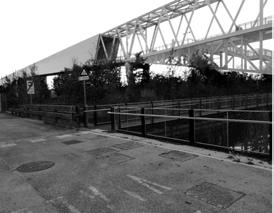
29 MIND Site Analysis
Fig 37: MIND,MIND Village
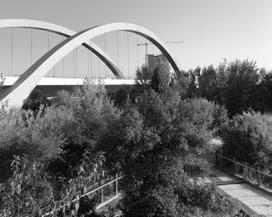
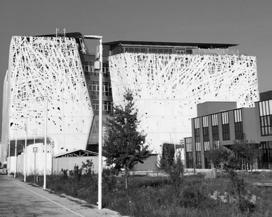
Fig 40: Human Technopole, Authors Fig 41: Bridge, Authors
Fig 38: Decumano,Authors Fig 39: Bridge-Water, Authors
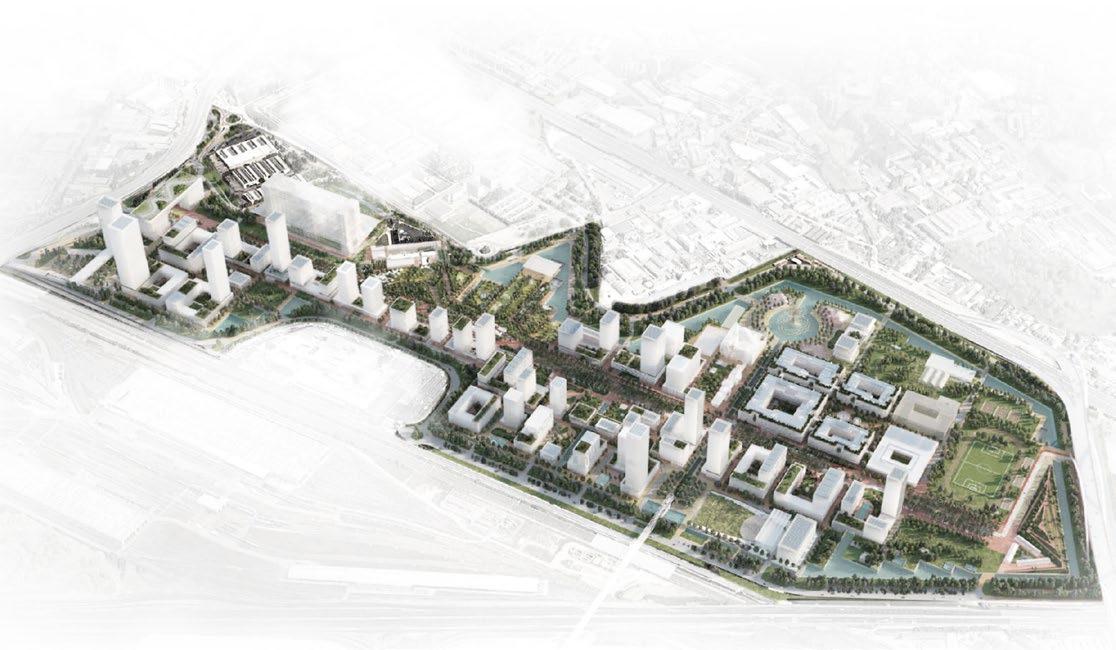
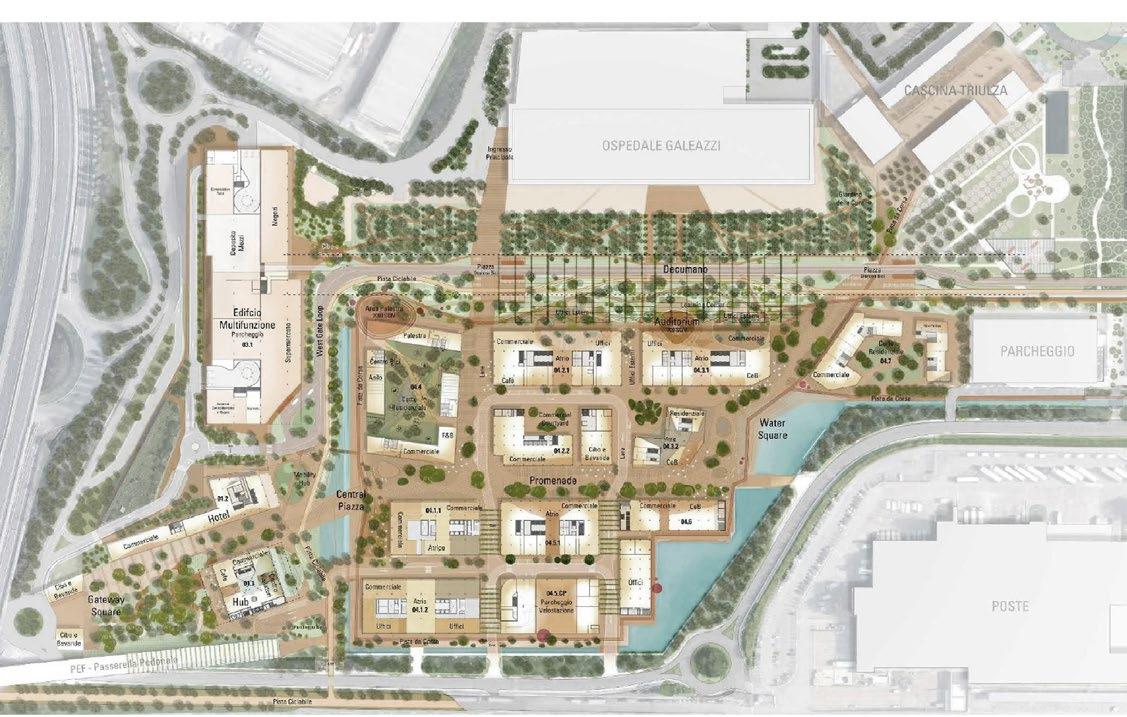
This part of the analysis is focused on the masterplan annexed to the Integrated Intervention Program that was signed in February 2020. Develop by Arexpo and Lendlease together with Carlo Ratti Associati, Land, Systematica, J+S, Bemaa, Rossi Bianchi, and GAD, the masterplan proposes a different urban arrangement even though having the same Guidelines of the first plan as a framework. All the three districts envisaged - West Gate, Green Heart, and Knowledge Hub - are considered entirely to better understand the morphological structure of the district, focussing on urban grid-entries, greenery, blocks and buildings. A grid system, linked to external ring road through several entries served by bridges, is the framework to the design of the urban blocks
of the overall district: the grid system - redefined in its “expanded” meshes by Arexpo and Lendlease - greenery, networks, and open spaces are a significant legacy of the Expo 2015 in Milan As we observed in the previous drawings, the site preserves a green legacy, which MIND calls the Blue-Green Belt. Greenery surrounds the area and spreads inside, following the same route as water, giving character to the context and proposes a chance to experience nature. The green system is then implemented with a large multifunctional theme park that develops as an ecological and social infrastructure along the Decumano, the Park for Healthy Eating and the Sports and Entertainment Park
30 MIND Site Analysis
Fig 42: Grids, MIND, Authors
Fig 43: Greenery, MIND, Authors
Blocks and buildings analysis is essential to read the “texture” of the site and understand its scale. The urban grid defined by the PII’s masterplan in 2019 acts as a reference system, a “framing tool”, to recompose the main axes and pedestrian paths in an overall framework, completed with the new interventions. Specially to the south of Decumano, within the private development sector, the large meshes of this urban grid don’t define in reality the “urban blocks”, but wider urban lots to be further articulated. The urban texture is so marked by a high diversity in morphology, determined by adding an axis with different orientations and a further minor pedestrian path to generate a “fine” urban grain, which leads through the blocks to coincide with single buildings (i.e., West Gate).
The flexibility of the land use mix and the fragmentation of the building permit into several sub-units to favour the adaptation of the project to future needs entails, in reality, the risk of weakening the control of the unique urban character of the district, as the “ scenarios” prefigured for MIND already suggest. To the north of Decumano, the presence of the major public functions working as urban drivers - the Human Technopole research center, the new Galeazzi hospital, and the new campus of the State Universityinstead allows the recognizability of the urban grid. For this reason, the “blocks” evidential in the scheme indicate wider compounds, including textures responding to different morphological rules.

31 MIND Site Analysis
Fig 44: Blocks, MIND, Authors
Fig 45: Buildings, MIND, Authors
east gate analysis

Main axis Secondary axis Entrances
The main backbone of the site is Decumano, the Linear Park, and it continues all along the district, from the West Gate entrance to the Mediterranean Hill. The Cardo - a water Boulevard in the heart of the new Innovation district between the Human Technopole and the State University - collects the flows instead from the main access from the Cascina Merlata district and the routes crossing the perimeter Green-Blue Belt.
Fig 47: Greenery, East Gate, Authors
As mentioned in the previous chapters, MIND maintained existing greenery at the site. The Research Center for Natural Sciences master plan aims to respect the existing green texture and improve its quality, including new sports facilities or working areas within the different zone of the park. So, the ratio of the greenery guaranteed by the redefined master plan of the Knowledge Hub District is equivalent to the one provided by the official PII.
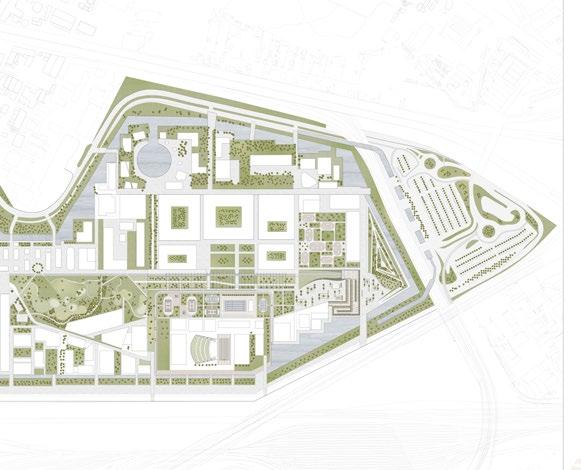
Fig 48: Built-Unbuilt, East Gate, Authors
During the design of the new master plan, different urban strategies and rules have been instead applied in revising the foreseen urban blocks to respond to the urban, programmatic, and functional requirements of the new intervention. The “BuiltUnbuilt Space” diagram shows the association between built areas and overall context.
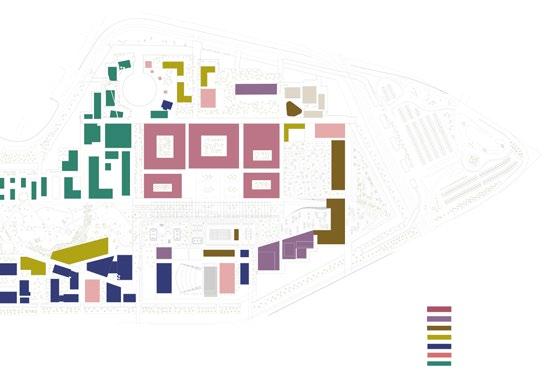
Fig 49: Functions, East Gate, Authors

The area mainly consists of education (UNIMI) and cultural, public,retail and residential buildings. The Research Center for Natural Sciences location is close to the cultural and educational zone, which was one of the essential criteria that affected the building`s function.
32
Fig 46: Accesibility, East Gate, Authors
East Gate Analysis
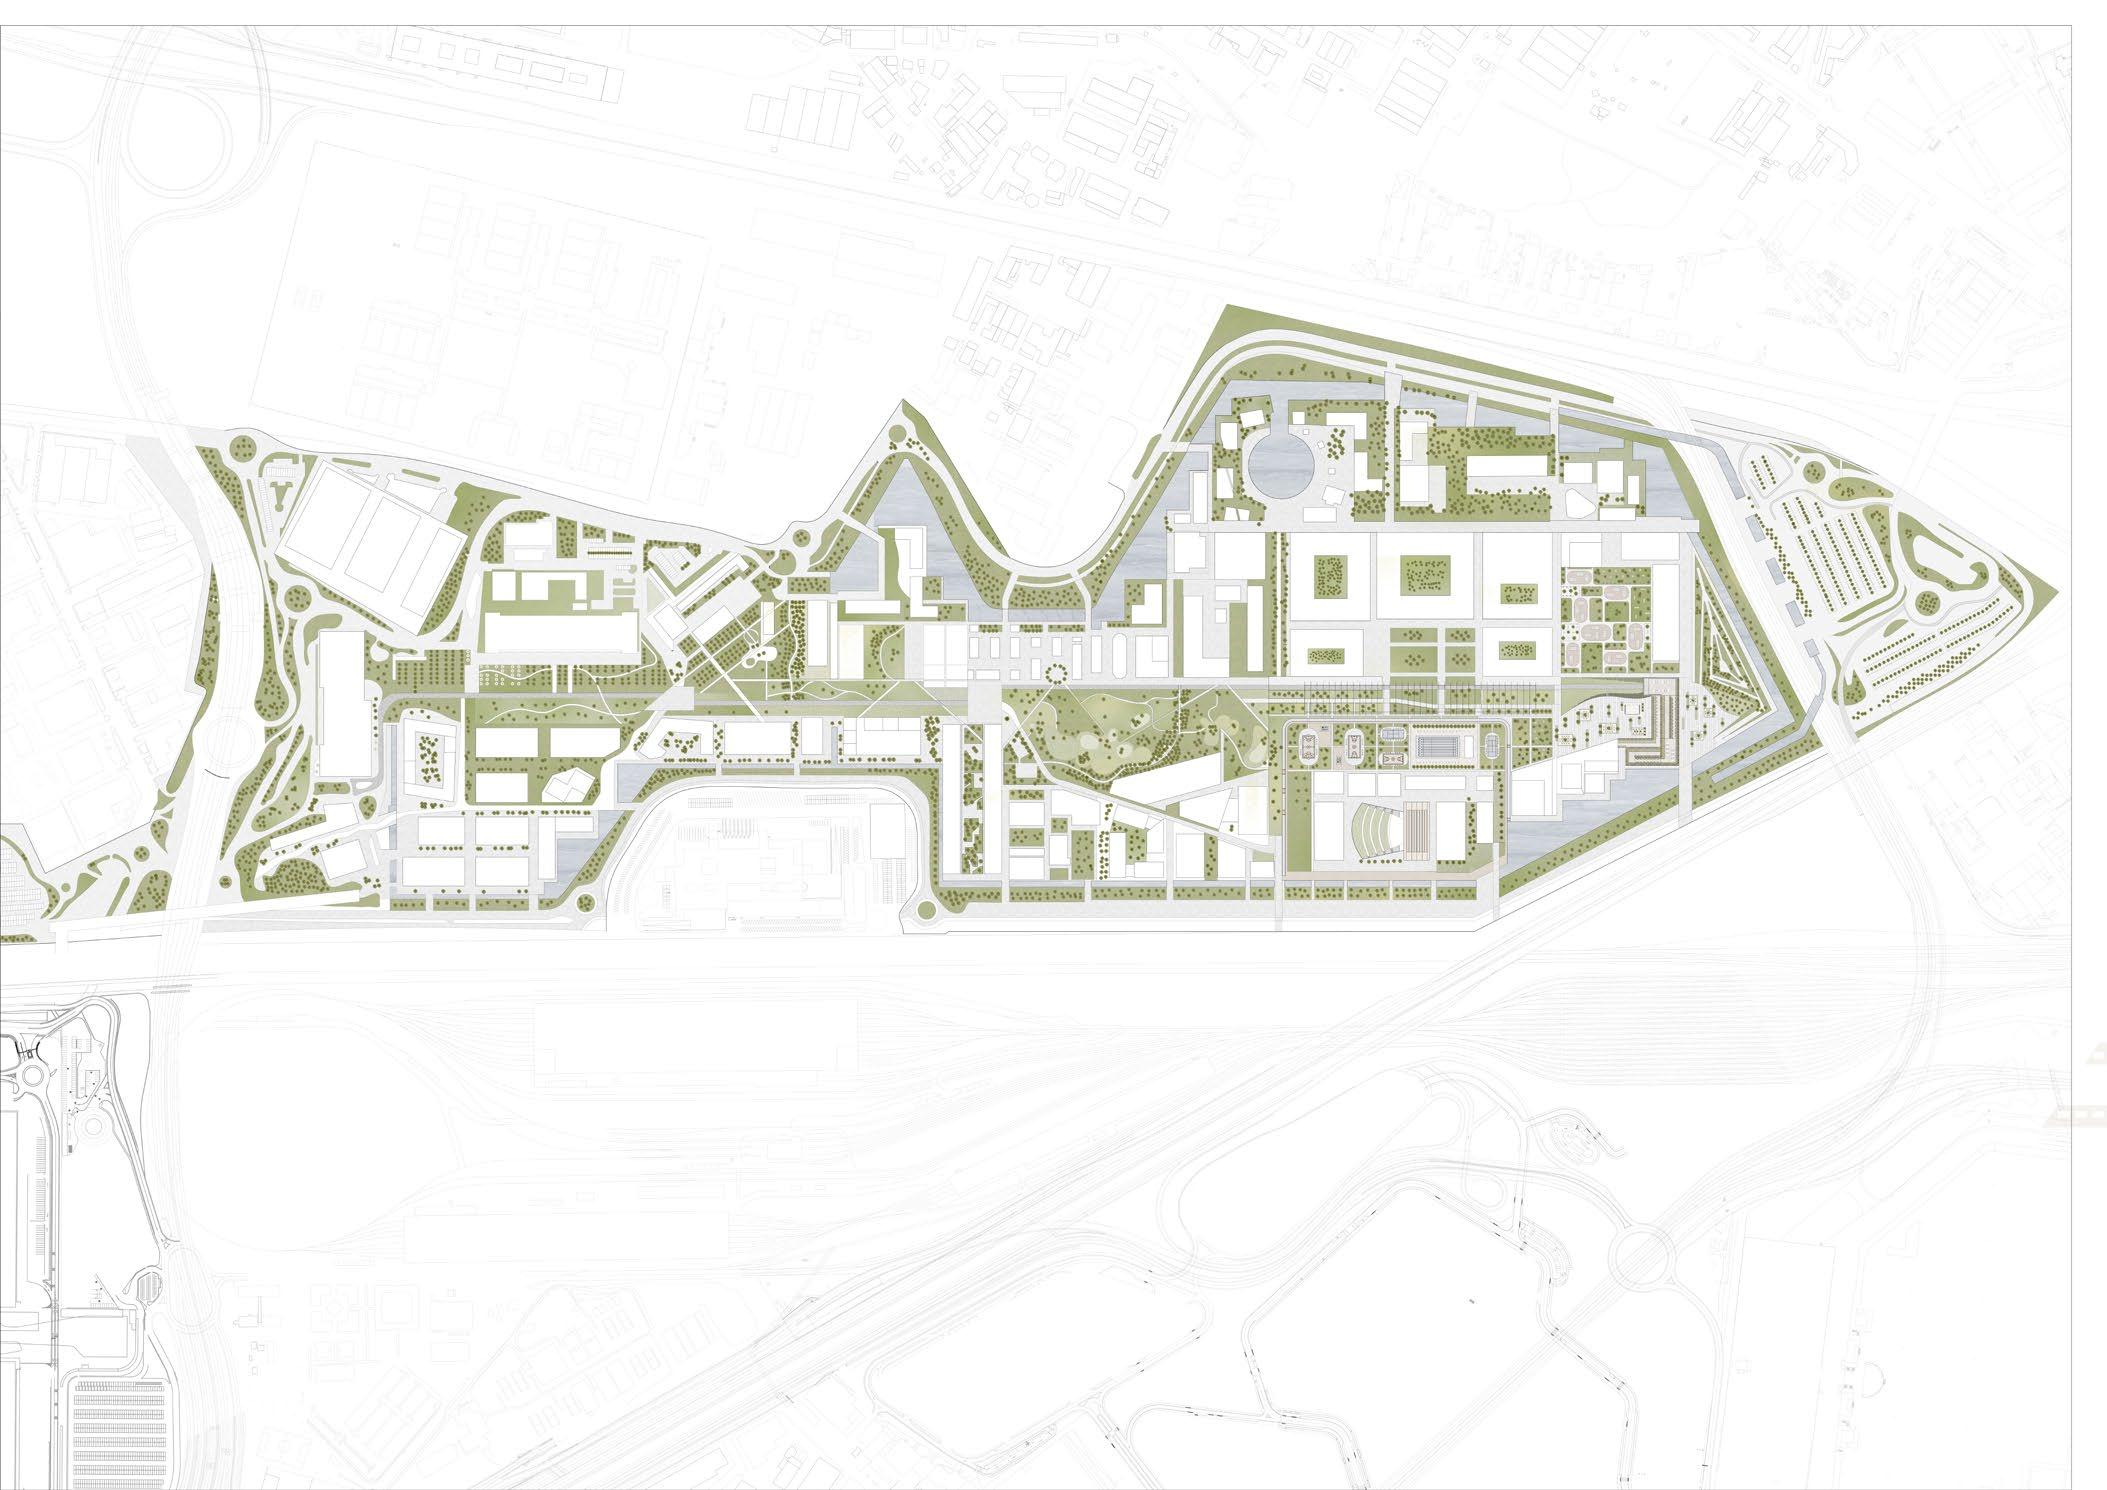


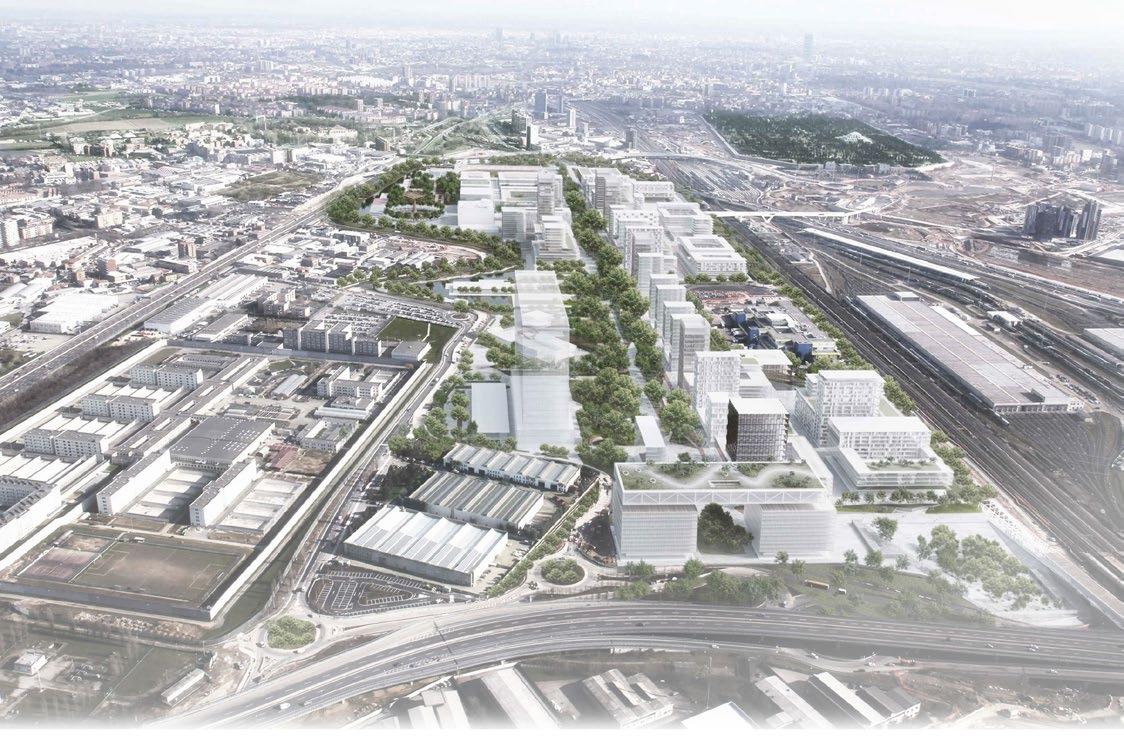
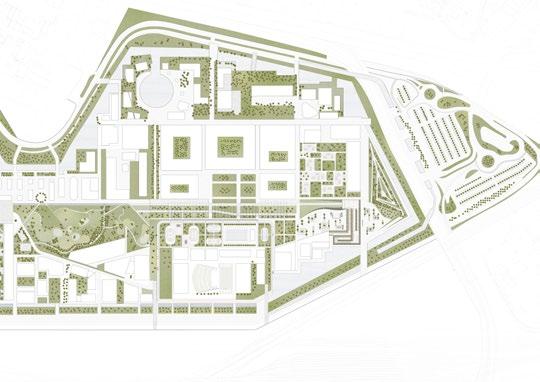
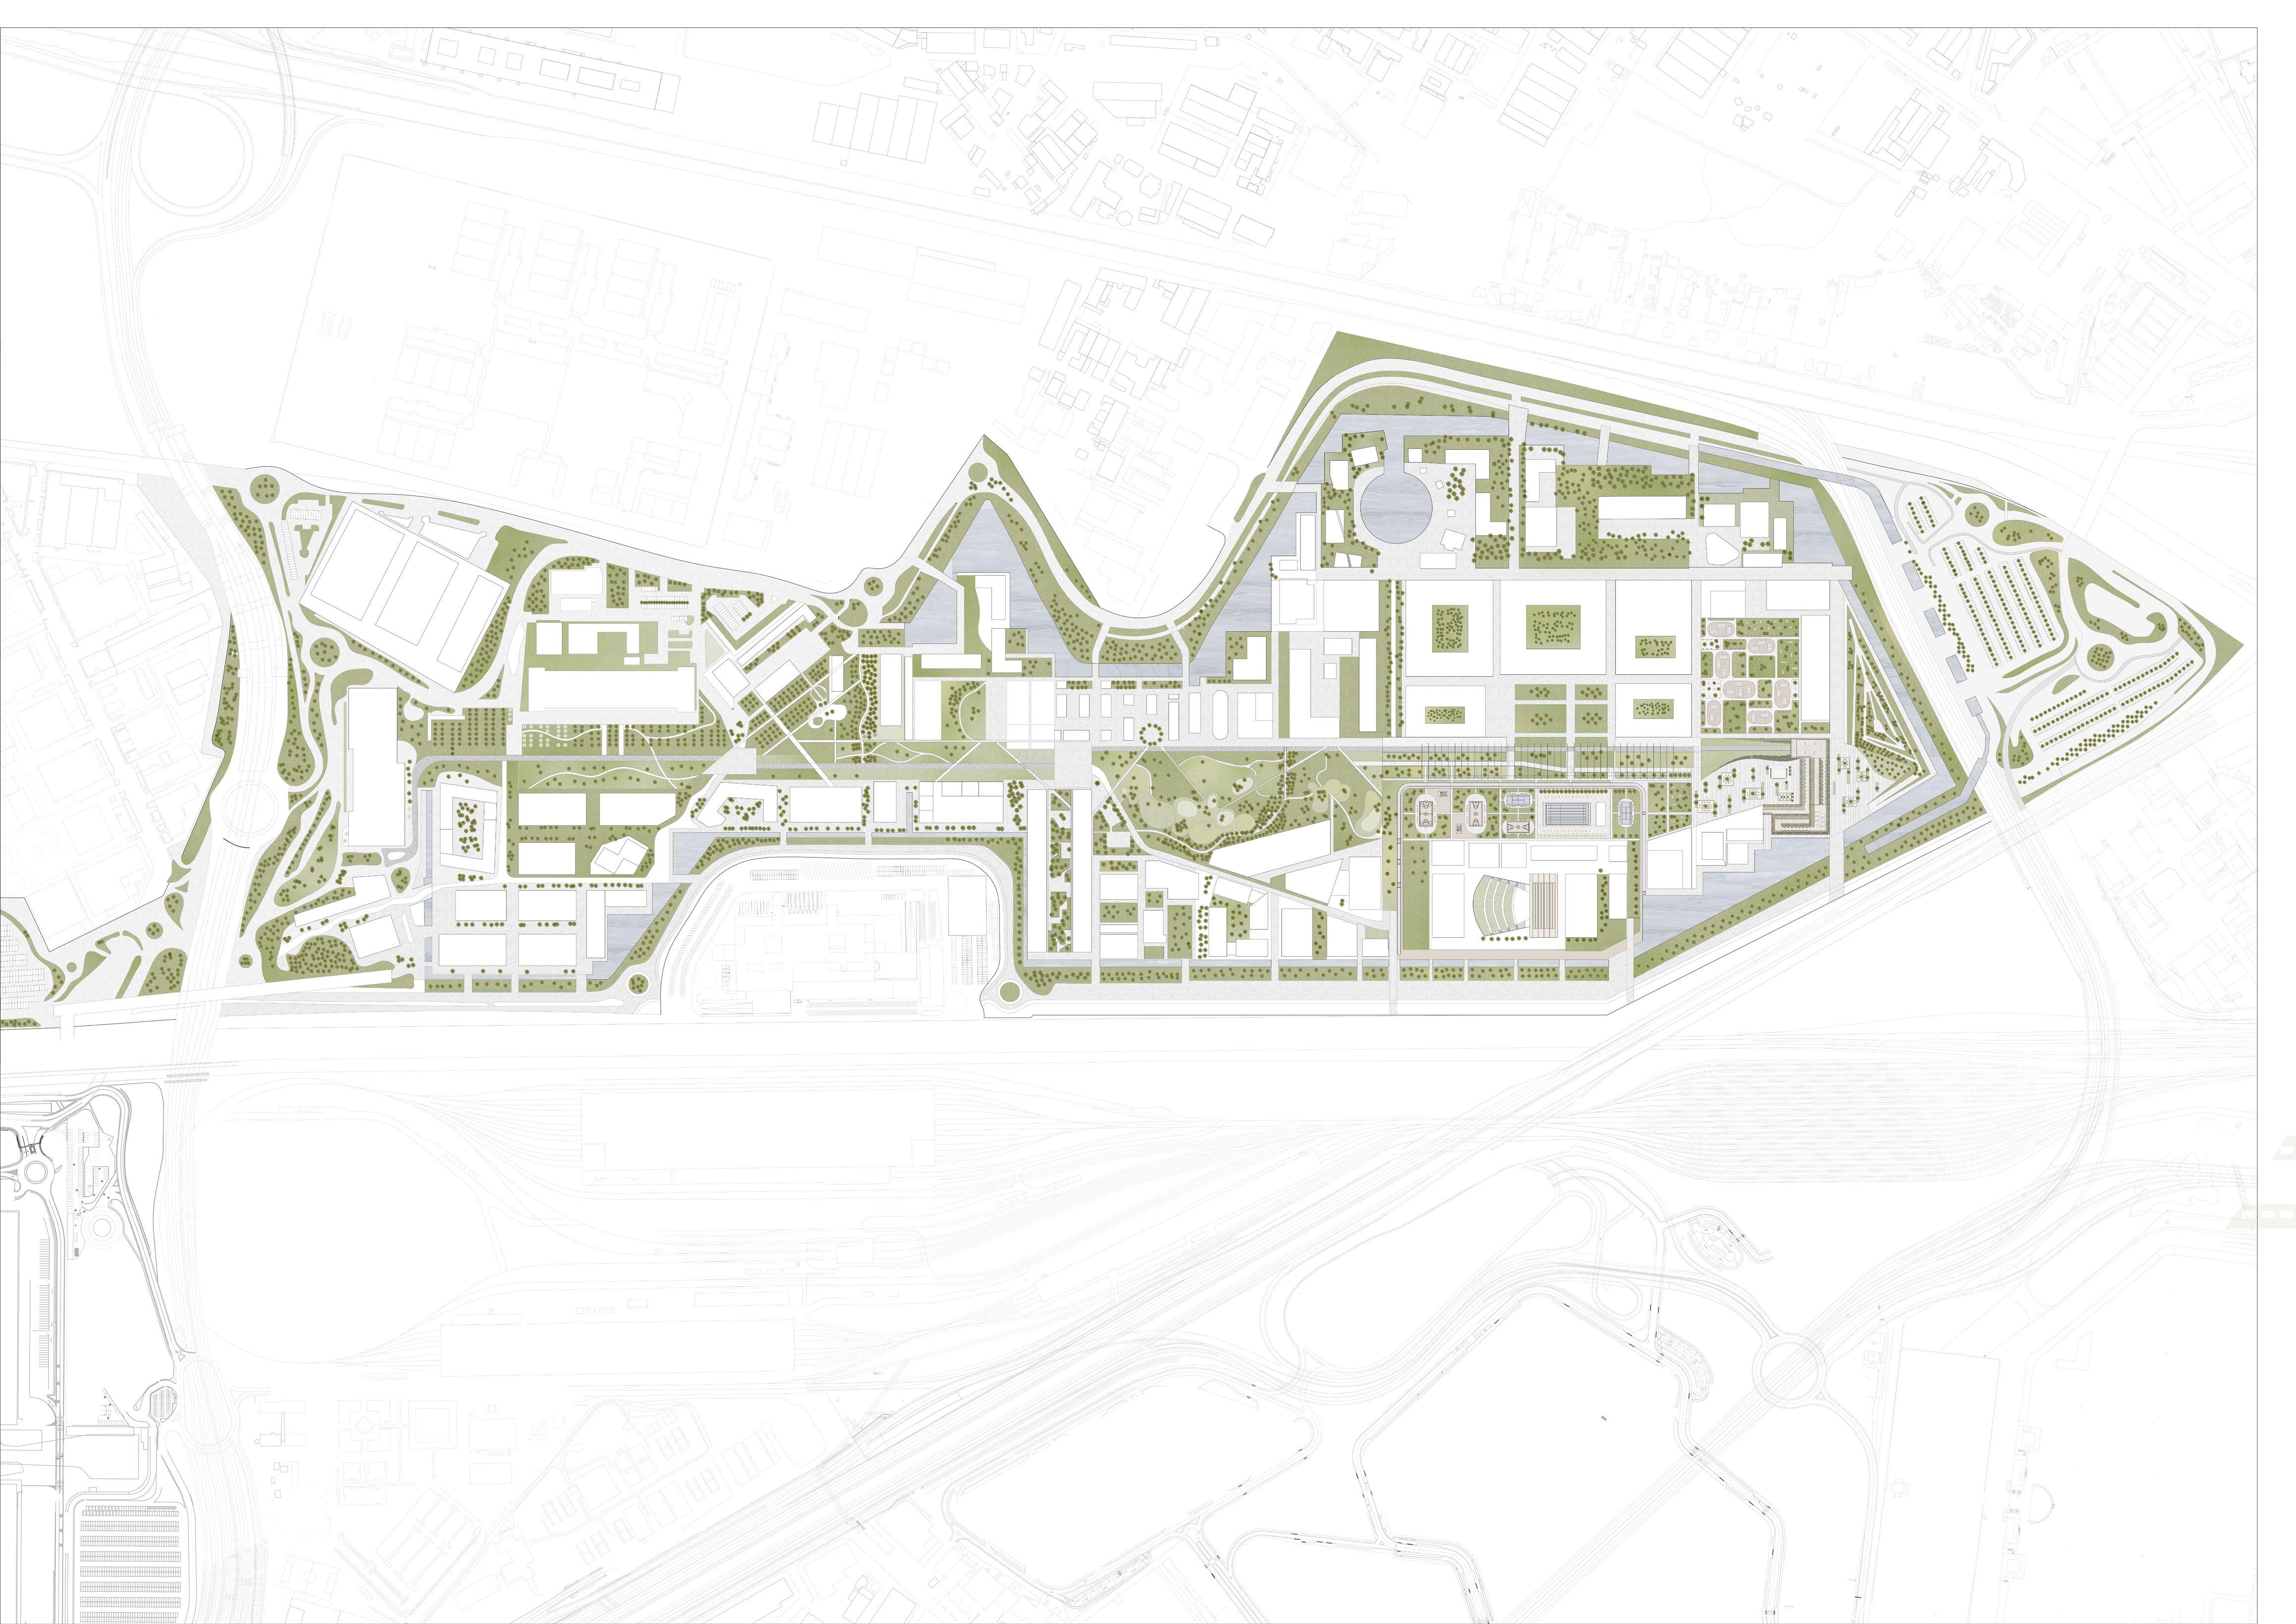
Master Plan
Fig 51: Perspective, Master Plan
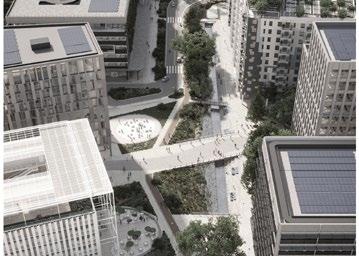
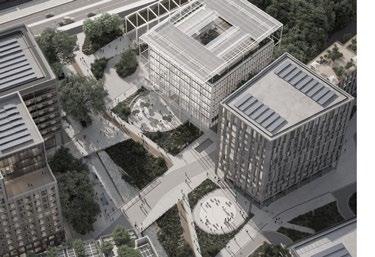
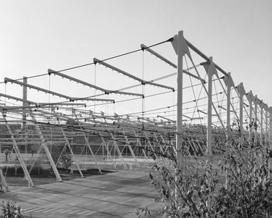
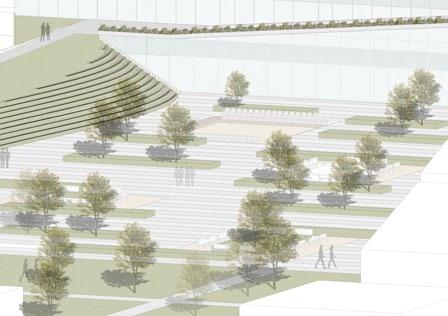
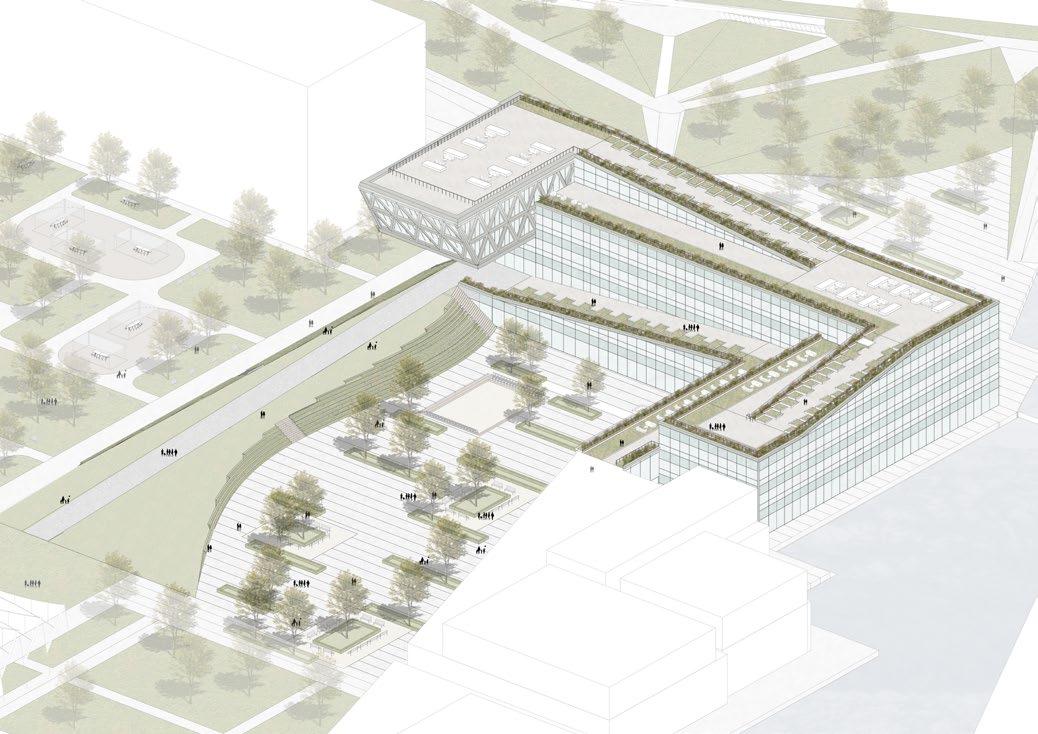
The Research Center for Natural Science is located at the East Gate of the MIND, within the Knowledge Hub. The urban strategy guiding the modification of the official master plan and the new landscape design for the Sports and Entertainment Park is to reinforce the ending part of the Decumano and its surroundings. The open spaces network and the park are articulated in different zones - including sports areas, digital parks, and event spaces, in accordance with general prerequisites of this District – to modulate the scale of the site and offer a rich, varied, and humanized environment, wherein each part can play a specific urban and social role. The articulation of parts of the Park is defined starting from the “grid” of paths that lead from the perimeter bridges, crossing the Blue-Green Belt, to the Linear Park which develops along Decumano. Trees are used as filtering in-between spaces. Especially trees chosen for the sports area are more elevated than in the quad facing the Research Center, especially to provide the needed privacy and protection to the sports field and open-air pool.Except for the event area, the project primarily consists of greenery, which is related to the “preserving nature philosophy” that shapes the main MIND’s green infrastructure.One of the vital design points aspects of the Research Center for Natural Sciences is the green pathway that, starting from the Linear Park, as a
“green strip,” keeps getting elevated as a slope and introduced into the building. While going through the journey along this lightly inclined route, the large artery slowly meta-morphs itself into the roof of the building. This gives the pedestrians a sense of movement and, thus, also a better experience of the surrounding context. This lightly inclined route surrounds the event space partially and turns into an open amphitheater, where the events are held. It invites people towards the Research Center and defines the neighboring open spaces, offering another “panoramic” ground floor at the higher levels and contributing to the vitalization of the place. Being a “natural border” for the different open spaces, the green ramp reflects and strengthens its edge by changing the material finish of the area. The chosen materials for the changes depend mainly on the zones, which are stone (darker, lighter), wood, and greenery, consistent materials with each other and suitable for the general concept. Overall, the master plan of the Research Center for Natural Science’s scope of intervention is marked by sustainable attitude and collaborative design principles, aimed at developing, in accordance with the landscape strategy foreseen for MIND, the multifunctional theme park as an ecological and social infrastructure, taking into consideration not only present but also future community and its necessities.
34
Master Plan
Zone 1 : Sports Area
Zone 2 : Digital Park Zone 3 : Event Space
Zone 1 : Sports Area
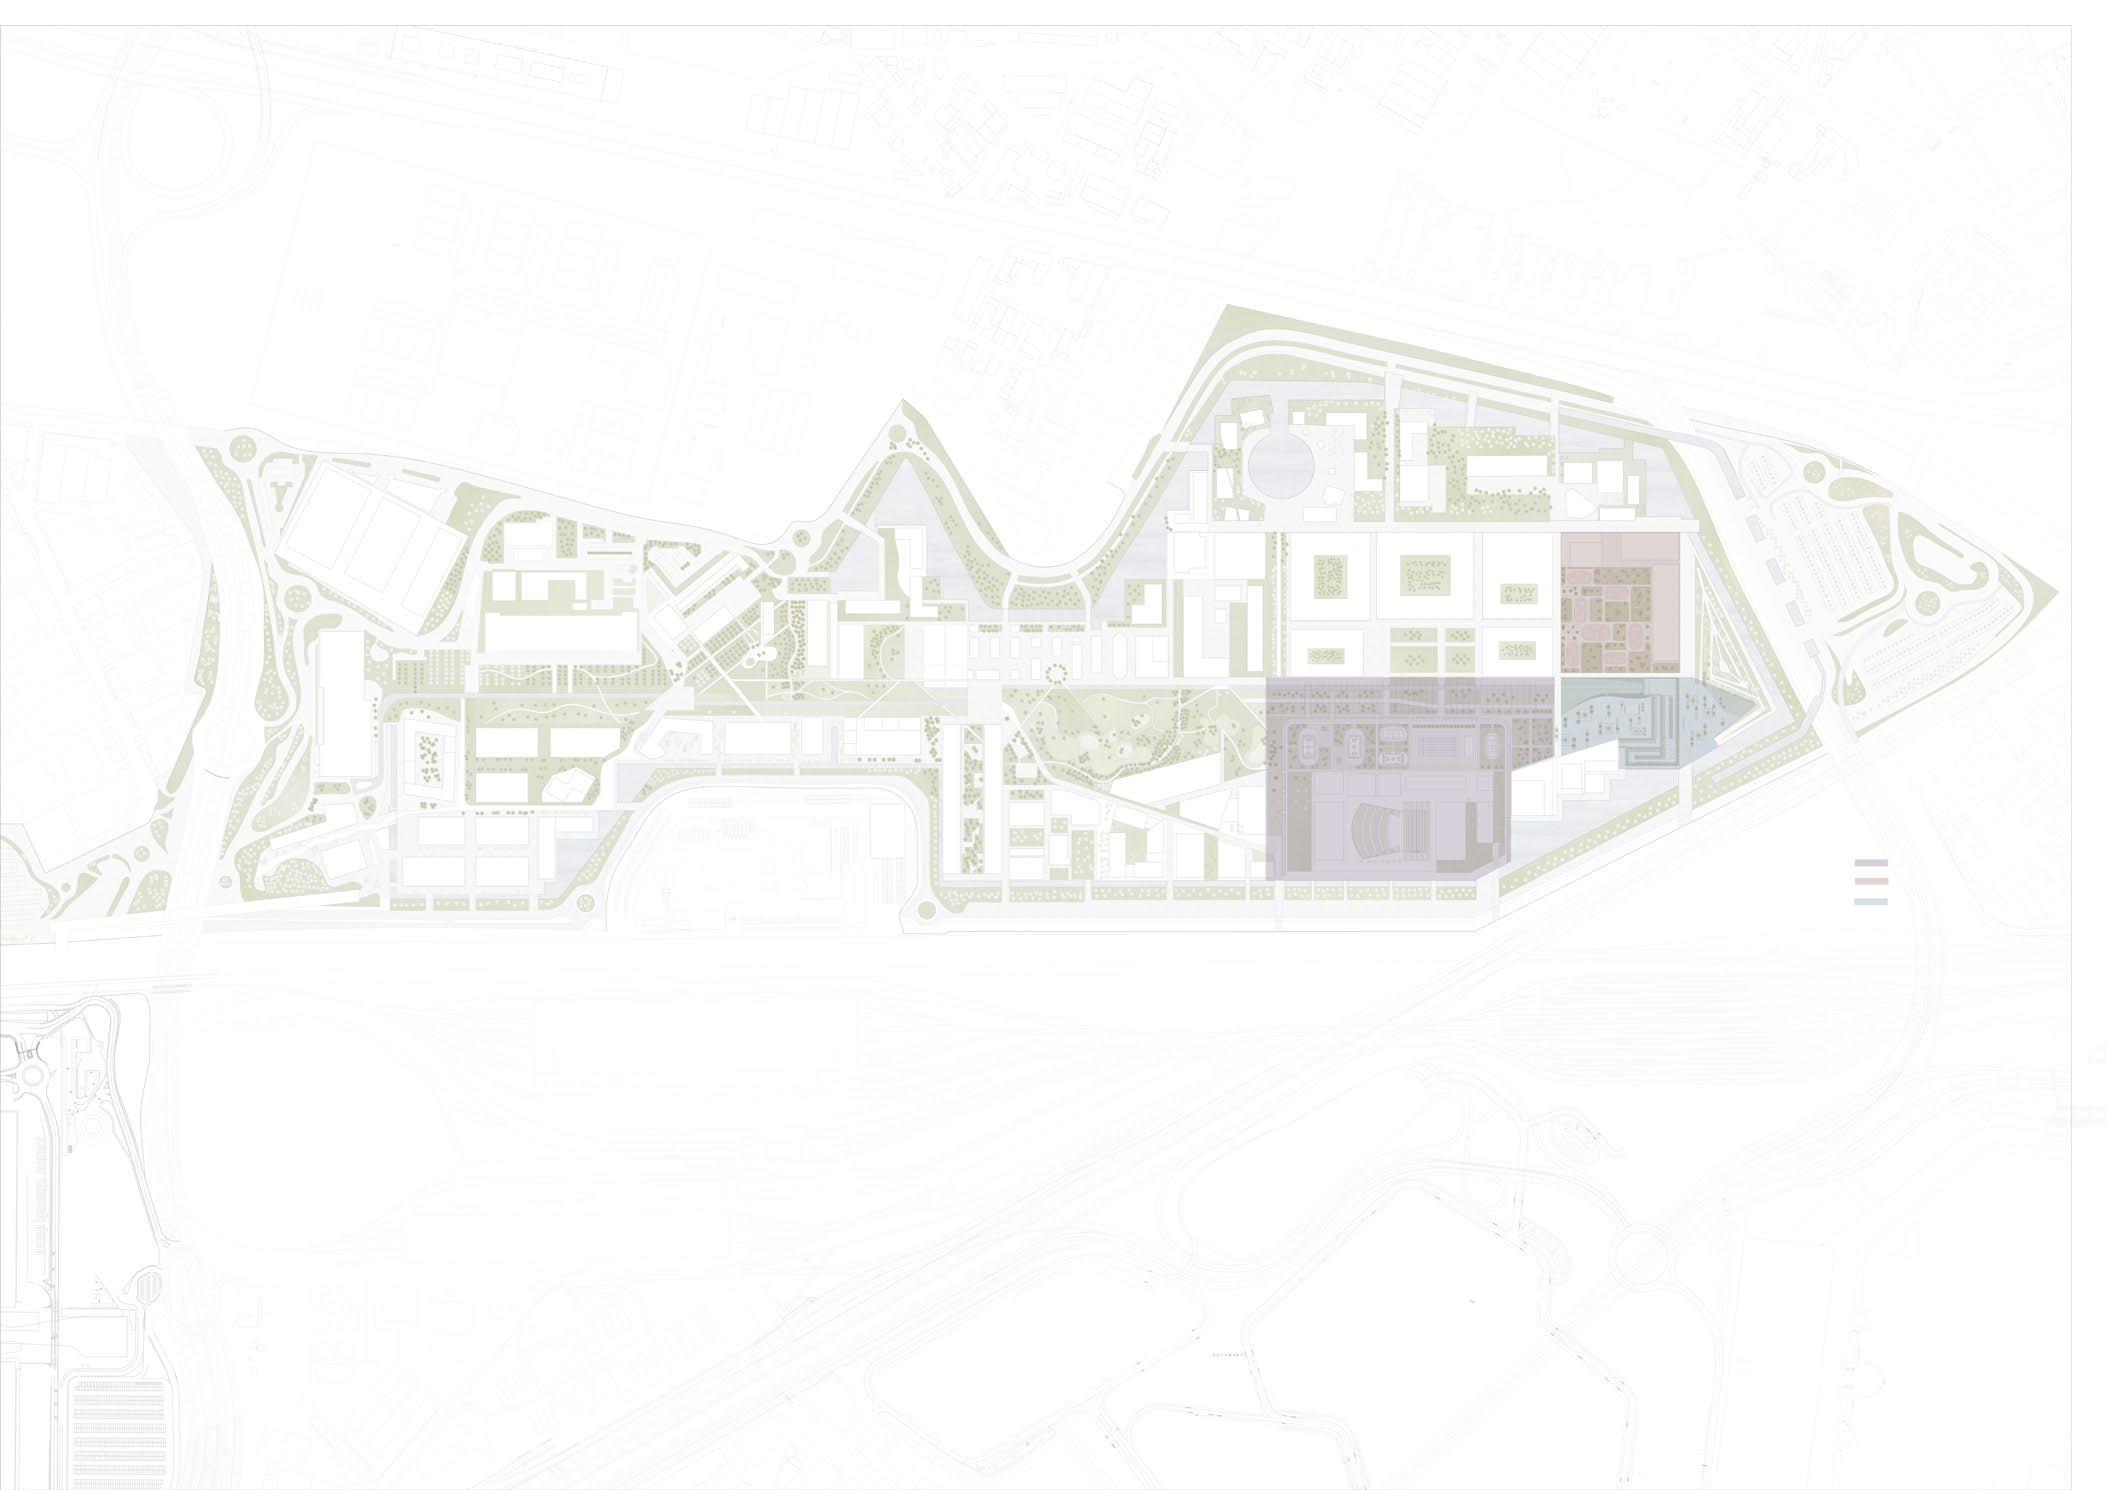
Fig 52: Zones, Master Plan, Authors Fig 53: View from sports area, Authors Fig 54: View from digital part, Authors
Master Plan
Fig 55: View from event space, Authors

36
Master Plan
Fig 56: Axonometry,Research Center for Natural Sciences, Authors
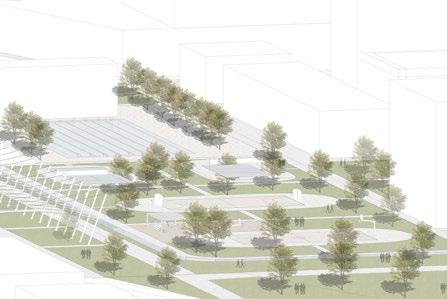
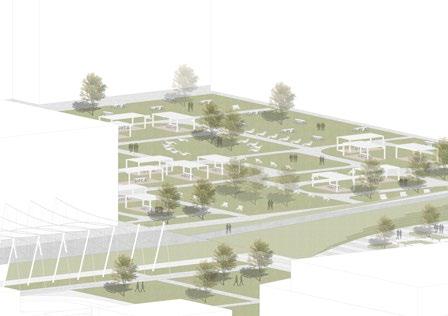
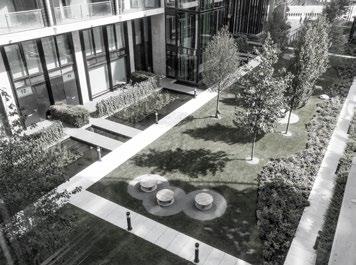
Digital park is located near the hill and northern part of the Research Center for Natural Sciences. Buildings surround the area, aiming to give consistency to the space. In the first phase, the horizontal grids are specified by considering UNIMI, and the vertical grids are placed. The area consists of study places, walking paths, and relaxing areas. The relaxing part is located in the center of the park, a design concept inspired by BAM Biblioteca Degli Alberi Milan. These places are multifunctional, people can exhibit their digital artwork.The working spaces are made from wooden pavement to provide a warm atmosphere, and the other parts combine with concrete and greenery. Trees are encountered all around the area to provide privacy.
The area is located at the intersection of UNIMI and the Research Lab for Natural Sciences.It consists of a basketball court, tennis courts, an open swimming pool, a running track, and indoor facilities. The primary design concept was dividing the horizontal space into grids, and these grids connect to the main backbone,decumano. These grids are called walking paths and turn into the bridge when the water exists. The water covers the zone with a running track; it is one main partition element. Sport is one of the significant activities that connect people. They could socialize and change their atmosphere at work. However, to provide this, it was essential to give this place privacy, so when people come there, they should feel free. As a solution, trees and high vegetation are used as a filtering element, especially from the university. Mainly five elements are used during the design of the finishes. The area predominantly consists of greenery. The swimming pool has ceramic tiles for outdoor gym areas and a running track made from rubber. Tennis courts are assembled from asphalt, the walking paths are made of stone, and bridges consist of wooden pavement.

The event space is the place where the project proposes itself and welcomes people. It is located in front and back of the building and connects this zone until the end of the hill. The ramp is a natural border of this space and partially covers the space. The event space is placed where the open Amphi is, one of the central parts of the project. Considering the ground floor open dining areas close to the restaurant, which has separate entry.

The area was designed with vertical geometry combined with squares and rectangles. These geometric portions are like small meeting zones with trees and greenery. Mainly stone material is used, and it is combined with greenery in some parts. The aim of having trees at that part is to have natural shading while people are disbursing time there.

Fig 57: Digital
Master Plan,
Fig 58:
Fig 59: Event area, Master Plan, Authors
Park,
Authors
Sport Facilities, Master Plan, Authors
Master Plan
Event space
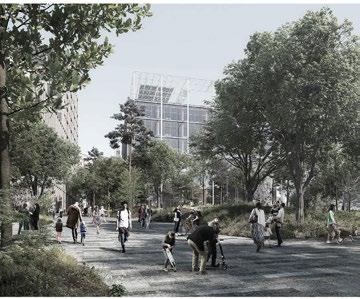
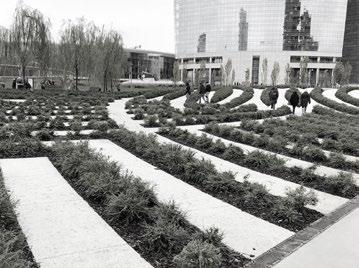
`A community-connecting new park is advancing universal accessibility and ecological restoration. `The linear park is one of the largest urban open spaces and acts as a walkable green corridor connecting otherwise separate green space and integrating with surrounding.
Decumano, Linear Park
Its combination of poetic form, cultural expression and ecological restoration creates a multi-dimensional experience that many generations will enjoy. A solid commitment to improving the ecological system and a people-oriented spirit is manifested in design details.
One of them is universal accessibility on all pathways. These native plantings support the local bio-community and efficient reuse of existing materials and on-site facilities. Its vertical grid pavement design with greenery was passionate for the design of the event space ( zone 3 ) at the Research Center for Natural Sciences.
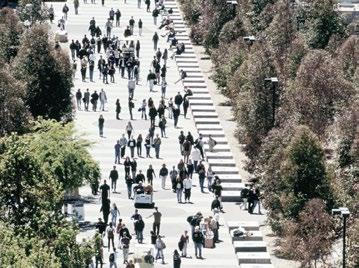
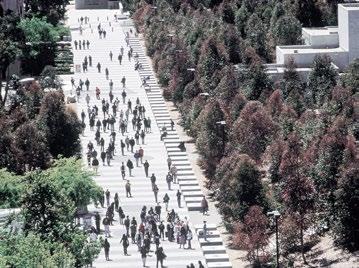
The project of Library Walk, encountered at the University of California, San Diego Campus, is a pedestrian walking path that runs through the heart of the studentservices buildings and concludes at Geisel Library.
The promenade provides much-needed structure and a key pedestrian link to a loosely planned and sprawling campus. The walk to be multi-functional, a location for campus gatherings and fairs throughout the year.
During the design process of Decumano and its side green parks, the design ideology is based on Library Walk`s concept. The linear Path continues with trees and vegetation to give a sense the walking in the park.
38 references
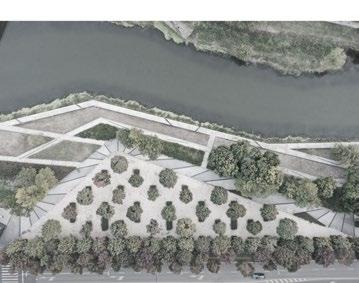
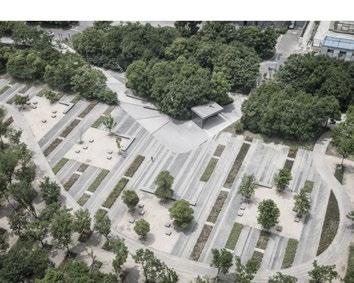
Jiading Central Park, Sasaki, 2013, Shanghai, China
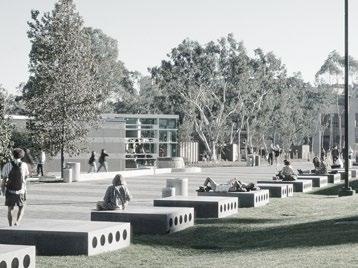
Library Walk University of California, PWP Landscape Architecture, 1995, San Diego, CA
Fig 61: Waterfront, Sasaki
Fig 62: Open space, Sasaki
Fig 60: Park, Sasaki
Fig 63: Library Walk, PWP
Fig 64: Library Walk, PWP
Fig 65: Library Walk, PWP
References
Walkpaths - Water - Sports area
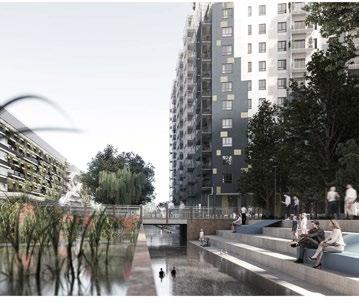
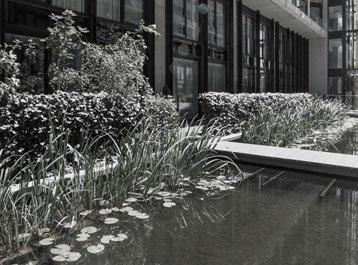
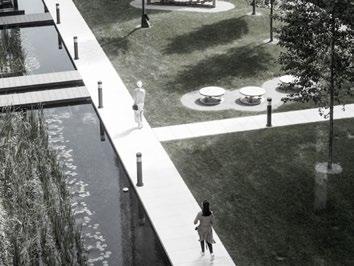
The Riverlight project located at the London,UK and built in 2016.It is landscape development of the residential project designed by Rogers Stirk Harbour Partners One of the inspirational concepts for our design was a river walk.
Digital Park- Relaxing areas
It is slightly raised to allow views over the river wall to the Thames — which opens up a stretch of previously underused waterfront. It was a connection between Research Center for Natural Science`s walking paths near the water.
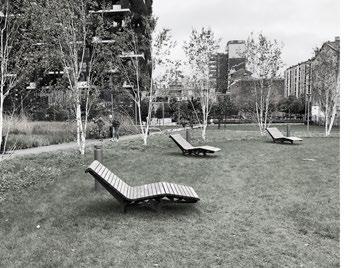
`Gillespies’ designs have captured the particular character of these bodies of still water in a series of contemporary water gardens that sit within the residential gardens`
The park is located around Porta Garibaldi Station. The park works as an urban connector and botanical garden. Paths are drawn from different areas around the site, assembling a grid of relations that overlap and intersect.
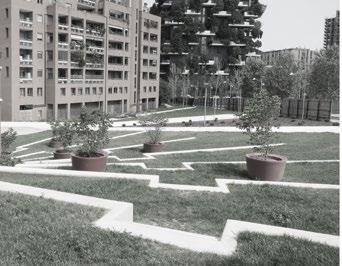
Routes, jointly with the irregular fields that are created in between, underlying traffic tunnels, create sound walls.Vegetations have been chosen specifically to be consistent with the site by considering its conditions.
The concept of the open spaces, creating a tree library inspired during the design not only the digital park but also the complete master plan. Especially the relaxing zones have wooden sunbaths surrounded by trees parallel the BAM`s tree library.
39
Riverlight, Rogers Stirk Harbour + Partners,2018, London,UK
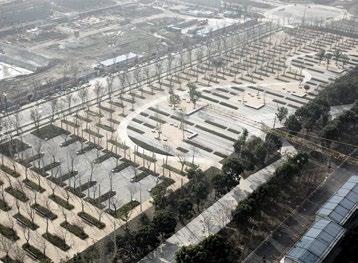
BAM Biblioteca Degli Alberi Milan, Inside | Outside Petra Blaisse, 2013-2018, Milan, Italy
Fig 66: Waterfront, Rogers Stirk Harbour Partners
Fig 67: Yard, Rogers Stirk Harbour Partners
Fig 68: Waterfront, Rogers Stirk Harbour Partners
Fig 69: Relaxing area,InsideOutside
Fig 70: Park,InsideOutside
Fig 71: Nature Park,InsideOutside
References
40
building design

3
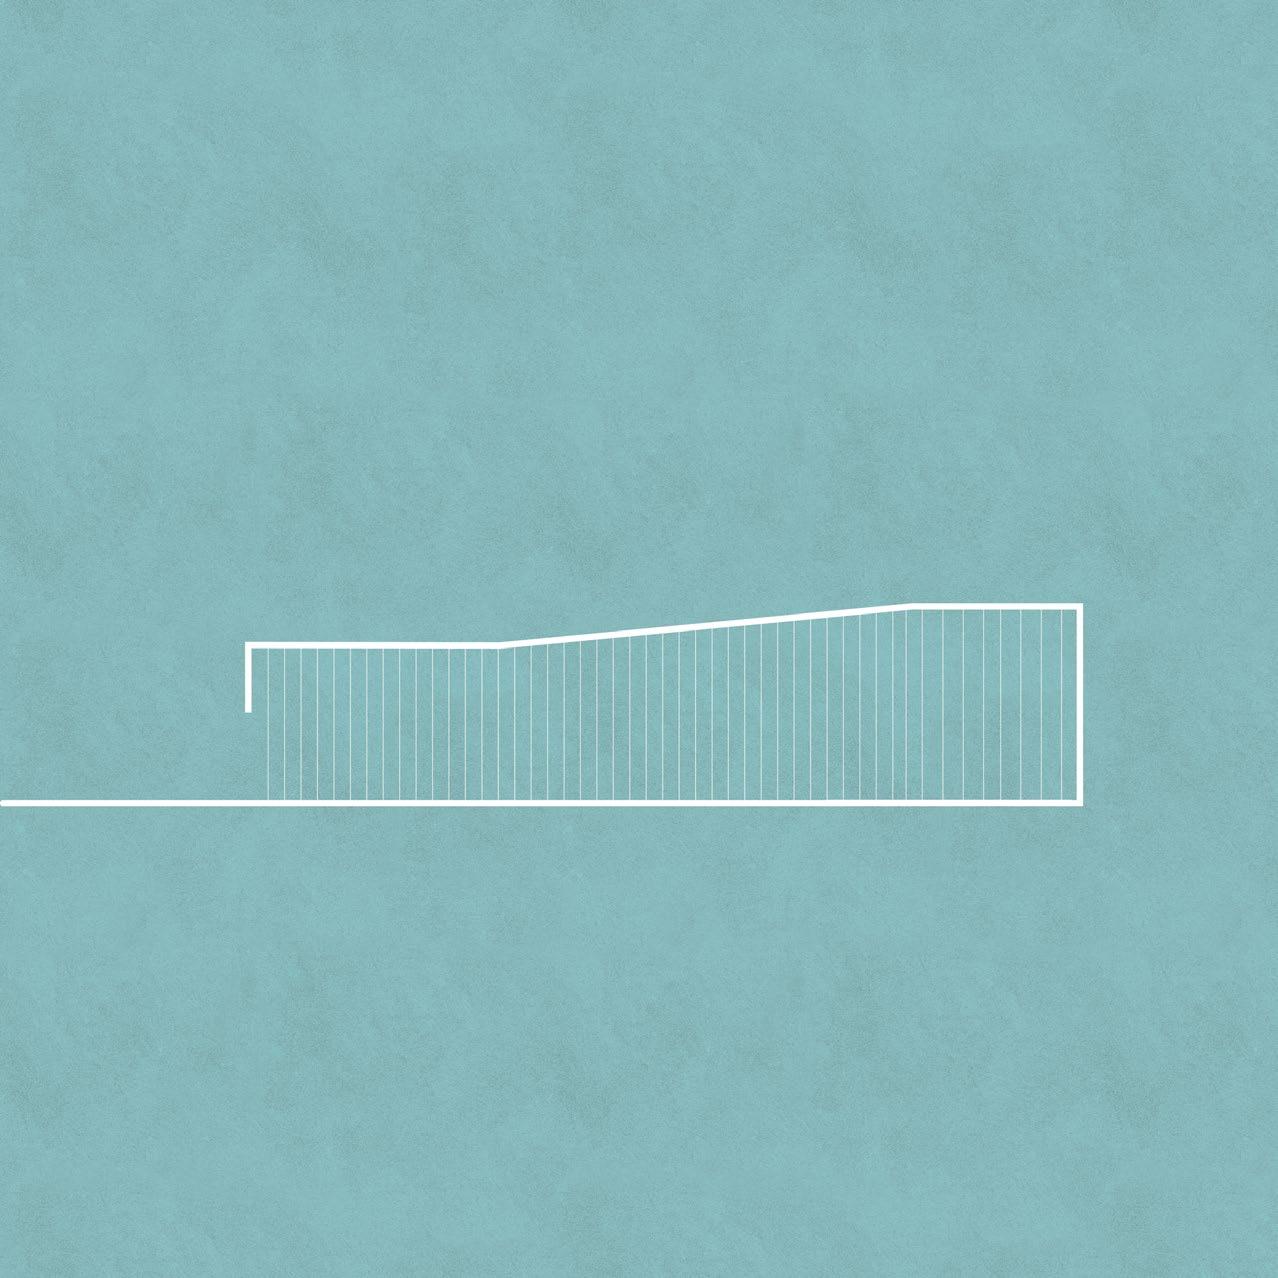
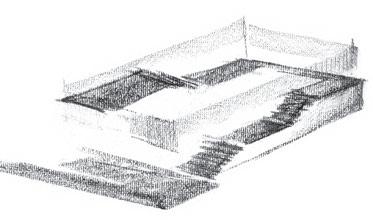
The morphology of the research center has been derived from the transformation of the surrounding context. It has been conceptualized as a series of inclined roofs that sought to morph the landscape into an inclined promenade.
Fig 72: Morphology diagram, Authors
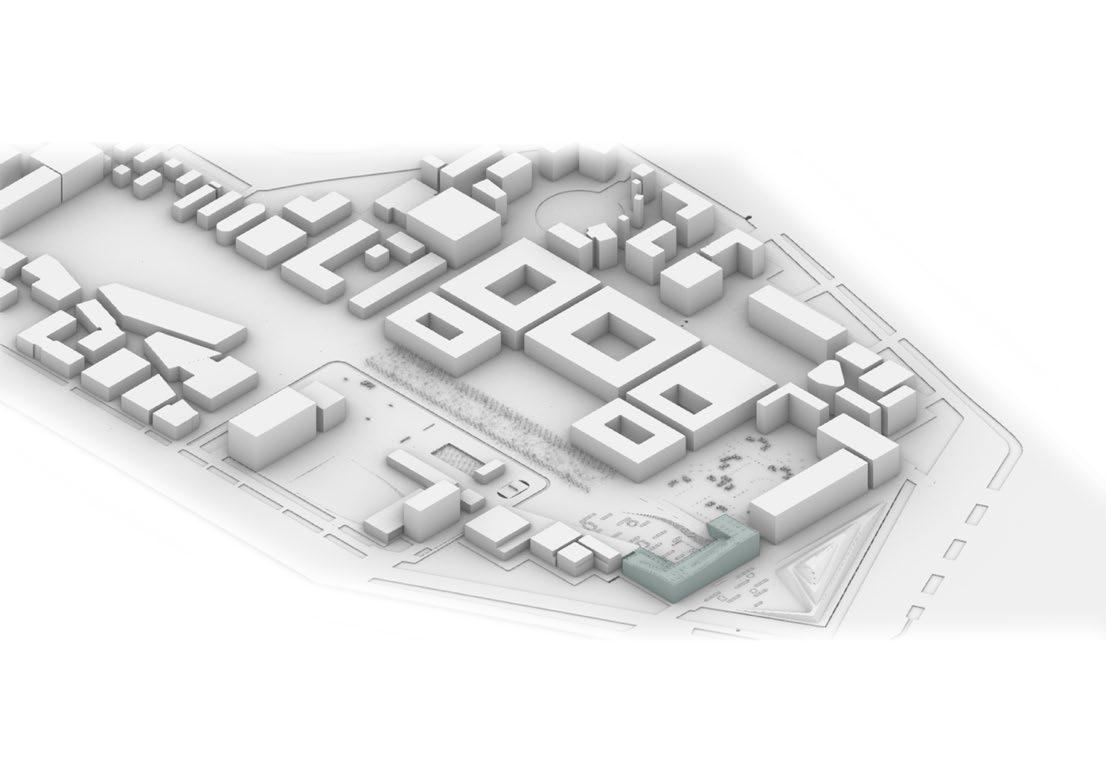
The boundaries of the volume are determined through the alignments with the predefined edges of the site. As a consequence, the new generated mass consists of a main body stretched along the new borderline fronting the sports park in the west, as well as two
5. 8. morphology
6. 9.
42 Morphology
wings positioned in the north and south. The alignment with the decumano on one side and the bridging with the contextual buildings along the waterfront, in the south, further emphasizes the concept of creating an enclosed space, as well as a visual end to the park. 1. 2. 3. 4. 7.
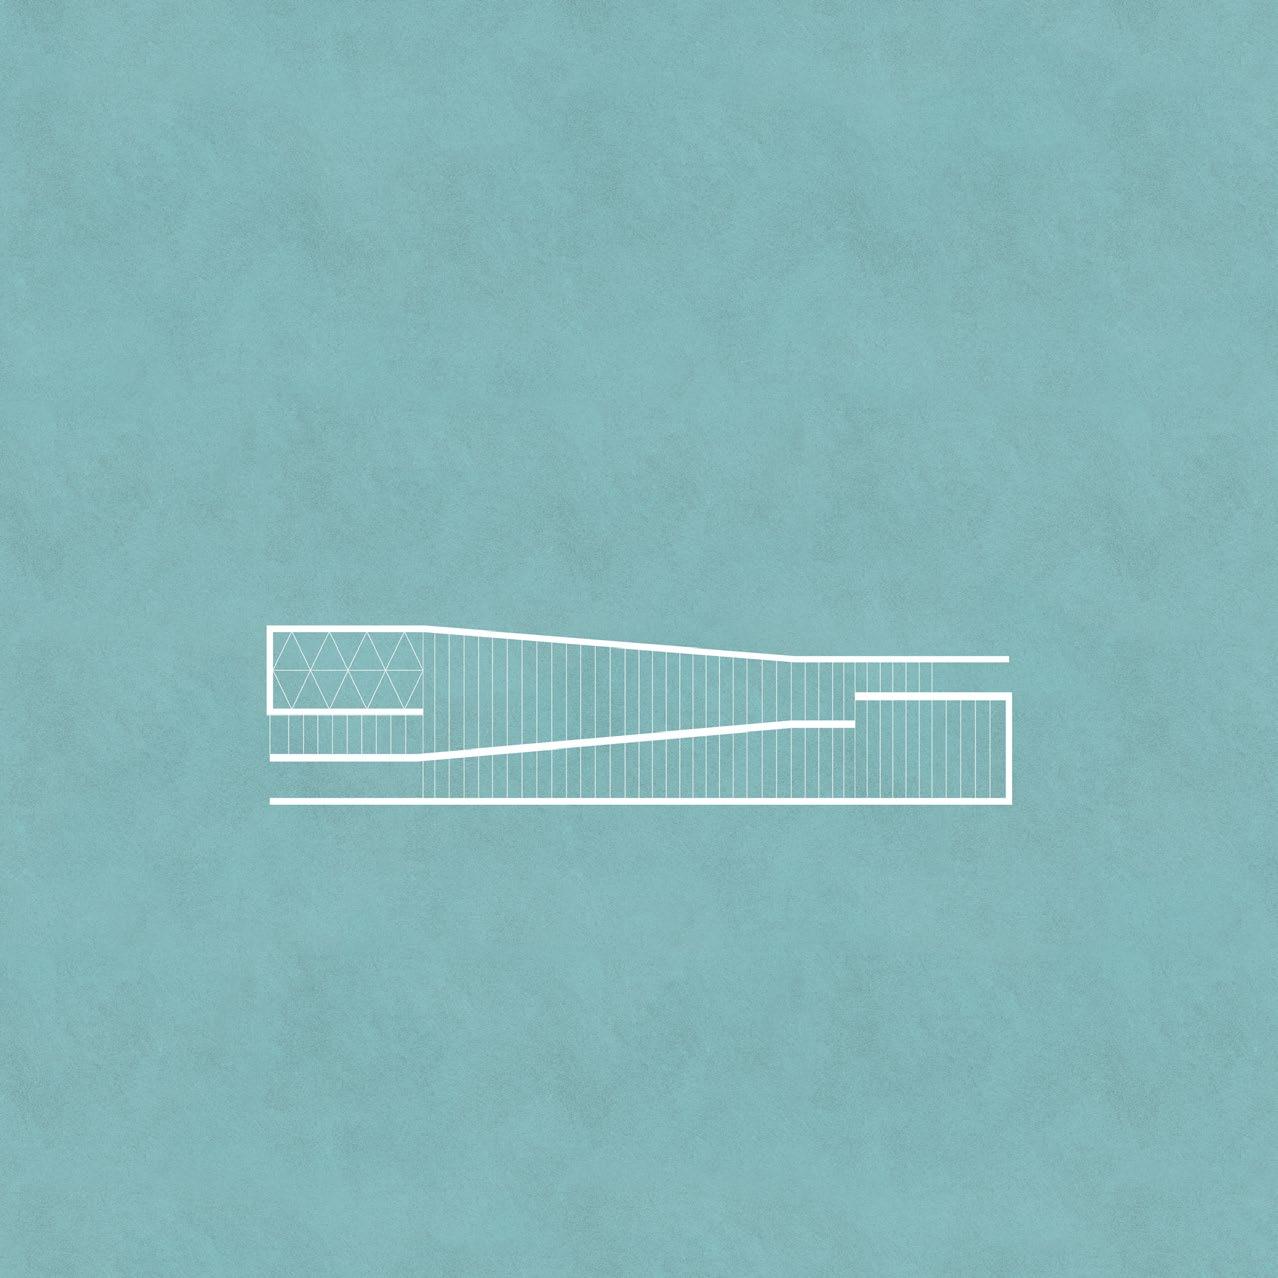
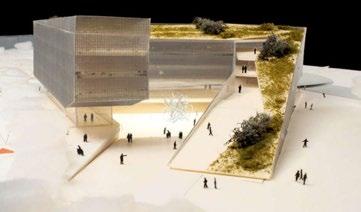
In addition to the aforesaid configuration and the concept of the inclined promenade, we sought to divide the building block into two main components; an inner volume which shapes the enclosed piazza, as well as an outer one which preserves the relationship with the external gateway and the hill.
Simultaneously, these components ought to express a sense of movement as well as to integrate the concept of the inclined promenade. Such an action is provided through the division of the volumes in a system of terraces positioned at different heights. Additionally, these emanating terraces are further interconnected through the use of inclined pathways.
The interconnection of levels through ramps and the introduction of terraces is aimed at giving the building more dynamism. The inclined promenade has a large effect on the overall result of the facade.
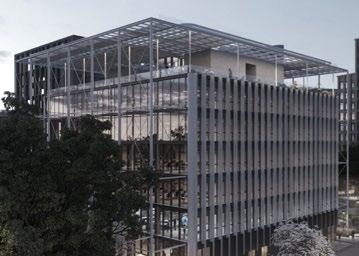
The system of paths generated can be seen as a crowning of the building mass, the conclusion of which is reached through a final overhanging volume. Although this cantilever is a peculiar addition to the overall composition of the building, it can be viewed as a contrasting element that stretches out and pivots the attention back at the site.
As a consequence, the aforementioned configuration of the building volume proved to have a large effect in the quality of the interior. The utilization of terraces as junction points was further developed throught the division of the upper wide ramps into 2 equal spans. The expansion of the terraces established connections between the external environment and the interior coworking spaces, as well as new access points to the building.
43 Morphology
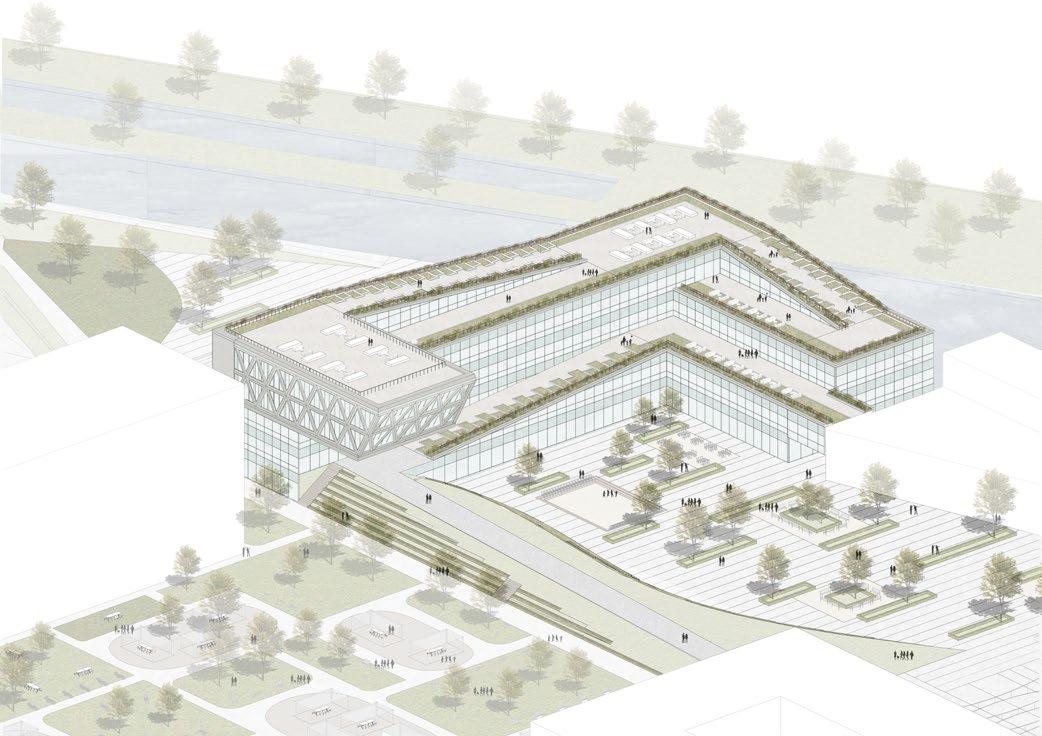
Fig 73: Axonometry
44
Morphology
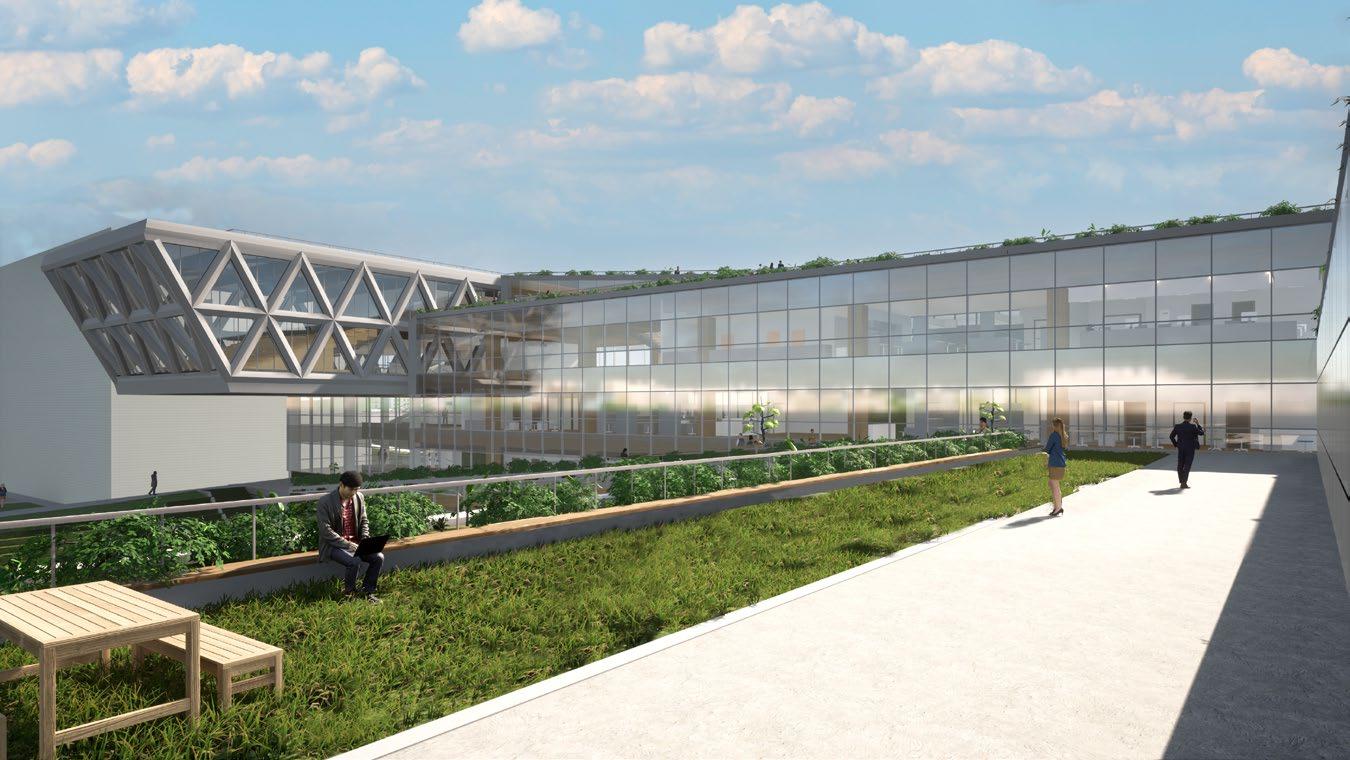
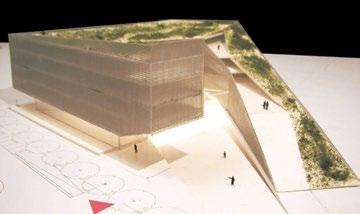
Fig 74: Exterior Render
The continuation of the park and its translation into the green sloped roof had an indespensable importance for the project. As a consequence, the circulation created through this process generates a better relationship between the existing project and the new research center. The system of terraces previously described allows for different access points to the building.
Simultaneously, it offers a brand new external envirnoment that elicits new sensational viewpoints of the project site. However, not all parts of the roof are designed to be completely accessible. In the diagram adjacently represented, a distinction is marked between 3 separate areas. The first one highlighted in red is the public portion of the building. It creates accessibility through the ground and the first floor of the building.
Notwithstanding, it also builds a connecting point with the terrace of the public building on the eastern side of the research center.
The second set of ramps that lead to the top of the cantilever generate a number of terraces with a semi-public functionality. Lastly, the portion represented in blue gives restricted access only to the scientist or the university professors working in the laboratories.
45
Fig 75: Accessibility, Authors Fig 76: Accessibility, Authors
circulation Circulation
Fourth Floor
Conference Outdoor Gathering
Second Floor
GROUND FLOOR
Collective Working
Eating Studying
functional distribution
Technical Facilities
Storage
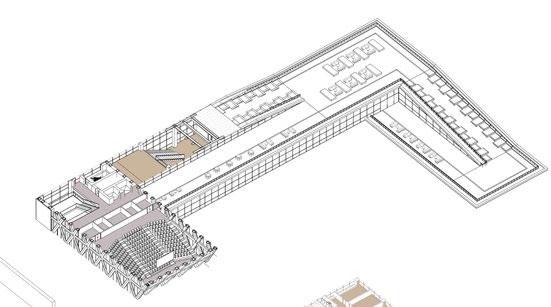
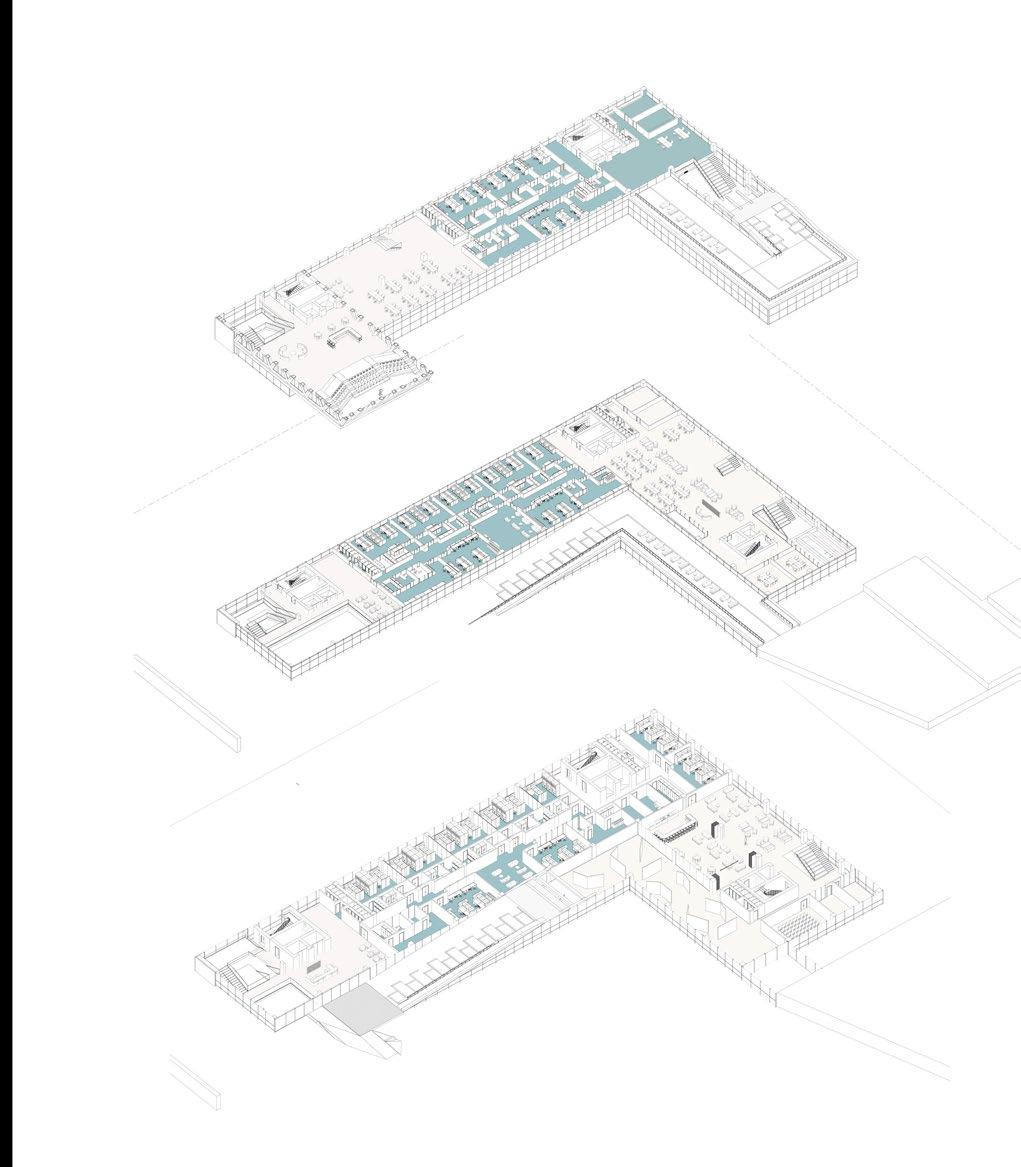
Fig 77: Exploded Axonometry, Authors
46
Functional Distribution
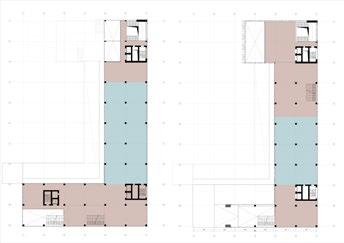
Underground Floor First Floor
The underground floor is created mostly as a technical space for all the mechanical equipment that have to be provided for the building to work properly. Alongside this, it serves also as an accessible parking space for large vehicles needed to transport the machinery
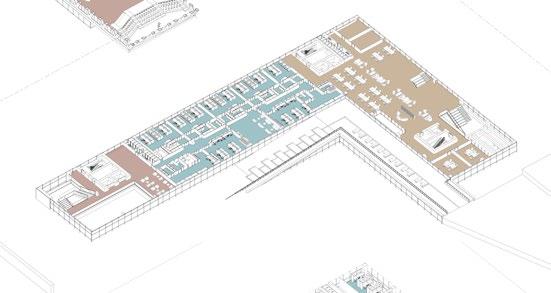
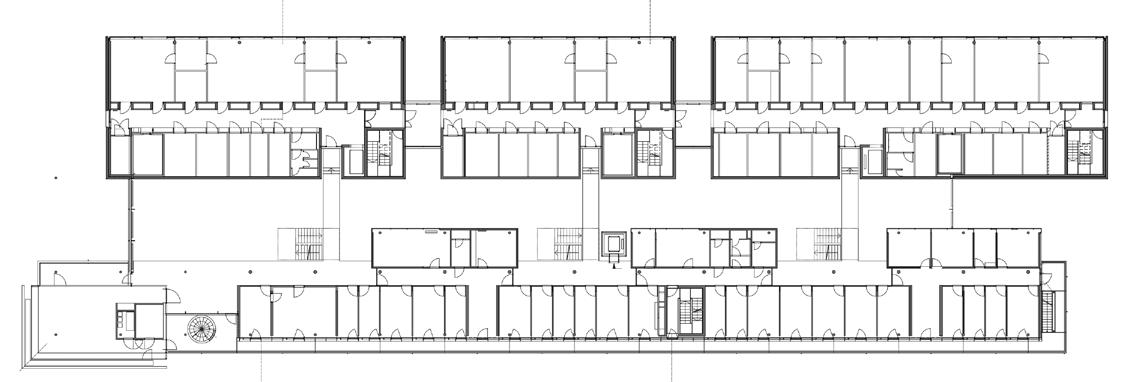
The first floor is dedicated to laboratories and exhibition rooms. The laboratories are arranged along the main body of the building. The units are connected together through a main enclosed corridor, which starts from the northern edge. The u-shaped staircase situated along the northern facade allows for vertical communication throughout all the floors of the building.
On the other side, the southern wing is occupied by a large exhibition space, which contains its own separate circulation.
Third Floor
In the third level the building area reduces even further. Connections with new terraces which lead to the sloped roof are created. A smaller encapsulated space remains at the center dedicated to research facilities just like in the other floors, while on the northern and southern sides, open private areas for working are provided.
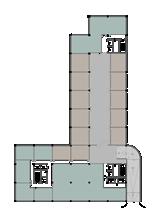
Fig 78: U.F. function layout
Authors
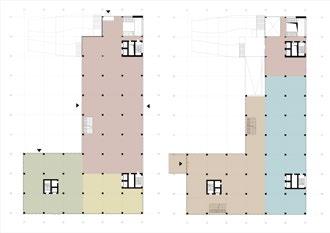
Ground Floor
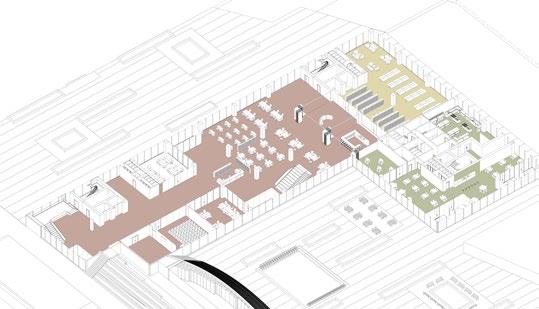
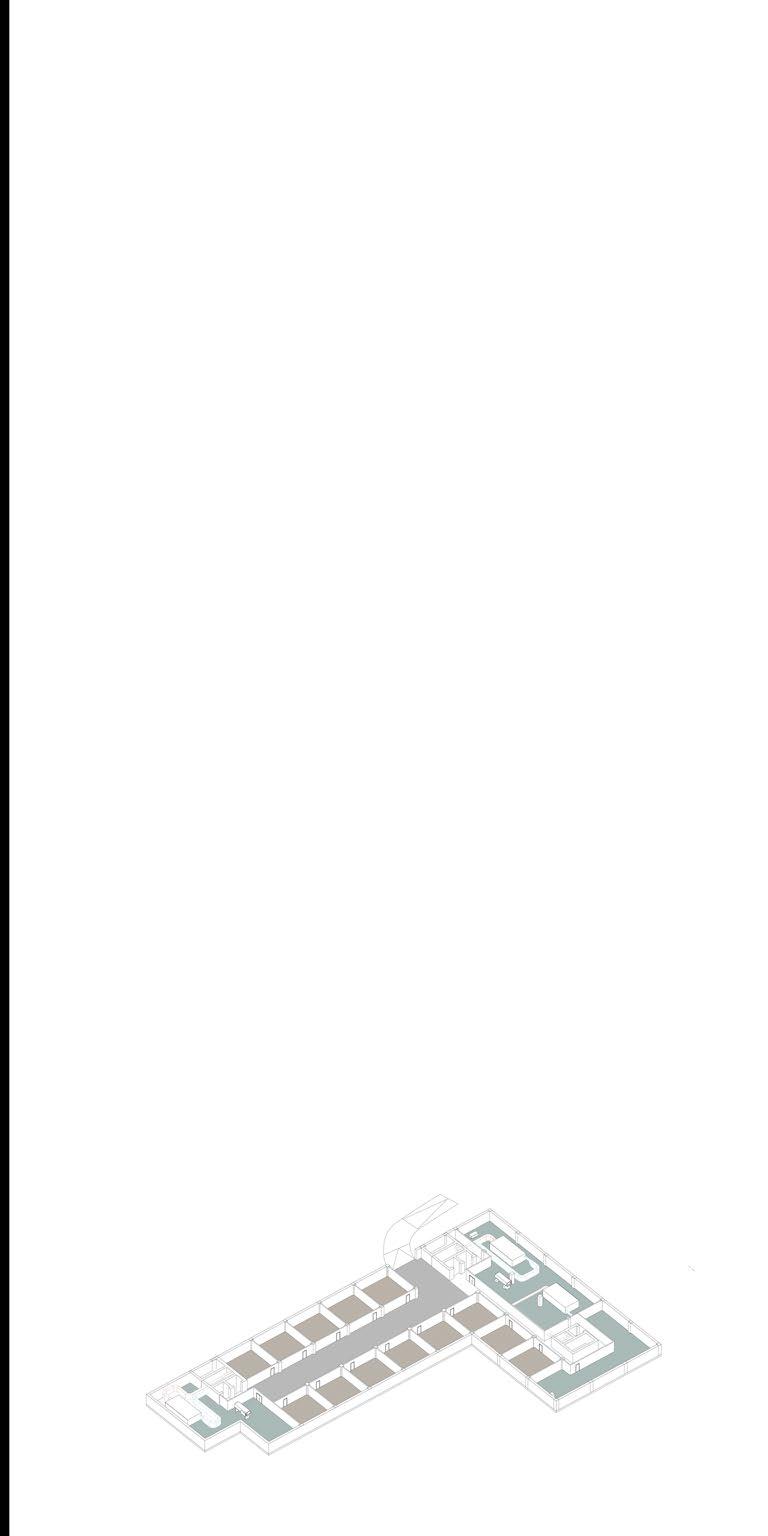
The Ground Floor of the research center is characterized by functions that are vastly open to the public. In addition to this, the transparent skin of the building, together with the large open area the ground level provides, gives a welcoming feeling to visitors, university professors, or any other person seeking a working space. The functions of this large space are divided as follows:
- Closed and open co-working spaces, and meeting areas.
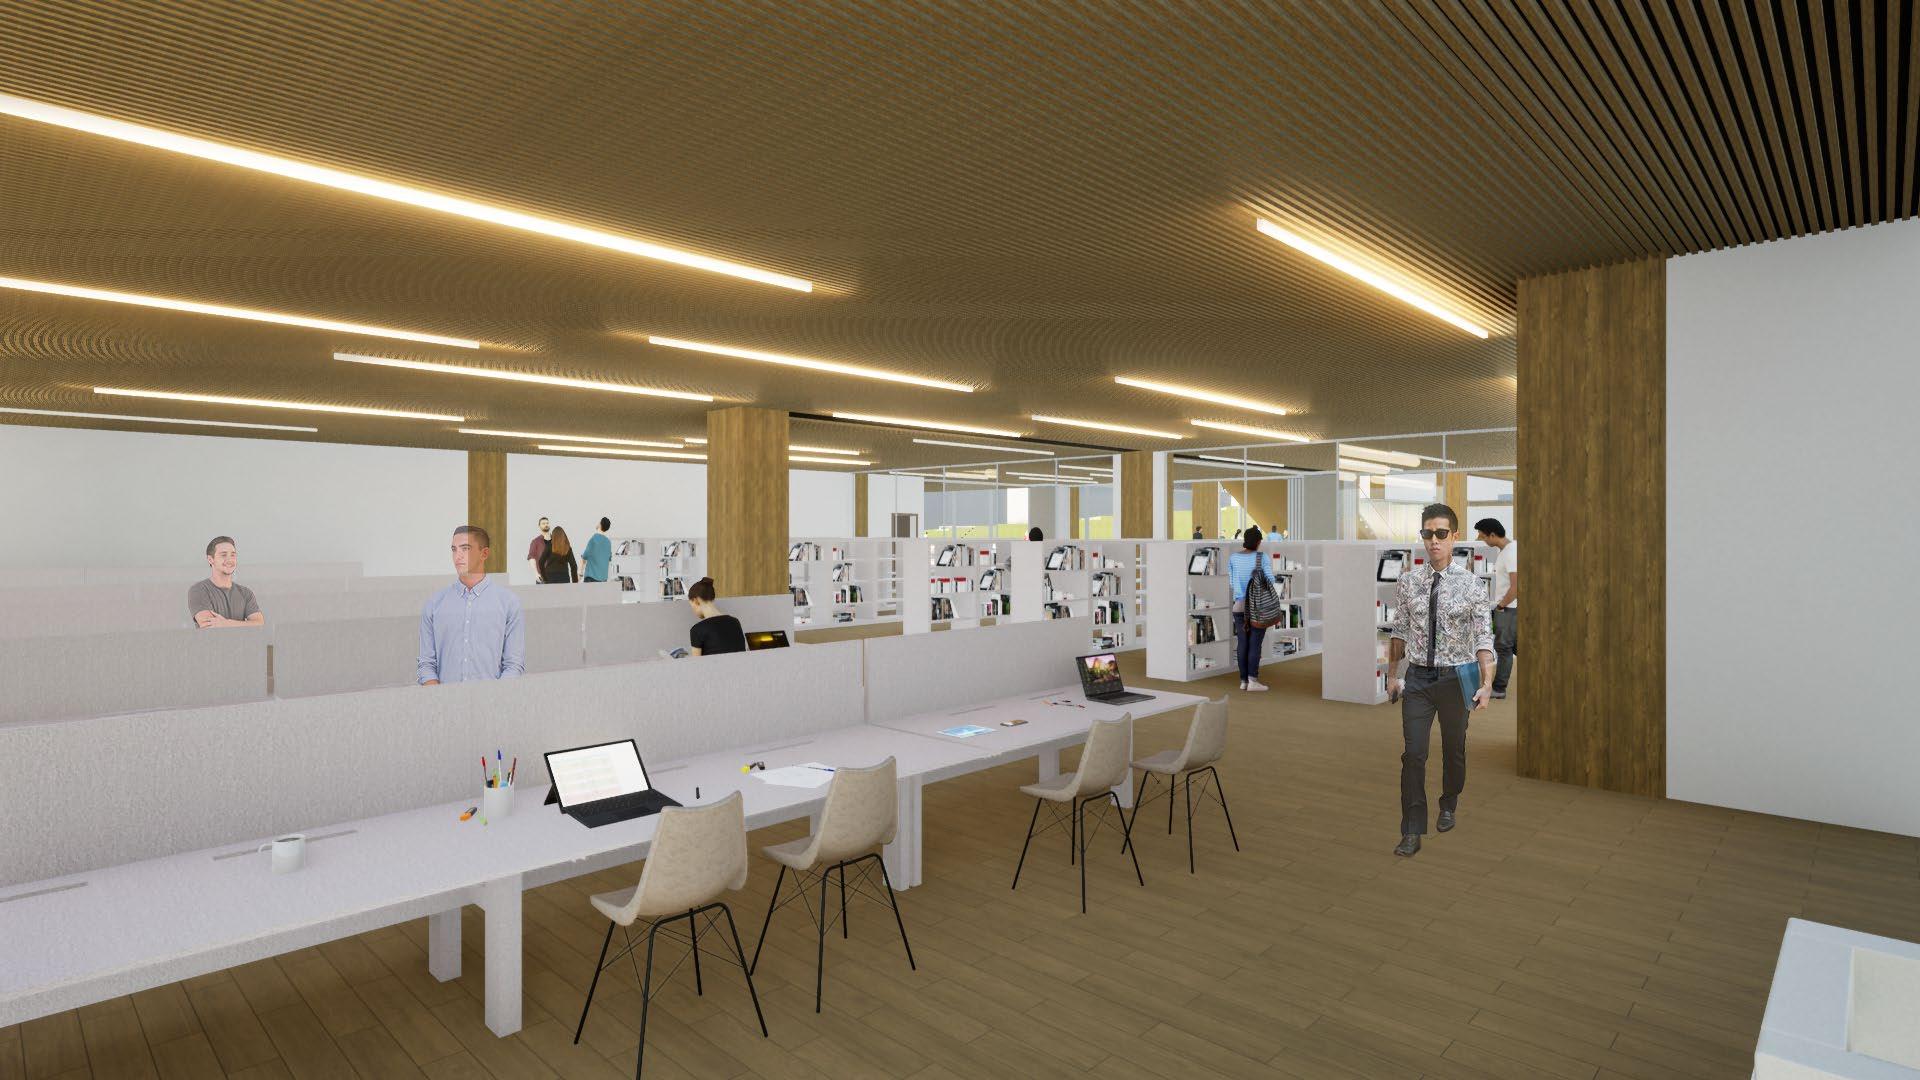
- A library and a reading area.
- Restaurants and cafes devoted to the public, workers, and researchers.
The co-working spaces are characterized by flexible lightweight walls, which are able to divide the area in several ways. This flexibility makes the plan more dynamic and adaptable to the people’s needs.
It is substantial to point out that this level is characterized by flexible walls in the laboratories as well as the exhibition area similar to the previous floor.
Lastly a final vertical connection is provided from the working space to the above terrace, which further leads to the final terrace of the building.
Fig 79: G.F. function layout, Authors
Fig 80: First Floor function layout, Authors
Second Floor
The logic used for the layout of the building plan becomes more apparent since a repeating pattern comes to our attention.
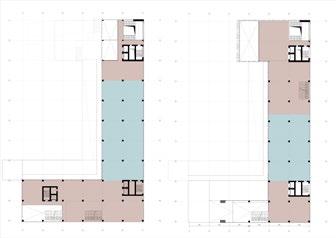

In this floor a similar arrangement of laboratories covers the main body of the edifice. However in the southern wing we notice a reduction of area due to the inclined green roof. From this external terrace, an additional entrance is provided to the building. The area accessed through this entrance is dedicated to co-working spaces.
Fig 82: function layout Authors
Fourth Floor
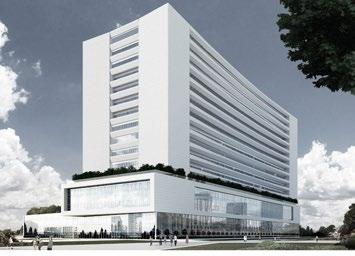
The particular features of the last floor stand in its materiality and morphology. On top of that, there is a distinction also in terms of functionality in regard to the other parts of the building. The large auditorium creates a detached space from the rest of the building which serves as a common event space. It stands at the peak height of the project and thus it gives a fascinating panorama of the whole MIND area to the visitor.
S.F. function layout
Th. F. function layout
47
Functional Distribution
Fig 84: Perspective of the recreational area Authors
48
Functional Distribution
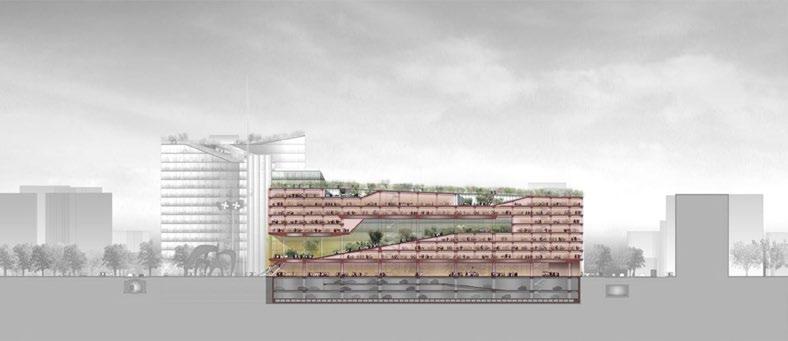
Fig 85: Section A-A, Authors
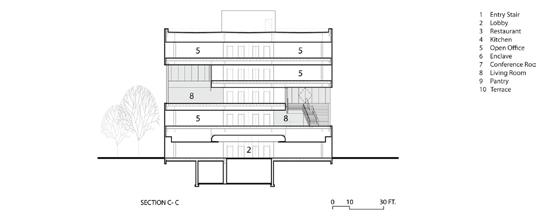
Fig 86: Section C-C, Authors
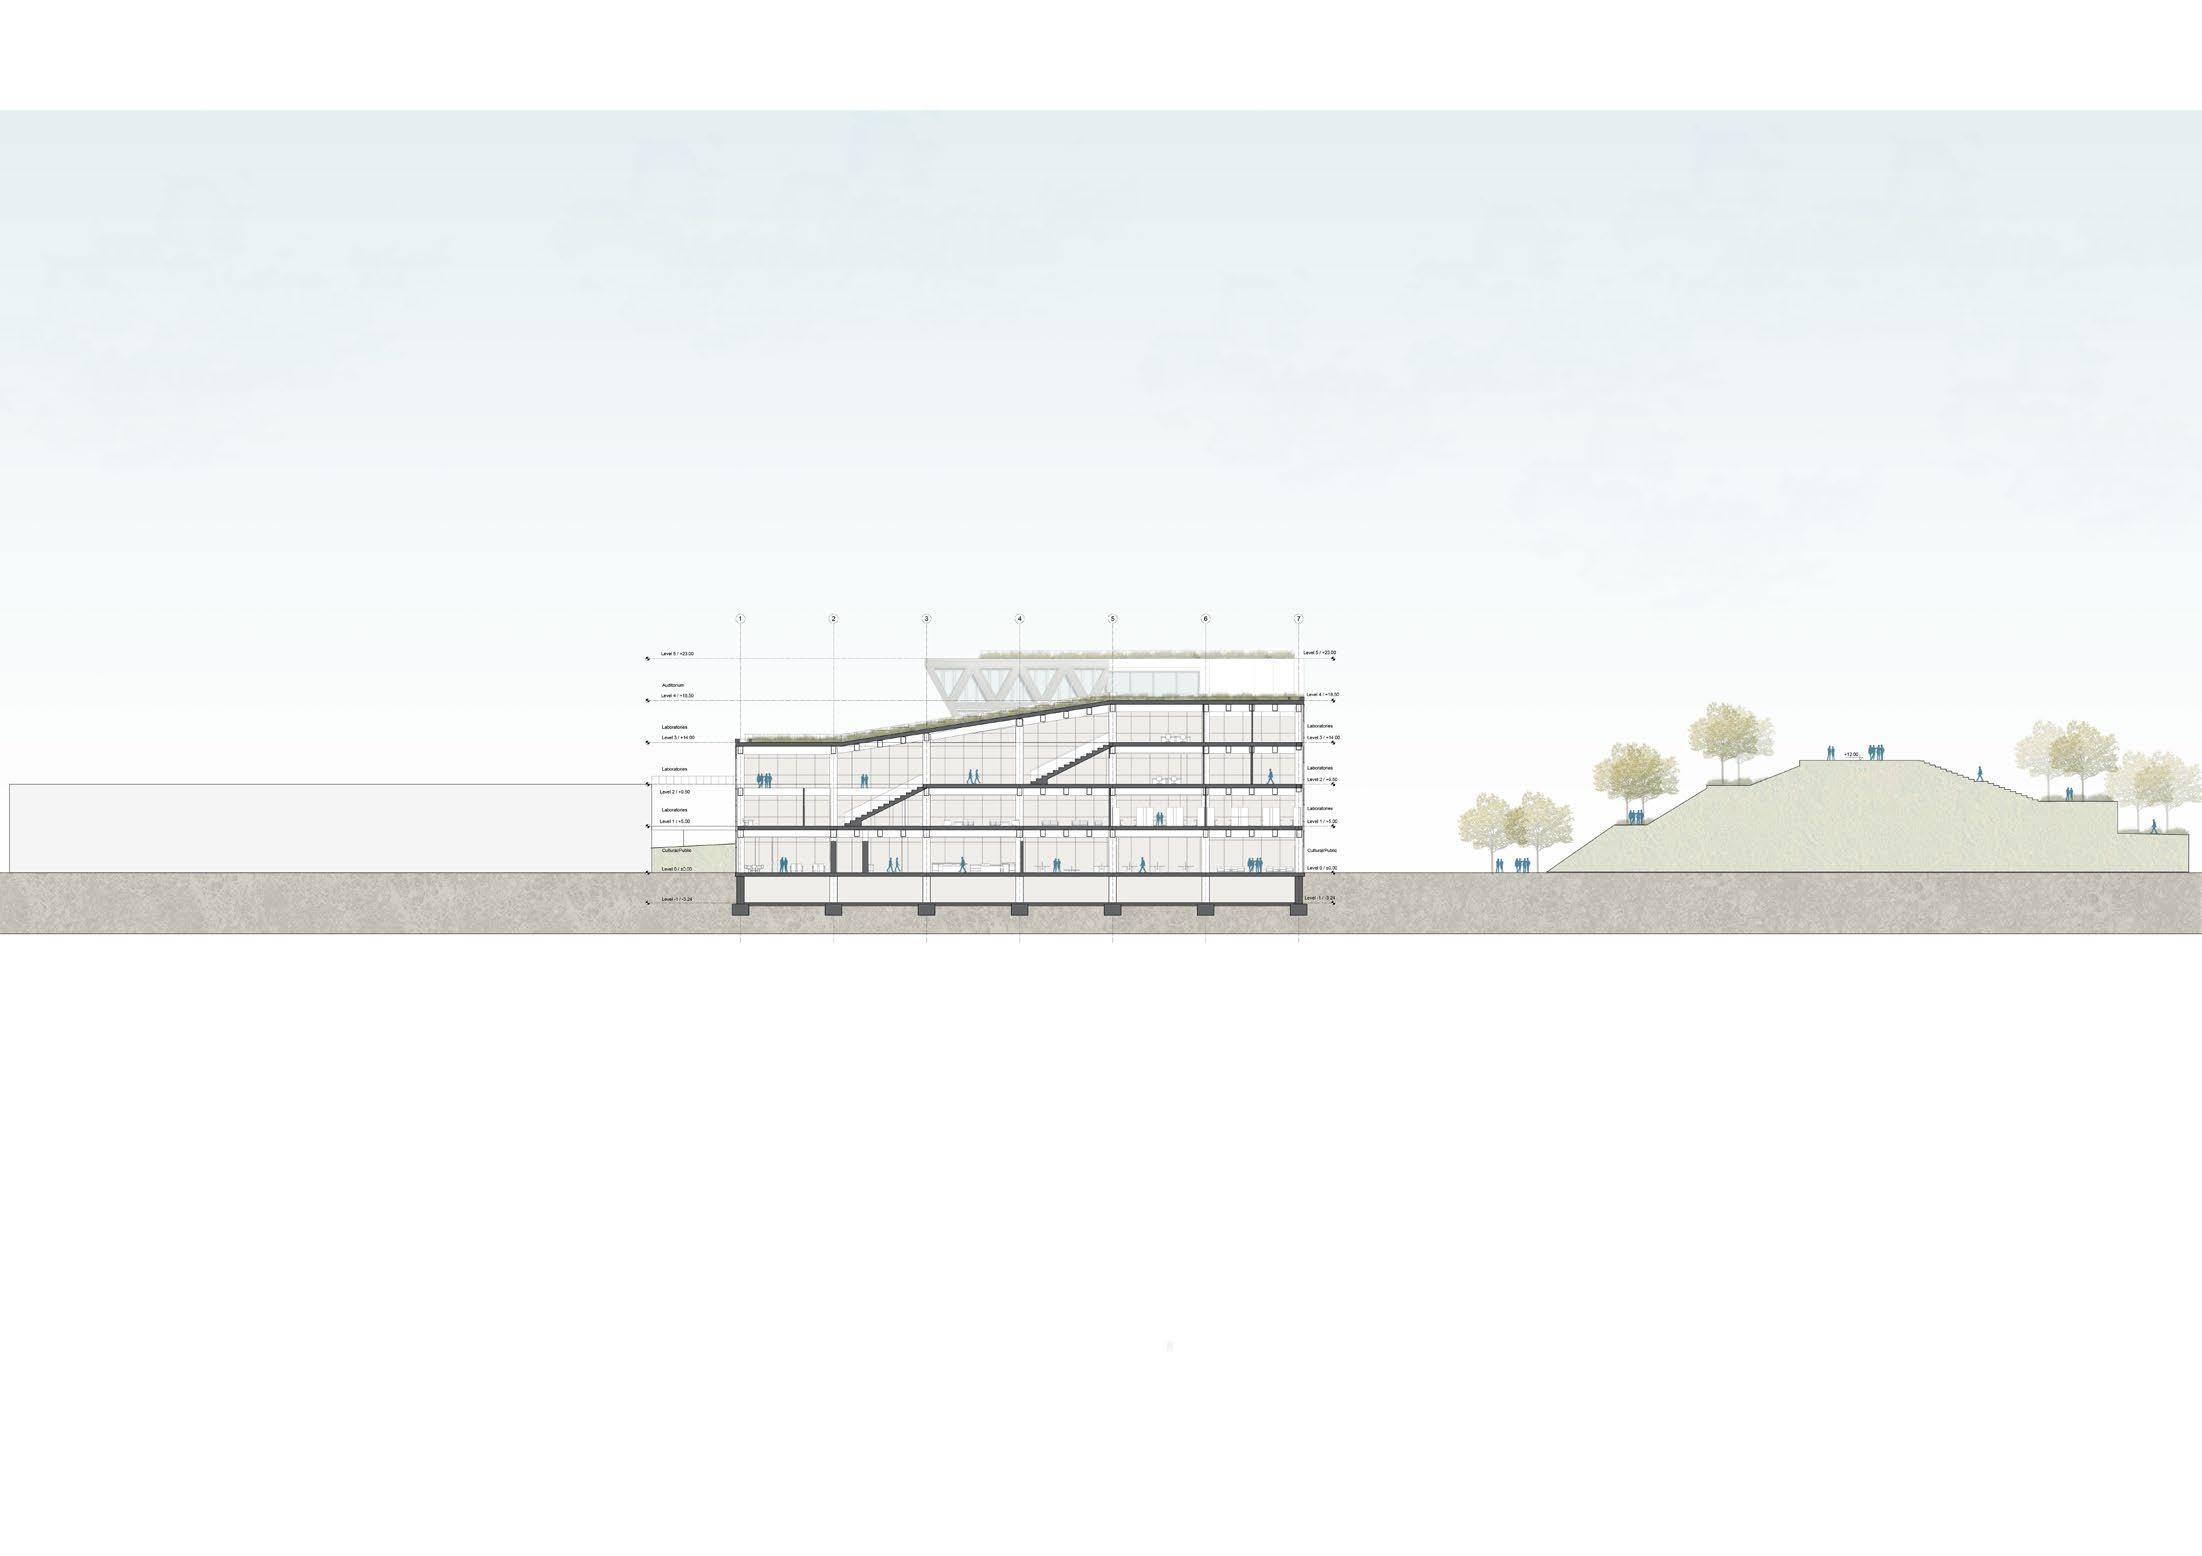
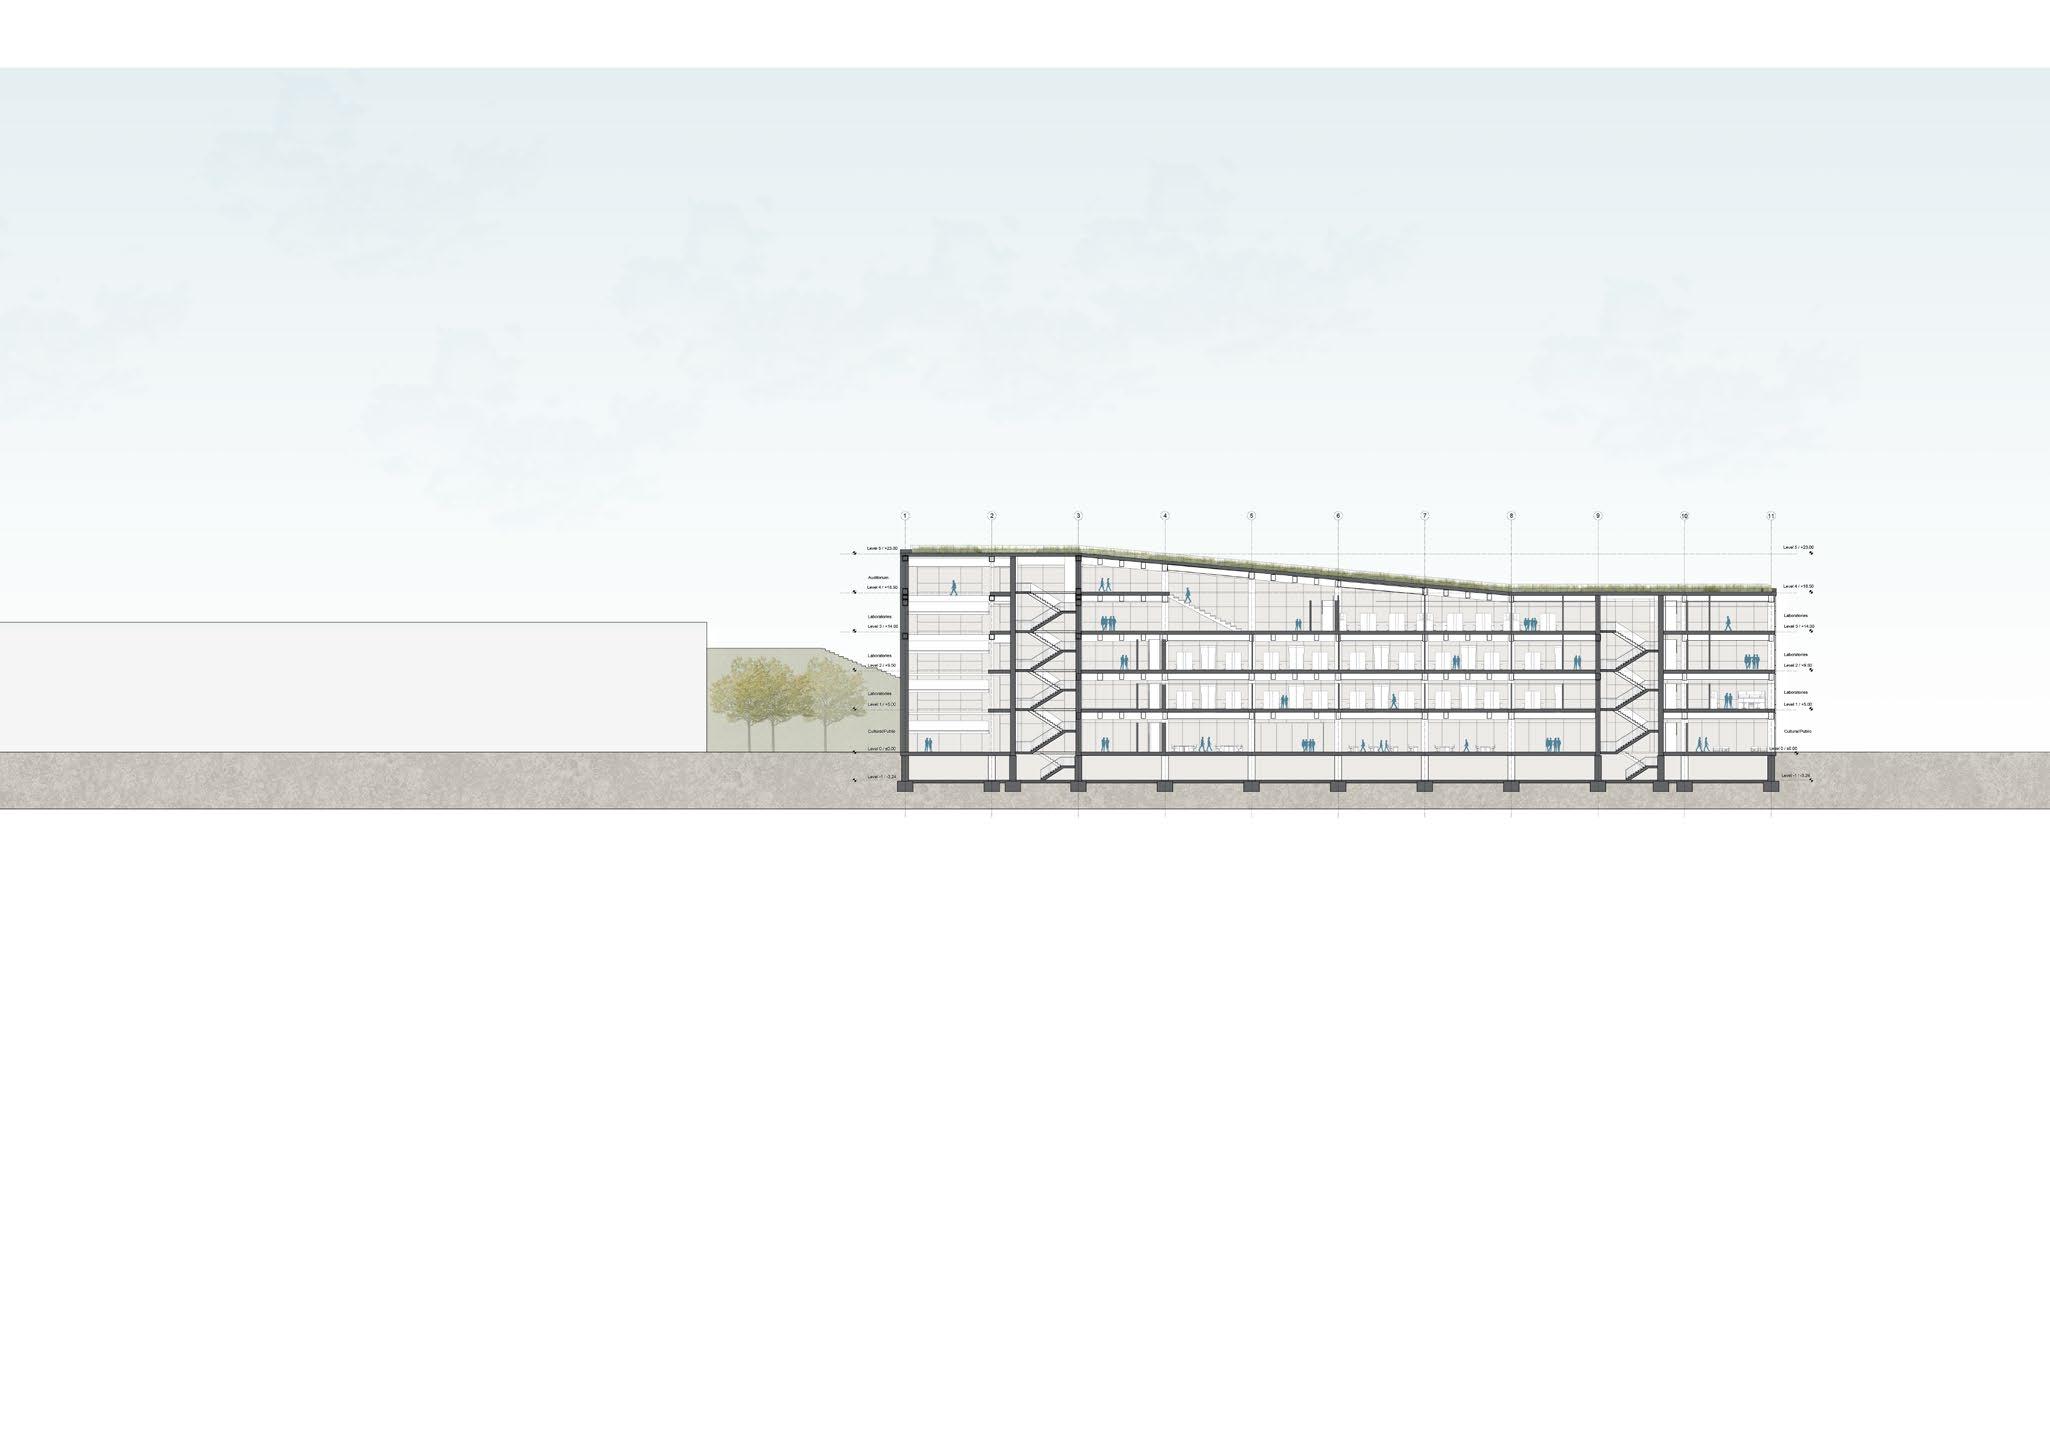
Functional Distribution
case study: typological series
Type, Variation, Transgression
The case study is based on observing theoretical and cultural foundations for designing new buildings. To learn from the past and explore modern ways. Typology studies are comparative studies to understand the difference between types and history.
One of the main aim was to highlight the significance of the new design buildings by making a comparison between other reference buildings. The process began by specifying our typology and then observing others.
The ‘typological series’ study is divided into three parts.In the first part, one of the main concepts, the typology of open spaces, will discuss. Then in the second part, superimposition and layers, the last part typology of the plan will be investigated.
Organisation of Ground floor - open spaces ,Sections, Circulation
Novartis Campus, Weiss Manfredi, 2013, East Hannover, USA
With its column-free spans and clear glass, which divides spaces for groups to collaborate, Novartis Campus introduces an innovative world.
Working areas have a light organization to allow flexibility, similar to the Research Lab Center. The concept of “ Common Ground” is one of the intersection points of the projects.
The primary connection between Novartis Campus and Research Lab for Natural Sciences is the design philosophy of the architectural stairs which connect the floor.
Fig 87: Ground Floor Plan, Novartis Campus
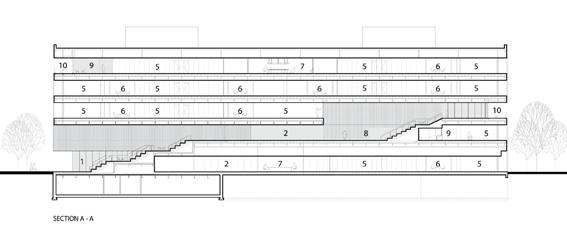
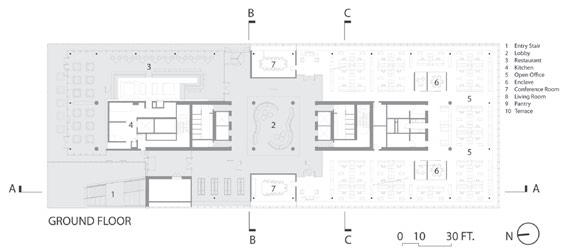
Fig 88: Section, Novartis Campus
Fig 90: Section, Novartis Campus
Fig 89: Section, Research Lab for Natural Sciences, Authors
Case Study:Typological Series
Fig 91: Building sketch, Novartis Campus
50
In the second part of the case study, the term ‘superimposition’ was one of the guides. Research Lab Center has diverse floor plans and buildings created by superimposing those different layers. The project Regione Lombardia shown in Figure 100, is an excellent reference to see the evolution of the floor plans, which is similar to our project’s design process.


The following approach is to study circulation, ramps, and circuits to focus on the buildings with identical design perspectives.The main design element of the Research Lab for Natural Sciences is green slope ramps which have created both external and internal concepts. This green slope is not only for transition
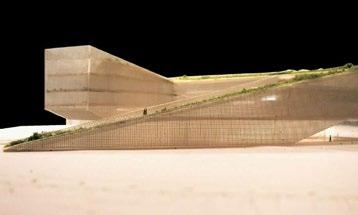
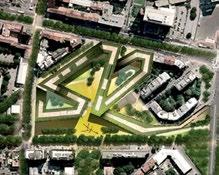
Figure 95 emphasizes the ramps that connect different levels at the Project of Regione Lombardia and Piacenza municipality building. The sense of taking and directing people to the building with a ramp at the entrance is parallel to the project
51
`Layers`
Superimposition -
Fig 92: Diagramatic plan schemes, Research Lab Center, Authors Fig 93: Lombardia Region Headquarters - Mario Cucinella , Foster + Partners
Fig 96: Municipality of Piacenza , MCA
Fig 95: 3D, Research Lab for Natural Sciences, Authors
Fig 98: Municipality of Piacenza , MCA
Fig 97: Municipality of Piacenza , MCA
Case Study:Typological Series
Fig 99 - Ground Floor Plan,

the common ground
52
The Common Ground
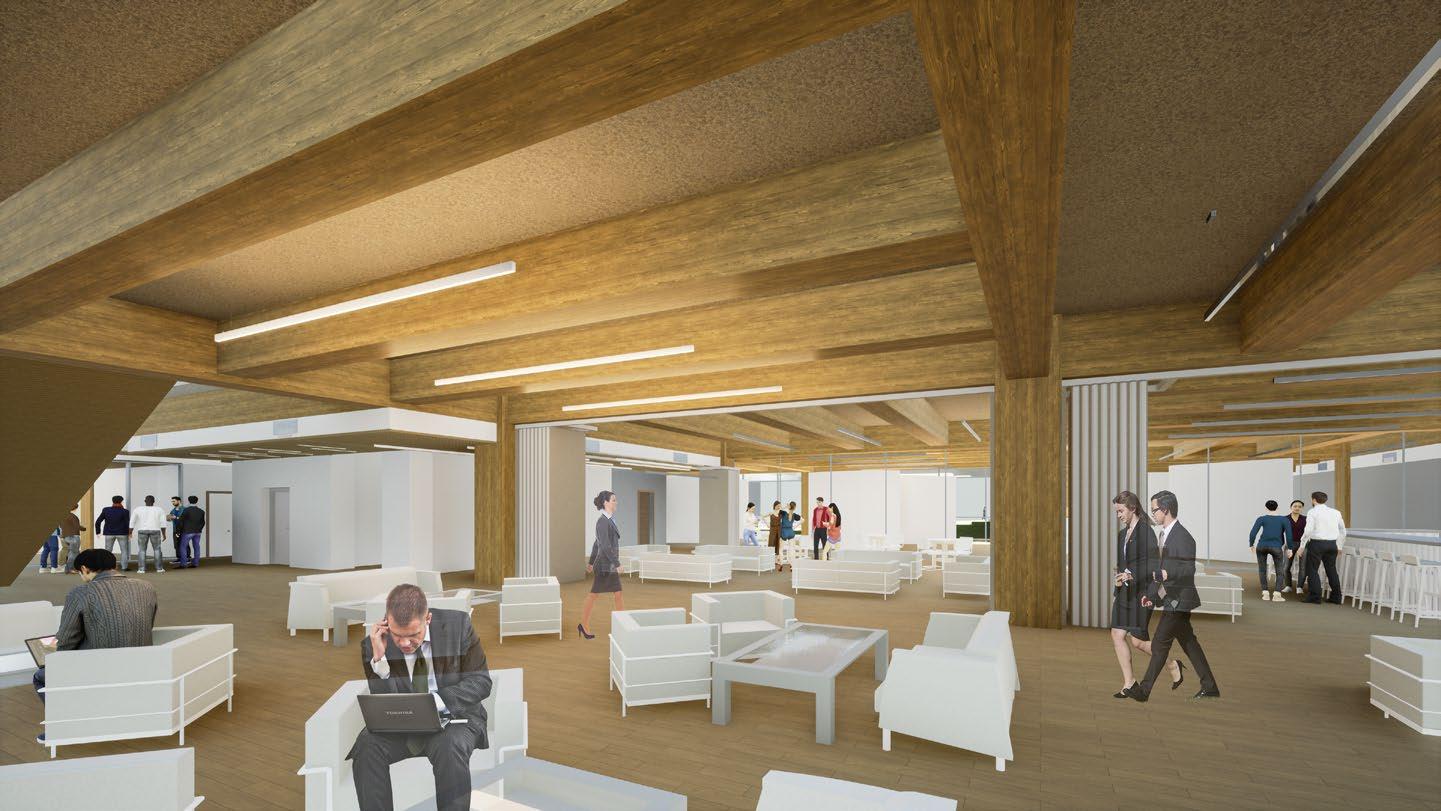
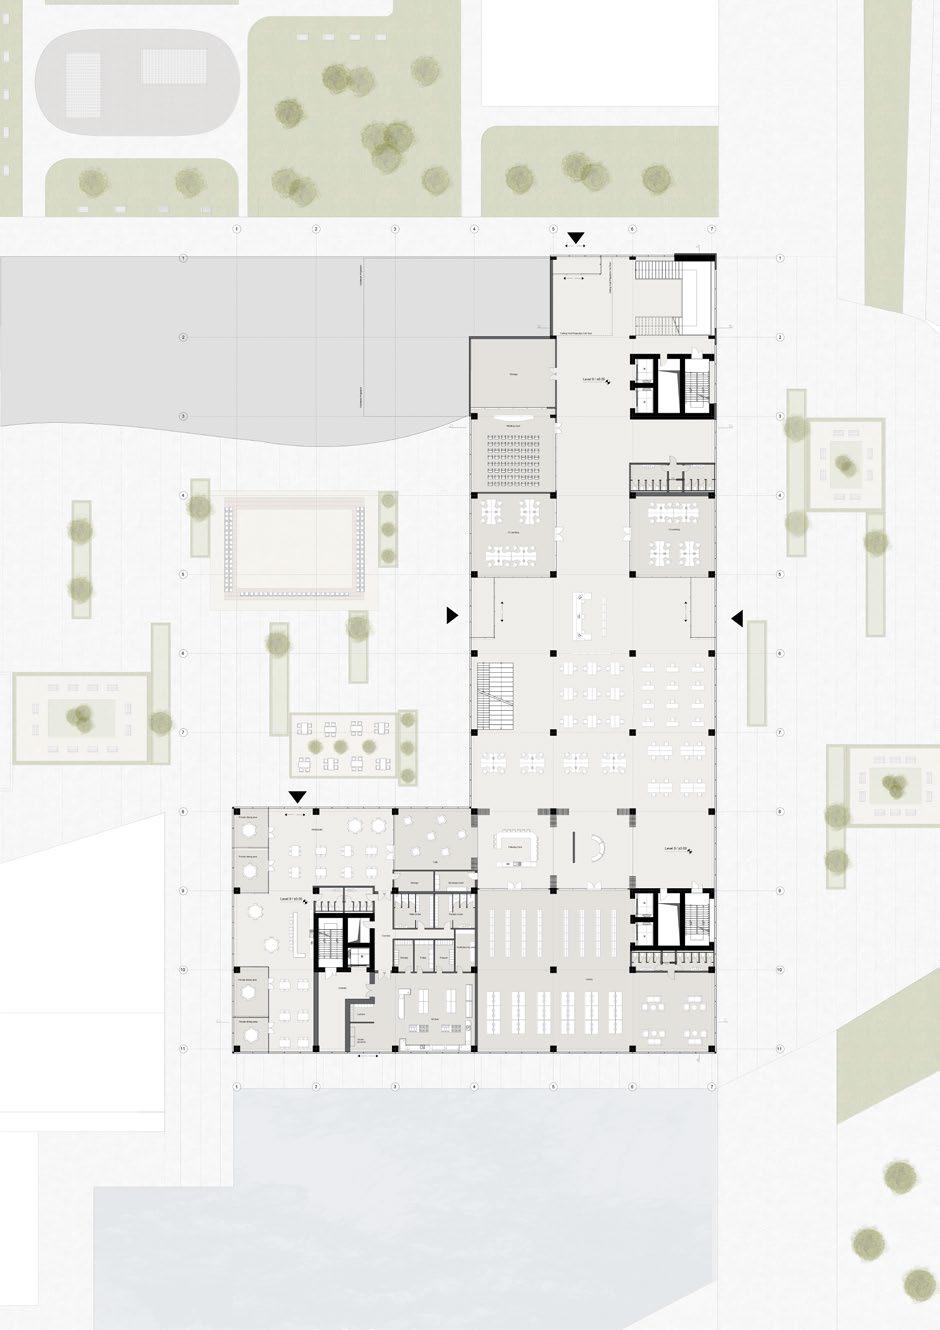
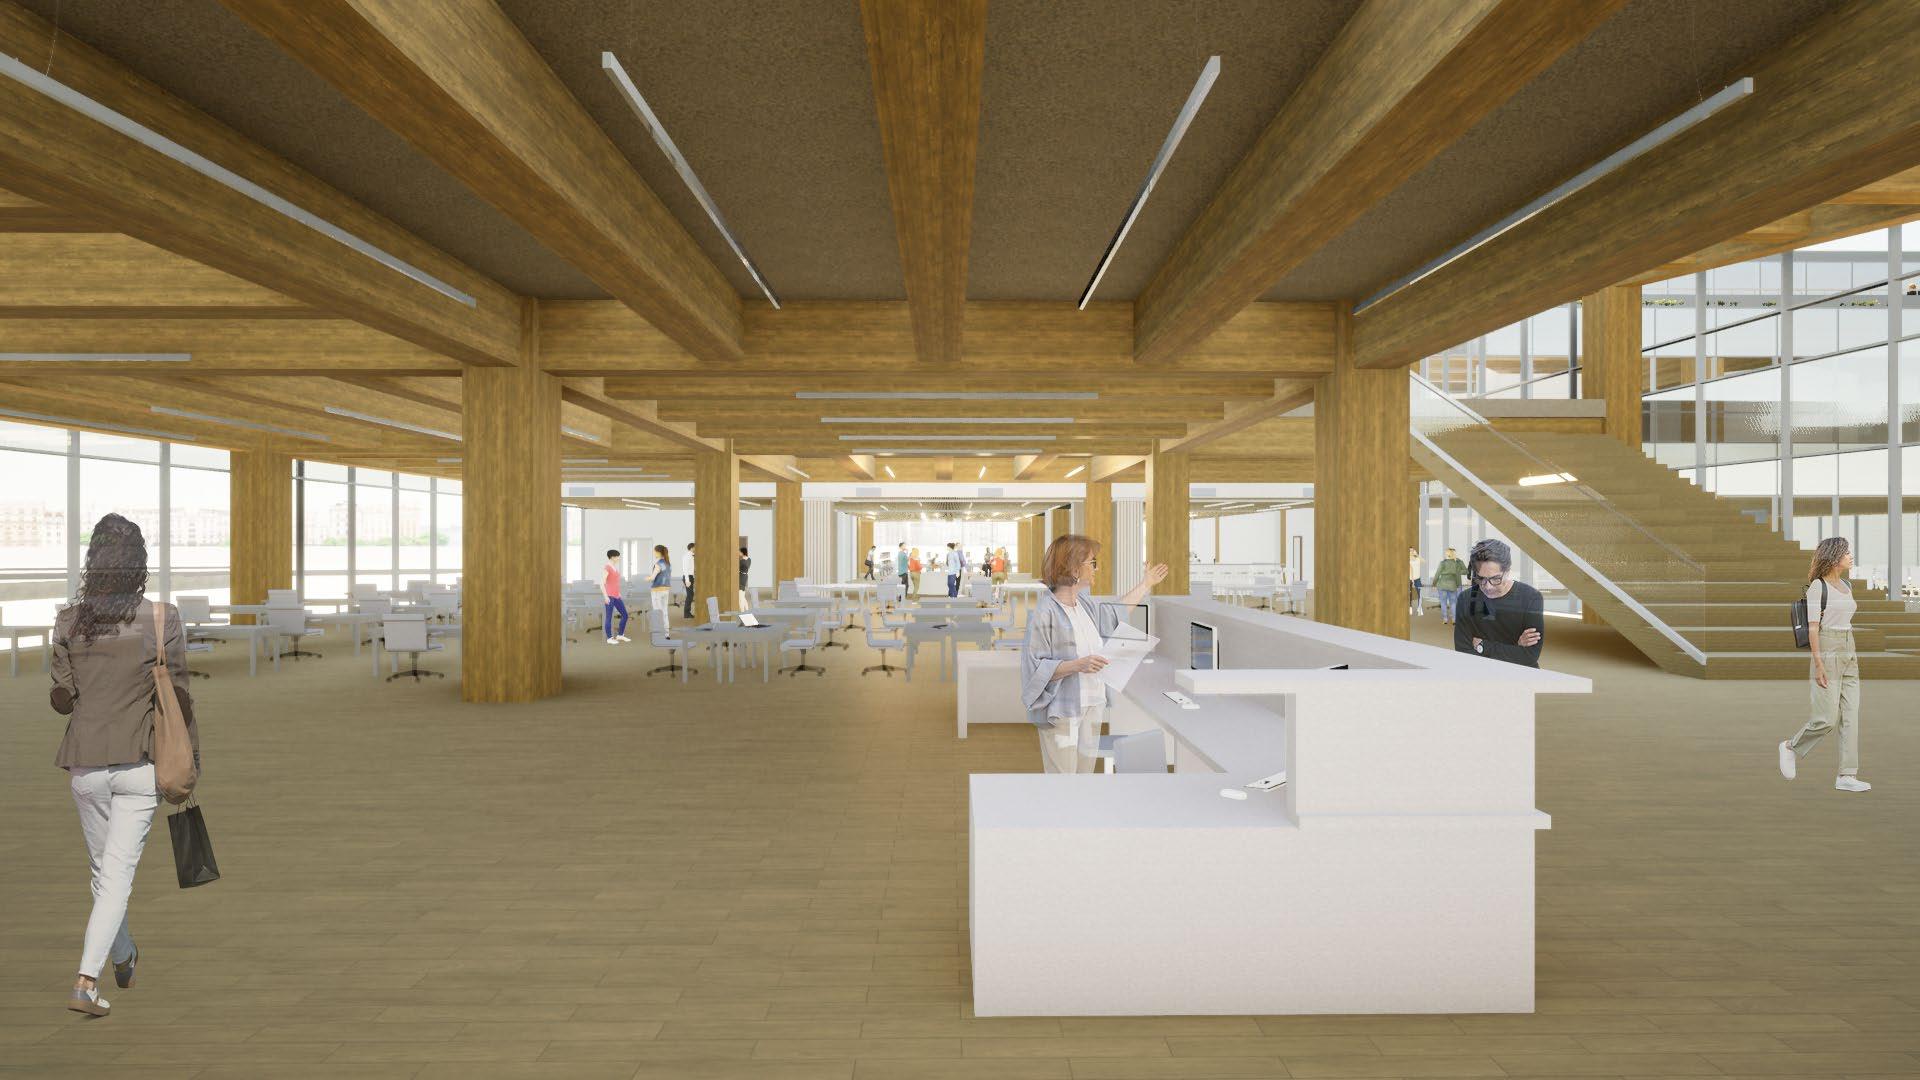
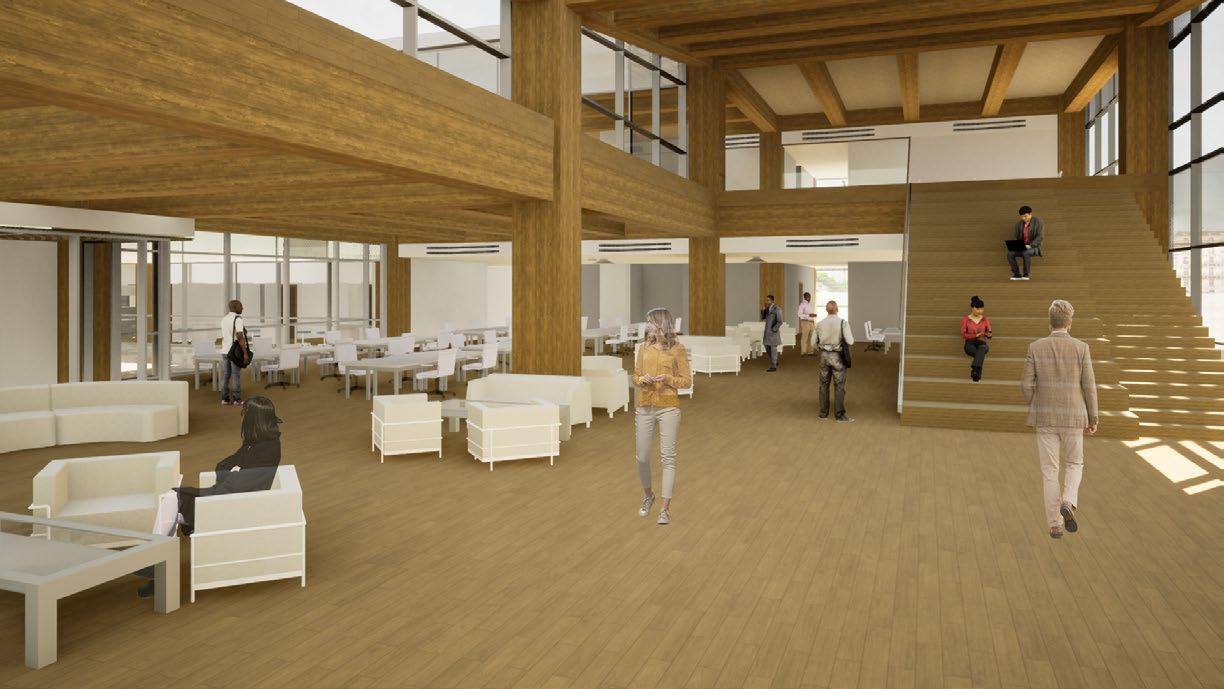
The structural layout played a key factor in the design of the common ground. The large spans inbetween columns provided a more transparent interior. The regularity of the structural grid allowed for a consistent configuration of the facade as well as for a better distribution of the functions throughout the building floors. In more concrete terms, the ground floor is separated into 3 areas ; the foaye occupying the northern wing, the co-working space allocated along the main body of the building and the southern wing, where the library and the rstaurant are distributed.
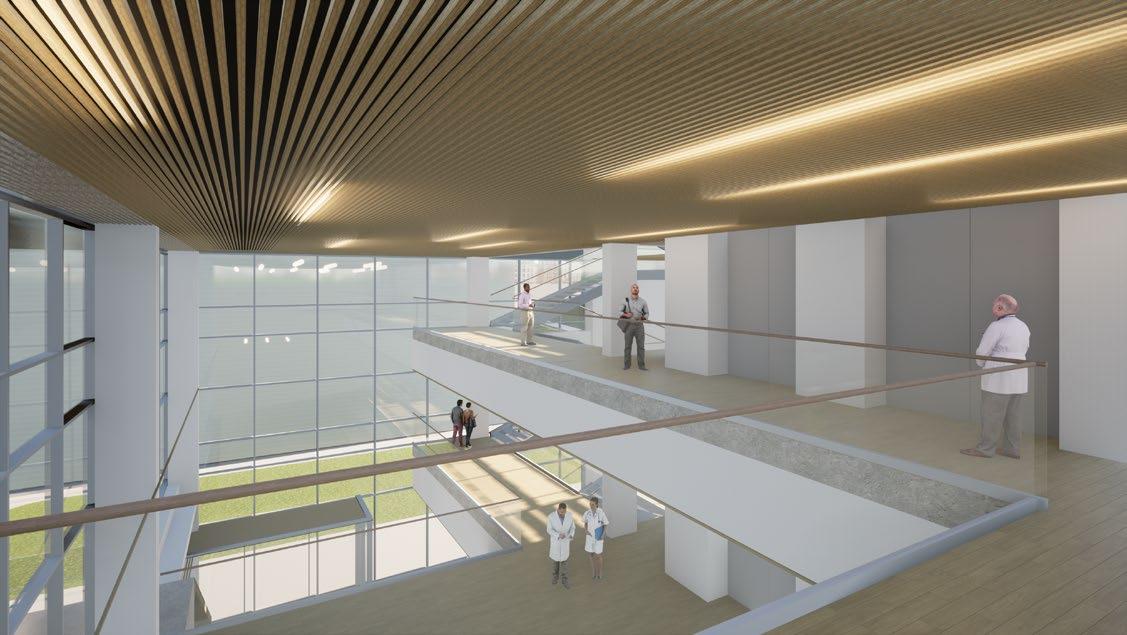
The foaye represented below is the interconnecting point between all the levels. The circulation that it provides gives access to all the laboratory areas in the upper floors, as well as the auditorium that occupies the overhanging volume. The height of the lobby reaches up to the ceiling of the 3rd floor, thus creating a unified space. In the first floor the access is granted through the ramp. Having said that, the second floor generates a bridge connecting the staicase to the laboratory area, from where the viewer overlooks the access points in the ground and the first floor.
53
The Common Ground
Fig 100 - Entrance render, Authors
Fig 101 - Co-working axonometry, Authors
54
The Common Ground
Co-Working space
The structure is distributed throughout a total span of 30 meters. Containing two access points, the co-working area can be regarded as an interconnecting point inbetween the eastern entryway and the rest of the masterplan.
The flexibility that characterizes the layout of this space, as well as the large spans generated inbetween the wooden structural components, transmit a feeling of unification through a collective workplace.
The area is accessed by anyone. Thus, it is conceptualized as a public point where ideas are communicated and exchanged. It is a hub of knowledge and circulation of information.
Adjacent to the workplace, we have introduced a filtering area enclosed with movable partitions, which is utilized as a break space, or a tansitioning room ahead of the south wing.
On the other hand, below the western entrance, the staircase is used as a connecting architectural element between the ground and the exhibition area in the above level. In addition to the circulation, the set of stairs function also as a reading and leisure space.
55
Center
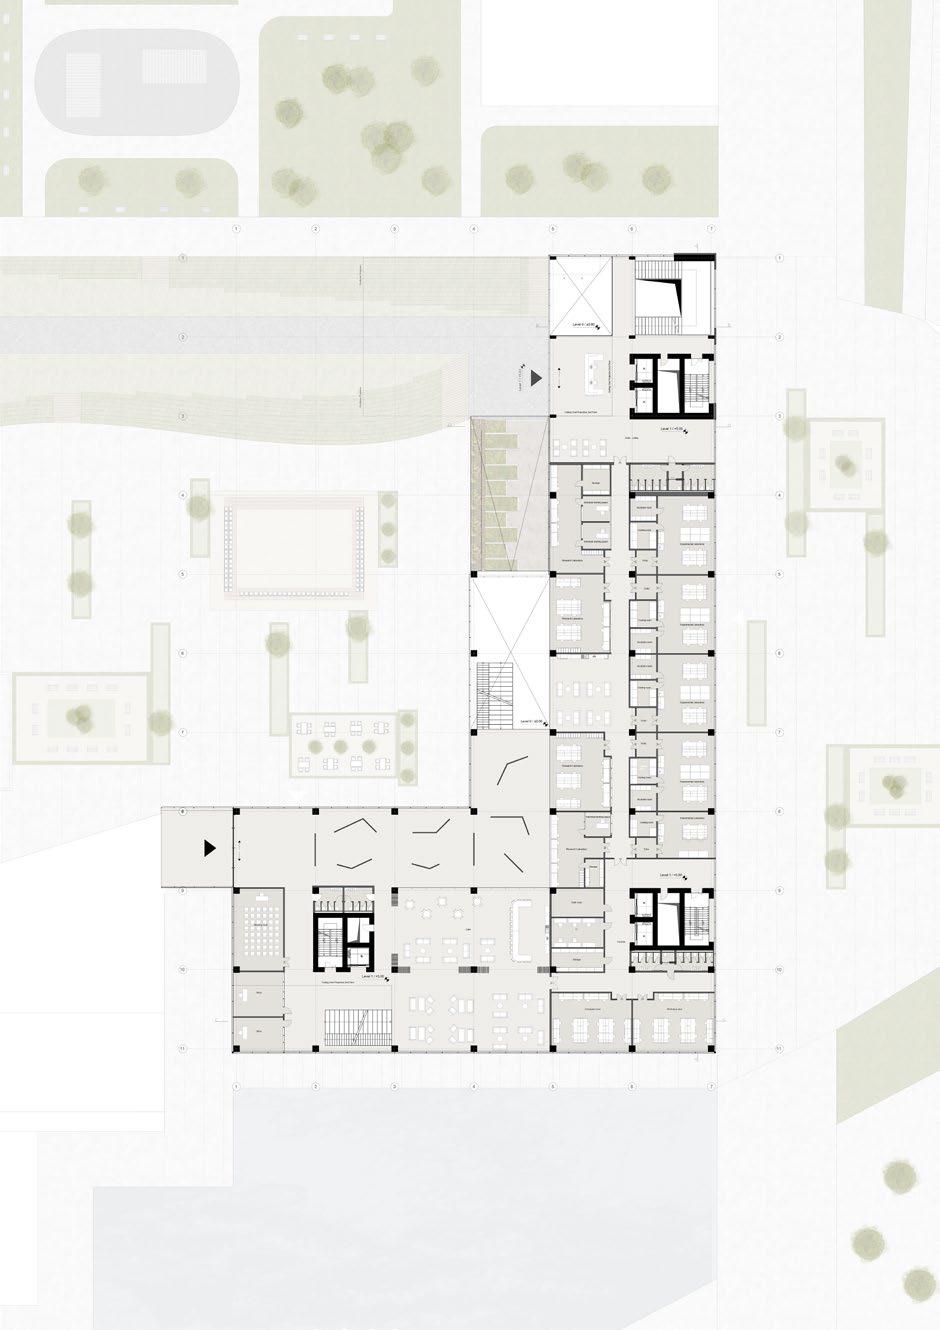
Ground Floor Plan 1:
Fig 102 - Common Space: Co-Working Spaces, Authors
for Natural Sciences
200
Beverage room Filtering Zone Level 0 / ±0.00 The Common Ground
56
The Common Ground
Fig 103 - Recreation area axonometry, Authors
Library and restaurant
The southern wing shows a more rigid configuration compared to the previous workspace. However, it is mainly separated into two adjacent areas; the restaurant on the western side and the public library on the eastern one. The junction point inbetween the spaces is the filtering room described earlier. Both the library and the restaurant are conceptualized as public independant spaces that can also be directly accessed from the external piazza.

Even though, at first glance the layout of the south wing appears to be more rigid, it follows a similar logic as the other areas of the building. The wooden structure allows for a very straightforward distribution of space. The large spans provided from the columns, give flexibility to both the interior of the restaurant and the library. Notwithstanding, the structural cores adjacently located provide the perfect solution for the distribution of technical spaces, toilets, changng rooms, kitchen and other storage rooms.
In contrast to the co-working area, the structural frames are not visible in the foaye, the corridors , the library and the restaurant space. The slabs are covered through a system of linear wooden beams that constitute the false ceiling. The purpose of such decision is to cover the heating system above the ceiling structure and as a result to maintain a more neat interior.
57
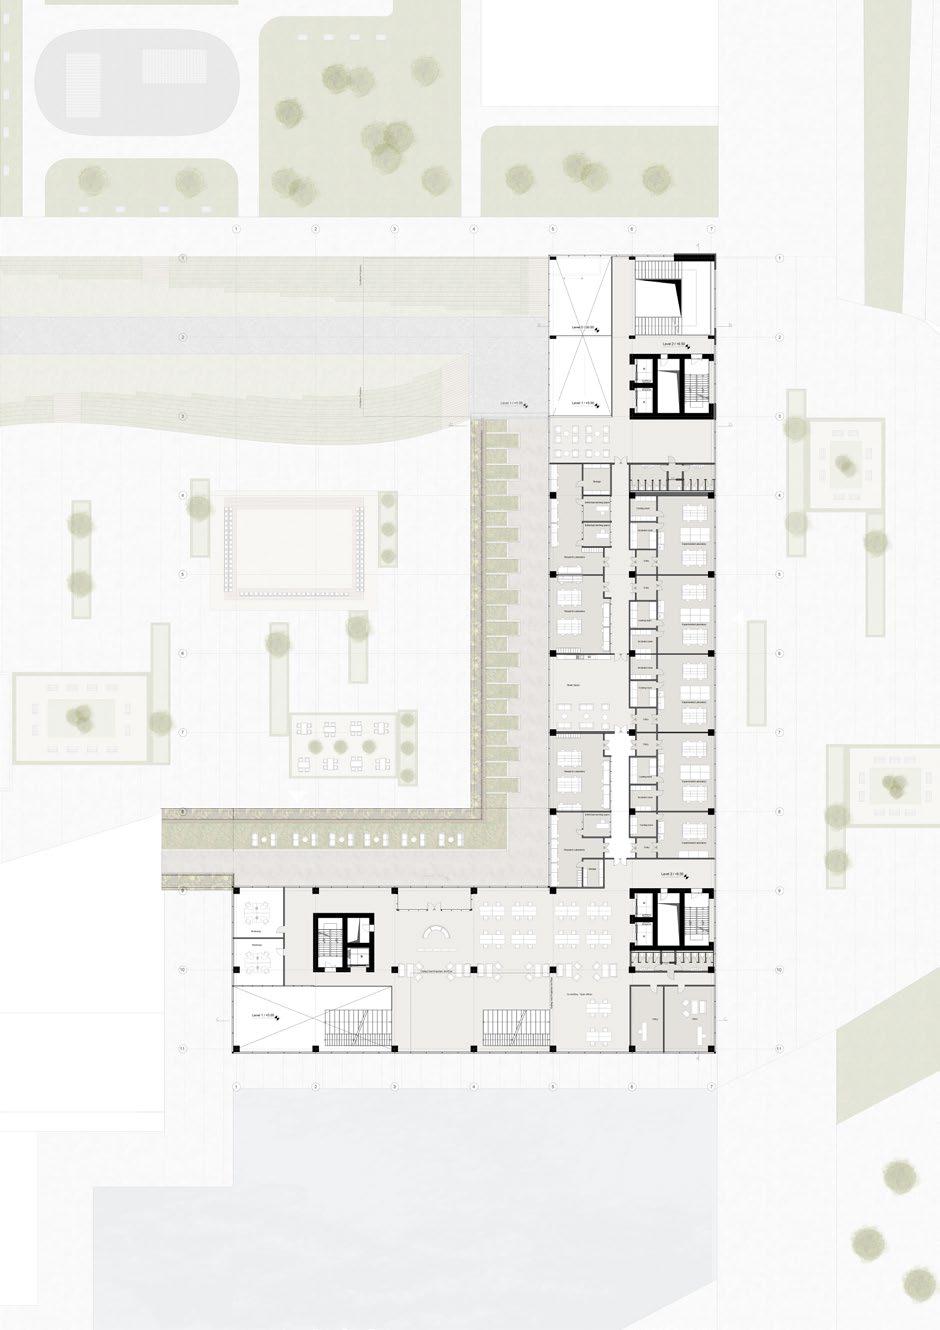
M N D Research Center for Natural Sciences ENTRANCES LOBBY- CIRCULATION - : - Circulation : 200 sqm 1295 sqm - Restaurant (Including Kitchen&Staff) : 685 sqm - Cafe: 200 sqm - Co- working spaces : 820 sqm - Meeting Room 150 sqm - Library : 600 sqm ARCHITECTURE BUILDING ARCHITECTURE A. A. 2021/2022 03 CITY CAMPUS ARCHITECTURE Ground Floor Plan 1: 200 Floor height Total Area 3700 sqm Ground Floor: Section D-D’ 1:200 South Elevation 1:200
Fig 104 - Restaurant and Library, Authors
Goods received Lockers Kitchen Storage Fridge Freezer Ventilated dry store Male locker Female locker Storage Beverage room Corridor Corridor Restaurant Cafe Private dining area Private dining area Private dining area Private dining area 21 20 17 11 14 17.85 28 24 Level 0 ±0.00 Library Filtering Zone 21 20 17 11 13 28 28 25 24 Level 0 ±0.00 The Common Ground
58
The Common Ground
Fig 105 - Interior render of co-working , Authors
59
The Common Ground
Fig 106 - Interior render of library , Authors
60
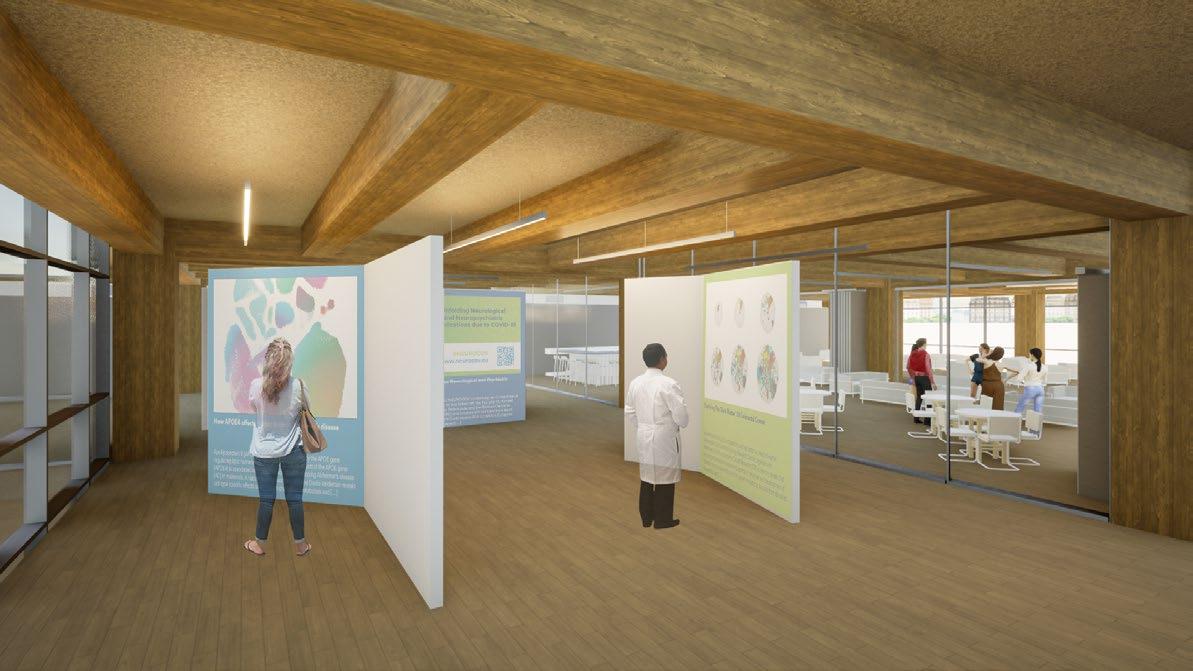
Fig 107 - Render of the exhibition and lounge area, Authors
exhibition area Exhibition Area
61 Exhibition Area
Fig 109 - Axonometry of the exhibition and lounge area , Authors
62
Exhibition Area
The exhibition space is integrated as a place for communication thorugh the presentation of works as a manifestation of ideas, as well as an exchange of knowledge and experience. it is a place where the expertise and innovation achieved in research and science can be transmitted to anyone. Through such place any person can get a glimpse of how natural science is evolving and how it can affect the everyday life.
Allocated in the south wing, the main access point for this space is through the aforementioned staircase in the common ground floor. It is later followed by an open recreational area used as a large open breakroom.

The connection through different levels through the wooden staircase aimes at generating a continuity between the different levels. Just like the common ground also the recreational area is designed to express the same movement and dynamism. This fabrication of atriums comes also as a result of the integration of the sloped roof.
Fig 110 - First Floor zoom-in, Authors
63
Computer room Cafe Meeting room Workshop area 22 19 18 11 13 17.30 13 17.30 12 28 25 Ceiling Void Projection 2nd Floor Level 1 / +5.00 Cooling room Dry Room Cooling room Research Laboratory Lab Type 1 Lab Type 1 Research Laboratory Entry Corridor Dark room IT Storage Individual working space Storage 23 20 17 15 13 13 17.30 24 Level 1 / +5.00 Office Office
Exhibition Area
restricted co-working
64
Resricted Co-Working
Fig 111 - Co-working space render, Authors
65 Resricted Co-Working
Fig 113 - Perspective section of the south wing, Authors
66
Resricted Co-Working
67
Research is more lifestyle than work. It is a lifestyle that tends to form a large part of a researcher’s life.1
Laboratories are the place where researchers realize themselves. The atmosphere of the space leads the way in studying. Because of that it is essential to understand their history and meaning.
Additionally, the laboratory reflects modernity. It provides a connection between humans and technology and science; It has created history primarily as an enclosed space. Also, it is technically and organisationally highly refined, as they have to serve specialized work processes efficiently.
laboratory design
The research environment, which used to be more introverted in the past, today is more collaborative. This means space should be open to interaction and coworking for experiments. So architects should design space not only for research and technical equipment but also for social interaction between scientists.
68
“ The nature of the space reflects what it wants to be” Louis Kahn
Fig 114: Salk Institude, Louis Kahn
Laboratory Design
History of the term “laboratory” :
The Latin term laboratorium (from the Latin term labor, meaning exertion, effort or work) was already in use in the medieval period. However, it was only in the late 16th century that the term assumed the meaning which it retains in modern languages today. Schmidgen H.(2011). History of the Beginnings of the Laboratory in the Early Modern World.
In the 14th century, the term laboratorium meant simply a task or work.Today, Oxford English Dictionary defines “laboratory” as a “building set apart for conducting practical investigations in natural science”.
Laboratory buildings are technically and organisationally highly refined, as they have to serve specialized work processes efficiently. Because of that reason, it is essential to understand their history and meaning.
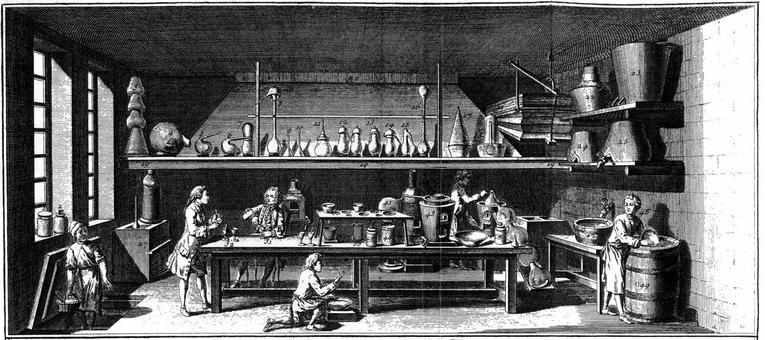
Figure 115 represents Encyclopédie is the first depiction of a laboratory organized according to scientific principles.
According to 1765`s Laboratory illustration there are some researchers in the room with a modern looking. According to sources, these researchers are scientists, physicists, and laboratory assistants. They are debating the experiments around the rectangular table. Also, there are some technical pieces of equipment around the table.
The Revolution of Laboratories:
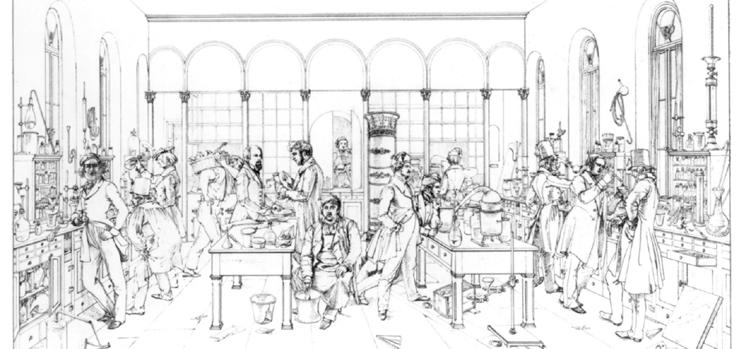
During the 19th century, laboratories developed by the influence of university reforms and founding new universities. The university systems began to change. Universities became place of scientific and technical research.
Liebig’s famous laboratory in Giessen (Figure 116) has a collective working atmosphere and does not even seem to have had a special room for storing chemical substances
69
Fig 115: Chemical laboratory, 1765 / S.Henning
Fig 116: Liebig`s teaching laboratory
Early Modern Period : The Laboratories
Laboratory Design
case study: philosophy of lab design
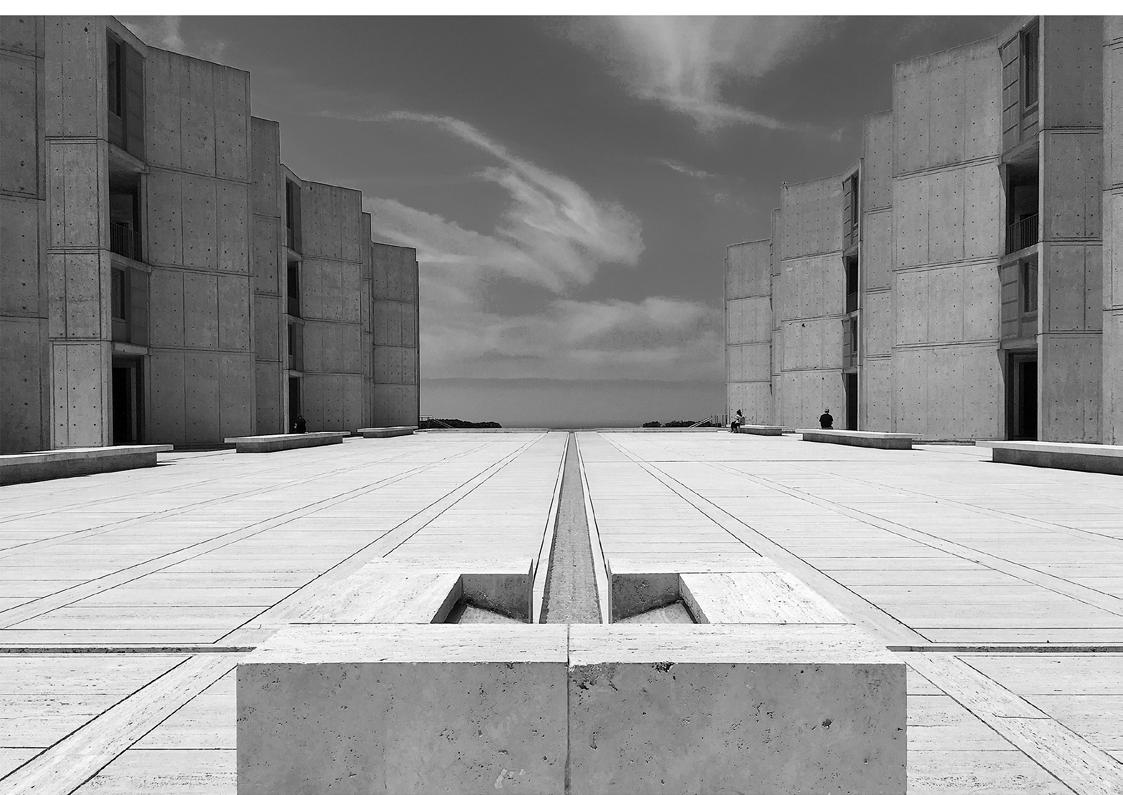
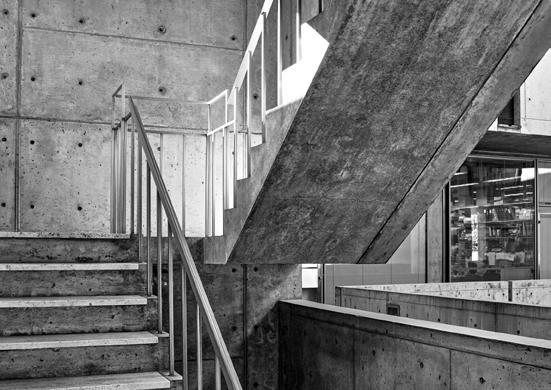
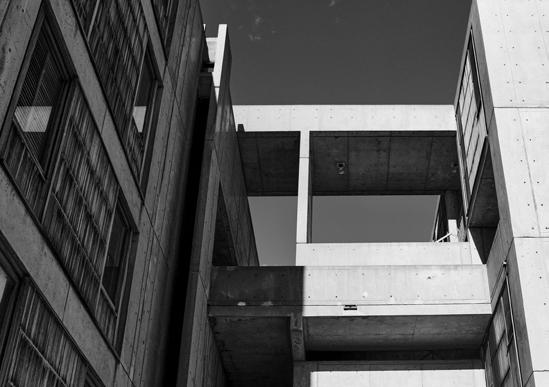
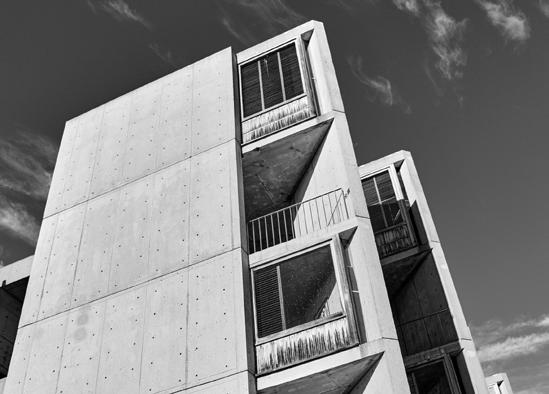
“Concrete is the material of parking garages and overpasses and highways, but in the Salk Institute, the concrete has an enormous warmth to it and changes in beautiful ways as the sun moves around or the fog rolls in.” Nathaniel Kahn
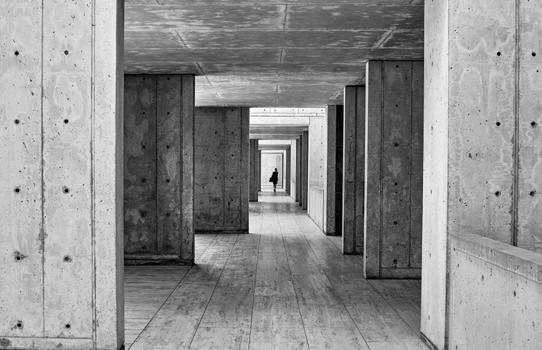
The motivation for selecting the project is to begin operating on a specific topic, and it is essential to comprehend and observe iconic examples. Salk Institute is one of the leading projects of the laboratories, and it was passionate to create a communicative atmosphere within the house during the design.
In addition, writing desks in the laboratories are positioned along the windows and are separated from the lab benches with glazed partitions. Throughout the building, the use of glass provides transparency and also corresponds well with the Research Center for Natural Sciences laboratory design principle. The Salk Institute, Louis Kahn’s most outstanding masterpieces, enlighten the way of thinking during the design of the labs. It has a substantial vision of using materials and organization of spaces. Case Study: Philosophy of Lab Design
70
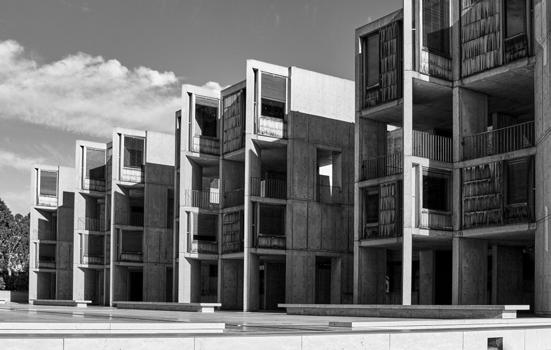
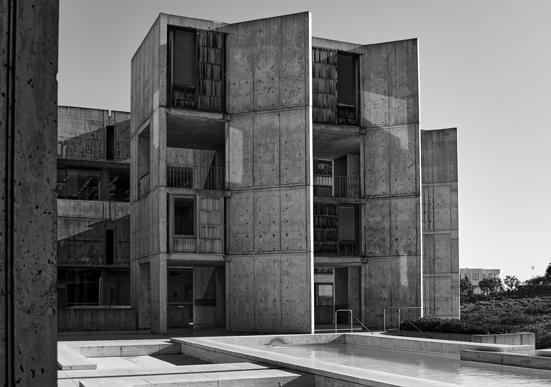
Salk Institude, Louis Kahn ( 1959-1965), San Diego,CA
Fig 117: Salk Institude, Louis Kahn
Fig 119: Salk Institude,Louis Kahn
Fig 120: Salk Institude,Louis Kahn
Fig 118: Salk Institude,Louis Kahn
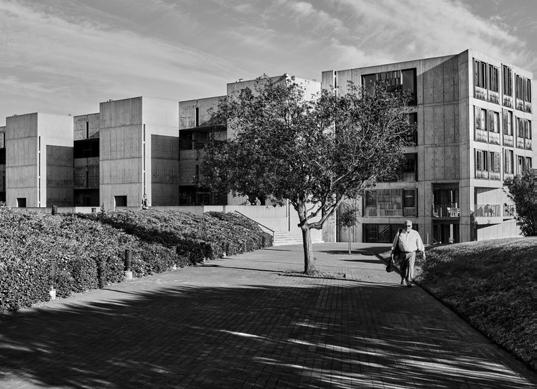
The laboratories, first conceived as a pair of towers separated by a garden, evolved into two elongated blocks mirroring each other across a paved plaza. The central court is lined by a series of detached towers whose diagonal protrusions allow for windows facing westward onto the ocean. 4
Kahn designed the laboratories to be easily upgraded. Support beams are restricted to the edges of each lab, allowing for greater flexibility in reconfiguring the equipment and spaces within. 4
Kahn writes, ”snugly isolated from other mentalities, needed more than anything the presence of the unmeasurable, which is the realm of the artist.” A place providing architectural quality is a complex situation that is not simply created by putting individual elements together in a refined and logic manner.
Besides the physical quality of the building, understanding Kahn`s philosophy and artistic vision provide another perspective on the way of thinking.
71
Fig 121 Salk Institude, Louis Kahn
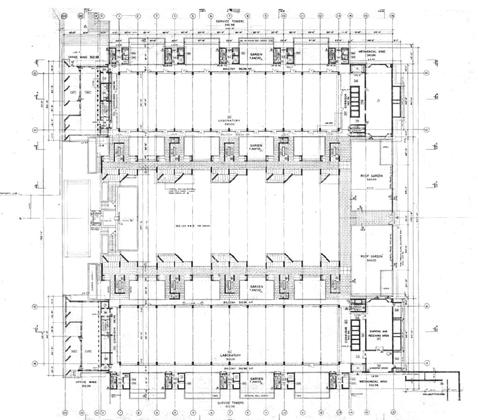
Fig 123 PLan, Salk Institude, Louis Kahn
Fig 122 Stairs, Salk Institude, Louis Kahn
Fig 124: Salk Institude, Louis Kahn
Case Study: Philosophy of Lab Design
Fig 125: Max Planck Institute of Biophysics,Auer+Weber+Partners
Fig 126: Max Planck Institute of Biophysics , Auer+Weber+Partners
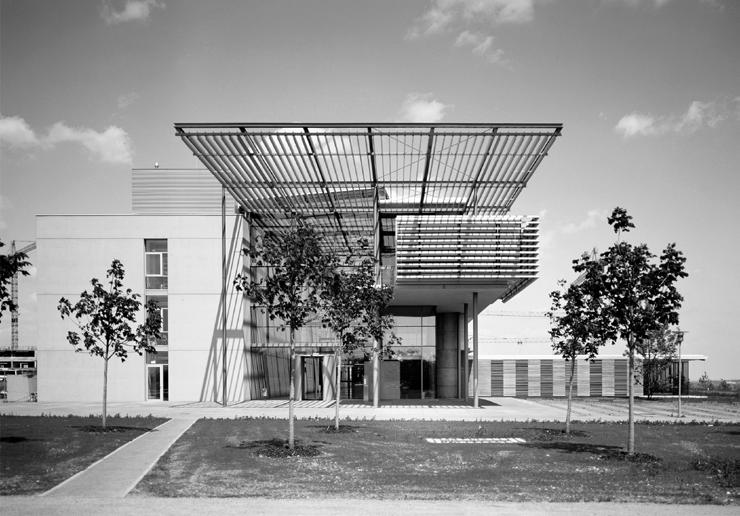
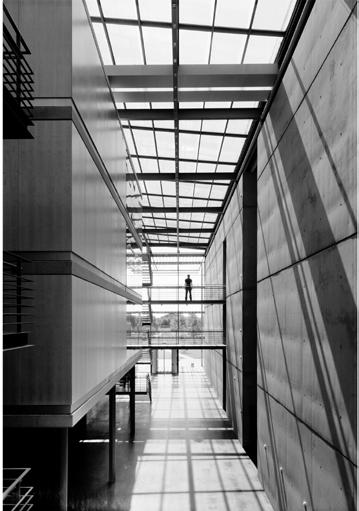
Fig 127: Plan, Max Planck Institute of Biophysics , Auer+Weber+Partners
Case Study: Philosophy of Lab Design
72
Max Planck Institute of Biophysics, Auer + Weber + Partners, (1998-2003) Frankfurt,Germany
Fig 128: Max Planck Institute of Biophysics,Auer+Weber+Partners
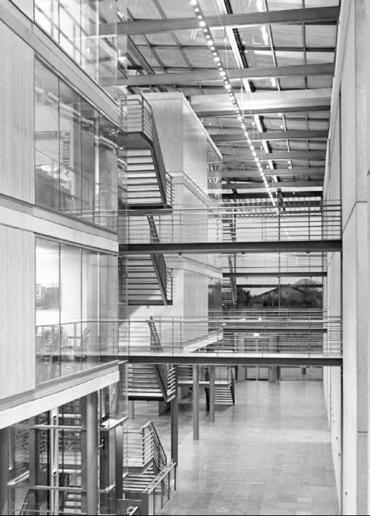
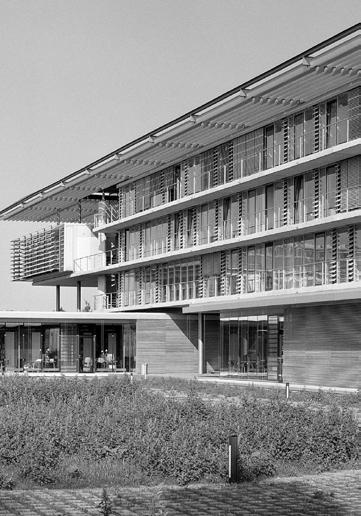
Fig 129: Max Planck Institute of Biophysics , Auer+Weber+Partners
The institute’s new building is located on the natural science campus of Johann Wolfgang Goethe University in “Niederurseler Hang” next to the chemistry, physics, and biology departments, as well as other non-university research facilities. The building composes the southern border of the campus’ future central area and is placed parallel to the slope to the south. It consists of two parallel wings systematically and tightly partitioned and connected by a full-height atrium space. Laboratory departments for experimental research are placed in the north; they are readable from the exterior and form a row of three-story volumes with double-loaded passages.
The plan layout of the project corresponds pleasingly with Research Center for Natural Sciences` laboratories. Their laboratories closed filtered space, and laboratories are located on the sides of the central corridor
Fig 130: Section, Max Planck Institute of Biophysics , Auer+Weber+Partners
73
of
Case Study: Philosophy
Lab Design
132: Entry/Exit
Concerning the building’s geometric features, one of the main issues was creating the layout of the laboratories. With a length of 20 m, the ideal solution was to have the central corridor and both sides laboratories. Another critical aspect was the design methods for workplaces, storage, and furniture. Designing laboratories has strict rules depending on the building characteristic and types of labs. From services design to interior design, each phase needs detailed research. Brian Griffin’s Design Guide was used in these actions during this approach.
Fundamental principles are taken from Brian Griffin,
-A good rule in interior laboratory design is to arrange the workbenches at right angles to the window walls, this arrangement creates quiet work ‘bays’ free from traffic.
Fig 133: Wet/Dry Lab modules Fig 134: Office
Fig 135: Single Corridor, Braun Griffin
- The single corridor plan is generally favored, however, as it is more flexible. The areas on bothsides should be the same width for maximum flexibility, so the single corridor should be central.
- Wall and ceiling surfaces should be impermeable, non-porous, and smooth for easy cleaning.
- Plan for storage space adjacent to the main circulation for easy access by staff replenishing supplies.
- The laboratory support facilities in this plan can be arranged immediately adjacent to the laboratory they serve.
-For maximum flexibility laboratory functions should be combined into shared open spaces.
74
Fig 131: Cool RM/CT Cabinets Fig
Laboratory Design Guide, Brian Griffin Laboratory Layout
Labs Support
Corridor Support
Lab Case Study: Philosophy of Lab Design
A Design Manual Research and Technology Buildings, Braun Gromling
Laboratory Modules
The experimental scientific working area is one of the critical parts of the laboratories. They have high-tech equipment, depending on the type. Scientists collect information, substantiate the experiments and summarize their investigations there. After these results, they discuss them with a small group of people. These procedures suppose a specific critical community and work phases. Some of the information that should follow, according to Gromling,
-Type and frequency of work processes -Number of persons working in a laboratory -Daylight/artificial lighting -Fume boards for toxic substances -Number of desks for writing and analysis -Layout and planning of service supply
Besides the investigation of Griffin`s principles, during the design of laboratory modules, we based Gromling`s laboratory module layout ( Figure 136,137,138), which is consistent with our functions.
According to the Gromling, the following design criteria of the laboratories,

-Work areas -Fixtures, furnishings and equipment (FF&E) -Grids -Structural and fit-out considerations -Zoning and required areas for apparatuses and technical equipment
Fig 136: Molecular Biology Laboratory, Gromling B.
Fig 137: Chemical Laboratory, Gromling B.
Fig 138: Physical Laboratory, Gromling B.
Fig 139: Molecular Biology Laboratory, Gromling B.
Working areas
Fig 140: Chemical Laboratory, Gromling B.
Zoning and required areas for technical equipment
Fixtures, furnishings and equipment (FF&E)
Study: Philosophy of Lab Design
Fig 141: Physical Laboratory, Gromling B.
75
Case
types of laboratories
Level 1 : Chemistry Laboratory
Level 2 : Biology Laboratory
Level 3 : Physics Laboratory
76
Types of Laboratories
Fig 142: Exploded axonometry diagram , Authors
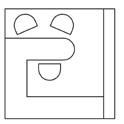
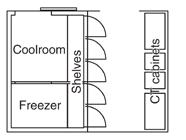
type 1 : experimental lab : chemistry dangerous substances/ Wet area fume cupboard, point air exhaust cabinet for dangerous substances cabinet for chemicals working desks with stoneware/ceramic tops laboratory sink storage: incubator/dryer refrigerator/freezer
Dangerous substances/wet area Fume cupboard,point air exhaust Cabinet for dangerous substances Cabinet for chemicals Laboratory sink
type 1 : experimental lab : chemistry dangerous substances/ Wet area fume cupboard, point air exhaust cabinet for dangerous substances cabinet for chemicals working desks with stoneware/ceramic tops laboratory sink storage: incubator/dryer refrigerator/freezer
type 1 : experimental lab : chemistry dangerous substances/ Wet area fume cupboard, point air exhaust cabinet for dangerous substances cabinet for chemicals working desks with stoneware/ceramic tops laboratory sink storage: incubator/dryer refrigerator/freezer
Working desks with ceramic tops Incubator/Dryer Refrigerator/Freezer
type 2 : research lab
single computer lab storage / archive writing desk locker
type 1 : experimental lab chemistry dangerous substances/ Wet area fume cupboard, point air exhaust cabinet for dangerous substances cabinet for chemicals working desks with stoneware/ceramic tops laboratory sink storage: incubator/dryer refrigerator/freezer
Dangerous substances/wet area Fume cupboard,point air exhaust Cabinet for dangerous substances Cabinet for chemicals Laboratory sink Working desks with ceramic tops Incubator/Dryer Refrigerator/Freezer
type 1 : experimental lab chemistry dangerous substances/ Wet area fume cupboard, point air exhaust cabinet for dangerous substances cabinet for chemicals working desks with stoneware/ceramic tops laboratory sink storage: incubator/dryer refrigerator/freezer
type 1 : experimental lab chemistry dangerous substances/ Wet area fume cupboard, point air exhaust cabinet for dangerous substances cabinet for chemicals working desks with stoneware/ceramic tops laboratory sink storage: incubator/dryer refrigerator/freezer
type 1 : experimental lab : chemistry dangerous substances/ Wet area fume cupboard, point air exhaust cabinet for dangerous substances cabinet for chemicals working desks with stoneware/ceramic tops laboratory sink storage: incubator/dryer refrigerator/freezer
Dangerous substances/wet area Cabinet for dangerous substances Cabinet for materials Laboratory sink Working desks with ceramic tops Dark room
type 2 : research lab
single computer lab storage / archive writing desk locker
type 1 experimental lab : chemistry dangerous substances/ Wet area fume cupboard, point air exhaust cabinet for dangerous substances cabinet for chemicals working desks with stoneware/ceramic tops laboratory sink storage: incubator/dryer refrigerator/freezer
type 1 : experimental lab : chemistry dangerous substances/ Wet area fume cupboard, point air exhaust cabinet for dangerous substances cabinet for chemicals working desks with stoneware/ceramic tops laboratory sink storage: incubator/dryer refrigerator/freezer
type 2 : research lab
Individual working space Storage/archive Writing desks Locker
single computer lab storage / archive writing desk locker
Break
type 2 : research lab
single computer lab storage / archive writing desk locker
break space
break space other functions : workshop server room dark room IT storage
type 2 : research lab break space other functions : workshop server room dark room IT storage
other functions : workshop server room dark room IT storage
vertical connections / bathrooms
vertical connections / bathrooms
Other functions Workshops Server room Storage Dark room
vertical connections / bathrooms
Individual
type 2 : research lab
type 2 : research lab
single computer lab storage / archive writing desk locker
single computer lab storage / archive writing desk locker
single computer lab storage / archive writing desk locker
break space other functions : workshop server room dark room IT storage
type 2 : research lab break space other functions : workshop server room dark room IT storage
single computer lab storage / archive writing desk locker
type 1 : experimental lab : chemistry dangerous substances/ Wet area fume cupboard, point air exhaust cabinet for dangerous substances cabinet for chemicals working desks with stoneware/ceramic tops laboratory sink storage: incubator/dryer refrigerator/freezer
type 2 : research lab
Individual working space Storage/archive Writing desks Locker
Other
vertical connections / bathrooms
break space other functions : workshop server room dark room IT storage
break space other functions : workshop server room dark room IT storage
vertical connections / bathrooms
vertical connections / bathrooms
vertical connections / bathrooms
single computer lab storage / archive writing desk locker
type 2 : research lab
single computer lab storage / archive writing desk locker
break space other functions : workshop server room dark room IT storage
break space other functions : workshop server room dark room IT storage
break space other functions : workshop server room dark room IT storage
vertical connections / bathrooms
vertical connections / bathrooms
vertical connections / bathrooms
77 Level 1
Level 2 Level
connections bathrooms type 2 research lab
space other functions workshop server room dark room IT storage
1 experimental lab chemistry dangerous substances/ Wet area fume cupboard, point air exhaust cabinet for dangerous substances cabinet for chemicals working desks with stoneware/ceramic tops laboratory sink storage: incubator/dryer refrigerator/freezer single computer lab storage archive writing desk locker
break
biology dangerous
exhaust cabinet
dangerous substances
tops
break space other functions offices vertical connections bathrooms
1 experimental lab physics dangerous substances/ Wet area cabinet for dangerous substances cabinet for chemicals working desks with stoneware/ceramic tops laboratory sink dark room storage single computer lab storage archive writing desk locker
Fig 143: Plan Diagram of Labs, Authors Fig 144: Plan Diagram of Labs, Authors Fig 145: Plan Diagram of Labs Authors
3 vertical
break
type
type 2 research lab
space other functions workshop server room dark room IT storage vertical connections / bathrooms type experimental lab
substances/ Wet area fume cupboard, point air
for
cabinet for chemicals working desks with stoneware/ceramic
laboratory sink storage: incubator/dryer refrigerator/freezer single computer lab storage archive writing desk locker type 2 research lab
type
1 : Experimental Laboratory Type 1 : Experimental Laboratory Type 1 : Experimental Laboratory
2 : Research Laboratory Type 2 : Research Laboratory
2 : Research Laboratory
Type
Type
Type
space
space
space
Break
Break
functions: Workshops Server room Storage Dark room Other functions: Offices
working space Storage/archive Writing desks Locker
Types of Laboratories
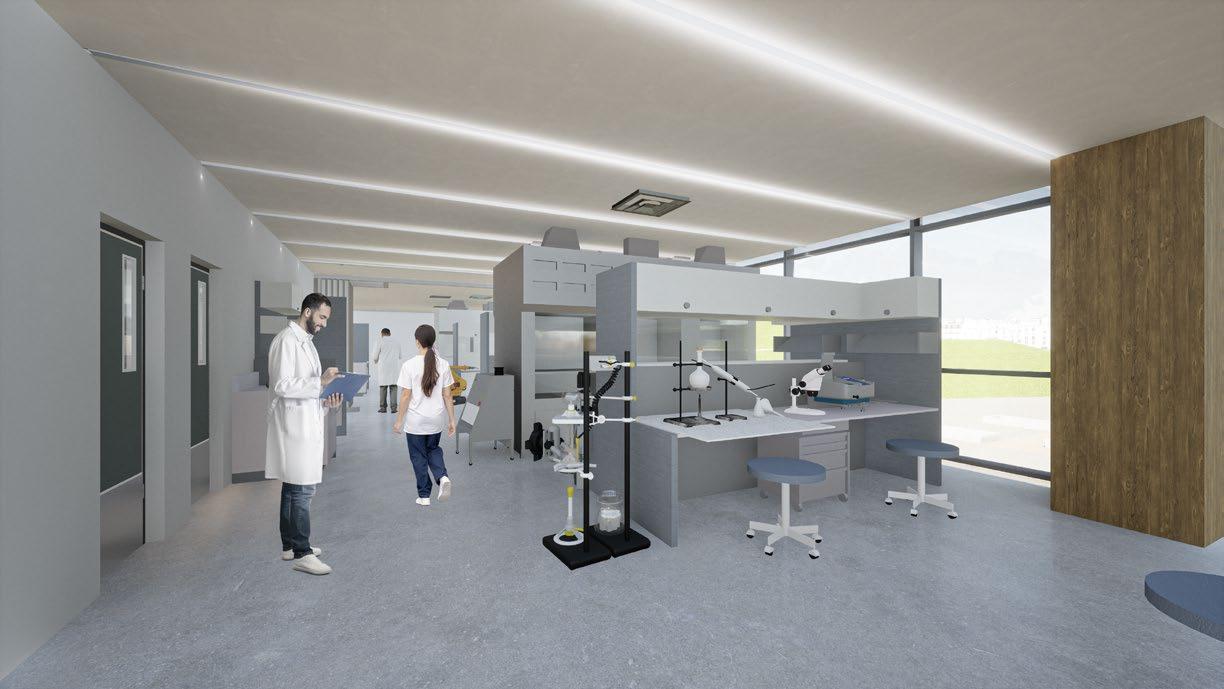
Research Center for Natural Sciences distinguishes itself from the most common lab building design with its visionary perspective. The functions of the labs are specified by considering Unimi Campus`s departments. The three building levels are dedicated to the laboratories, each with a specific function. These functions are Chemistry, Biology, and Physics. The laboratory typology is based on the central corridor, which infiltrated until the end of the space. These closed spaces are placed in between the central cores of the building to have continuous accessibility. This way, a private and healthy work environment throughout the area is provided. In light of the case study of the philosophy of laboratory design, the laboratory layout was created, and modules were developed. All levels were designed by considering community needs, and the aim was to create a vibrant atmosphere, such as having an exhibition on the first floor, lounges, and break areas inside the laboratory layout. Meeting rooms and workshop areas are also placed at the same level for working groups, usually composed of several teams.
Modularity: With respect to the general grid system of the building, laboratories have the rules of the grid depending on their types. The primary configuration of the labs started by using grids and modules, depending on the building shape. All the labs are classified by using 10 meters as a vertical dimension. The horizontal dimension changes between types, and it provides to have various design perspectives and interior distinctions.
Light - Facade: Having natural light was one of the essential design goals for laboratories. The building has a curtain wall facade system and openable windows at each laboratory. Curtain wall provides also weather protection and improves performance of the building. Considered laboratories the curtain wall has openable windows to have air circulation especially for the laboratories.In addition,along the corridor, there are opposite lab types with a glass interior skin so that researchers can see each other in both labs. Shading provides by interior curtains.
78
Fig 145: Interior render of the laboratory type 1, Authors
Types of Laboratories
Type 1 : Experiment Laboratories Type 2.1 : Research Laboratories Type 2.2 : Research Laboratories
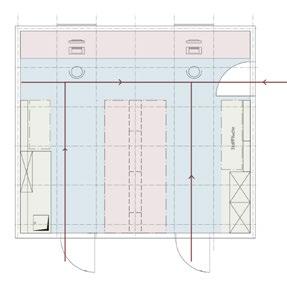
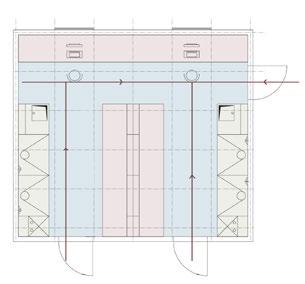
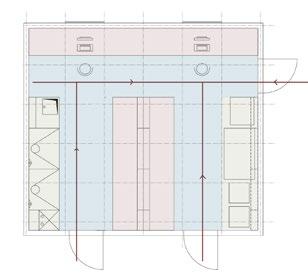
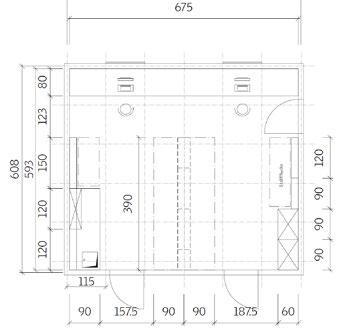
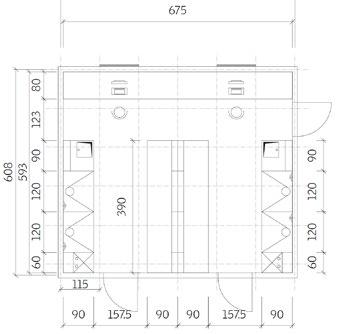
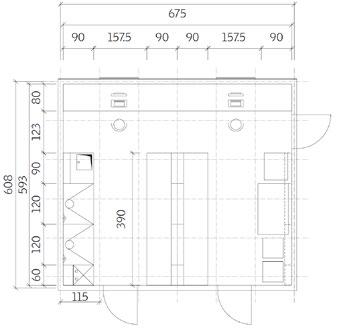
Type 1 is the experimental laboratory typology with a 10x10 grid. They consist of entry/exit from the central corridor, and it has support areas. Entry/exit work as a filtering zone between the corridor and experiment space. Chemistry and biology laboratories have cooling and incubator rooms to maintain their chemicals or other materials. Physics laboratories have a dark room for experimentation and storage of the equipment. All the experimental laboratories have working stations perpendicular to the window and separated from the walls. Distinct from the physics laboratory, chemistry and biology laboratories have fume boards. They also have a laboratory sink for sanitizing, called wet labs. Ventilation is vital for the experimental laboratories; respecting Neufert, rooms have a high rate of air exchange and frequently additional fume cupboards with air extraction. Each laboratory has airflow thanks to the ceiling, and all the equipment is hidden.
Function distibutions
Type 2.1 is the secondary typology of laboratories with a 10x7 grid, and it has direct space from the central main corridor. It has primary and supports areas. Supports areas consist of archives or storage and individual working spaces. Individual working spaces has also computers to enable research at the same place. Lockers are located near the entry for the researcher`s needs. The dry laboratory has working stations and writing desks for their research. Natural light has an essential role in people`s motivation. So, writing desks are in front of the windows to benefit from natural sunlight and site view. There is a distance between the writing desks and the support areas for special equipment. As last, Individual working spaces have glazed walls to provide interaction between other researchers.
Type 2.2 is the other typology of type 2 laboratories with a 10x7 grid. Research laboratories(Type 2.1 and Type 2.2) are located across from the experimental laboratories to conduct experiments and research at the same level. This laboratory type has a direct entry, and the space is completely dedicated to working stations and writing desks. Lockers near the fixed walls and working stations are placed perpendicular to the window, similar to type 1. Writing desks are located on the side of the corridor, which has glazed interior skin. Between the working stations and writing desks, there is a space for equipment which all the laboratories have. Besides, Type 2 laboratories are dry labs used for investigations without experiments. Similar to the other laboratories, each research laboratory has its airflow and a ceiling to hide the equipment.
entry / filtering zone central corridor special for labs )
cooling room / freezer dryer room / incubator
space for equipment
lab sink space for equipment
working station lab sink
fume boards working station
cooling room / freezer
working station working station
storage for chemicals / archive writing desks
fume boards
space for equipment space for equipment
single computer lab
space for equipment space for equipment experiment area
single computer lab
lockers
experiment area entry / filtering zone
working station working station working station
lockers space for equipment space for equipment
dryer room / incubator entry / filtering zone central corridor ( special for labs )
entry
writing desks
central corridor ( special for labs )
Fig 146: Function diagram, Type 1, Authors Fig 147: Function diagram, Type 2.1, Authors Fig 148: Function diagram, Type 2.2, Authors
79
Types of Laboratories
- Dangerous substances/ Wet area - Fume cupboard, point air exhaust
- Cabinet for dangerous substances
- Cabinet for chemicals
- Working desks with stoneware/ceramic tops
Chemistry,Biology, Physics
- Laboratory sink - Storage: - Incubator/dryer - Refrigerator/freezer
- Working desks with stoneware or melamine tops
- Laboratory sink
- Tall laboratory Fume Cupboard
- Space for equipment
type 1: experimental laboratory
345 260 90 305 1000
Moveable wall
Entry
Cooling room/Freezer
Working station with: Large equipment/possible wet area Fume Cupboard
155
180
150
90 1000
180
Working station with: Large equipment/possible wet area
155
Dryer room/Incubator 90
80 Fig 149 : Lab Type 1 Plan , Authors
1:50
Type 1: Experimental Laboratory
81 Fig 150 : Type
Type 1: Experimental Laboratory
1 Axonometry,Authors
Fig 151 : Lab Type 2 Plan, Authors
Type 2.1: Research Laboratory
- Single computer lab - Storage / archive - Writing desk - Locker
Furniture, fixtures, and equipment (FF&E): Working desks with stoneware or melamine tops Laboratory sink Space for equipment
type 2.1: research laboratory
Working station
Working station
Working station
Storage
Single computer lab
1315
Single computer lab
Locker
395 305 700 325 325 325 250 90
82
1:50
Working station Type 2.1: Research Laboratory
Accesibility and Circulation : Laboratories start from the first level, which we have semi-public areas. As mentioned, architectural stairs, cores, and wet areas are closer to labs. In contrast, to have only scientific functions at all levels, co-working spaces, exhibitions, and lounges for researchers are placed close to laboratories. The aim was to have substantial connections in these private spaces, which brought people together. To have continuous circulation, especially along the corridors, was one further aim. For this reason, all the entrance doors were moved inside not only for circulation but also considering an emergency exit. Accessibility is an important topic not only for circulation but also in case of fire. Cores should be accessible at a limited distance from each space.
Transparency: As mentioned curtain wall provides transparency to space and gives an opportunity to benefit from natural light.
Flexibility: During the preliminary design process, the focal idea was to create a collaborative, interactive space to connect the people was the general concept of the building. The same strategy is also applied to the labs. All of them are divided by moveable walls in case needing a larger area for experiments or group discussions. Laboratories’ interiors are designed considering these partition walls, and all the furniture is organized in this sense.
Visual Permeability:To support the interactive design concept, the type 2 laboratories have glass interior skin along the corridor, provides people to interact with each other during the research phases. These skins place mostly where the writing desks or individual working spaces are placed. From a safety point of view, the experimental labs have opaque fixed walls along the corridor.
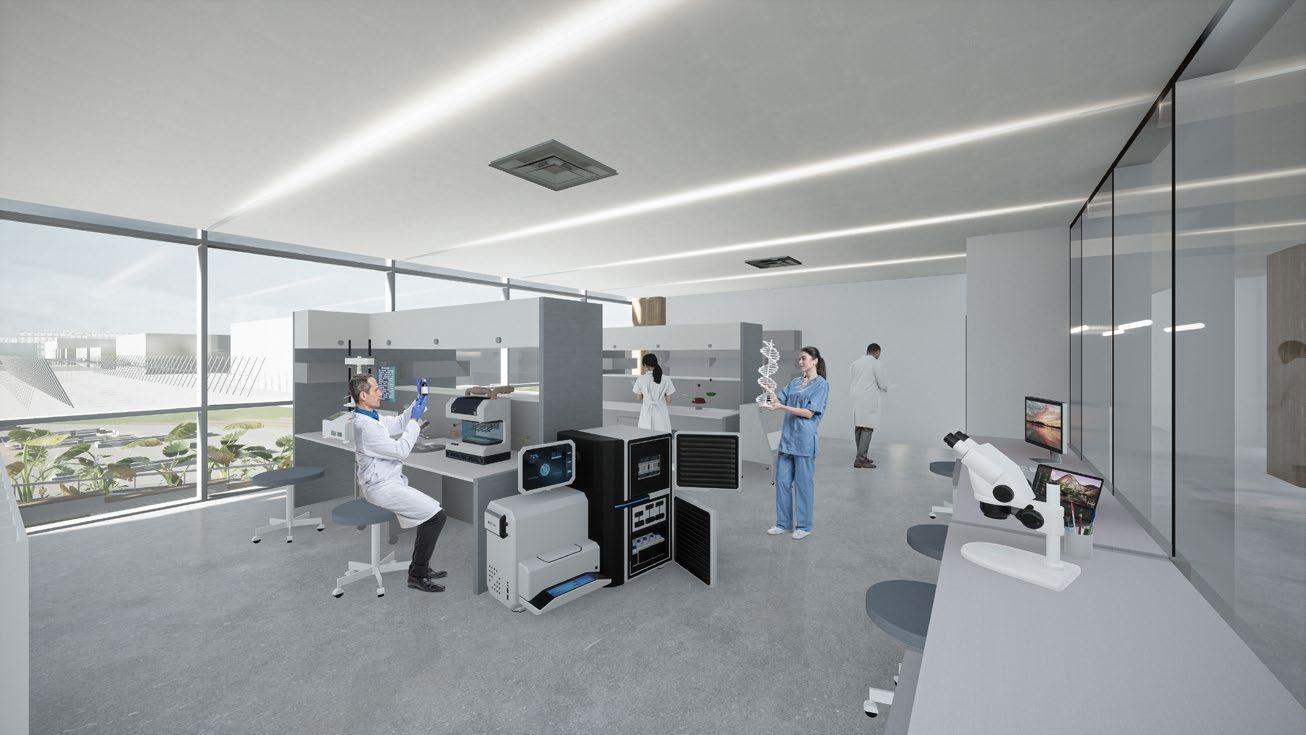
83
Fig 152: Interior render of the laboratory type 2, Authors
Type 2.1: Research Laboratory
84
Type 2.1: Research Laboratory
Fig 153: Type 2.2 Axonometry, Authors
Fig 154 : Type 2 Axonometry, Authors
Type 2.2: Research Laboratory
- Single computer lab - Storage / archive - Writing desk - Locker
Furniture, fixtures, and equipment (FF&E):
type 2.2: research laboratory
Working desks with stoneware or melamine tops Laboratory sink Space for equipment
Locker Working station
Working station with: Large equipment/possible wet area
Working station with: Large equipment/possible wet area Working station with: Large equipment/possible wet area
90 260 400 750 180 150 180 155
90 90
155
1000
85
1:50
Type 2.2: Research Laboratory
Fig 155 : Type 2 Axonometry, Authors
86
Type 2.2: Research Laboratory
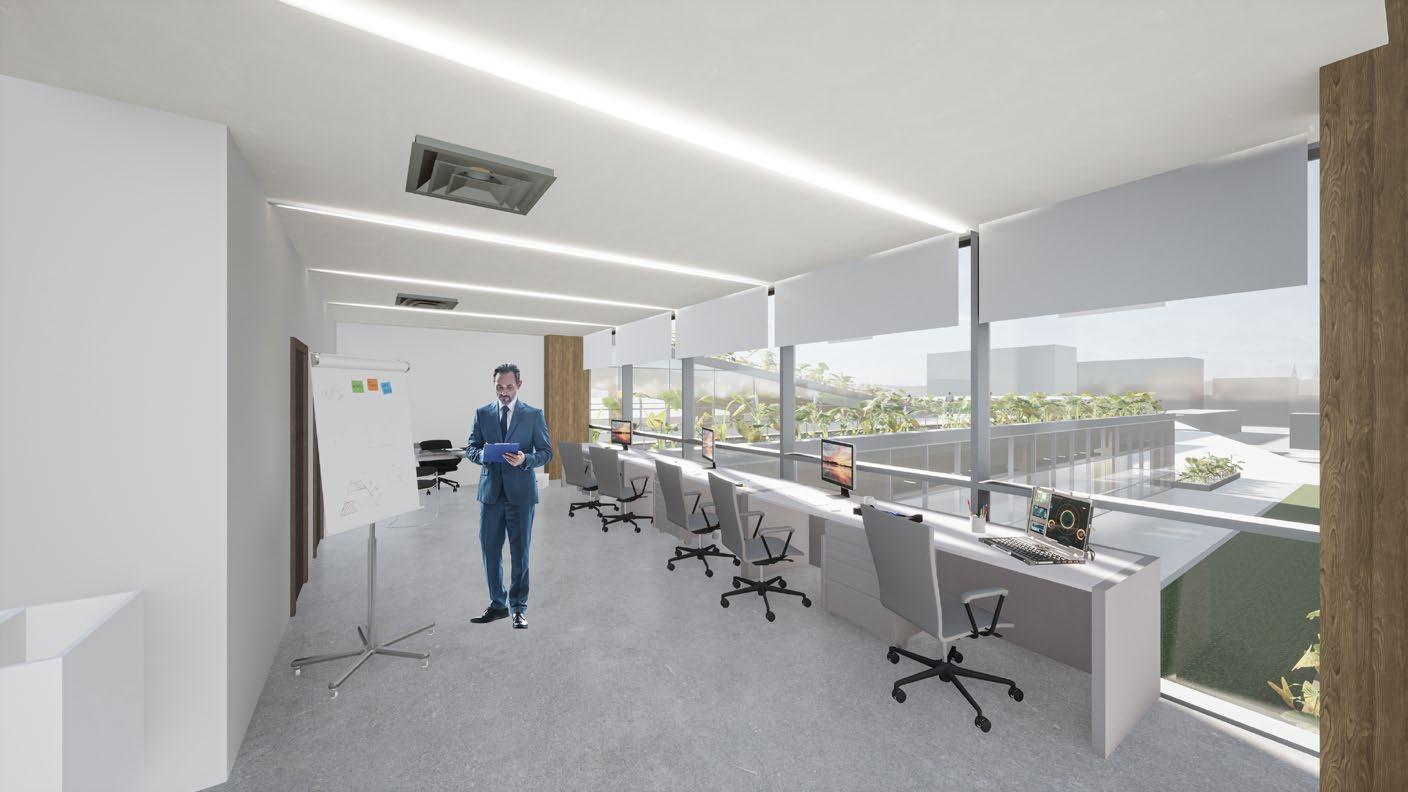
87
Type 2.2: Research Laboratory
Fig 156 : Laboratory visualization, Authors

88
Auditorium
Fig 157 - Render of the overhanging volume, Authors
89 Auditorium
Fig 159 - Axonometry of the auditorium, Authors
90
Auditorium
The pinnacle of the ascending volumes is the overhanging volume. The design of which came as a result of a long process of thinking and integration of discilines together. The conception of the structural system assumes an important role in the conception of the architectural space of the auditorium hall and in the definition of its spatial-structural type. Consequently, the design of the various components of the structural system, up to the careful choice of the sections of each single element, become part of the architectural language.
The auditorium was conceptualized as a semi-public space. The core located behind it made it possible to maintain a vertical connection with the common ground, as well as the other leves. However, it allowed this space to be completely separated from the rest of the laboratory areas.
We envisioned the auditorium as a node that returns the attention back at the overall district.
As a consequence, the alignment with the decumano is intentionally made with the purpose of capturing the whole context. The panorama generated through the triangular fixed windows frames the linear park, thus making it feel like part of the interior.
160 - Third Floor, Authors
Fig 161 - Third Floor, Authors
91
Fig
23 19 Level 3 / +14.00 Foyer Entry Entry Storage Technical space Technical space Foyer Conference Hall 17 15 Level 3 / +14.00 Level 4 +18.50 Level 4 +18.50 Foyer Auditorium
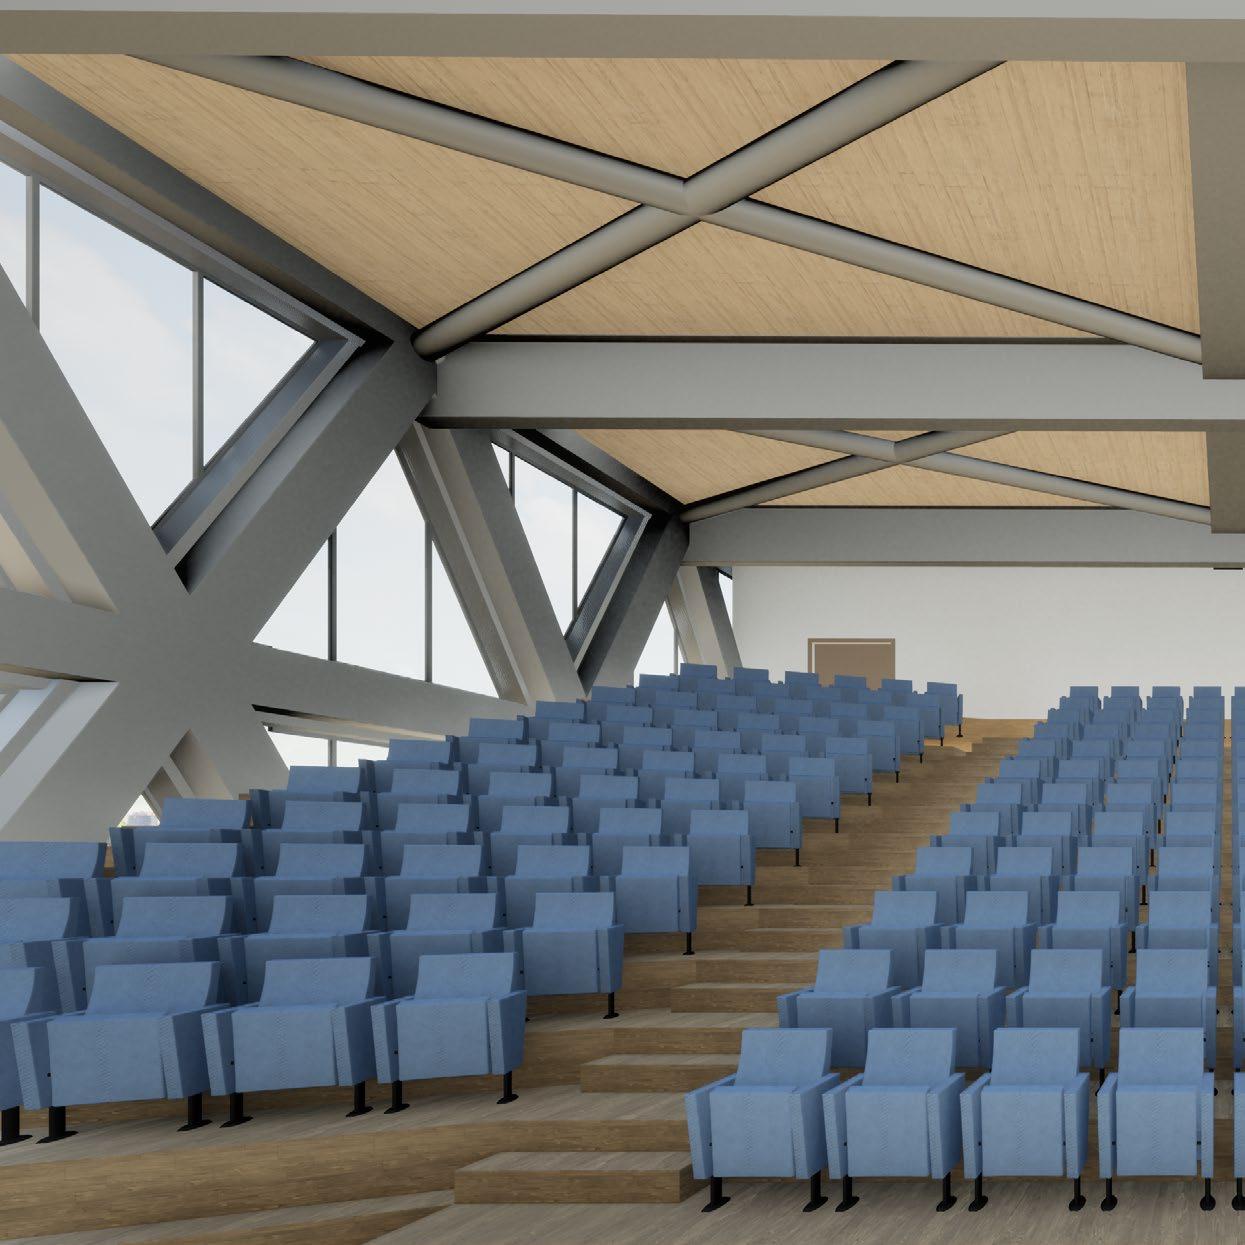
Fig 170 - Auditorium
Visualization
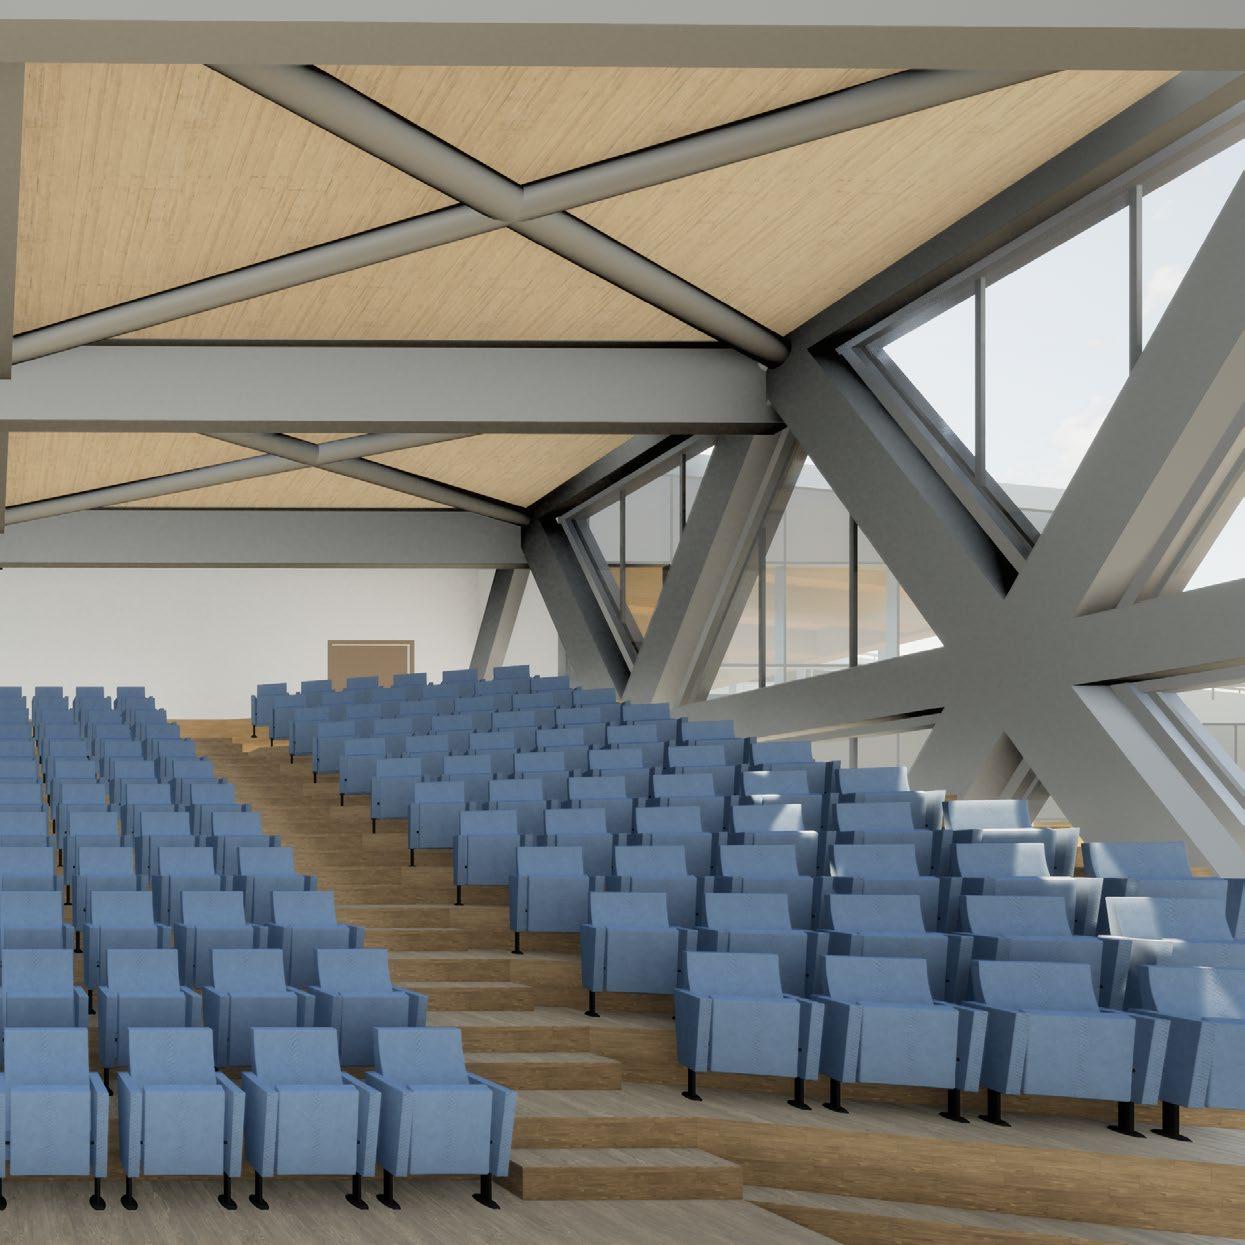
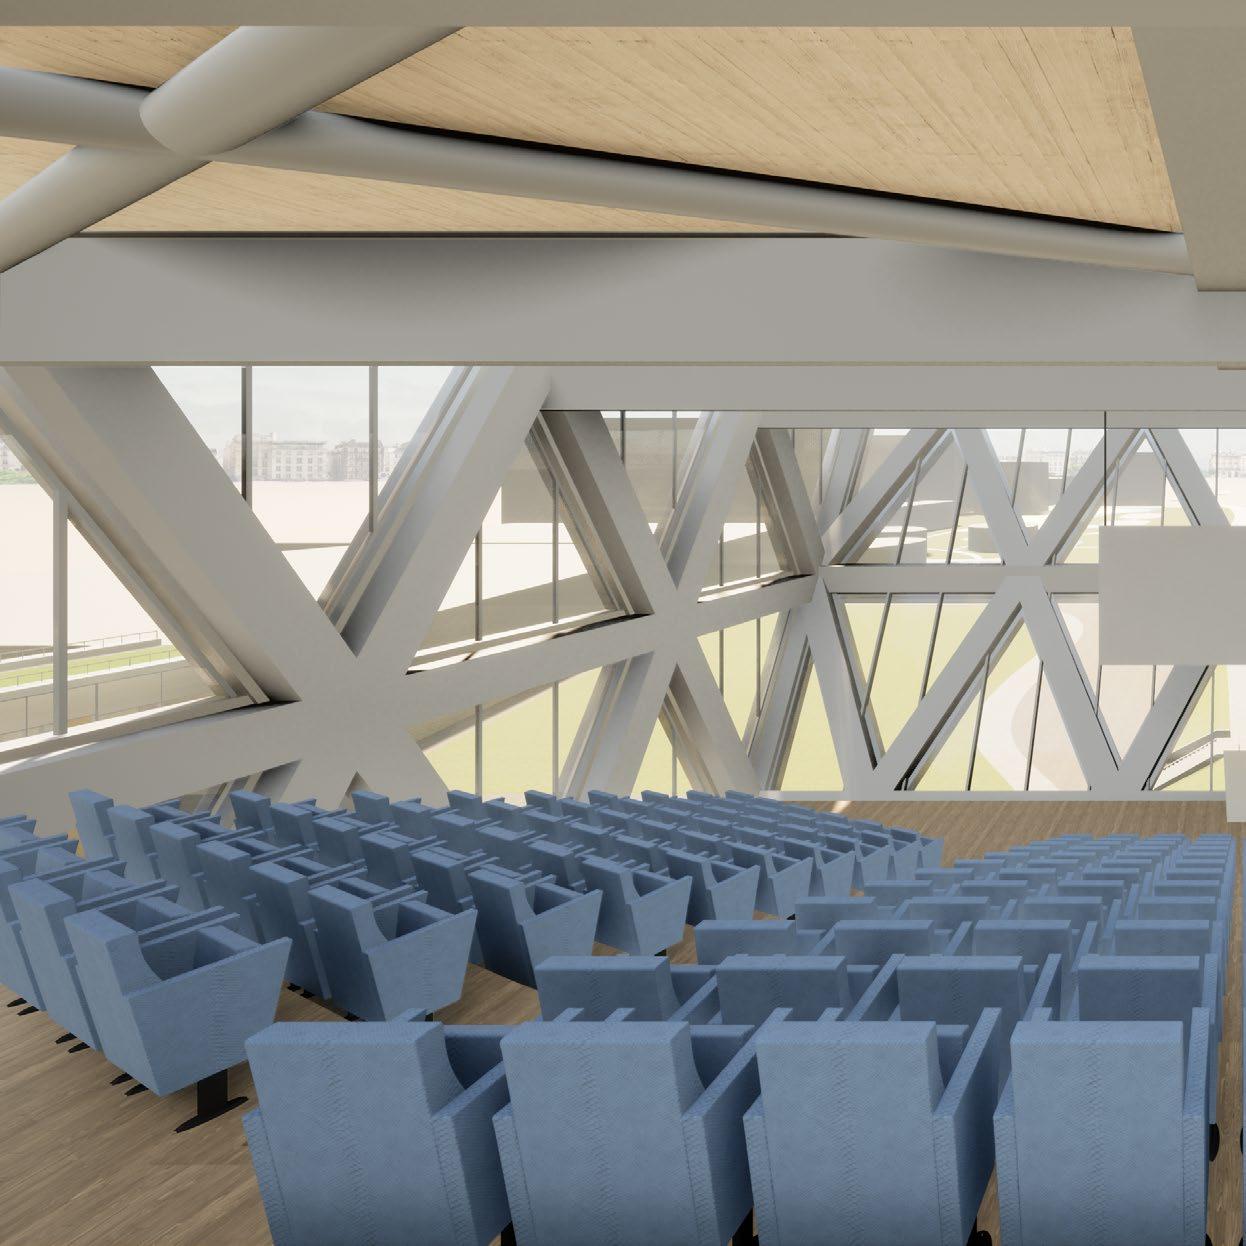
Fig
171 - Auditorium Visualization
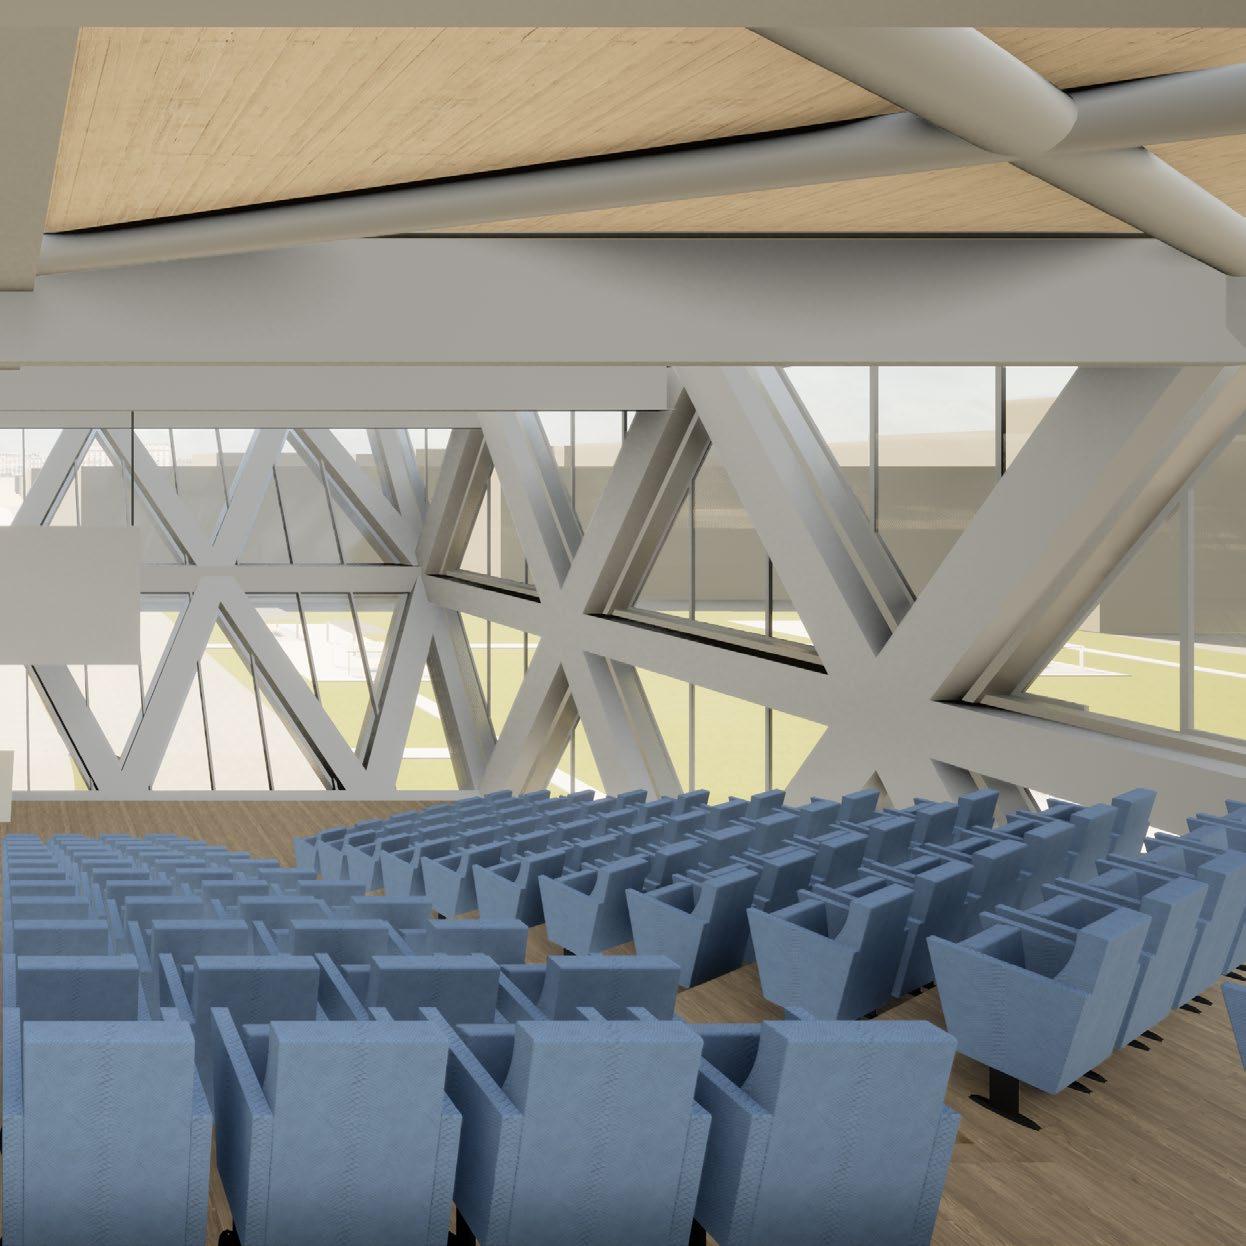
Fig 162 - East Elevation, Authors
Fig 163 - West Elevation, Authors
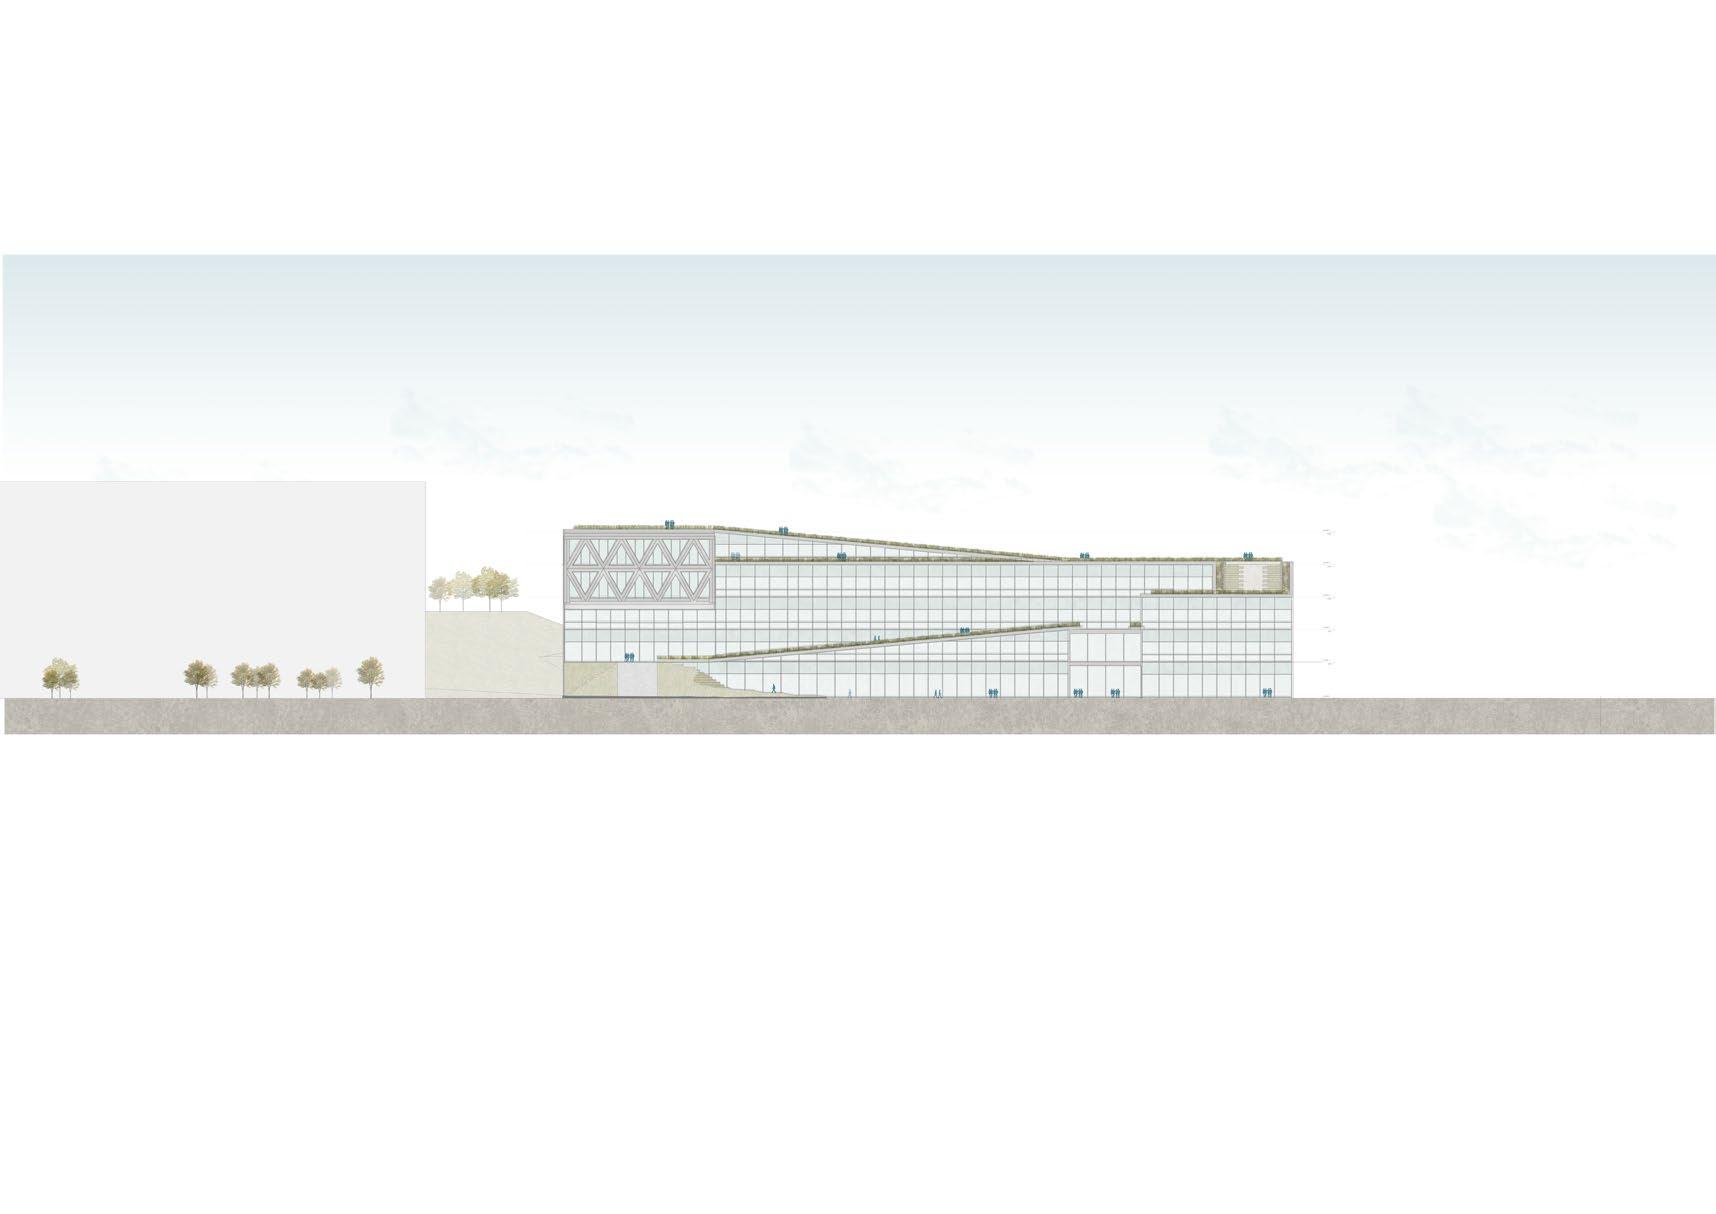
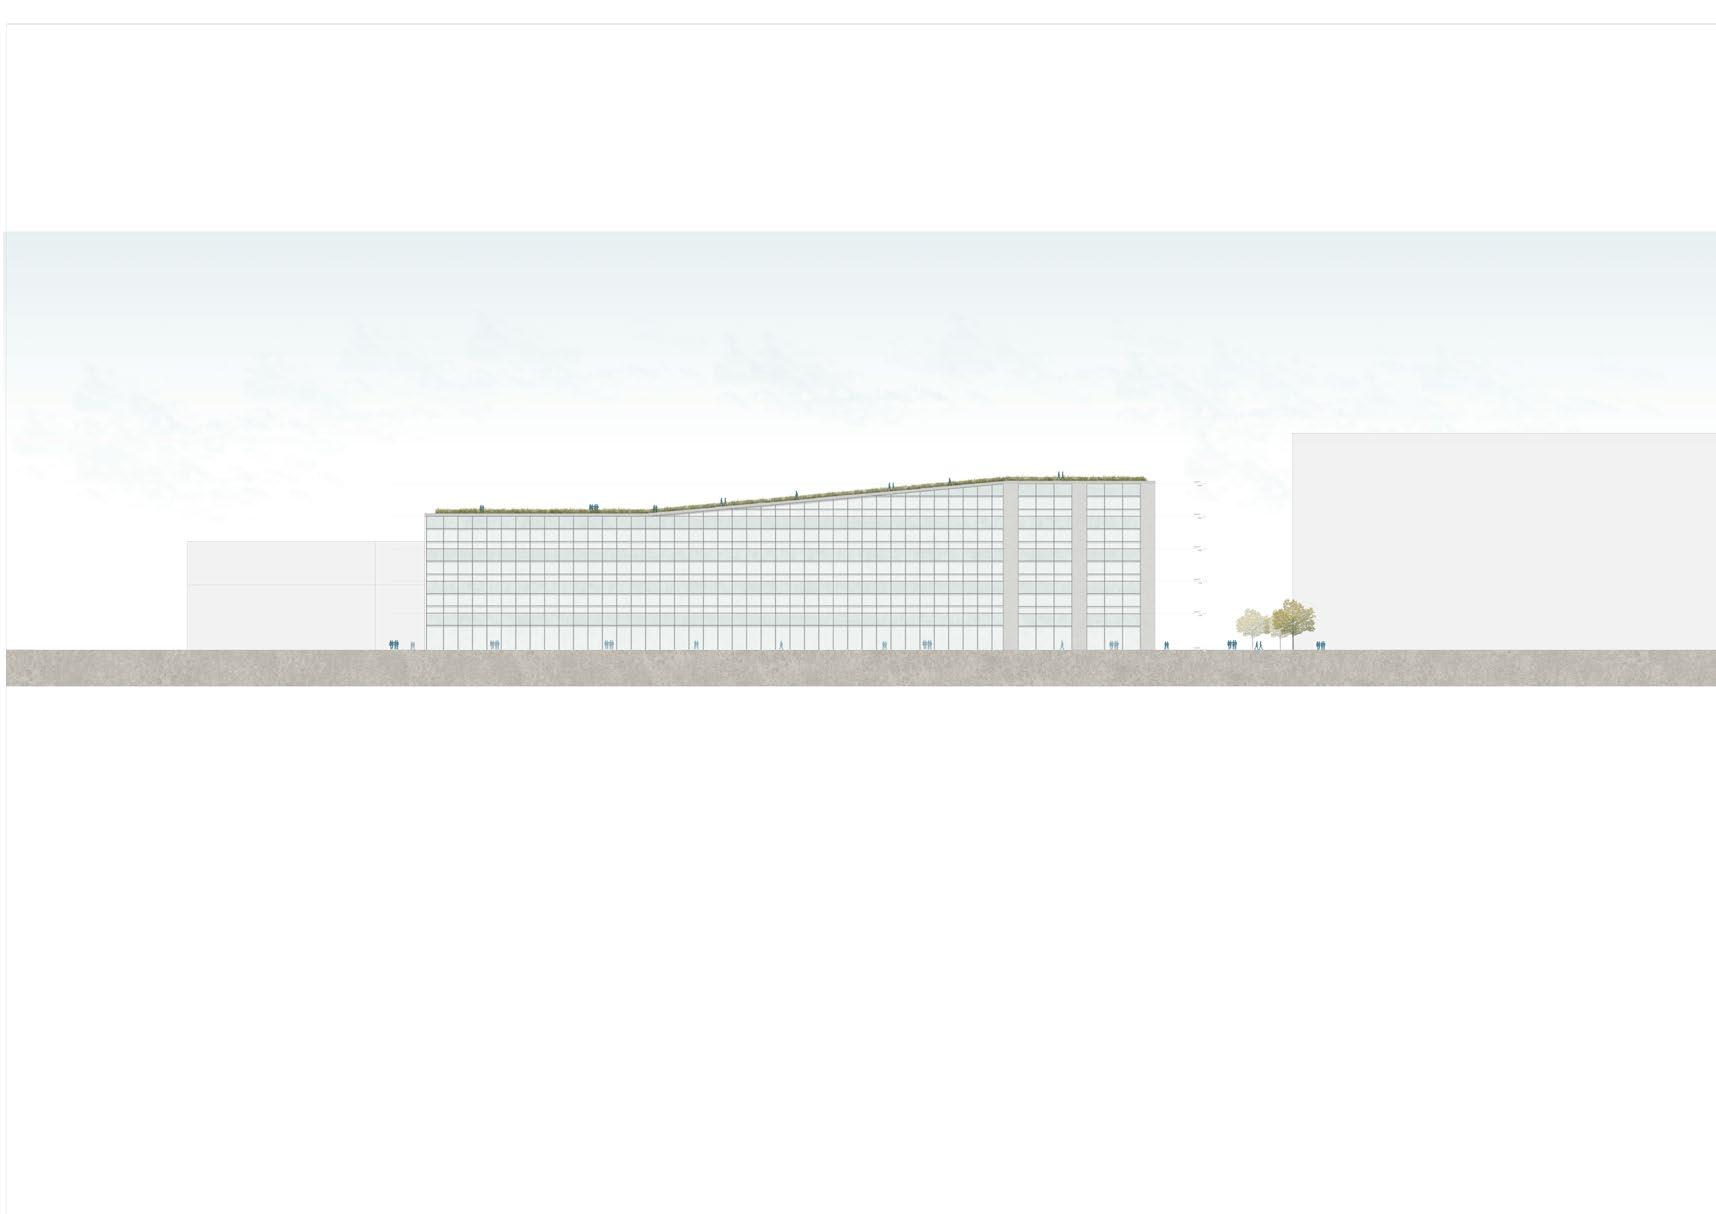
building envelope Building Envelope
The purpose of implementing a curtain wall system on the facade was to maintain the skin of the building as lightweight as possible, with the aim of highlighting even further the dynamic movement generated through the use of terraces and sloped roofs. Through its transparent characteristic, the envelope is able to interpret better the effect produced from the interior wooden structure.
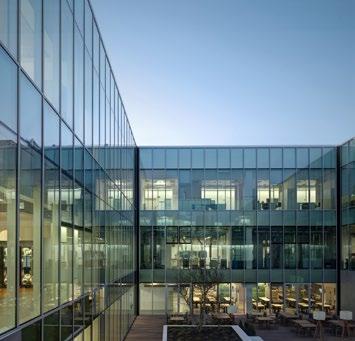
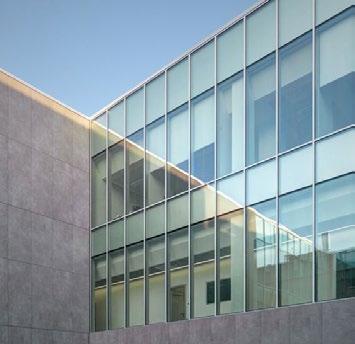
The stick system is designed based on the configuration of the building. As a starting point we utilized the griddle system. Its layout is articulated through a series of axes with a span of 10 meters. Thereafter, each of the spans is divided further into 4 fragments.
On the other hand, our aim is to maintain a main divison based on the floor-tofloor span. Simultaneously, two more subdivisions are implemented. The first one generates a surface utilized as a photovoltaic opaque element that hides the service systems, while also using the sunlight as a source of energy. The second one is a 1 meter separation above the floor slab that is applied as a security measure for openable partitions.
The facade of the workshop is composed of a transparent skin. The thin metal mullions arranged at a distance of about six metres, add aesthetic harmony to the structure as a whole without preventing natural light from illuminating the space inside. In addition, the glazing has also been given a special surface treatment to make it appear different in colour depending on changes in the sunlight. The cladding appears significantly lighter as a result. The visual effects created by it change according to the time of day and the observer’s position.
97
Reference: Manifattura Bulgari workshop in Valenza; Open Project Architects
Curtain Wall
Fig 164: Facade Exploded Axonometry, Authors
Fig 165: Facade Reference
Building Envelope
Fig 166: Facade Reference
Fig 167 - North Elevation, Authors
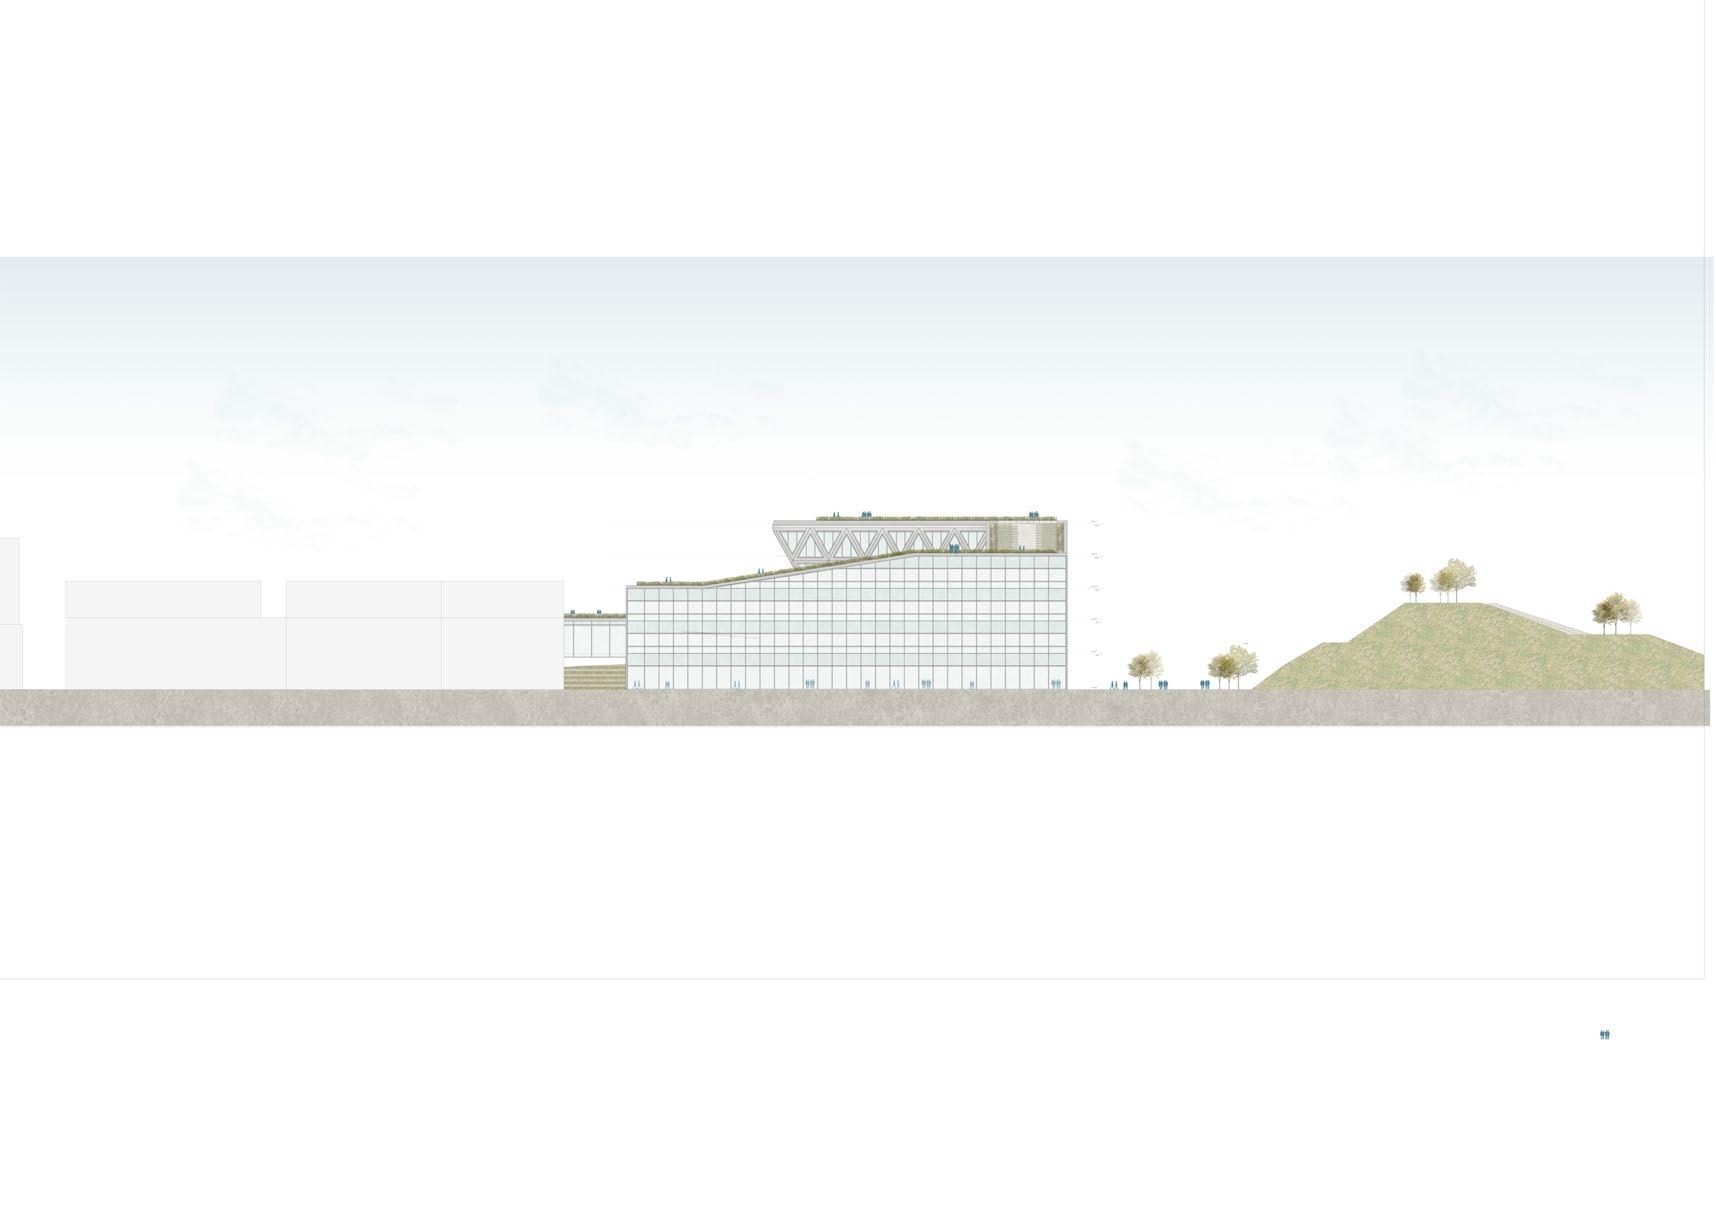
Fig 168 - Southern Elevation, Authors
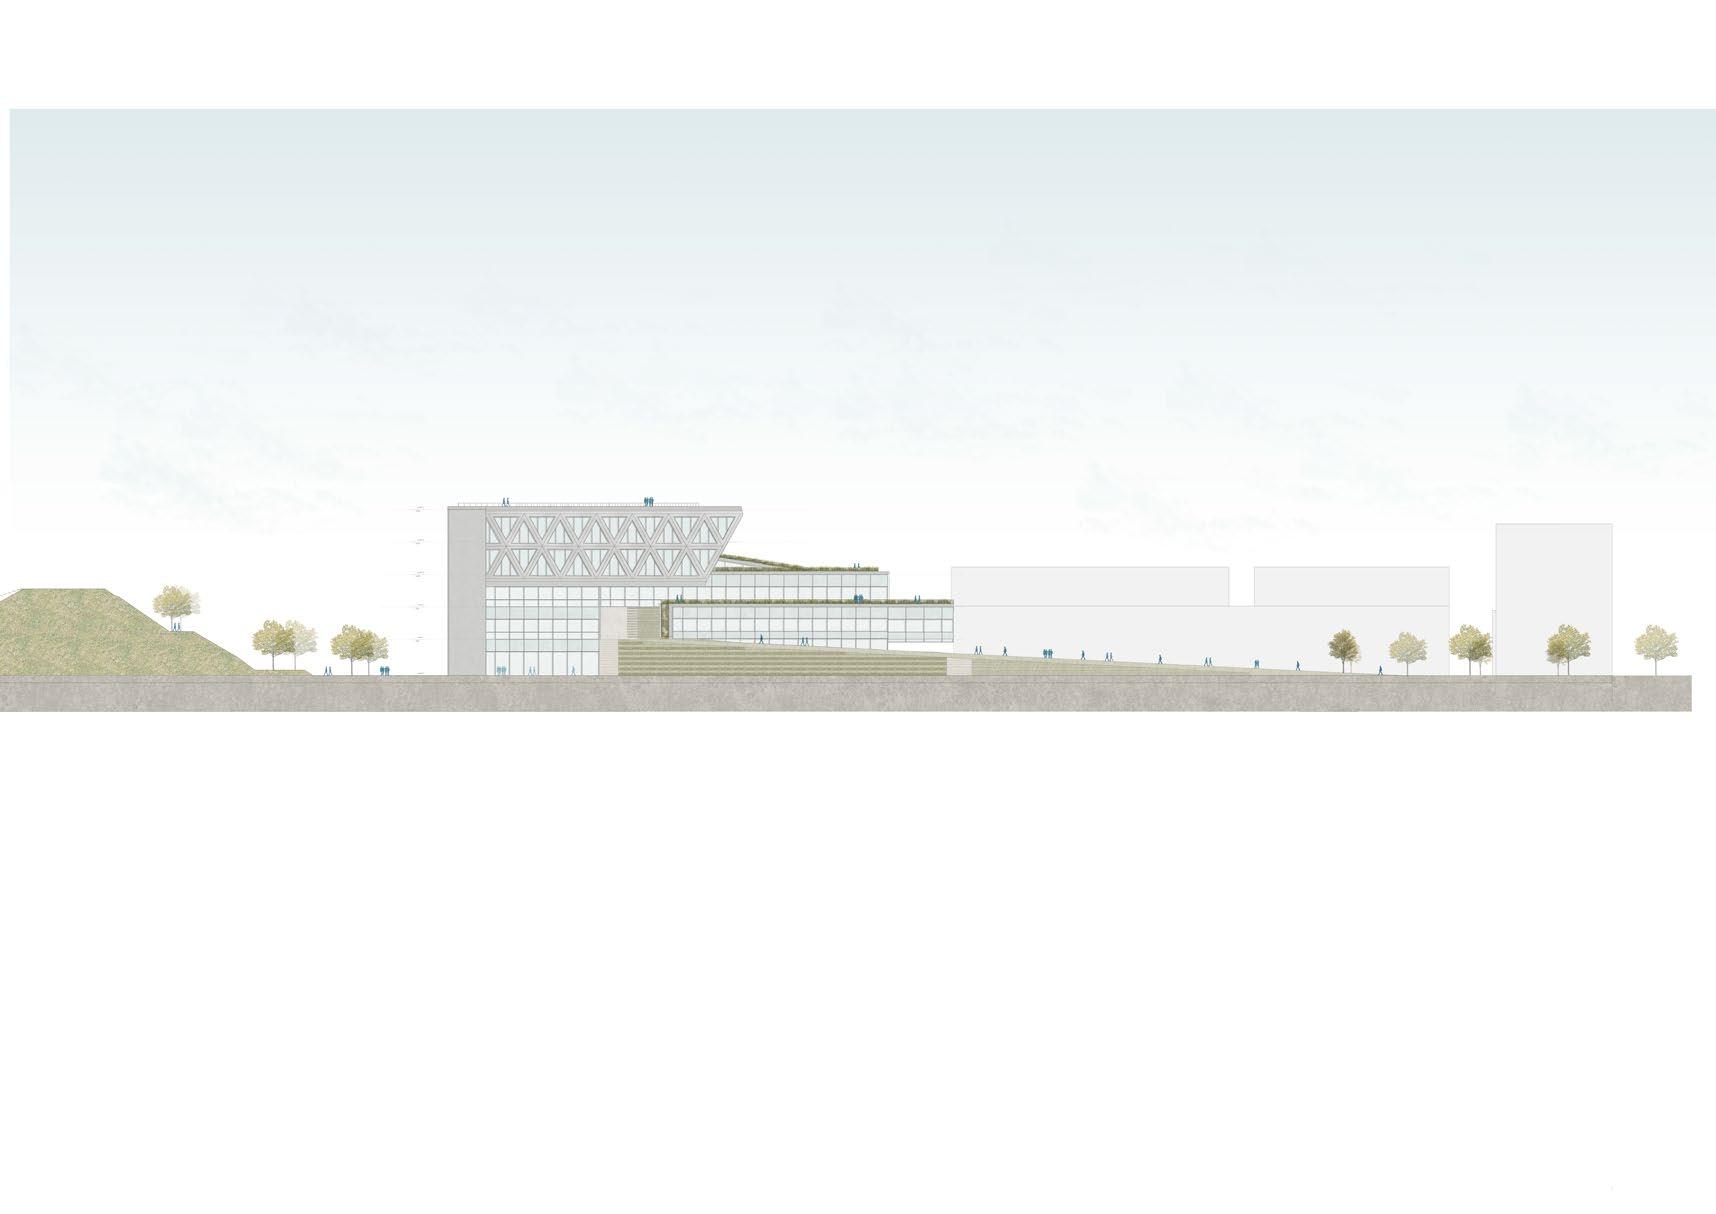
Building Envelope
The last two floors of the building facing the decumano stretch out of the auditoriums cantilever volume and extend towards the park. This was the morphological starting point of the cantilever. Moving forward, this volume was concieved as a distinctive element. As such, It had to reflect its characteristics also through its envelope.
The further integration of the structural comprehension of such complex building component was essential for the design process of the internal auditorium, as well as its exterior. The double floor truss that follows along the perimeter of the cantilever is the key element that aids with the purpose of maintaing the structural integrity of the overhanging auditorium. Simultaneously, the truss becomes a part of the architecture that this space has to offer.
The rectangular steel beam that composes the structure is then coated through an insulated aluminum cladding. As a result, in the junctions between the diagonal and horizontal beams a diamond geometry is generated. Concurrently, inbetween the triangular voids formed through the configuration of the truss, fixed electrochromatic windows are integrated.
Since the beginning of the design, before any calculation was performed, the overhanging volume was conceieved as an architectural element that generated a lot of weight.
As such, it required a reinforced concrete core behind it to counterweight all structural stress and strain produced. It additionally entailed an adjacent circulation space that would assist in creating an appropriate access point for the auditorium.
The reflection of the structural continuity of the truss and its translation into the vertical circulating space the core hosts are manifested throught the facade.
Consistently, the vertical ventilated facade system that shields the core is communicated as the point of origin of the complex volume that tries to fight through the gravitational forces.
99 Cantilever envelope
Building Envelope
Fig 169: Exploded facade axonometry, Authors
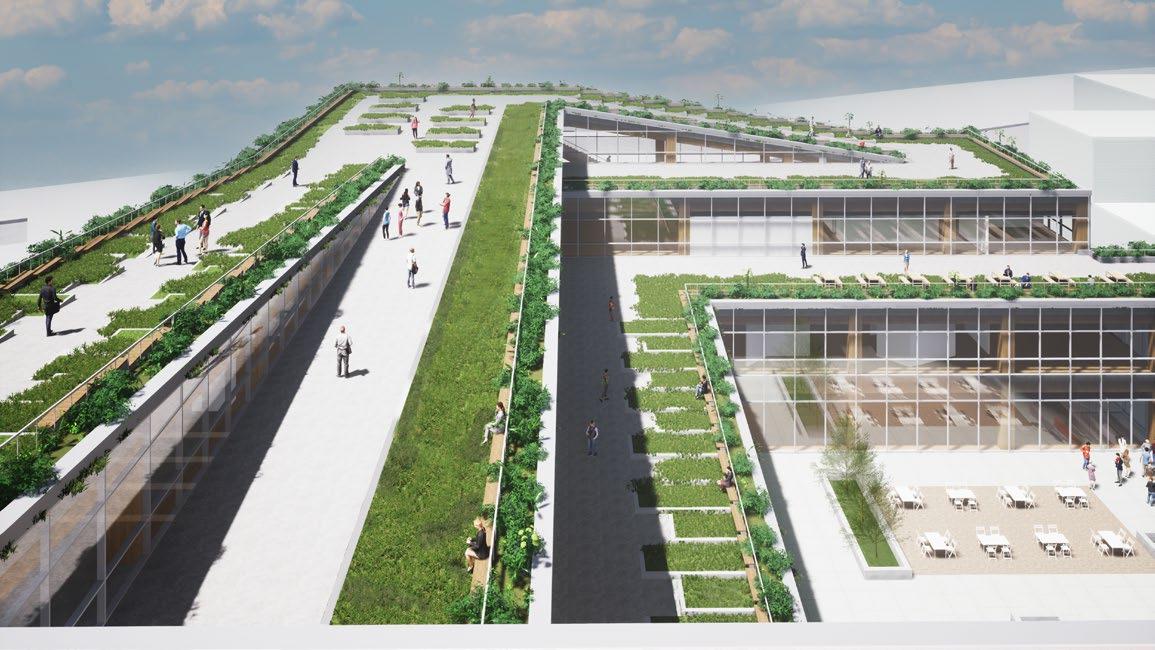
100 roof
design
Fig 170 - Exterior render, Authors
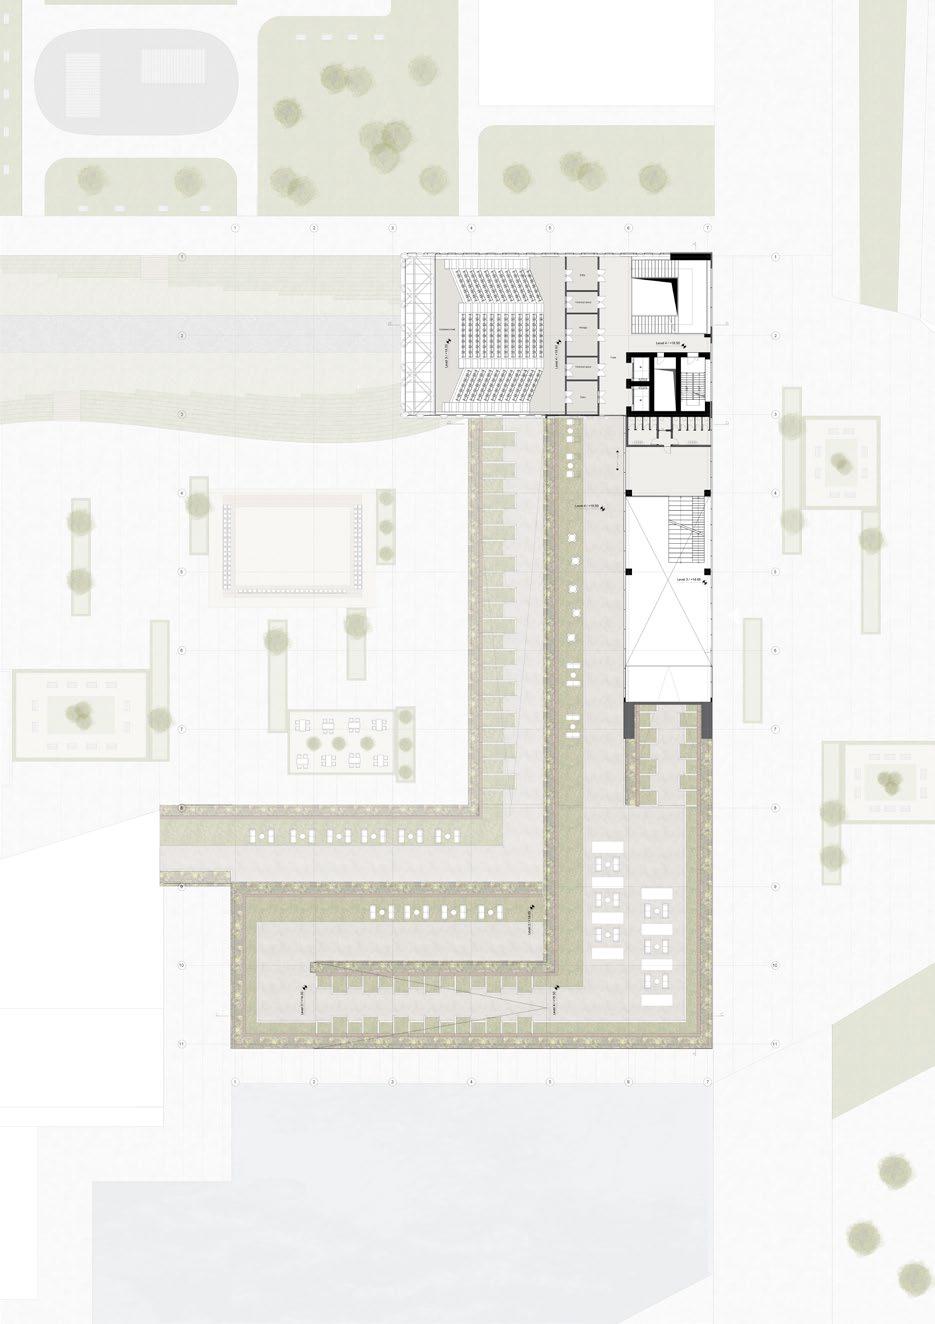

101
Fig 171: Fourth Floor Plan, Authors
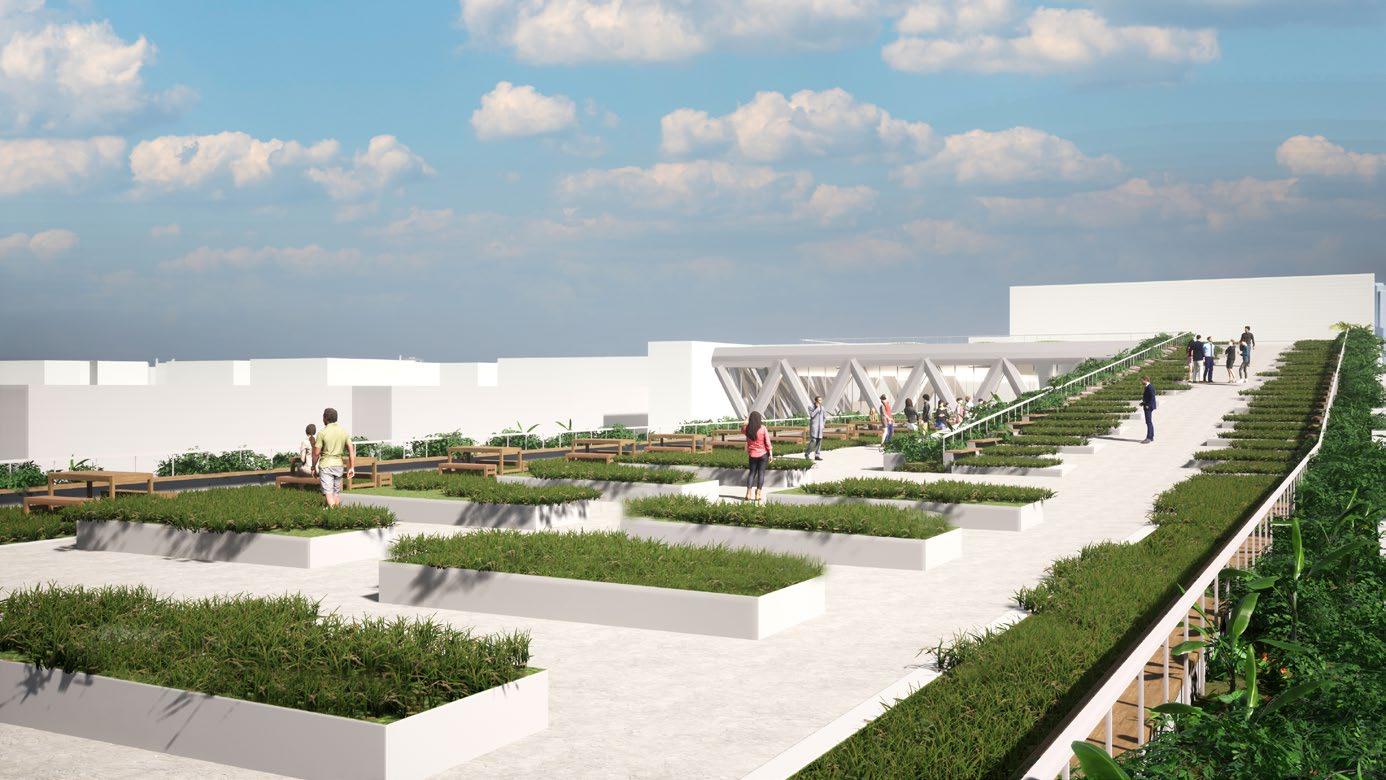
102 Roof Design
Fig 172: Roof Visualization, Authors
At the beginning of the chapter the roof was introduced as an essential component of the morphological design of the building. In general terms, the promenade formed through the system of inclined slabs and terraces was conceptualized as an open recreational park.
This initial concept is actually a starting point for the development of the roof. Our intention is to further transform the long segments originally created into pathways, as well as sitting green areas and non-accessible higher vegetation. For this reason, we have horizontally fractioned the ramp along the inclination and subsequently generated breakpoints consisting of green platforms and benches.
Organization
The whole concept is further on brought together into one final axonometric drawing, which shows the relationship between the platforms, the sitting area and pathway.
The parapets flanking the above mentioned layout of the inclined slab played a key role in the expression of the roof as a crowning ingredient. We designed the parapet as an element which emphasizes even more the dynamic perception that characterizes the volume. We did so by maintaining a distace from the pathway and sitting platforms, while incorporating higher vegetation to act as an outline of the roof. Furthermore, the aluminum sheathing that encloses the top of the curtain wall keeps a very low height, consequently attempting to shift the focus towards the vegetation.
103
Fig 173: Roof organization diagram, Authors
Concept
Roof Design
Fig 174: Roof Axonometry, Authors
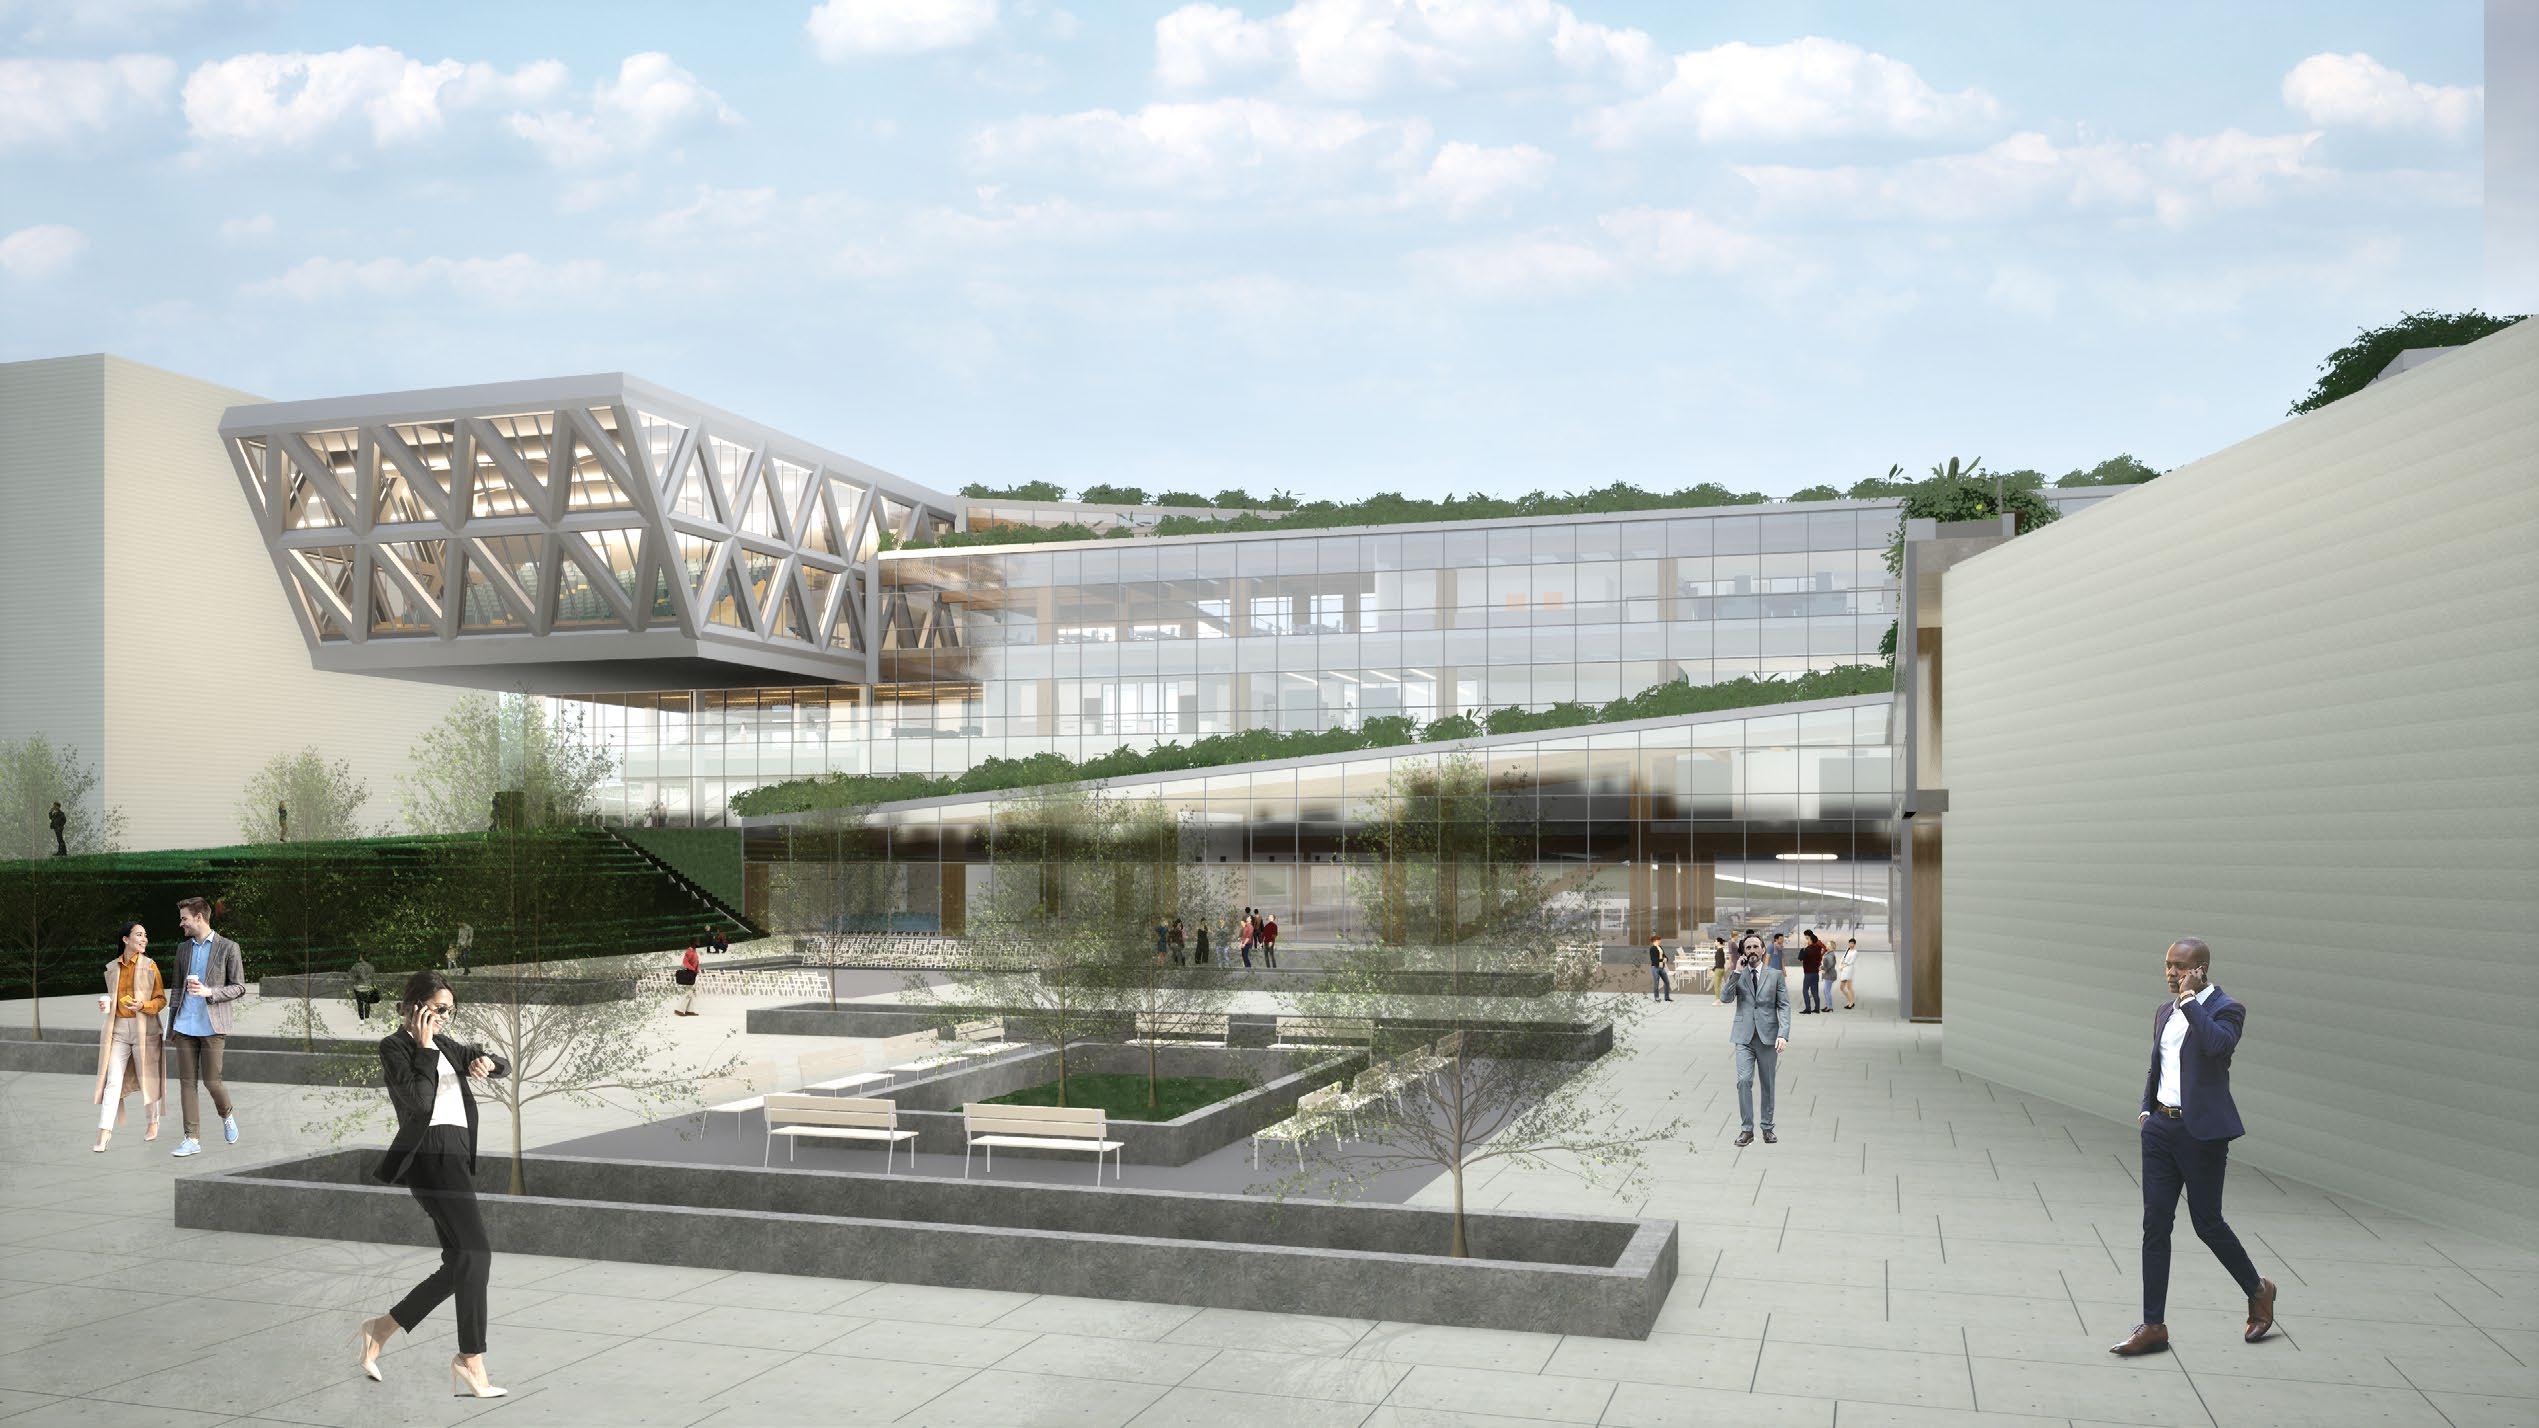
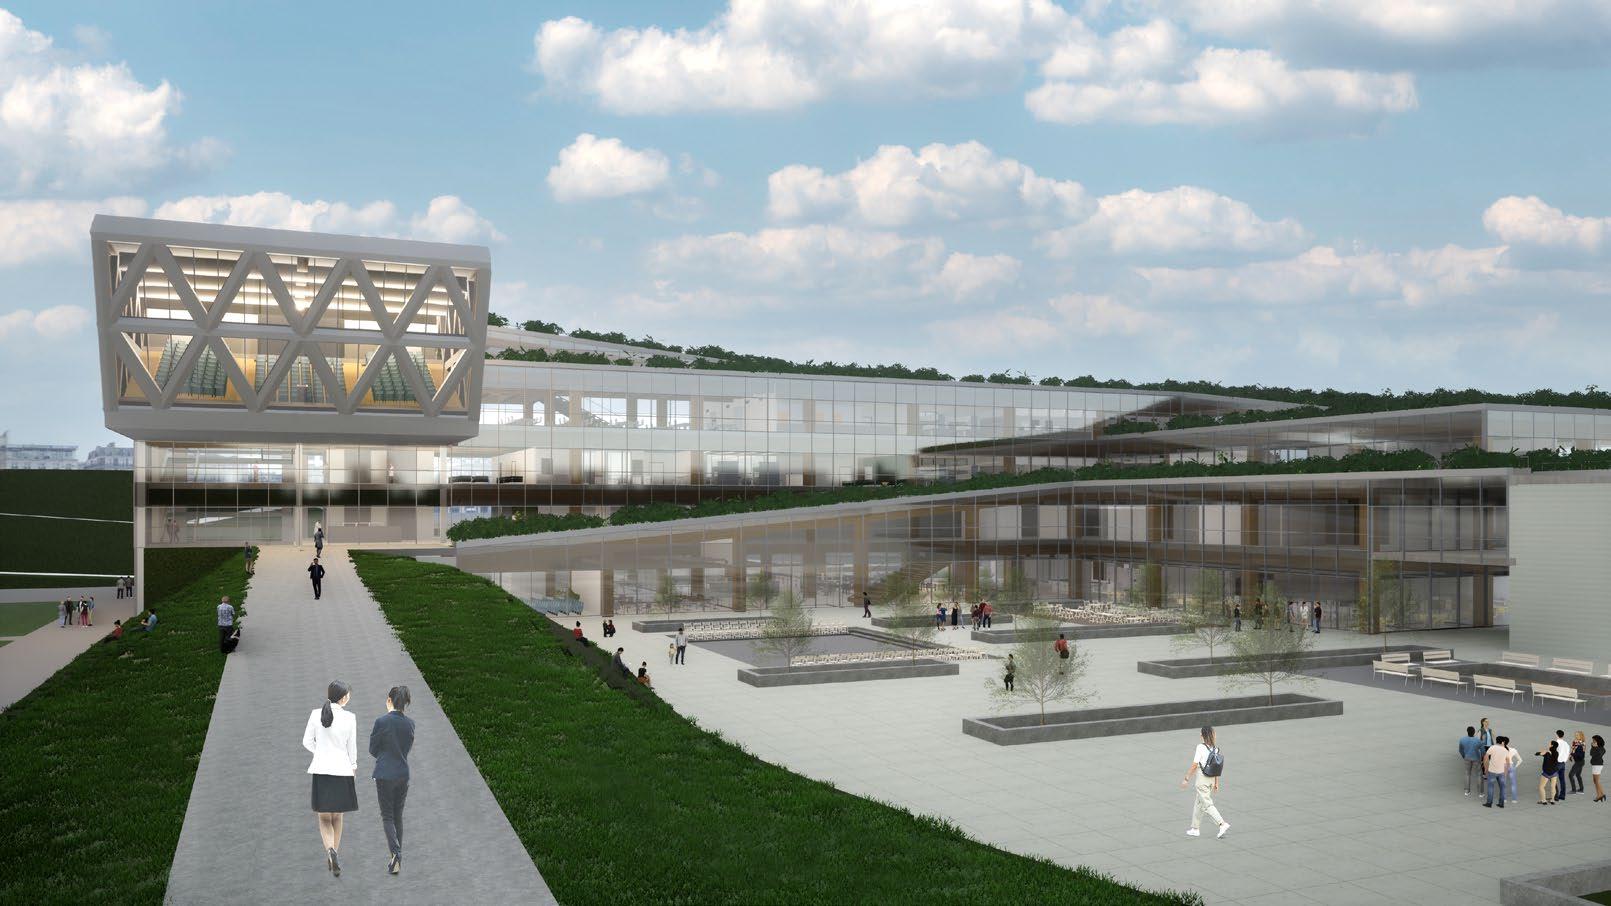
106
Roof Design
Fig. 175 - Exterior render of the ramp and building , Authors
The manifesto is a drawing which aims at explaning the concept behind our project in the best manner possible. As such, it needs to combine all the elements previously seen throughout the chapter and integrate them into one unifying representation.
We began the process by creating a section along the overhanging auditorium with the purpose of illustrating the structural system composing it, as well as the interior environment created inside and its relationship to the core behind. Afterwards, we generated
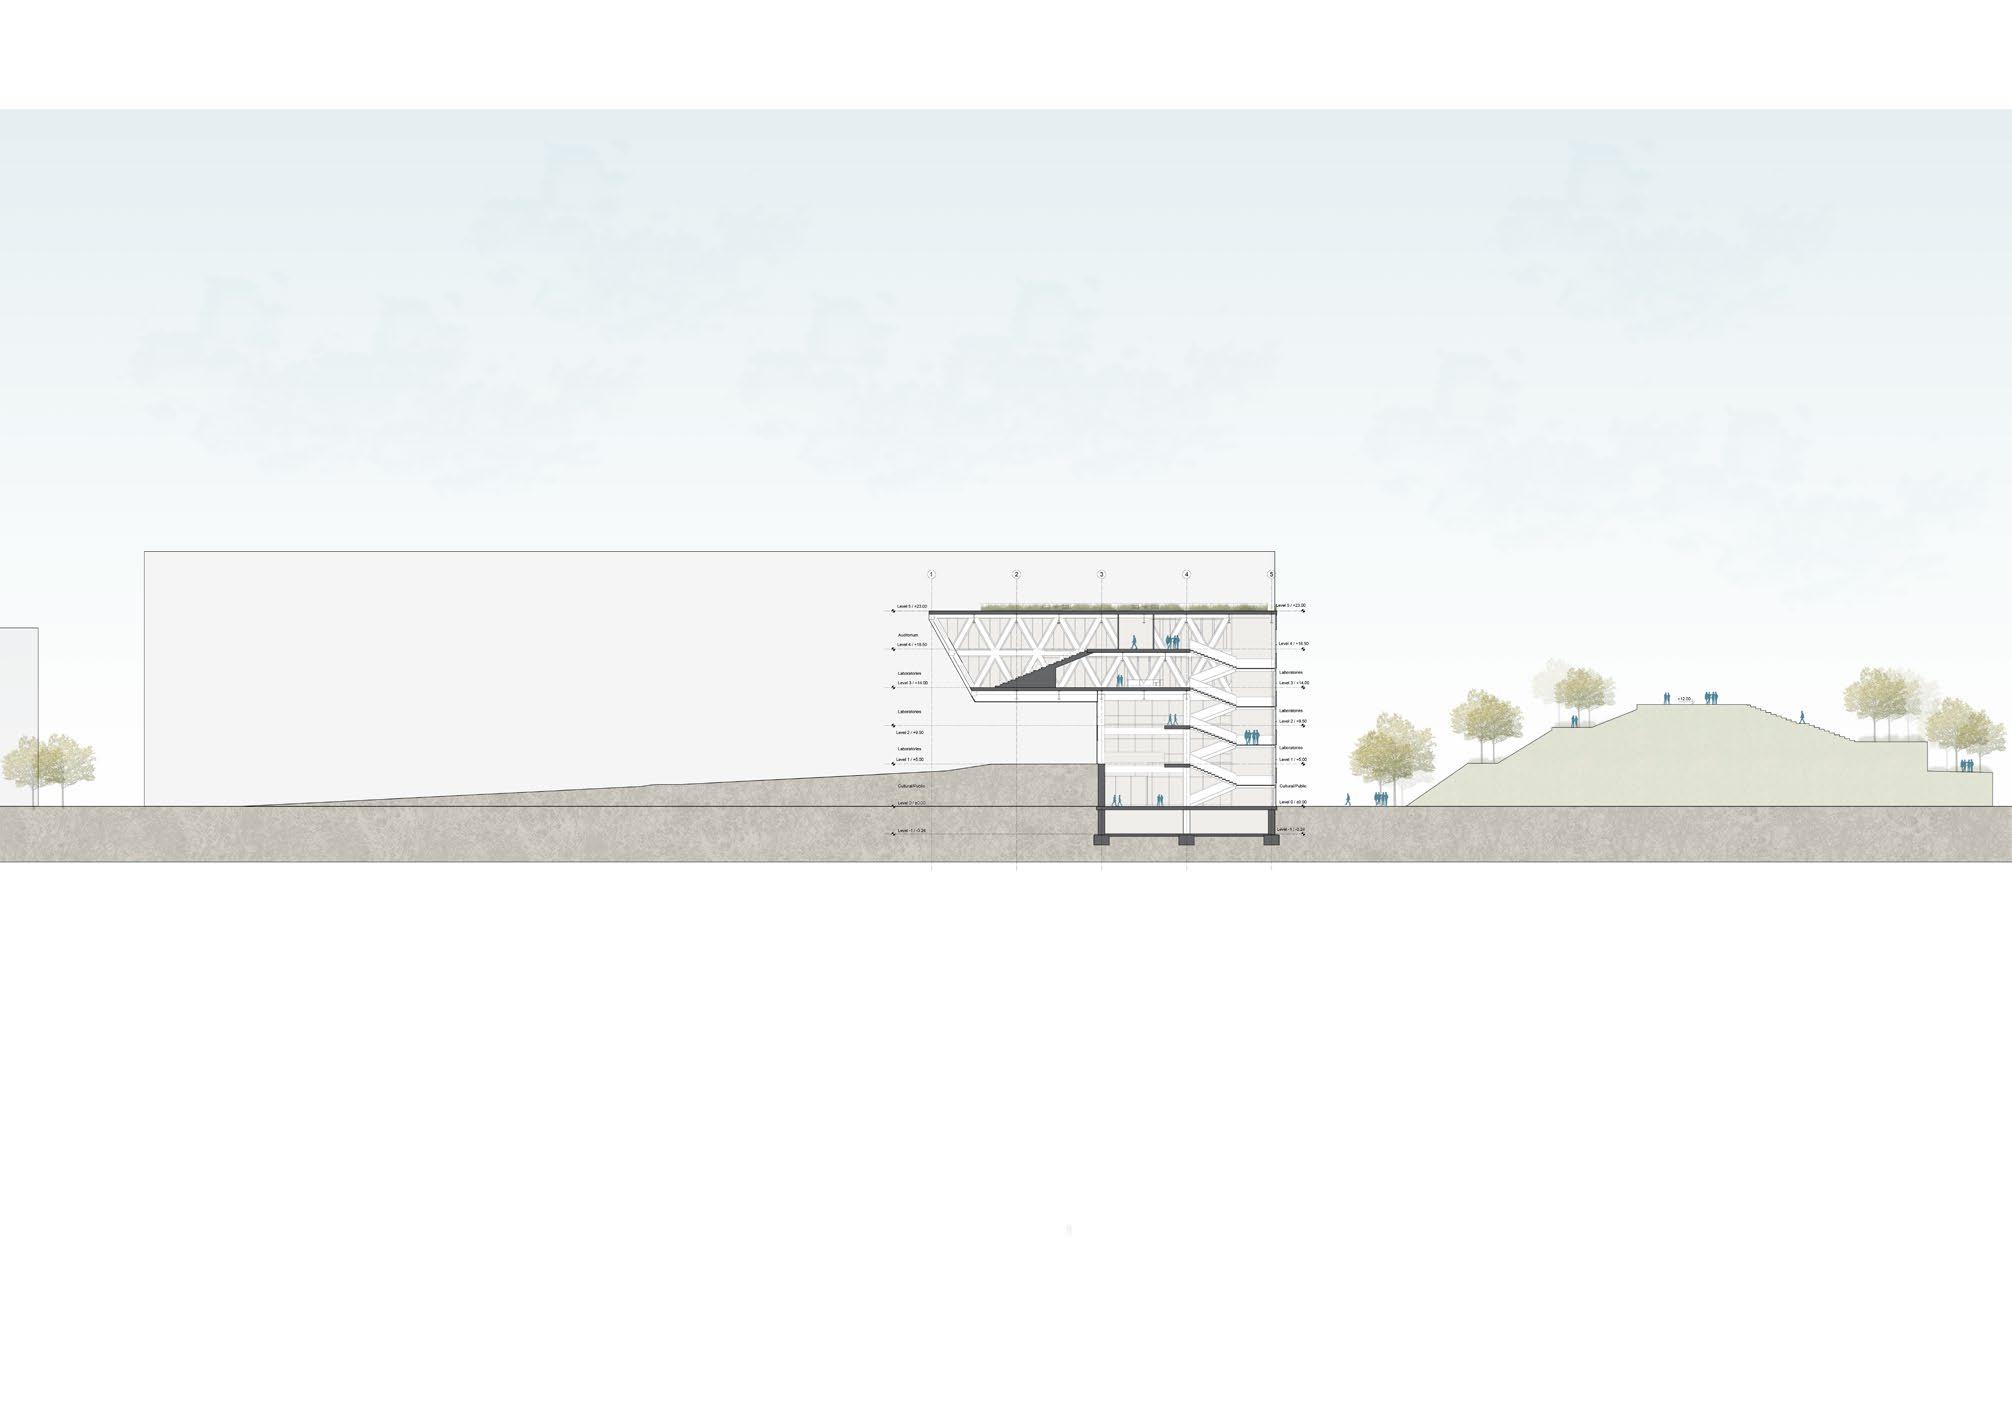
manifesto
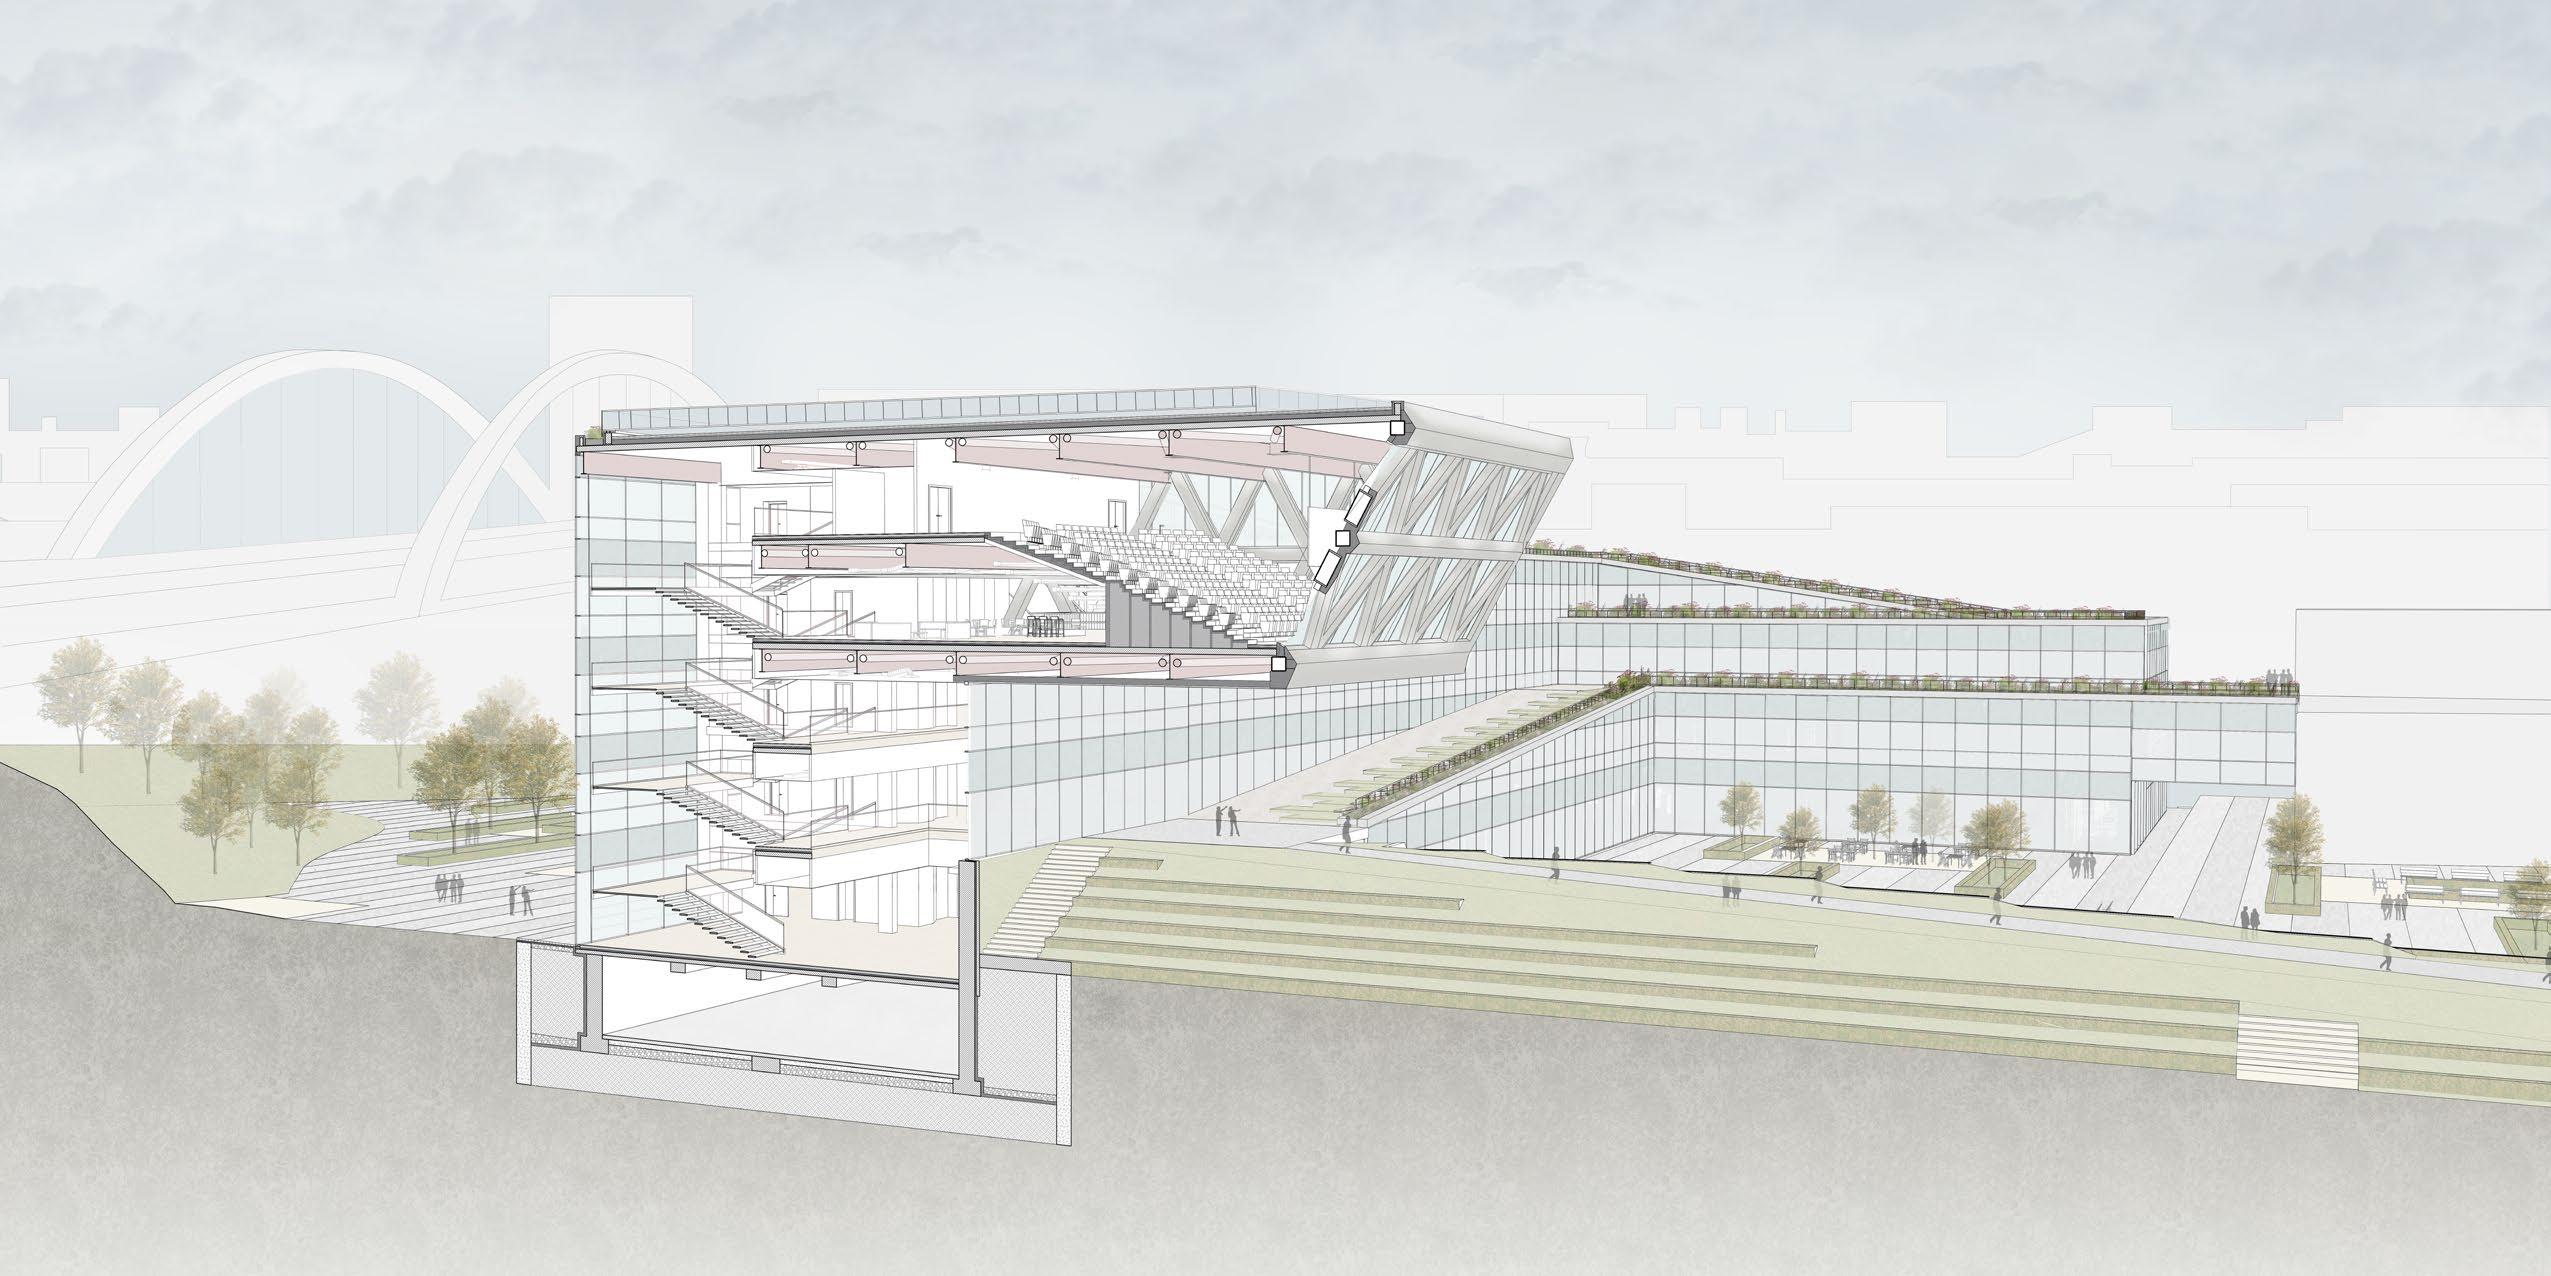
110
structural design
4
Fig 177: Structural Axonometry, Authors
112 Structural Concept
structural concept
Throughout this chapter we are going to explain more in detail the main structural concepts already introduced in the building design. Through illustrations and calculations, we are going to represent in a hierarchic manner how the structural components are designed.
Our calculations are separated into two segments. In the first one, we have analysed the cross laminated structure, starting from the slab weight, secondary beams, primary beams and finally the columns.
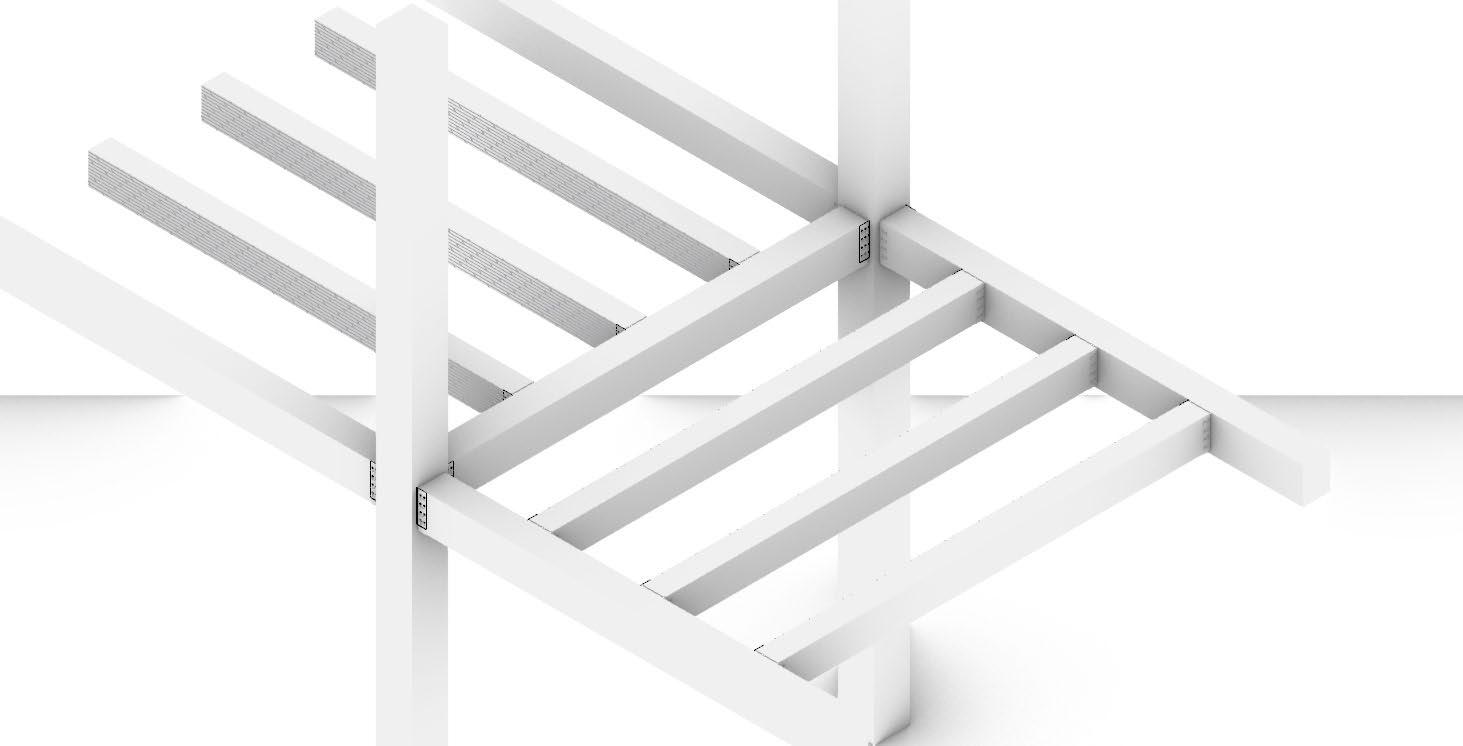
While in the second segment we have focused in the design of the structure of the cantilevered auditorium. Thus, we have explained how the long span secondary beams are resisting the large moments and shear forces, as well as how the double height truss is working in resisting the stresses and strains.
In addition to this, we have further represented detailed conncetions of the members in the x-lam construction and the steel structure.
113 Structural Concept
Fig 178: Wooden structure connection, Authors
114
Structural Concept
Fig 179: Structural Axonometry, Authors
We have started the calculation of the cross-laminate structure by understanding first the total weight generated on the beams and columns at the roof level of the building.
The total weight of roof is produced by the structural slab in combination with the covering layers above. In the adjacent section we have represented the layers composing the roof, while further below we have placed them in a table. .
Initially, we have started with the structural slab, which is made of cross laminated timber. It consists of 7 boards glued together, each layer perpendicular to the other. Combined, they give a total height of 240 mm. The unit weight of the x-lam is taken as 500 Kg/m3 = 5.0 KN/ m3. This value is multiplied by the height of the slab, in order to give us the weight over the area of the slab. Thus, we get a total weight equal to g1 = 1.2 KN/m2. All the non structural layers of the roof are: the soil, the gravel, screed, insulation and partition walls. They give a total of g2 = 9.7 KN/m2. The live load is taken Q = 4 KN/m2
1. Load information
1. Load information
Beam Lenght L 10m 10000mm
Beam Lenght L 10m 10000mm
Influence area width "a" 2.5m
Influence area width "a" 2.5m
The secondary beams we have chosen have dimensions of 700x500 mm. While, for the primary we have selected parameters of 800x500 mm. Furthermore, the cross laminated timber class we have taken into account is C40.
It has a fm,k = 40 MPa.
The design strength is: fm,d = 0.8 * fm,k / γM fm,d = 25.6 Mpa
Fv,k = 3.8MPa. fv,d = 0.8*fv,k / γM. fv,d = 2.43 Mpa.
Linear load g1' 1.750kN/m Dead load: Beam
Linear load g1' 1.750kN/m Dead load: Beam self weight
Dead load: Floor self-weight
StructuralX-lamslab1.0m1.0m0.24m5kN/m31.2kN/m2
Area Dead Load G 10.86kN/m2 Dead load: Floor Self weight Linear dead load g 27.15kN/m
Area Dead Load G 10.86kN/m2 Dead load: Floor Self Linear dead load g 27.15kN/m
Area load g1" 1.2kN/m2
Dead load: Floor self-weight
StructuralX-lamslab1.0m1.0m0.24m5kN/m31.2kN/m2
Area load g1" 1.2kN/m2
Area load Q1 4kN/m2 Linear load q1 10.0kN/mLive load: Residential
Area load Q1 4kN/m2 Linear load q1 10.0kN/mLive load: Residential
LayerLengthWidthHeightVolumetricweightWeight Soil1.0m1.00.3m20kN/m36.0kN/m2 Gravel1.0m1.0m0.1m16kN/m31.6kN/m2 Screed1.0m1m0.1m20kN/m32.0kN/m2 Insulation1.0m1.0m0.2m0.3kN/m30.1kN/m2 Divisorywalls0.0kN/m2
2. M_ED External Bending Moment Calculation Load_ULS COMB 54.02kN/m Load_RARA COMB 38.90kN/m
Residential standard live load Area load q 4.0
Standard lightweight concrete/bricks floor kN/m2
2. M_ED External Bending Moment Calculation Load_ULS COMB 54.02kN/m Load_RARA COMB 38.90kN/m
1.35 + 1.5
Area load g2 9.7kN/m2
Variable load:Residential
LayerLengthWidthHeightVolumetricweightWeight Soil1.0m1.00.3m20kN/m36.0kN/m2 Gravel1.0m1.0m0.1m16kN/m31.6kN/m2 Screed1.0m1m0.1m20kN/m32.0kN/m2 Insulation1.0m1.0m0.2m0.3kN/m30.1kN/m2 Divisorywalls0.0kN/m2 Area load g2 9.7kN/m2
M_ED_ULS 253.20 kNm253200000Nmm (ql^2/2 or software value)
M_ED_ULS 253.20 kNm253200000Nmm (ql^2/2 or software value)
Residential standard live load Area load q 4.0
Standard lightweight concrete/bricks floor kN/m2
Variable load:Residential
3. Choose Timber Class Timber class C… 40 fm,k 40MPa γM 1.25 fm,d 25.6MPa fv,k 3.8 MPa γM 1.25 fv,d 2.43MPa
3. Choose Timber Class Timber class C…
115
40 fm,k 40MPa γM 1.25 fm,d 25.6MPa fv,k 3.8 MPa γM 1.25 fv,d 2.43MPa 1.35 cross-laminate structure design Cross-Laminate Structure Design Fig 179.a: Roof Section, Authors Level 0 / ±0.00 C2 Level 1 / +5.00 Level 2 / +9.50 +3.65 +7.86 C2 CF 164 cm - FF - GL - SC - AM - TI - FP - CVB - CLTD - B4 - SSC CF 164 cm - FF - GL - SC - AM - TI - FP - CVB - CLTD - B4 - SSC Laboratories 286 70 24 20 50 70 24 20 164 286 164 164 450 B3 B4 A9 4 A8 4 A10 4 A11 4 C2 CF 74 cm - FF - GL - SC - AM - TI - FP - CVB - RC - B2 40 460 40 40 280 280 540 Curtain Wall Support Beam TR Level 0 / ±0.00 -0.74 Wall: Thermal Insulation XPS Knobbed mat Bitumen sheet Bitulit dark covering Concrete Wall 800 mm W1 ML CF 196 cm - BP - CR - RB - WI - LC - GR - EA 40100 100 100 100 100 100 10040 800 B1 Wall: Thermal Insulation XPS Knobbed mat Bitumen sheet Bitulit dark covering Concrete Wall 800 mm W1 280 40 1072 40 1200 500 500 Level -1 / -3.24 Level -1' / -4.60 CF 164 cm - FF - GL - SC - AM - TI - FP - CVB - CLTD - B3 - SSC B4 ML TR 160 110 160 160 110 700 40 80 8040 240 Ø 32 Ø Mx24 +3.65 Level 1 / +5.00 C2 Shading Roller 20 40 40 120 Double Glazing 0.9 +1.1 TR 40 80 80 40 CF 177 cm - GR - SS - GT - GR - AR - TI - WI - CLTD - B4 - SSC +16.23 Level 4 / +18.50 20 40 40 120 C2 B4 Shading Roller TR ML 160 110 160 160 110 700 Ø 32 Ø Mx24 40 80 8040 240 Section Detail A8/4 Section Detail A9/4 Section Detail A13/4 Section Detail A12/4 Section Detail A11/4 C2 B3 B3 C2 CF 164 cm - FF - GL - SC - AM - TI - FP - CVB - CLTD - B4 - SSC CF 177 cm - GR - SS - GT - GR - AR - TI - WI - CLTD - B4 - SSC Level 3 / +14.00 Level 4 / +18.50 +12.36 +16.23 Laboratories 286 50 70 24 20 50 70 24 33 164 286 177 164 463 110 737 A5 4 A6 4
Secondary beams
Area load Q1 4 kN/m2 Linear load q1 10.0 kN/m
Area load Q1
Linear load q1 10.0 kN/m
The weights that are generated from the slab are going to be multiplied by the length they cover inbetween secondary beams. Since the axis between columns are 10mx10m we have decided to divide the slab with 4 secondary beams distributed in spans of 2.5m. To find the total weight translated to the secondary beams, it is neccessary to multiply the weight distributed over an area of the slab by the span.
2. M_ED External Bending Moment Calculation
The total dead load is g1 = 1.2 KN/m2 + g2 =9.7 KN/m2 = 10.9kN/m2.

This provides a linear load going through the secondary beams equal to 10.9 kN/m2 * 2.5m = 27.15 kN/m . additionally is also applied the self weight of the beam.
2. M_ED External Bending Moment Calculation Load_ULS COMB 60.77 kN/m Load_RARA COMB 43.90 kN/m M_ED_ULS 253.20 kNm (ql^2/2 or software value)
Load_ULS COMB 60.77 kN/m Load_RARA COMB 43.90 kN/m M_ED_ULS 253.20 kNm (ql^2/2 or software value)
The beam we have taken into account has a cross section of 700 mm x 500 mm. Thus, by using the weight per cubic meter of the beam; 5KN/m3. We can get its selfweight by multiplying the weight per cubic meter by its cross sectioned area. As a result, we get a value of 1.75 KN/m.
The same logic is applied also for the live load.
Q = 4KN/m2 * 2.5 m = 10KN/m. All the loads are multiplied by the corresponding load combination for Ultimate Limit State and for Serviceability Limit State. In the case of ULS, as represented below, the structural dead load of the slab and the selfweight of the beam are multiplied by 1.35, while the live load is multiplied by 1.5. As for the SLS, all loads are multiplied by 1.
3. Choose Timber Class Timber class C… 40 fm,k 40 MPa γM 1.25 fm,d 25.6 MPa fv,k 3.8 MPa γM 1.25 fv,d 2.43 MPa
The beam dead load is g1’ = 1.75 kN/m. Linear load g1= 10.9 kN/m2 * 2.5 m = 27.15 kN/m.
q1 = 4kN/m2 * 2.5m = 10 kN/m.
In the end, we get ULS Comb. = 1.35 * (g1’+g1)+ 1.5 * q1 = 1.35 * (27.15 kN/m+1.75 kN/m)+1.5*10 kN/m. ULS Comb. = 39 kN/m + 15 kN/m. ULS Comb. = 54 kN/m. RARA combination on the other hand is going to be: RARA Comb. = 38.90 kN/m.
1. Load information
Fig 180: Grid load distribution, Authors 9 12 10 11 6 7 8 3000 1000 1000 1000 1000 1000 1000 10000 13
3. Choose Timber Class Timber class C… 40 fm,k 40 MPa γM 1.25 fm,d 25.6 MPa fv,k 3.8 MPa γM 1.25 fv,d 2.43 MPa
4. Choose the cross section such as it satisfies all the checks Beam chosen h 700 mm b 500 mm W 40,833,333 mm3 Iy 14,291,666,667 mm4 E0,05 9400 MPa
4. Choose the cross section such as it satisfies all the checks Beam chosen h 700 b 500 W 40,833,333 Iy 14,291,666,667 E0,05 9400
5. Bending stress check 6.20
Beam Lenght L 10m 10000mm
Influence area width "a" 2.5m
6. Check maximal instantaneous displacements for RARA
delta_max L/400 25.00 mm delta simple beam 8.5 mm
5. Bending stress check 6.20 < fm, d delta_max L/400 25.00 mm delta simple beam 8.5 mm
�������� = ⬚ 384 ����������������4 ���������������� =
�������� = ⬚ 384 ����������������4 ���������������� =
Linear load g1' 1.750kN/m Dead load: Beam
Area Dead Load G 10.86kN/m2 Dead load: Floor Linear dead load g 27.15kN/m
7. Check Shear ULS COMB
Av (area resisting in shear) 350000 mm2 V_Ed_ULS 303825 N =0.67 * fv,d 1.63 MPa
Av (area resisting in shear) 350000 mm2 V_Ed_ULS 303825 N =0.67 * fv,d 1.63 MPa
Area load Q1 4kN/m2 Linear load q1 10.0kN/mLive load: Residential

1.30 MPa
1.30
2. M_ED External Bending Moment Calculation Load_ULS COMB 54.02kN/m 1.35
116
4 kN/m2
=
MPa
=
6. Check maximal instantaneous displacements for RARA combination 7. Check Shear ULS COMB Cross-Laminate Structure Design
Beam Lenght L 10m 10000mm
Structural checks for secondary beams
Influence area width "a" 2.5m
Bending stress check
Following the load combination, we use the result to find the maximum moment on the secondary beam. Since we have a distributed load over the length of the secondary beam and the connection on the support is fixed we can calculate the moment as qL^2/12 for the supports and qL^2/24 for the center. This gives a value of 450 kNm on the supports and 225 kNm at the center.
Linear load g1' 1.750kN/m Dead load: Beam self weight
In this later stage we have to compute the checks for the secondary beams. They consist of the bending stress check, the maximum displacement and the ULS shear check.
Area Dead Load G 10.86kN/m2 Dead load: Floor Self weight Linear dead load g 27.15kN/m
w = b*h^2 / 6, w = 40,833,333 mm3. σ = M/w σ = 225 000 000 Nmm / 40 833 333 mm3 σ = 5.51 MPa.
cba 0.3.6 continuous beam analysis
Starting with the bending stress check. We first have to find the section modulus of the beam.
Area load Q1 4kN/m2 Linear load q1 10.0kN/mLive load: Residential
from before we know that: fm,d = 25.6 MPa. σ < fm,d, 6.20 MPa < 25.6 MPa
2. M_ED External Bending Moment Calculation
Load_ULS COMB 54.02kN/m Load_RARA COMB 38.90kN/m
single-span beam: l:10.00m defR: -1 -1 rotR: 450 450
permanent loads: p:39.00kN/m
live loads: p:15.00kN/m
Satisfied
Deflection check
1.35 + 1.5
To find the deflection of the beam we use ��= qL^4 / EI * 384


M_ED_ULS 253.20 kNm253200000Nmm (ql^2/2 or software value)
For the force q is taken the RARA combination with load combination coefficient 1.
15 kN/m 39 kN/m
-449.8 V: 270.0
cba 0.3.6 continuous beam analysis
3. Choose Timber Class
single-span beam: l:10.00m defR: -1 -1 rotR: 450 450
Timber class C… 40 fm,k 40MPa γM 1.25 fm,d 25.6MPa fv,k 3.8 MPa γM 1.25 fv,d 2.43MPa
permanent loads: p:39.00kN/m live loads: p:15.00kN/m
results - characteristic loads (1.0 1.0): Mmax:225.20kNm Mmin:-449.80kNm Vmax:270.00kN Vmin:-270.00kN EIdmax:1408.75m EIdmin:0.00m Rmax:270.00270.00kN Rmin:195.00195.00kN M: 225.2
results - characteristic loads (1.0 1.0): Mmax:225.20kNm Mmin:-449.80kNm Vmax:270.00kN Vmin:-270.00kN EIdmax:1408.75m EIdmin:0.00m Rmax:270.00270.00kN
Rmin:195.00195.00kN M: 225.2
-270.0
RARA Comb. = 38.9 kN/m. ��= 7.5 mm. Deflection limit is L/400 = 10m / 400 = 0.025m = 25 mm �� = 7.5 mm < 25 mm.
Shear check
-449.8 -270.0
Av (area resisting in shear) 350000mm2 V_Ed_ULS 270075N =0.67 * fv,d 1.63MPa = 1.16 MPa
The last check is related to the shear. For it to be satisfied we have to have:
τ < kcr * fv,d τ = 1.16MPa
kcr * fv,d = 1.63 MPa 1.16 MPa < 1.63MPa
Satisfied Satisfied
117
Cross-Laminate Structure Design
Beam Lenght L 10m
Influence area width "a" 1.25m
Bending stress check
Linear load g1' 2.000kN/m
cba 0.3.6 continuous beam analysis
Given that we have not treated the beams as continuous, below we have represented a diagram showing the maximum moment located in the supports. The moment on the support is M_ED_SUPP = 1100 kNm, while the one in the center is M_ED_C = 625.6 kNm. The shear force is the highest in the part of the constraints. V =548.0 kN. The same force is going to be transferred to the columns as a Normal Load.
Area Dead Load G 10.86kN/m2 Linear dead load g 13.575kN/m
Further on we have to compute the checks for the primary beams. They consist of the bending stress check, the maximum displacement and the ULS shear check. Starting with the bending stress check, we first have to find the section modulus of the beam.
Area load Q1 4kN/m2 Linear load q1 5.0kN/m
continuous beam 4 spans: l:2.502.502.502.50m defR: -1 0 0 0 -1 rotR:1080 0 0 01080
2. M_ED External Bending Moment Calculation
Load_ULS COMB 28.53kN/m
Load_RARA COMB 20.58kN/m
permanent loads: p:21.1021.1021.1021.10kN/m P: 270.00270.00270.00kN a= 0.000.000.00m
cba 0.3.6 continuous beam analysis
live loads: p:7.507.507.507.50kN/m
270 kN 270 kN 270 kN 7.5 kN/m 21.1kN/m
w = b*h^2 / 6, w = 53 333 333 mm3. σ = M/w σ = 625 000 000 Nmm / 53 333 333 mm3 σ = 11.72 MPa.
from before we know that: fm,d = 25.6 MPa. σ < fm,d, 11.72 MPa < 25.6 MPa
Deflection check
To find the deflection of the beam we use ��= qL^4 / EI * 384.

For the force q is taken the RARA combination with load combination coefficient 1.


RARA Comb. = 20.58 kN/m. �� = 2.7 mm. Deflection limit is L/400 = 10m / 400 = 0.025m = 25 mm �� = 2.7 mm < 25 mm.
continuous beam 4 spans: l:2.502.502.502.50m defR: -1 0 0 0 -1 rotR:1080 0 0 01080
-1.1k
permanent loads: p:21.1021.1021.1021.10kN/m P: 270.00270.00270.00kN a= 0.000.000.00m
live loads: p:7.507.507.507.50kN/m
results - characteristic loads (1.0 1.0): Mmax:200.69625.62625.62200.69kNm Mmin:-1081.880.000.00-1081.88kNm Vmax:548.00206.500.000.00kN Vmin:0.000.00-206.50-548.00kN EIdmax:2002.853657.853657.852002.85m EIdmin:-114.210.000.00-114.21m Rmax:548.000.000.000.00548.00kN Rmin:510.50-0.00-0.00-0.00510.50kN M: 625.6
Shear check
Av (area resisting in shear) 400000mm2 V_Ed_ULS 142631N =0.67 * fv,d 1.63MPa = 0.53 MPa
results - characteristic loads (1.0 1.0): Mmax:200.69625.62625.62200.69kNm Mmin:-1081.880.000.00-1081.88kNm Vmax:548.00206.500.000.00kN Vmin:0.000.00-206.50-548.00kN EIdmax:2002.853657.853657.852002.85m EIdmin:-114.210.000.00-114.21m Rmax:548.000.000.000.00548.00kN Rmin:510.50-0.00-0.00-0.00510.50kN
-1.1k
cba 0.3.6 continuous beam analysis V: 548.0
M:
-548.0 EId: -114.2
The last check is related to the shear. For it to be satisfied we have to have τ < kcr * fv,d τ = 0.53 MPa kcr * fv,d = 1.63 MPa 0.53 MPa < 1.63 MPa
Satisfied Satisfied Satisfied
119
Structural checks for primary beams
625.6
Cross-Laminate Structure Design
Fig 182: Schematic floor framing system,
Authors
Fig 183: Beam to beam connection
Up to this point we have calculated a total load transferring to the columns at the roof level of the building. This level holds the largest weight out of all the floors because of the soil and gravel layers of the green roof. In order to understand the total weight on the columns we need to know also the weights generated from the lower floors.
The layers of the slab result into a total weight of 4.4 kN/m2 compared to the 9.7 kN/m2, which was in the roof. g1 = 1.2 kN/m2 + 4.4 kN/m2 = 5.6 kN/m2 The selfweights of the secondary beams are going to be the same as before, so g1’ = 1.75kN/m.
The live load is going to remain as 4 kN/m2, since these lower floor are occupied by laboratories.
Furthermore, g1 is multiplied by the area in which it acts on. g1 = 5.6 kN/m2 * 2.5 m = 14kN/m.
total g= 14kN/m + 1.75kN/m = 15.75 kN/m * 1.35 = 21.2 kN/m. g = 21.2 kN/m.
On the other side q=4 kN/m2 * 2.5 * 1.5 = 15 kN/m. From these values we can get the shear and moment diagrams.
Dead load: Floor self-weight
Structural 1.0 m 1.0 m 0.24 m 5 kN/m3 1.2 kN/m2
Area load g1" 1.2 kN/m2
Dead load: Floor self-weight
Standard lightweight concrete/bricks floor
Layer Length Width Height Volumetric weight Weight
Finish 1.0 m 1.0 m 0.02 m 16 kN/m3 0.3 kN/m2 Screed 1.0 m 1 m 0.1 m 20 kN/m3 2.0 kN/m2
Standard lightweight concrete/bricks floor
Insulation 1.0 m 1.0 m 0.1 m 0.3 kN/m3 0.0 kN/m2
Divisory walls 2.0 kN/m2
Area load g2 4.4 kN/m2
m 0.02 m 16 kN/m3 0.3 kN/m2 Screed 1.0 m 1 m 0.1 m 20 kN/m3 2.0 kN/m2 Insulation 1.0 m 1.0 m 0.1 m 0.3 kN/m3 0.0 kN/m2
Divisory walls 2.0 kN/m2
Area load g2 4.4 kN/m2
Residential standard live load
Area load 4.0
Residential standard live load Area load 4.0
Variable load:Residential kN/m2
Variable load:Residential kN/m2
120 Total load on typical floor A11 4 A12 4 A13 4 C2 CF 74 cm - FF - GL - SC - AM - TI - FP - CVB - RC - B2 40 460 40 40 280 540 Curtain Wall Support Beam TR Level 0 / ±0.00 -0.74 Wall: ML CF 164 cm - FF - GL - SC - AM - TI - FP - CVB - CLTD - B3 - SSC B4 ML TR 160 110 160 160 110 700 40 80 8040 240 Ø 32 Ø Mx24 +3.65 Level 1 / +5.00 C2 Shading Roller 20 40 40 120 Double Glazing 0.9 +1.1 TR 40 80 80 40 CF 177 cm - GR - SS - GT - GR - AR - TI - WI - CLTD - B4 - SSC +16.23 Level 4 / +18.50 20 40 40 120 C2 B4 Shading Roller TR ML 160 110 160 160 110 700 Ø 32 Ø Mx24 40 80 8040 240 U-Channel Support L-Profile 10 11 12 13 14 15 16 17 18 19 20 H I J K L M N Section Detail A13/4 Section Detail A12/4 Section Detail A11/4
m
Length Width Height
m
Structural 1.0 m 1.0 m 0.24
5 kN/m3 1.2 kN/m2 Area load g1" 1.2 kN/m2 Layer
Volumetric weight Weight Finish 1.0
1.0
Cross-Laminate Structure Design
rotR:
live loads: p:15.00kN/m
permanent loads: p:21.20kN/m live loads: p:15.00kN/m
-301.5 V: 181.0
-301.5 V: 181.0
results - characteristic loads (1.0 1.0): Mmax:151.03kNm Mmin:-301.47kNm Vmax:181.00kN Vmin:-181.00kN EIdmax:945.20m EIdmin:-0.00m Rmax:181.00181.00kN Rmin:106.00106.00kN M: 151.0
cba 0.3.6 continuous beam analysis
single-span beam: l:10.00m defR: -1 -1 rotR: 302 302
permanent loads: p:21.20kN/m live loads: p:15.00kN/m
results - characteristic loads (1.0 1.0): Mmax:151.03kNm Mmin:-301.47kNm Vmax:181.00kN Vmin:-181.00kN EIdmax:945.20m EIdmin:-0.00m Rmax:181.00181.00kN Rmin:106.00106.00kN M: 151.0
results - characteristic loads (1.0 1.0): Mmax:151.03kNm Mmin:-301.47kNm Vmax:181.00kN Vmin:-181.00kN EIdmax:945.20m EIdmin:-0.00m Rmax:181.00181.00kN Rmin:106.00106.00kN M: 151.0
cba 0.3.6 continuous beam analysis
The point load that is going to be transferred to the primary beams is 181kN. In addition to the point loads we consider the selfweight of the primary beams and the linear weight that comes from the slab on the other side. It consists of g =12.1 kN/m and q = 7.5kN/m.
-181.0
-181.0
continuous beam 4 spans: l:2.502.502.502.50m defR: -1 0 0 0 -1 rotR: 729 0 0 0 729
permanent loads: p:12.0712.0712.0712.07kN/m P: 181.00181.00181.00kN a= 0.000.000.00m
cba 0.3.6 continuous beam analysis
live loads: p:7.507.507.507.50kN/m
181 kN 181 kN 181 kN
From the diagrams we can understand that the maximum shear that is going to be transferred to the columns is 369.3 kN.
To sum up, in the roof there is a load P_ULS = 615.3 kN, while in the typical floors there is a P_ULS = 369.3 kN.
-301.5 V: 181.0
-181.0
continuous beam 4 spans: l:2.502.502.502.50m defR: -1 0 0 0 -1 rotR: 729 0 0 0 729
permanent loads: p:12.0712.0712.0712.07kN/m P: 181.00181.00181.00kN a= 0.000.000.00m
cba 0.3.6 continuous beam analysis V: 369.3
results - characteristic loads (1.0 1.0): Mmax:135.66421.12421.12135.66kNm Mmin:-728.510.000.00-728.51kNm Vmax:369.35139.430.000.00kN Vmin:0.000.00-139.42-369.35kN EIdmax:1349.092463.592463.591349.09m EIdmin:-76.850.000.00-76.85m Rmax:369.350.000.000.00369.35kN Rmin:331.85-0.00-0.00-0.00331.85kN M: 421.1
-728.5
live loads: p:7.507.507.507.50kN/m
results - characteristic loads (1.0 1.0): Mmax:135.66421.12421.12135.66kNm Mmin:-728.510.000.00-728.51kNm Vmax:369.35139.430.000.00kN Vmin:0.000.00-139.42-369.35kN EIdmax:1349.092463.592463.591349.09m EIdmin:-76.850.000.00-76.85m Rmax:369.350.000.000.00369.35kN Rmin:331.85-0.00-0.00-0.00331.85kN M: 421.1
-728.5
-369.3 EId: -76.8
121
302
302
Secondary Beams
Cross-Laminate Structure Design
Primary Beams
Fig 184: CLT - Column Design, Authors
122 Cross-Laminate Column Design Cross-Laminate
Structure Design
Up to now we have designed the secondary beams with a cross section of 700 x 500 mm and the primary beams with 800x500 mm. We have also generated a total weight transferred from the primary beams to the columns. In the roof the weight is: P_ULS = 548 kN, whereas in the typical floors it is: P_ULS = 369.3 kN.
2192 kN 3669.2 kN 5146.4 kN 6623.6 kN 8100.8 kN
Both of these weights have to be multiplied by the number of primary beams that are connected to the column. In our case it is 4 , since we have 4 primary beams. Therefore, for the total weight in the roof we get a value of P_ULS = 548 kN * 4 = 2192 kN and for the typical floor we get P_ULS = 339.3 kN * 4 = 1477.2 kN.
As mentioned in previous chapters, throughout the project there is an ascending promanade. The slopes and terraces have an affect on the structure since the total load is not going to be the same everywhere. Thus, for this calculation we have taken into consideration the highest volume of the building, which is going to transmit the most weight to the columns.
Fig 185: Load on column, Authors

Cross-Laminate Structure Design
As a result, the 4 typical floors and 1 roof level are going to generate a total load of P_ULS_total = 1477.2 kN * 4 + 2461.2 kN * 1. P_total = 8370 kN.
10000
The column chosen for the project has dimensions: 800x800 mm, with a timber class of C40, fc,0,k = 26 MPa. fc,0,d = 0.8 * 26 MPa / 1.25 = 16.6 MPa.
3. Choose the cross section such as it satisfies all the checks Beam chosen h 800 b 800 W 85,333,333 mm3 Iy 34,133,333,333 mm4 E0 mean 14000MPa E,005 9400MPa A 640000mm2 i_min 231.2230.9
3. Choose the cross section such as it satisfies all the checks Beam chosen h 800 b 800 W 85,333,333 mm3 Iy 34,133,333,333 mm4 E0 mean 14000MPa E,005 9400MPa A 640000mm2 i_min 231.2230.9
2. Choose Timber Class Timber class C… 40 fc,0,k 26MPa γM 1.25 16.6MPa
2. Choose Timber Class Timber class C… 40 fc,0,k 26MPa γM 1.25 16.6MPa
1000 1000 1000 1000
i_min = 0.289 * h = 0.289 * 800 mm = 231.2 mm.
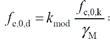
σc,0,d = N_ED * h * b σc,0,d = 8 100 800 N / 800 mm * 800 mm σc,0,d = 12.66 MPa.
Total length of the column in one floor is L= 5 m = 5000 mm
λ = L / i_min = 5000 mm / 231.2 mm = 21.6
21.6 < 180
6 7 8 13
Design compressive strength Buckling resistance
198.16 MPa 0.36 0.57beta_c 0.99
198.16 MPa 0.36 0.57beta_c 0.99
198.16 MPa 0.36 0.57beta_c 0.99
7. Verification of the failure condition 0.77<1


9
198.16 MPa 0.36 0.36 0.57beta_c 0.2 0.99
198.16 MPa 0.36 0.36 0.57beta_c 0.2 0.99
Verification of failure condition
7. Verification of the failure condition check OK
Satisfied Satisfied
7. Verification of the failure condition 0.77<1 check
7. Verification of the failure condition 0.77<1 check
123
10
7. Verification of the failure condition 0.77<1 check OK
Total Load on column
Column parameter decision
Slenderness
60 Structural Drawings
14 16 8 14
8
CW2 Core Concrete Wall 60 16 22 16 8 11 8
54 27 Horizontal Detail A2/1 1:10
X-Lam B3 Primary Beam 60 x 80
8
11 8 8 14 16 8 14 60
11 8
27 27
8
Fig 186.a: CLT beam to concrete wall connection
X-Lam B3 Primary Beam 60 x 80
Horizontal Detail A1/1 1:10
8
8
8
60 10
10 8 8 8 8 8 10
ML
8 10 60 10 8 8 8 8 8 10 60
8
X-Lam B3 Primary Beam 60 x 80
Fig 187: CLT beam to column connection, Authors
Double Glazing 0.9 +1.1 X- Lam C2 Column 80 x 80 ML TR
125
X-Lam B3 Primary Beam 60 x 80
126 44 416 84 371 79 371 79 371 79 2693 500 450 450 450 371 92 463 0 500 950 1400 1850 2300 80 920 80 920 80 920 80 930 60 697 60 1173 80 8010 2070 10080 1000 1000 1000 1000 1000 1000 B4 B4 B4 B4 B4 B4 B4 B4 B4 B4 B4 B4 B4 B4 B4 B4 B2 B2 B2 B2 B2 B4 C2 C2 C2 C2 C2 C2 C2 C2 C2 C2 C2 C2 C2 C2 C2 C2 B3 B3 B3 B3 B3 B3 B3 B3 B3 B3 B3 B3 B3 B3 B3 B3 B3 Constructive Longitudinal Section 1:200 1 2 3 4 5 6 7 1000 1000 1000 1000 1000 1000 920 80 920 80 920 80 687 60 173 80 920 80 9920 80 10080 80 80 920 120 266 54 441 59 391 59 391 59 391 59 440 2795 500 450 450 450 391 59 450 80 920 80 920 80 920 80 930 60 697 60 1173 80 8010 2070 10080 1000 1000 1000 1000 1000 1000 B4 B4 B2 B4 B4 B4 B4 B2 B4 B4 B4 B4 B2 B4 B4 B4 B4 B2 B4 B4 B2 B2 B2 B2 B2 B2 B4 C1 C1 C1 C1 C1 C1 C1 C2 C2 C2 C2 C2 C2 C2 C2 C2 C2 C2 C2 C2 C2 C2 C2 B3 B3 B3 B3 B3 B3 B3 B3 B3 B3 B3 B3 B3 B3 B3 B3 B3 55 Level 0 / -0.20 Level 1 / +4.80 Level 2 / +9.30 Level 3 / +13.80 Level 4 / +18.30 -0.74 -5.20 Excavation level Level -1 / -3.24 +4.21 +8.71 +13.21 +17.71 Laboratories Laboratories Laboratories Cultural/Public Level 5 / +22.80 +22.21 1 2 3 4 5 6 7 A9 4 C2 CF 74 cm - FF - GL - SC - AM - TI - FP - CVB - RC - B2 40 460 40 40 280 280 540 Curtain Wall Support Beam TR Level 0 / ±0.00 -0.74 Wall: Thermal Insulation XPS Knobbed mat Bitumen sheet Bitulit dark covering Concrete Wall 800 mm W1 ML Section Detail A11/4 1:10 A8 4 CF 196 cm - BP - CR - RB - WI - LC - GR - EA 1800 40100 100 100 100 100 100 10040 800 10040 100 100 100 100 100 100 100 100 100 100 100 100 100 100 100 40100 B1 Wall: Thermal Insulation XPS Knobbed mat Bitumen sheet Bitulit dark covering Concrete Wall 800 mm W1 280 40 1072 40 1200 500 500 Level -1 / -3.24 Level -1' / -4.60 Section Detail A10/4 1:10 Fig 188: Structural section, Authors Fig 189: Foundation detail, Authors Fig 190: Ground floor detail, Authors Structural Drawings

128 7 6 5 C1 C1 C1 C1 C1 C1 C1 C1 C1 C1 C1 C1 C1 C1 C1 C1 C1 C1 C1 C1 C1 C1 C1 C1 C1 C1 C1 C1 C1 B1 B1 B1 B1 B1 B1 B1 B1 B1
B1
B1
B1 B1
40 180 809 405 596 190 820 180
1000 1000 1000 1000
4010040 820 4010040 820 4010040 180 820 180 820 180 1000 1000 60 231 602690 163 60 85 150 85 60 60 320 60 279 60 231 60 1070 60 231 60 279 60 320 60 1070 60
235
26 249 25
29 207 71
294
306 60 100 245 104 207 131 787 1234 5969 787 1203 60 85 150 85 60 163 90 26 60 231 60 60 328 53 279 60 231 60 145 458 90 377 1070 960 60 231 60 279 60 320 60 1070 2980 920 100 1960 40 900 100 900 100 2040 40 900 100 900 100 CW CW CW CW CW CW CW CW CW CW CW CW CW CW CW CW CW 7 6 5 1 2 3 4 5 6 7 8 9 10 11 CW2 CW2 CW2 CW2 CW2 CW2 CW2 CW2 C2 C2 C2 C2 C2 C2 C2 C2 C2 C2 C2 C2 C2 C2 C2 C2 C2 C2 C2 C2 C2 C2 C2 C2 C2 C2 C2 C2 C2 C2 C2 C2 C2 C2 C2 C2 C2 C2 C2 C2 C2 C2 B3 B3 B3 B3 B3 B3 B3 B3 B3 B3 B3 B3 B3 B3 B3 B3 B3 B3 B3 B3 B3 B3 B3 B3 B3 B3 B3 B3 B3 B3 B3 B3 B3 B3 B3 B3 B3 B3 B3 B3 B3 B3 B3 B3 B3 B3 B3 B3 B3 B3 B3 B3 B3 B3 B3 B3 B3 B3 B3 B3 B3 B3 B3 B3 B3 B3 B3 B3 B3 B3 B3 B3 B3 C3 C3 C3 C3 B4 B4 B4 B4 B4 B4 B4 B4 B4 B4 B4 B4 B4 B4
7
3 2 1 1
4 3 2 1
60
60 250
193
60
920 80 B4 B4 B4 B4 B4 B4 B4 B4 B4 B4 B4 B4 B4 B4 B4 B4
B4 B4 B4 B4 B4 B4
50 200 50 200 50 185 50 200 50 200 50 185 50 200 50 200 50 225 80 185 50 200 50 200 50 185 80 920 80 185 50 200 50 200 50 185 80 920 80 185 50 200 50 200 50 185 80 920 80 80 920 80 920 80 920 80 920 80 920 80 920 80 6000 80 185 50 200 50 200 50 185 80 920 80 185 50 200 50 200 50 185 80 80 920 80 920 80 920 80 3080 9080 10080 185 185 50 200 50 200 50 185 80 920 80 920 80 920 80 920 80 3000 50 200 50 200 50 185 80 920 80 920 80 920 80 920 80 920 80 920 80 80 5000 5000 1000 5000 7000 2000 A2 X-Lam B3 Primary Beam 60 x 80 X-Lam B3 Primary Beam 60 x 80 10 8 8 8 8 10 60 Double Glazing 0.9 +1.1 X- Lam C2 Column 80 x 80 ML Level -1 / -3.24 Level -1 / -3.24 Level 0 / ±0.00 Level 0 / ±0.00 Level 0 ±0.00 L1 1 L2 1 Typical Floor Plan 1:200 5 6 7 8 9 10 11 80 920 80 204 60 666 60 930 80 920 80 920 80 920 80 8010 10080 1040 1000 1000 1000 1000 1000 1000 1000 1000 1000 1000 1000 1000 1000 1000 1000 1000 B4 Fig 192: Typical structural floor plan, Authors Structural Drawings
B1
B1
B1 B1 B1 B1 B1 B1 B1 B1 B1 B1 B1 B1 B1 B1 B1 B1 B1 B1 B1 B1 B1 B1 B1 B1 B1 B1 B1
B1 B1 B1 B1 B1 B1 B1 B1 B1 B1 B1 B1 B1 B1 B1 B1 B1 B1 B1 B1 B1 B1 B1 B1 B1 B1 B1 B1 B1 B1 B1 B1 B1 B1 B1 B1 B1 B1 B1 B1 B1 B1 B1 B1 B1 B1 B1 B1 B1 B1 B1 B1 B1 B1 B1 B1 B1 B1 B1 B1 4010040 820 4010040 820 4010040 180 820 180 820 180 1000 1000 2180 3180 40 100 40 820 40 100 254 596 71 60 59 820 40 100 40 820 40 100 40 820 40 100 40 820 40 100 40 820 40 100 40 820 90 100 627 60 163 100 40 820 40 100
820 180 820 180 820 180 820 180 820 190 627 363 820 180 10180
1000 1000 1000 1000 1000 1000
60 60 40
25 60 29 207 71 60 300 60 306 60 100 235 114 207 131
60
60 60
66
B4 B4 B4 B4 B4 B4 B4 B6 B6 B6 B6 B6 B6 B6 B6 B6
6 5 4
2 3 4 5 6 7 8 7 6 5
1 2 3 4 5 6 7 8 9 10 11 9 10 11 B2
627 60 1273 747
60
90 94 1273 250 60 317 60 60 60 311 60 278 60 231 602690 163 60 85 150 85 60 60 320 60 279 60 231 60 1070 3231 769 960
80 150 180 198 100 60 311 60 278 60 769 60 231 60 279 60 320 60 3231 1070 960 60 60 60 40 235 25 60 29 207 71 60 300 60 306 60 100 235 114 207 131 26 249 25 60 29 207 71 60 60 294 66 306 60 100 245 104 207 131 787 1234 5969 787 1203 60 85 150 85 60 163 90 60 231 60 60 328 53 279 60 231 60 145 458 90 377 1070 960 60 231 60 279 60 320 60 1070 2980 920 100 900 1960 80 920 80 204 60 667 60 929 80 185 80 920 80 185 80 920 80 185 60 667 60 193 40 940 80 1284 787 5969 787 1253 10080 80 920 80 920 80 2080 3080 6080 920 80 1000
B4 B4 B4 B4 B4
B4 B4 B4 B4 B4 B4 B4 B4 B4 B4 B4 B4 B4 B4 B4 B4 B4 B4 B4 B4 B4 B4 B4 B4 B4 B4 B4 B4 B4 B4 B4 B4 B4
Fig 193: Structural axonometry, Authors
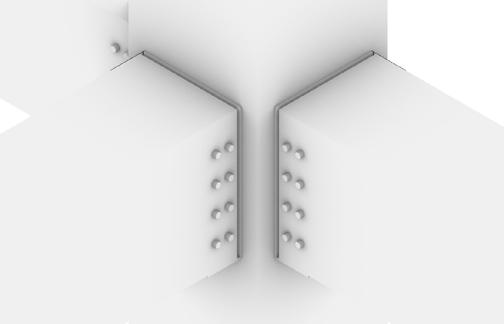
Fig 194: Detail structural connection , Authors
Fig 195: Detail structural connection, Authors

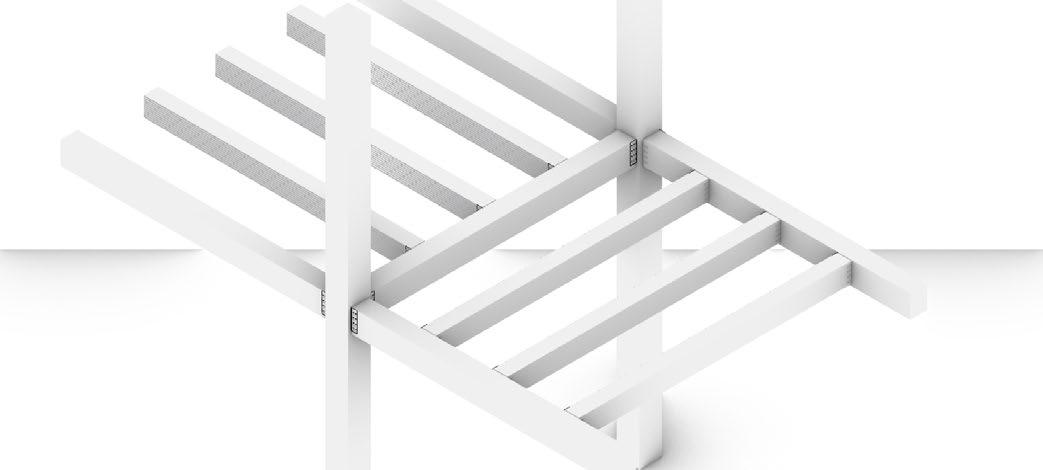
129
Structural Drawings
Construction-floor 177 cm - GR (Grass/Low plantation) - SS (Soil substrate 15 cm) - GT (Geotextile 0.5 cm) - SC (Screed 5 cm)
- AR (Anti-root insulation membrane 0.5 cm) - TI (Thermal insulation Swisspor PIR 12 cm, λ=0.020)
- WI (Water insulation membrane 0.5 cm) - CLTD (X-lam timber deck 24 cm) - B4 (X-lam beam 70 cm) - SSC (Suspended ceiling 50 cm)
Construction-floor 164 cm - FF (Flooring-Finishing 2.0 cm) - GL (Glue 0.5 cm) - SC (Screed 10 cm) - AM (Anti mix. separation layer 0.5 cm) - TI (Thermal insulation 5 cm) - FP (Footfall-proof layer 1.5 cm) - CVB (Concrete vapor barrier 0.5 cm) - CLTD (X-lam timber deck 24 cm) - B4 (X-lam beam 70 cm) - SSC (Suspended ceiling 50 cm)
Construction-floor 164 cm - FF (Flooring-Finishing 2.0 cm) - GL (Glue 0.5 cm) - SC (Screed 10 cm) - AM (Anti mix. separation layer 0.5 cm) - TI (Thermal insulation 5 cm) - FP (Footfall-proof layer 1.5 cm) - CVB (Concrete vapor barrier 0.5 cm) - CLTD (X-lam timber deck 24 cm) - B4 (X-lam beam 70 cm) - SSC (Suspended ceiling 50 cm)
Construction-floor 164 cm - FF (Flooring-Finishing
Construction-floor 74 cm - FF (Flooring-Finishing 2.0 cm) - GL (Glue 0.5 cm) - SC (Screed 10 cm) - AM (Anti mix. separation layer 0.5 cm) - TI (Thermal insulation 5 cm) - FP (Footfall-proof layer 1.5 cm) - CVB (Concrete vapor barrier 0.5 cm) - RC (Reinforced concrete 24 cm) - B3 (Concrete beam 30 cm)
130
656 80
C1
W1 (Wall): Thermal Insulation XPS Knobbed mat Bitumen sheet Bitulit dark covering Concrete Wall 600 mm 120 266 74 336 164 286 164 286 164 286 177 460 2323 500 450 450 463 1000 1000 80 920 80 204 60
60 B4 B4 B2 B4 B4 C1
C1 C2 C2 C2 C2 C2 C2 C2 C2 A3 1
2.0 cm) - GL
0.5 cm) - SC
10 cm) - AM (Anti mix. separation layer 0.5 cm) - TI
insulation 5 cm) - FP
layer 1.5 cm) - CVB
vapor barrier 0.5 cm) - CLTD
timber deck 24 cm) - B4
beam 70 cm) - SSC
ceiling 50 cm) Construction-floor 196 cm - BP (Basement Pavement 15.0 cm) - CR (Concrete 20.0 cm) - RB (Rubbles 10 cm) - WI (Water insulation membrane 1.0 cm) - LC (Leveling Concrete 20 cm) - GR (Gravel 40.0 cm) - EA (Earth) Bulkhead B3 B3 B3 B3 B3 B3 B3 B3 Level 0 / ±0.00 Level 1 / +5.00 Level 2 / +9.50 Level 3 / +14.00 Level 4 / +18.50 -0.74 -5.20 Excavation level Level -1 -3.24 +3.65 +7.86 +12.36 +16.23 Laboratories Laboratories Laboratories Cultural/Public A4 4 A5 4 A6 4 A3 3 Fig 196: Section, Authors Structural Drawings
(Glue
(Screed
(Thermal
(Footfall-proof
(Concrete
(X-lam
(X-lam
(Suspended
-
CF
CVB - CLTD


B3
131 GL OG GL GL OG GL GL OG GL GL OG GL GL OG GL GL OG GL GL OG GL GL OG GL GL OG GL GL OG GL GL OG GL GL OG GL 100 241 159 100 191 159 100 191 159 100 191 105 250 250 120 266 74 336 164 286 164 286 164 286 177 460 2323 500 450 450 463 60 Level 0 / ±0.00 Level 1 / +5.00 Level 2 / +9.50 Level 3 / +14.00 Level 4 / +18.50 -0.74 -5.20 Excavation level Level -1 / -3.24 +3.65 +7.86 +12.36 +16.23 A3 3 W1 (Wall): Thermal Insulation XPS Knobbed mat Bitumen sheet Bitulit dark covering Concrete Wall 600 mm Level 0 ±0.00 -0.74 C2 CF 74 cm - FF - GL - SC - AM - TI - FP - CVB - RC - B3 CF 196 cm - BP - CRBulkhead Level 1 / +5.00 Level 2 / +9.50 +3.65 +7.86 C2 CF 164 cm - FF - GL - SC - AM - TI - FP - CVB - CLTD - B4 - SSC CF 164 cm - FF - GL - SC - AM - TI - FP - CVB - CLTD - B4 - SSC Laboratories 266 30 24 20 266 74 286 70 24 20 50 70 24 20 164 286 164 164 450 B2 B3
A9
B4
4 A8 4 A10 4 A11 4 C2 CF 74 cm - FF - GL - SC - AM - TI - FP - CVB - RC - B2 40 460 40 40 280 280 540 Curtain Wall Support Beam TR Level 0 ±0.00 -0.74 Wall: Thermal Insulation XPS Knobbed mat Bitumen sheet Bitulit dark covering Concrete Wall 800 mm W1 ML CF 196 cm - BP - CR - RB - WI - LC - GR - EA 1800 40100 100 100 100 100 100 10040 800 10040 100 100 100 100 100 100 100 100 100 100 100 100 100 100 100 40100 B1 Wall: Thermal Insulation XPS Knobbed mat Bitumen sheet Bitulit dark covering Concrete Wall 800 mm W1 280 40 1072 40 1200 500 500 Level -1 / -3.24 Level -1' / -4.60
Section Detail A8/4 Section Detail A9/4 Section Detail
Section Detail A12/4 Section Detail A11/4 Section Detail A10/4 C2 B3 B3 C2 CF 164 cm - FF - GL - SC - AM - TI - FP - CVB - CLTD - B4 - SSC CF 177 cm - GR - SS - GT - GR - AR - TI - WI - CLTD - B4 - SSC Level 3 +14.00 Level 4 +18.50 +12.36 +16.23 Laboratories 286 50 70 24 20 50 70 24 33 164 286 177 164 463 110 737 A5 4 A6 4 Fig 197: Facade, Authors
Detail Section Authors Structural Drawings
164 cm - FF - GL - SC - AM - TI
FP -
-
- SSC B4 ML TR 160 110 160 160 110 700 40 80 8040 240 Ø 32 Ø Mx24 +3.65 Level 1 / +5.00 C2 Shading Roller 20 40 40 120 Double Glazing 0.9 +1.1 TR 40 80 80 40 CF 177 cm - GR - SS - GT - GR - AR - TI - WI - CLTD - B4 - SSC +16.23 Level 4 +18.50 20 40 40 120 C2 B4 Shading Roller TR ML 160 110 160 160 110 700 Ø 32 Ø Mx24 40 80 8040 240
A13/4
Fig 197.a:
cantilever concept
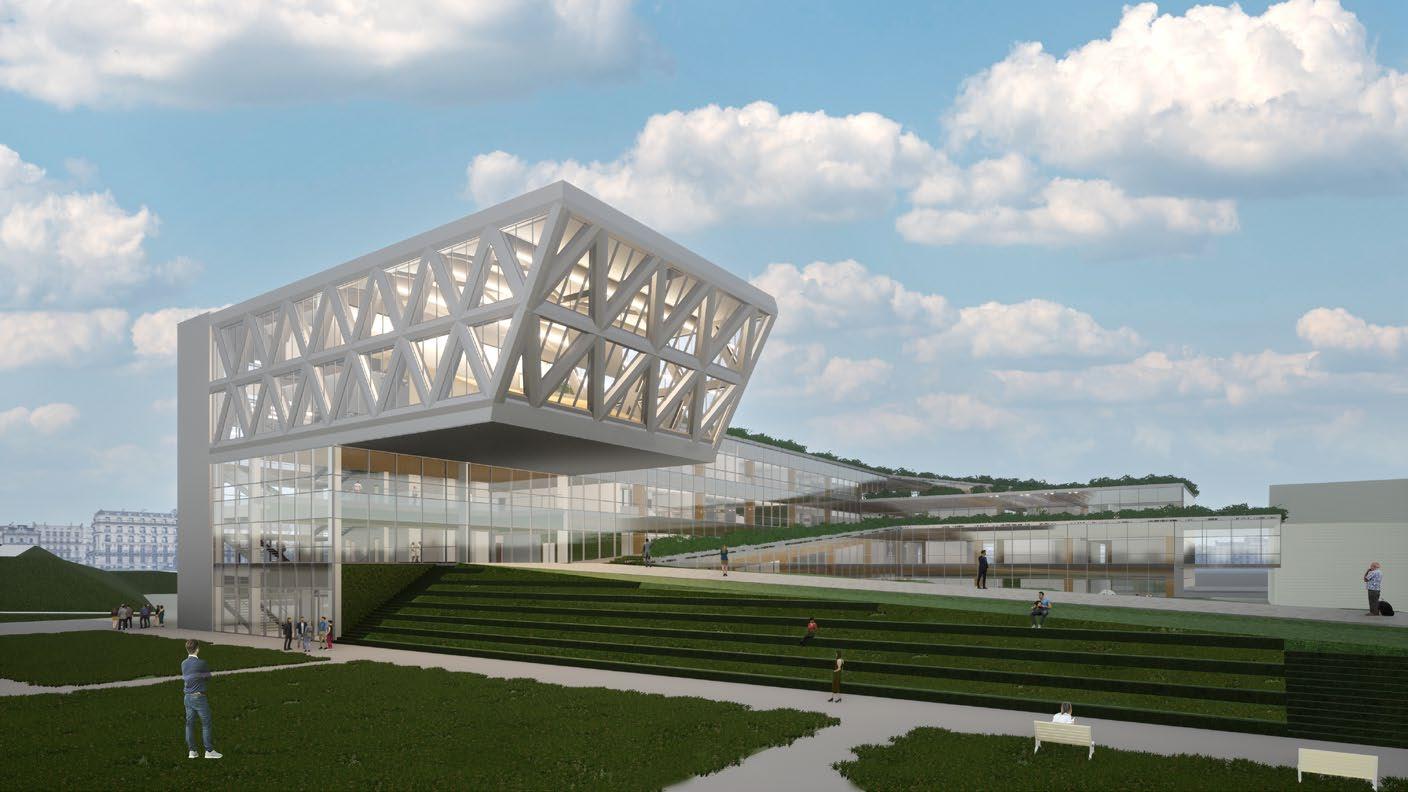
132
Cantilever Concept
Fig 198: Cantilever render, Authors
The most complex part of the structural design for our project is located in the following segment of the chapter. The cantilevered volume is composed of a steel structure that transfers its weights into the concrete core behind it, as well as in the suporting columns below.
The composition of the steel structure consists of:
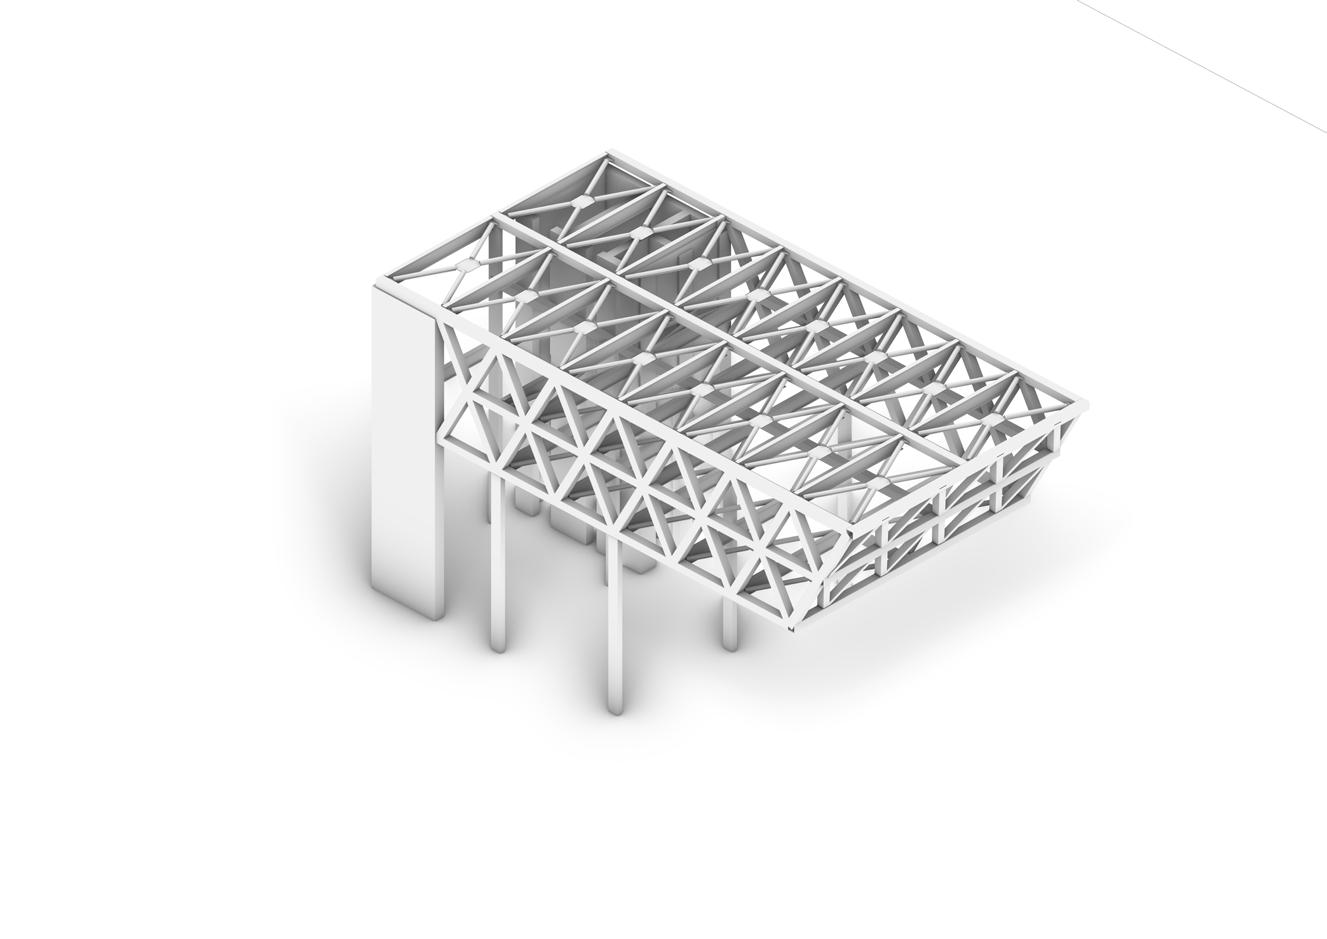
Secondary beam - HEB steel profile 1000x300 mm. Steel class S450.
Bracing - Circular steel profile CHS-CF 323.9x25 mm. Steel class S 450.
truss - HSS steel profile 600x25 mm. Steel class S450.
133
Cantilever Concept
Fig 199: Cantilever structural axonometry , Authors
The length of the beams connected inbetween the 2 trusses is 20 meters. Moreover, the influence area width of the slab is 5 meters. In the table represented below we have taken into consideration the weights that are tranferred from the slab. Such weights are the dead structural load; G1’= 1.2 kN/m2, the non-structural dead load; G2= 4.4 kN/m2 and the live load Q1 = 4kN/m2. Subsequently, we multiply by the width of the influence area all the loads mentioned above to find the linear load applied on the beam.
1. Load information
Beam Lenght L 20m
Influence area width I 5m
4. Calculate Wpl
Wpl 8866667mm3 886710^3 mm3
Linear load g1' 3.14kN/m
Area load G1'' 1.2kN/m2 Linear load g1'' 6kN/m
Area load G2 4.4kN/m2 Linear load g2 22.0kN/m
Area load Q1 4kN/m2 Linear load q1 20.0kN/m
= = = 5 384 = = = 3. Choose steel class Steel class S… 450 fyk 450MPa γs 1.05 fyd 429MPa Choose steel class class S… 450 450MPa 1.05 429MPa For the secondary beams, we have chosen a HEB 1000 profile with a steel class of S450. As a result, It has an fy,k = 450 MPa. The design strength is fy,d = fm,k / γM. fy,d = 429 Mpa
6. Check maximal displacements for RARA combination (D + L) 7. Check maximal displacements for combination ( L ) 8. Check Shear ULS COMB Cantilever Concept
6. Check maximal displacements for RARA combination (D + L)
= 5 384 =
5. Choose the cross section such as it has a Wpl greater than the one calculated Beam chosen HEB 1000 Wpl chosen 1468010^3 mm3 OK Iy chosen 64470010^4 mm4 E 210000MPa delta_max L/200 100mm delta simple beam 78.7mm OK delta software 485.5 0.4 OK delta_max L/250 80mm delta simple beam 30.8mm OK delta software 202.5 0.1 OK
= 5 384 = = = = 5 384 = = =
HEB 1000 h_section 1000mm tw_section 19mm r_section 30mm tf_section 36mm Av (area resisting in shear) 23320mm2 V_Ed_ULS 753.4kN Note: only one value (ql/2 or software value) 122kN
4. Calculate Wpl Wpl 8866667mm3 886710^3 mm3 5. Choose the cross section such as it has a Wpl greater than the one calculated Beam chosen HEB 1000 Wpl chosen 1468010^3 mm3 OK Iy chosen 64470010^4 mm4 E 210000MPa delta_max L/200 100mm delta simple beam 78.7mm OK delta software 485.5 0.4 OK delta_max L/250 80mm delta simple beam 30.8mm OK delta software 202.5 0.1 OK HEB 1000 h_section 1000mm tw_section 19mm r_section 30mm tf_section 36mm Av (area resisting in shear) 23320mm2 V_Ed_ULS 753.4kN Note: only one value (ql/2 or software value) 122kN V_Rd 5770.2 kN OK
V_Rd 5770.2 kN OK
134 Secondary HEB Beam
7. Check maximal displacements for combination ( L ) 8. Check Shear ULS COMB
Fig 200: Total load diagram, Authors
Shear and Moment diagrams
In the diagrams represented below the maximum moment is located at the cennter of the beam: Mc = 3800 kNm.
The shear force is the highest at the constraints: V=303.9 kN.
cba 0.3.6 continuous beam analysis
In this later stage we have to compute the checks for the secondary beams. They consist of the bending stress check, the maximum displacement and the ULS shear check.
single-span beam: l:20.00m
permanent loads: p:12.30kN/m live loads: p:63.00kN/m
results - characteristic loads (1.0 1.0): Mmax:3765.00kNm Mmin:-0.00kNm
Bending stress check
wpl = 14 680 000 mm3. w = M/fyd w = 3 800 000 000 Nmm / 429 N/mm2 w = 8 866 667 mm3. w < wpl, 8 866 667 mm3 < 14 680 000 mm3
Deflection check
Vmax:753.00kN
cba 0.3.6 continuous beam analysis
Vmin:-753.00kN
7.5 kN/m 12.1 kN/m
EIdmax:156875.00m EIdmin:0.00m Rmax:753.00753.00kN Rmin:123.00123.00kN
single-span beam: l:20.00m permanent loads: p:12.30kN/m live loads: p:63.00kN/m
results - characteristic loads (1.0 1.0): Mmax:3765.00kNm Mmin:-0.00kNm Vmax:753.00kN
Vmin:-753.00kN
EIdmax:156875.00m EIdmin:0.00m
Rmax:753.00753.00kN
Rmin:123.00123.00kN
M:
-0.0
To find the deflection of the beam we use ��= 5 qL^4 / EI * 384
For the force q is taken the RARA combination with load combination coefficient 1. RARA Comb. = 51.14 kN/m. �� = 78.7 mm. Deflection limit is L/200 = 20m / 200 = 0.1m = 100 mm �� = 78.7 mm < 100 mm.
Shear check
The last check is related to the shear. For it to be satisfied we have to have:
V_ED_ULS < V_RD * fv,d V_ED_ULS = 753.4 kN
Av = 23 320 mm2, fyd = 429 MPa. V_RD = 5770.2 kN
This shear force is going to be transferred to the truss members as a point load. Satisfied Satisfied Satisfied
753.4 kN < 5770.2 kN
135
3.8k
M_ED
Load_ULS
75.34kN/m Load_RARA COMB 51.14kN/m Load_LIVE COMB 20kN/m
M: 3.8k -0.0 V: 753.0 -753.0 2.
External Bending Moment Calculation
COMB
Cantilever Concept
Fig 201 Exploded structural axonometry, Authors
136 truss design Truss Design
Checking Result
Title
z
Axial forces Fxx = -2,091,505 N
600
30 30
600
Bending Moments
My = -2,654,742,603 Nm; Mz = -1,630,602 Nm
Slenderness Ratio
KL/r = 42.9 < 200.0
Axial Resistance
y
End Moments
Myi = -2654742603 Nm, Myj = 457457088 Nm.
Myi = -2654742603 Nm, Myj = 457457088 Nm.
Mzi = -1630602, Mzj = -1312152 (for Lz)
Shear Forces
Unbraced Lengths
Depth 600.000Web Thick 30.0000 Flg Width 600.000Top F Thick 30.0000 Web Center 570.000Bot.F Thick 30.0000
Ly = 5000.00, mm Lz = 5000.00, mm Lb = 5000.00 mm
Effective Length Factors
Ky = 1.00, Kz = 1.00
Equivalent Uniform Moment Factors:
Cmy = 1.00, Cmz = 1.00, CmLT = 1.00
Fyy = -63.690 (LCB: 1, POS:1/2) Fzz = -640211 (LCB: 1, POS:I)
Design code : Eurocode 3:05 Units are in N, mm Member number is 503 Material: Steel S450 Section name: HSS 600x30 Member : 5000 mm
N_Ed/MIN[Nc_Rd, Nb_ Rd = 2091505/30096000 Rd = 0.069 < 1
Satisfied
-1630602 457457088 (for Lb) 457457088 (for Ly) (for Lz) = 5000.00, Lb = 5000.00 1.00 1.00, CmLT = 1.00 1)................................... O.K 0.069 < 1.000 ........................ O.K < 1.000 ............................... O.K 1.000 .................................. O.K Project
N_Ed/MIN[Nc_Rd, Nb_Rd] = 2091505/30096000 Rd = 0.069 < 1
M_Edz/M_Rdz = 1630602/6438960000 = 0.000 < 1.000
Bending Resistance Combined Resistance
Rmax = MAX[ R.MNRd, R.BiM, (R.byN+R.byM), MAX(Rc. LT1+Rb.LT1, Rc.LT2+Rb.LT2) ] = 0.482 < 1.000
Depth Web Thick Web Center
600.000 600.000 570.000
Web Thick Top F Thick Bot.F Thick
30.0000 30.0000 30.0000 Area 68,400.0 Asz 36,000.0 Qyb 121,950 Qzb 121,950 Iyy 3,714,120,000 Izz 3,714,120,000 Ybar 300.000 Zbar 300.000 Wely 12,380,400 Welz 12,380,400 ry 233.024 rz 233.024
Truss Design
Shear Resistance
V_Edz/Vz_Rd = 0.070<1.000
Deflection
L/ 250.0 = 20.0000 > 3.2566 (Member:503) Calculation for 5 meter length of the member of the truss.
Satisfied Satisfied Satisfied Satisfied Satisfied
137
Area 68400.0Asz 36000.0 Qyb 121950Qzb 121950 Iyy 3714120000Izz 3714120000 Ybar 300.000Zbar 300.000 Wely 12380400Welz 12380400 ry 233.024rz 233.024 Rd)^Beta
Name G:\...\Model MIND full new.mgb
Results extracted from Midas Software Member Forces Slenderness Ratio
Fig 214: Truss section
Reaction forces
midas Gen
POST-PROCESSOR
REACTION FORCE
FORCE-Z
MIN. REACTION NODE= 1 FZ: -1.7635E+006
MAX. REACTION NODE= 3 FZ: 1.5578E+007
CBS: SLCB1
MAX : 3 MIN : 1
POST-PROCESSOR
REACTION FORCE FORCE-Z
MIN. REACTION NODE= 1 FZ: -1.7635E+006
MAX. REACTION NODE= 3 FZ: 1.5578E+007 CBS: SLCB1 MAX : 3 MIN : 1
FILE: MODEL MIND UNIT:N DATE:07/09/2022
FILE: MODEL MIND FULL NEW UNIT:N DATE:07/09/2022 VIEW-DIRECTION X:0.697 Y:-0.672 Z:0.250

VIEW-DIRECTION X:0.697 Y:-0.672 Z:0.250
Fig 202: Reaction forces, Authors
Shear
forces Truss Design

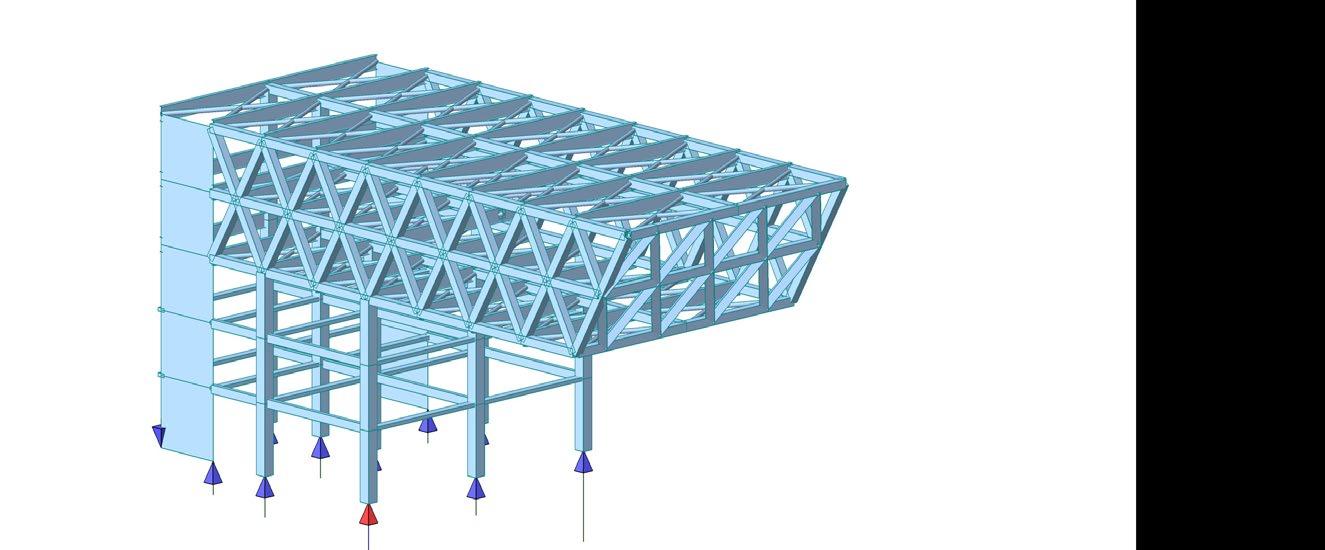


midas Gen
POST-PROCESSOR
Reaction forces
SCALEFACTOR= 2.0664E+001
CBS: SLCB1
MAX : 533 MIN : 317
FILE: MODEL MIND FULL NEW UNIT:N DATE:07/09/2022
VIEW-DIRECTION X:0.697 Y:-0.672 Z:0.250
Fig 203.a: Shear forces, Authors
138
midas Gen
BEAM FORCE SHEAR-z 7.15961e+005 5.86116e+005 4.56270e+005 3.26424e+005 1.96579e+005 6.67330e+004 0.00000e+000 -1.92958e+005 -3.22804e+005 -4.52650e+005 -5.82495e+005 -7.12341e+005
Deflection analysis
Fig 203: Deflection analysis, Authors
midas Gen
POST-PROCESSOR
BEAM STRESS COMBINED 1.81352e+002 1.42580e+002 1.03808e+002 6.50357e+001 2.62637e+001 0.00000e+000 -5.12803e+001 -9.00523e+001 -1.28824e+002 -1.67596e+002 -2.06368e+002 -2.45140e+002
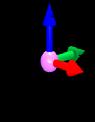
SCALEFACTOR= 2.0664E+001
CBS: SLCB1
MAX : 533 MIN : 503
FILE: MODEL MIND FULL NEW UNIT:N/mm^2 DATE:07/09/2022
VIEW-DIRECTION
X:0.697 Y:-0.672 Z:0.250 Truss Design
midas Gen
POST-PROCESSOR
DISPLACEMENT
Z-DIRECTION
1.26653e+000 0.00000e+000 -1.32854e+001 -2.05614e+001 -2.78374e+001 -3.51134e+001 -4.23893e+001 -4.96653e+001 -5.69413e+001 -6.42173e+001 -7.14933e+001 -7.87692e+001
SCALEFACTOR= 2.9059E+001
CBS: SLCB2
MAX : 154 MIN : 274
POST-PROCESSOR
DISPLACEMENT
Z-DIRECTION
1.26653e+000 0.00000e+000 -1.32854e+001 -2.05614e+001 -2.78374e+001 -3.51134e+001 -4.23893e+001 -4.96653e+001 -5.69413e+001 -6.42173e+001 -7.14933e+001 -7.87692e+001
SCALEFACTOR=
2.9059E+001
CBS: SLCB2
FILE: MODEL MIND FULL NEW UNIT:mm DATE:07/09/2022
VIEW-DIRECTION
MAX : 154 MIN : 274
FILE: MODEL MIND UNIT:mm
The deflection limit for the truss members previosly considered is L/250. While, for the cantilever deflection we have considered a limit of L/180 20m / 180 = 0.11 m = 110 mm. While, the maximum deflection of the structure under stress is 79 mm. 79mm < 110 mm. Satisfied


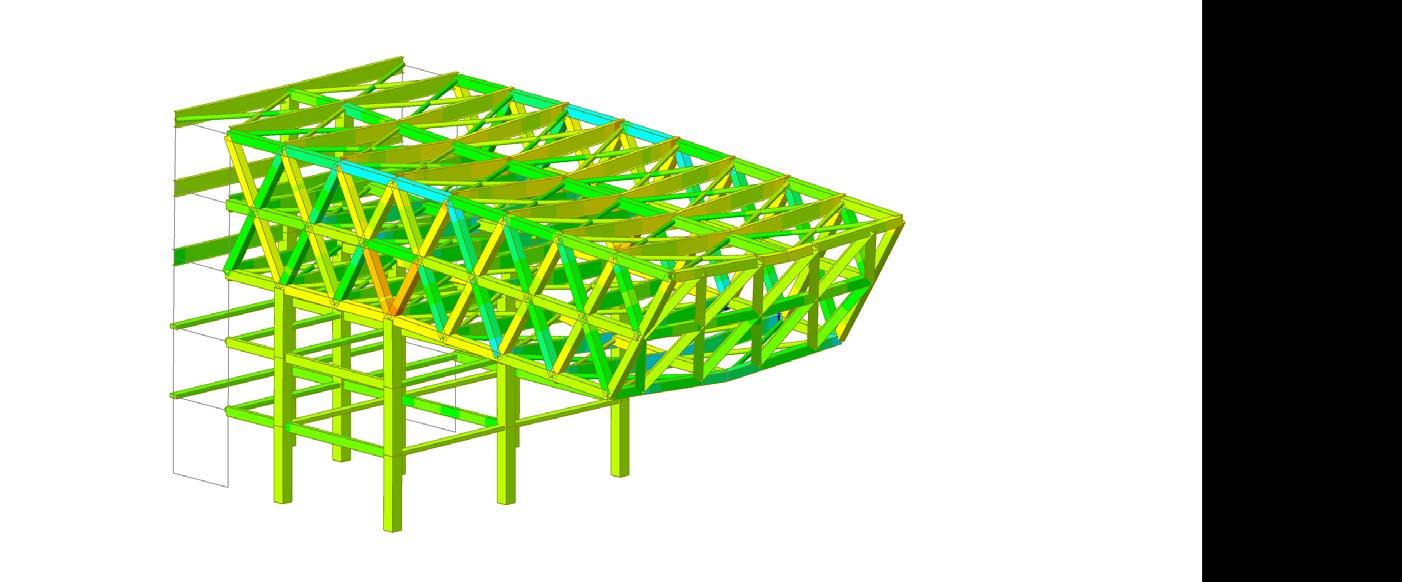
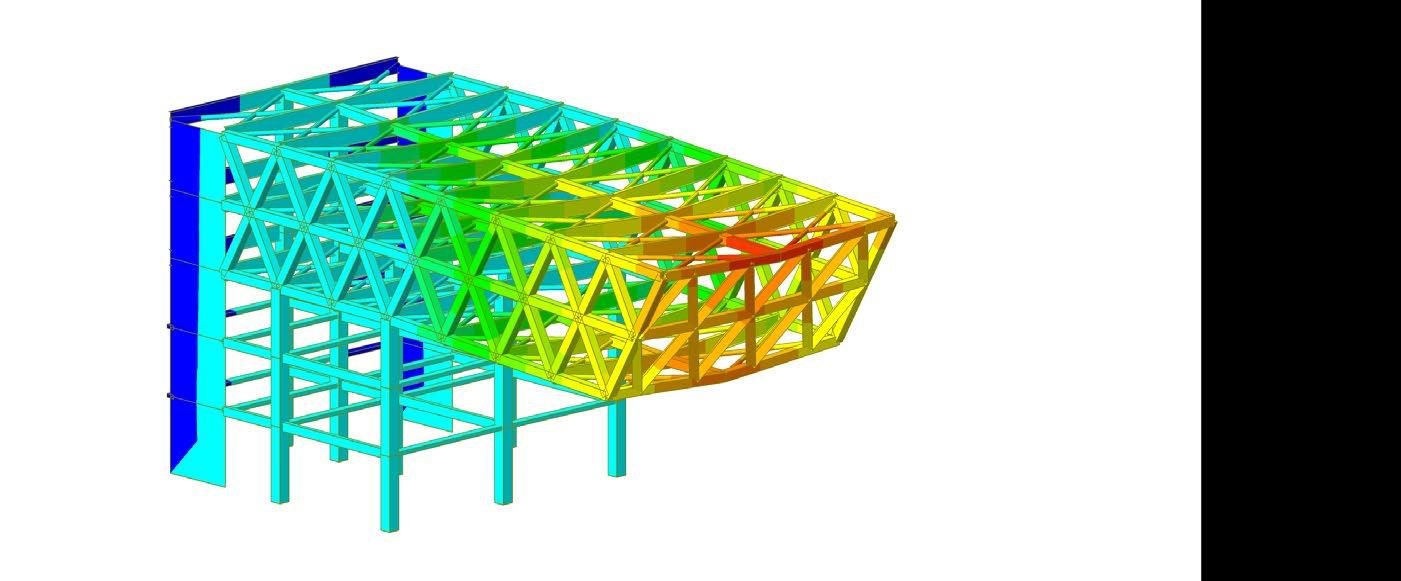
X:0.697 Y:-0.672 Z:0.250
DATE:07/09/2022
VIEW-DIRECTION
X:0.697 Y:-0.672
Fig 203.: Stress analysis, Authors
139 midas Gen


142 L7 2 L8 2 GL GL GL GL OG OG GL GL OG GL OG GL OG GL Level 0 / ±0.00 Level 1 / +5.00 Level 2 / +9.50 Level 3 / +14.00 Level 4 / +18.50 Level 5 / +23.00 Facade 1:200 A17 304 2317 1000 1000 2000 144 306 144 306 157 1258 1057 2315 A15 2 A16 2 A17 2 4 3 2 1 Fig 209: Cantilever section , Authors Structural Drawings
CSHS 323.9 x 25
HEB 1000
Welded custom C - Channel profile 4 mm
Vertical Detail A16/2 - 1:10
Extended insulated window profile with double glazing
Angular steel covering profile 6 mm
HSS 600 x 30
CSHS 323.9 x 25
HEB 1000

Welded custom C - Channel profile 4 mm
Angular steel covering profile 6 mm
HSS 600 x 30
Extended insulated window profile with double glazing
143
C2 C2 B3 B3 7 1 2 3 4 B4 B4 B4 A7 1 19 17 11 13 17.30 12 28
x 25 CSHS 323.9 x 25 Level 4 / +18.50 485 500 L7 2 Cantilever Cross Section 1:200 A13 2 OG GL GL GL OG GL GL GL Level 0 ±0.00 Level 1 +5.00 Level 2 / +9.50 Level 3 / +14.00 Level 4 / +18.50 Level 5 +23.00 Facade 1:200 A17 2 Level 0 / ±0.00 Level 1 / +5.00 Level 2 / +9.50 Level 3 / +14.00 Level 4 / +18.50 Laboratories Laboratories Laboratories Cultural/Public Level 5 / +23.00 Level -1 -3.24 Level 0 ±0.00 Level 4 +18.50 Laboratories Laboratories Laboratories Level 5 +23.00 Auditorium Level 1 / +5.00 Level 2 / +9.50 Level 3 +14.00 Cultural/Public Level -1 / -3.24 1000 1000 1000 1000 4000 500 450 450 450 467 304 2317 500 450 450 450 450 1400 900 324 2300 C1 C1 A14 2 144 306 144 306 157 1258 1057 2315 1000 A4 1 4 3 2 1 5 1
Fig 212: Section, Authors Structural Drawings
Vertical Detail A17/2 - 1:10
CSHS 323.9
Fig 210: Detail, Authors Fig 211: Detail, Authors
144
service design

5
Fig 213: Concept drawing of HVAC, Authors
146
Service Design
The Heating, ventilation and air conditioning system selected for the research building is an all-air system. It is composed of heating pumps and air handling units in the underground, as well as air distribution ducts and ceiling grills and diffusers. The air inside the building is ventilated and conditioned through a series of ducts that come from the technical rooms in the underground floor and spread through each floor. In each enclosed space there are at least 2 grilles attached to the false ceiling. One of them supplies fresh and conditioned air, while the other returns the consumed air to the air-handling unit in the basement. This same air goes through a process of filtration, cooling or heating from the heat pump and later on is distributed again throughout the research center. This is a closed cycle that goes on repeatedly.
This chapter provides a thorough analysis on the components of the above-mentioned system, together with the representation of the architectural spaces it is connected to. The analysis begins with an understanding of the summer cooling and winter heating loads necessary to maintain comfort in the interior spaces of the research center through the most extreme seasons of the year. The values extracted from this study are subsequently used to determine the producers and the parameters of the heat pump and the air handling units. Furthermore, an estimation is done on the air flow that is required for each architectural space. Such computation has provided the means necessary to determine the dimensioning of each duct.
Underground Heat pump and Air handling unit Axonometry
Fig 214: Underground concept, Authors
147
concept Concept
winter heat load
General information
It is part of the designers job to consider all the different aspects of a project when conceptualizing a new building. Similarly to the architectural design, or the structural one, the thermal design has its own weight in the design process. It is essential for a contemporary project to offer thermal comfort in addition to architectural quality. In this module our aim is to give an answer to the main problems regarding heating and cooling energy requirements.

The layers of the roof consist of soil, gravel, screed, XPS insulation and lastly the cross laminated slab. Upon gathering the thermal conductivity of each layer, we were able to find the total Resistance of the slab.
R = d/
Subsequently, the total roof transmittance was calculated.
UR = 1/R.
On the other side, the vertical envelope is compose
Several data are needed to calculate the amount of energy necessary for a building to function properly. Such data are related to the site location, the materiality and transmittance of the building envelope. In this first part we have begun the analysis by illustrating the materiality of the horizontal and vertical envelope.
Roof Layers
To simplify the analysis the building was studied as one unit. In other words, the internal divisions such as walls, or floors were not taken into consideration. The building components that played a role are the external curtain wall and the roof. Therefore, as a starting point we have broken down such components and used their characteristics to calculate the total resistance through the use of their thermal transmittance.
Layer of the roof Thickness (m) λ (W/mk)
Layer of the roof Thickness (m)
Soil substrate 0.15
Soil substrate 0.15
Gravel 0.05 Screed 0.1
Gravel 0.05 Screed 0.1
Thermal Insulation 0.12 0.02
X-Lam timber deck 0.24
Thermal Insulation 0.12 X-Lam timber deck 0.24
Total
Total
Total Transmittance (W/m² K)
Total Transmittance (W/m² K)
Façade glazing Transmittance (W/m² K) 1.2
Façade glazing Transmittance (W/m² K) 1.2
Winter Heat Load
Facade composition
Total heat load through transmission
On the other side, the vertical envelope is composed of a curtain wall. The product we have selected for the exterior facade is Schüco FWS 35 PD.HI. It is composed of a double layered glass connected to aluminum transoms and mullions. Below we have represented a table with the thermal transmittance of 1.20 W/m2K, provided by the producer.
The formula for the calculation of the total conduction heat flow is:
����,��=Σ������������ (��int,i−����)+ Σ��������Ψ�� (��������,��−����)+ Σ �������� (��������,��−����)
This formula does not simply take into account the heat conduction through the area of the glass, but also through the linear and punctual thermal bridges of the building.
Legend:
Layer of the roof Thickness (m) λ (W/mk) Resistance (m2K/W) Density
Layer of the roof Thickness (m) λ (W/mk) Resistance (m2K/W) Density
����= Exposition correction factors which take into account of climatic influences on absorption of humidity, wind velocity, etc. ����= dispersing surface[m2]
Soil substrate 0.15 0.8 0.19 2000 Gravel 0.05 0.5 0.05 1600 Screed 0.1 1.8 0.06 2100
Soil substrate 0.15 0.8 0.19 2000 Gravel 0.05 0.5 0.05 1600 Screed 0.1 1.8 0.06 2100 Thermal Insulation 0.12 0.02 6 30 X-Lam timber deck 0.24 0.12 2.00 500 Total 8.3
Thermal Insulation 0.12 0.02 6 30 X-Lam timber deck 0.24 0.12 2.00 500 Total 8.3
����= Thermal transmittance of building component[W/m2/K] ����= Length of thermal bridge[m] ����= Linear thermal transmittance of thermal bridge[W/m/K] ����= Punctual thermal transmittance of thermal bridge[W/K] ��������,��= internal design temperature[°C] ����= external design temperature[°C]
Total Transmittance (W/m² K)
Total Transmittance (W/m² K)
Fig 216: Facade type
0.12
0.12
In the table represented below we have calculated a final conduction heat flow for each facade . The final value of the conduction heat flow of the transparent envelope is 142.9 kW, while the conduction through the roof is 10.9 kW.
Façade glazing Transmittance (W/m² K) 1.2 Tint 20 Tout -1
Façade glazing Transmittance (W/m² K) 1.2 Tint 20 Tout -1
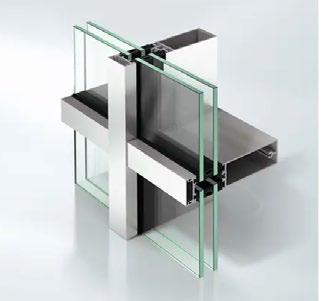
The total heat transfer is QT = 153.8 kW.
Winter Heat Load
Winter Heat Load
Transparent envelope e U (W/m² K) A (m²) dT QT (W) QT (KW) North 1.2 1.2 470 21 14212.8 14.2128 East 1.15 1.2 2030 21 58829.4 58.8294 West 1 1.2 977 21 24620.4 24.6204 South 1.1 1.2 1632 21 45239.04 45.239 142901.64 142.902
Transparent envelope e U (W/m² K) A (m²) dT QT (W) QT (KW) North 1.2 1.2 470 21 14212.8 14.2128 East 1.15 1.2 2030 21 58829.4 58.8294 West 1 1.2 977 21 24620.4 24.6204 South 1.1 1.2 1632 21 45239.04 45.239 142901.64 142.902
Opaque e U (W/m² K) A (m²) dT QT (W) QT (KW) Roof 1 0.12 4325 21 10899 10.899
Opaque e U (W/m² K) A (m²) dT QT (W) QT (KW) Roof 1 0.12 4325 21 10899 10.899
QT (KW) = QTT + QTR 153.80064
QT (KW) = QTT + QTR 153.80064
Winter Heat Load
149
Heat dispersion through ventilation
����= �� �� ����(��i−��e)
��= fresh air flow rate [m3/s]
ρ= air density [kg/m3]
ρ = 1.225 kg/m3
����= specific heat of air [J/kg K] ����= 1005 J/kg K
����= (�� * n / 3600) * �� �� �� (��i−�� ��)
��= volume of building
��= Air change per hour (standard = 0,5)
�� �� = design ambient temperature[°C] �� �� = 20 °C
�� �� = design external temperature[°C] �� �� = -1 °C
V = 3386m2 * 5m + 4.5 m * (3627 + 2928 + 2552 + 702) m2
V = 3386m2 * 5m + 4.5 m * 9809 m2
V = 16,930 m3 44,140.5 m3
V = 61,070.5 m3
����= (61,070.5 *0.5 (m3/s) /3600)* 1.225 kg/m3 * 1005 J/kg K * [20-(-1)]K
����= (8.5 * 1.225 * 1005 * 21) J/s
����= (10,464.6 * 21) J/s
���� = 219,755.8 W
���� = 219.8 kW
Additional heating-up power ��hu,i = ������ℎ��,��
���� is the surface of the heated space ��ℎ��,�� a correction factor [W/m2]
Hence, to calculate the additional heating-up power, it is required to obtain from the lower left table the value of the correction factor ��ℎ��,�� Once that is done, the facade and roof areas of the building in different directions can be used to get the final heating up value. Such calculation is represented in the table below.
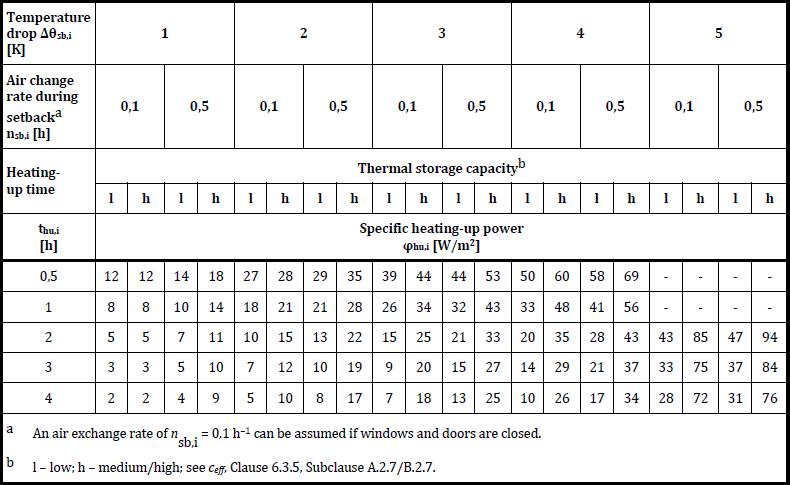
The total value of ��hu,i = 169.8 kW.
Exposition ��������ℎ��������,�������� (W/m2) Ai (m2) ��������hu,I (W) ��������hu,I (kW)
North 18 470 8460 8.46
East 18 2030 36540 36.54 West 18 977 17586 17.586 South 18 1632 29376 29.376 Roof 18 4325 77850 77.85 Total 169812 169.812
Heat dispersion through ventilation
����,��= Thermal dispersion by transmission[W] ����,i = Thermal dispersion by ventilation[W] ��ℎ��,��= Extraction power needed for compensating the effects of the intermitting heating[W]
������,��= ����,i + ����,i +��ℎ��,��
Now that all the required heat transfer values have been calculated, we can go ahead and sum them up to obtain the total winter heat load.
������,��= 153.8 kW + 219.8 kW + 169.8 kW. ������,��= 543.4 kW
150
Winter Heat Load
Fixed machinery Heat (W) Amount Total (W)
Variable Heat (W) Amount (people) Total (W)
photocopy 450 50 22500 Seated working space 70 350 24500
Scanner 1500 25 37500 Laboratory 75 426 31950
Sensitive Sensitive
Coffee machines 1000 24 24000 Restaurant and cafeteria 80 400 32000 Microwave 400 6 2400 Auditorium 65 304 19760
Fixed machinery Heat (W) Amount Total (W)
Variable Heat (W) Amount (people) Total (W) photocopy 450 50 22500 Seated working space 70 350 24500 Scanner 1500 25 37500 Laboratory 75 426 31950
summer heat load
Cold water distributer 1750 20 35000 Heat (W) Amount
Cold drink distributor 550 20 11000 personal computers 90 560 50400
General information
Coffee machines 1000 24 24000 Restaurant and cafeteria 80 400 32000 Microwave 400 6 2400 Auditorium 65 304 19760
Envelope information
Cold water distributer 1750 20 35000 Heat (W) Amount
Cold drink distributor 550 20 11000 personal computers 90 560 50400
This second study that we conducted is related to the summer heat load calculation. Up to now we have gotten a glimpse of the amount of energy the building we have designed requires during the winter. However, the city of Milan is known for its continental climate. Summer days can achieve quite humid and high temperatures. This leads to a large amount of heat to transfer inside the work environment and to create discomfort. In general the energy that is going to be needed to cool down the building during the hottest days of summer is going to be higher than the winter heat load that we previously saw.
Envelope information
Minicalculators 2000 25 50000 158610 Laser printer 350 25 8750 191150 8 47583 9 79305 10 79305 11 111027 100 70 12 158610 4 5 750 13 79305 2 4 480 14 79305 15 158610 16 158610 17 158610 18 158610 19 79305 20 47583 21 31722 22 31722 23 0 24 0
The analysis is started by organizing the necessary data into tables. Firstly, we start with the general information of the site, such as; the average external temperature together with the internal project temperature, the humidity and the building mass in plan (kg/m2).
Minicalculators 2000 25 50000 158610 Laser printer 350 25 8750 191150 8 47583 9 79305 10 79305 11 111027 100 70 12 158610 4 5 750 13 79305 2 4 480 14 79305 15 158610 16 158610 17 158610 18 158610 19 79305 20 47583 21 31722 22 31722 23 0 24 0
The analysis is started by organizing the necessary data into tables. First we start with the general information of the site, the average temperature, the humidity and the building mass in plan (kg/m2).
Once again we are considering the building as one unit block, without taking into account the internal divisions between airconditioned and unconditioned rooms. The interior environment is rather considered as one space and the only division is formed through the exterior facade and roof.
Hence, in the table below for every exposed surface of the building is indicated a correlating information regarding the thermal transmittance, area of the exposure, the attenuation factor, the shading coefficient and the frontal mass. The research building we are designing is characterized by a stick system facade. Therefore, the opaque surface transmittance and frontal mass are not taken into account. Rather the calculation is centered more around the transparent surface transmittance, the attenuation factor, shading factor and the glass area for each direction.
Through this table we obtain the means necessary to determine the heat gain of the building through conduction during the warmest month of the year, considering an external temperature equal to 30 oC and an internal one equal to 20 oC.
General Data
Note
Location Milano - 0
External project temperature Te 30 °C ompreso fra 5 e 17 °C
General Data
Note
Location Milano - 0
External project temperature Te 30 °C ompreso fra 5 e 17 °C
Daily thermal excursion ΔTe 12 °C ore compreso fra:
Daily thermal excursion ΔTe 12 °C ore compreso fra: Absolute maximum external humidity Xe 13.6 g/kg icali: 100 e 700 kg/mq Latitude 45 ° e sole: 50 e 400 kg/mq 4646 ' ombra: 100 e 300 kg/mq
Interior project temperature Ta 20 °C preso fra 150 e 730 kg/mq
Absolute maximum external humidity Xe 13.6 g/kg icali: 100 e 700 kg/mq Latitude 45 ° e sole: 50 e 400 kg/mq 4646 ' ombra: 100 e 300 kg/mq
Interior project humidity Xa 5.9 g/kg PI CON BORDO ARANCIONE Plan mass Ma 713 kg/mq External air flow V 32160 mc/h
Interior project temperature Ta 20 °C preso fra 150 e 730 kg/mq
Interior project humidity Xa 5.9 g/kg PI CON BORDO ARANCIONE Plan mass Ma 713 kg/mq
Envelope Data
External air flow V 32160 mc/h
Opaque surfaces Windows
Exposition Up Mf,p** A UF f F=SC Fvs SF W/(mq K) kg/mq mq W/(mq K) - - mq
Envelope Data
North 0 100 0 1.2 0.95 0.82 470 East 0 100 0 1.2 0.95 0.82 2030 West 0 100 0 1.2 0.95 0.82 977 South 0 100 0 1.2 0.95 0.82 1632
Opaque surfaces Windows
Exposition Up Mf,p** A UF f F=SC Fvs SF W/(mq K) kg/mq mq W/(mq K) - - mq
Horizontal shading 0 100 0 Horizontal Sun 2.7 620 4339
North 0 100 0 1.2 0.95 0.82 470 East 0 100 0 1.2 0.95 0.82 2030 West 0 100 0 1.2 0.95 0.82 977 South 0 100 0 1.2 0.95 0.82 1632
Horizontal shading 0 100 0 Horizontal Sun 2.7 620 4339
Carichi Interni
Internal sensible constant load Qint,s,cost 191150 W
Internal latent constant load Qint,l,cost 15600 W
Carichi Interni
Internal sensible constant load Qint,s,cost 191150 W
Internal latent constant load Qint,l,cost 15600 W
Carichi interni totali Ora Costante Variabile Costante Variabile H Qint,s,cost Qint,s,var Qint,l,cost Qint,l,var h W W W W 8 191150 47583 15600 34953
Carichi interni totali
Ora Costante Variabile Costante Variabile
151
Summer Heat Load
Sensitive Latent
Amount Total (W) Variable Heat (W) Amount (people) Total (W)
Fixed machinery Heat (W) Amount Total (W) Variable 22500 Seated working space 70 350 24500 photocopy 0 50 0 Seated working 37500 Laboratory 75 426 31950 Scanner 0 25 0 Laboratory 24000 Restaurant and cafeteria 80 400 32000 Coffee machines 650 24 15600 Restaurant and 2400 Auditorium 65 304 19760 Microwave 0 6 0 Auditorium 35000 Heat (W) Amount Cold water distributer 0 20 0 11000 personal computers 90 560 50400
Another important factor that has to be taken into account is the internal heat gain. To evaluate more accurately the summer heat load it is necessary to determine all the energy released through the machinery used inside the building. Every device to function needs the use of electricity. The power generated is later on transformed into heat and is released into the environment. In addition to this also the people using the facilities inside the building, just like any machinery, release a certain amount of heat.
(people) Total (W)
General Data Note Location
Note
Location Milano - 0
Milano - 0
External project temperature Te 30 °C ompreso fra
External project temperature Te 30 °C ompreso fra 5 e 17 °C
Daily thermal excursion ΔTe 12 °C ore compreso
Latent Latent
Fixed machinery Heat (W) Amount Total (W)
Daily thermal excursion ΔTe 12 °C ore compreso fra: Absolute maximum external humidity Xe 13.6 g/kg icali: 100 e 700 kg/mq Latitude 45 ° e sole: 50 e 400 kg/mq 4646 ' ombra: 100 e 300 kg/mq
Absolute maximum external humidity Xe 13.6 g/kg icali: 100 e Latitude 45 ° e sole: 50 e 4646 ' ombra: 100
Variable Heat (W) Amount (people) Total (W)
350 24500 photocopy 0 50 0 Seated working space 65 350 22750
Interior project temperature Ta 20 °C preso fra 150
426 31950 Scanner 0 25 0 Laboratory 80 426 34080
Interior project temperature Ta 20 °C preso fra 150 e 730 kg/mq
400 32000 Coffee machines 650 24 15600 Restaurant and cafeteria 115 400 46000
304 19760 Microwave 0 6 0 Auditorium 45 304 13680
Interior project humidity Xa 5.9 g/kg PI CON BORDO Plan mass Ma 713 kg/mq External air flow V 32160 mc/h
Amount Cold water distributer 0 20 0 Heat (W) Amount
Below we have represented 2 tables that show the sensitive energy release caused by machinery such as photocopy, scanner, coffee machines, microwaves, etc. This is followed by a series of variable heat loads created by people and personal computers. For every function we have estimated an amount of people that are going to be using the facilities. For example for laboratories we have estimated around 426 people in total considering 5 m2/ person of space.
Interior project humidity Xa 5.9 g/kg PI CON BORDO ARANCIONE Plan mass Ma 713 kg/mq External air flow V 32160 mc/h
Envelope Data
Opaque surfaces Windows
Total (W)
In total the fixed machineries release a sensitive heat of 191 kW and a latent heat of 15 kW. On the other side the sensitive variable loads are 159 kW and latent variable loads are 116 kW.
Exposition
Opaque surfaces Windows
Exposition
560 50400 Cold drink distributor 0 20 0 personal computers 0 560 0 158610 Minicalculators 0 25 0 116510 Laser printer 0 25 0 15600
Up Mf,p** A UF W/(mq K) kg/mq mq W/(mq K)
Total internal loads throughout the day
Up Mf,p** A UF f F=SC Fvs W/(mq K) kg/mq mq W/(mq K) - -
North 0 100 0 1.2 East 0 100 0 1.2 West 0 100 0 1.2 South 0 100 0 1.2
North 0 100 0 1.2 0.95 0.82 East 0 100 0 1.2 0.95 0.82 West 0 100 0 1.2 0.95 0.82 South 0 100 0 1.2 0.95 0.82 Horizontal shading 0 100 0 Horizontal Sun 2.7 620 4339
°C ompreso fra 5 e 17 °C
°C ore compreso fra: g/kg icali: 100 e 700 kg/mq
Envelope
° e sole: 50 e 400 kg/mq ' ombra: 100 e 300 kg/mq
Sensitive Sensitive
Fixed machinery Heat (W) Amount Total (W)
Horizontal shading 0 100 0 Horizontal Sun 2.7 620 4339
Carichi Interni
However, the variable loads have to be calculated throughout one entire day. For this reason we have considered the amounts calculated above as the maximum variable loads during the busiest hours of the research center. For the rest of the day we have taken different percentages of the maximum amount. For example for 11 A.M.we have considered 70% of the total variable load, or at 02:00 P.M. we have considered 50% of the total load.
Internal sensible constant load Qint,s,cost 191150 W Internal latent constant load Qint,l,cost 15600 W
Internal sensible constant load Qint,s,cost 191150 W Internal latent constant load Qint,l,cost 15600 W
Carichi interni totali
Cold drink distributor 0 20 0 personal computers 50000 158610 Minicalculators 0 25 0 8750 Laser printer 0 25 0 191150 15600 8 47583 9 79305 10 79305 11 111027 12 158610 750 13 79305 480 14 79305 15 158610 16 158610 17 158610 18 158610 19 79305 20 47583 21 31722 22 31722 23 0 24 0 Note Milano - 0
Variable sensible load during the day.
Carichi interni totali
Ora Costante Variabile Costante Variabile H Qint,s,cost Qint,s,var Qint,l,cost Qint,l,var h W W W W
47583 8 34953 79305 9 58255 79305 10 58255 111027 11 81557 158610 12 116510 79305 13 58255 79305 14 58255 158610 15 116510 158610 16 116510 158610 17 116510 158610 18 116510 79305 19 58255 47583 20 34953 31722 21 23302 31722 22 23302 0 23 0 0 24 0
Ora Costante Variabile Costante H Qint,s,cost Qint,s,var Qint,l,cost h W W W
8 191150 47583 15600
8 191150 47583 15600 34953
9 191150 79305 15600
9 191150 79305 15600 58255 10 191150 79305 15600 58255 11 191150 111027 15600 81557
10 191150 79305 15600
11 191150 111027 15600 12 191150 158610 15600
12 191150 158610 15600 116510
13 191150 79305 15600
13 191150 79305 15600 58255
Sensitive Latent
Variable Heat (W) Amount (people) Total (W)
Data
°C preso fra 150 e 730 kg/mq g/kg PI CON BORDO ARANCIONE kg/mq mc/h Windows
14 191150 79305 15600
14 191150 79305 15600 58255
15 191150 158610 15600
15 191150 158610 15600 116510
16 191150 158610 15600
Fixed machinery Heat (W) Amount Total (W) Variable
16 191150 158610 15600 116510
22500 Seated working space 70 350 24500 photocopy 0 50 0 Seated working space
17 191150 158610 15600 116510
17 191150 158610 15600 18 191150 158610 15600 19 191150 79305 15600 20 191150 47583 15600 21 191150 31722 15600 22 191150 31722 15600 23 191150 0 15600 24 191150 0 15600
Variable sensible load during the day.
A UF f F=SC Fvs SF kg/mq mq W/(mq K) - - mq 0 1.2 0.95 0.82 470 0 1.2 0.95 0.82 2030 0 1.2 0.95 0.82 977 0 1.2 0.95 0.82 1632 0 4339
Variable Heat (W) Amount (people) Total (W) photocopy 450 50 22500 Seated working space 70 350 24500 Scanner 1500 25 37500 Laboratory 75 426 31950 Coffee machines 1000 24 24000 Restaurant and cafeteria 80 400 32000 Microwave 400 6 2400 Auditorium 65 304 19760 Cold water distributer 1750 20 35000 Heat (W) Amount Cold drink distributor 550 20 11000 personal computers 90 560 50400 Minicalculators 2000 25 50000 158610 Laser printer 350 25 8750 191150 8 47583 9 79305 10 79305 11 111027 100 70 12 158610 4 5 750 13 79305 2 4 480 14 79305 15 158610 16 158610 17 158610 18 158610 19 79305 20 47583 21 31722 22 31722 23 0 24 0
18 191150 158610 15600 116510 19 191150 79305 15600 58255 20 191150 47583 15600 34953 21 191150 31722 15600 23302 22 191150 31722 15600 23302 23 191150 0 15600 0 24 191150 0 15600 0
Variable sensible load during the day.
37500 Laboratory 75 426 31950 Scanner 0 25 0 Laboratory 24000 Restaurant and cafeteria 80 400 32000 Coffee machines 650 24 15600 Restaurant and cafeteria 2400 Auditorium 65 304 19760 Microwave 0 6 0 Auditorium 35000 Heat (W) Amount Cold water distributer 0 20 0 11000 personal computers 90 560 50400 Cold drink distributor 0 20 0 personal computers 50000 158610 Minicalculators 0 25 0 8750 Laser printer 0 25 0 191150 15600 8 47583 9 79305 10 79305 11 111027
152
Carichi Interni
Envelope Data General Data Internal load calculation
W W
Summer Heat Load
Lastly, from all the information gathered up to now it is possible to obtain a final load transmission. In the table below we have represented for most of the daytime the total loads, either by transmission through window, or internal loads. At the end we got a maximum value of 1,577 kW for sensible and 338.6 kW for latent summer heat load. Through the use of this maximum value we can go ahead and select the necessary heat pump and air handling unit.
Time of day 8 9 10 11 12 13 14 15 16 17 18 19
North Walls Transmission 0 0 0 0 0 0 0 0 0 0 0 0 Windows Transmission 958.8 1748.4 2538 3243 3948 4653 5358 5640 5358 5076 4794 4117.2 3440.4 Windows Irradiation 3650.081 4506.88 5155.22736 5695.51319 6228.14498 6660.37365 7193.00544 7509.52289 7833.69439 8042.15468 6383.02692 5611.31865 4955.3216
0 0 0
958.8 1748.4 2538 3243 3948 4653 5358 5640 5358 5076 4794 4117.2 3440.4 2735.4 2030.4 1325.4 620.4 3650.081 4506.88 5155.22736 5695.51319 6228.14498 6660.37365 7193.00544 7509.52289 7833.69439 8042.15468 6383.02692 5611.31865 4955.3216 4500.13078 3959.84494 3635.67 3319.16 0 0 0 0 0 0 0 0 0 0 0 0 0 0 0 0 0 4141.2 7551.6 10962 14007 17052 20097 23142 24360 23142 21924 20706 17782.8 14859.6 11814.6 8769.6 5724.6 2679.6 271928.4 311984 319323.3 302405.946 269690.283 237534.143 221176.312 204818.481 181680.542 172662.341 156864.033 140506.202 125267.417 109469.109 101569.955 93111.3 77872.5
East Walls Transmission 0 0 0 0 0 0 0 0 0 0 0 0 Windows Transmission 4141.2 7551.6 10962 14007 17052 20097 23142 24360 23142 21924 20706 17782.8 14859.6
Windows Irradiation 271928.4 311984 319323.3 302405.946 269690.283 237534.143 221176.312 204818.481 181680.542 172662.341 156864.033 140506.202 125267.417
West Walls Transmission 0 0 0 0 0 0 0 0 0 0 0 0 Windows Transmission 1993.08 3634.44 5275.8 6741.3 8206.8 9672.3 11137.8 11724 11137.8 10551.6 9965.4 8558.52 7151.64 Windows Irradiation 98319.02 89905.7 89905.6843 89905.6843 90547.0593 117069.802 172039.413 246401.185 328534.913 384145.899 402896.686 346644.325 300088.046
0 0 0 0 0 0 0 0 0 0 0 0 0 0 0 0 0 1993.08 3634.44 5275.8 6741.3 8206.8 9672.3 11137.8 11724 11137.8 10551.6 9965.4 8558.52 7151.64 5686.14 4220.64 2755.14 1289.64 98319.02 89905.7 89905.6843 89905.6843 90547.0593 117069.802 172039.413 246401.185 328534.913 384145.899 402896.686 346644.325 300088.046 263227.847 234780.979 207617 188866
South Walls Transmission 0 0 0 0 0 0 0 0 0 0 0 0 Windows Transmission 3329.28 6071.04 8812.8 11260.8 13708.8 16156.8 18604.8 19584 18604.8 17625.6 16646.4 14296.32 11946.24 Windows Irradiation 82106.06 127009 178712.328 224065.145 269417.963 307520.68 327021.863 326572.039 307070.857 268068.492 234966.756 208665.297 183263.486
0 0 0 0 0 0 0 0 0 0 0 0 0 0 0 0 0 3329.28 6071.04 8812.8 11260.8 13708.8 16156.8 18604.8 19584 18604.8 17625.6 16646.4 14296.32 11946.24 9498.24 7050.24 4602.24 2154.24 82106.06 127009 178712.328 224065.145 269417.963 307520.68 327021.863 326572.039 307070.857 268068.492 234966.756 208665.297 183263.486 163762.303 144710.945 132010 119309
Shadow Walls Transmission 0 0 0 0 0 0 0 0 0 0 0 0
0 0 0 0 0 0 0 0 0 0 0 0 0 0 0 0 0
Sunlight Walls Transmission 85488.89 85495.9 92525.0963 98395.6332 117153 156985.02 182765.709 195665.426 222610.616 242525.454 255405.255 255399.398 242512.568
85488.89 85495.9 92525.0963 98395.6332 117153 156985.02 182765.709 195665.426 222610.616 242525.454 255405.255 255399.398 242512.568 235477.53 235457.614 222564 209671
Infiltration
191150 191150 191150 191150 191150 191150 191150 191150 191150 191150 191150 191150 191150 191150 191150 191150 191150 47583 79305 79305 111027 158610 79305 79305 158610 158610 158610 158610 79305 47583 31722 31722 0 0 808962.9 941760 1032146.44 1119845.22 1221127.25 1235686.32 1341243.1 1499770.65 1558082.42 1577343.94 1549963.16 1350683.66 1197936.68 1081295.26 1004207.18 889813 808783
1577343.941
Internal load Constant 191150 191150 191150 191150 191150 191150 191150 191150 191150 191150 191150 191150 191150 Variable 47583 79305 79305 111027 158610 79305 79305 158610 158610 158610 158610 79305 47583 Total 808962.9 941760 1032146.44 1119845.22 1221127.25 1235686.32 1341243.1 1499770.65 1558082.42 1577343.94 1549963.16 1350683.66 1197936.68 Max sensible load Time of day 8 9 10 11 12 13 14 15 16 17 18 19 Infiltration 206442.5 206443 206442.544 206442.544 206442.544 206442.544 206442.544 206442.544 206442.544 206442.544 206442.544 206442.544 206442.544 Internal load Constant 15600 15600 15600 15600 15600 15600 15600 15600 15600 15600 15600 15600 15600 Variable 34953 58255 58255 81557 116510
338552.544 338552.544 222042.544 280297.544 256995.544 Max latent load 338552.544
153 Total summer load
58255 58255 116510 116510 116510 0 58255 34953 Total 256995.5 280298 280297.544 303599.544 338552.544 280297.544 280297.544 338552.544
8 9 10 11 12 13 14 15 16 17 18 19 20 21 22 23 24 0 0 0 0 0 0 0 0 0 0 0 0 0
0
206442.544 206442.544 206442.544 206442.544
15600 15600 15600 15600 15600 15600 15600 15600 15600 15600 15600
116510 58255
338552.544 280297.544
Summer Heat Load
8 9 10 11 12 13 14 15 16 17 18 19 20 21 22 23 24 206442.5 206443 206442.544 206442.544 206442.544 206442.544
206442.544 206442.544 206442.544 206442.544 206442.544 206443 206443
15600 15600 15600 15600 15600 15600 34953 58255 58255 81557
58255 116510 116510 116510 0 58255 34953 23302 23302 0 0 256995.5 280298 280297.544 303599.544
280297.544 338552.544 338552.544 338552.544 222042.544 280297.544 256995.544 245344.544 245344.544 222043 222043 338552.544 1577343.941
Heat pump
Producer: Climaveneta Model type: i-FX2-W-G04/H 0402 - 1242
High efficiency heat pump with water source, reversible on the hydraulic side
398 - 1.242 kW
” Unit for internal installation for the production of chilled/hot water with screw compressors optimized to work with low compression ratios, driven by high efficiency variable speed motors (Inverter Driven), using very low GWP HFO R1234ze refrigerant. All sizes are made with two completely independent refrigerant circuits, electronically controlled expansion valves, shell and tube condenser and flooded/falling film hybrid type evaporator with low refrigerant charge technology and high heat transfer coefficients, both by design and manufacturing Mitsubishi Electric Hydronics and IT Cooling Systems. These particular technological solutions allow the unit to achieve high efficiencies, with a low refrigerant charge ”.
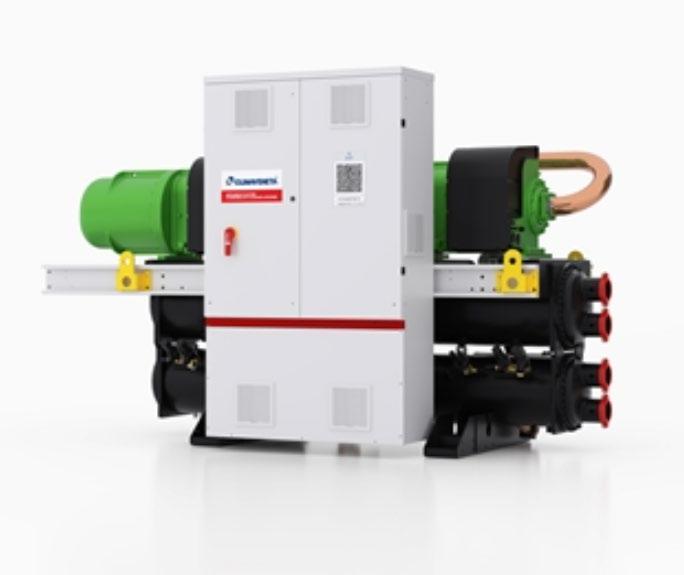
- High efficient at artial loads.
” Combining brilliant annual efficiency with the use of a low GWP refrigerant, i-FX2-W-G04 tackles both the indirect (due to the primary energy consumption) and the direct global warming impact, thus resulting the perfect choice for any new, forward-looking cooling system.
The environmental impact of the refrigerants is measured by two parameters:
ODP: Ozone Depletion Potential
GWP: Global Warming Potential
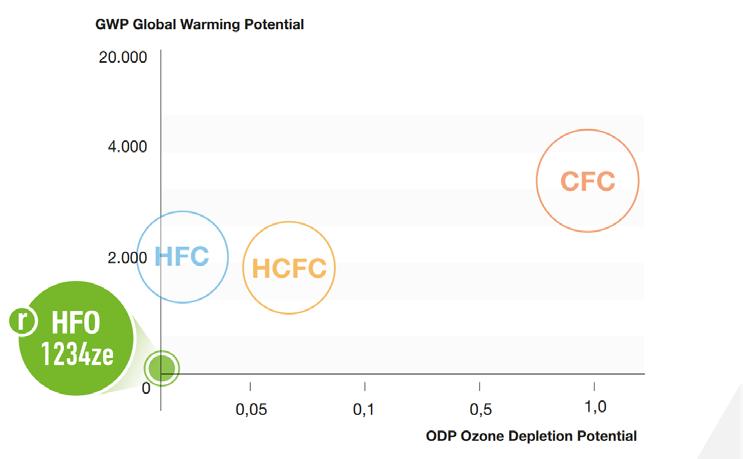
While in the past the focus was on reducing ODP values to 0, new regulations encourage Member States to work harder on GWP ” .
Fig 217: Heat pump
154 producer
Producer
Finally our choice for the heat pump was the climaveneta product. with a model code: i-FX2-W-G04/H 0402. The amount of energy we obtained from the previous summer heat analysis was 1557 kW. Therefore, we selected from the producer table illustrated below 2 heat pumps of 852 kW, which are going to be placed in the underground technical rooms.
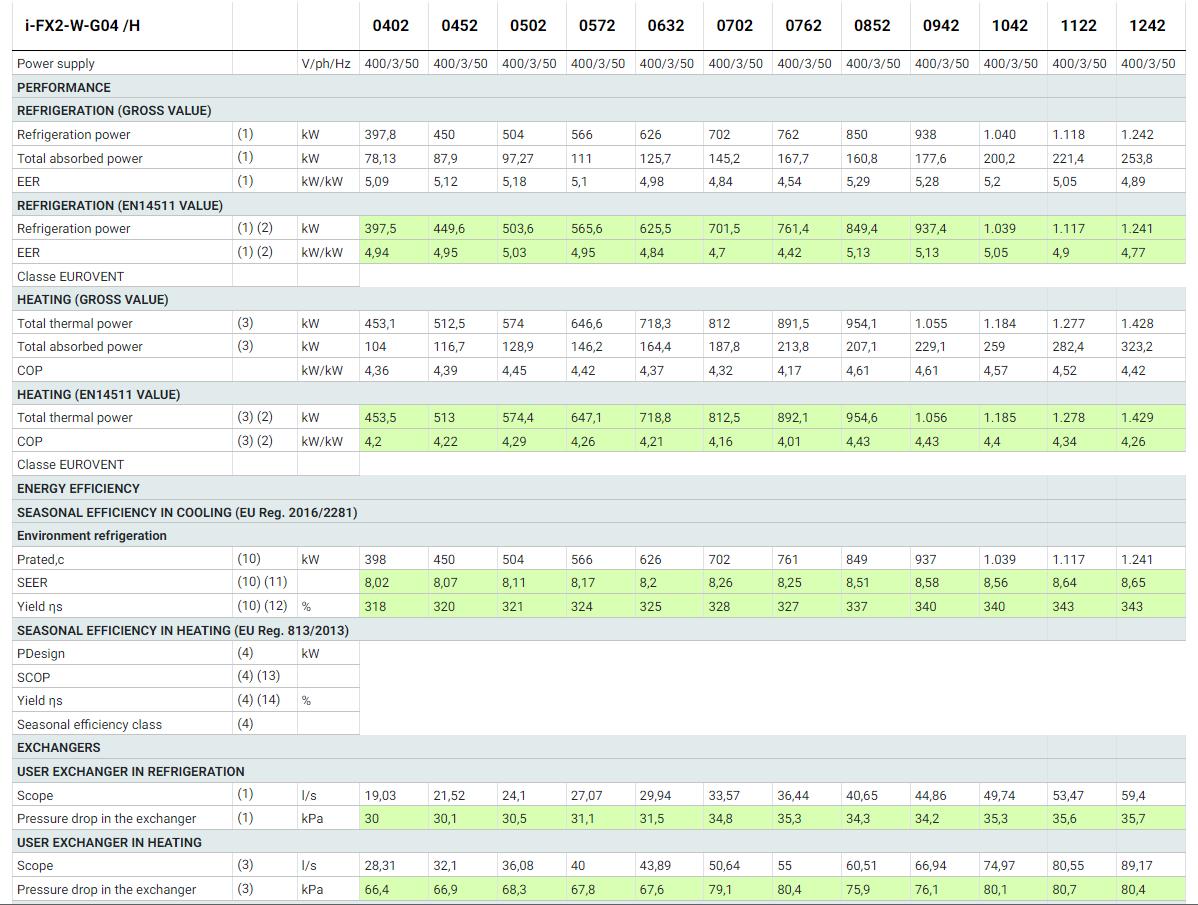
155
Producer
Producer: Climaveneta Model type: WZ-E
” The Air Handling Units of the WZ-E range synthesize in a single project the design experience aimed at satisfying all the needs of the market in the various application sectors. Made to measure and managed as standard industrialized products, they are of very high quality and reliability, guaranteeing absolute safety. The units of the WZ-E series find application both in traditional sectors with installations in hotels, museums, theatres, airports, banks, shops and in specific sectors with installations in the pharmaceutical, food, hospital, electronic, maritime fields and in all those production processes at controlled temperatures and contamination. ”.
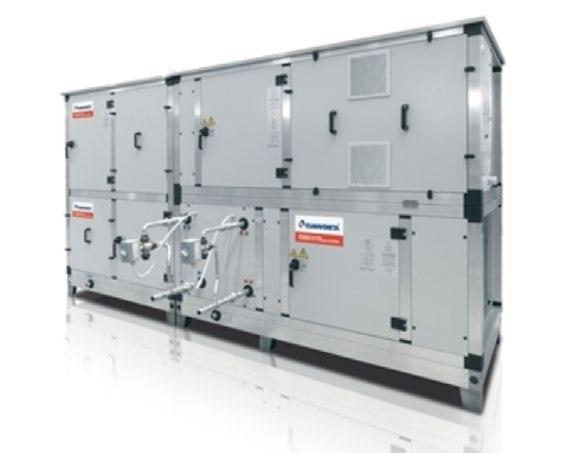
Fig 218: Air handling unit
The air flow that we have calculated for a single floor passing through one of the shafts is approximately 2 m3/s. This has to be multiplied by the number of floors. So, 2 m3/s * 5 floors = 10 m3/s
10 m3/s = 10 * 3600 m3/h = 36,000 m3/h
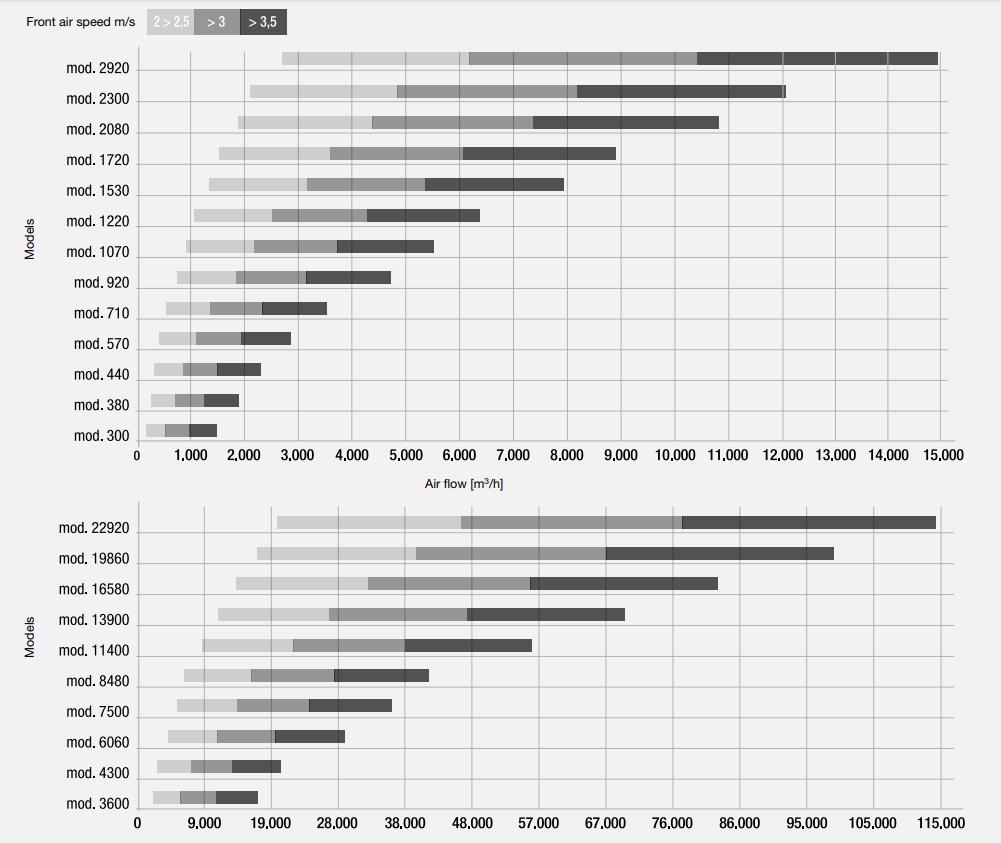
This is the air flow needed for the shaft that goes up to the highest floor.
For this reason we have chosen from the table on the right mod.8480 which has an air flow that goes higher than 38,000 m3/h with a speed above 3.5 m/s.
For the whole building we are going to need a total of 3 AHU. One connected to every shaft.
156 Air
unit
handling
Producer
Fig 219: Axonometry of HVAC, Authors
157 duct design Duct Design
158
Duct Design
Fig 220: Exploded Axonometry of ground floor and first floor, Authors
Dry Room Cooling room Dry Room Cooling room Lab Type
The common ground, as well as the exhibition and cafeteria which occupy the south wing on the first floor, share a similar approach towards the complete exposure of the wooden structure. This design decision was completely linked to the HVAC system, since the use of the surrounding ceiling was required to hide the ducts that would condition the air in the open co-working space or the cafeteria. The planimetry displayed in figure 100, as well as the exploded axonometric view in figure 100 explain the positioning of the grilles and the necessary network of ducts distributed from the 2 separate cores. In addition, they also show the positioning of the false ceilings covering the whole HVAC system.
To estimate the amount and the dimensioning of the ducts required to condition and ventilate the air inside the cafeteria and the exhibition space, we had to refer to the standard air flow per person and air flow per square meter indicated in the ASHRAE book. In addition to this we used a maximum air flow speed of 6 m/s. All the acquired information was combined with the data of our building and later on placed in the table represented below.
The formula to obtain the air flow (Vz) is:
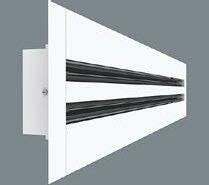
Vz = Rp * P + Ra * A
0.312666667 9 10 11
Lab Type Research Laboratory
Entry Entry Dark room IT Storage
(m3/s) number of rooms Vz * number of rooms V max (m/s) Computer room
of rooms Vz * number of rooms V max (m/s) Ad (Area in m2) secondary Total Ad (Area in m2) primary Duct dimensions 1 0.4525 6 0.075416667 0.075416667 0.16 x 0.50 m 1 0.53 6 0.088333333 0.088333333 0.16 x 0.50 m 1 0.312666667 6 0.052111111 2 0.026 6 0.002166667 1 0.03 6 0.005 0.061444444 0.16 x 0.50 m
First floor plan open space, Authors
0.013 8 2 4 1 5 6 7 3
0.005 0.061444444 Level 1 +5.00
Cooling room Storage Level 1 +5.00 Office Duct Design
x 0.50 m Fig 221: HVAC plan, Authors Fig 222: Grill type Level ±0.00
0.002166667 0.03 8
Once Vz is found we convert it to m3/s by dividing it with 1000. Finally we get the area of duct A= Vz (m3/s) / V (m/s). The largest duct area is 0.08 m2. Thus, to condition the open area of the cafeteria and exhibition it is necessary to use at least 3 ducts for supply and 3 for return of dimension 160 x 500 mm. Functions Rp ( L/s P) sqm/person P (people) Ra (L/s m2) A (m2) Vz (L/s) Vz (m3/s) number of rooms Vz * number of rooms Caffeteria 2.5 3 133 0.3 400 452.5 0.4525 1 0.4525 Exhibition space 3.8 5 100 0.3 500 530 0.53 1 0.53 Conference room 2.5 0.6 117 0.3 70 312.6667 0.312666667 1 0.312666667 Office 2.5 1 0.3 35 13 0.013 2 0.026 Corridor 0.3 100 30 0.03 1 0.03
Type of grill used
0.50 Cafe
0.50 Meeting room Workshop area
0.026 7 9 10 11
0.03 7 Ceiling Void Projection 2nd Floor
159
Exhibition area duct design
Ad (Area in m2) secondary Total Ad (Area in m2) primary Duct dimensions 0.4525 1 0.4525 6 0.075416667 0.075416667 0.16 x
m 0.53 1 0.53 6 0.088333333 0.088333333 0.16 x
m
1 0.312666667 6 0.052111111
2
6
1
6
number of rooms Vz * number of rooms V max (m/s) Ad (Area in m2) secondary Total Ad (Area in m2) primary Duct dimensions 1 0.4525 6 0.075416667 0.075416667 0.16 x 0.50 m 1 0.53 6 0.088333333 0.088333333 0.16 x 0.50 m 1 0.312666667 6 0.052111111 2 0.026 6 0.002166667 1 0.03 6 0.005 0.061444444 0.16 x 0.50 m0.16
Functions Rp ( L/s P) sqm/person P (people) Ra (L/s m2) A (m2) Vz (L/s) Vz (m3/s) number of rooms Vz * number of rooms Caffeteria 2.5 3 133 0.3 400 452.5 0.4525 1 0.4525 Exhibition space 3.8 5 100 0.3 500 530 0.53 1 0.53 Conference room 2.5 0.6 117 0.3 70 312.6667 0.312666667 1 0.312666667 Office 2.5 1 0.3 35 13 0.013 2 0.026 Corridor 0.3 100 30 0.03 1 0.03 70 sqm 70 sqm 70 sqm
160
Duct Design
Fig 223: Exploded axonometry of second floor, Authors
The laboratories occupy the main body of the building. Their interior design follows a completely different concept from the open flexible space we previously saw. The laboratories are characterized by movable partition walls and false ceilings that enclose the space and hide the building structure together with the HVAC system. However, the approach for the calculation of the duct system is the same as the one we previously analyzed.
The necessary data was organized in the tables below regarding each shaft. The air flow was obtained for each of the laboratories. From the regulation we used a maximum air flow speed of 5 m/s for secondary ducts and 6 m/s for the primary. The total amount of area acquired for primary ducts was 0.15 m2. Since there is only 40 cm of space in between the primary beams and the ceiling, we decided to divide into 2 primary ducts that go through the corridor and then they spread through several different laboratories or break rooms. Thus, the final area of a single primary duct is 0.07. Its dimensions are 160 mm x 500 mm. On the other side, the secondary ducts are of dimensions 100 x 400 mm.
Fig 225: Detailed plan of laboratory HVAC, Authors
Level 3 1400
Fig 226: Section of the laboratory
secondary Total Ad (Area in m2) primary Number of Ducts Area of a single primary duct
Functiom Rp ( L/s P) sqm / person P (people) Ra (L/s m2) A (m2) Vz (L/s) Vz (m3/s) number of rooms Vz * number Corridor 0.3 120 36 0.036 1 0.036 Lab 1 5 5 20 0.9 100 190 0.19 1 0.19 Lab 2 5 5 16 0.9 70 143 0.143 5 0.715 Total (primary duct) 0.369 0.941
Type of duct rectangular duct wxh (m) secondary 0.10 x 0.40 secondary 0.10 x 0.40 secondary 0.10 x 0.40 0.156833333 2 0.078416667 primary 0.16 x 0.50
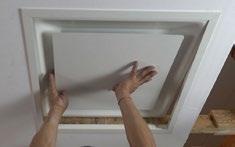
Vz (m3/s) number of rooms
secondary Total Ad (Area in m2) primary Number of Ducts Area of a single primary duct Type of duct rectangular duct wxh (m) secondary 0.10 x 0.40 secondary 0.10 x 0.40 secondary 0.10 x 0.40 0.156833333 2 0.078416667 primary 0.16 x 0.50
Functiom Rp ( L/s P) sqm / person P (people) Ra (L/s m2) A (m2) Vz (L/s) Vz (m3/s) number of rooms Vz * number Corridor 0.3 120 36 0.036 1 0.036 Lab 1 5 5 20 0.9 100 190 0.19 1 0.19 Lab 2 5 5 16 0.9 70 143 0.143 5 0.715
Total (primary duct) 0.369 0.941
Functiom Rp ( L/s P) sqm / person P (people) Ra (L/s m2) A (m2) Vz (L/s) Vz (m3/s) number of rooms Vz * number Corridor 0.3 120 36 0.036 1 0.036 Lab 1 5 5 20 0.9 100 190 0.19 1 0.19 Lab 2 5 5 16 0.9 70 143 0.143 5 0.715 Total (primary duct) 0.369 0.941
* number of rooms V max (m/s) Ad (Area in m2) secondary Total Ad (Area in m2) primary Number of Ducts 0.036 1 0.036 5 0.0072 0.19 1 0.19 5 0.038 0.143 5 0.715 5 0.0286 0.369 0.941 6 0.156833333 2 secondary Total Ad (Area in m2) primary Number of Ducts Area of a single primary duct Type of duct rectangular duct wxh (m) secondary 0.10 x 0.40 secondary 0.10 x 0.40 secondary 0.10 x 0.40 0.156833333 2 0.078416667 primary 0.16 x 0.50
161 Laboratory duct design
Vz
Fig 224: Type of grill used Level 2 950 Duct Design
162
Duct Design
Fig 227: Exploded axonometry of third and fourth floor, Authors
Auditorium duct design
The auditorium stands at the highest point of the building. It is composed of a completely separate structure. In addition to this, the auditorium occupies both floors of the cantilever, thus creating a merged double height and unique space. The structure that holds the seats is made out of steel light construction. This gives the possibility to use the space below the auditorium seats as a technical room where the HVAC ducts can supply the conditioned and ventilated air inside. Considering such a space has a large hosting capacity, it is important to accurately calculate the air flow inside.
The system network consists of 2 components;. The air supply and the air return. The supply is implemented below the auditorium seats. While the return is conducted through the return grilles above the entrance doors.
Below we have represented a table which shows the amount of air flow required to ventilate and condition such a large space with a capacity of approximately 304 people. Just like in the other studies, we have extracted the duct section area necessary for this space.
From the ASHRAE standard we have obtained the Rp as 2.5 L/s P and the Ra as 0.3 L/s m2. At the end we get a rectangular duct with dimensions: 200 x 700 mm.
Fig 228: Plan of the auditorium HVAC, Authors
* number of rooms V max (m/s) Total Ad (Area in m2) Number of Ducts Type of duct rectangular duct wxh (m) 0.88 6 0.146666667 1 primary 0.2x 0.7
Functiom Rp ( L/s P) sqm / person P (people) Ra (L/s m2) A (m2) Vz (L/s) Vz (m3/s) number of rooms Vz * number of rooms V Auditorium 2.5 1.3 304 0.3 400 880 0.88 1 0.88
163
4
3 3 2 5 6
23 22 21 20 19 18 17 14 10 11 12 13 12 28 26 25 24 16 Level 3 /
Dark room Storage Entry Lab Type 1 Foyer Lab Type 2 Single computer lab Single computer lab Storage 5.50PEø1250.5% m> PE ø50 0.5 % PE ø125 0.5 % 6.50 m > PE ø125 0.5 % 5.00 m > %0.5ø125PE m7.00< < PE ø50 0.5 % A B C D E G H J K L 160x500
5 6 7
1 4
+14.00
Duct Design
In this module, the system of the gravity drainage system will be solved with calculations to see the maximum capacity of the building, illustrated with the solution on the layout, and visually modeled on BIM.
The building itself is a Research Center for Natural Sciences. This lets us understand that it will contain special parts, equipment, and appliances inside the laboratories.
In order to manage the capacity, and the layout of the gravity drainage system, the arrangement will be divided into 3 parts to be collected into 3 cores that the building possesses.
The technical solution and technical standard to resolve the sewage system is:
EN - 12056-2
This standard is applied for the disposal of waste water through sewage systems that are operated by gravity as mentioned above.
Throughout this module, primarily the entire calculation of the building that is made will be shown and secondarily a certain methodology of 7 steps will be followed in order to adapt the capacity. Meaning the system, ventilation, piping size, drain, and type will be defined.
The technical solution and technical standard to resolve the water supply system is:
UNI 9182, UNI EN 806-part1/5, BS 8558:2015
Fig 229: Axonometry of toilet, Authors
164 introduction
Introduction
gravity drainage system
Followed methodology:
1. Choose among the four type of ventilation systems proposed;
2. Define if there is a secondary ventilation and branches discharge
3. For each branche discharge calculate the DU and the frequency factor, k 4. Define the mass flow of waste water per each branch 5. Define the DN of the pipe and check the application limits 6. Determine the stack discharge dimension and eventually the size of the secondary ventilating stack
7. Determine the dimension of the drain
1. Choosing among the four type of ventilation proposed
System I
Single discharge stack system with partly filled branch discharge pipes Sanitary appliances are connected to partly filled branch discharge pipes. The partly filled branch discharge pipes are designed with a filling degree of 0.5 (50%) and are connected to a single discharge stack.
System II
Single discharge stack system with small bore discharge branch pipes Sanitary appliances are connected to small bore branch discharge pipes. The small-bore branch discharge pipes are designed with a filling degree of 0.7 (70%) and are connected to a single discharge stack.
System III
Single discharge stack system with full bore branch discharge pipes Sanitary appliances are connected to full bore branch discharge pipes. The full-bore branch discharge pipes are designed with a filling degree of 1.0 (100%) and each branch discharge pipe is separately connected to a single discharge stack.
System IV
Separate discharge stack system Drainage systems type I. II and III may also be divided into a black water stack serving WCs and urinals and a grey water stack serving all other appliances.
2. Defining if there is a secondary ventilation and branches discharge
Secondary ventilated system configurations. Control of pressure in the discharge stack is achieved using separate ventilating stacks and/or secondary branch ventilating pipes in connection with stack vents. Alternatively, air admittance valves may be used.
Branch Discharge Pipe
Wash Basin
Fig 230: Vertical piping diagram Fig 231: HVAC section, Authors
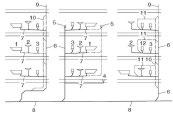
165
2.
3.
4.
5.
6.
7.
8.
9.
10.
11.
12.
PE ø225 0.5 % < 9.00 m Drain PE ø125 < 13.50 m Discharge Stack PE ø70 17.00 m > Ventilation Stack 1
Level 0 ±0.00 Level 4 / +18.50 Laboratories Laboratories Laboratories Level 5 / +23.00 Auditorium Level 1 +5.00 Level 2 +9.50 Level 3 +14.00 Cultural/Public Level -1 / -3.24 Gravity
Legend: 1. Bath
WC
Floor Gully
Air Admittance Valve
Stack
Drain
Stack
Ventilating Stack
Branch Ventilating Pipe
Urinal
2 3
Drainage System
3. For each branch discharge, calculating the DU and the frequency factor (K)
The waste water flowrate (QWW) is the expected flowrate of waste water in a part or in the whole drainage system where only domestic sanitary appliances are connected to the system.
QWW = K√∑DU
QWW = Waste water flowrate (l/s)
K = Frequency factor
∑DU = Sum of Discharge Units
Typica Frequency factors associated with different usage of applicances:
Usage of appliances K
Intermittent use e.g. in Dwelling, Guesthouse, Office 0,5 Frequent use e.g. in Hospital, School, Restaurant, Hotel 0,7 Congested use e.g. in Toilets and/or Showers open to public 1,0 Special use e.g in Laboratory 1,2
The Research Center for Natural Sciences Building has in total 3 Cores, with emergency stairs, elevators, shafts, and toilets. There are in total 6 branches that are used and they are divided into 2 branches per core.
Each core contains WCs of 7.5 liters cistern and Wash Basins. The discharge unit (DU) for the WC is 2.0 l/s and for the Wash Basin 0.3 l/s
As seen from table/figure 100, even if the building contains offices, restaurants, and so on, the building needs to use the frequency factor of K = 1.2 because it contains Laboratories.
From the formula, to find the wastewater flow rate, the total amount (sum) of the discharge unit for each appliance has to be calculated and added together.
The frequency factor is multiplied by the square root of the sum of the discharge unit that will result in the waste water flow rate.
Next, after finding the total amount of the QWW, the Nominal Diameter (DN) of the stack, vent and the drain will be found .
166
Core 1 Branch 1 Appliances System 1 Quantity Total l/s Total l/s Appliances Stories DN
DN
125 WC 7,5 Cistern DU l/s 5
50 Wash Basin WC 7,5 l Cistern 2 5 10 K=1,2 Waste water flowrate DN 125/70 D.Stack/Vent Wash Basin 0,3 2 0,6 ∑DU K (Frequency factor) Qww = K√∑DU DN 200 Drain D.Stack/Vent 10,6 53 1,2 8,74 Qmax = 17,4 Drain V = 1,3 m/s Branch 2 Appliances System 1 Quantity Total l/s Total l/s Appliances Stories Slop e= 1,5 cm/m DU l/s 4 WC 7,5 l Cistern 2 5 10 K=1,2 Waste water flowrate Wash Basin 0,3 2 0,6 Total l/s with stories K (Frequency factor) Qww = K√∑DU Qwwc=Qww1+Qww2 10,6 42,4 1,2 7,81 16,55
DN 125/70 D.Stack/Vent Wash Basin 0,3 2 0,6 Total l/s with stories K (Frequency factor) Qww = K√∑DU DN 200 Drain 8,6
4 Appliances System 1 Quantity Total l/s Total l/s Appliances Stories Slop
DU l/s 5 WC 7,5 l Cistern 2 5 10 K=1,2 Waste water flowrate Wash Basin 0,3 2 0,6 Total l/s with stories K (Frequency factor) Qww = K√∑DU Qwwc=Qww3+Qww4 10,6 53 1,2 8,74 14,83 Core 3 Branch 5 Appliances System 1 Quantity Total l/s Total l/s Appliances Stories DN 125 WC 7,5 Cistern DU l/s 4 DN 50 Wash Basin WC 7,5 l Cistern 2 5 10 K=1,2 Waste water flowrate DN 125/70 D.Stack/Vent Wash Basin 0,3 2 0,6 Total l/s with stories K (Frequency factor) Qww = K√∑DU DN 200 Drain 10,6 42,4 1,2 7,81 Qmax = 17,4 V = 1,3 m/s Branch 6 Appliances System 1 Quantity Total l/s Total l/s Appliances Stories Slop e= 1,5 cm/m DU l/s 3 WC 7,5 l Cistern 2 3 6 K=1,2 Waste water flowrate Wash Basin 0,3 2 0,6 Total l/s with stories K (Frequency factor) Qww = K√∑DU Qwwc=Qww5+Qww6 6,6 19,8 1,2 5,34 13,15 ∑Qww 44,53 Gravity Drainage System
Core 2 Branch 3 Appliances System 1 Quantity Total l/s Total l/s Appliances Stories DN 125 WC 7,5 Cistern DU l/s 3 DN 50 Wash Basin WC 7,5 l Cistern 2 4 8 K=1,2 Waste water flowrate
25,8 1,2 6,10 Qmax = 17,4 V = 1,3 m/s Branch
e= 1,5 cm/m
7. Determine the dimension of the drain
Slope DN 100 DN 125 DN 150 DN 200 DN 225 DN 250 DN 300 i Qmax v Qmax v Qmax v Qmax v Qmax v Qmax v Qmax v cm/m l/s m/s l/s m/s l/s m/s l/s m/s l/s m/s l/s m/s l/s m/s
0,5 1,8 0,5 2,8 0,5 5,4 0,6 10,0 0,8 15,9 0,8 18,9 0,9 34,1 1,0 1,0 2,5 0,7 4,1 0,8 7,7 0,9 14,2 1,1 22,5 1,2 26,9 1,2 48,3 1,4 1,5 3,1 0,8 5,0 1,0 9,4 1,1 17,4 1,3 27,6 1,5 32,9 1,5 59,2 1,8 2,0 3,5 1,0 5,7 1,1 10,9 1,3 20,1 1,5 31,9 1,7 38,1 1,8 68,4 2,0
2,5 4,0 1,1 6,4 1,2 12,2 1,5 22,5 1,7 35,7 1,9 42,6 2,0 76,6 2,3
3,0 4,4 1,2 7,1 1,4 13,3 1,6 24,7 1,9 38,2 2,1 46,7 2,2 83,9 2,5
3,5 4,7 1,3 7,6 1,5 14,4 1,7 26,6 2,0 42,3 2,2 50,4 2,3 90,7 2,7 4,0 5,0 1,4 8,2 1,6 15,4 1,8 28,5 2,1 45,2 2,4 53,9 2,5 96,9 2,9
4,5 5,3 1,5 8,7 1,7 16,3 2,0 30,2 2,3 48,0 2,5 57,2 2,7 102,8 3,1 5,0 5,6 1,6 9,1 1,8 17,2 2,1 31,9 2,4 50,6 2,7 60,3 2,8 108,4 3,2
4. Define the mass flow of waste water per each branch (Note: Will be seen further in the calculations)
5. Define the Nominal Diameter (DN) of the pipe and check the application limits.
6. Determine the stack discharge dimension and eventually the size of the secondary ventilating stack
List of Appliances used: Stack and stack vent Secondary vent System I, II, III, IV Qmax (l/s) DN DN Square entries Swept entries 60 50 0,7 0,9 70 50 2,0 2,6 80* 50 2,6 3,4 90 50 3,5 4,6 100** 50 5,6 7,3 125 70 7,6 10,0 150 80 12,4 18,3 200 100 21,0 27,3 * Minimum size where WC’s are connected in system II ** Minimum size where WC’s are connected in system I, III, IV
DU l/s DU l/s DU l/s DU l/s
Wash Basin, Bidet 0,5 0,3 0,3 0,3 Shower without Plug 0,6 0,4 0,4 0,4 Shower with Plug 0,8 0,5 1,3 0,5
Single Urinal with Cistern 0,8 0,5 0,4 0,5 Urinal with Flushing Valve 0,5 0,3 - 0,3 Slab Urinal 0,2* 0,2* 0,2* 0,2* Bath 0,8 0,6 1,3 0,5
Kitchen Sink 0,8 0,6 1,3 0,5 Dishwasher (Household) 0,8 0,6 0,2 0,5
Washing Machine up to 6 kg 0,8 0,6 0,6 0,5 Washing Machine up to 12 kg 1,5 1,2 1,2 1,0
WC with Cistern 4,0 l Cister ** 1,8 ** **
WC with Cistern 6,0 l Cister 2,0 1,8 1,2 to 1,7*** 2,0
WC with Cistern 7,5 l Cister 2,0 1,8 1,4 to 1,8*** 2,0
WC with Cistern 9,0 l Cister 2,5 2,0 1,6 to 2,0*** 2,5
Floor Gully DN 50 0,8 0,9 - 0,6
Floor Gully DN 70 1,5 0,9 - 1,0
Floor Gully DN 100 2,0 1,2 - 1,3
* Per person ** Not Permitted *** Depending upon type (valid for WCs with siphon flush cistern only) - Not used or no data
167
Gravity Drainage System
168 water supply system Entry - Lobby 3 2 4 23 22 21 20 19 18 17 15 14 5 6 7 8 9 10 11 12 13 13 x 17.30 12 x 28 13 x 17.30 12 x 28 0 1 2 3 4 26 25 24 16 Level 1 / +5.00 Dry room PEø1250.5% 5.50m> PE ø50 0.5 % > PE ø125 0.5 % 6.50 m > PE ø125 0.5 % 5.00 m > <PEø1250.5% 7.00m < PE ø50 0.5 % A B C D E F G H I J K L A B C D Cold water calculation for Core 1 Coldwater Core 1 Core 2 Sink 0,1 l/s Sink WC 0,1 l/s WC Segments LU tot LU max DS mm Segments A 1
B
AB
C
ABC
D
ABCD
E
K
ABCDEFGHIJK 10
L
ABCDEFGHIJKL 11
M
ABCDEFGHIJKLM 12
ABCDEFGHIJKLM N 1
ABCDEFGHIJKLMN 13
ABCDEFGHIJKLMN O 1
ABCDEFGHIJKLMNO 14 1
ABCDEFGHIJKLMNO LU tot DS 14 26 Stories Vertical DS mm (max) Stories 5 70 40 Water Supply Fig 232: Toilet plumbing scheme, Authors
1 26 A
1 1 26 B
2 1 26 AB
1 1 26 C
2 1 26 ABC
1 1 26 D
3 1 26 ABCD
1 1 26 E ABCDE 4 1 26 ABCDE F 1 1 26 F ABCDEF 5 1 26 ABCDEF G 1 1 26 G ABCDEFG 6 1 26 ABCDEFG H 1 1 26 H ABCDEFGH 7 1 26 ABCDEFGH I 1 1 26 I ABCDEFGHI 8 1 26 ABCDEFGHI J 1 1 26 J ABCDEFGHIJ 9 1 26 ABCDEFGHIJ
1 1 26 K
1 26 ABCDEFGHIJK
1 1 26 L
1 26 ABCDEFGHIJKL
1 1 26 M
1 26
1 26 N
1 26
1 26 O
26
169 0.16m3/s 70 sqm Workshop area 9 10 Cooling room Lab Type 1 Entry Corridor 23 22 21 20 19 18 17 15 14 5 6 7 8 9 10 11 12 13 13 x 17.30 12 x 28 13 x 17.30 12 x 28 0 1 2 3 4 26 25 24 16 Level 1 / +5.00 A B C D E F G H I J K L M O A B C D Cold water calculation for Core 2 Coldwater Core 1 Core 2 Core 3 Sink 0,1 l/s Sink 0,1 l/s Sink WC 0,1 l/s WC 0,1 l/s WC Segments LU tot LU max DS mm Segments LU tot LU max DS mm Segments A 1 1 26 A 1 1 26 A B 1 1 26 B 1 1 26 B AB 2 1 26 AB 2 1 26 AB C 1 1 26 C 1 1 26 C ABC 2 1 26 ABC 2 1 26 ABC D 1 1 26 D 1 1 26 D ABCD 3 1 26 ABCD 3 1 26 ABCD E 1 1 26 E 1 1 26 E ABCDE 4 1 26 ABCDE 4 1 26 ABCDE F 1 1 26 F 1 1 26 F ABCDEF 5 1 26 ABCDEF 5 1 26 ABCDEF G 1 1 26 G 1 1 26 G ABCDEFG 6 1 26 ABCDEFG 6 1 26 ABCDEFG H 1 1 26 H 1 1 26 H ABCDEFGH 7 1 26 ABCDEFGH 7 1 26 ABCDEFGH I 1 1 26 I 1 1 26 I ABCDEFGHI 8 1 26 ABCDEFGHI 8 1 26 ABCDEFGHI J 1 1 26 J 1 1 26 J ABCDEFGHIJ 9 1 26 ABCDEFGHIJ 9 1 26 ABCDEFGHIJ K 1 1 26 K 1 1 26 K ABCDEFGHIJK 10 1 26 ABCDEFGHIJK 10 1 26 ABCDEFGHIJK L 1 1 26 L 1 1 26 l ABCDEFGHIJKL 11 1 26 ABCDEFGHIJKL 11 1 26 ABCDEFGHIJKL M 1 1 26 M 1 1 26 ABCDEFGHIJKLM 12 1 26 ABCDEFGHIJKLM 12 1 26 N 1 1 26 N 1 1 26 ABCDEFGHIJKLMN 13 1 26 ABCDEFGHIJKLMN 13 1 26 O 1 1 26 O 1 1 26 ABCDEFGHIJKLMNO 14 1 26 ABCDEFGHIJKLMNO 14 1 26 LU tot DS LU tot DS 14 26 14 26 Stories Vertical DS mm (max) Stories Vertical DS mm (max) Stories 5 70 40 4 56 32 Water Supply Fig 233: Toilet plumbing scheme, Authors
1 26 G 1 1 26 G 1 1 26
1 26 ABCDEFG 6 1 26 ABCDEFG 6 1 26
170
23 22 21 20 19 18 17 15 14 5 6 7 8 9 10 11 12 13 13 x 17.30 12 x 28 13 x 17.30 12 x 28 0 1 2 3 4 26 25 24 16 Ceiling Void Projection 2nd Floor Level
A B C D E F G H I J K L A B C D Cold water calculation for Core 3
Sink 0,1 l/s
WC
DS mm Segments LU tot LU max DS mm Segments LU tot LU max DS mm
Cafe
1 / +5.00
Core 2 Core 3
Sink 0,1 l/s
0,1 l/s WC 0,1 l/s
1 26 A 1 1 26 A 1 1 26 1 26 B 1 1 26 B 1 1 26 1 26 AB 2 1 26 AB 2 1 26 1 26 C 1 1 26 C 1 1 26 1 26 ABC 2 1 26 ABC 2 1 26 1 26 D 1 1 26 D 1 1 26 1 26 ABCD 3 1 26 ABCD 3 1 26 1 26 E 1 1 26 E 1 1 26 1 26 ABCDE 4 1 26 ABCDE 4 1 26 1 26 F 1 1 26 F 1 1 26 1 26 ABCDEF 5 1 26 ABCDEF 5 1 26
10
11
1
1
1
ABCDEFGHIJKLM 12 1
1
1
1
ABCDEFGHIJKLMN 13 1
1
1
1
ABCDEFGHIJKLMNO 14 1
LU tot DS LU tot DS 26 14 26
(max) Stories Vertical DS mm (max) Stories Vertical DS mm (max) 40 4 56 32 3 33 32 Water Supply Fig 234: Toilet plumbing scheme, Authors
1 26 H 1 1 26 H 1 1 26 1 26 ABCDEFGH 7 1 26 ABCDEFGH 7 1 26 1 26 I 1 1 26 I 1 1 26 1 26 ABCDEFGHI 8 1 26 ABCDEFGHI 8 1 26 1 26 J 1 1 26 J 1 1 26 1 26 ABCDEFGHIJ 9 1 26 ABCDEFGHIJ 9 1 26 1 26 K 1 1 26 K 1 1 26 1 26 ABCDEFGHIJK
1 26 ABCDEFGHIJK 10 1 26 1 26 L 1 1 26 l 1 1 26 1 26 ABCDEFGHIJKL
1 26 ABCDEFGHIJKL 11 1 26
26 M
1 26
26
26
26 N
1 26
26
26
26 O
1 26
26
26
11 20
Core 1 Core 2 Core 3 Sink 0,1 l/s Sink 0,1 l/s Sink 0,1 l/s WC 0,1 l/s WC 0,1 l/s WC 0,1 l/s Segments
Legend:
Legend:
Legend:
Legend:
Polyethylene (PE)
Drainage pipe with: ø125 WC
Polyethylene (PE) Drainage pipe with: ø125 WC
Polyethylene (PE) Drainage pipe with: ø125 WC
Polyethylene (PE) Drainage pipe with: ø125 WC
ø225 Main Drain Pipe
ø225 Main Drain Pipe
ø225 Main Drain Pipe
Polyethylene (PE) Drainage pipe with: ø125 WC
ø225 Main Drain Pipe
Polyethylene (PE) Drainage pipe with: ø50 Sink
ø225 Main Drain Pipe
Polyethylene (PE) Drainage pipe with: ø50 Sink
Polyethylene (PE) Drainage pipe with: ø50 Sink
Polyethylene (PE) Drainage pipe with: ø50 Sink
Polyethylene (PE) Drainage pipe with: ø50 Sink
Polyethylene (PE) Cold Water Supply: ø26
Polyethylene (PE) Cold Water Supply: ø26
ø40 Vertical (max)
Polyethylene (PE) Cold Water Supply: ø26
Polyethylene (PE) Cold Water Supply: ø26
ø40 Vertical (max)
ø40 Vertical (max)
Polyethylene (PE) Cold Water Supply: ø26
Polyethylene (PE) Hot Water Supply: ø15
ø40 Vertical (max)
Polyethylene (PE) Hot Water Supply: ø15
ø26 Vertical (max)
ø40 Vertical (max)
Polyethylene (PE) Hot Water Supply: ø15
Polyethylene (PE) Hot Water Supply: ø15
Fig 235: Plumbing legend, Authors
ø26 Vertical (max)
ø26 Vertical (max)
ø26 Vertical (max) Water Supply
Polyethylene (PE) Hot Water Supply: ø15
ø26 Vertical (max)
171
Hot water calculation for every core (1,2 and 3)
LU
Segments LU tot LU
Segments LU
LU
1
1
1
1
1 1
2 1
2 1
1
1
1 1
1
2 1
2 1
2 1 D 1 1
1 1 D 1 1 ABCD 3 1
3 1
3 1 LU tot DS LU tot DS LU tot DS 3 16 3 16 3 16 Stories Vertical DS mm (max) Stories Vertical DS mm (max) Stories Vertical DS mm (max) 5 15 26 4 12 26 3 9 20
tot LU max
max
tot
max A 1
A 1
A 1
B 1
B
B 1 1 AB
AB
AB 2
C 1
C
C 1
ABC
ABC
ABC
D
ABCD
ABCD
Legend:
172 HVAC and plumbing drawings received Lockers Kitchen Storage Fridge Freezer Ventilated dry store Storage Beverage room Co working Co working Library Corridor Restaurant Filtering Zone Storage Private dining area Private dining area Private dining area 3 2 9 10 11 2 4 1 5 6 8 1 5 6 7 3 4 2 4 1 5 6 7 3 7 3 2 9 10 11 5 6 8 1 4 7 Ceiling Void Projection 1st Floor Level ±0.00 Level 0 ±0.00 Level 0 ±0.00 PEø1250.5% 5.50 PE ø125 0.5 PEø1250.5 7.00m 160x500 160x500 160x500 160x500 160x500 160x500 Fig 236: Services ceiling
HVAC and Plumbing Drawings
plan ground floor, Authors
173 0.16m3/s 70 sqm 0.16m3/s 0.16m3/s Entry Lobby Computer room Meeting room Workshop area 3 2 9 10 11 2 4 1 5 6 8 1 5 6 7 3 4 2 4 1 5 6 7 3 7 3 2 9 10 11 5 6 8 1 4 7 Cantilever Projection Cantilever Projection Ceiling Void Projection 2nd Floor Ceiling Void Projection 2nd Floor Level 1 +5.00 Level +5.00 Level ±0.00 Level 0 ±0.00 Level +5.00 Cooling room Dry room Cooling room Dry Room Dry Room Cooling room Dry Room Cooling room Research Laboratory Individual working space Lab Type Lab Type Lab Type Lab Type Lab Type Research Laboratory Entry Entry Entry Entry Corridor Dark room Storage Cooling room Storage Research Laboratory Individual working space Storage Level 1 +5.00 Office Office PEø1250.5% 5.50 PEø1250.5% 7.00 160x500 160x500 160x500 Fig 237: Services ceiling plan first floor, Authors HVAC and Plumbing Drawings
174 Workshop Office Office Co working Open offices Workshop 3 2 9 10 11 2 4 1 5 6 8 1 5 6 7 3 4 2 4 1 5 6 7 3 7 3 2 9 10 11 5 6 8 1 4 7 Cantilever Projection Cantilever Projection Ceiling Void Projection 3rd Floor Level +5.00 Level ±0.00 Level 2 +9.50 Level 2 +9.50 Level 1 +5.00 Storage Lab Type Dry room Cooling room Entry Lab Type Entry Lab Type Dry room Cooling room Lab Type Entry Entry Lab Type Cooling room Dry room Entry Lab Type Lab Type Lab Type Break Space Storage Single computer lab Single computer lab Single computer lab Storage Level +9.50 PEø1250.5% 5.50 PEø1250.5% 7.00 160x500 160x500 160x500 Fig 238:
HVAC and Plumbing Drawings
Services ceiling plan second floor, Authors
Fig 239: Cross services section, Authors
Fig 240: Longitudinal services section, Authors
175
Level 0 ±0.00 Level 1 +5.00 Level 2 +9.50 Level 3 +14.00 Level 4 / +18.50 Laboratories Laboratories Laboratories Cultural/Public Level 5 / +23.00 Level -1 -3.24 1 2 3 4 5 6 7 8 9 10 11 Level 0 ±0.00 Level 4 +18.50 Laboratories Laboratories Laboratories Level 5 +23.00 Auditorium Level 1 +5.00 Level 2 +9.50 Level 3 +14.00 Cultural/Public Level -1 -3.24 PE ø225 0.5 % < 9.00 m Drain PE ø125 < 13.50 m Discharge Stack PE ø70 17.00 m > Ventilation Stack 1 2 3 Level 0 ±0.00 Level 4 / +18.50 Laboratories Laboratories Laboratories Level 5 / +23.00 Auditorium Level 1 +5.00 Level 2 +9.50 Level 3 +14.00 Cultural/Public Level -1 / -3.24 HVAC and Plumbing Drawings
176 Office Office 3 2 9 10 11 2 4 1 5 6 8 1 5 6 7 3 4 2 4 1 5 6 7 3 7 3 2 9 10 11 5 6 8 1 4 7 Level 3 +14.00 Level 3 +14.00 Level +14.00 Level 2 +9.50 Level 2 +9.50 Level +14.00 Storage Entry Storage Dark room Entry Lab Type Entry Dark room Foyer Lab Type Lab Type Single computer lab Storage Single computer lab Level 3 +14.00 PEø1250.5% 5.50 7.00ø1250.5% 160x500 160x500
HVAC and Plumbing Drawings
Fig 241: Services ceiling plan third floor, Authors
177 Entry Entry Storage Technical space Technical space Foyer Conference Hall 3 2 9 10 11 2 4 1 5 6 8 1 5 6 7 3 4 2 4 1 5 6 7 3 7 3 2 9 10 11 5 6 8 1 4 7 Level 3 +14.00 Level +14.00 Level +14.00 Level +18.50 Level +14.00 Level +18.50 Level 4 +18.50 Level +18.50 Foyer 160x500 160x500
HVAC and Plumbing Drawings
Fig 242: Services ceiling plan fourth floor, Authors
178
sustainable design
6
“


Bearable, Viable, Equitable”
One of the most common definition comes from the UN World Commission on Environment and Development: “sustainable development is development that meets the needs of the present without compromising the ability of future generations to meet their own needs.” [World Commission on Environment and Development (WCED). Our common future. Oxford: Oxford University Press, 1987 p. 43.
Three Pillars of Sustainability :
Environmental Sustainability :

Ecological integrity is maintained, all of earth’s environmental systems are kept in balance while natural resources within them are consumed by humans at a rate where they are able to replenish themselves.
Economic Sustainability :
Human communities across the globe are able to maintain their independence and have access to the resources that they require, financial and other, to meet their needs.
Environmental friendly innovative technologies such as using energy-efficient materials, reducing carbon footprint, and generating power; are today`s essential topics. Also, the project site MIND Milano Innovation District is based on sustainable principles; it integrates nature and functions.

With its green roof and x-lam structure system, Research Lab for Natural Sciences considered sustainable principles in all the design phases. The project was conceptualized by incorporating the various parameters for energy savings and modeled in the Autodesk Revit Insight and Solar Analysis software.
Social Sustainability:

Universal human rights and basic necessities are attainable by all people, who have access to enough resources in order to keep their families and communities healthy and secure. Healthy communities have just leaders who ensure personal, labour and cultural rights are respected and all people are protected from discrimination.
Life Cycle Assestment:

LCA addresses the environmental aspects and potential environmental impacts(e.g.use, of resources and the environmental consequences of releases) throughout a product’s life cycle from raw material acquisition through production, use, end-of-life treatment, recycling, and final disposal.


180
environment economy equity sustainability use end of life product manufacturing material processing resources distribution
sustainability Sustainability
Fig 243: Sustainability Loop , Authors Fig 244: LCA Loop , Authors
climate analysis
Climate has an undeniable impact on building design. Understanding the climate qualifications of the site is essential during the design phases of the project. Research Lab for Natural Center is located in Milan, Italy. The city is located in north-western Italy, the plain closed on three sides, with the Alps to the north and west and the Apennines to the south. It features a mid-latitude, four-season humid subtropical climate (Cfa), according to the Köppen climate classification. The climate of the Milan is continental, with damp, chilly winters and hot, humid summers. Snow falls between December and February, and springtime is generally rainy.
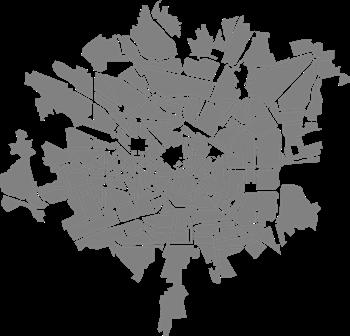
Climate consultant is a graphic-based software that allows for analyzing the local climate. It uses annual 8760-hour EPW format climate data made available at no cost by the US Department of Energy (DOE) for thousands of weather stations worldwide.1 In our project we used IWEC Data as a data source and location based on 45.62 North and 8.73 East and time zone from Greenwich 1. In accordance with these informations, the chart shows the average monthly data for climate. ( Figure 246)
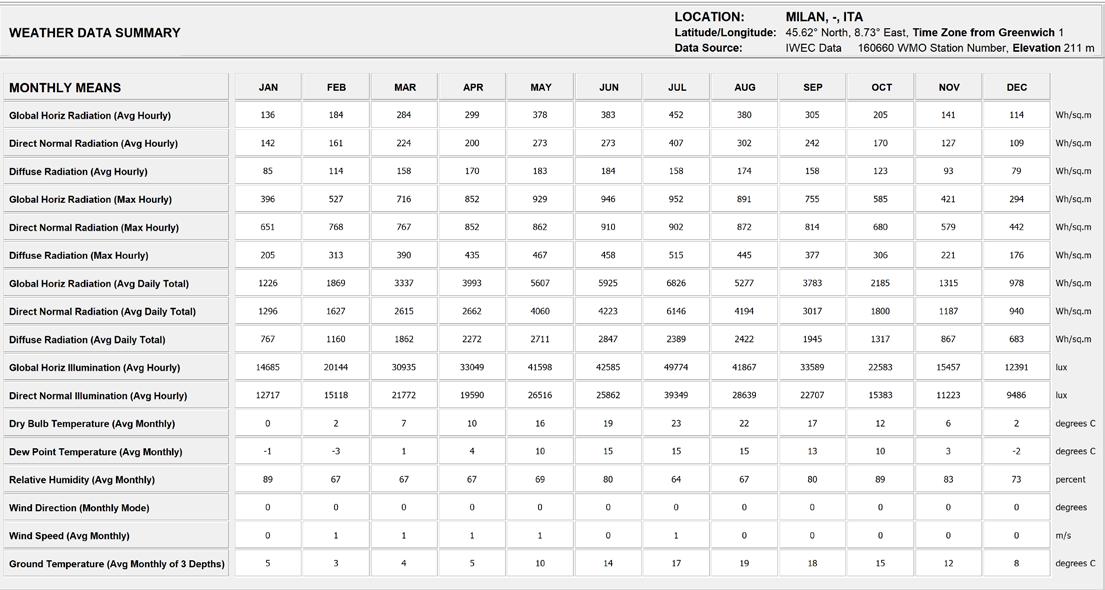
181
Fig 246: Weather Data Summary, Climate Consultant, Authors
Fig 245: Map of Milan, Authors
Climate Analysis
Fig 247: Mounthly Diurnal Averages, Climate Consultant, Authors
Fig 248: Sun shading chart, Climate Consultant, Authors
182
Climate Analysis
HOURLYAVERAGES
183
JanFebMarAprMayJunJulAugSepOctNovDecAnnual 1600 1500 1400 1300 1200 1100 1000 900 800 700 600 500 400 300 200 100 0
HitENTERtoreplotifyouchangeTiltedSurfaceRadiationparameters. Next Back
LEGEND
Daily Total Hourly Avg PLOT: (20% = grass) % Ground Reflectance (South = 0°,West = +.. Bearing degrees from .. (Vertical = 90°) Tilt degrees from Horiz.. 20.0 0.0 0.0 TiltedSurfaceRadiationInput: IWEC Data 160660 WMO Station Number, Elevation 211 m DataSource: 45.62° North, 8.73° East, TimeZonefromGreenwich 1 Latitude/Longitude:
LOCATION:A RADIATIONRANGE Fig 249: Radiation Range, Climate Consultant, Authors Fig 250: Radiation Range, Climate Consultant, Authors Next Back 04812162024 100 80 60 40 20 0 JAN 04812162024 100 80 60 40 20 0 FEB 04812162024 100 80 60 40 20 0 MAR 04812162024 100 80 60 40 20 0 APR 04812162024 100 80 60 40 20 0 MAY 04812162024 100 80 60 40 20 0 JUN 04812162024 100 80 60 40 20 0 JUL 04812162024 100 80 60 40 20 0 AUG 04812162024 100 80 60 40 20 0 SEP 04812162024 100 80 60 40 20 0 OCT 04812162024 100 80 60 40 20 0 NOV 04812162024 100 80 60 40 20 0 DEC LEGEND DryBulb Humidity ComfortZone AcceptabilityLimits 90% IWEC Data 160660 WMO Station Number, Elevation 211 m DataSource: 45.62° North, 8.73° East, TimeZonefromGreenwich 1 Latitude/Longitude:
AdaptiveComfort DRYBULBXRELATIVEHUMIDITY Climate Analysis
DAYLITHOURSONLY RECORDEDHIGHAVERAGEHIGHMEANAVERAGELOWRECORDEDLOWRECORDED: DIRECTNORMAL GLOBALHORIZONTAL TOTALSURFACE (Wh/sq.mperhour) THEORETICAL:
MILAN,-,IT
MILAN,-,IT LOCATION:A
The climate analysis has been done considering ` Adaptive Comfort` and data source EPW data
Monthly diurnal averages ( Figure 247) demonstrate the temperature and radiation. It is seen that from May to August, the dry temperature is higher than the comfort zone in Milan. The global horizontal radiation, direct normal radiation, and diffuse radiation peak in July.
Global horizontal radiation: refers to the total irradiance (often referred to as the global horizontal irradiance) is the summary of the direct radiation and diffuse components.1
Direct normal radiation:is the amount of solar radiation received per unit area by a surface that is always held perpendicular (or normal) to the rays that come in a straight line from the direction of the sun at its current position in the sky.2
The Sun shading chart ( Figure 248) shows the sun shading summer fall, which means June 21 to December 21. As we approach June, we see that the temperature is increasing, and we are gradually out of our comfort zone.
The following chart is analyzed for the daily variation in radiation as in Figure 249. This depicts high radiations during May, June, and July.
According to figure 250, 12 charts are the average for each hour of each month of the Dry Bulb Temperature (yellow dot) and humidity ( green dot). Correspondingly, the grey lines show the comfort zone seen on the graphs between April and October, and dry bulb temperature is almost the inverse of relative humidity.
A psychrometric chart is one of the most developed analyses of climate consultants. Each dot on the graph represents the temperature and humidity of each 8760 hours per year. It shows the dry bulb temperature across the bottom and the moisture content of the air up the side. The vertical scale shows the humidity ratio (or grams of water per kilogram of dry air).
In summary, understanding the local climate is essential to build energy-efficient projects, and it allows for deciding the most suitable location, designing facades and shading systems, and urban design.
184
Fig 251: Physhrometric Chart, Climate Consultant, Authors
Climate Analysis
N
N
Solar radiation, often called the solar resource or just sunlight, is a general term for the electromagnetic radiation emitted by the sun.1Determining how the built environment is altered by the physiognomy of the constructions and how the design should be amended to get a better climatic performance has been one of the critical goals of environmental sciences applied to architecture. How can the architectural design be optimized to achieve a suitable distribution of the natural energy ?
N
N
Fig 252: 3D Solar Axonometry, Authors Fig 254: 3D Solar Axonometry


December / Winter Fig 253: 3D Solar Axonometry, Authors


Solar Analysis
4:00 PM 8:10 PM W 21 June / Summer 21
10:00 AM W
E
Figure 254 shows the seasonal configuration of the sun and the Earth. The June solstice is the longest day of the year in the northern hemisphere and December solstice is the shortest. Solar analysis are done for 21 June and 21 December.
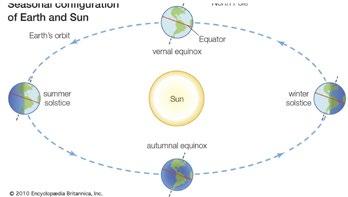
4:00 PM 8:10 PM
June 21 4:40 AM W


The workflow steps was, 1-Set the project location.
2- Set true north for the project.
3-Specify the time period by selecting the type of solar study.


4-Perform a solar analysis


185
June 21
E
4:00 PM
4:40 AM W 4:00 PM
10:00 AM June 21 4:40 AM
8:10 PM W
4:00 PM
June 21 4:40 AM W
solar analysis
Solar Analysis envisions and quantifies the distribution and intensity of solar radiation on Revit model surfaces. The analysis considers neighboring things like grass and buildings and their shadows. Solar analysis can help pinpoint areas for maximizing solar gain by taking into account shading effects and seasonal fluctuations in solar radiation, even though it is not designed to size photovoltaic panels. The Solar Analysis tool is a part of the Insight plug-in.
lighting analysis
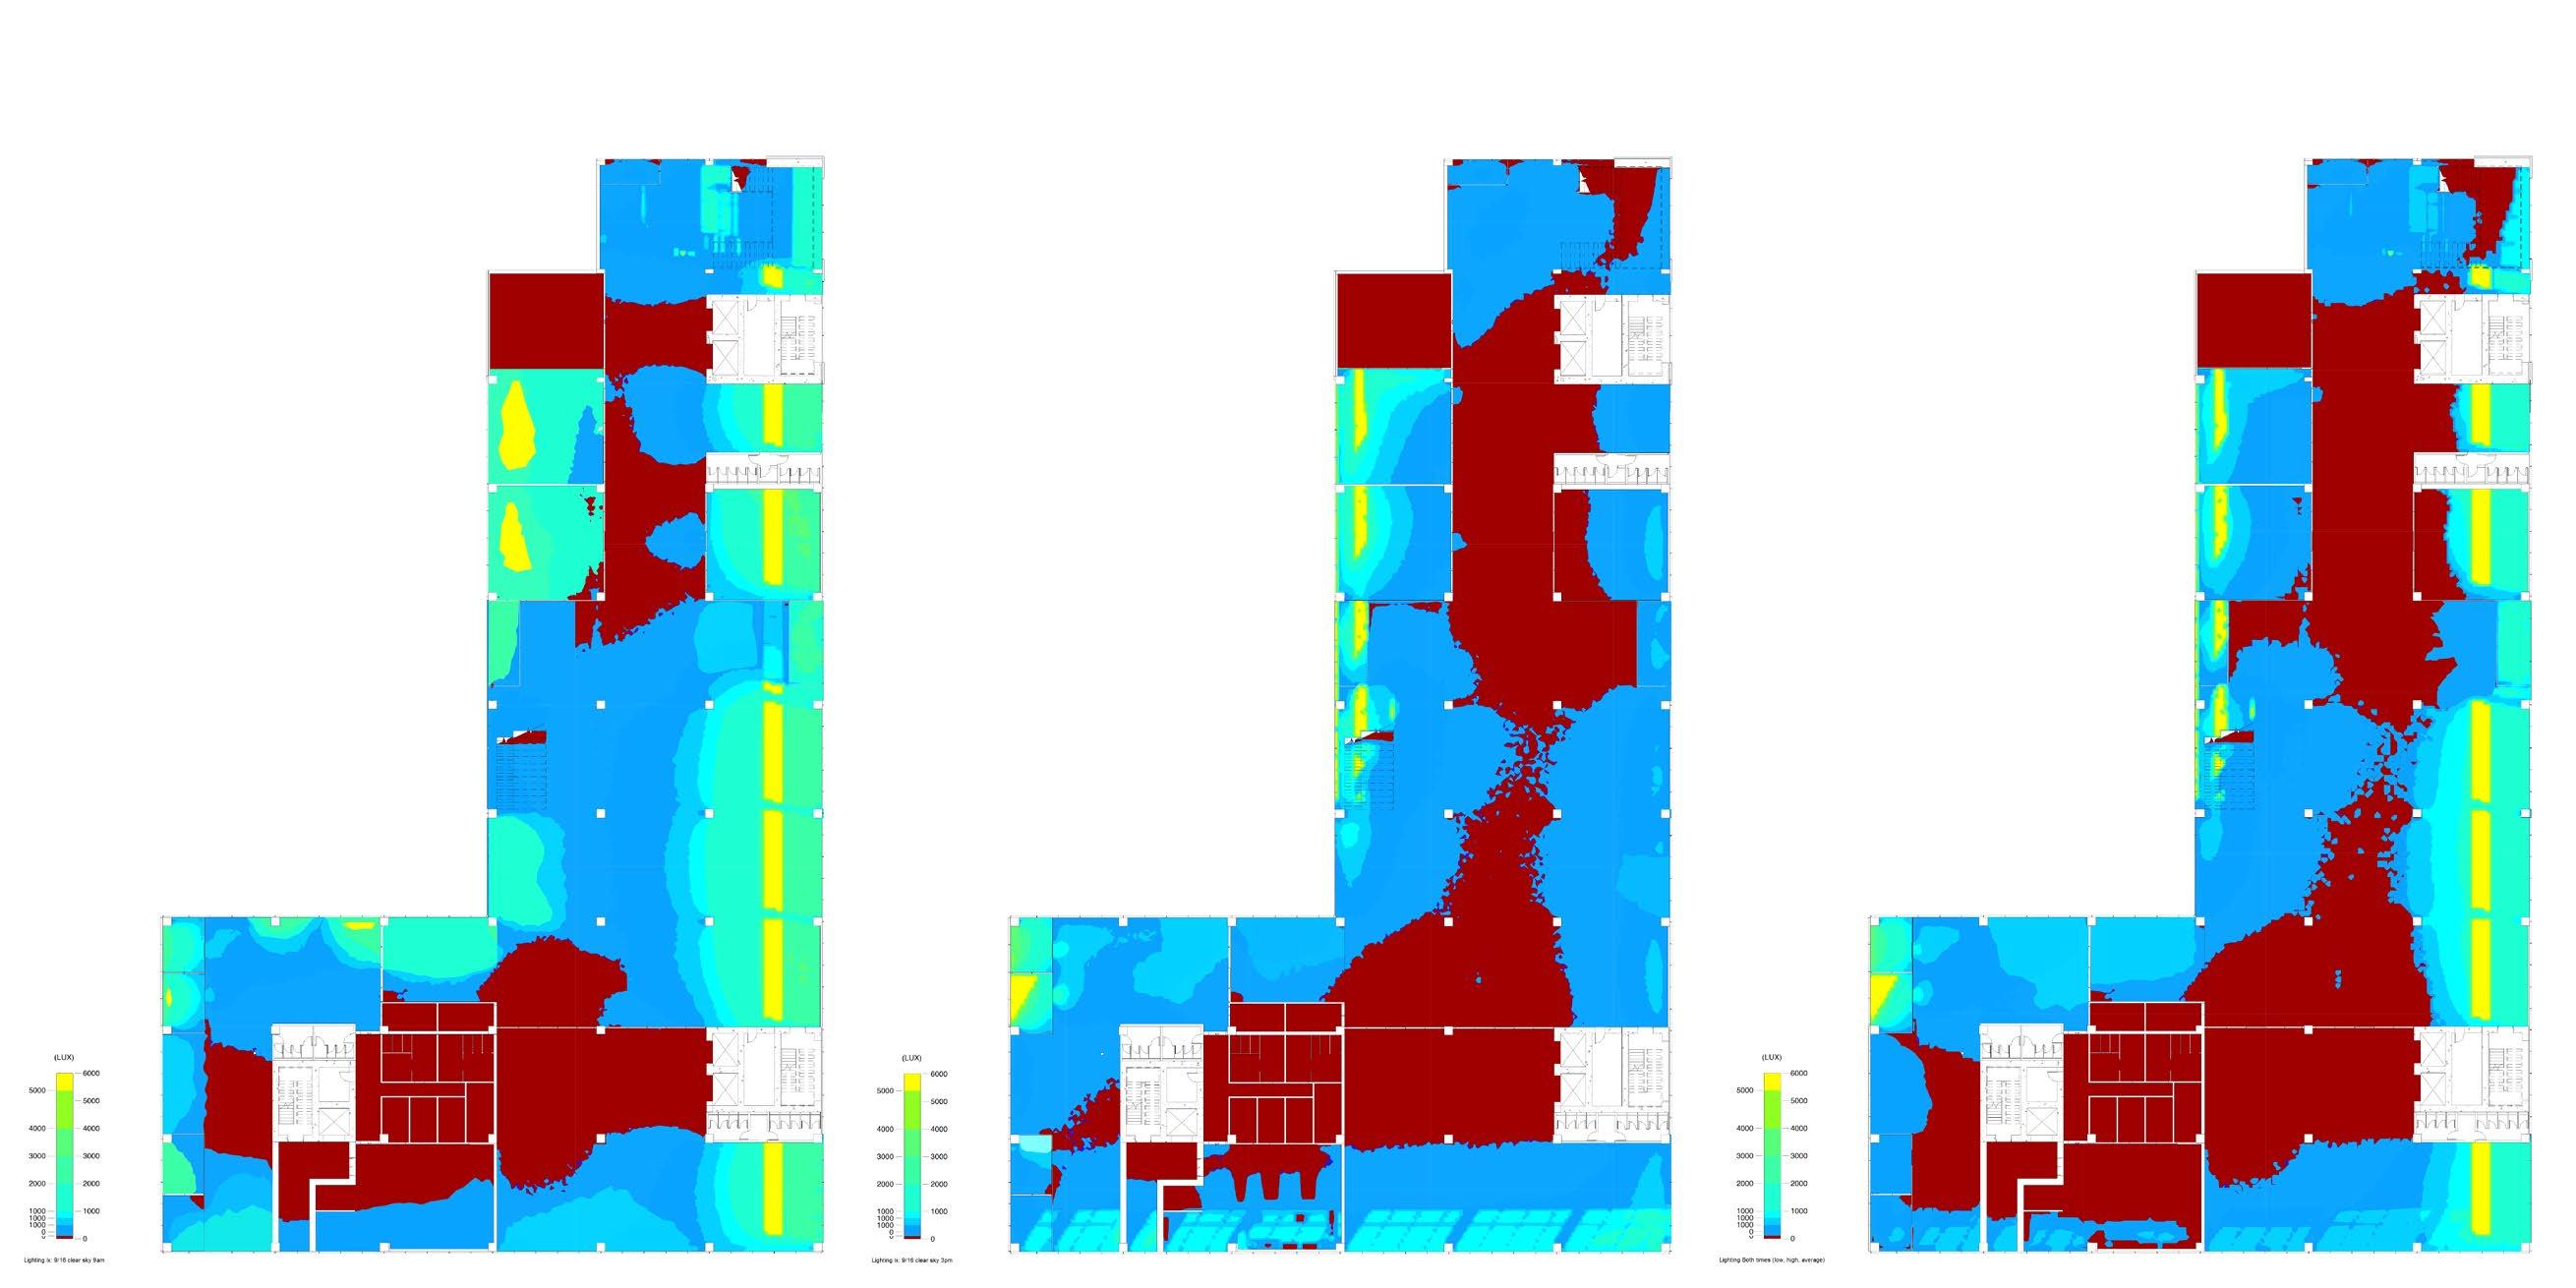
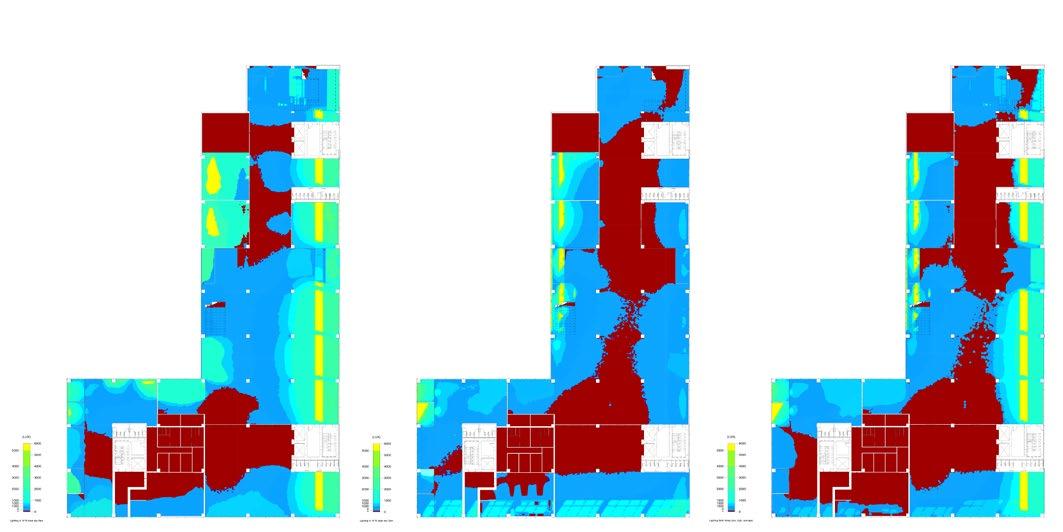
Fig 255: Ground Floor, Authors
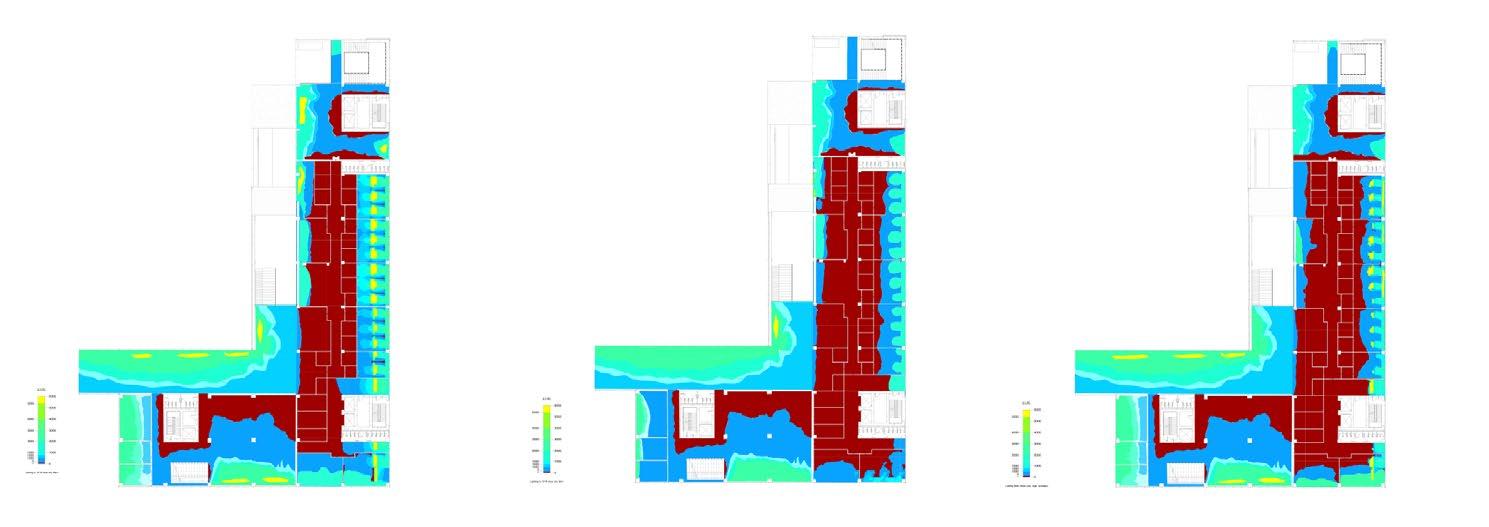
Fig 256: Ground Floor, Authors
Fig 257: Ground Floor, Authors
Fig 258: First Floor, Authors
Fig 259: First Floor, Authors
Fig 260: First Floor, Authors
186
Lighting Analysis
Fig 261: Second Floor, Authors
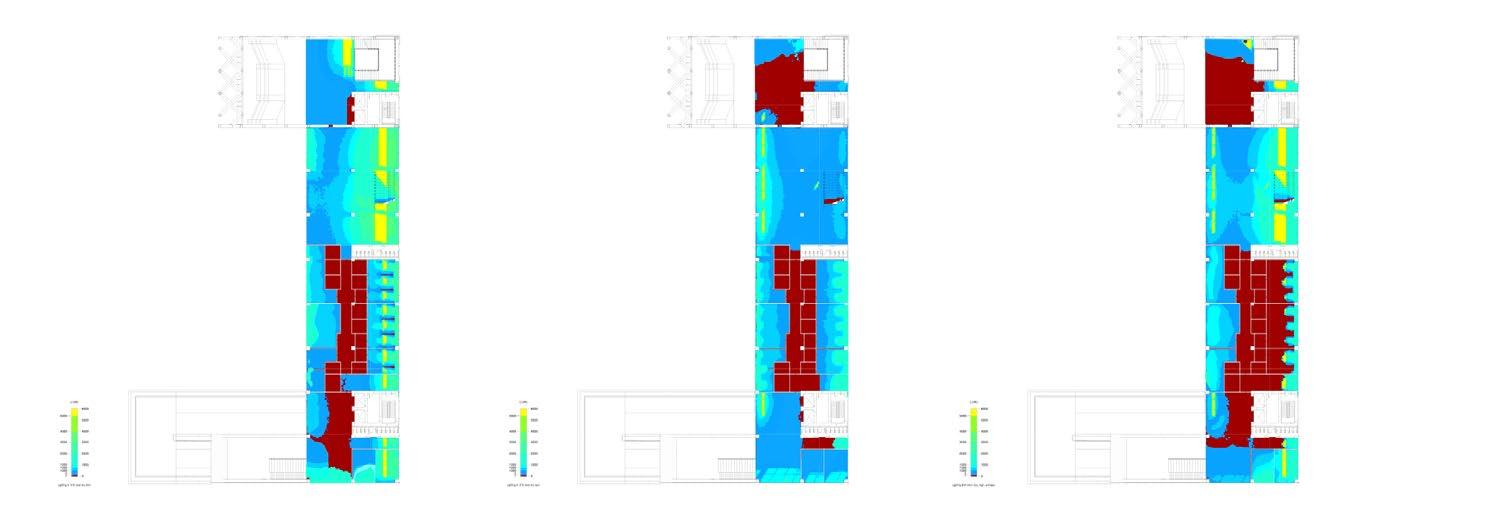
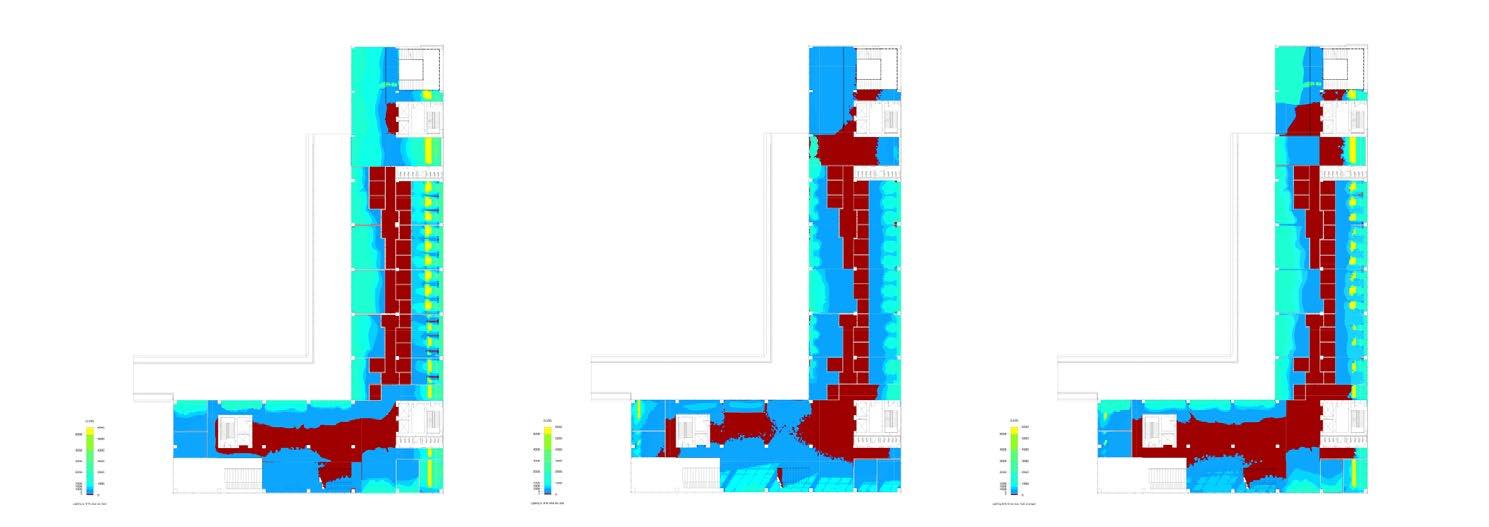
Fig 262: Second Floor, Authors
Fig 263: Second Floor, Authors
Fig 264: Third Floor, Authors
Fig 265: Third Floor, Authors
Fig 266: Third Floor, Authors
187
Lighting Analysis
Natural lighting is one of the essential elements of architecture for its effect on the comfort of people, energy conservation, and enriching the spaces. In other words, proper integration of natural lighting into built-up areas increases the value of space. It supports and promotes airflow, which controls the air fresh all around. In addition, utilizing natural light can lead to substantial energy savings. Electric lighting in buildings consumes more than 15 percent of all electricity generated in the United States, according to the U.S. Department of Energy and the U.S. Energy Information Administration.
Having natural light, specifically for the laboratories, was paramount as well. The laboratories are located in the west and east part. Therefore, the interior receives direct sunlight from the south, east, and west orientations, as well as light levels that change substantially during the day as the sun moves around the Earth.
The lighting system considers the color and reflectivity of the Dark surfaces reflect less light than bright surfaces, and the result is likely to be insufficient luminous conditions in which there is little direct reflected light. Regarding this, lighter finishes have been selected for the laboratories.
Insight Lighting Analysis with Revit supplies in-context daylighting and lighting analysis outcomes and automated scheduling to help document light levels throughout the design.
The workflow of the Insight Lighting Analysis,
1. Preparation of the model: Setting the project location
2. Room tags, surface reflectivity, glazing, and material properties are defined.
2. The type of analysis has been chosen
3. Run analysis
In the Research Center for Natural Sciences project, the lighting analysis is based on types of LEED.).The unit of measurement is `LUX. ` The analysis was done by each floor plan separately. Three different time ranges were set for the study at the Clear sky conditions ( 9.00 am,3.00 pm, and both times.
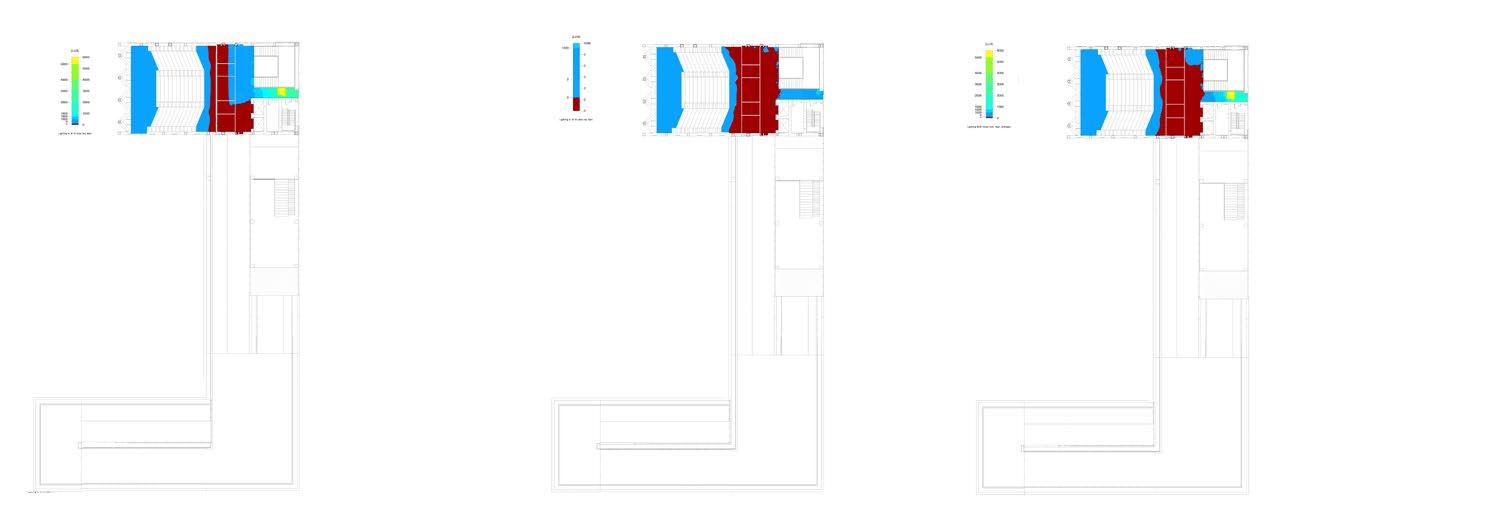
The results show that all the levels have enough daylight during the day. At 9.00 am, the clear sky and the space have more daylight at all levels. The central part of the building has less light because of the 10x10 concrete compact cores.
Laboratories are located in the area with natural light at an appropriate level. The cantilever is located in the north part, which needs less natural light because of its function, the conference hall.
188
Fig 267: Fourth Floor, Authors Fig 268: Fourth Floor, Authors Fig 269: Fourth Floor, Authors
Lighting Analysis
Double Glazing System with Electrochromatic Cover System provides acoustic barrier and shading system
Fig 270: Axonometry , Authors
Timber Structure and Flooring System
Accesible Green Roof It helps regulate Solar System
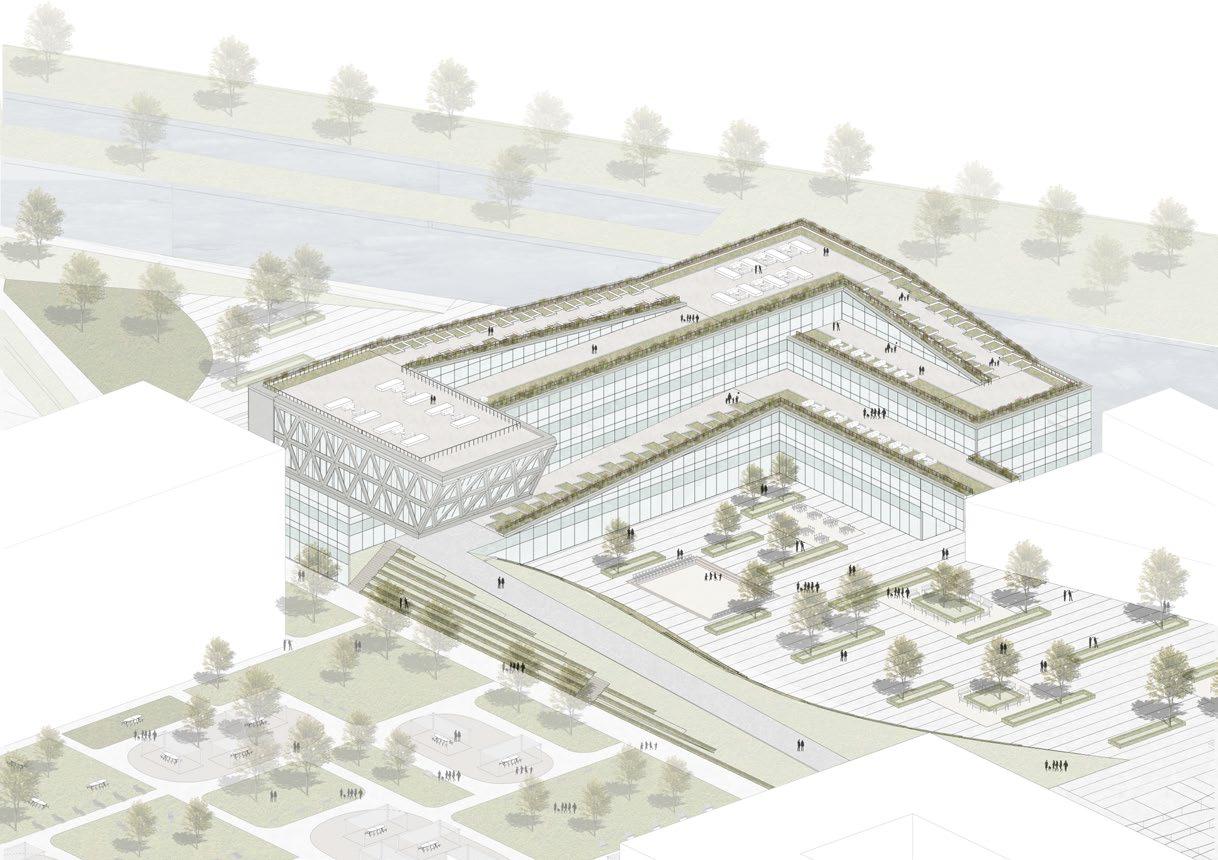
Timber is the most sustainable form of construction, as it benefits from the lowest embodied carbon dioxide of any building material.
Sustainable Mobility A car free district: walkability and innovative mobility
Photovoltaic glass system at the south facade
189
materials Materials
Double Glazing System with an Electrochromatic Cover is a solution for the shading system of the cantilever. The system provides privacy and lighting control. The system works with a simple on-off switch or a remote that turns the Smart Glass from being frosted (opaque) to clear (transparent). It has easy installation as any regular laminated tempered glass. When the system is open, the visible light is % 83, and Solar Heat Gain Coefficiency is % 0.74. When the system is closed, the visible light is %73, and Solar Heat Gain Co-efficiency is %0.31.
Fig 272: Structural Axonometry , Authors
The structure is mainly composed of Cross Laminated Timber. It creates a better-insulated environment, and unlike concrete constructions, which need to dry, cross-laminated timber constructions can be established quickly. Light weight lowers the load on foundations, so there is less need for materials with high embodied energy. The environmental impact of materials is one of the popular topics of today. Hence, wood is a sustainable resource, and Cross Laminated Timber can be an outstanding, environmentally friendly option as a construction material.
Accesible Green Roof
The Research Center for Natural Sciences` façade comprises a curtain wall system with opaque and clear glazing. As a solar solution, it is decided to have solar panels at the south façade of the building. For this system, Onyx Solar producer has chosen, and they produce a photovoltaic glass façade composed of photovoltaic glass carbon dioxide emissions avoided in 35 years40 Tons of carbon dioxide.In addition, photovoltaic glass integrates perfectly with architectural design, providing it with optimal electrical efficiency and sustainability.
Fig 274: Axonometric view, Authors
The project is composed of a green sloped roof which is the main element of the design concept. Walking paths are made of stone, and steps are made of greenery and parapet with small vegetation. Compared with a standard roof,vegetationtion on a green roof assists in reducing both gaseous pollutants and dust particles by dismissing a proportion of them from the immediate environment. It also has advantages for building performance. It helps the insulation of the building and enhances sound absorption.
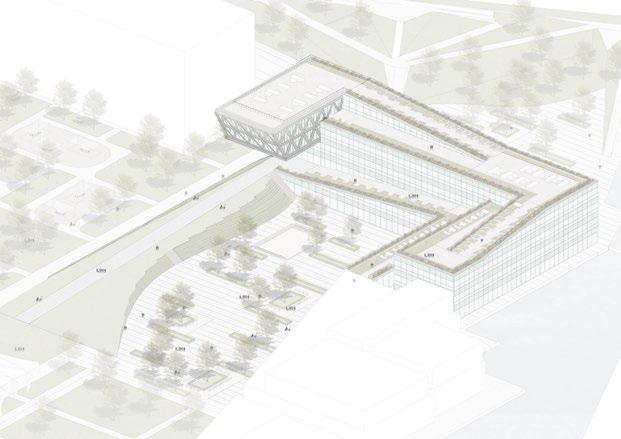
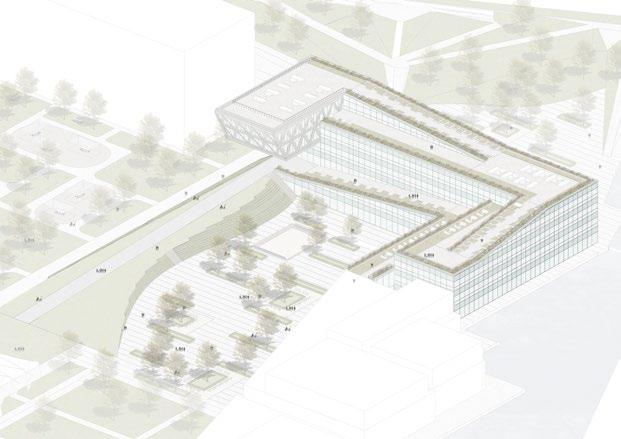
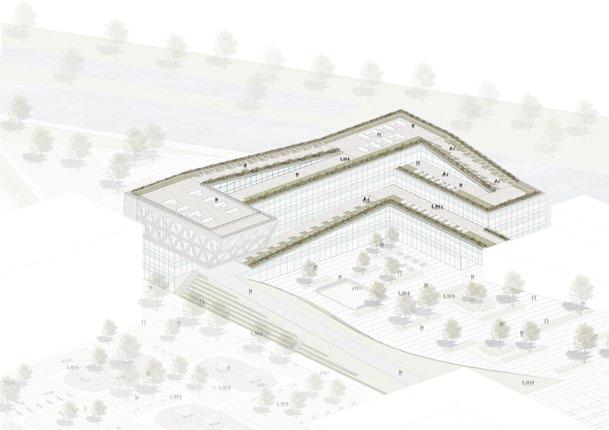
190
Timber Structure and Flooring System :
Materials
177 cm construction floor
Grass ( Low plantation), Soil, Geotextile, Gravel, Anti-root insulation membran, Thermal insulation,Water insulation,XLam timber deck,X-Lam beam
164 cm construction floor
Wooden floor pavement ,Glue,Screed,Seperation layer,Thermal insulation,Footfallproof layer,Vapor barrier,X-Lam timber deck,X-Lam beam
Fig 275: 3D Axonometry , Authors
Service system
Cross Laminated Timber Structure
Wooden sitting steps
Parapet with vegatations
Curtain wall facade system
Cross Laminated Timber Structure

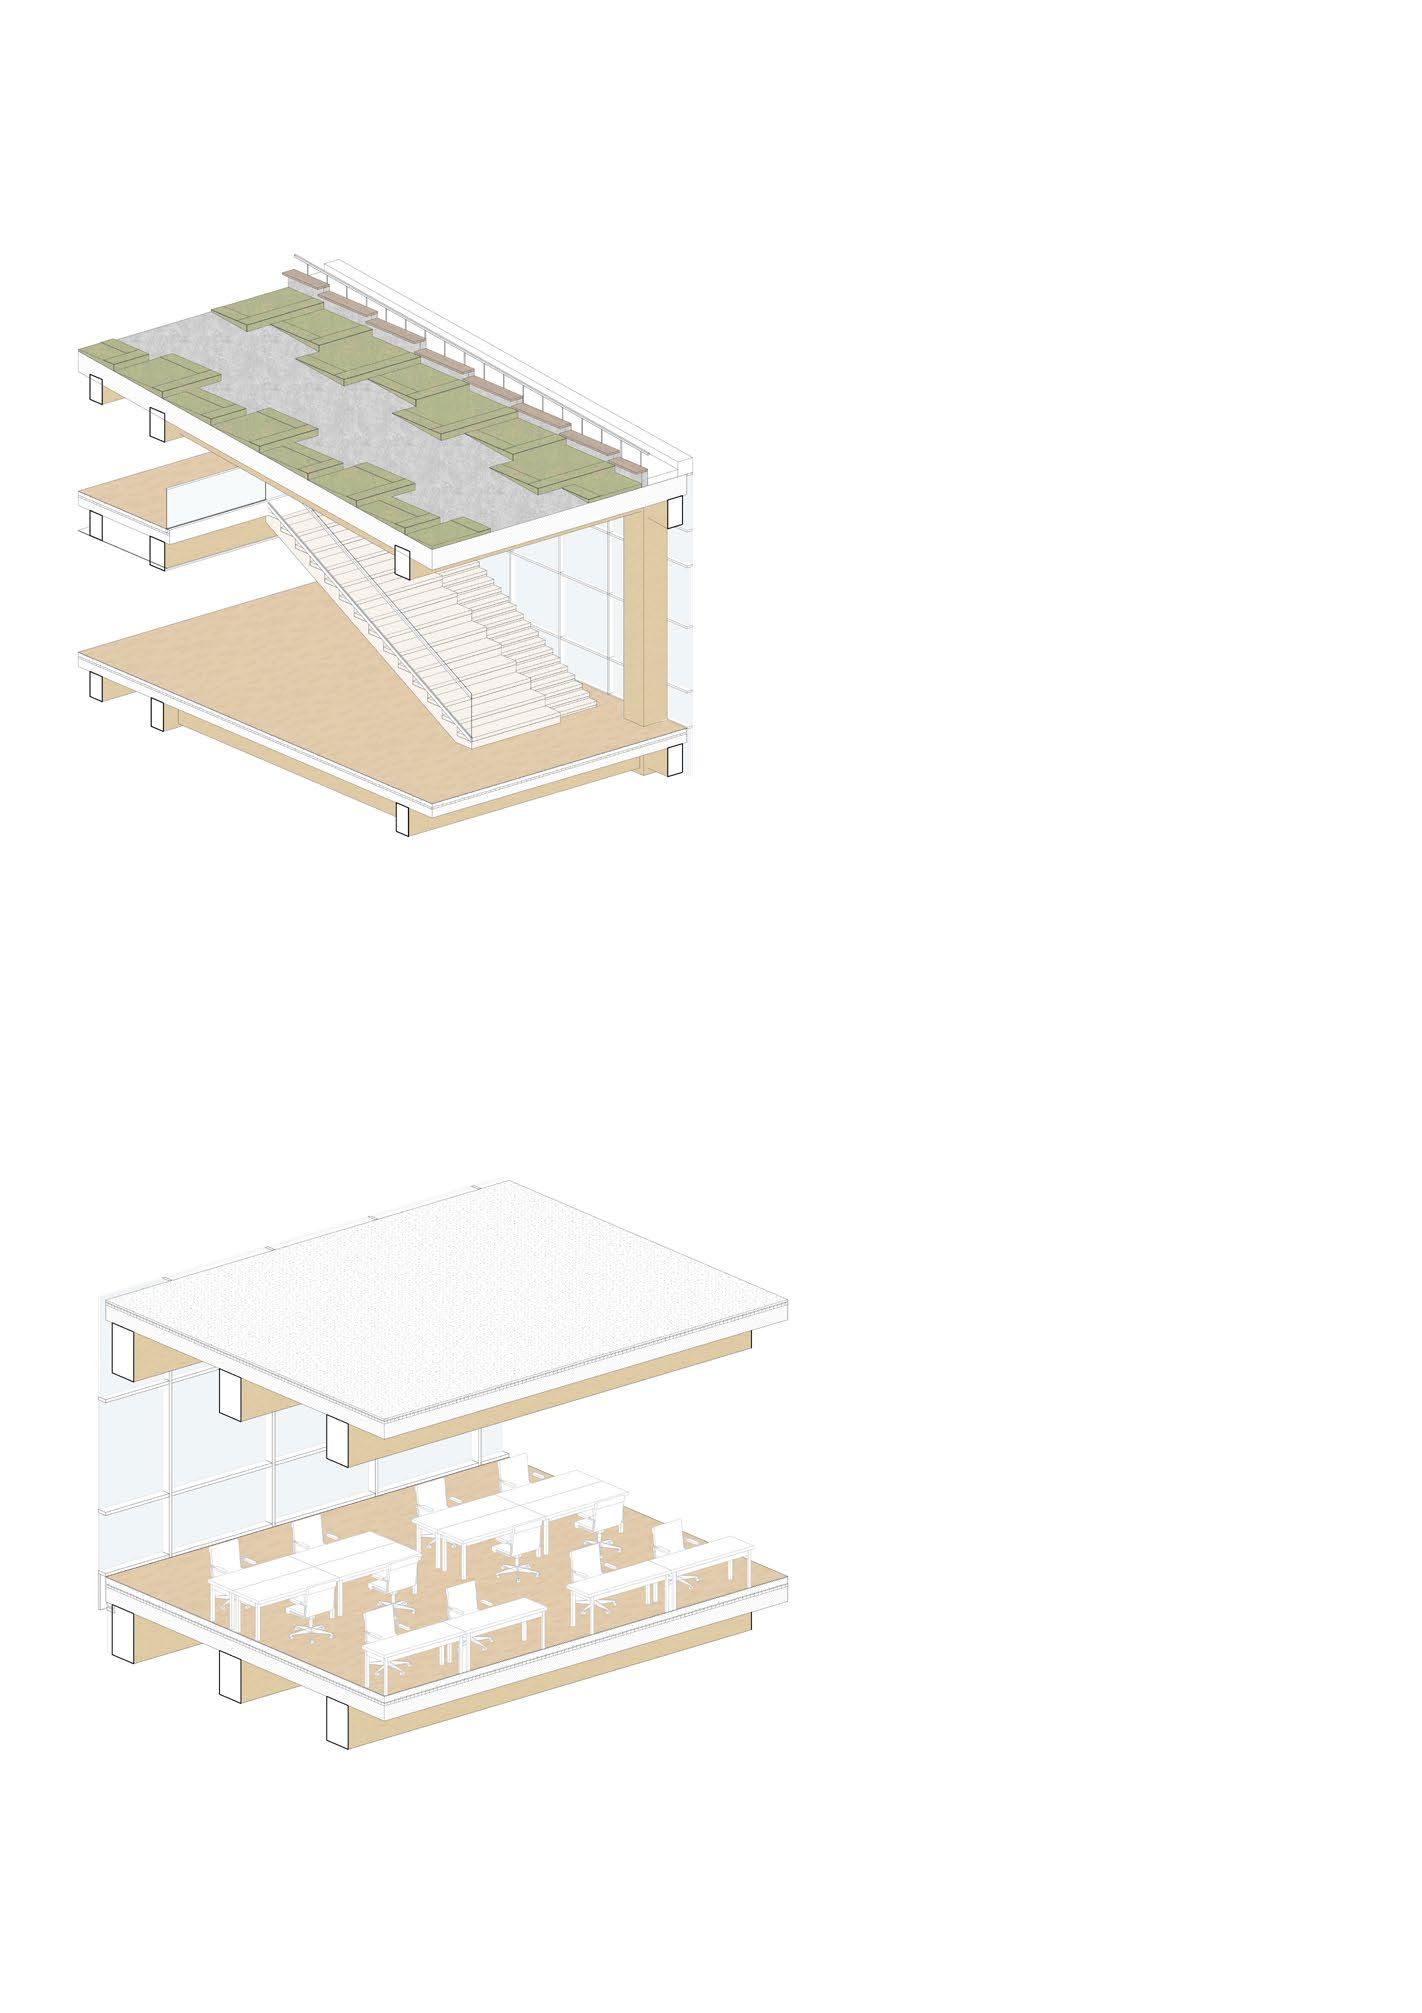
30 mm
Wooden linear ceiling system
164 cm construction floor
Floor finishing : Silentfloor PUR English Oak ,Glue,Screed,Seperation layer,Thermal insulation,Footfallproof layer,Vapor barrier,X-Lam timber deck,X-Lam beam
Fig 276: 3D Axonometry , Authors

Materials
150 mm
Interior walls
164 cm construction floor
Floor finishing : Epoxy Resin ,Glue,Screed,Seperation layer,Thermal insulation,Footfallproof layer,Vapor barrier,X-Lam timber deck,X-Lam beam
Curtain wall facade system
Fig 277: 3D Axonometry , Authors
Fig 278: 3D Axonometry , Authors
Working desks with stoneware/ceramic tops
Open ceiling
164 cm construction floor
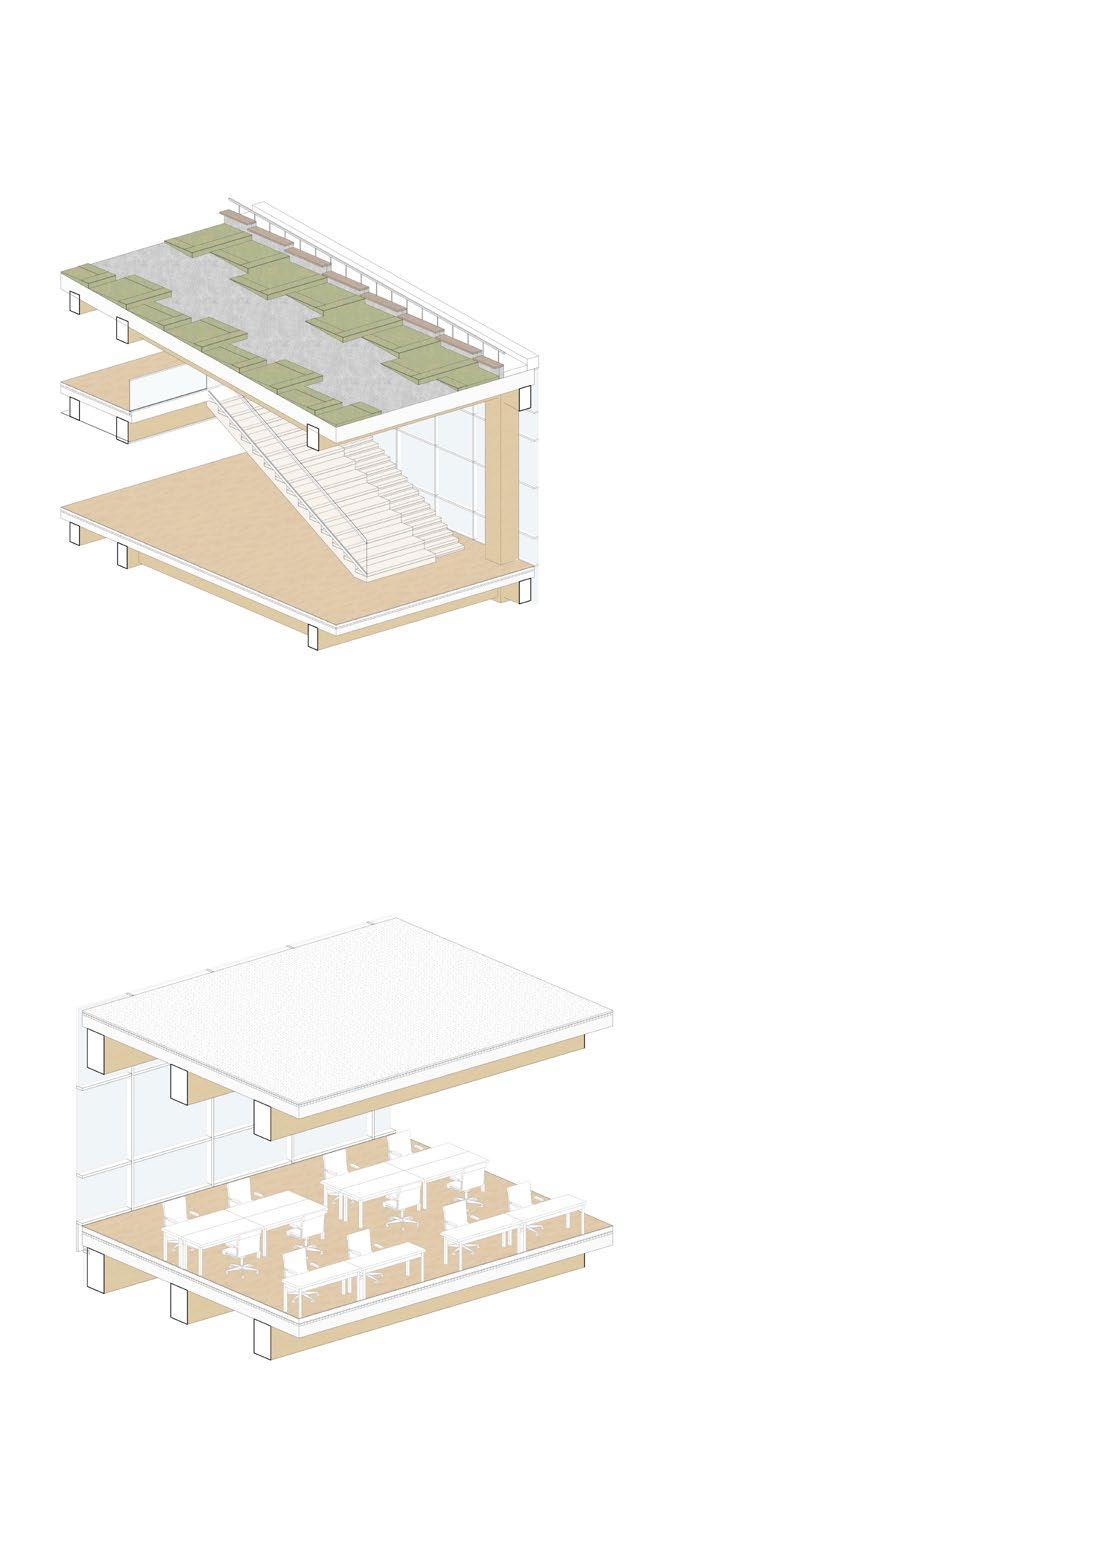
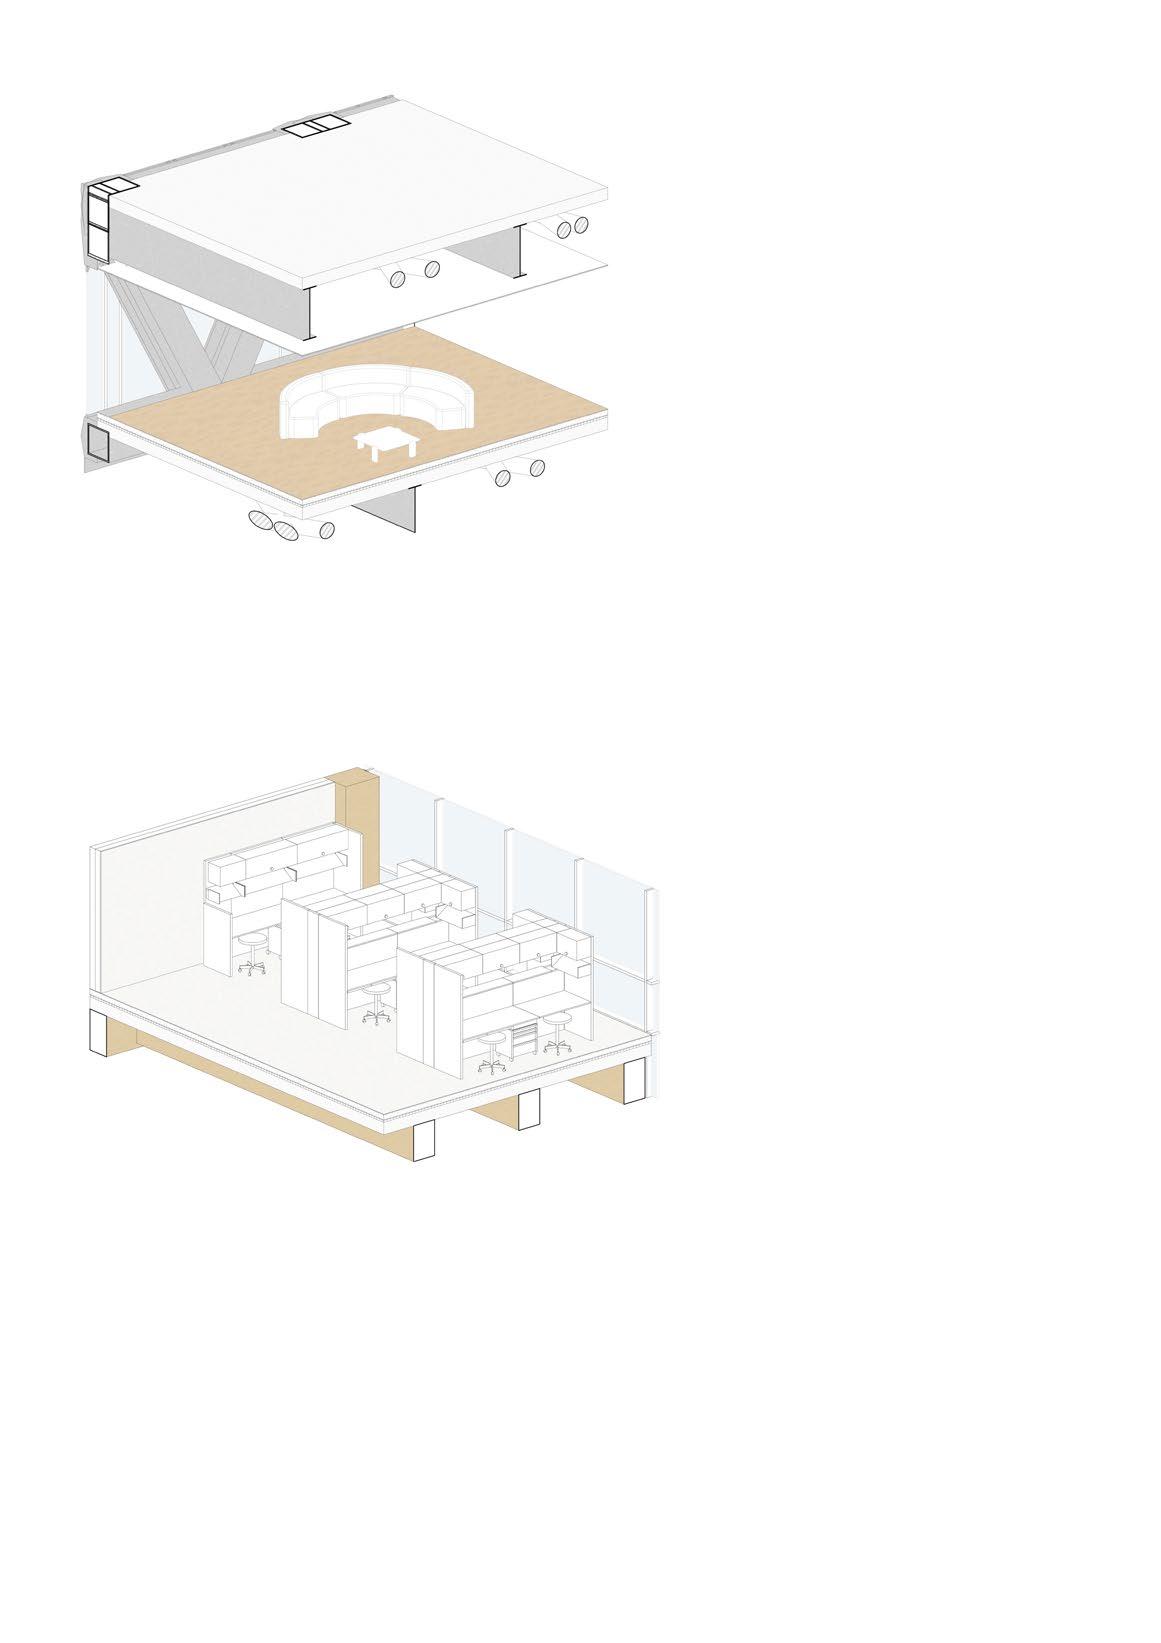
Materials
Pipe System
Steel Beams
Double Glazing system with electrically switchable glass
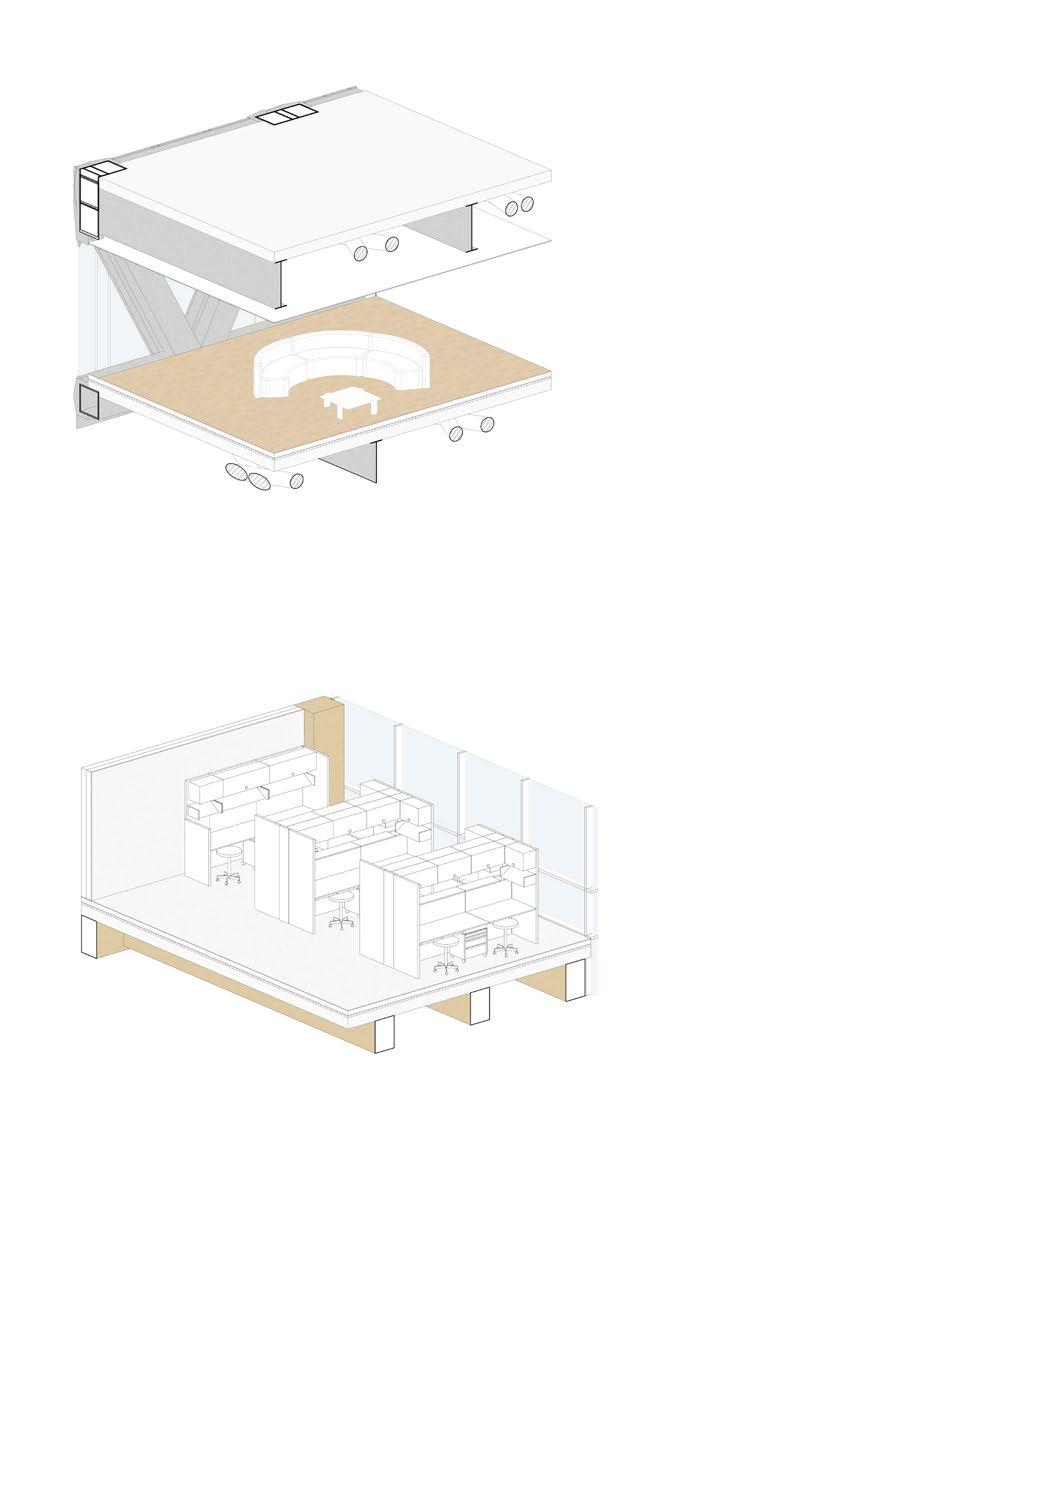
Steel Truss System
Floor finishing : Wooden pavement ,Glue,Screed,Seperation layer,Thermal insulation,Footfallproof layer,Vapor barrier,Reinforced Concrete, Steel beam
Fig 279: 3D Axonometry ,

Interior Curtain wall
Stair with a wooden finish
Cross Laminated Timber Structure
Fig 280: 3D Axonometry ,
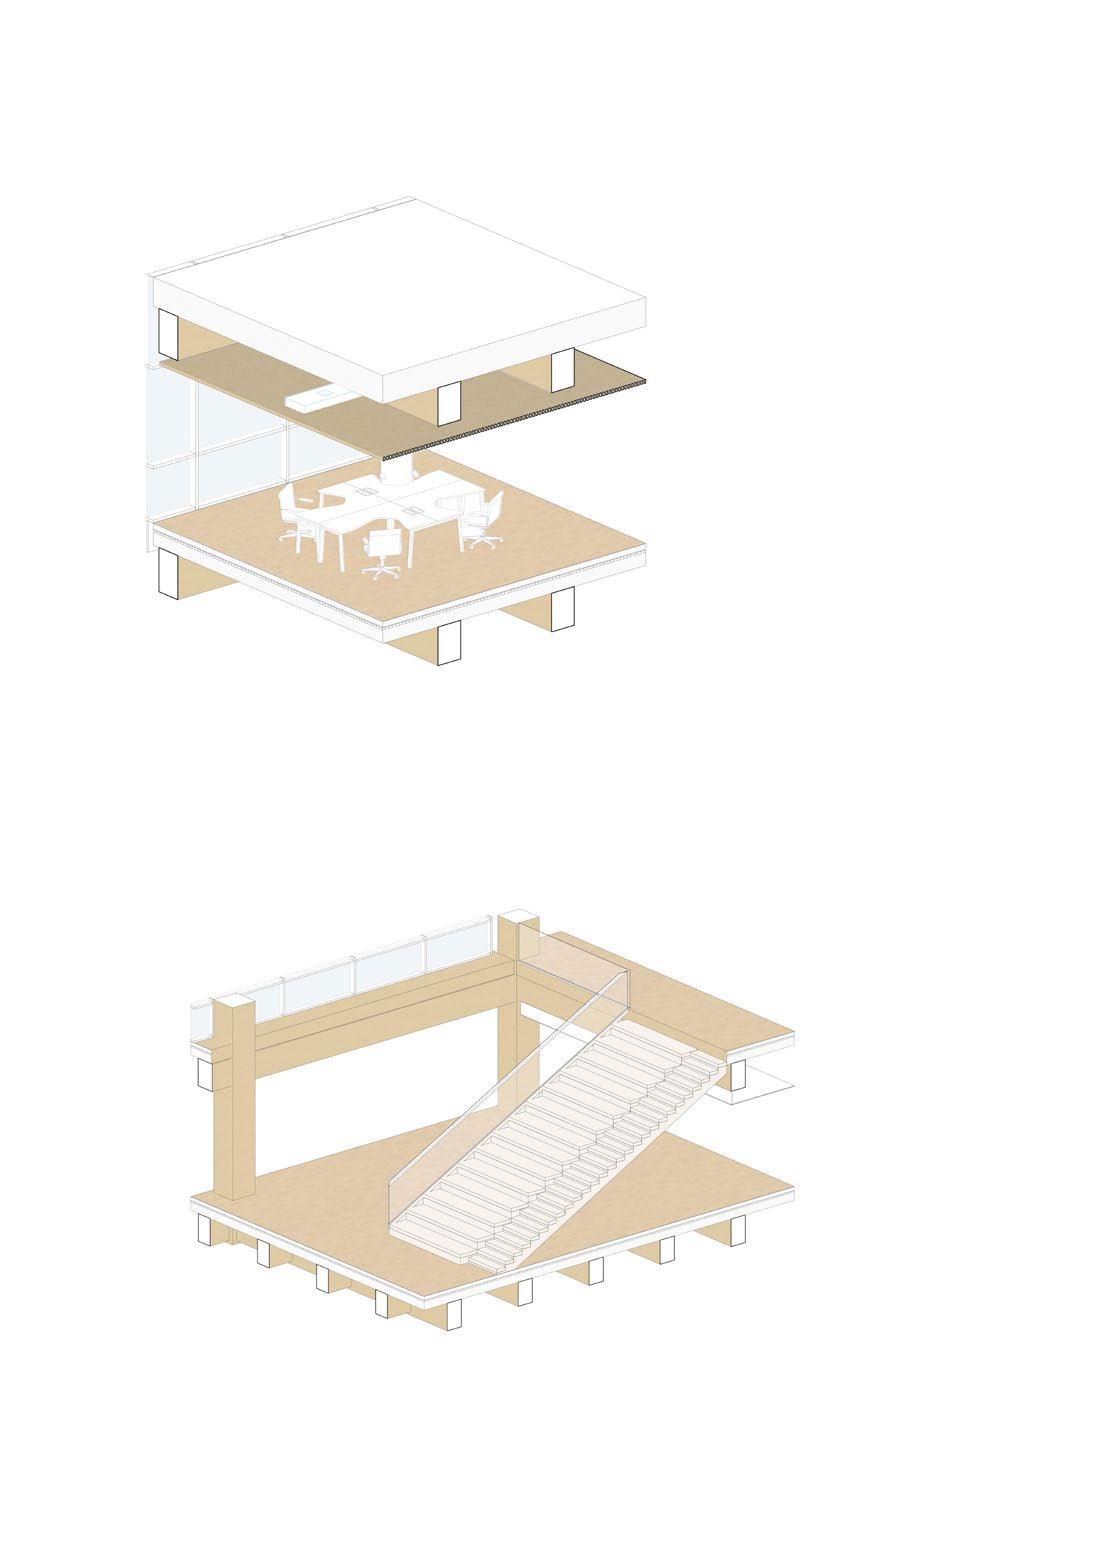
Materials
SUSPENDED CEILING Laboratory Laboratory
Epoxy
Resin
Producer: Sika
High chemical resistance Slip resistant: R12 V 8 ( DIN51130) 2-3 mm , gloss finish
FLOOR FINISH
Public Spaces
Steel Linear Ceiling System
Producer: HunterDouglas Panel length: 800 mm to 6000 mm Panel depth: 15 mm
FLOOR FINISH
Public Spaces
An epoxy resin finish is used for the laboratory floor finishing. Experimental laboratories specifically need a finish that is chemical resistant and is a non-absorbent surface. Epoxy resin has high hardness and easy to clean, and makes the surface shine. Moreover, it is long-lasting and easy to maintain. To have a compatible design, research and experimental laboratories have the same finishes.
Laboratories have fake ceilings to hide service equipment for a visually better environment. One of the main reasons for choosing metal ceilings is the first visual embodiment, and Hunter Douglas is a producer who pioneered suspended metal ceilings. Secondly, their performance is good from an acoustic, so it increases the comfort of the space. Lastly, it has good performance from a fire safety point of view.
Wooden Pavement
Producer: Polyfloor R value: R10
Thermal Resistance: 0.0525 m2K/W %100 recyclable

Wooden Linear Ceiling System
Producer: HunterDouglas Panelsize: 33 mm gap, 46 mm height, 17 mm width Fire classification: Up to class B-s2
FLOOR FINISH FLOOR FINISH
Exterior spaces & Roof ( Partial) Exterior spaces
The public areas consist of wooden flooring to provide harmony with the wooden structure. For the interior spaces, the design vision was seeing the wood inside and feeling to wood. Also, wood is a natural product that is alive, it breaths and with its own characteristics is suitable for wide range of design solutions.It is the only type of construction material that is 100 percent carbon dioxide neutral and fully recyclable.
A ceiling system is used to hide service equipment. Thanks to the strategy, interior spaces still have wooden effects from the design point of view. It also has high acoustic performance, which is essential for interior spaces. Furthermore, from a fire safety point of view, it can achieve a reaction to fire classification (EN13501-1) of B-s1,d0.
Stone Pavement
Producer: Onetile Thickness: 20mm Surface: Matt
Fig 281: Material list, Authors
Materials
Wooden pavement
Producer: Parlex Prodema Panel dimensions: 2440 x 130, 198, 300 mm Thicknesses: 10 and 14 mm

The master plan of the Research Center for Natural Sciences consists mainly of greenery zones and stone finishes. All the walking paths and in front of the building consist of stone to have a consistent design philosophy. It is more durable than concrete and easy to maintain. Likewise, visually, it has a substantial effect with its matt finish.
Wooden pavement has been selected for the working areas, which is compatible with the greenery and is a sustainable material. It also provides a warm atmosphere for people, especially those working in outdoor spaces. They are resistant to slip and moisture and easy to maintain.
194 FLOOR FINISH
CURTAIN WALL SYSTEM
Laboratory & Public Spaces
SHADING SYSTEM
Cantilever
Since the building is made from cross-laminated timber, the aim was to make the structure visible from the outside using a curtain wall. Another design criterion was to reflect the slopes of the building. Utilizing a transparent façade allows for a simple and sufficient façade configuration. Technical point of view, curtain walls enhance the thermal efficiency of the building. Also, it constructs from much lighter materials like glass, allowing natural light to be filtered into the building. The reason for selecting Schüco is a leader in the Italian market in developing and distributing high-quality aluminum systems for windows, and facades.
Stick Curtain Wall System
Producer: Schuco
U Value: 1,69 W/m²K
Airborne sound insulation 48dB
THERMAL-ACOUSTIC INSULATION
Floor&Wall
Electrically switchable glass
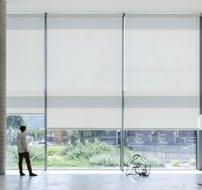
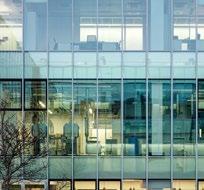
Producer: Smart Glass Technologies
Solar Heat Gain COEF(ON): %74
Solar Heat Gain COEF (OFF): %32 Glass Type: Laminated, Low Iron.
STRUCTURAL SYSTEM
Columns,Beams and Slabs
As noted before, the `Double Glazing System with an Electrochromatic Cover ` system has been used for the cantilever glazing. Because of its function, it was essential to have shading in this part of the building.
Rock Mineral Wool

Producer: Knauf
U value: 0.7 W/m2k
Reaction to fire ( Euroclass): A1 Specific heat (Cp) 1.030 J/kg K
SHADING SYSTEM
Cross Laminated Timber
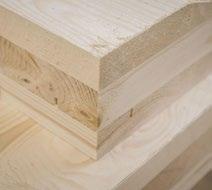
Producer: X-LAM Dolomiti
Thermal Conductivity: 0,12 W/(mK) Specific heat Cp: 1600 J/(kgK)
PARTITION WALLS
Interior curtain system Laboratory
The reason for selecting rock mineral wool for the insulation is to heat or cool the building, so less energy is needed. It effectively reduces airflow and, essentially, sound transmissions, and its higher airflow resistivity means better sound attenuation for a quieter environment. Rockwool gives you peace of mind with a fire-resistant design, a critical safety point of view.
Cross Laminated timber has been chosen from mainly sustainability point of view which explained before. Compared with steel and concrete construction it is a low impact material with a much lower embodied carbon footprint.X-LAM Dolomiti has been chosed as a producer which is the largest Italian plant specialized in the production of XLAM panels and ecological buildings.
Fabric rolling shading
Producer: Bandalux
Max width: 4600 x 4600 mm
Material: Fabric
Fig 282: Material list, Authors
Materials
Manoeuvrable partition walls
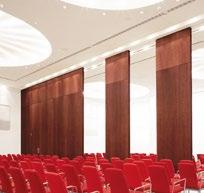
Producer: Darmakaba
Technology: Average sound insulation value 30 – 59 kg/m2
The facade of the Research Center for Natural Sciences consists of opaque and translucent glazing. The opaque part is to cover slabs from the outside, not to have them visible. However, the transparent parts needed a glazing solution, especially the southern part. Fabric curtains are easy to install, and their simple design suits research buildings.
Flexibility was one of the leading design benchmarks, especially for laboratories. Partition walls are positioned mainly in the laboratories to have flexible spaces. The product has also been chosen considering the acoustic performance to have privacy when closed.
195
conclusion

7
We have not only placed a building but also revitalized the masterplan of the East Gate. We have managed to produce a spine of sports facilities starting from the knowledge hub and ending with Decumano. The sports area is a concentric scope, bordered by a shallow continuous river and running track that will serve the elderly and youth.
Approaching the end of the road of Decumano, the conclusion of the whole masterplan is marked with the Research Center for Natural Sciences. The ground entrance level of the design is manifested as a common ground with numerous public functions. The main entrance is connected with the elevated slope terrain to the first floor, further connecting with the sloped roofs.
The purpose of the thesis is to make an impact on the area and create a convex establishment that will bring together science, innovation, and technology. It will be a place that will also serve the University of Milan and the Human Technopole with its common working spaces. We have managed to reinvigorate the common park of the research center and the university. The area is turned into a digital park to serve as a joint venue to brainstorm and exchange ideas with each other in the open air.
Furthermore, one other objective was to connect the public part of the research center together with the cultural center. The fusion is made through an exhibition space with the intention to meld along with innovation. The idea of elegance and simplicity is transmitted to the facade of the building, to appreciate the movement of the building and its shape with sloped roofs. Through the building and its surrounding, we adapted for sustainability and efficiency in transformation. With the use of cross-laminated timber for the structure, we have managed to reconcile with neighboring buildings.
Efficiency in the transformation was a subject of matter for the inner functional organization. For the laboratories, transformable and movable walls were designed to divide or bring together groups of researchers. In the future, the three floors containing laboratories can be reorganized to a completely different area or function with the help of the moveable partitions. This is considered sustainable, and efficient in the effort of transformation as a workload and an economic solution.
Reaffirming, the auditorium is the final volume and focal point of the thesis. It is manifested as a colossal cantilever. Together with the visibly distinguished shape, the exterior look will also be prominent in comparison with the regular dignified facade. Being inside the auditorium, the project will be concluded by perceiving the whole Milano innovation district, from the end of the masterplan.
197
Conclusion
bibliography

8
1. INTRODUCTION
Tucci, M. (2011). For an urban history of Milan, Italy: The role of GIScience. Texas, USA.
Addarii, F. (2016). Mind - Milano innovation district. Aligning public and private interests.
Nili, F. (2020). The history of Milan through 8 incredible maps. https://fonsnili.wordpress.com/2020/05/11/8-historical-maps-of-milan-to-discover-2500-years-of-forgotten-history/
Fondazione Triulza. (2021). Welcome to Mind: A strategic project for Milan and Italy. Milan, Italy.
Arexpo, pwc, Roland Berger (2016), Milan. “Guidelines for the Arexpo strategic development and enhancement plan”. Arexpo (2018), Milan. “Thematic park’’, Human Technopole: the new headquarters”.
Arexpo, Lendlease, Aecom, Land, Systematica, Carlo Ratti Associati (2019), Milan. “Accessibility study from west gate to the municipality of Rho, MIND: Regeneration project for sustainable urban development”.
Arexpo, Lendlease, Aecom, Land, Systematica, Carlo Ratti Associati (2019), Milan. “Landscape report, attachment n.3, environmental Im¬pact Study, MIND: Regeneration project for sustainable urban development”.
Arexpo, Lendlease, Aecom, Land, Systematica, Carlo Ratti Associati (2019), Milan. “Strategic environmental assessment of the integrated post-expo intervention program, MIND: Regeneration project for sustainable urban development”.
Arexpo, Lendlease, Aecom, Land, Systematica, Carlo Ratti Associati (2019), Milan. “Integrated program of intervention – final proposal, MIND: Regeneration project for sustainable urban development”.
MIND (2019), Milan. “Innovation agenda for MIND – Life Sciences”.
MIND (2019), Milan. “Welcome to MIND: a strategic project for Lombardy and Italy”.
Lendlease (2020), Milan. “MIND Workplace Experience Strategy”.
Lendlease (2020), Milan. “MIND West gate competition design brief”.
Arexpo (2020), Milan. “Enhance Covert Innovate”.
CRA – Carlo Ratti Associati (2018), “Science for Citizens. The Science Campus of the University of Milan in MIND” (Schematic Design).
CRA – Carlo Ratti Associati (2017), “Milan Science & Innovation Park. Master plan
CRA – Carlo Ratti Associati (2018), Science for Citizens. The Science Campus of the University of Milan in MIND (Schematic Design)
CRA – Carlo Ratti Associati (2017), Milan Science & Innovation Park. Master plan for the transformation of Milan’s former 2015 World Expo site
199
Bibliography
2. URBAN STRATEGY
Oliveria V. (2018). Teaching Urban Morphology.
Comune di Rho.Regione Lombardia https://www.comune.rho.mi.it/it-it/vivere-il-comune/storia
Arexpo.(2016). Guidelines for the Arexpo Strategic Development and Enhancement.
Sasaki (2013).Jiading Park. https://www.sasaki.com/projects/jiading-central-park/ PWP LA.Library Walk.The University of California. https://www.pwpla.com/projects/uc-san-diego-library-walk Inside.Outside.Biblioteca Degli Alberi Milan. https://bam.milano.it/ Gillespiles.Riverlight https://www.gillespies.co.uk/projects/riverlight Lendlease.MIND Village. https://mindvillage.it/ Cocchiera F. (2014) Potsdamer Platz - Berlin, Germany. Lehman S. (2010). Can rapid urbanization ever lead to low-carbon cities?
Morandi C. (2007), Milan. The Great Transformation, Marsilio, Milano.
Lotus International Magazine, monographic numbers: Milano Boom (n.131, 2007), Meteo Milano (n. 161, 2016).
Andreola, I., Biraghi, M., Lo Ricco, G. (2015), Milan architectural guide 1945-2015, Hoepli, Milano Berizzi, C. (2015), Milan: buildings and projects since 1919, DOM, Berli
3-BUILDING DESIGN
Schmidgen H.(2011). History of the Beginnings of the Laboratory in the Early Modern World.
Gromling B.(2005).A Design Manual: Research and Technology Buildings.
Schemidgen H.(2011).The Laboratory.Bauhaus University, Weimar.
Griffin.B.(2005).Laboratory Design Guide.
Inside Salk.(2017).A Masterful Design.
Weiss/Manfredi.Novartis Office Building. https://www.weissmanfredi.com/projects/24-novartis-office-building
Mario Cucinella Architects.Municipality of the city of Piacenza https://www.mcarchitects.it/en/projects/municipality-of-city-ofpiacenza
Mayr Ludescher Max-Planck-Institute for Biophysics, Frankfurt http://www.mayr-ludescher.com/max-planck-institute-forbiophysics-frankfurt.html
200 Bibliography
Neufert.(2012). Architect`s Data.
Lab Design Conference.(2016).Designs That Foster Collaboration Between Experimentalists & Computationalists. WIRE.The Laboratory of the Future.
I.M.PEI.(1961-1967) National Center For Atmospheric Research.
Fishman, M. C., (2017), LAB – Building a Home for Scientists, Lars Müller Publishers GmbH, Zurich
Goldstein, R. N. (2006), Architectural Design and the Collaborative Research Environment, Cell 2006 Oct 20, 127(2), 243-6.
Harrison, A. L., Serra, M., (2011) Learning from Laboratories, in Log N°21 (WINTER 2011), Anyone Corporation, PP. 53-61 (http:// www.jstor.org/stable/41765397)
Klonck, C. (2016), New Laboratories: Historical and Critical Perspectives on Contemporary Developments, De Gruyter, Digital original edition (April 11, 2016)
Watch, D. D., Kliment, S.A., Perkins & Will, (2008), Building Types Basic for Research Laboratories, John Wiley & Sons, Inc. https:// www.laboratoryequipment.com/
Neuman, D. J. (2013), Building type basics for college and university facilities (2nd edition), Wiley, Hoboken (2018) Complex buildings, Learning system, A+T: Revista de arquitectura y tecnologia, Issue 50, 2018
Curvelo Magdaniel, F. (2016), Technology campuses and cities. A study on the relation between innovation and the built environment at the urban area level (A+BE I Architecture and the Built Environment), TU Delft Open, Delft
Hoeger, K., & Bindels, E. (2007), Campus and the city: urban design for the knowledge society, gta Verlag, ETH Zurich, Zurich Katz, Bruce, Wagner Julie, The Rise of Innovation Districts: A New Geography of Innovation in America, Metropolitan Policy Program at Brookings
MIT School of Architecture and Planning (2011), Innovation Technology Innovation Park. A research Study: Nandasoft Innovation Technology Development Park, Massachusetts Institute of Technology School of Architecture and Planning, Cambridge
Moodysson, J., & Jonsson, O. (2007), Knowledge collaboration and proximity the spatial organization of biotech innovation projects. European urban and regional studies, 14(2), 115-131.
Russell, J. S. (1992), The New Workplace, Architectural Record, June 1992, p72
4. STRUCTURAL DESIGN
Gupta R.S.(2020) Principles of Structural Design.Wood, Steel, Concrete Third Edition.
5. SERVICES DESIGN
ASHRAE. (2013) Ventilation for Acceptable Indoor Air Quality.
201 Bibliography
5. SUSTAINABLE DESIGN
Sutton A., Black D., Walker P. (2011) Cross Laminated Timber. The University of Bath.
Sharma A. (2018) Climate Consultant: A Software for Designing Energy Efficient Building. Gangadhar Meher University.
UN Environment. Life Cycle Initiative https://www.lifecycleinitiative.org/ UCLA.Sustainability. Why is sustainability? https://www.sustain.ucla.edu/
Velux.Benefits of daylight. https://www.velux.com/what-we-do/research-and-knowledge/deic-basic-book/daylight
GSA Report of the United States General Services Administration.(2011) The Benefits and Challenges of Green Roofs on Public and Commercial Buildings
202 Bibliography
203
citations

9
1. INTRODUCTION
Tucci, M. (2011). For an urban history of Milan, Italy: The role of GIScience. Texas, USA.
Addarii, F. (2016). Mind - Milano innovation district. Aligning public and private interests.
Nili, F. (2020). The history of Milan through 8 incredible maps. https://fonsnili.wordpress.com/2020/05/11/8-historical-maps-of-milan-to-discover-2500-years-of-forgotten-history/
Fondazione Triulza. (2021). Welcome to Mind: A strategic project for Milan and Italy. Milan, Italy.
2. URBAN STRATEGY
Arexpo.(2016). Guidelines for the Arexpo Strategic Development and Enhancement. Sasaki (2013).Jiading Park. https://www.sasaki.com/projects/jiading-central-park/ PWP LA.Library Walk.The University of California. https://www.pwpla.com/projects/uc-san-diego-library-walk
Inside.Outside.Biblioteca Degli Alberi Milan. https://bam.milano.it/ Gillespiles.Riverlight https://www.gillespies.co.uk/projects/riverlight
Cocchiera F. (2014) Potsdamer Platz - Berlin, Germany.
3-BUILDING DESIGN
Schmidgen H.(2011). History of the Beginnings of the Laboratory in the Early Modern World. Gromling B.(2005).A Design Manual: Research and Technology Buildings. Schemidgen H.(2011).The Laboratory.Bauhaus University, Weimar.
Griffin.B.(2005).Laboratory Design Guide.
Inside Salk.(2017).A Masterful Design. Weiss/Manfredi.Novartis Office Building. https://www.weissmanfredi.com/projects/24-novartis-office-building
Mario Cucinella Architects.Municipality of the city of Piacenza https://www.mcarchitects.it/en/projects/municipality-of-city-ofpiacenza
Mayr Ludescher Max-Planck-Institute for Biophysics, Frankfurt http://www.mayr-ludescher.com/max-planck-institute-forbiophysics-frankfurt.html
205
Citations
4. STRUCTURAL DESIGN
Gupta R.S.(2020) Principles of Structural Design.Wood, Steel, Concrete Third Edition.
5. SERVICES DESIGN
ASHRAE. (2013) Ventilation for Acceptable Indoor Air Quality.
6. SUSTAINABLE DESIGN
UN Environment. Life Cycle Initiative https://www.lifecycleinitiative.org/ UCLA.Sustainability. Why is sustainability? https://www.sustain.ucla.edu/ Velux.Benefits of daylight. https://www.velux.com/what-we-do/research-and-knowledge/deic-basic-book/daylight
GSA Report of the United States General Services Administration.(2011) The Benefits and Challenges of Green Roofs on Public and Commercial Buildings
https://environment.ec.europa.eu/topics/waste-and-recycling/waste-framework-directive_en https://www.lifecycleinitiative.org/starting-life-cycle-thinking/life-cycle-approaches/
206 Citations
207 Citations
sitography
10
https://www.arexpo.it/en/homepage
https://www.mindmilano.it/en/ https://www.htechnopole.it/en/campus https://www.mindmilano.it/en/human-technopole-new-building/ https://fondazionetriulza.org/cose-cascina-triulza/ https://carloratti.com/project/milans-science-knowledge-and-innovation-park/ https://www.unimi.it/en/university/la-statale/our-heritage-our-future/campus-project https://web.comune.milano.it/wps/portal/PubblicazioniUrbanistiche/archivio_pubblicazioni_urbanistiche_2019/ pii+mind+adozione2
https://www.britannica.com/place/Milan-Italy/Landscape https://fonsnili.wordpress.com/2020/05/11/8-historical-maps-of-milan-to-discover-2500-years-of-forgotten-history/ https://repertoriodimilano.wordpress.com/ http://www.storiadimilano.it/ https://carloratti.com/project/science-for-citizens/ https://www.systematica.net/project/mind-milan-innovation-district-post-expo/ https://www.arup.com/projects/milan-mind-innovation-district https://www.epa.gov/sustainability/learn-about-sustainability#what https://environment.ec.europa.eu/topics/waste-and-recycling/waste-framework-directive_en https://www.lifecycleinitiative.org/starting-life-cycle-thinking/life-cycle-approaches/ https://www.huxleyandco.co.uk/curtain-walling-advantages-and-disadvantages-of-this-system/ https://www.knaufinsulation.co.uk/media/news/benefits-of-rock-mineral-wool-insulation https://www.greengage-env.com/sustainability-benefits-cross-laminated-timber/
209
Sitography
list of figures
11
1. INTRODUCTION - P. 11-25
Fig 3: External spaces - MIND
Fig 4: Traditional Ground Level, MIND
Fig 5: Common Ground, MIND
Fig 6: Bicycle roads, MIND
Fig 7: West gate, MIND
Fig 8: Map of Expo 2015 Site,Arexpo
Fig 9: Map of Expo 2015 Site, MIND
Fig 10: Unimi,Carlo Ratti Associati
Fig 11: The Italian Pavilion, Expo 2015, Inexhibit
Fig 12: The three of life, Arexpo
Fig 13: Functional Map with anchor buildings - MIND
Fig 14: Galeazzi Hospital, MIND
Fig 15: Innovation Hub, MIND
Fig 16: WG Common Ground, MIND
Fig 17: Human Technopole, MIND
Fig 18: Zenith Multipurpose Building, MIND
Fig 19: WG Common Ground, MIND
Fig 20: Horizon Retail Building, MIND
Fig 21: Residential Building, MIND
Fig 22: WG Common Ground, MIND
Fig 23: 3D view, MIND
Fig 24: Transport Insfracture,MIND, Systematica
Fig 25: West Gate visualization, MIND
Fig 26: Map of West Gate site with surrounding, MIND
2. URBAN STRATEGY - P.27-47
Fig 27: Urban cut, Authors
Fig 28: Grids, MIND, Authors
Fig 29: Blocks, MIND, Authors
Fig 30: Greenery, MIND, Authors
Fig 31: Roads, MIND, Authors
Fig 32: Buildings,MIND, Authors
Fig 33: Perimeter,MIND, Authors
Fig 34: Morphology map (1956) ,MIND, Authors
Fig 35: Morphology map (1972) ,MIND, Authors
Fig 36: Morphology map (2021) ,MIND, Authors
Fig 37: MIND, Mindvillage
Fig 38: Decumano,Authors
Fig 39: Bridge-Water, Authors
Fig 40: Human Technopole, Authors
Fig 41: Bridge, Authors
Fig 42: Grids, MIND, Authors
Fig 43: Greenery, MIND, Authors
Fig 44: Blocks, MIND, Authors
Fig 45: Buildings, MIND, Authors
Fig 46: Accesibility, East Gate, Authors
Fig 47: Greenery, East Gate, Authors
Fig 48: Built-Unbuilt, East Gate, Authors
Fig 49: Functions, East Gate, Authors
Fig 50: Masterplan , Authors
211
List of figures
Fig 51: Perspective, Master Plan, Authors
Fig 52: Zones, Master Plan, Authors
Fig 53: View from sports area, Authors
Fig 54: View from digital part, Authors
Fig 55: View from event space, Authors
Fig 56: Axonometry,Research Center for Natural Sciences, Authors
Fig 57: Digital Park, Master Plan, Authors
Fig 58: Sport Facilities, Master Plan, Authors
Fig 59: Event area, Master Plan, Authors
Fig 60: Park, Sasaki
Fig 61: Waterfront, Sasaki
Fig 62: Open space, Sasaki
Fig 63: Library Walk, PWP
Fig 64: Library Walk, PWP
Fig 65: Library Walk, PWP
Fig 66: Waterfront, Rogers Stirk Harbour Partners
Fig 67: Yard, Rogers Stirk Harbour Partners
Fig 68: Waterfront, Rogers Stirk Harbour Partners
Fig 69: Relaxing area,InsideOutside
Fig 70: Park,InsideOutside
Fig 71: Nature Park,InsideOutside
3. BUILDING DESIGN - P. 49-115
Fig 72: Morphology diagram, Authors
Fig 73: Axonometry, Authors
Fig 74: Exterior Render
Fig 75: Accessibility, Authors
Fig 76: Accessibility, Authors
Fig 77: Exploded Axonometry, Authors
Fig 78:U.F. function layout Authors
Fig 79: G.F. function layout, Authors
Fig 80:First Floor function layout, Authors
Fig 81:S.F. function layout Authors
Fig 82: function layout Authors
Fig 83:Th. F. function layout Authors
Fig 84: Perspective of the recreational area Authors
Fig 85: Section A-A, Authors
Fig 86: Section C-C, Authors
Fig 87: Ground Floor Plan, Novartis Campus
Fig 88: Section, Novartis Campus
Fig 89: Section, Research Lab for Natural Sciences, Authors
Fig 90: Section, Novartis Campus
Fig 91: Building sketch, Novartis Campus
Fig 92: Diagramatic plan schemes, Research Lab Center, Authors
Fig 93: Lombardia Region Headquarters - Mario Cucinella , Foster + Partners
Fig 94: Section,Lombardia Region Headquarters - Mario Cucinella , Foster + Partners
Fig 95: 3D, Research Lab for Natural Sciences,Authors
Fig 96: Municipality of Piacenza , MCA
212 List of figures
Fig 97: Municipality of Piacenza , MCA
Fig 98: Municipality of Piacenza , MCA
Fig 99 - Ground Floor Plan, Authors
Fig 100 - Entrance render, Authors
Fig 101 - Co-working axonometry, Authors
Fig 102 - Common Space: Co-Working Spaces, Authors
Fig 103 - Recreation area axonometry, Authors
Fig 104 - Restaurant and Library, Authors
Fig 105 - Interior render of co-working , Authors
Fig 106 - Interior render of library , Authors
Fig 107 - Render of the exhibition and lounge area, Authors
Fig 108 - First floor plan , Authors
Fig 109 - Axonometry of the exhibition and lounge area , Authors
Fig 110 - First Floor zoom-in, Authors
Fig 111 - Co-working space render, Authors
Fig 112 - Second floor plan, Authors
Fig 112 - Second floor plan, Authors
Fig 113 - Perspective section of the south wing, Authors
Fig 114: Salk Institude, Louis Kahn
Fig 115: Chemical laboratory, 1765 / S.Henning
Fig 116: Liebig`s teaching laboratory
Fig 117: Salk Institude, Louis Kahn
Fig 118: Salk Institude,Louis Kahn
Fig 119: Salk Institude,Louis Kahn
Fig 120: Salk Institude,Louis Kahn
Fig 121 Salk Institude, Louis Kahn
Fig 122 Stairs, Salk Institude, Louis Kahn
Fig 123 PLan, Salk Institude, Louis Kahn
Fig 124: Salk Institude, Louis Kahn
Fig 125: Max Planck Institute of Biophysics, Auer+Weber+Partners
Fig 126: Max Planck Institute of Biophysics, Auer+Weber+Partners
Fig 128: Max Planck Institute of Biophysics, Auer+Weber+Partners
Fig 129: Max Planck Institute of Biophysics, Auer+Weber+Partners
Fig 130: Section, Max Planck Institute of Biophysics Auer+Weber+Partners
Fig 131: Cool RM/CT Cabinets
Fig 132: Entry/Exit
Fig 133: Wet/Dry Lab modules
Fig 134: Office
Fig 135: Single Corridor, Braun Griffin
Fig 136: Molecular Biology Laboratory, Gromling B.
Fig 137: Chemical Laboratory, Gromling B.
Fig 138: Physical Laboratory, Gromling B.
Fig 139: Molecular Biology Laboratory, Gromling B.
Fig 140: Chemical Laboratory, Gromling B.
Fig 141: Physical Laboratory, Gromling B.
Fig 142: Exploded axonometry diagram , Authors
Fig 143: Plan Diagram of Labs, Authors
Fig 144: Plan Diagram of Labs, Authors
Fig 145: Plan Diagram of Labs Authors
213 List of figures
Fig 146: Function diagram, Type 1, Authors
Fig 147: Function diagram, Type 2.1, Authors
Fig 148: Function diagram, Type 2.2, Authors
Fig 149 : Lab Type 1 Plan , Authors
Fig 150 : Type 1 Axonometry,Authors
Fig 151 : Lab Type 2 Plan, Authors
Fig 152: Interior render of the laboratory type 2, Authors
Fig 153: Type 2.2 Axonometry, Authors
Fig 154 : Type 2 Axonometry, Authors
Fig 155 : Type 2 Axonometry, Authors
Fig 156 : Laboratory visualization, Authors
Fig 157 - Render of the overhanging volume, Authors
Fig 158 - Third Floor Plan, Authors
Fig 159 - Axonometry of the auditorium, Authors
Fig 160 - Third Floor, Authors
Fig 161 - Third Floor, Authors
Fig 162 - East Elevation, Authors
Fig 163 - West Elevation, Authors
Fig 164: Facade Exploded Axonometry, Authors
Fig 165: Facade Reference
Fig 166: Facade Reference
Fig 167 - North Elevation, Authors
Fig 168 - Southern Elevation, Authors
Fig 169: Exploded facade axonometry, Authors
Fig 170 - Exterior render, Authors
Fig 171: Fourth Floor Plan, Authors
Fig 172: Roof Visualization, Authors
Fig 173: Roof organization diagram, Authors
Fig 174: Roof Axonometry, Authors
Fig. 175 - Exterior render of the ramp and building, Authors
Fig. 176 - Section B-B`, Authors
4. STRUCTURAL DESIGN - P. 117-149
Fig 177: Structural Axonometry, Authors
Fig 178: Wooden structure connection, Authors
Fig 179: Structural Axonometry, Authors
Fig 179.a: Roof Section, Authors
Fig 180: Grid load distribution, Authors
Fig 181: Grid load distribution, Authors
Fig 182: Schematic floor framing system, Authors
Fig 183: Beam to beam connection
Fig 184: CLT - Column Design, Authors
Fig 185: Load on column, Authors
Fig 186: Structural floor design, Authors
Fig 186.a: CLT beam to concrete wall connection
Fig 187: CLT beam to column connection, Authors
Fig 188: Structural section, Authors
Fig 189: Foundation detail, Authors
Fig 190: Ground floor detail, Authors
Fig 191: Typical floor detail, Authors
Fig 192: Typical structural floor plan, Authors
Fig 193: Structural axonometry, Authors
Fig 194: Detail structural connection , Authors
Fig 195: Detail structural connection, Authors
214
Fig 195: Detail structural connection, Authors
Fig 196: Section, Authors
Fig 197: Facade, Authors
Fig 197.a: Section Authors
Fig 198: Cantilever render, Authors
Fig 199: Cantilever structural axonometry , Authors
Fig 200: Total load diagram, Authors
Fig 201 Exploded structural axonometry, Authors
Fig 202: Reaction forces, Authors
Fig 203: Deflection analysis, Authors
Fig 203.a: Shear forces, Authors
Fig 203.a: Stress analysis, Authors
Fig 204: Third floor structural plan, Authors
Fig 205: Structural detail plan, Authors
Fig 206: Structural connection detail, Authors
Fig 207: Structural connection detail , Authors
Fig 208: Structural connection detail, Authors
Fig 209: Cantilever section , Authors
Fig 210: Detail, Authors
Fig 211: Detail, Authors
Fig 212: Section, Authors
5. SERVICE DESIGN - p. 151-183
Fig 213: Concept drawing of HVAC, Authors
Fig 214: Underground concept, Authors
Fig 215: Roof axonometry, Authors
Fig 216: Facade type
Fig 217: Heat pump
Fig 218: Air handling unit
Fig 219: Axonometry of HVAC, Authors
Fig 220: Exploded Axonometry of ground floor and first floor, Authors
Fig 221: HVAC plan, Authors
Fig 222: Grill type
Fig 223: Exploded axonometry of second floor, Authors
Fig 224: Type of grill used
Fig 225: Detailed plan of laboratory HVAC, Authors
Fig 226: Section of the laboratory
Fig 227: Exploded axonometry of third and fourth floor, Authors
Fig 228: Plan of the auditorium HVAC, Authors
Fig 229: Axonometry of toilet, Authors
Fig 230: Vertical piping diagram
Fig 231: HVAC section, Authors
Fig 232: Toilet plumbing scheme, Authors
Fig 233: Toilet plumbing scheme, Authors
Fig 234: Toilet plumbing scheme, Authors
Fig 235: Plumbing legend, Authors
Fig 236: Services ceiling plan Ground floor, Authors
Fig 237: Services ceiling plan first floor, Authors
Fig 238: Services ceiling plan Ground floor, Authors
Fig 239: Cross services section, Authors
Fig 240: Longitudinal services section, Authors
Fig 241: Services ceiling plan Ground floor, Authors
Fig 242: Services ceiling plan first floor, Authors
215 List of figures
6. SUSTAINABLE DESIGN -
Fig 243: Sustainability Loop , Authors
Fig 244: LCA Loop , Authors
Fig 245: Map of Milan, Author
p. 185-200
Fig 275: 3D Axonometry , Authors
Fig 276: 3D Axonometry , Authors
Fig 277: 3D Axonometry , Authors
Fig 278: 3D Axonometry , Authors
Fig 246: Weather Data Summary, Climate Consultant, Authors
Fig 247: Mounthly Diurnal Averages, Climate Consultant, Authors
Fig 248: Sun shading chart, Climate Consultant, Authors
Fig 249: Radiation Range, Climate Consultant, Authors
Fig 250: Radiation Range, Climate Consultant, Authors
Fig 251: Physhrometric Chart, Climate Consultant, Authors
Fig 252: 3D Solar Axonometry, Authors
Fig 253: 3D Solar Axonometry, Authors
Fig 254: 3D Solar Axonometry
Fig 255: Ground Floor, Authors
Fig 256: Ground Floor, Authors
Fig 257: Ground Floor, Authors
Fig 258: First Floor, Authors
Fig 259: First Floor, Authors
Fig 260: First Floor, Authors
Fig 261: Second Floor, Authors
Fig 262: Second Floor, Authors
Fig 263: Second Floor, Authors
Fig 272: Structural Axonometry , Authors
Fig 273: Axonometric view, Authors
Fig 274: Axonometric view, Authors
Fig 279: 3D Axonometry , Authors
Fig 280: 3D Axonometry , Authors
Fig 281: Material list, Authors
Fig 282: Material list, Authors
216 List of figures
217