
SCIENCE
Helen Silvester
Victorian Curriculum
Oxford University Press is a department of the University of Oxford. It furthers the University’s objective of excellence in research, scholarship and education by publishing worldwide. Oxford is a registered trademark of Oxford University Press in the UK and in certain other countries.
Published in Australia by Oxford University Press
Level 8, 737 Bourke Street, Docklands, Victoria 3008, Australia.
© Helen Silvester 2025
The moral rights of the author/s have been asserted.
First published 2016 Third edition
All rights reserved. No part of this publication may be reproduced, stored in a retrieval system, transmitted, used for text and data mining, or used for training artificial intelligence, in any form or by any means, without the prior permission in writing of Oxford University Press, or as expressly permitted by law, by licence or under terms agreed with the appropriate reprographics rights organization. Enquiries concerning reproduction outside the scope of the above should be sent to the Rights Department, Oxford University Press, at the address above. You must not circulate this work in any other form and you must impose this same condition on any acquirer.
ISBN: 978 0 1903 5034 5
Reproduction and communication for educational purposes
The Australian Copyright Act 1968 (the Act) allows educational institutions that are covered by remuneration arrangements with Copyright Agency to reproduce and communicate certain material for educational purposes. For more information, see copyright.com.au.
Edited by Lorna Hendry
Typeset by Q2A Media Services Pvt. Ltd., Noida, India
Proofread by Jess Ni Chuinn
Indexed by Puddingburn Publishing Services
Printed in Singapore by Markono Print Media Pte Ltd
Oxford University Press Australia & New Zealand is committed to sourcing paper responsibly.
Disclaimer
Links to third party websites are provided by Oxford in good faith and for information only. Oxford disclaims any responsibility for the materials contained in any third party website referenced in this work.
DRAFT
Acknowledgement of Country
Oxford University Press acknowledges the Traditional Owners of the many lands on which we create and share our learning resources. We acknowledge the Traditional Owners as the original storytellers, teachers and students of this land we call Australia. We pay our respects to Elders, past and present, for the ways in which they have enabled the teachings of their rich cultures and knowledge systems to be shared for millennia.
Warning
Aboriginal and Torres Strait Islander readers are advised that this book (and the resources that support it) may contain the names, images, stories and voices of deceased persons.
Non-Indigenous readers should be aware that for some Aboriginal and Torres Strait Islander communities, showing the names and photographs of deceased persons may cause sadness or distress and, in some cases, be contrary to cultural protocols.

Printer please replace with your FSC logo

1.4
1.5 Skills
2.9 Experiment: Dissecting
2.11 Vertebrates
3.1 All
3.3 All organisms have a role in an ecosystem
3.4 Experiment: What if more seeds were planted in a pot?
3.5 Energy flows through an ecosystem
3.6 Challenge: Exploring leaf litter
3.7 Population size depends on abiotic and biotic factors
3.8 Challenge: Bead counting
3.9 Introducing a new species may disrupt a food web
3.10 Challenge: Rabbit and fox chasey
3.11 Experiment: What if the effectiveness of pollinators was reduced?
3.12 Ecosystems can be disrupted
3.13 Science as a human endeavour: Human management of ecosystems continues to change
3.14 Challenge: Eucalypt adaptations
Module 4 Resources
4.1 Resources on Earth take different times to renew
4.2 Easily renewable resources can be quickly replaced
4.3 Challenge: Can you increase the output of a
4.4 Easily renewable resources can be harnessed to provide
4.5 Challenge: Can you increase the power of solar cells?
4.6 Some resources are limited.....................................................................................................................................186
4.7 Experiment: What if a metal was obtained
4.8 Soil
4.9 Experiment:

5.1
5.2 The
5.4
5.5 Seasons
6.1
6.2 Experiment:
6.3
6.4
6.5 Magnetic
6.6 Electrostatic
6.7 Experiment: What
6.8 Earth’s
6.9 Experiment: Making a parachute
6.10 Experiment: Dropping
6.11 Gravity affects all objects in
6.12 Friction slows
6.13 Experiment:
6.14 A
6.15 Experiment: Using a first-class lever to lift masses
6.16 Experiment: Using a second-class lever to lift masses
6.17 A pulley changes the size or direction of a force
6.18 Experiment: Calculating mechanical advantage
6.19 There are different types of machines
6.20 Experiment: Comparing different machines
6.21 Science as a human endeavour: The forces in flight
6.22 Experiment: Comparing the forces in flight
6.23 Science as a human endeavour: Forces are involved in sport
7.1 There are three states of matter
7.2 Experiment: Comparing states of matter
7.3 Scientists’ understanding of matter has developed over thousands of years
7.4 The
7.5 The
7.6 Experiment: The density den
7.7 Increasing kinetic energy in matter causes it to
7.8 Experiment: Effect of heat
7.9 Experiment: From ice to
7.10 Science
a
8.1 Mixtures are a combination of
8.2 Challenge: Comparing different types of mixtures
8.3 A solution is a solute dissolved in a solvent
8.4 Experiment: What if salt was dissolved in water?
8.5 Experiment: What if the solvent was heated when making a mixture?
8.6 Mixtures can be separated according to their properties
8.7 Experiment: What if a flocculant was added to muddy water?.......................................................................354
8.8 Mixtures can be separated according to their size and mass
8.9 Experiment: What if you centrifuge tomato sauce?
8.10 The boiling points of liquids can be used
8.11 Experiment: Crystallisation of
8.12 Challenge: Design a way to purify water from
8.13 Solubility can be used to separate mixtures
8.14 Challenge: Separation challenge
8.15 Experiment: Who wrote the nasty note?
8.16 Science as a human endeavour: Wastewater is a mixture that can be separated
as a human endeavour: Materials recovery facilities separate mixtures
Lessons available exclusively on Oxford digital.
Introducing Oxford Science 7 Victorian Curriculum (Third
edition)
Congratulations on choosing Oxford Science 7 Victorian Curriculum (Third edition) as part of your studies this year!
Oxford Science 7 Victorian Curriculum (Third edition) has been purpose-written to meet the requirements of the Victorian Curriculum Version 2.0 Science. It includes a range of flexible print and digital products to suit your school and incorporates a wide variety of features designed to make learning fun, purposeful and accessible to all students!
Key features of Student Books
The Science toolkit is a standalone module t hat explicitly teaches important Science inquiry skills. The Aboriginal and Torres Strait Islander Histories and Cultures cross-curriculum priority is addressed in both standalone lessons and within other lessons.
In each core lesson:
• a concept statement summarises the key concept in one sentence
• key ideas are summarised in succinct dot points
• key terms are bolded in blue text, with a glossary definition provided in the margin a set of check your learning questions are aligned to the learning intentions for the lesson.
Scientists


Lesson 1.2


Science as a human endeavour lessons explore real world examples and case studies, allowing students to apply science understanding.


The Test your skills and capabilities section provides scaffolded opportunities for students to apply their science understanding while developing skills and capabilities.


DRAFT
Practical activities appear within each module, directly after the core lesson they relate to. Additional activities are provided through Oxford Digital.
Challenges, Skills labs and Experiments provide students with opportunities to use problem-solving and critical thinking, and apply science inquiry skills.
For a complete overview of all the features and benefits of this Student Book: >activate your digital access (using the instructions on the inside front cover of this book) and click on “Introducing
(Third edition)” in the Course menu.
Key features of
Oxford Digital has been designed in consultation with Australian teachers for Australian classrooms. The new platform delivers fully accessible, reflowable course content with videos, autoand teacher-marked activities, interactives and more embedded right where you need them. There’s also a range of unique features designed to improve learning outcomes.


DRAFT
As a student, you can:
> v iew all Student Book content in a fully accessible, reflowable format that’s delivered in bite-sized chunks so you can work at your own pace
> use the “Read to me” button to have any part of the course read aloud to you
> highlight, take notes, bookmark pages, or define words with the built-in Australian Oxford Dictionary
> watch hundreds of concise key content videos to help you revise anything you don’t understand, catch up on things you’ve missed, or help you with your homework
> complete hundreds of interactive questions and quizzes as you work through the content and get the answers and results sent to you.
viii Oxford Science 7 Victorian Curriculum Oxford University Press
As a teacher, you can:
> elevate your teaching and reduce planning and preparation time with Live Lesson mode This is an Australian first that lets you upgrade from traditional print-based lesson plans to fully interactive, perfectly sequenced and timed interactive lessons complete with classroom activities that are ready to go
> personalise learning for every student and differentiate content based on student strengths and weaknesses. Assign support or extension resources to any student using a range of differentiation resources
> begin every lesson with ready-made learning intentions and success criteria
> revolutionise your planning, marking and reporting with powerful analytics on s tudent performance and progress.
DRAFT
• A ssessment report shows how students are performing in each online interactive assessment, providing feedback for teachers about areas of understanding

• Curriculum report summarises student performance against specific curriculum content descriptors and curriculum codes For a complete overview of all the features and benefits of Oxford Digital: >activate your digital access (using the instructions on the inside front cover of this book) and click on “Introducing Oxford Science 7 Victorian Curriculum (Third edition)” in the Course menu.

Module 1 Science toolkit

Overview
Scientists are curious about the world around them! They investigate how and why things work. To do this, they make observations, ask questions, form hypotheses and conduct experiments to test their ideas. Scientists gather information and organise it into charts or graphs so they can look for patterns and check for mistakes. They use evidence to support their conclusions so they can explain what they found in a way that’s easy for others to understand. This process is known as the scientific method.
DRAFT
This Science toolkit includes all the content you need to learn as part of the Science Inquiry substrand of the Victorian Curriculum Version 2.0. You’ll be learning and developing these skills across Years 7 and 8, so some of the lessons in this module also appear in Year 8 so you can revise them.

Lesson in this module:
Lesson 1.1 Science is the study of the natural and physical world (page 4)
Lesson 1.2 Scientists value the knowledge and skills of Aboriginal and Torres Strait Islander Peoples (page 7)
Lesson 1.3 Scientists follow the scientific method (page 12)
Lesson 1.4 Scientists make observations and ask questions (page 17)
DRAFT
Lesson 1.5 Skills lab: Using your senses to make observations (page 21)
Lesson 1.6 Scientists form hypotheses that can be tested (page 23)
Lesson 1.7 Skills lab: Using a question to form a hypothesis (page 27)
Lesson 1.8 Scientists plan and conduct experiments (page 28)
Lesson 1.9 Scientists always take safety precautions (page 32)
Lesson 1.10 Scientists use specialised equipment (page 36)
Lesson 1.11 Skills lab: Drawing scientific diagrams (page 39)
Lesson 1.12 A Bunsen burner is an essential piece of laboratory equipment (page 40)
Lesson 1.13 Skills lab: Lighting and using a Bunsen burner (page 42)
Lesson 1.14 Scientists measure and record data accurately (page 44)
Lesson 1.15 Skills lab: Measuring mass and volume (page 50)
Lesson 1.16 Scientists use tables, graphs and models to record and analyse data (page 51)
Lesson 1.17 Skills lab: Heating water to record and analyse the results (page 58)
Lesson 1.18 Scientists evaluate claims and results (page 59)
Lesson 1.19 Scientific reports communicate findings (page 63)
Lesson 1.20 Skills lab: Egg bungy jump experiment – Can an egg survive a controlled fall? (page 67)
Lesson 1.21 Command terms help identify tasks and communicate responses (page 69)
Lesson 1.22 Review: Science toolkit (page 72)
Learning intentions and success criteria
Lesson 1.1
Science is the study of the natural and physical world
Key ideas
→ Science is the study of the natural and physical worlds.
→ Science measures what we observe (e.g. see, hear, smell and feel) and organises it into testable explanations.
→ Scientists have jobs that focus on asking questions and finding answers.
→ Some scientists work in a laboratory; many scientists work in teams.
science the study of the natural and physical world
natural world all living things in the world around us, including ecosystems and natural phenomena (e.g. plants, animals, oceans, ecosystems, weather patterns) physical world all non-living things in the world around us, including the forces acting upon them (e.g. rocks, planets, energy, matter, and forces such as gravity and magnetism)
scientist a person who studies the natural and physical world
DRAFT
philosopher a “lover of knowledge”; someone who studies ideas, theories and questions
→ Scientists answer questions by observing, recording and interpreting what they find.
Science is a quest for knowledge
Science is the study of the natural world and the physical world. In other words, all of the living and non-living things in the world around us. The word “science” actually comes from the Latin word scientia – meaning “knowledge” – so science is really just the quest for knowledge
Scientists are curious people. Many scientific discoveries in the past started with one person who was curious about something. The world today would be a very different place if scientists of the past hadn’t asked questions like “How does this work?” and “Why is this so?”
Curiosity about the world can be motivated by many different things.
Tens of thousands of years ago, the first humans were curious out of necessity. They had to discover, through trial and error, which foods were edible and which were poisonous. They also had to experiment with making fire, building shelter and treating injuries. This curiosity was driven by a need to survive, and could have life-or-death results.
Curiosity can also come from the desire to know more. In Ancient Greece, people were curious to know more about the Sun, the Moon, the stars and our own planet. Early scientists were not called scientists at all – they were called “natural philosophers” because of their interest in studying nature (Figure 1). Philosopher means “lover of knowledge”. Natural philosophers used their observations to develop calendars, to locate Earth in the universe and to show that Earth is round, not flat.
Curiosity can also be driven by a desire to solve problems that affect individuals, communities, countries or the entire planet. Many of the great advances in medicine,

1 Early scientists were called “natural philosophers”.
philosophers used their observations to develop calendars and to show that Earth is round, not flat.
Figure
Natural
such as the discovery of penicillin or the creation of vaccinations to prevent serious diseases, are the result of years of scientific research. Scientific discoveries have changed our lives, mostly for the better. Science is in the news every day (Figure 2). Some important issues that scientists are curious about right now include:
Scientists find cause of disease outbreak
Scientists create tsunami warning system
Scientists develop cervical cancer vaccine Scientist awarded Australian of the Year
Figure 2 Curiosity about the world around us has resulted in many scientific discoveries
• d iscovering new energy sources that are cleaner and greener for the planet
• i mproving access to clean drinking water and food sources to support the world’s growing population
• developing treatments and cures for a range of viruses and deadly diseases (such as the Influenza virus, Ebola virus or corona viruses).
• exploring space travel and investigating the possibility of life on other planets
• i nvestigating whether the human brain could one day be replaced by artificial intelligence.
There are many branches of science
Science measures what we observe around us – see, hear, smell and feel – and tries to explain what is happening. You will learn about the four main branches of science this year. These are listed in Table 1 with information about each one and a list of topics you will study in this course.
Table 1 There are four main branches of science. This year you will be learning about each of them.
What is it?
What careers are there in this branch of science?
What questions do these scientists ask?
The study of living things, including their life processes, growth and characteristics
• Biologist
• E ntomologist
• M arine biologist (Figure 3)
• W hat plants could we grow in space?
• How will rising sea levels affect the Great Barrier Reef?
What topics will I be studying in this course?
• Module 2 Classification (page 78)
• Module 3 Ecosystems (page 122)
The study of Earth’s systems and its place in the universe
• G eologist
• Volcanologist
• A stronomer
• Palaeontologist (Figure 4)
• W hat can dinosaur fossils tell us about modern life on Earth?
• W hat do geological records tell us about climate change?
• Module 4 Resources (page 170)
• Module 5 Earth, Sun and Moon (page 204)
The study of matter, motion, force and energy, including how they interact with each other
• P hysicist
• Mechanical engineer
• E lectrical engineer (Figure 5)
• How can we keep our homes warm or cool?
• W hy does gravity exist?
• Module 6 Forces (page 234)
The study of what things are made of and how they change when they interact with each other
• C hemist
• Biochemist
• Forensic scientist
• P harmacologist (Figure 6)
• W hat type of material would be best for making solar panels?
• How can we make better batteries?
• Module 7 Particle theory (page 300)
• Module 8 Mixtures (page 338)
Within each branch of science, there are many different types of careers and roles for different scientists. Scientists often dedicate many years of study to specialise in one particular area, but many roles require scientists to use and apply knowledge from many branches of science at the same time.
Science is an ever-expanding search for knowledge and, as you will learn this year, there is a lot more for us to learn. Welcome to the amazing world of science!


Check your learning 1.1
Check your learning 1.1
Retrieve
1 Identify the name given to the early scientists.
2 Define the term “science” in your own words.
Comprehend
3 Describe one reason why being curious and asking questions is important in science.
4 Describe an idea or invention that has been developed in your lifetime due to science.
Analyse

DRAFT
5 Scientists claim that “there are more than four branches of science”. Evaluate this statement (by using the examples and

definitions in Table 1 to show how one type of scientific research might fit into more than one branch of science) and justify whether you think this statement is true or false.
Apply
6 L ook carefully at Figure 3.
a P ropose a possible question about coral reefs that the scientist may be investigating.
b Describe the risks that this type of research may have on: i t he scientist ii t he coral reef.
Figure 3 Marine biologists usually have a background in the branch of science called Biology.
Figure 4 Palaeontologists usually have a background in the branch of science called Earth and space science.
Figure 5 Electrical engineers usually have a background in the branch of science called Physics.
Figure 6 Pharmacologists usually have a background in the branch of science called Chemistry.
Lesson 1.2
Scientists value the knowledge and skills of Aboriginal and Torres Strait Islander Peoples
Key ideas
→ Aboriginal and Torres Strait Islander Peoples have developed sophisticated science skills that enabled them to survive and thrive some of the most challenging environments in the world for tens of thousands of years.
→ Indigenous science sees everything as connected – the land, water, plants, animals and people are all part of one big system that remains in balance.
→ The scientific knowledge and skills of Aboriginal and Torres Strait Islander Peoples is now recognised and valued by Western scientists.
Australia is home to many Aboriginal and Torres Strait Islander Peoples
Australia is home to over 250 different Aboriginal and Torres Strait Islander Peoples, each with their own culture, customs, language, laws and knowledge systems.
Aboriginal and Torres Strait Islander Peoples – also known as First Nations Peoples – have lived in Australia and the islands of the Torres Strait for at least 60,000 years, making them the oldest surviving cultures in the world. Aboriginal and Torres Strait Islander cultures in Australia are incredibly rich and diverse. Although these groups are different and distinct, they share a deep connection to Country.
The scientific knowledge and skills of Aboriginal and Torres Strait Islander Peoples developed as part of their connection to Country over tens of thousands of years. They cover a wide range of areas, such as:
• detailed local knowledge of weather patterns, seasons and tides (Figure 1)
• k nowledge of the stars and astronomy
• bush food, medicine and healing
• detailed knowledge natural resources and how to manage them sustainably
• t he physics required to design, make and use a variety of tools.
The knowledge and traditions of Aboriginal and Torres Strait Islander Peoples suffered significantly after the English colonised Australia from 1788. Over many decades, government policies have had a devastating impact on Aboriginal and Torres Strait Islander Peoples. These policies have directly (and indirectly) removed people from their traditional lands, broken families up and prevented culture, knowledge, skills and language from being passed down from generation to generation. This includes passing down scientific knowledge and skills.
Learning intentions and success criteria
Country a term used by Aboriginal and Torres Strait Islander Peoples to describe the connections between land, water, sky, animals, plants, people, stories, songs, cultural practices and spiritual beliefs that make up a traditional area
The
Despite the negative impacts of colonisation, the cultures, languages, beliefs, knowledge and skills of Aboriginal and Torres Strait Islander Peoples have survived and are still practised today. In fact, this knowledge is gaining recognition for its scientific rigour and relevance to modern-day challenges such as climate change and sustainability.
Indigenous science
Aboriginal and Torres Strait Islander Peoples have developed sophisticated science skills that enabled them to survive and thrive some of the most challenging environments in the world for tens of thousands of years.
Over this time, Aboriginal and Torres Strait Islander Peoples created sophisticated systems for closely observing Country, identifying the similarities and differences between the individual parts and how they work together to create a balance. This approach to close observation, grouping and classification to identify patterns
Figure 1
Wurundjeri people of the Kulin Nation in Victoria identify seven seasons in their calendar. These seasons are marked by changes in the weather, the life cycles of plants and animals, and the position of the stars in the sky at night.
and balance has been passed down through storytelling that often models the consequences if balance is not maintained. Today, this body of knowledge and skills is referred to as Indigenous science
While Western science often relies on comparative testing, it is recognised that the Indigenous approach to science – observation, classification, identification and modelling – is a unique way to approach the investigation of the natural world that is place-specific, producing knowledge that is tailored to a particular environment.
The scientific knowledge and skills of Aboriginal and Torres Strait Islander Peoples is now recognised and valued by Western scientists. It is integral to current conversations and collaborations around some of the biggest scientific questions of today, such as sustainability, management of natural resources, food security and climate change.
Examples of Indigenous science
Aboriginal and Torres Strait Islander Peoples developed advanced scientific knowledge and skills that were integral to survival, cultural practices and management of the environment.
Astronomy
Aboriginal and Torres Strait Islander Peoples have a rich tradition of using the stars for navigation, timekeeping and cultural storytelling.
• Navigation: The stars, moon and constellations are used to navigate large distances across land and sea. For example, Torres Strait Islander Peoples use star maps for navigation at sea.
• Seasonal calendars: Many Aboriginal and Torres Strait Islander Peoples developed complex seasonal calendars based on the appearance of certain stars or constellations. For example, the Wardaman people of the Northern Territory associate the appearance of a star cluster known as the “Seven sisters” with the start of the wet season.
• P redicting events: Knowledge of lunar cycles and eclipses is used to predict environmental changes, such as tides and animal migrations.
Ecology and land management
Aboriginal and Torres Strait Islander Peoples developed sophisticated land and water management practices that have sustained ecosystems for thousands of years.
• Cultural burning: Aboriginal and Torres Strait Islander Peoples use controlled burning to manage landscapes, promote new growth and encourage biodiversity (Figure 2). This practice (also known as “cool burning” and “fire-stick farming”) has shaped Australia’s ecosystems.
DRAFT
Indigenous science a system of knowledge developed by Aboriginal and Torres Strait Islander Peoples over tens of thousands of years that combines careful observation and testing of the natural world with cultural understanding to explain how things work and are connected in nature
Western science a system of knowledge based on careful observation, measurement, testing, and experimentation (known as the scientific method) to develop and test hypothesis to explain how things work
• Using resources sustainably: Knowledge of plant and animal life cycles has ensured sustainable harvesting. For example, certain plants are only harvested at specific times to allow time for them to regrow.

Figure 2 Cultural burning in Kakadu National Park
• Water management: In dry regions, Aboriginal and Torres Strait Islander Peoples have developed techniques to locate and manage water sources, such as digging soakage wells or using natural indicators (e.g. bird behaviour) to find water.
Medicine
Aboriginal and Torres Strait Islander Peoples have an extensive knowledge of medicinal plants and healing practices, developed through observation and testing.
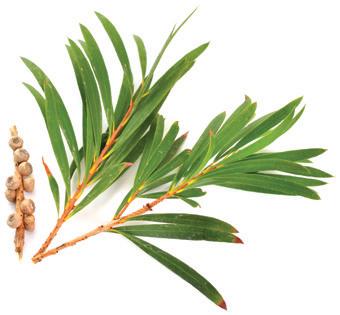
• P lant-based medicines: Plants like eucalyptus, tea tree and kangaroo apple are used for their antiseptic, anti-inflammatory and healing properties. For example, eucalyptus leaves are used to treat respiratory conditions. Aboriginal and Torres Strait Islander Peoples also understood the dosage and preparation of medicinal plants, such as boiling, crushing and infusing, to maximise their effectiveness.
• Healing practices: “Ngangkari” (traditional healers) of the Ngaanyatjarra, Pitjantjatjara and Yankunytjatjara lands (in the remote western desert of Central Australia) combined physical treatments with spiritual healing to set broken bones and care for wounds.
Engineering
Aboriginal and Torres Strait Islander Peoples developed tools, structures and technologies suited to their environments.
• Tools and weapons: Boomerangs, spears and spear-throwers were designed using principles of aerodynamics and physics. Boomerangs, for example, were crafted to return to the thrower or travel long distances, depending on their purpose (Figure 4)
• Fish traps and aquaculture: The Gunditjmara people of Victoria created traps and dug channels to catch and farm eels at Budj Bim Cultural Landscape – a UNESCO World Heritage site near Warrnambool in western Victoria (Figure 5).


Figure 3 Tea tree (Melaleuca) leaves and seeds are used for their antiseptic, antiinflammatory and healing properties.
Figure 5 The Gunditjmara people of Victoria dug channels (shown here) to catch and farm eels at Budj Bim Cultural Landscape (near Warrnambool in western Victoria). These channels are at least 6,600 years old.
Figure 4 Boomerangs, spears and spear-throwers –like those of the Luritja and Pertame Peoples in Central Australia – were designed using principles of aerodynamics and physics.
• Housing and shelter : Structures like bark huts, stone houses and windbreaks were designed for insulation, ventilation and protection from the elements, reflecting an understanding of materials science and environmental conditions.
Agriculture
Aboriginal and Torres Strait Islander Peoples practised sustainable agriculture and developed methods to store and preserve food.
• Cultivation: Evidence suggests that some Aboriginal and Torres Strait Islander Peoples in Victoria and New South Wales, cultivated yams, grains and other plants. Grinding stones dating back 30,000 years indicate the processing of seeds and grains.
• Food preparation: Techniques like roasting, crushing and soaking were used to treat certain plants, such as cycads, so that toxins were removed, making them safe to eat (Figure 6).
• Food preparation and preservation: Smoking, drying and fermentation were used to preserve meat, fish and plants. For example, Torres Strait Islander Peoples preserved fish and dugong meat for long-term storage.
• Seasonal harvesting: Knowledge of seasonal cycles ensured that food resources were harvested sustainably, preventing overuse.

Different approaches, similar goals
Indigenous science and Western science both aim to understand the natural world, but they can use different paths to get there. Indigenous science sees everything as connected – the land, water, plants, animals and people are all part of one big system that remains in balance. Western science, on the other hand, has often broken things down into smaller parts to study them separately in controlled experiments before reconstructing the whole. Table 1 shows some of the different approaches taken by Indigenous and Western science to achieve similar goals and outcomes.
DRAFT
Indigenous science
• Passed down orally through stories, songs and direct teaching.
• K nowledge is integrated with cultural and spiritual systems.
• V iews everything as interconnected and part of one system.
• Methods are specific to local environments and contexts.
• K nowledge is developed and modelled in local environments by the whole community over generations.
• Focus is on understanding specific places and ecosystems in detail.
Western science
• Written down in formal documents, papers and textbooks.
• K nowledge is considered separate from cultural and spiritual systems.
• Focus is on breaking things down into separate parts to study them (e.g. fields such as Biology, Chemistry and Physics).
• Uses standardised methods that can be repeated anywhere.
• K nowledge is often developed by specialist experts in laboratories.
• Usually aims to find universal laws (rules that apply everywhere).
Figure 6 Aboriginal Peoples across Far North Queensland observed that the seeds and stems of cycad plants could be poisonous. They planned and conducted tests to discover ways to make them safe to eat.
Table 1 A comparison of Indigenous science and Western Science.
Check your learning 1.2
Check your learning 1.2
Retrieve
1 Define Indigenous science.
2 Identify one way in which Indigenous science is similar to Western science and one way in which it is different.
Comprehend
3 Describe why it is important to refer to Aboriginal and Torres Strait Islander Peoples as “Peoples” and not “people”.
4 Describe one example of Aboriginal and Torres Strait Islander Peoples observing the world.
5 Describe one example of an experiment that Aboriginal and Torres Strait Islander Peoples may have conducted thousands of years ago.
Lesson 1.3
6 Ex plain why it is important to communicate the results of an experiment to produce clean water or identify plants that are safe to eat.
Apply
7 Identify the Aboriginal and Torres Strait Islander nations in your local area. Carry out some research to investigate one or two examples of scientific knowledge and skills used by one or more of these groups.
DRAFT
8 C ompare and contrast two differences between Indigenous science and Western science. In your answer, use specific examples from both knowledge systems to support your comparison.
Scientists follow the scientific method
Key ideas
→ The scientific method is a framework that helps scientists figure out how things work by asking questions and testing ideas. It is an essential tool to guide scientific inquiry and research that is valid and reliable.
→ There are five stages to the scientific method.
→ Pseudoscience is a term used to describe theories, beliefs or claims that seem scientific but aren’t backed by any real evidence or results from experiments.
Introducing the scientific method
Being a scientist means that you need to use the scientific method. The scientific method is a framework that helps scientists figure out how things work by asking questions and testing ideas. It is an essential tool to guide scientific inquiry and research that is valid and reliable.
At each stage of scientific inquiry, the scientific method outlines what a scientist must do in order to ensure their findings can be trusted. It also helps scientists evaluate and test the claims and findings made by other scientists. This is known as “peer review”, and helps to ensure all scientific findings are valid .
There are five stages to the scientific method (Table 1). In this module, you will develop the science inquiry skills needed at each stage of the scientific method. These skills will ensure you can investigate ideas, solve problems, draw valid conclusions and develop evidence-based arguments.
validity a measure of how accurately a method measures what it is intended to measure
inference a conclusion based on evidence and reasoning hypothesis a proposed explanation for a prediction that can be tested
Stages of the scientific method
Stage 1: Questioning and predicting
Stage 2: Planning and conducting
Stage 3: Processing, modelling and analysing
What happens at each stage
A curious scientist has questions about the world. Observations lead to asking questions, making inferences and forming hypotheses to be tested.
Stage 4: Evaluating
There are many different ways to test a hypothesis. Scientists might make observations over time to describe an event or object. They might compare objects or events to identify similarities or differences. They could use information or data that already exists or design a controlled experiment to generate their own data. This approach allows them to collect and organise reliable information that can be trusted by everyone in the community.
Once the data has been collected, it must be checked to make sure it tells the full story of what has happened. Scientists look for patterns and trends that might show a predictable relationship.
Patterns in the data might provide evidence that the hypothesis is supported, so scientists need to process and analyse the data so they can create models that can be tested further.
Once the data has been processed and analysed, scientists need to compare the new information with the hypothesis or other experiments. Does it answer the original question? Does the information tell the same story as other scientific investigations? Can it be used to explain the original observations?
This process is different to processing and analysing data. Evaluating the science means that scientists must consider the accuracy and importance of their work. Scientific investigations can only be used to make decisions or design solutions to problems if they can be trusted.
Lessons in this module
• L esson 1.4 Scientists make observations and ask questions (page 17)
• L esson 1.5 Skills lab: Using your senses to make observations (page 21)
• L esson 1.6 Scientists form hypotheses that can be tested (page 23)
• L esson 1.7 Skills lab: Using a question to form a hypothesis (page 27)
• L esson 1.8 Scientists plan and conduct experiments (page 28)
• L esson 1.9 Scientists always take safety precautions (page 32)
• L esson 1.10 Scientists use specialised equipment (page 36)
• L esson 1.11 Skills lab: Drawing scientific diagrams (page 39)
• L esson 1.12 A Bunsen burner is an essential piece of laboratory equipment (page 40)
• L esson 1.13 Skills lab: Lighting and using a Bunsen burner (page 42)
• L esson 1.14 Scientists measure and record data accurately (page 44)
• L esson 1.15 Skills lab: Measuring mass and volume (page 50)
• L esson 1.16 Scientists use tables, graphs and models to record and analyse data (page 51)
• L esson 1.17 Skills lab: Heating water to record and analyse the results (page 58)
• L esson 1.18 Scientists evaluate claims and results (page 59)
Table 1 The five stages of the scientific method
Stages of the scientific method
What happens at each stage
Stage 5: Communicating The work of scientists is only important if people know about it. Consider the safety features of a car. Seatbelts, airbags and braking systems are only included in cars today because scientists communicated the results of their scientific process to car manufacturers and the public. Scientists must be able to explain what they do to many different audiences. Good science communication explains a complex scientific idea in simple language that everyone can understand. This allows science to influence environmental, social and economic change.
Lessons in this module
• L esson 1.19 Scientific reports communicate findings (page 63)
• L esson 1.21 Command terms help identify tasks and communicate responses (page 69)
DRAFT
As shown in Figure 1, the scientific method is often presented as a cycle because the results from one scientific inquiry can lead to new questions, prompting further investigation and greater understanding of the scientific explanations. This means scientists often loop back to earlier stages of the process to refine understanding and continue their research. Most of the time, science inquiry is not a linear progression where you simply follow steps once and reach a final result.
Why the scientific method is important
The scientific method is important for several reasons. It helps us tell the difference between claims that have reliable evidence and claims that have no evidence. Instead of guessing or believing rumours, scientists use the scientific method to test a claim. For example, if someone says
The Scientific Method
STAGE 1 Questioning and predicting
STAGE 2 Planning and conducting
STAGE 3 Processing, modelling and analysing
STAGE 4 Evaluating
STAGE 5 Communicating
Figure 1 The scientific method
“Eating carrots helps you see in the dark”, rather than just believing them, we can use the scientific method to check if this claim has evidence to support it.
It allows other people to check our work. When scientists do experiments, they write down exactly how they did everything. This means other scientists can try the same experiment to see if they get the same results. It’s like a very detailed recipe – anyone can follow it, and they should get similar results.
It teaches us to be curious and think critically. Instead of just accepting what we’re told, the scientific method encourages us to ask questions, look for evidence and come to our own conclusions based on careful observation and testing.
Pseudoscience
Pseudoscience is a term used to describe theories, beliefs or claims that seem scientific but aren’t backed by any real evidence or results from experiments (Table 2). The word “pseudo” (pronounced SYOO-doh) comes from an Ancient Greek word that means “false”.
Table 2 Common pseudosciences
Type of pseudoscience
Astrology
Crystal healing
Flat Earth idea
Description
The belief that the positions of stars and planets at the time of your birth determine your personality and future. While astronomy is a real science that studies planets and stars in the universe, astrology makes predictions without any scientific evidence.
The belief that different crystals have healing powers. Crystals are beautiful minerals that are studied by geologists, but there is no scientific evidence that they can cure illnesses or are beneficial to our health.
The belief that Earth is flat rather than spherical. This contradicts centuries of scientific observations, satellite imagery and physics.
Unlike real science, pseudoscience doesn’t follow the scientific method. This means it doesn’t involve carefully collecting evidence and testing ideas over and over. One example of a popular pseudoscience is astrology (Figure 2).
DRAFT
pseudoscience claims that are supposedly scientific but are made with no evidence to support them
Figure 2 Although many people enjoy reading their stars, astrology is a pseudoscience.
Check your learning 1.3
Check your learning 1.3
Retrieve
1 Identify the five stages of the scientific method.
2 Define the term “pseudoscience” and give one example of a pseudoscience.
Comprehend
3 Ex plain why it is so important for scientists to follow the scientific method.
4 Describe one idea or invention that has changed in your lifetime due to science.
Analyse
5 Compare (the differences between) these two stages in the scientific method: “Processing, analysing and modelling” and “Evaluating”.
Apply
6 It is often said that science is never “finished”. Evaluate this statement (by providing examples of science that are never finished and deciding if this statement is true).
7 L ook carefully at Figure 3.
a P ropose a possible question about the local environment that a Wurundjeri scientist may have investigated.
b Describe the investigation that the scientist may have completed to answer their question.
8 Research the prediction of your star sign for the next day or week. Evaluate the truth of this prediction (by identifying how many star signs there are, describing the number
and ages of people in the world that would be affected by this star sign and deciding if this prediction could be true for all these people).
Lesson 1.4 Scientists make observations and ask questions
Key ideas
→ Scientists use all their senses to observe the world around them (i.e. what they can see, hear, smell, taste and touch).
→ Scientists make observations, ask questions and make inferences (i.e. educated guesses).
→ Observations can be quantitative or qualitative.
The best way to learn is by observing
Following the scientific method means that all scientists follow the same general set of rules and processes when conducting inquiries and research. This helps to ensure that all scientific research and findings are based on careful testing and reliable evidence.
Stage 1 of the scientific method involves making observations, making inferences and asking questions (Figure 1).
Making observations
The skill of observation requires you to take notice of the world around you. Observation is how all good science starts. Before scientists can ask questions or try to solve problems, they need to first notice what is actually happening in the world. This includes making note of things that are the same, different or changing over time.
Figure 2 shows two illustrations. There are 10 differences between the two. Can you use your observation skills to identify them all?
Learning intentions and success criteria
Check the next lesson for a linked practical activity or experiment.
observation use of the senses to notice and gather information
STAGE 1 Questioning and predicting
Figure 1 Stage 1 of the scientific method is Questioning and predicting
DRAFT

All of your senses help you observe
When most people hear the word “observation”, they think of looking with their eyes, but the secret to making good observations is to use all five senses (Figure 3).
Observations can be quantitative or qualitative
Quantitative observations use numbers to describe the characteristics of something. As the name suggests, quantitative observations describe “quantities” (i.e. amounts). These quantities are usually accompanied by units that describe what is being measured (e.g. 2.7 m (metres) or 23°C (degrees Celsius)). Metres is a measure of length, and degrees Celsius is a measure of temperature. quantitative observation an observation that uses a number, such as a measurement
Figure 2 Use your observation skills to identify the 10 differences between the two illustrations.
Figure 3 The secret to making great observations as a scientist is to use all of your sense organs.
Qualitative observations use words to describe the characteristics of something. As the name suggests, qualitative observations describe “qualities” (i.e. characteristics). The five main sense organs of the human body are essential for qualitative observations. What you can see, hear, smell, taste and feel are important factors to include when making qualitative observations. “Rough”, “sour”, “sweet”, “clear” and “yellow” are examples of words you might use to describe the qualities of something being observed.
Making inferences
Once a scientist has made one or more observations, the next step is to make inferences and ask questions.
In science, observations use the senses (“I see/hear/ smell/feel/taste...”), while an inference is an educated guess (“I think...”) about something based on the clues or information you do have.
Making inferences is like being a detective who is trying to work out what happened at a crime scene by looking at all the evidence. If a house has been robbed and the detective has observed (“I see...”) that a window is broken and the glass is on the inside, the inference (“I think...”) is that the burglar broke in through that window.

Figure 4 A quantitative observation of this conical flask is that it contains 100 mL (millilitres) of liquid at a temperature of 23°C (degrees Celsius). A qualitative observation is that it contains a clear liquid that has a sweet smell.
An inference isn’t guaranteed to be correct, but the observations should provide supporting evidence for the idea.
Asking questions
Once you have made an inference, you can form a specific question about the thing you want to investigate (Table 1).
A scientific inquiry question should:
1 be specific enough to test
–I nstead of: “How do plants grow?”
–Try: “How does the amount of sunlight received by a tomato plant affect its growth rate?”
2 focus on something you can measure
–I nstead of: “What makes ice cream taste good?”
–Try: “How does freezing temperature affect the taste of ice cream?”
3 look at how one thing affects another
–I nstead of: “What happens to a cake when you bake it?”
–Try: “How does oven temperature affect how a cake rises?”
4 be something you can actually test
–I nstead of: “Why are dinosaurs extinct?”
–Try: “How old is the rock that has dinosaur fossils?”
qualitative observation an observation that uses words and is not based on measurements or other data inference a conclusion based on evidence and reasoning
Table 1 Examples of observations, inferences and questions that can be used to guide a scientific inquiry
Observation Inference
Your house smells like cooked onions when you get home from school.
A fabric feels like silk.
You see a man running down the street.
You hear a house alarm going off next door.
Lemon juice tastes sour.
Check your learning 1.4
Check your learning 1.4
Retrieve
I think we’re having cooked onions with dinner.
I think the fabric is either silk or something that feels very much like silk.
I think the man is either running away from something or running towards something.
I think someone has broken into my neighbour’s house.
I think lemons contain a kind of acid or something else that makes them sour.
Question
Are we having cooked onions for dinner?
Is this fabric silk?
Where is the man running to?
Is the neighbour’s house being robbed?
How much acid do lemons contain?
1 Define the term “observation”. Use an example to support your definition.
2 Define the term “inference”. Use an example to support your definition.
Comprehend
3 C lassify each of the following statements as observations or inferences.
a. You smell a strong odour from a garbage bin.
b. Coffee stays hotter if you add the milk before the hot water.
c. I measured the temperature today at 37°C.
d. It is so hot that the temperature must be 37°C.
e. There is a person in a Santa suit. It must be Christmas.
f. This soup is so hot that it hurts my teeth.
Apply
Observation Inference
4 Ex plain the differences between quantitative observations and qualitative observations.
5 Ex amine Table 1 and use the information provided to develop your own observation, inference and question. Present your response in the following format.
Question 1.4
Observation Inference
Lesson 1.5
Skills lab: Using your senses to make observations
Aim
To test how our senses can be used to make observations
What you need:
• Test-tube rack
• 3 or 4 corked test tubes wrapped in paper (so the contents cannot be seen)
• Variety of substances with strong smells (e.g. spices, coffee, fruit, hand cream)
• Variety of sensory objects (e.g. fruit, fabric, sandpaper, pen)
• Blindfold
What to do:
In this activity, you will be using your senses to make observations about the world around you. The four senses you will be using are:
• sight
• smell
• hearing
• touch.
Using sight to observe
The skill of observation needs you to notice small differences in what you see. Figure 1 shows two scenes that are almost identical. Can you find the eight differences between the two?
DRAFT

Using smell to observe
Your teacher will provide you with some test tubes lined up in a test-tube rack. Each test tube will be wrapped in paper to hide its contents. Gently wafting the air from each test tube towards your nose with your hand. Can you can identify the smells?

Figure 1 Use your sense of sight to identify the eight differences between these two pictures.
Figure 2 Use your sense of smell to identify the substances in the test tubes. Oxford University Press
Caution!
Never smell anything in a test tube unless your teacher specifically instructs you that it is safe to do so!
Using touch to observe
Sit at your desk and put on your blindfold. Your partner will pass you an object (e.g. a piece of fruit, a piece of sandpaper, some fabric). Use your sense of touch to describe each object. Compare the sensitivity of your fingertips to the sensitivity of the back of your hand.

Using hearing to observe
Sit at your desk and put on your blindfold. Your partner will make a few different sounds in front, beside or behind you (e.g. tapping the desk, clearing their throat, clicking their fingers). Can you identify what each sound is and what direction it is coming from?

DRAFT
Questions
1 Ex plain why your sense of taste is not tested in a science laboratory.
2 Ex plain why you used your hand to waft odours towards your nose.
3 Describe the differences in how each member of your team or class were able to sense each smell.
4 Ex plain why most scientists use their fingertips to feel an object rather than the back of their hand.
5 Compare the loudness of a sound made in front of you to the same sound made behind you.
6 Ex plain why scientists use equipment to measure their observations, where possible.
Figure 3 Use your sense of touch to identify the objects.
Figure 4 Use your sense of hearing to identify a number of different sounds and determine where they are coming from.
Lesson 1.6 Scientists form hypotheses that can be tested
Key ideas
→ A prediction is a specific statement about what you expect to observe when you try to answer your question. It is often written as an “If... then...” statement.
→ A hypothesis is a proposed scientific explanation for a question. It should try to explain why something happens based on previous observations, research or your reading on the topic.
Questions lead to hypotheses
Stage 1 of the scientific method involves questioning and predicting. Now that you have learned about how scientists observe and ask questions, we will learn about how they make predictions and form hypotheses (Figure 1).


Learning intentions and success criteria
DRAFT
Check the next lesson for a linked practical activity or experiment.


Figure 1 Stage 1 of the scientific method is Questioning and predicting
variable something that can affect the outcome or results of an experiment
Understanding the role of variables
Once a scientist has made an observation and decided on the inquiry question they want to investigate, it is time to make predictions and form a hypothesis to test. Before planning an experiment, they need to think about all of the things that might affect the result. These are known as variables. When a variable is changed, the results of the experiment might change.
Types of variables
Variables can be independent, dependent or controlled (Table 1).
• A n independent variable is the one thing you choose to change in your experiment. They are called “independent” because they don’t depend on anything else in an experiment or situation – they stand on their own.
prediction an outcome that is expected based on prior knowledge or observation
DRAFT
• A dependent variable is the thing you measure at the end of an experiment. They are called “dependent” because the results “depend” on the independent variable.
• C ontrolled variables are all the other factors that must be kept the same throughout your experiment. They are called “controlled” because you control them during the entire experiment.
Table 1 Different types of variables in an experiment
Experiment scenario
To test the growth rate of tomato plants, you choose three identical plants and change the amount of sunlight each one receives every day.
After two weeks, the height of the plants are different.
Any factors that aren’t related to the amount of sunlight the plants are receiving must be the same for all plants. This includes the:
• a mount of water they receive
• t ype of soil they are planted in
• room temperature
• levels of fertiliser in the soil
• size of the pots.
Type of variable
The number of hours of sunlight each plant receives every day is the independent variable.
The height of the tomato plants is the dependent variable.
These are all controlled variables.
Making predictions based on variables
A prediction is a specific statement about what you expect to observe when you try to answer your question. It is often written as an “If... then...” statement. When you understand the role a variable can play in the outcome of an experiment, you can ask “What if” questions. For example:
• W hat if a tomato plant receives 6 hours of sunlight a day?
• W hat if a tomato plant receives 12 hours of sunlight a day?
• W hat if a tomato plant receives 24 hours of sunlight a day?
Once you have chosen a “What if” question, you can turn it into a prediction by removing the “What” at the start and adding “then” at the end. For example:
• Q uestion: What if a tomato plant receives more hours of sunlight each day?
• P rediction: If a tomato plant receives 12 hours of sunlight each day, then it will grow taller than a plant that receives 6 hours of sunlight each day.
Based on your question, you can now make a prediction by:
• choosing one independent variable to change
• measuring the dependent variable
• managing all other controlled variables.
In this prediction, the independent variable is the amount of sunlight the plants receive, the dependent variable is the height of the plants, and everything else (water, temperature, type of plant) is controlled so that they are the same for all the plants (Figure 2).
Figure 2 To test the effect of different sunlight exposure on the growth rate of tomato plants, you need to control all other variables.
Forming hypotheses
A hypothesis is a proposed scientific explanation for your question. It should try to explain why something happens based on previous observations, research or your reading on the topic. It is often written as an “If... then... because…” statement. The “If... then...” part describes what you are testing, and the “because...” part describes why it should happened. For example:
• P rediction: If a tomato plant receives 12 hours of sunlight each day, then it will grow taller than a plant that receives 6 hours of sunlight each day
DRAFT
• Hypothesis: If a tomato plant receives 12 hours of sunlight each day, then it will grow taller than a plant that receives 6 hours of sunlight each day because the more sunlight a plant receives, the more food it can produce via photosynthesis (Figure 3).
Independent variable: the variable that is changed
Dependent variable: the variable that is tested or measured at the end
If a tomato plant receives 12 hours of sunlight a day, then it will grow faster and taller than a tomato plant that receives only 6 hours of sunlight a day because the more sunlight a plant receives, the more chemical energy it can produce to grow.
The explanation for the reasoned prediction
Figure 3 Elements of a hypothesis
A hypothesis is designed to be tested by conducting experiments. This hypothesis:
• outlines what can tested and measured in an experiment (the height of the plants)
• clearly states the cause and effect (the amount of sunlight and plant growth)
• i ncludes a scientific explanation for why this will happen (more sunlight leads to more photosynthesis, which produces more food for the plant).
The results of an experiment will either support a hypothesis (i.e. show it to be correct) or refute a hypothesis (i.e. show it to be incorrect).
Study tip
Key points to remember when making predictions and forming hypotheses:
• A prediction describes what you expect to happen if you try to answer your question.
• A prediction should be written as an “If ... then...” statement.
• A hypothesis adds an explanation of why something might happen.
• A hypothesis should be written as an “If ... then... because...” statement.
• A hypothesis should be about things that can be measured and observed in an experiment.
Check your learning 1.6
Retrieve
1 Define the term “variable”.
2 Identify the name given to the variable that is being tested, and therefore changed on purpose.
3 Identify the two variables contained in a prediction.
Comprehend
4 Ex plain why most variables need to be controlled.
5 Ex plain the difference between a hypothesis and a prediction.
Analyse
6 Justin decided to conduct an experiment to find out whether his cats preferred full-cream or low-fat milk. He gave one cat a saucer of full-cream milk and the other cat a saucer of
DRAFT
low-fat milk and then left them alone. When he returned an hour later, the low-fat milk was gone and there was a small amount of full-cream milk left. Justin concluded that his cats preferred low-fat milk.
a Explain why you agree or disagree with Justin’s conclusion.
b Explain whether Justin conducted a reasonable experiment. (Did he control all other variables? Would he have seen the same results if he repeated the experiment? Was the experiment fair?)
c Identify two variables that should have been controlled. Explain how these variables could have affected the results.
d Descr ibe two ways Justin could improve his experiment so that his results were more reliable.
Lesson 1.7
Skills lab: Using a question to form a hypothesis
Aim
To use a “what if” question to form a hypothesis and test it.
What you need:
• L arge plastic cup
• Teaspoon
• Permanent marker
• Baking soda (also known as bicarbonate soda)
• Vinegar
• Ruler
What to do:
Part A: Conduct an experiment
1 P ut a small amount of vinegar in the plastic cup. Then add a teaspoon of bicarbonate soda. Describe what happens.
2 Use the permanent marker to place a mark on the outside of the cup showing the height of the reaction.
3 Use the ruler to measure the distance between the base of the cup and the mark.
4 R inse the cup with water.
5 Repeat steps 1 to 4 until the reaction rises to the same mark three times in a row.
DRAFT

Part B: Form and test a hypothesis
Choose one of the following “What if” questions to investigate:
1 W hat if you increased or decreased the amount of vinegar?
2 W hat if you increased or decreased the amount of bicarbonate soda?
3 W hat if you heated the vinegar? For the question you have chosen:
1 Write a prediction for your “What if” inquiry.
2 Identify the independent variable that you will change from the first method.
3 Identify the dependent variable that you will measure and/or observe.
4 Form a hypothesis for your inquiry.
5 L ist the variables that you will need to control to ensure a fair test.
6 Describe how you will control these variables.
7 Test your hypothesis. Repeat your experiment at least three times to make sure your results are reliable.
8 Record your results in a table.
Figure 1 Vinegar and baking soda
Questions
1 C ompare your prediction to the result of your experiment.
2 Describe how many times you should repeat your experiment to make your results reliable.
3 Justify your decision (by describing the consequences of less repeats).
4 Compare a prediction to a hypothesis.
5 Wr ite your prediction as a hypothesis.
6 Describe how you could use this test to check if double-strength vinegar really has twice the amount of vinegar in the same volume.
Lesson 1.8 Scientists plan and conduct experiments
Key ideas
→ An experiment must be a reproducible test to ensure accurate and reliable results.
→ Reliable results are those that are consistent and can be trusted because they are repeatable under the same conditions.
→ When planning and conducting scientific experiments, managing risks is crucial for everyone’s safety.
Learning intentions and success criteria
→ Ethical issues are important questions or problems that scientists must consider before conducting an experiment (e.g. whether the research might harm living things or the environment, or go against important values like honesty, respect and fairness).
A goal without a plan is just a wish
Stage 2 of the scientific method involves planning scientific investigations and conducting experiments (Figure 1).
In this lesson, you will learn about the ways in which scientists plan and conduct experiments so that:
• t hey are reproducible
• t he results are reliable
• a ny risks are recognised and managed
• t hey consider any ethical issues
• t hey follow necessary protocols (especially when accessing Aboriginal and Torres Strait Islander Peoples’ cultural sites and artefacts on Country).
2 Planning and conducting
Figure 1 Stage 2 of the scientific method is Planning and conducting
Experiments must be reproducible
Once the hypothesis has been written, it’s time to plan how to carry out the experiment. An experiment must be a reproducible test to ensure accurate and reliable results. A reproducible test is one in which only one variable is changed at a time, and all other conditions are controlled. This means the test can be reproduced and should achieve the same results. This helps scientists trust the effect of the variable being tested.
For example, if you’re testing how sunlight affects plant growth, you should keep the type of plant, amount of water and soil the same for all the plants, and only change the amount of sunlight each plant receives (Figure 2). By doing this, you can be confident that any differences in plant growth are due to the amount of sunlight and not other factors.
This approach helps scientists make valid conclusions and advances our understanding of the world.
Results must be reliable

reproducible test the ability to replicate the results of an experiment under similar conditions as the original test
It is extremely important that the results of an experiment are reliable. Reliable results are those that are consistent and can be trusted because they are repeatable under the same conditions.
If you do an experiment once, following your plan exactly, you will probably get a set of results you think are accurate and reliable. But what if you try the experiment again the next day and the results are different? You would probably ask:
• D id I do things in a different order?
• D id the conditions change (e.g. hotter or cooler weather)?
• D id I use different materials (e.g. a different brand of vinegar or a slightly different variety of plant)?
Repeating the experiment until you get the same results at least three times helps to ensure your results are reliable. Another way to ensure your results are reliable is to ask someone else to perform the same experiment multiple times to confirm they get the same results. This consistency is crucial for making sure your findings are precise and reliable.
DRAFT
reliable consistency of a measurement, test or experiment

Risks must be recognised and managed
When planning and conducting scientific experiments, managing risks is crucial for everyone’s safety. Before starting any experiment, scientists need to identify what could go wrong (e.g. harmful chemical reactions, dangerous equipment or toxic materials).
Figure 2 If you are testing how sunlight affects plant growth, you should control all other variables like water, soil, temperature and pot size.
Figure 3 Reliable results are those that are consistent and can be trusted because they are reproducible under the same conditions.
They must put safety measures in place to prevent accidents and minimise harm. This includes:
• using protective equipment (e.g. goggles, gloves and lab coats)
• carefully following safety instructions and warnings for chemicals (and other dangerous materials)
• working in well-ventilated areas
• k nowing emergency procedures (including proper disposal of hazardous materials). It is also important to consider risks not only to the people doing the experiment, but to others nearby (e.g. animals involved in research) and the environment. For example, if an experiment requires strong acids, the scientists need safety materials and equipment nearby and must know how to safely clean up spills.
A well-planned experiment includes thinking ahead about safety. Missing one small thing could lead to an accident. The goal is to get good scientific results while keeping everyone and everything safe.

DRAFT
Ethical issues must be considered
Ethical issues in science are the questions and decisions that scientists face about what is right or wrong when doing research. These issues involve making choices that could affect the wellbeing of people, animals or the environment.
When planning and conducting an inquiry, a simple way for a scientist to consider ethical issues is by asking “Should we?” rather than just “Can we?”. For example:
• Should we test new medicines on animals?
• Could this research harm anyone?
• Do the potential benefits of this research outweigh the risks?
• Should we share this discovery if it could be used in harmful ways?
• A re we being completely honest about our results?


Figure 4 Read and follow all safety instructions and warnings carefully when planning and conducting experiments.
Figure 5 There are many ethical issues related to animal testing, including whether animals should have the more legal rights and how to balance the wellbeing of animals against the benefits of developing safe medicines for humans and other animals.
These questions don’t always have clear right or wrong answers. This is why it is important to discuss and think about them carefully before, during and after scientific research is conducted.
Protocols must be followed
When planning and conducting scientific research in the field (i.e. outside the laboratory), it is important that scientists do their research and seek permission from the person or organisation that owns the land they will be using to conduct their research. This could be a private landholder, a company that holds a lease to the land, or a local, state or federal government organisation.
When conducting research on culturally significant sites in Australia, key protocols need to be followed. These include:
• requesting and receiving consent from the Traditional Owners of the land on which the research is being done
• respecting cultural sensitivities and engaging with Elders and community leaders to ensure these are understood
• not disturbing sacred objects
• l imiting access to the site to people who have permission to be there
• ensuring the Traditional Owners understand the aims, methods and possible impacts (both positive and negative) of the research
• ensuring data is shared appropriately with the community. Hammersely Gorge (Figure 6) is located in the Pilbara region of Western Australia. There are many sacred sites in the Pilbara region including nearby Juukan Gorge. In 2020, mining company Rio Tinto legally destroyed a 46,000 year-old cave in the Juuken Gorge to expand one of its iron ore mines, despite its cultural significance to Traditional Owners. The event led to global outrage, a parliamentary inquiry and changes to Western Australian cultural heritage laws.
Check your learning 1.8
DRAFT

Retrieve
1 Define the term “reproducible test”.
2 Identify three ways in which risks can be managed when planning an experiment.
Comprehend
3 Describe the difference between asking “Should we?” and “Can we?” when planning scientific research. Use a specific example to illustrate your answer.
Figure 6 When conducting scientific research on sites in Australia that are culturally significant, it is essential that scientists seek permission and follow all protocols carefully.
4 Ex plain why repeating an experiment several times and obtaining the same results increases the reliability of those results.
5 Ex plain why scientists must seek permission before conducting field research on private or culturally significant land. Support your answer with two examples from the text.
Apply
6 A nalyse the events that resulted from the destruction of Juukan Gorge by Rio Tinto
in 2020. You will need to conduct some additional research online for this. In your response, identify three specific protocols that were not followed by Rio Tinto.
7 Ex amine one ethical issue of your own choice that scientists might face when conducting medical research. In your response, consider both the potential benefits and risks of the issue.
Lesson 1.9 Scientists always take safety precautions
Key ideas
Learning intentions and success criteria
DRAFT
→ Scientists use specialised equipment to conduct experiments in the laboratory and in the field.
→ All instructions and safety protocols need to be followed when using specialised equipment.
→ Scientific diagrams are used to show how specialised equipment needs to be set up to conduct and experiment.
Safety in the science laboratory
A science laboratory is not like a normal classroom. There are additional rules to follow. As a science student, just like every scientist, it is your responsibility to be familiar with your laboratory and to know where the safety equipment is located, what the warning signs mean and what to do in an emergency. Most safety is common sense – common sense can prevent many dangerous situations.
General rules Do:

• Wear a lab coat for practical work.
• Keep your workbooks and paper away from heating equipment, chemicals and flames.
• Tie long hair back whenever you do an experiment.
• Wear safety glasses while mixing or heating substances.
• Tell your teacher immediately if you cut or burn yourself, break any glassware or spill chemicals.
• Wash your hands after an experiment.
• L isten to and follow the teacher’s instructions.
• Wear gloves when your teacher instructs you to.

Don’t:
• Ru n or push others or behave roughly.
• E at anything or drink from glassware or laboratory taps.
• L ook down into a container or point it at a neighbour when heating or mixing chemicals.
• Smell gases or mixtures of chemicals directly; instead, waft them near your nose and only when instructed.
• M ix chemicals at random.
• P ut matches, paper or other substances down the sink.
• Carry large bottles by the neck.
• E nter a preparation room without your teacher’s permission.
Safety symbols
Safety symbols are used in many different settings to warn people of potential dangers. They are often simple drawings, although sometimes words are also used. If a picture can show a message clearly, words may not be needed. You may have seen the safety symbols shown in on building sites, at entrances to buildings, at school or on roads. Your laboratory may already have some of these symbols displayed.

Labfab: Notes from the fashion labwalk
DRAFT
Labfab takes the science fashion world by storm!
Direct from Milan Fashion Week, the new range from hot new underground label Labfab is set to transform every laboratory in the country. It’s exactly what every fashion-conscious scientist has been waiting for.
Olivia is wearing a four-button lab coat that is styled loosely for comfort during those tricky experiments. This knee-length garment is both on trend and will protect you from unexpected spills and chemical sprays. It is also available in a three-button style, but whichever one you choose, remember to do all the buttons up. Olivia wouldn’t be seen dead with those buttons open in the lab!
Figure 1 Can you see any of these safety symbols in your science laboratory?
Top model and scientist Corey is also sporting a brand new pair of big and bold safety glasses from Labfab’s range. But remember – if you are lucky enough to already wear glasses, you may not need to wear safety glasses.
Laboratory shoes are solid and sensible –open-toed shoes are definitely out this season! Finally, you can never have too many accessories. Labfab is leading the way with a fabulous range of latex and plastic disposable gloves. They come in a range of colours – like beige – to suit any mood!

DRAFT
Creating laboratory safety rules
• How many potentially dangerous activities can you identify in?
• W hat rules might be needed to prevent potential danger?
• Create a list of rules you think might be needed in your science laboratory. Give a possible consequence if the rule is not followed.
• Compare your list of do’s and don’ts rules with those listed in Safety in the field.
• Type up your list on a computer, print it out and store it somewhere easily accessible, like your writing book or planner.

Long hair must be tied back
Lab coat must be buttoned up
Safety glasses
Latex gloves for extra protection
Solid shoes
Figure 2 Models Olivia and Corey in this season’s latest (and safest) fashions for the science laboratory.
Figure 3 Can you spot any potentially dangerous activities in this image?
Safety in the field
When scientists work in the field (i.e. conduct research and practical work in the natural environment), they need to take important safety measures to protect themselves and their research.
This includes wearing appropriate protective clothing and equipment specific to the location they are working in – for example, closed-toe shoes, long pants or weatherappropriate clothing to guard against hazards like sharp rocks, thorny plants or extreme temperatures (Figure 4).
Scientists working in the field should carry first aid kits, satellite phones and special equipment like GPS trackers in case of emergencies. They should also work in pairs or teams whenever possible rather than on their own.
It is crucial to research potential dangers in advance, such as dangerous local wildlife, extreme weather conditions or terrain challenges, and plan accordingly.

4 Volcanologists are scientists who study volcanoes. When they are out in the field, they wear heatresistant silver suits to protect themselves against heat, ash and molten rock.
Taking these precautions helps ensure that scientists can focus on their research without putting themselves at risk.
Experiments conducted in a laboratory are easier to control than those conducted in the field because external factors like weather conditions and natural disasters don’t influence the results.
Check your learning 1.9
Check your learning 1.9
Retrieve
1 Identify five things you should do to stay safe in the laboratory.
2 Identify five things you should not do in the laboratory.
3 Identify the three safety symbols shown in Figure 5. Describe the meaning of each symbol.
5 Ex plain why do you think it is dangerous to drink from laboratory glassware.
6 Evaluate the effectiveness of the safety equipment being worn by the students in Figure 6.
4 Identify three items of protective clothing you might wear in the laboratory. Describe what might happen if you do not wear one of these items of clothing.
7 Develop a list of suggestions you could offer the students to improve their safety in the science laboratory.

Figure
Figure 5 Three safety symbols
Figure 6 Two students in a science laboratory
Learning intentions and success criteria
Lesson 1.10 Scientists use specialised equipment
Key ideas
→ Scientists use specialised equipment to conduct experiments in the laboratory and in the field.
→ All instructions and safety protocols need to be followed when using specialised equipment.
Check the next lesson for a linked practical activity or experiment.
equipment items used in the laboratory to conduct experiments
experiment an investigation used to test a hypothesis, solve a problem or find an answer to a question results the measurements and observations made in an experiment; they are often presented in a table or graph
→ Scientific diagrams are used to show how specialised equipment needs to be set up to conduct an experiment.
Scientific equipment
Equipment is the term used to describe the beakers, Bunsen burners, conical flasks, retort stands and other items used by scientists to conduct experiments. Using the correct equipment ensures accurate and precise results and the safety of scientists.


Beaker
Retort stand with boss head and clamp
Measuring cylinder
Bunsen burner Filter funnel
Figure 1 Types of equipment used in the laboratory
Commonly used specialised equipment is shown in . Some of the names may sound unfamiliar, but you will soon learn what each piece of equipment is called and how it is used. The equipment in your school laboratory may look slightly different because each laboratory has its own types of equipment.
Scientists often select different pieces of equipment use them together to conduct an experiment. This selection of equipment is known as the apparatus for that experiment.
Memory: Scientific equipment
Your class will divide into teams for this game of memory.
1 I n your teams, spend two minutes looking closely at Figure 2 and learning the correct names for all pieces of scientific equipment (include how they are spelled).
2 Your teacher will uncover a mystery tray containing all 12 pieces of equipment. You will have 60 seconds to study the tray before it is covered up again. You are not permitted to write anything down during this time.
laboratory a specially designed space for conducting research and experiments apparatus equipment placed together for an experiment
DRAFT
3 Once the tray is covered up, return to your desk and write down the names of as many pieces of equipment as you can remember.
4 C heck your answers. You will score:
– 2 points for each piece of equipment you remembered and spelt correctly – 1 point if the name of the equipment is spelt incorrectly.
5 Add up the points for every member of your team. The team with the most points wins.
Beaker
Figure 2 Scientific diagrams of
Scientific diagrams
To show others how to set up an experiment, scientists write a list of equipment needed and draw how it should be set up.
scientific diagram a clear, side-view, labelled line drawing, usually made using a sharp pencil Check your learning 1.10
Scientists have a quick and simple way to show how specialised equipment should be set up to conduct an experiment. They use drawings called scientific diagrams Using scientific diagrams means you do not have to be a good artist to be a good scientist. It also means you have more time to focus on conducting experiments rather than drawing.
The procedure for drawing scientific diagrams is as follows:
1 D raw clearly and neatly.
2 Use a sharp grey pencil.
3 D raw the equipment from the side view.
4 Do not show any detail – just a simple outline with no shading.
5 D raw lines using a ruler.
6 Write labels neatly and connect them to the diagram with a line.
Retrieve
7 Spell labels correctly. Incorrect spelling makes good science look bad!
8 D iagrams should be 6 to 10 c m high.
1 Identify the equipment shown in Figure 3.
Figure 3 Scientific diagrams
2 Identify the missing words in the following sentences.
a L aboratory equipment that is put together to do an experiment is called …
DRAFT
b Beakers, retort stands and other items used for experiments are called …
Analyse
3 C ontrast (describe the differences between) a scientific diagram and an artist’s drawing.
Apply
4 D raw scientific diagrams for:
a a f ilter funnel
b a beaker
c metal tongs
d a measuring cylinder.
Lesson 1.11 Skills lab: Drawing scientific diagrams
Aim
To correctly identify science equipment and draw accurate scientific diagrams
Station 1
What you need:
• 5 boxes from your teacher (each containing 5 different pieces of equipment)
• 1 piece of plain A4 paper
• G rey pencil
• Ruler
• E raser
What to do:
1 Share a box with a partner. Write down the name of each piece of equipment in the box and draw a scientific diagram of each piece of equipment in pencil.
2 Return the box to the teacher and collect a different box. Repeat step 1 until you have named and drawn the equipment in all five boxes.
3 C heck the names (including spelling) and diagrams for the pieces of equipment from Figure 2 (page 36) in Lesson 1.10 Scientists use specialised equipment (page 36). Correct any mistakes you have made.
4 D ivide the scientific equipment you have drawn into two groups. For example, you might group all pouring equipment, all heating equipment or all safety equipment together. In your notebook, write the names of the groups and list the scientific equipment that belongs in each group.
Station 2
What you need:
• Retort stand
• Boss head
• C lamp
• L arge flask
• Small beaker (100 m L)
• Funnel
What to do:
1 Set up the retort stand with the boss head and clamp, placing the boss head approximately two-thirds of the way up the stand, as shown in Figure 1 in Lesson 1.10 Scientists use specialised equipment (page 36).
2 Carefully place the flask neck into the clamp and tighten the clamp so that the flask is secure. (The flask should be approximately 10 c m above the bench, not resting on it.)
3 P redict how many beakers of water you think it will take to fill the flask. In your notebook write: “Step 2 Prediction = beakers of water to fill the flask”.
4 Fill the beaker with water. Use the funnel to transfer the water into the flask until it is full. Write the answer in your notebook: “Number of beakers of water needed to fill the flask = ” .
5 D raw a scientific diagram of the equipment that was set up. Label the equipment.
6 Take the apparatus apart and place each piece of equipment in its appropriate cupboard.
Questions
1 Name the piece of equipment that was the most difficult to draw.
2 Name the piece of equipment that was the easiest to draw.
3 Identify up to five pieces of equipment that you had not seen before and list their uses in a laboratory.
4 For each of the following tasks, identify two pieces of equipment that can be used.
a Holding things
b M ixing chemicals
c Pouring
Learning intentions and success criteria
Lesson 1.12
Check the next lesson for a linked practical activity or experiment.
5 Describe where in your laboratory you could find each of the following.
a Test tubes
b Bunsen burners
c Tongs
d Retort stands
e Test-tube racks
f Heatproof mats
g A rubbish bin
h Beakers
DRAFT
Bunsen burner a piece of equipment used as a heat source in the laboratory
A Bunsen burner is an essential piece of laboratory equipment
Key ideas
→ A Bunsen burner is a small, adjustable gas burner that produces a single open flame. It is used to heat substances and chemicals during experiments.
→ Safety procedures must be followed while lighting and using a Bunsen burner.
→ The yellow flame (known as the “safety flame”) is easier to see and cooler (i.e. around 300°C). It is used when the burner is not actively heating anything.
→ The blue flame is harder to see and hotter than the yellow flame (i.e. between 500 to 700°C). It is used for most heating purposes in the lab.
Using a Bunsen burner
A Bunsen burner is a gas burner that is used in the laboratory to heat substances and sterilise equipment. A mixture of liquid petroleum gas (LPG) or methane and air is used to produce a good flame.
A Bunsen burner has a collar that can be turned to open or close the air hole. The position of the collar controls how much air enters the burner and therefore how hot the flame is. If the hole is closed, less air can mix with the gas. This results in a yellow


safety flame. If the air hole is open, air mixes with the gas, allowing a hotter blue flame to burn (Figure 1).
When alight but not being used for heating, the Bunsen burner should be left on the yellow (safety) flame, which is not as hot and is easy to see. The safety flame is always used when lighting the burner (Figure 2).
What to do if there is a fire in the laboratory
1 L et the teacher know immediately (they will turn off the main gas tap if gas is involved and may use the fire extinguisher if the fire is small).
2 A sk the class fire officer to take a message to the school administration as quickly as possible.
3 Evacuate the area in an orderly manner.
4 C heck that everyone is safe.
Treating scalds and burns
1 I mmediately run cold tap water on the scald or burn for at least 15 minutes (Figure 3 and Figure 4). Do not use ice or very cold water.
2 A sk another student to tell your teacher about the scald or burn.
3 Remove nearby clothing (unless it is stuck to the burnt area) and jewellery (such as watches, rings and bracelets) because burnt areas can swell quickly.
4 Try not to touch the area. Do not use any creams.
DRAFT
5 Seek medical attention if necessary.


Heating flame
Figure 1 Blue (heating) and yellow (safety) flames on the Bunsen burner Air hole closed
Match held to one side of top of burner Hand below flame
Figure 2 The correct way to light a Bunsen burner
Figure 3 A scalded hand
Figure 4 A burnt hand
Check your learning 1.12
Check your learning 1.12
Retrieve
1 Identify the colour of the Bunsen burner’s safety flame.
2 Identify the colour of the Bunsen burner’s heating flame.
Comprehend
3 Ex plain how (what you do) to get a heating flame with your Bunsen burner.
4 Ex plain how you should treat a scald.
5 I f you were heating a substance to check for colour change, describe the flame that you would use to make it easier to observe.
6 Ex plain why hair should be tied back when using a Bunsen burner.
Apply
7 A student claimed that the top part of the Bunsen burner flame was hotter than the bottom of the flame. Design an experiment that will allow you to test the student’s claim.
Lesson 1.13
Skills lab: Lighting and using a Bunsen burner
Caution!
• Remember to keep your hand below the flame.
• Keep your notebook and other materials well away from the Bunsen burner.
• Never sit at eye level in front of a Bunsen burner. Stand while you are conducting the experiment.
• T he porcelain you heat will remain very hot for a long time. Do not pick it up with your fingers – use tongs. Wear safety goggles and a lab coat.
DRAFT
What you need:
• Bunsen burner
• Heatproof mat
• M atches
• Notebook
• Coloured pencils
• G rey pencil
• Metal tongs
• 2 pieces of white ceramic or porcelain

Figure 1 Place the Bunsen burner on a heatproof mat.


DRAFT


6 After you have followed these steps, the Bunsen burner will have a yellow (safety) flame.
What to do:
1 Follow the steps shown in Figures 1 to 6 to light your Bunsen burner.
2 C hange the flame to blue by turning the collar to open the air hole.
3 D raw three diagrams of a Bunsen burner and describe what happens to the flame in each of these scenarios:
a one with the air hole closed
b one with the air hole half open
c one with the air hole fully open.
Figure 2 Connect the rubber hosing firmly to the gas tap.
Figure 3 Close the air hole by turning the collar.
Figure 4 Light a match and place it above the barrel, with your hand below the flame.
Figure 5 Open the gas tap fully.
Figure
4 Close the collar so that a yellow (safety) flame is produced.
5 Using tongs, hold a piece of porcelain in the top of the yellow flame for a minute. Place the hot porcelain on the heatproof mat when you have finished. Describe what happens to the porcelain and draw it.
6 Turn the collar to change the flame to blue. Using tongs, hold the other piece of porcelain in the top of the blue flame for a minute. Describe what happens to this piece of porcelain and draw it.
Questions
1 Ex plain why the yellow flame is called the safety flame. Give two reasons.
2 Identify which colour flame is noisier. Explain why this is useful to know.
3 Identify which colour flame leaves a sooty carbon black deposit on an object it heats.
4 Identify which colour flame is the “clean” flame for heating.
5 Ex plain why you might use a blue flame for heating in an experiment. Give two reasons.
Check the next lesson for a linked practical activity or experiment.
DRAFT
6 Ex plain why the porcelain was put on the heatproof mat after testing.
Lesson 1.14
Scientists measure and record data accurately
Key ideas
→ Scientists use equipment to measure their results.
→ Scientists need to compare their measurements with one another.
→ The standard metric system is used by scientists around the world to measure distance (metres), volume (litres) and mass (grams).
Caution!
Make sure the water is not too hot before putting your hand in it. Learning intentions and success criteria
What if? Human thermometer
What you need
3 ice-cream containers
• Cold water
• Ice cubes Room-temperature water
• Very warm water
• T hermometer
What to do
1 Half fill the first container with cold water and add the ice cubes.
2 Half fill the second container with room-temperature water.
3 Half fill the third container with very warm water.
4 Place one hand in the cold water and the other in the warm water.
5 A fter 2 minutes, remove both hands and place them both in the room-temperature water.
– W hat do you notice about how hot or cold the water feels?
Do both hands tell your brain the water is the same temperature?
6 Use a thermometer to measure the temperature of the water in all three containers. What if?
• W hat if a foot was put in the water instead of a hand?
As you discovered in the “Human thermometer” activity, your body picks up changes in the environment, but it cannot tell you the exact temperature of the water or air. Your body will also become used to warmer temperatures in summer and colder temperatures in winter. A day when the temperature reaches 18°C might seem warm in winter but cold in summer. This is why scientists take accurate measurements during experiments.
Old ways of measuring
For thousands of years, distances have been measured by comparing them to parts of the human body (Table 1). The height of a horse, for instance, is still measured in hands. Some countries, such as the United States, measure distance in feet. However, a standard system is now used, instead of human hands and feet.
Table 1 Measurements used in ancient civilisations and their modern equivalents
Royal
Fathom The distance between a person’s fingertips when both their arms are stretched out
Knuckle The width of a finger
Lick
Measurement and units
Mesopotamia
Using human body parts for basic measurements caused confusion and arguments because everyone’s body size is different. So many different systems were being used to measure things that people were often cheated, such as when buying goods by weight.
metric system a decimal system of measurement; uses units such as metres (m), kilograms (kg) and litres (L)
In 1790, the king of France, Louis XVI, decided that a uniform system of measurement should be established. This was ultimately called the metric system and it is now used by scientists worldwide.
Scientists often check each other’s work by repeating experiments to see if they get the same results. To do this they need to use measurements that are consistent with the original experiment. By using a standard system of measurement, scientists everywhere can understand and build on each other’s work. A length of 2.45 m is the same in Ballarat, Australia, as it is in New York, USA. A temperature of 37°C is just as hot in Kolkata, India, as it is in Toowoomba, Queensland.
Five kinds of measurement are important when you are exploring science:
1 length (Figure 1)
2 mass (Figure 2)
DRAFT
3 t ime (Figure 3)
4 temperature (Figure 4)
5 volume (Figure 5).

Figure 1 Length This is a measure of an object or distance from end to end (and can include height and width). Length can be measured in different units. For shorter distances, millimetres (mm) or centimetres (cm) can be used. For longer distances, metres (m) or kilometres (km) can be used. Devices used to measure length include trundle wheels, metre rules and tape measures.

Figure 3 Time This is a measure of periods between the past, the present and the future. A watch or clock tells the time of day. A stopwatch measures how much time has passed. In your experiments, time will often be measured in seconds (s).

Figure 2 Mass This is a measure of the amount and type of matter or substance in an object. On Earth, this is similar to weight. Weight can be measured in grams (g), kilograms (kg) and tonnes (t). Smaller weights are measured in milligrams (mg). Weightmeasuring devices are called scales or balances.

Figure 4 Temperature This is a measure of heat energy. In your experiments, temperature will be measured in degrees Celsius (°C). Temperature is usually measured using a thermometer.
Meniscus
Place the measuring cylinder on a level surface. Look in line with the top of the water.
Read level here
Read the water level at the bottom of the meniscus.
(Here the correct measurement is 34mL.)
Figure 5 Volume This is a measure of how much space something takes up. The volume of solid objects can be measured in cubic centimetres (cm 3). The volume of liquids can be measured in litres (L) or millilitres (mL). In science, beakers and cylinders are used to measure the volume of liquids. Some beakers have a measuring scale on them, but cylinders are more accurate. Liquids cling to the sides of containers, forming a slightly curved surface called a meniscus. Measurements should be taken from the bottom of the meniscus.
Recording measurements
Measurements are usually recorded in a table or a graph so that they can be easily read, compared or used for further calculations. All measurements have two parts: a number and a unit. The unit can be written as a word or a symbol.
Every standard unit used in science has its own unit (Table 2). For example, 5 metres is written as “5 m”. Notice that the unit does not have an “s” after it, even though it stands for the plural “metres”. This is so that it is not confused with milliseconds.
Table 2 Metric units of measurement
Measurement Unit
Distance or length
Kilometre km
Metre m
Centimetre cm
Millimetre mm
Volume Litre L
Millilitre mL
Mass Tonne t
Kilogram kg
Gram g
Milligram mg
Time Hour
Trundle wheel
Metre rule
Tape measure or ruler
Tape measure or ruler
Beaker
Measuring cylinder
Weighbridge
Beam balance
Spring balance
Electronic scales
lock Minute
Converting units of length
To compare two measurements, their units must be the same. It is difficult to compare 10,000 m with 13 km – which is longer? It is much easier to compare 10 km with 13 km.
The metric system works in multiples of 10:
• 1 k ilometre = 1,000 metres
• 1 metre = 100 centimetres
• 1 centimetre = 10 millimetres.
To change a larger unit (such as kilometres) into a smaller unit (such as metres), you need to multiply. To change a smaller unit (such as millimetres) into a larger unit (such as centimetres), you need to divide (Table 3).
Table 3 Converting metric units
Worked example 1.14A Converting between units
A scientist measured the height of two trees. The first tree was 150 m t all, while the second tree was 12,000 c m tall. Identify which tree is the tallest.
Solution
Before you can compare the numbers, they need to be changed so that they have the same units.
• 1 m = 100 c m (multiply by 100 to convert m to cm)
• 150 m × 100 = 15,000 c m
• 15,000 c m is longer than 12,000 c m.
Therefore, the 150 m tree is taller than the 12,000 cm tree.
Worked example 1.14B Comparing measurements that use different units
A scientist wants to send a 2950 m m long metal pipe to a laboratory in England. Should they choose a 2.5 m or a 3.0 m postage cylinder for the pipe?
Solution
• 1,000 m m = 1.0 m (divide by 1,000 to convert mm to m)
• 2 ,950 mm ÷ 1,000 = 2.95 m
• 2 ,950 mm = 2.95 m
Therefore, a 2,950 mm long pipe will fit in the 3.0 m (i.e. 3,000 mm) postage cylinder. It will be too long for the 2.5 m (i.e. 2,500 mm) postage cylinder.
Measuring accurately
Accurate measurement in science is important so that your results are a true record of your experiment. Comparing measurements with other scientists is useful only if your results are accurate.
You can do several things to improve your accuracy in the science laboratory.
• A lways take your time when measuring.
• Write down the result straight away.
• C heck your measurements multiple times without changing (or bumping) the equipment.
• W hen reading a scale, line up your eye directly in front of the object and the scale. Looking from above or from the side can produce different readings. This is called parallax error (Figure 6).
Your measurements are precise if you have measured things more than once and all the measurements are similar (or identical) to each other.
Check your learning 1.14
Retrieve
1 L ist everything you have measured today. Think carefully – you have probably measured more things than you realise. Try to list at least five things.
2 Identify the part of the meniscus that you should read when measuring volume.
3 Identify which tools you would use to measure the following things.
a D istance around a cricket ground
b Time it takes a sprinter to run 100 m
With parallax error
No parallax error
With parallax error
accuracy how carefully, correctly and consistently data has been measured or processed; in science, how close a measured value is to the true value
DRAFT
c M ass of a carrot
d Volume of water in a fish tank
e Volume of a block of wood
f Temperature of a swimming pool
g Your mass
Comprehend
4 Ex plain why using body parts as a measuring tool might cause problems for scientists.
parallax error an error, or inaccurate reading, that occurs as a result of reading a scale from an angle
5 I n the United States, everyday people use imperial units of measurement (e.g. foot, pound, mile), but scientists use metric units.
a Ex plain why the scientists in the United States need to use metric units.
b Ex plain why problems might arise if scientists in the United States used imperial units.
6 Use a labelled diagram to describe a meniscus.
7 Ex plain why you might prefer to walk 14,900 c m instead of 3 k m.
8 Using an example, explain why errors in measurement are sometimes unavoidable.
Analyse
9 Determine which is longer: 10,000 m m or 500 m.
10 Determine which is shorter: 3 k m or 1,000 m
11 Ca lculate 1 k m in metres, centimetres and millimetres.
Figure 6 Parallax error occurs when you read a scale from an angle.
Lesson 1.15
Skills lab: Measuring mass and volume
Aim
To accurately weigh the sugar mass and liquid volume in a variety of drinks
What you need:
• Variety of soft drinks
• F lavoured milk
• Fruit juices
• Bottled water
• Tap water
• Beakers
• Scales
• Sugar
• Small spoon
• Measuring cylinder
What to do:
1 Select a drink. Locate the nutrition panel on the side of the drink container (Figure 1). Identify the volume of one standard serve and the amount of sugar in one serve.

2 Place a beaker on the scales and press the “TARE” button to reset it to zero.
3 Add sugar to the beaker until it reaches the mass of sugar in one serve of the drink (as shown in the nutrition panel).
4 Using tap water, carefully measure the volume of one serve of the drink and add it to another beaker.
DRAFT
5 Repeat steps 1 to 4 for all the drinks provided.
6 C onstruct a table to record the name of each drink, the mass of sugar per serve, the volume of one serve and the number of serves of drink that were in each container.
Questions
1 Identify the drink that had the most sugar in a single serve.
2 Identify the drink that had the most serves in a single container.
3 Identify the drink that has the most sugar in a whole container.
4 Identify a type of drink that had an unexpected amount of sugar content, and explain why you were surprised.
Figure 1 A nutrition panel
Lesson 1.16 Scientists use tables, graphs and models to record and analyse data
Key ideas
→ Scientists need to collect data and present it in an organised manner.
→ Tables and graphs allow scientists to identify patterns in their results.
→ Tables should have a heading, column headings with units of measurement and data in each column.
→ Different graphs should be used depending on the type of data (discrete or continuous) being displayed.
→ Keys help a scientist to interpret or identify information in scientific diagrams, maps and data.
→ Models are representations that help explain scientific concepts or can be used to test explanations.
→ Mathematical relationships show connections between variables and pieces of data, and express them as numbers or equations.
Without data, you’re just another person with an opinion
Stage 3 of the scientific method involves processing, modelling and analysing data generated during a scientific inquiry (Figure 1). This can be done using:
• d ata tables
• g raphs
• keys
• models
• mathematical relationships.
Data tables
When recording the results of experiments, the data collected should be neatly presented in a table or logbook. There are four steps for drawing a table:
1 Use a ruler to draw a table with the correct number of columns.
2 Write a heading that describes the data shown in the table (e.g. “Change in water temperature over time”) (Table 1).
Learning intentions and success criteria
STAGE 3 Processing, modelling and analysing
Figure 1 Stage 3 of the scientific method is Processing, modelling and analysing
categorical data information that can be divided into groups or categories numerical data data in the form of numbers discrete data data where the numbers can be separated into different groups continuous data data that are measured and can be any value
3 G ive each column in the table a heading and provide a description of the units (i.e. what the numbers in each column as showing, such as “Temperature (°C)” or “Time (mins)”.
4 Add your data in the correct columns.
Table 1 A table recording the change in water temperature over time
DRAFT
Graphs
There are two main types of data that are recorded and graphed by scientists so they can be analysed efficiently.
• C ategorical data is a collection of information that can be divided into named groups (e.g. colours, types of animals, types of vehicles).
• Numerical data is a collection of information that can be represented as numbers (e.g. temperature, wind speed, height). Numerical data can be divided into two smaller groups.
• Discrete data is data that can only take a specific and separate value, It is usually counted in whole numbers that cannot be broken down into smaller parts. For example:
–t he number of students in a class –t he number of butterflies in a specific location (Figure 2)
–t he number of votes in an election.
Discrete data is often represented in a column graph.
• C ontinuous data is data that can take any value within a range. It can be divided into smaller parts. It is measured, not counted. For example:

Figure 2 The number of butterflies recorded at a specific location is an example of discrete data
–measuring the speed and acceleration of a runner over the course of a 100 m sprint (Figure 3)
–measuring the rate at which water is poured into a glass –measuring temperature and wind speed over the course of a day Continuous data should always be represented in a line or scatter graph.
Column graphs
In a column graph, the height of each column represents a value that you have measured. This type of graph is good for showing discrete data.
Imagine that a scientist is recording the number of insects at different locations. In this experiment, the independent variable (the variable that is changed) is the location. The dependent variable (the variable that is measured) is the number of insects. The following steps outline how to construct a column graph to display the data they collect.
• Step 1: Use a pencil and a ruler to draw the horizontal and vertical lines of a graph. These lines are the axes. Add small lines along each of the axes at regular intervals (e.g. every 2 cm) (Figure 4).

• Step 2: Label each axis (Figure 5). The independent variable is always on the x -axis (the horizontal line) of a graph. The dependent variable is always on the y -axis (the vertical line) of a graph.
column graph a graph in which the height of the columns represents the number measured
• Step 3: Add numbers or categories at regular intervals to to the lines along the axes. Mark each interval with a small line (Figure 6). It is important to make sure that all your data can be represented on the axis. For example, if the smallest number is 7 and the largest number is 62, then the axis should go from 0 to 70.
Figure 3 The speed and acceleration rate of a runner measured over a distance of 100 metres is an example of continuous data
Figure 4 Drawing a set of axes
5 Labelling
Figure 6 Adding numbers to each axis
scatter graph a graph used to represent continuous data; it consists of discrete data points
• Step 4: Add units to the labels on the axes to explain what the numbers mean (Figure 7). For example, the units could be metres (m), seconds (s), minutes (min) or the number (n) of things. If an axis has categories instead of numbers, it does not need units.
• Step 5: Plot the data on the graph as columns (Figure 8). Rule the lines carefully, making sure there is a gap between the columns.
• Step 6: Write a descriptive title at the top of the graph (Figure 9).
Figure 7 Adding units to the axes
DRAFT
Figure 8 Plotting the data as columns
Scatter graphs
Figure 9 Writing a descriptive title for the column graph
In a scatter graph, the relationship between two sets of data is compared. The steps for drawing a scatter graph are listed below.
Imagine that a scientist is investigating how temperature changes over time. In this experiment, the independent variable (the variable that is changed) is time. The dependent variable (the variable that is measured) is temperature. The following steps outline how to construct a scatter graph to display the data they collect.
• Step 1: Use a pencil and a ruler to draw the x -axis (horizontal) and y -axis (vertical) of a graph. Label each axis. The independent variable is on the x -axis and the dependent variable is on the y -axis (Figure 10).
• Step 2: Add numbers at regular intervals to the lines along the axes. Mark each interval with a small line (Figure 11). It is important
Figure 10 Drawing a set of axes
Figure 11 Adding numbers to axes at regular intervals
to make sure that all your data can be represented on the axis. For example, if the smallest number is 14 and the largest number is 178, then the axis should go from 0 to 200. Add units to the labels on the axes to give the numbers meaning.
• Step 3: Plot the data on the graph. Use small crosses rather than dots (Figure 12). It is easier to find the centre of a cross than the centre of a dot.
• Step 4: Draw a line of best fit or a smooth curve that passes through, or near to, as many data points as possible (Figure 13).
• Step 5: If you are plotting more than one set of data on the same graph, use different symbols (e.g. circles or triangles) for the other sets of data. Add a legend to identify each set of data (Figure 14).
• Step 6: Write a descriptive title at the top of the graph (Figure 15).
Figure 12 Plotting data on the graph using small crosses
line of best fit the line on a scatter graph that passes through, or nearly through, as many data points as possible to show any overall trends in the data
(min)
Figure 13 Drawing a line of best fit
The change in temperature of honey and distilled water over time
Distilled water Honey
Figure 14 Using small crosses and circles when plotting more than one set of data
Keys
(min)
water Honey
Figure 15 Writing a descriptive title for the scatter graph
A key is a guide that helps a scientist to interpret or identify information in scientific diagrams, maps and data. Examples include:
• a legend on a graph to explain what different coloured lines represent
• a colour key on a weather map to indicate temperature ranges
• a sy mbol key on a geological map to indicate different types of rock
• a d ichotomous key to identify plants or animals based on their characteristics (Figure 16).

Models
Models are representations that help explain scientific concepts or systems. They include:
• a physical model of the solar system (Figure 17)
• a d iagram showing how the water cycle works
• a computer simulation of weather patterns
DRAFT

• a mathematical model predicting population growth
• a scale model showing the relative sizes of different atoms. Models are not just used for communication. Some models (such as physical or computer models) can be used to test hypotheses about how a system might behave differently if a variable is changed.
Mathematical relationships
Mathematical relationships show connections between independent variables and dependent variables and express them as numbers or equations. Examples include:
• d istance travelled = walking speed × time spent walking
• g raphing the relationship between the amounts of water given to plants and their growth
• temperature changes throughout a day
• how the weight of a bag changes as you add more items
• f inding patterns in measurements (e.g. analysing daily rainfall over a month).
Figure 16 A dichotomous key can be used to identify animals based on their characteristics.
Figure 17 A physical model of the solar system
Check your learning 1.16
your learning 1.16
Retrieve
1 Identify the two types of numerical data that scientists collect.
2 Identify which variable (independent or dependent) is located on the x -axis of a graph.
3 Describe the type of graph that would be used to show the number of birds found in a particular area each month.
Analyse
4 Figure 18 shows a graph drawn by a student. Identify all the things that should be corrected on the graph.
Table 2 The number of accidents in the science laboratory during the first six months of the year
5 Describe the type of graph that should be chosen to represent the sets of data shown in Tables 2 to 4.
6 C hoose one set of data and construct an appropriate graph.
7 Describe any patterns or trends that you observe in the data of your graph.
Table 3 The number of cigarettes smoked per day by a pregnant woman and the birth weight of her baby
Lesson 1.17
Skills lab: Heating water to record and analyse the results
Caution!
• Wear safety glasses and lab coat.
• Tie long hair back when using a Bunsen burner.
• Do not touch hot equipment.
Aim
To identify how adding sugar or salt to water affects the boiling point of water
What you need:
• Retort stand
• Boss head
• C lamp
• Tr ipod
• G auze mat
• Heatproof mat
• Beaker (250 mL)
• Water
• Bunsen burner
• T hermometer
• M atches
• Stopwatch
• Glass stirring rod
• Salt (optional)
• Sugar (optional)
• Teaspoon
What to do:
1 Set up the equipment as shown in Figure 1. Add 150 m L of water to the 250 m L beaker. Do not light the Bunsen burner.
Thermometer held in clamp
Stir gently with stirring rod
Figure 1 Equipment set-up
2 D raw a labelled scientific diagram of the equipment set-up in your notebook.
3 D raw a table with two columns – one for time (in minutes) and the other for temperature (in degrees Celsius) (Table 1).
Table 1 Example of table Time (min) Temperature (°C)
4 Measure the starting temperature of the water and write it in the table. This is the temperature at 0 minutes.
5 Safely light the Bunsen burner and then open the collar to get a blue flame.
6 Heat the water over the Bunsen burner. Record the temperature of the water every minute for a total of 12 minutes.
Inquiry: What if another substance was added to the water?
Choose one of these inquiry questions:
• W hat if sugar was added to the water?
• W hat if salt was added to the water? Follow the guide below to plan an experiment that answers your inquiry question.
1 Develop a hypothesis for your experiment.
2 Identify the independent variable that you will change in the “Heating water” activity above.
3 Identify the dependent variable that you will measure and/or observe.
4 L ist the variables you will need to control to ensure a reproducible test.
5 Describe how you will control each variable.
Lesson 1.18
6 Test your hypothesis by repeating the method with the independent variable you chose.
7 Record the data in a table.
8 C onstruct an appropriate graph for your data.
Questions
1 Identify the type of data you have collected.
2 Describe any patterns or trends you observed in the graph.
3 Ex plain how your data supports or refutes your hypothesis.
4 Describe how your experiment was a reproducible test (by providing a definition of a reproducible test and matching this to your method).
Scientists evaluate claims and results
Key ideas
→ Science experiments are planned and analysed carefully to minimise errors.
→ Before claiming that a hypothesis is supported or refuted, experimental data must be checked carefully to identify any assumptions, errors and improvements.
Take a step back and evaluate
DRAFT
Stage 4 of the scientific method involves evaluating the data and findings generated during a scientific inquiry (Figure 1). Scientists do this by:
• evaluating the methods to identify assumptions, errors and improvements
• evaluating the results to identify outliers and anomalies.
Learning intentions and success criteria
STAGE 4 Evaluating
Figure 1 Stage 4 of the scientific method is Evaluating
Reliable science
In Lesson 1.3 Scientists follow the scientific method (page 12) you learned about how pseudoscience claims are commonly made on the internet or in the media. These claims often use scientific words and describe poorly designed experiments that did not have all variables controlled. A reliable, valid science experiment needs to be carefully planned, the variables must be controlled, and the results should be carefully analysed to make sure that all errors have been minimised.
When you are planning your method or analysing the results of your experiment, there are approaches you can take to help you avoid making pseudoscientific claims. Some of these approaches are outlined below.
Evaluating the method
DRAFT
statements or beliefs that are accepted as true without supporting evidence
One of the most difficult things to do in an experiment is to control all the variables. Sometimes random things, such as someone opening a door or window, can cause an error in an experiment (Figure 2). For example, if a scientist is testing whether salty water takes longer to boil than fresh water, a window opening might change the temperature of the air in the room. This is why it is important to check if an experiment was repeated at least three times with the same results. Repeated experiments are more reliable than single experiments.

Identifying assumptions
When a scientist decides that the temperature of the room does not change without measuring it, they have made an assumption. Assumptions are beliefs that are accepted as true without any evidence or testing. Some assumptions are reasonable. An example of this is the assumption that your science teacher has given you the correct materials for the experiment. Other assumptions should be questioned, such as, are the scales you used to measure a material accurate?
When you are planning your own experiment, or reading about someone else’s experiment, it is important to check if any assumptions have been made.
Figure 2 Even something as small as having a window open can affect the results of an experiment.
Identifying errors
Scientists can make mistakes when conducting experiments. Mistakes should be fixed immediately, or the experiment should be started again.
An error is different from a mistake – it can happen for many reasons, no matter how careful you are. Errors can occur if the object you are measuring falls between two markings on a scale and you have to estimate the exact measurement. When this occurs, it is important to use a more accurate scale or a digital device. Sometimes scales can be calibrated (set up) incorrectly, which means that, no matter what you measure, you will get a slightly inaccurate result (Figure 3). You can minimise the effect of this kind of error by always using the same measuring device.
Identifying possible improvements

An effective scientist will always look for ways to improve their experiments. It is important to be open and honest about how the method could be changed to improve the reliability of your results.
Evaluating the results
An experiment does not finish when the results have been recorded. A scientist should check the data to identify if it contains errors or unexpected results before they claim that their hypothesis is supported or refuted.
Identifying outliers and anomalies in the data
Sometimes when plotting data on a graph, there may be a single dot or number that is unexpected or that does not fit with the rest of the data (Figure 4). This is called an outlier in the data.
An anomaly is an unexpected pattern in a data set that differs from what is normally observed. While an outlier can be due to an error in the data, anomalies can indicate something is wrong with the way the experiment is designed. It is important not to remove or ignore unexpected values or trends in data. If you can, try to explain what might have caused unexpected results.
Making a claim
If the data is reliable, has few outliers and no anomalies, and agrees with the original hypothesis, then the scientist can claim their hypothesis is supported. When making a claim, the scientist will:
• rewrite their hypothesis
• describe the experiment and the data that supports their hypothesis
• explain why the dependent variable was changed by the independent variable
• describe any relevant variables that have not yet been tested (the limitations).
error an inaccuracy or inconsistency in measurement calibrate check the accuracy of a measuring device against known measurements
outlier a data point that does not fit with the rest of the data anomaly a result that does not fit in with the pattern of data or what is normally observed
Figure 3 Scales should always be calibrated to avoid an error.
Figure 4 A data outlier can be identified by a graphed data point that is away from the other data.
If the data does not support the hypothesis, or there are several outliers, the hypothesis is refuted (not supported by the evidence). It is exciting when a hypothesis is not supported as this can lead to unexpected discoveries. As stated by famous scientist, Isaac Asimov, “The most exciting phrase to hear in science, the one that heralds new discoveries, is not ‘Eureka!’ but ‘That’s funny …’”.
Check your learning 1.18
Check your learning 1.18
Retrieve
1 Define the terms “anomaly” and “outlier”.
2 Identify an assumption that a scientist may make when completing an experiment that tests how fast water boils.
Comprehend
3 Describe how not calibrating scales at the start of an experiment could affect the results of the experiment.
Analyse
4 C ontrast the terms “mistake” and “error”.
Apply
5 A ssociate Professor Elizabeth Tibbets had difficulty putting marks on the wasps she was studying. When looking closely at the wasps, she realised that they all had different markings (Figure 5). This encouraged her to test if the wasps could tell one another apart. Propose a hypothesis that the associate professor could test based off this idea.
6 A scientist tested how the amount of light in a glasshouse affected the growth of wheat plants. When they analysed their results, they stated that their findings could not be applied to plants growing outside the glasshouse. Discuss why the scientist put a limit on how the findings of their investigation could be applied.
DRAFT
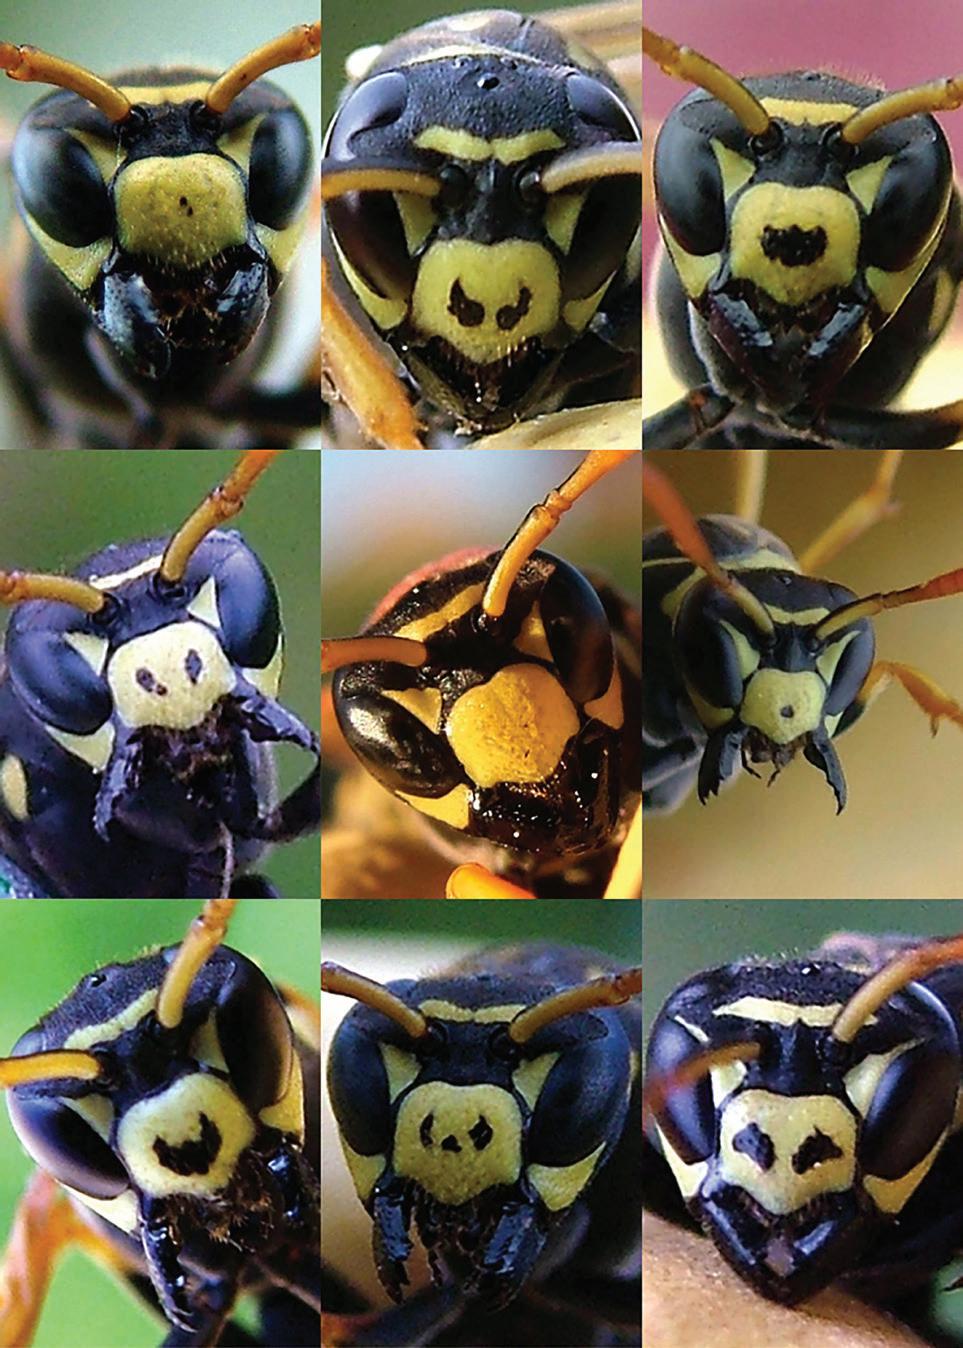
Figure 5 Associate Professor Elizabeth Tibbetts discovered that the wasps she was studying had individual markings.
Lesson 1.19 Scientific reports communicate findings
Key ideas
→ A scientific report is structured document that presents research findings and date in a formal, structured way.
→ Scientists use a similar style and language in their reports so that they can be understood by scientists worldwide.
→ Scientists communicate with other scientists so that they can learn from each other and expand on each other’s work.
Communication is key
Stage 5 of the scientific method is communicating the data and findings generated during a scientific inquiry (Figure 1). This includes asking another scientist to check if they are correct. This process of peer review means the second scientist:
• evaluates the methods to identify assumptions, errors and improvements
• evaluates the results to identify outliers and anomalies
• evaluates the patterns or trends that were identified.
What is a scientific report?
A scientific report is a written account of an experiment or investigation. It usually has the following parts (i.e. headings and features):
1 Title – This should clearly state what you’re investigating. It can be written as a statement or a question. Be descriptive but keep your title brief.
2 Date – This is the date (or dates) on which the experiment was conducted.
Learning intentions and success criteria
DRAFT
3 Partners – This is a list of people who conducted the experiment (if you are working in a group). Do not forget to include your own name here too.
4 A im (or question) – This is what you were trying to find out or why you were doing the experiment.
5 Hypothesis – This describes the independent variable and dependent variable of the experiment or investigation and the scientific explanation that will be supported or refuted as a result of testing.
Check the next lesson for a linked practical activity or experiment.
peer reviewed the evaluation of work by one or more people with similar skills and backgrounds (peers)
aim the purpose of an experiment
STAGE 5 Communicating
Figure 1 Stage 5 of the scientific method is Communicating
method a series of steps explaining how to do an experiment
discussion in a scientific report, a summary of findings, and analysis of the design of an experiment, including problems encountered and suggestions for improvement conclusion a statement that “answers” the aim of an experiment
6 M aterials (or equipment) – This contains a detailed list of the equipment and materials used.
7 Method – This lists the steps or procedure that you use to carry out the experiment or investigation, including diagrams of the experimental setup. There are two ways to write a method. The first is to plan what you are going to do. This method should be in the present tense. The second method is for a formal report. Past tense should be used for this method.
8 Results – These are measurements and observations recorded during an experiment or investigation, usually presented in a table, graph and/or diagram. A few sentences can be used to provide a description of the data in the tables, graphs and diagrams.
9 Discussion – This is your opportunity to discuss the patterns you see in the findings and any anomalies identified. You should describe any assumptions or errors and any suggestions for improvement or further investigation. The discussion should be written in the third person.
10 C onclusion – This describes the answer to the aim or question. It should be clear and reasoned, closely related to the aim or question, and if the investigation has a hypothesis, state whether it is supported or refuted by the results. The conclusion should be written in the third person.
How should a scientific report be written?
Scientific reports should present data objectively, letting the evidence speak for itself. This is why they’re typically written in the “third person” rather than the “first person”, removing the scientist from the spotlight and focusing on the work itself. First person and third person are different perspectives or “points of view” used in writing and communication.
First person
• Writing in the first person uses the pronouns “I”, “me”, “my”, “we”, “us”, and “our”.
• E xample: I measured the temperature of each solution and recorded the results in my logbook.
Third person
• Writing in the third person often avoids using pronouns altogether.
• E xample: The temperature of each solution was measured and recorded. When you write in third person:
• T he experiment becomes the focus, not the person conducting it.
• Results appear more universal and reproducible.
• T he science stands independent of who performed it. A well-controlled experiment should yield similar results regardless of who conducts it – whether a renowned scientist or a complete novice. The methodology and results, not the experimenter, are what matter.
Create your own scientific report
Now it is your turn to conduct an experiment and create your first scientific report. Read through the following instructions before you begin. You will be working in pairs.
1 Before you begin, create a template for your scientific report (including all the parts listed earlier in this lesson). You may choose to create your report by hand or digitally.
2 Next, conduct Lesson 1.20 Skills lab: Egg bungy jump experiment – Can an egg survive a controlled fall? (page 67) and begin to create your own scientific report on the experiment.
3 Be sure to record your results as you complete the experiment and then create a graph.
4 A nswer the discussion questions making sure you practise using the third person.
5 Evaluate the method and how the experiment was conducted by identifying any possible errors, anomalies and assumptions that might have been made.
6 C heck the aim of the experiment (to remind yourself what needs to be in your conclusion). Now write a conclusion by following the instructions in the example.
Case study Scientific report
Title
What if concentrated vinegar was added to bicarbonate soda?
Date
14 April 2026
Partner(s)
Vanessa Xi
Lauren Watson
Nicholas Balik
Aim
Hypothesis
DRAFT
This should clearly state what you’re investigating. It can be written as a statement or a question. Be descriptive but keep the title brief.
This is the date (or dates) on which the experiment was conducted.
This is a list of people who conducted the experiment (if you are working in a group). Do not forget to write your own name here.
This sets out what you are trying to discover. It is the “question” you are asking. This will be different for each experiment.
To determine how the chemical reaction changes when concentrated vinegar is added to bicarbonate soda.
This describes the independent variable and dependent variable of the experiment or investigation and the scientific explanation that will be supported or refuted as a result of testing.
If double strength vinegar is added to bicarbonate soda, then twice as many gas bubbles will be produced compared with regular white vinegar. This is because double strength vinegar has twice as much acid in it, so it will cause twice as much of the chemical reaction and produce double the gas bubbles.
Materials
• L arge plastic cup
• Teaspoon
• Permanent marker
• Bicarbonate soda (McKenzies brand recommended)
This is a list of what you need.
• W hite vinegar - 4% acidity (Coles brand recommended)
• Double-strength white vinegar - 8% acidity (Coles brand recommended)
• Ruler Method
This gives step-by-step instructions and often a diagram of the equipment set-up.
1 1 c m of regular vinegar was placed in the plastic cup.
2 One level teaspoon of bicarbonate soda was added to the vinegar.
3 T he permanent marker was used to place a mark on the outside of the cup identifying the height of the reaction. A ruler was used to measure the distance between the base of the cup and the mark.
4 T he cup was rinsed with water.
5 Steps 1 to 4 were repeated three times to check that the reaction rose to the same mark.
6 Step 1 was repeated with 1 cm of double-strength vinegar.
7 Steps 2 to 3 were repeated.
Results
Discussion
DRAFT
This often includes a table of results and a graph of the data collected.
This is where any set questions are answered and where you describe any unusual or interesting results. You can also suggest improvements to an experiment.
When vinegar and bicarbonate soda are mixed it produces carbon dioxide gas. This causes the mixture to bubble up.
It was hypothesised that using the double-strength vinegar would make the mixture make twice as many bubbles. This hypothesis was refuted because the height of bubbles in the double strength of vinegar was only 2.6 cm higher.
There was one measurement in the double-strength vinegar that was less than the other measurements (7.0 compared to 7.7 and 7.8). This could be a random error because the cup was not rinsed properly before the last measurement. This might have caused vinegar to be left in the cup.
Plastic cup
Bicarbonate soda
Vinegar
To improve the experiment, the cup should be rinsed properly after each test.
Conclusion
This is the answer to the question you set out to investigate. Look back at the aim and see whether the results support the aim before writing the conclusion. Try to use one to two sentences and to write in the third person (e.g. instead of saying “I measured the length of the rubber bands”, say “the length of the rubber bands was measured”).
Double-strength vinegar caused more gas bubbles to be produced, but it did not double the reaction.
Check your learning 1.19
Check your learning 1.19
Retrieve
1 Define the term “hypothesis”.
2 L ist the parts of a scientific report and provide a brief description of what should be included in each part.
Comprehend
3 Ex plain why a conclusion is written at the end of an experiment or investigation.
Lesson 1.20
4 Ex plain why personal pronouns are not used in scientific reports.
5 Ex plain why it is important that scientists prepare scientific reports.
6 Ex plain why using a common format for all scientific reports might make it easier for scientists to communicate with one another.
Skills lab: Egg bungy jump experiment –
Can an egg survive a controlled fall?
Caution!
Wear safety glasses and lab coat during this experiment
DRAFT
Materials
• Rubber bands
• Small mesh or plastic bag
Aim
To determine how many rubber bands are needed to drop an egg from a height of one metre so it falls as close to the ground as possible without breaking.
• R aw egg (or small water balloon filled with water)
• Wire (or paper clip)
• Retort stand
• C lamp with boss head
• Metre ruler
Method
1 Place the egg in the plastic bag and seal the bag with the wire (or paper clip). Be careful to tie the wire tightly to prevent the plastic bag from slipping through and breaking during the experiment.
2 M ake a loop out of wire at the top of the bag and connect the first rubber band to it (Figure 1).
3 Attach the boss clamp to the retort stand and place it on the ground (or a solid box or step). Ensure that the total drop height is one metre.
4 Hook the rubber band over the clamp on the retort stand.
5 C hoose one person to hold down the retort stand to ensure that it does not move or tip over during the experiment.
6 Carefully hold the egg so that it is level with the height of the clamp and let it drop. One member of the group may need to catch the egg as it bounces back up to ensure that it does not hit the clamp.
7 For each drop, hold the metre ruler level with the clamp to measure the distance the egg travels from the clamp when dropped. Record the number of elastic bands used and the distance of each drop. Be careful to avoid parallax error when recording this measurement.
8 A fter each drop, add one or more additional rubber bands (connected in a chain) to increase the length of the drop to the desired level.
Results
1 Record the distance the egg fell for each added rubber band.
2 D raw a line graph representing the number of rubber bands used for each attempt and the distance the egg fell each time.
Discussion
1 Describe any you had when measuring the distance that the egg fell.
2 Describe how your results would have been affected if the rubber bands were different sizes.
Figure 1 Connect the rubber band around the wire loop and then hook it over the retort stand clamp
3 Identify one other variable that could have affected the results. Describe how you tried to control this variable.
4 E xtend your graph so that it shows how many rubber bands would be needed for a 2 m drop. From this extrapolation/extension, calculate how many rubber bands you would need to safely drop the egg as close to the floor as possible. If you have time, test your hypothesis.
5 Ex plain how your results may have changed if extra weight was added to the egg before dropping it.
6 Ex plain how your results could help people who want to bungy jump off a bridge.
7 Describe two safety recommendations that should be made to anyone trying this experiment.
Conclusion
Outline the relationship between the number of rubber bands used, and the distance the egg travelled from the starting point.
Lesson 1.21
Command terms help identify tasks and communicate responses
Key ideas
→ Command terms are “doing words” that ask you to perform a specific task.
→ Command terms can be grouped into categories based on how much thinking and understanding is required to perform the task.
Understanding command terms
A command term is a verb or “doing word” that requires you to do a certain kind of thinking to complete a set task.
DRAFT
Command terms are helpful for a number of reasons. They can help you to:
• u nderstand exactly what the question is asking you to do
• identify how complex or difficult a question is
• t hink about your own thinking processes – a process called metacognition
• structure and communicate your responses more clearly.
Command terms are commonly used in questions – both in this course and in most of the assessment tasks you will be completing this year. In each lesson of this course, you’ll see that the command term in each question is bolded.
Some common command terms are listed in Table 1. Each one has an explanation that tells you what you whet the command term is telling you to do.
Learning intentions and success criteria command term a doing word that requires you to perform a specific thinking task
Some command terms involve simpler thinking processes that are easier to understand and master (e.g. define), while others are more complex and will take some time to practise and master (e.g. discuss). For this reason, command terms are organised into four categories based on the type of thinking processes required and how complex these are. These are also listed in Table 1. In order from least complex to most complex, these include:
• Retrieve
• Comprehend
• A nalyse
• Apply
As you work through this course, you’ll notice that the questions in the “Check your learning” activities in each lesson are organised into these categories. These categories will help you understand the types of thinking process you need to use when answering questions and the level of complexity required.
For example, if you are asked to “ Name the two fruits in Figure 1, you will simply need to recall the terms “apple” and “orange” and provide them as your response.
“Name” falls in the “Retrieve” category of command terms so requires less complex thinking.
However, if you are asked to “Compare the two fruits in Figure 1”, you would need to consider the two fruits carefully, identify at least one similarity and one difference between them, and make a comment on the importance of these similarities and differences.
DRAFT

Figure 1 Being asked to “name” two fruits or “compare” two fruits are quite different things.
“Compare” falls in the “Analyse” category of command terms so requires more complex thinking.
Table 1 Some common command terms. Familiarising yourself with different command terms can help you identify what a question is asking you to do and communicate your ideas.
Command term
Define
Explanation
Give the meaning of a word, concept or phrase, and identify its qualities
Identify Recognise, name and/or select a distinguishing factor or feature
Name
Provide a word or term to identify a person, place or object
Recall Present remembered facts, experiences or ideas
Use Operate or put into effect
Select Pick out
Describe
Explain
Summarise
Provide a detailed account of how and/or why, referencing effects, causes, reasons and relationships between things
Category
Retrieve – Recall information from long-term memory.
Provide a description of a situation, event, pattern, or process (including its features or characteristics) Comprehend –Activate and transfer knowledge from your long-term memory to your working memory.
Give a brief statement of relevant and important details of text, events, processes, concepts or narratives; present ideas and information in fewer words and in sequence
Command term
Explanation
Classify Arrange, distribute or order in classes or categories according to shared qualities or characteristics
Compare Recognise similarities and differences, and the importance of these
Contrast Give an account of the differences between two or more items or situations
Distinguish
Recognise as distinct or different and note points of difference
Interpret Draw meaning from information, determine its significance and recognise patterns and trends
Calculate Determine or obtain a numerical answer using mathematical processes
Create Reorganise or put elements together into a new pattern or structure
Discuss
Present a clear argument that is balanced and considered, identifying strengths, weaknesses, issues and points for and against; talk or write about a topic
Evaluate Examine and determine the merit, value, amount or significance of something; make a judgement
Justify Give reasons or evidence to defend or support an answer, response, point of view or conclusion
Predict State an expected result or outcome of a future action or event; make an educated guess based on observations and prior knowledge
Check your learning 1.21
your learning 1.21
Retrieve
1 Define the term “command term”.
2 Identify the command term that requires you to describe at least one similarity and one difference between two things.
Comprehend
3 Describe what is required to correctly answer:
a a “classify” question
b a “distinguish” question
c an “explain” question.
Category
Analyse – Use your reasoning to go beyond what was directly taught.
Apply – Use your knowledge in specific situations.
Analyse
4 Distinguish the different categories of command terms.
Apply
5 A student was asked to distinguish between the apple and orange in Figure 1.
a Identify the command term in the question.
b T he student’s response was “Both the apple and orange are round in shape”. Evaluate whether the student has correctly answered the question.
Lesson 1.22 Review: Science toolkit
Summary
Lesson 1.1 Science is the study of the natural and physical world
• Science is the study of the natural and physical worlds.
• Science measures what we observe (e.g. see, hear, smell and feel) and organises it into testable explanations.
• Scientists have jobs that focus on asking questions and finding answers.
• Some scientists work in a laboratory; many scientists work in teams.
• Scientists answer questions by observing, recording and interpreting what they find.
Lesson 1.2 Scientists value the knowledge and skills of Aboriginal and Torres Strait Islander Peoples
• Aboriginal and Torres Strait Islander Peoples have developed sophisticated science skills that enabled them to survive and thrive some of the most challenging environments in the world for tens of thousands of years.
• I ndigenous science sees everything as connected – the land, water, plants, animals and people are all part of one big system that remains in balance.
• T he scientific knowledge and skills of Aboriginal and Torres Strait Islander Peoples is now recognised and valued by Western scientists.
Lesson 1.3 Scientists follow the scientific method
• T he scientific method is a framework that helps scientists figure out how things work by asking questions and testing ideas. It is an essential tool to guide scientific inquiry and research that is valid and reliable.
• T here are five stages to the scientific method.
• Pseudoscience is a term used to describe theories, beliefs or claims that seem scientific but aren’t backed by any real evidence or results from experiments.
Lesson 1.4 Scientists make observations and ask questions
• Scientists use all their senses to observe the world around them (i.e. what they can see, hear, smell, taste and touch).
• Scientists make observations, ask questions, and make inferences (i.e. educated guesses).
• Observations can be quantitative or qualitative.
Lesson 1.6 Scientists form hypotheses that can be tested
• A prediction is a specific statement about what you expect to observe when you try to answer your question. It is often written as an “If... then...” statement.
• A hypothesis is a proposed scientific explanation for a question. It should try to explain why something happens based on previous observations, research or your reading on the topic.
Lesson 1.8 Scientists plan and conduct experiments
• A n experiment must be a reproducible test to ensure accurate and reliable results.
• Reliable results are those that are consistent and can be trusted because they are repeatable under the same conditions.
• W hen planning and conducting scientific experiments, managing risks is crucial for everyone’s safety.
• Ethical issues are important questions or problems that scientists must consider before conducting an experiment (e.g. whether the research might harm living things, the environment, or go against important values like honesty, respect, and fairness).
Lesson 1.9 Scientists always take safety precautions
• Scientists use specialised equipment to conduct experiments in the laboratory and in the field.
• A ll instructions and safety protocols need to be followed when using specialised equipment.
• Scientific diagrams are used to show how specialised equipment needs to be set up to conduct and experiment.
Lesson 1.10 Scientists use specialised equipment
• Scientists use specialised equipment to conduct experiments in the laboratory and in the field.
• A ll instructions and safety protocols need to be followed when using specialised equipment.
• Scientific diagrams are used to show how specialised equipment needs to be set up to conduct an experiment.
Lesson 1.12 A Bunsen burner is an essential piece of laboratory equipment
• A Bunsen burner is a small, adjustable gas burner that produces a single open flame. It is used to heat substances and chemicals during experiments.
• Safety procedures must be followed while lighting and using a Bunsen burner.
• T he yellow flame (known as the “safety flame”) is easier to see and cooler (i.e. around 300°C). It is used when the burner is not actively heating anything.
• T he blue flame is harder to see and hotter than the yellow flame (i.e. between 500 to 700°C). It is used for most heating purposes in the lab.
Lesson 1.14 Scientists measure and record data accurately
• Scientists use equipment to measure their results.
• Scientists need to compare their measurements with one another.
• T he standard metric system is used by scientists around the world to measure distance (metres), volume (litres) and mass (grams).
• Tables and graphs allow scientists to identify patterns in their results.
• Tables should have a heading, column headings with units of measurement and data in each column.
• D ifferent graphs should be used depending on the type of data (discrete or continuous) being displayed.
• Keys help a scientist to interpret or identify information in scientific diagrams, maps and data.
• Models are representations that help explain scientific concepts or can be used to test explanations.
DRAFT
Lesson 1.16 Scientists use tables, graphs and models to record and analyse data
• Scientists need to collect data and present it in an organised manner.
• M athematical relationships show connections between variables and pieces of data, and express them as numbers or equations.
Lesson 1.18 Scientists evaluate claims and results
• Science experiments are planned and analysed carefully to minimise errors.
• Before claiming that a hypothesis is supported or refuted, experimental data must be checked carefully to identify any assumptions, errors and improvements.
Lesson 1.19 Scientific reports communicate findings
• A scientific report is structured document that presents research findings and date in a formal, structured way.
• Scientists use a similar style and language in their reports so that they can be understood by scientists worldwide.
• Scientists communicate with other scientists so that they can learn from each other and expand on each other’s work.
Lesson 1.21 Command terms help identify tasks and communicate responses
• Command terms are “doing words” that ask you to perform a specific task.
• Command terms can be grouped into categories based on how much thinking and understanding is required to perform the task.
Review questions 1.22
Review questions: Module 1
Retrieve
1 Identify which of the following is most accurate when measuring 10 m L of liquid.
A Conical flask
B Beaker
C Measuring cylinder
D Test tube
2 Identify which of the following could be used to measure the temperature of the air.
A Balance
B E lectronic scales
C Stopwatch
D T hermometer
3 Identify the step that should be completed first when lighting a Bunsen burner.
A O pen the air hole.
B L ight the match.
C Turn on the gas.
D Place the lit match over the Bunsen burner.
4 Identify the metric units used for the following measurements.
A Volume
B Temperature
C Time
D M ass
5 Define the term “mass”.
6 Identify the following as either quantitative or qualitative observations.
A T he bus is red.
b T he swimming pool smells of chlorine.
c I a m older than 12 years old.
9 Consider the image of the Bunsen burner with a blue flame (Figure 1).
a Identify whether the air hole on the Bunsen burner would be open or closed.
b how the position of the air hole produces a blue flame.
DRAFT
d T he line to the tuckshop is 4 m long.
7 Name the section of a scientific report that would contain the measurements collected.
Comprehend
8 I llustrate a diagram of a:
a conical flask
b t ripod stand
c test tube.
10 Ex plain what this safety sign means.
11 Describe a reproducible test.
12 Ex plain why it is important to control variables in an experiment.
13 Ex plain why a measurement is not very useful if you do not include the correct units.
14 A nswer the following questions about a Bunsen burner.
a P rovide an example of when the Bunsen burner safety flame is important.
b Ex plain what steps you need to use to achieve a safety flame with your Bunsen burner.
c Describe two reasons why the safety flame is not good for heating.
d C ontrast the command terms in the following instructions. “Identify which part of the blue flame is best for heating.” “Describe the blue flame that is used for heating.”
Figure 1 Bunsen burner with a blue flame
Figure 2 Safety sign
15 A student is conducting an experiment and measuring the amount of water they need to use in a measuring cylinder. They look at their measuring cylinder from three angles – A, B and C (Figure 3).
a Identify which angle would provide them with the most accurate reading.
b Ex plain your answer to part a.
Analyse
16 Write three observations and three inferences about:
a t his textbook
b your own hand.
17 Consider what would happen if the units used by scientists were not the same everywhere in Australia.
18 Identify the correct graph to use to represent the following set of data on the number of road deaths each year due to car accidents.
DRAFT
19 Measure the length of the palm of your hand. Check the length of your own palm against the suggested value (Table 1 in Lesson 1.14
Scientists measure and record data accurately (page 44)) in centimetres.
a Ca lculate the length of 50 standard “palms”.
b Ca lculate the length of 50 values of the measurement of your palm.
c Ca lculate the difference in the two measurements.
Apply
20 T here are many unusual measurements. Determine how you might find the answers to these measurement problems.
a W hat is the temperature inside a furnace?
b W hat is the thickness of a sheet of paper?
c How fast do your fingernails grow?
Figure 3 Different viewing angles for a measuring cylinder containing water
21
T he number of koalas has been steadily decreasing across many of the eastern states in Australia since 2012. The percentage decrease in each state is shown in Figure 4.
a Use the data to construct a column graph.
b Evaluate why a column graph would be the most appropriate graph to use for this data.
c Discuss why you could not use this data to determine which state has the largest koala population.
The decline of koala populations in Australia
Note: Overall population decline –24%
Source: Adams-Hoskin et al. (2016)
22 Pseudoscience challenge: Your teacher will provide you with a set of last week’s horoscopes. They will be randomly numbered, and the dates and star signs removed.
–Decide which horoscope from last week best fits you.
–Collate all the horoscope numbers and class members’ names on the board.
–Your teacher will list the corresponding star signs for each number.
d Discuss two new things you learnt from this activity.
Social and ethical thinking
23 M any forms of science research are dependent on government funding. Scientists need to apply for the funding, which can result in their projects competing against one another for the limited funds. A selection panel will often need to decide which research project will receive funding and which will not. Read the following Nobel Prize proposals and decide which research proposal should receive funding.
DRAFT
Once you have carried out the above tasks:
a Identify how many horoscopes were correct.
b Determine what this tells you about astrology.
c Use the evidence from questions a and b to determine if astrology is a science or a pseudoscience.
Discuss how you made your choice.
–How to identify a narcissist (self-absorbed) person by the shape of their eyebrows?
–W hat happens to the shape of an earthworm when it is vibrated?
–W hat does a crocodile who breathes helium sound like when they bellow?
Critical and creative thinking
24 Design one of the following experiments. Write an aim, hypothesis and method for the experiment. Identify the variables and make sure your method controls all but the independent variable. Make note of any safety issues. Set it out like one of the experiments in this book.
–A n experiment to test if three types of material are waterproof.
–A n experiment to see how high a rubber “bouncy ball” can bounce on different surfaces.
25 M any scientists use data from other scientists when planning their experiments. This data is called secondary data.
a Describe how you would determine if you could trust the information or data you read on a website.
b Identify which of the following factors you would consider:
i W ho wrote the information?
ii W hen was the information written?
iii How old is the author of the website?
iv W hy did the author make the website?
c Develop one more question that you would ask when you read the website information.
Figure 4 The decline of koala populations in Australia.
Research
26 C hoose one of the following topics for a research project. Your job is to plan the project, rather than actually do the research. Planning is a very important tool. Place the topic in the centre of a mind map and fill the surrounding bubbles with big questions. Make sure your questions are big enough to give you an insight into the topic, as well as broader issues.
Famous Australian scientists
Scientists become famous when they have become experts in their area of research. They may have spent many years working on one particular area or have made an important discovery. Some have even won awards for their work.
• Select one of the scientists from this list: Frank Macfarlane Burnet, Douglas Mawson, Gustav Nossal, Mark Oliphant, Helen Caldicott, Nancy Millis, William McBride, Struan Sutherland, Suzanne Cory.
• Describe their research area.
• E xplain any significant discoveries that they have made.
• Create a list of questions that you would ask them if you had the chance.
Depending on variables
Scientific discoveries rely on carefully controlling experiments. This means that the methods must be able to be repeated and variables must be controlled.
• E xplain the difference between controlled variables and the independent variable.
• Describe what would happen if the variables in an experiment were not controlled.
• Describe two experiments: one that was controlled and one that was not controlled.
• E xplain how the reputation of a scientist may be affected if they made a claim based on results from an uncontrolled experiment.
Intellectual property
When you develop a new product or idea, it is said to be your intellectual property. This means you have time to use your idea or product to produce something to sell and cover the cost of your research. If you were shown by an Aboriginal or Torres Strait Islander person how a native plant could cure an infected finger, would you need to ask their permission before you researched the plant to make a new antibacterial medicine?
• Identify what is meant by the term “biopiracy”.
• Describe the way Aboriginal and Torres Strait Islander Peoples used scientific techniques to gain knowledge of the plant.
• Describe the things you would need to consider before you started your research.
Module 2 Classification

Overview
DRAFT
Early scientists worked hard to understand the world around them. One way they did this was by grouping things into categories based on what they had in common or what made them different. Classification helps us organise living things by their shared traits. Tools like classification keys help identify all kinds of organisms, from plants and animals to tiny microorganisms. Today, scientists called taxonomists still use these methods to keep discovering and organising new species.

Lessons in this module:
Lesson 2.1 Classification organises our world (page 80)
DRAFT
Lesson 2.2 Living organisms have characteristics in common (page 83)
Lesson 2.3 Classification keys are visual tools (page 85)
Lesson 2.4 Challenge: Dichotomous key (page 89)
Lesson 2.5 The classification system continues to change (page 90)
Lesson 2.6 Kingdoms can be used to classify organisms (page 93)
Lesson 2.7 Challenge: Classifying living things (page 96)
Lesson 2.8 Animals that have no skeleton are called invertebrates (page 97)
Lesson 2.9 Experiment: Dissecting skeletons (page 100)
Lesson 2.10 Challenge: Identifying invertebrates (page 102)
Lesson 2.11 Vertebrates can be organised into five classes (page 103)
Lesson 2.12 Challenge: Who are the vertebrates? (page 106)
Lesson 2.13 Plants can be classified according to their characteristics (page 107)
Lesson 2.14 Challenge: Identifying plants (page 110)
Lesson 2.15 The first Australian scientists classified their environment (page 111)
Lesson 2.16 Science as a human endeavour: Taxonomists classify new species (page 114)
Lesson 2.17 Review: Classification (page 116)
Lesson 2.1 Classification organises our world
Key ideas
→ Classification systems help scientists to organise and communicate the findings of their research.
→ Scientists identify all living things through scientific names.
The American magpie and the Australian magpie, shown in Figure 1, look so similar that they were given the same common name, “magpie”. However, these birds are not closely related and so their scientific names are different. Scientific names are a more reliable way to communicate information about a species than common names. The Learning intentions and success criteria
→ Carolus Linnaeus developed the modern Linnaean classification system.
Early classification methods
Early humans first classified plants by learning which plants were edible and which were poisonous. A new plant or animal discovered by humans was (and still is) studied and put into a group. Some plants were found to help sick people and others were poisonous. Some animals could produce food, such as milk and eggs. Each generation of scientists worked to improve how these groups were classified.
Common names or scientific names
Scientists communicate with each other regularly to help with their research. Before photographs or computers existed, scientists had to draw living things, such as birds and plants, by hand and describe them in as much detail as they could. This was difficult, and it was easy to make mistakes and overlook important features.


Aristotle (384–322 bce) sent his students out to gather local samples and stories. He ordered the samples and stories from least important (rocks) to the most important (wild animals, men, kings, fallen angels, angels and God).
Andrea Cesalpino (1519–1603) suggested classifying plants into groups according to their trunks and fruits.
John Ray (1627–1705) suggested that organisms needed to be observed over the whole of their lifespans.
Augustus Quirinus Rivinus (1652–1723) and Joseph Pitton de Tournefort (1656–1708) suggested using a hierarchy of names. Each organism had a long Latin name that described the characteristics of each level of the hierarchy.
Figure 1 (A) The American magpie (Pica hudsonia) and (B) the Australian magpie (Gymnorhina tibicen)
Figure 4 A timeline of classification
Carolus the Linnaean
that over (1652–1723) (1656–1708)
Each described hierarchy.
name Gymnorhina tibicen for the Australian magpie means the same to scientists in every country around the world.
The Linnaean classification system
Greek philosopher Aristotle (384–322 BCE) was the first scientist to use systems to describe plants and animals. By the seventeenth century, the early classification systems used a hierarchy list of names, starting with large general groups (such as plants and animals) and then dividing each group into smaller and smaller groups based on their characteristics. Each organism ended up with a long Latin name that described the characteristics of each level of the hierarchy.

Swedish botanist Carolus Linnaeus (1707–1778) tried these classification systems but thought their descriptions were too long. He decided that a simpler system was needed. He changed the descriptions to single words and reduced the number of classification groups to seven.

3
Carolus Linnaeus (1707–1778) introduced the Linnaean classification system.
Thomas Cavalier-Smith (1942–2021) suggested the kingdom Plantae be split into two kingdoms because of di erences in their cells.
Carl Woese (1928–2012) suggested that the bacterial kingdom Monera be split into two domains, and the third domain contain all other organisms.
Figure 2 Carolus Linnaeus
Figure
Part of Linnaeus’s classification system. “Regnum Animale” means “Kingdom of Animals” in Latin.
Finding new species
There are many living things that are still to be discovered or named. In 2020, seven new species of peacock spiders were identified in Australia. These spiders are the same size as a grain of rice. During their courtship dance, they wave their brightly coloured abdomens.
Small groups of scientists are trying to find undiscovered plants in Brazilian rainforests before they are destroyed by logging and farming. Often the scientists are supported by large pharmaceutical companies from other countries in the hope that it may lead to the discovery of new medications. The antibiotic penicillin was discovered from a type of mould; aspirin comes from a substance in the bark of willow trees. The next painkiller could come from a small fungus in the rainforest or an insect that relies on the fungus for food. Without a name, the new discoveries would be lost and forgotten.

Check your learning 2.1
Check your learning 2.1
Comprehend
1 Ex plain why Linnaeus simplified the classification system used by previous scientists.
2 Ex plain why it would be difficult to classify frogs and tadpoles using the early methods of classification.
Apply
DRAFT
3 P ropose two reasons why scientists still classify organisms today.
4 T he earliest scientists did not have pens or paper. Describe how they would have passed on the information they discovered. Discuss the accuracy of this approach (by describing the advantages and disadvantages of using this method).

5 A ristotle was one of the first scientists to gather information from wide regions. Propose the method he might have used to tell the differences between a horse and a fly.
Skills builder: Planning investigations
6 A person found a strange species of insect in their backyard, but they could not identify what it was. Suggest what equipment could be used to record their observation so that they could ask an expert later. (THINK: What information would the person need to record so that an expert could help them? What is the best way to capture this information?)
Figure 6 The rainforests of Brazil contain many undiscovered plant species.
Figure 5 Peacock spiders are unique to Australia.
Lesson 2.2
Living organisms have characteristics in common
Key ideas
→ Biology is the study of living organisms and what it means to be alive.
→ Living things move, reproduce, need nutrition, grow, respond to change, exchange gases, produce waste and need water.
→ Dead organisms were once living.
Characteristics of living things
It has taken many years of observation and discussion for scientists to develop eight characteristics that all living things – plants, animals and even microorganisms such as bacteria – have in common. To remember all eight characteristics, think of: MR N GREWW.
Living things can MOVE by themselves
Animal movements are easy to see. But do plants move? Look at the leaves on an indoor plant – they usually face the window (a source of light). Turn the plant around so that the leaves face into a darker part of the room. In a few days, the leaves will again be facing the window. The leaves have moved by themselves. Sunflowers turn their heads to follow the Sun as it moves across the sky each day (Figure 1).
Living things can REPRODUCE
Living things can make new individuals that grow up to look like them. Animals mate and produce offspring, plants produce seeds that grow into new plants, and bacteria divide to produce more bacteria. Reproduction is the process by which living things make new life.
DRAFT
Learning intentions and success criteria
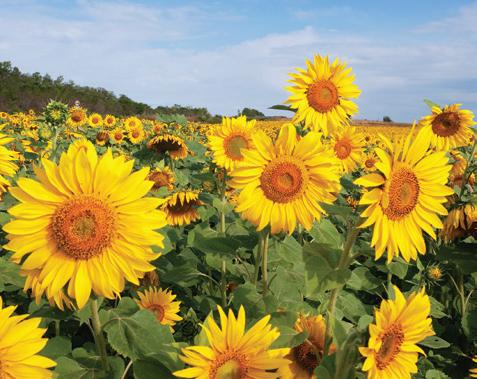

Living things need NUTRITION
All living things need nutrients to survive. Animals obtain most of their nutrients by eating food and drinking. Plants absorb nutrients through their roots and fungi feed on decaying organisms. Plants are autotrophs, which means they make their own food. Animals and fungi are heterotrophs, which means they rely on other living things for food or nutrients.

reproduction the production of offspring by a sexual or asexual process
autotroph an organism that makes its own food heterotroph an organism that eats other organisms to obtain nutrients
Figure 1 Living things move.
Figure 2 Living things reproduce.
Figure 3 Living things like snakes need nutrients to survive.
Living things GROW as they get older
All living things grow during their lives. Mushrooms start off as tiny spores. Humans are born as babies and develop into children, teenagers and then adults. Insects hatch from eggs as larvae and then metamorphose into adult insects (Figure 4). In every case, living things, when fully grown, resemble their parents.
Living things RESPOND to change
When an animal realises it is being chased, like the springbok in Figure 5, it runs. It is responding to stimuli (the sight and sound of a charging predator) or to changes in its environment (the sudden brush of leaves or movement of shadows). The sunflowers shown in Figure 1 are responding to the changing stimuli of light and warmth.
Living things EXCHANGE GASES with their environment
Plants and animals have organs and structures that allow them to exchange oxygen and other gases with their environment. Some animals, such as humans, use their lungs to inhale and then exhale. Other animals, such as fish and the axolotl (Figure 6), have gills. Some animals, such as worms, breathe through their skin. Even plants need to exchange gases with their environment.
Living things produce WASTES
We, like other animals, take in food, water and air to fuel our bodies. Chemical reactions occur in our bodies and wastes are produced as a result. We get rid of these wastes by exhaling, sweating, urinating and defecating (emptying our bowels). Plants get rid of their wastes through their leaves.

4 Caterpillars grow and change (metamorphose) into butterflies.
DRAFT
Living things require WATER
All living things need water; it is required for many jobs. For example, it transports substances in our bodies to where they are needed, and it is involved in many essential chemical reactions. In animals such as humans, water helps maintain body temperature. No wonder a large proportion of our body is water!
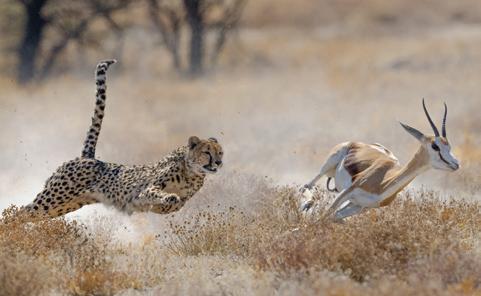
5 The springbok (Antidorcas marsupialis) responds quickly to any movement or sound. This keeps it alive.


8 The human body uses water for many jobs, including maintaining body temperature.
Figure
Figure
Figure 6 The axolotl has gills to exchange gases with its environment.
Figure 7 Sweating is one way humans get rid of waste products from their bodies.
Figure
Non-living or dead?
Something classified as living needs nutrition and water, and is able to move by itself, reproduce, exchange gases, grow, respond to stimuli and produce wastes.
If something does not have these characteristics, it would seem logical to assume that the thing is non-living. But what about something that is dead? Something dead, such as a dried flower or an Egyptian mummy, was once living; when it was alive it did have the characteristics of a living thing. Something that is non-living, such as a computer or your watch, has never had these characteristics.
Check your learning 2.2
Check your learning 2.2
Retrieve
1 Name the two broad groups scientists use to classify unknown things.
2 Identify what the letters of MR N GREWW represent when discussing the characteristics of living things.
Analyse
3 With a partner, or by yourself, classify the following things as living, non-living or dead:
a eucalyptus tree
b water
c paper d robot
e d inosaur fossil f wombat g roast chicken h plastic chair.
4 C ontrast non-living and dead things.
Apply
5 Identify the items listed in question 3 that are dead. Justify your answer (by defining the term “dead” and comparing the definition to the item).
6 Identify a bushfire as living, non-living or dead. Justify your answer (by describing the characteristics of a living thing and comparing it with the properties of a fire).
Lesson 2.3
Classification keys are visual tools
Key ideas
→ A key is a visual tool used in the classification of organisms.
→ A branched key can show the relationship between different organisms.
→ Scientists use keys to identify the scientific name of an organism.
Learning intentions and success criteria
Check the next lesson for a linked practical activity or experiment.
classify arrange in groups or categories that have similar characteristics
key (in biology) a visual tool used to classify organisms
dichotomous key a diagram used in classification; each “arm” of the key contains two choices
Introduction
When you visit an outdoor market, you might wander around for some time before you find what you want. A department store is more organised, with similar items grouped together. Scientists use a system like this to sort things into groups or classify them. A visual tool called a key helps scientists identify the names and descriptions of organisms.
Dichotomous keys
One common type of key is called the dichotomous key (pronounced “dye-COTo-muss”) because the branches always split into two (di meaning “two”). Scientists use a dichotomous key to make simple “Yes” or “No” decisions at each branch. For example, does the animal have fur (Yes/No)? Does it have scales (Yes/No)? Each answer leads to another branch and another question.
This key only works if the animal has already been identified by someone else. A newly discovered organism would need to be studied first and then new branches would be added to an existing key.
Tabular keys
If a scientist is going out into the bush to study plants and animals, a large drawing like the one in Figure 1 may not be useful. Instead, a field guide or tabular key, such as that shown in Table 1, can be used. This is used in the same way as the diagram version (Figure 3). Two choices are offered at each stage. When a decision is made, the scientist is led to the next choice between two characteristics.
Dr Redback’s family
Dr Redback loved to send out Christmas cards with a family photo on the front. One year, just for fun, he included two dichotomous keys to help everyone identify all his family and pets.
Use the picture of Dr Redback’s family (Figure 1) and one of the keys provided (Figure 2 and Table 1) to work out who is who.
Figure 1 Dr Redback’s family
3 A dichotomous key to help identify 16 different types of beetles
Check your learning 2.3
Check your learning 2.3
Retrieve
1 Define the term “dichotomous key”.
2 State why the key is called “dichotomous”.
3 Define the term “classify”. Apply
4 T he characteristics used to identify organisms should be permanent physical characteristics that are easy to observe. Characteristics that change over time, such as size and behaviour, are not as reliable for identifying species. For each of the characteristics listed below, consider if it is appropriate for use in a dichotomous key of birds and justify your answer (by explaining how it can or cannot be used to identify a bird):
Wings
Wings
DRAFT
Wings
Wings
c a broken leg d sitting on the ground.
5 C reate a dichotomous key that could be used to identify the birds in Figure 4.
a eating bird seed b a blue stripe above the eye
Figure 4 Birds sitting on a tree branch.

6 C reate a tabular key that could be used to identify laboratory equipment. Include these items: tripod stand, Bunsen burner, gauze mat, 50 mL beaker, 150 mL beaker, 100 mL measuring cylinder, 10 mL measuring
Figure
cylinder, 500 mL beaker, 500 mL measuring cylinder, retort stand, clamp.
7 Use the dichotomous key in Figure 3 to help with the following tasks.
a Identify the four beetles in Figure 5.
b C reate a simple sketch of the following:
i f rupe beetle
ii gr ing beetle
iii gr ipe beetle
iv f rong beetle.

Skills builder: Processing and analysing information
8 Refer to Figure 2. How might you adjust the dichotomous key if Dr Redback’s “family” included his sister, Melinda; his mother, Frances; his two daughters, Stef and Gemma (Stef wears glasses); and his pet lizard named Stealth but not a bird named Charlie?
Lesson 2.4 Challenge: Dichotomous key
Aim
To design a dichotomous key
Questioning and predicting
Think about objects that could be sorted into groups using a dichotomous key. The first step is to consider the first two groups you will use. For example, you might like to use snack foods, such as corn chips, flavoured chips or plain chips, or common products, such as bolts, nuts and screws.
Planning and conducting
1 C ompare the similarities and differences of the objects, thinking about how they could be grouped.
2 Identify a feature that can be used to divide the objects into two groups (e.g. corn chips, not corn chips).
3 Select one of the groups (e.g. corn chips) and identify a feature that can be used to divide the objects in this group into two groups (e.g. cheese flavour/not cheese flavour).
4 Repeat steps 1 to 3 until there is just one object in each group.
Processing, analysing and evaluating
1 C onstruct a dichotomous key to show how you grouped the objects.
2 Describe the difficulties of classifying the objects into groups.
Figure 5 Four types of beetles
3 Describe how you would improve your grouping if you repeated the challenge.
Communicating
Swap your dichotomous key with the key created by another group. Ask them to evaluate your key by assessing how easy it was for them to identify the key feature of each object that allowed it to be classified.

Learning intentions and success criteria
DRAFT
Linnaean taxonomy a hierarchical system of classification developed by Linnaeus in which all organisms are grouped into kingdom, phylum, class, order, family, genus and species, with each individual organism known by its genus and species names
Lesson 2.5
The classification system continues to change
Key ideas
→ The Linnaean system has seven main levels of classification.
→ Scientific names are binomial (two names): the genus and the species.
→ The modified Linnaean taxonomy system is still used today.
Giving organisms a precise name
When you try to find your house on Google Earth, you first look for Australia and then the state you live in. Then you narrow your search to your town, your suburb and your street, until you finally find your house.
The Linnaean taxonomy for classifying living things works in a similar way. It starts with large groups called kingdoms and then divides into smaller groups called phyla.

Figure 1 How do you find your house on Google Earth?
Figure 1 Swap your dichotomous key with another group for evaluation.
Each phylum has several classes. The classes have orders, and so on. There are seven different levels to get to the final name of each organism: kingdom, phylum, class, order, family, genus and species. (Tip: Some people use the following mnemonic to remember the Linnaean system: “K ing P hillip C rawled O ver Four G ooey Snails”.)
Linnaeus’s double-name system
Have you eaten a Musa sapientum lately, or have they been too expensive to buy? And did you pat your Canis familiaris this morning? The Linnaean classification system gives every living thing these double names.
Our homes can easily be found by using only the two smallest groups in an address – the street and the suburb. Information about the bigger groups, such as the country or the continent, is not really necessary.
In much the same way, an organism can also be named from the two last groupings on the Linnaean dichotomous key – the genus and the species.

In the double-name (or binomial) system, the genus group name always starts with a capital letter. The second word is the species name and it does not have a capital letter. The double name is always written using italics (sloping letters).
A species is a group of organisms that look similar to one another and can reproduce. When they breed in natural conditions, their offspring are viable, which means they are alive, healthy and are able to reproduce (in other words, they can also breed and have babies when they are adults). Domestic cats belong to the one species because they can breed and have viable kittens but they cannot breed and have viable kittens with other species.
Level of classification
Common name examples
Kingdom Animalia jellyfish, fish, bird, lizard, kangaroo, fox, lion, jungle cat, domestic cat
Phylum Chordata fish, bird, lizard, kangaroo, fox, lion, jungle cat, domestic cat
Class Mammalia kangaroo, fox, lion, jungle cat, domestic cat
DRAFT
Order Carnivora fox, lion, jungle cat, domestic cat
Family Felidae lion, jungle cat, domestic cat
Genus Felis jungle cat, domestic cat
Species catus domestic cat

binomial the double-name system created by Linnaeus to name organisms; the first name is the genus and the second name is the species genus a group of closely related species; taxonomic level between family and species species a group of organisms that look similar to one another, and can breed in natural conditions and produce fertile offspring viable able to survive and grow
Figure 2 Musa sapientum is the Linnaean name for a banana.
Figure 3 The Linnaean classification system uses seven different levels. It is used to give names to living things such as the domestic cat, Felis catus
The changing face of science
After 250 years, scientists are still testing and modifying the Linnaean classification system. The development of microscopes led to the discovery of single-celled organisms (bacteria). This led to the number of kingdoms increasing from three – plants, animals and minerals – to the current five Animalia, Plantae, Fungi, Protista and Monera. In the 1970s, a group of organisms previously thought to be bacteria was discovered to be something else: single-celled organisms that could live in extreme conditions, such as very salty or hot waters. The genetic material (DNA) of these organisms was different from that of other bacteria. This led to the suggestion that a sixth kingdom, Archaea, was needed. Scientists have been discussing this approach of six kingdoms and comparing it with a whole new level that comes before kingdoms.
The “three-domain system” was first suggested in 1990. This system suggests one super domain, Eukaryota, for plants, animals, protists and fungi. The single-celled organisms in kingdom Monera would then be split into two domains (Bacteria and Archaea) according to their genetic material (DNA).


1 Identify the person responsible for the naming system that is still used today to name living things.
2 Recall the seven levels or groups that are used to divide all living things. Write them in order from the largest to the smallest level of organisation.
3 Ex plain how you would know whether two organisms are the same species.
4 Select three animal species. For each species: a descr ibe its appearance b identify its common name and scientific name (the genus and species).
Analyse
5 Identify which two species would be most alike: Felis catus, Canis familiaris and Felis bieti Apply
6 Discuss how an understanding of genetic material changed the classification of bacteria.
Figure 4 (A) Archaea samples can be collected from the hot springs of the Obsidian Pool in Yellowstone National Park, USA, and (B) a magnified view of a clump of Archaean organisms
Skills builder: Planning investigations
7 A teacher is asked to classify a species of butterfly. Suggest how they might find the
information needed to discover its binomial name. (THINK: Does this require primary and secondary sources?)
Lesson 2.6 Kingdoms can be used to classify organisms
Key ideas
→ Taxonomists are scientists who classify living things.
→ The cells of organisms have features that allow us to classify them into five kingdoms: Animalia, Plantae, Fungi, Monera and Protista.
Building blocks of life
Cells are often called the building blocks of life. They can only be seen through a microscope. Think of the way bricks are used to build a house. Cells build living things in a similar way. However, there are usually many more cells in living things than bricks in a house. Any living thing with more than one cell is multicellular (Figure 1A and B). Many living things, such as bacteria, consist of only one cell. These are single-celled or unicellular organisms (Figure 1C).
Learning intentions and success criteria
Check the next lesson for a linked practical activity or experiment.
multicellular an organism consisting of two or more cells unicellular an organism consisting of only one cell; an example is bacteria

Figure 1 (A) Simple animal cell, (B) plant cell and (C) bacterial cell Nucleus
Cell wall
A B C
taxonomist a scientist who classifies living things into groups
nucleus a membrane-bound structure in cells that contains most of the cell’s genetic material (DNA)
cell wall a structure that provides support around the cell in some organisms, such as plants and fungi
Parts of a cell
Taxonomists looking through a microscope ask three questions when they are trying to classify the cells of an organism:
1 Does the cell keep all of its genetic material (called DNA) inside a nucleus? The nucleus protects the DNA that carries all the instructions for living and reproducing.
2 Does the cell have a cell wall around it for extra support?
3 Does the cell use sunlight to make its own nutrients (autotroph)? Plant cells can do this, but fungi (like mushrooms) need to absorb their nutrients from other living things (heterotrophs).
These three features are used to divide all living things into five large groups called kingdoms: Animalia, Plantae, Fungi, Monera and Protista.
Kingdom Animalia
Animalia taxonomic kingdom that includes all animals; all organisms in Animalia are multicellular with a nucleus in their cells (eukaryotes)
Plantae taxonomic kingdom that includes all plants; organisms in Plantae are multicellular or unicellular and they all have a nucleus in their cells (eukaryotes)
DRAFT
Fungi taxonomic kingdom that includes all fungi; organisms in Fungi are multicellular or unicellular and they all have a nucleus in their cells (eukaryotes)
All organisms in the kingdom Animalia are multicellular. Each cell stores its genetic material in a nucleus but does not have a cell wall. Animals gain energy from other living things (they are heterotrophs). We belong in this kingdom. Zoologists are the scientists who study animals.
Kingdom Plantae
Kingdom Plantae include trees, vines, bushes, ferns, mosses, weeds and grasses (Figure 3). They all gain energy by converting the energy from sunlight into food (they are autotrophs). They are multicellular and their cells are surrounded by a cell wall. Their genetic material is stored inside a nucleus in each cell. Botanists are the scientists who study plants.
Kingdom Fungi
Kingdom Fungi includes mushrooms, toadstools, yeasts, puffballs, moulds and truffles (Figure 4). Some fungi grow in wood and soil, and develop from tiny spores. Fungi store their genetic material in a nucleus and do not make their own food (they are heterotrophs). Instead, they feed on the remains of dead animals and plants. Some fungi can cause diseases, such as tinea (athlete’s foot). Mycologists are the scientists who study fungi.


Figure 2 Kingdom Animalia: the proboscis monkey (Nasalis larvatus)
Figure 3 Kingdom Plantae: the world’s smelliest plant, genus Rafflesia , is found in South-East Asia. Its flower can measure up to 90 cm across and weigh about 11 kg, and when it blossoms it gives off a rotten meat odour that attracts insects.
Figure 4 Kingdom Fungi: mushrooms
Kingdom Monera
Kingdom Monera is made up of the simplest and smallest living things. There are approximately 75,000 different organisms in Monera, and they are all unicellular and have a cell wall but no nucleus. Bacteria are the most common in this kingdom. Many people think of bacteria as harmful to humans, but this is not always true.

Bacteria in the soil break down rubbish and wastes produced by animals (especially humans). Without bacteria, we would be surrounded by mountains of smelly rubbish. Bacteria have been put to use by humans to make food, such as cheese and yoghurt (Figure 5). Microbiologists are the scientists who study microorganisms in the kingdoms of Monera and Protista.
Kingdom Protista
There are approximately 55,000 species in the kingdom Protista (protists). Their cell structure is more complex than that of the species in Monera. Often, organisms that do not fit into any other kingdom will belong in Protista. Protists range in size from single-celled organisms to much larger ones, such as kelp (seaweed). They all have one feature in common: they store their genetic material in a nucleus. Plankton, the tiny sea creatures eaten in their millions by whales, are part of this kingdom. Amoebas, microscopic organisms that change their shape to trap their food, also belong to this kingdom (Figure 6).

Monera taxonomic kingdom that includes bacteria and archaea; all organisms in Monera are unicellular with no nucleus (prokaryotes) bacteria unicellular organisms that have a cell wall but no nucleus
1 Identify where a plant cell stores its genetic material (DNA).
2 Name four features of the kingdom Fungi.
3 Define the term “multicellular”.
4 Name an organism made up of just one cell.
Analyse
Protista taxonomic kingdom that includes amoeba and plankton; most organisms in Protista are unicellular and they all have a nucleus in their cells (eukaryotes) plankton microscopic organisms that float in fresh or salt water amoeba a type of single-celled organism belonging to kingdom Protista
5 C ontrast (the differences between) a protist and a bacteria cell.
6 Compare (the similarities and differences between) the cells in the kingdom Plantae and those in the kingdom Fungi.
Figure 5 Kingdom Monera, as seen under a microscope: Lactobacillus casei , a helpful bacteria used to make some dairy foods
Figure 6 Kingdom Protista, as seen under a microscope: amoeba
Apply
7 Discuss why the invention of the microscope was important to our understanding of living things.
Skills builder: Communicating
8 C onstruct a table that compares and contrasts the structural features of each kingdom. (THINK: How can you group features together?)
Lesson 2.7
Challenge: Classifying living things
The scientist whose main role is to classify living things is known as a taxonomist. In this activity, you become the taxonomist.
Aim
To use the identifying features of different organisms to classify them into kingdoms
What you need:
• A 3 card or paper
• P ictures of different living things from Figure 1 (or from the internet or magazines)
• Scissors
• Glue
DRAFT

Figure 1 A collection of living things
What to do:
1 On a sheet of A3 card or paper, draw a table with four columns.
2 L abel the columns “Animalia”, “Plantae” “Fungi” and “Other (Monera and Protista)”. (Do not try to distinguish between Monera and Protista.)
3 P rint out Figure 1.
4 Cut and paste each of the pictures in Figure 1 into the correct column of your table.
Questions
1 Describe the identifying features for each kingdom.
2 Identify one organism that was difficult to classify. Discuss why it was difficult to identify the key feature that allowed it to be classified.
Lesson 2.8 Animals that have no skeleton are called invertebrates
Key ideas
→ Kingdom Animalia contains approximately 35 phyla.
→ The two main groups in the kingdom Animalia are vertebrates and invertebrates.
→ Endoskeletons are skeletons that are found inside the animal.
→ Exoskeletons are hard skeletons or shells that are found on the outside of the animal.
Internal or external skeleton?
In the same way as using a dichotomous key, dividing the animal kingdom into groups first requires a question. The system scientists use to divide animals into groups is based on the animals’ features. The question is: “Does this animal have an internal or external skeleton?”
DRAFT
Animals with an internal skeleton (called an endoskeleton), such as cats, humans and birds, are known as vertebrates. Because these animals often have a spinal cord that threads its way along the vertebrate bones, the phylum is called Chordata.
Animals with an external skeleton (exoskeleton), such as beetles and crabs, and those with no skeleton at all, such as slugs, are known as invertebrates. Invertebrates dominate the animal kingdom.
Learning intentions and success criteria
Check the next lesson for a linked practical activity or experiment. endoskeleton an internal skeleton
vertebrate an organism that has an endoskeleton and a spine
exoskeleton an external skeleton
invertebrate an organism that has an exoskeleton or no skeleton
phylum taxonomic level between kingdom and class
Invertebrates
There are many more invertebrates on Earth than there are vertebrates: 96 per cent of all animals are invertebrates. Invertebrates have either an external skeleton (exoskeleton) or no skeleton at all. As well as enormous animals, such as the giant squid (Figure 1), thousands of tiny insects and other creatures belong to the invertebrate group.
Identifying invertebrates
In the same way that vertebrates are classified, invertebrates are grouped into six main phyla (singular: phylum) on the basis of their characteristics. Characteristics used to classify invertebrates include the presence of a shell or hard cover, tentacles or spiny skin. Organisms with similar features are placed in the same group. The tabular key in Table 1 can be used to place an organism in a particular phylum.
Table 1 Tabular key for identifying invertebrates
1 Body spongy, with many holes
Body not spongy
2 Soft body, no shell
Outside shell or hard cover
Many tentacles or arms
3
4
Long body without tentacles

Figure 1 The giant squid is an invertebrate.
Tentacles around the mouth of a sac-like body
Arms with suction discs
5 Soft body, large foot (muscular organ used for movement)
Worm-like or leaf-like
6 Proper shell or smooth, hard covering
Spiny skin with rough covering
7 Limbs in pairs
Shell, no segments, large foot (muscular organ used for movement)
Poriferan
Go to 2
Go to 3
Go to 6
Go to 4
Go to 5
Cnidarian
Mollusc
Mollusc
Nematode, platyhelminth or annelid
Go to 7
Echinoderm
Arthropod
Mollusc
In the kingdom Animalia there are more than 40 phyla of invertebrates. Some of the most common are listed below.
Arthropods
Arthropods have segmented bodies, paired and jointed legs and an exoskeleton. Examples include insects, spiders (Figure 2A), centipedes and scorpions.
Poriferans
Poriferans have spongy bodies with holes and are found in water, attached to rocks. Examples include breadcrumb sponges (Figure 2B) and glass sponges.
Cnidarians
Cnidarians have soft, hollow bodies with tentacles and live in water. Examples include coral, sea jellies (Figure 2C) and anemones.
Nematodes, platyhelminths and annelids
Nematodes, platyhelminths and annelids have soft, long bodies and can be segmented, flat or round. Examples include leeches (Figure 2D), tapeworms and flatworms.
Echinoderms
Echinoderms have rough, spiny skin, their arms radiate from the centre of the body, and they are found in the sea. Examples include sea urchins, sea cucumbers and brittle star (Figure 2E).
Molluscs
Molluscs have soft bodies and usually have a protective shell. Examples include snails (Figure 2F), octopuses and oysters.


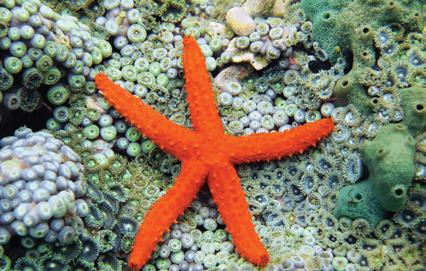


Figure 2 Some common invertebrate phyla: (A) spider, (B) breadcrumb sponge, (C) sea jelly, (D) leech, (E) brittle star and (F) snail
Check your learning 2.8
Check your learning 2.8
Retrieve
1 A nimals are divided into two main groups.
a Identify the names of the groups.
b Name the main characteristic of each group.
2 State the percentage of animals that are invertebrates.
3 Recall two examples of animals with an exoskeleton.
4 Recall two examples of animals with no skeleton at all.
Analyse
5 Beetles have segmented bodies and jointed legs. Identify the phylum that contains the beetles.
6 Consider an animal with the following characteristics: a non-spongy soft body, with many tentacles around the mouth. Use Table 1 to identify the group that a scientist would place it in.
Apply
7 E ighty per cent of animals on Earth are arthropods.
a Discuss what characteristic the name arthropod suggests. (Hint: Consider “arthritis” and “podiatrist”.)
b Draw three different arthropods and label the features that make them part of this phylum.
Lesson 2.9
DRAFT
Skills builder: Processing and analysing information
8 Use the tabular key (Table 1) to classify the organism in Figure 3. (THINK: What features can you observe to answer the questions in the key?)

Experiment: Dissecting skeletons
Caution!
• Scalpels are extremely sharp. Use with great care.
• A lways wear gloves when handling the animals. Some students may have latex allergies and will need to use latex-free gloves.
• A nimals must always be on the dissecting board when they are being handled or dissected.
• Cut away from hands.
• I f you cut yourself, remove the gloves and wash the cut under clean water. Tell your teacher. Apply antiseptic to the cut and cover it with a dressing.
Figure 3 How would you classify this organism?
Aim
To examine the skeletal structures of three marine organisms
Materials
• 1 f ish (whole)
• 1 prawn
• 1 squid
• D issecting board
• D issecting kit
• Newspaper
• Pair of vinyl or latex gloves
• D isinfectant
Method
1 Observe the external features of the fish.

2 Carefully cut the fish in half lengthways so that you can see the internal skeleton.
3 Observe the skeleton of the fish.
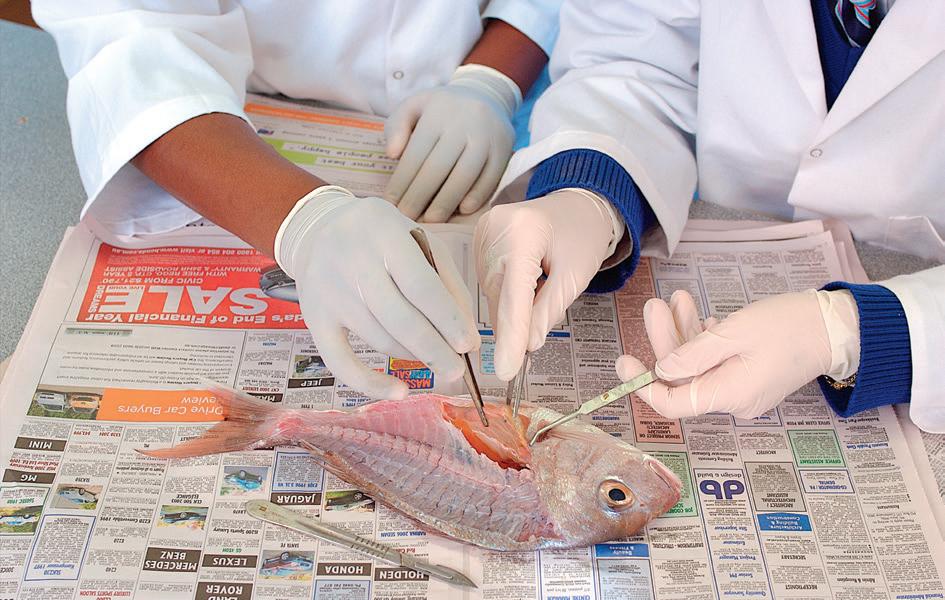
4 Touch the outside surface of the prawn. Identify the connections between the hard surfaces. Peel the outer shell off the prawn.
5 Cut the prawn in half lengthways and observe the insides.

DRAFT
6 Feel the outside surface of the squid.
7 Cut the squid in half lengthways and observe the insides.

8 Place scalpels in a container to be cleaned. Wrap dissected fish, squid and prawn in the newspaper. Place in a sealed plastic bag with disinfectant and dispose of in the general rubbish bin.
Results
Draw labelled diagrams of the skeleton of each specimen.
Figure 1 Observe the external features of the fish.
Figure 2 Cut the fish in half lengthways.
Figure 3 Cut the prawn in half lengthways.
Figure 4 Cut the squid in half lengthways.
Discussion
1 Consider the fish.
a Identify the location of the fish skeleton.
b Identify the type of skeleton found in the fish.
2 Consider the prawn.
a Identify the location of the prawn skeleton.
b Identify the type of skeleton found on the prawn.
3 Describe how the squid maintains its shape.
4 Identify the group (vertebrate or invertebrate) that each of the organisms –fish, prawn and squid – belongs to. Justify
Lesson 2.10
your answer by comparing the key features that are used to identify the classification group with features you identified on your organism.
5 Identify the classification group to which you belong (vertebrate or invertebrate). Justify your answer by comparing your features with the features that are used to identify your chosen group.
Conclusion
Describe the types of skeletons that you observed and how they helped you classify the organisms.
Challenge: Identifying invertebrates
Aim
To use the identifying features of invertebrates to classify using a tabular key
What you need:
• Vinyl or latex gloves
DRAFT
• Tweezers
• Jars with lids
• Paper
• Pencil
• M agnifying glass or stereomicroscope
• Petri dishes
Alternatively, your teacher may provide prepared samples for you to look at. Complete the classification exercise for each prepared sample.
What to do:
1 Visit a local natural environment (e.g. a garden, beach, park or pond) and observe invertebrate specimens.
2 Wearing gloves, use tweezers to collect up to 10 invertebrate specimens in separate jars.
• Do not touch any animal that might bite or sting. Check with your teacher if you are unsure.
• Use tweezers to pick up the animals.
• Place any animal immediately in a jar and secure the lid.
3 Use the tabular key in Table 1 in Lesson 2.8 Animals that have no skeleton are called invertebrates (page 98) to classify each invertebrate into its phylum.
4 Sketch each invertebrate. Use a magnifying glass or stereomicroscope to help you observe their features. Write the common name for the invertebrate (if you can) and write its classification group (phylum) under the drawing.
5 Return the invertebrates to their natural environment after you have finished.

Questions
Lesson 2.11
1 Identify the common characteristic of all the invertebrates you observed.
2 Describe the key characteristics that allowed you to recognise and classify the organisms you collected.
Vertebrates can be organised into five classes
Key ideas
→ Vertebrates are animals with a spine or backbone.
→ Vertebrates can be divided into classes based on their body covering, how their young are born and their body temperature.
DRAFT
→ Endotherms have a constant body temperature.
→ Ectotherms have a body temperature that changes with the environment.
Check the next lesson for a linked practical activity or experiment. Learning intentions and success criteria
Figure 1 Some common invertebrates
class taxonomic level between phylum and order
endotherm an organism that has a constant body temperature regardless of the temperature of its environment
Introduction
Vertebrates are animals that have bones or skeletons on the inside of their body. We often use the term “vertebra” to describe the bones that make up our backbone. These bones protect the special nerves that run from our brain to the rest of our body. There are five groups or classes of vertebrates: Mammalia, Aves, Reptilia, Amphibia and Pisces.
Class Mammalia
All mammals belong in the class Mammalia. Mammalia is a class of vertebrates well known to many people. Many of our pets belong to this class: horses, dogs, cats, rabbits, guinea pigs and mice. We belong to this class too.
Mammals are animals with hair or fur. They are known as endotherms because they can keep their body temperature constant. This means their body temperature remains the same despite the environment being hot or cold. Female mammals give birth to live young and feed their young with their own milk.
Class Mammalia can be further divided into three subgroups (Figure 1). The main feature used to separate mammals is the way in which their young develop.
• Monotremes are platypuses and echidnas. They lay soft-shelled eggs that contain immature young.
• M arsupials, such as kangaroos and wombats, are mammals with pouches. Their young are born immature and need to spend the first few months in their mother’s pouch.
• Placentals, such as dingoes and humans, give birth to live young. The unborn young are given nutrients via a placenta inside the mother’s uterus.


Class Aves
All birds belong in the class Aves. Like mammals, they are endotherms (having a constant body temperature). Two of their main distinguishing characteristics (the way they differ from the other classes) are their covering of feathers and their scaly legs (Figure 2). All animals in this class lay eggs with a hard shell.

Figure 1 The three subgroups of mammals: (A) monotremes lay soft-shelled eggs; (B) marsupials are born immature and need to spend the first few months in their mother’s pouch; (C) placentals are born with the general shape of the adult animal.
A C B
Figure 2 Class Aves: a cockatoo
Class Reptilia
Reptiles, such as snakes (Figure 3) and lizards, belong in the class Reptilia. The skin of reptiles is usually covered in a layer of fine scales. Reptiles use lungs to breathe, even if they live under water (sea snakes). These animals are ectotherms because their body temperature is always very similar to the environment. We do not use the term “cold-blooded” to describe these animals because a lizard that has been lying in the sun has very warm blood, even though at night its blood is cool. Turtles also belong to this class. Many people are confused by the hard outer shell of turtles and tortoises, thinking it is an exoskeleton. Underneath the shell there is a hard backbone with a spinal cord running through it (Figure 4).
Class Amphibia
Amphibians, such as frogs, belong in the class Amphibia. Like reptiles, amphibians are ectotherms; however, the skin of amphibians is usually soft and slimy to touch. They lay their eggs, which do not have hard shells, in water. For the first part of their life, amphibians have gills and live in the water. As they get older, lungs develop and they become able to live on land. The only remaining group of native amphibians in Australia is frogs. In other parts of the world, caecilians and salamanders may be found.
Class Pisces


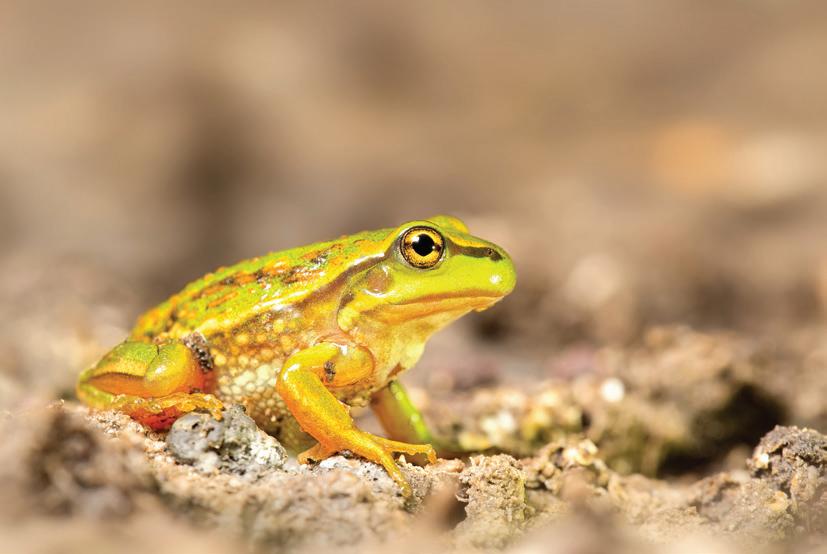

Fish belong in the class Pisces. Most fish are ectotherms. They are covered in a layer of scales and most have fins. They spend all their life in water and need gills to breathe. Fish are further grouped according to their skeleton. Sharks, rays and skates have a skeleton made entirely of cartilage, whereas all other fish have bony skeletons.
ectotherm an organism with a body temperature that changes with the environment
Figure 3 Class Reptilia: a king brown snake
Figure 4 Despite having a hard outer shell, turtles and tortoises have a hard backbone with a spinal cord running through it.
Figure 5 Class Amphibia: a growling grass frog
Figure 6 Class Pisces: a tuna
Check your learning 2.11
Check your learning 2.11
Retrieve
1 T he vertebrates have five classes: Mammalia, Reptilia, Amphibia, Aves and Pisces. Identify the common names for each of these classes.
Comprehend
2 Describe the main characteristics of mammals.
Analyse
3 C ontrast the appearance of a placental mammal when it is born with that of a monotreme and a marsupial.
Apply
4 A dolphin lives in the ocean and has fins. It breathes air, gives birth to live young and feeds them milk. Identify the class that the dolphin belongs in. Justify your answer
Lesson 2.12
(by comparing the characteristics of the class with the characteristics of the dolphin).
5 A f lying fox can glide through the air like a bird but is covered in fur. Identify the class that the flying fox belongs in. Justify your answer.
6 Seals have fins like fish and live on the land and in the water like amphibians.
a Investigate how a seal’s young are born.
b Given that the seal has long whiskers, is endothermic and breathes air, identify the class of vertebrate in which a seal belongs.
Skills builder: Communication
7 C onstruct a dichotomous key to show the five classes of vertebrates. (THINK: What information needs to be included to explain the different classes to someone who does not know about them?)
Challenge: Who are the vertebrates?
Aim
DRAFT
To identify a variety of different vertebrates
What you need:
• A 3 paper
• Pencils
What to do:
Task 1: Vertebrate alphabet graffiti
This task could also be completed as a webpage, with images and links to further information about each animal.
1 Your teacher will divide your class into five groups. Each group will be allocated one class of vertebrate.
2 L abel an A3 sheet of paper with the name of your class of vertebrate.
3 Write the letters of the alphabet down the left-hand side of the page.
4 Identify an animal in your class of vertebrate that starts with each letter. When finished, you will have the names of up to 26 different vertebrates. Some letters will be harder to complete than others.
5 P ut the finished sheets up around the room.
Task 2: Jellyfish organiser for vertebrates
A jellyfish graphic organiser is a good way to show how subgroups make up a whole. It can also be used to list specific examples at the same time.
1 I ndividually, go around to each of the five lists of vertebrates from Task 1 and select six animals from each class.
2 On a full page, draw five “jellyfish” connected to the main group (vertebrates), as shown in Figure 1. BirdsMammalsFishReptilesAmphibians Vertebrates
Figure 1 A jellyfish organizer for vertebrates
3 Identify the common name of each class (birds, mammals, fish, reptiles and amphibians) and label each jellyfish.
4 Describe the characteristics of each class under each jellyfish.
5 C lassify the six animals you selected from each class by placing them along the six tentacles of each jellyfish.
Lesson 2.13
Plants
can
be classified according to their characteristics
Key ideas
→ Plants have a variety of different characteristics that allow them to be classified into different phyla.
→ Plants can reproduce using spores or through pollination to create seeds.
→ The two groups of flowering plants are monocots and dicots.
→ Some plants use vascular tissue to transport water to the leaves.
Learning intentions and success criteria
Check the next lesson for a linked practical activity or experiment.
spore a tiny reproductive structure that, unlike a gamete, does not need to fuse with another cell to form a new organism
Seeds or spores?
Planting a seed and watching it grow is something many people do. But not all plants have seeds. Some plants, such as ferns, produce spores. Spores are much smaller than seeds and only contain half the genetic material needed to make a fern. They can be found clinging to the underside of a fern frond (Figure 1).
Vascular tissue

vascular tissue in a plant, tube-like structures that transport water from the roots to the leaves
Plants, like all living things, need water to survive. Many plants use their roots to absorb water and transport it through tube-like structures to the leaves. This system of tubes is called the vascular tissue of the plant and these plants are called vascular plants.
Not all plants have vascular tissue. Many plants, such as mosses and liverworts, need to live in damp places where they can absorb water through all parts of their structure (Figure 2). These plants are called non-vascular plants.
The importance of flowers
pollination the transfer of pollen to a stigma, ovule, flower or plant to allow fertilisation
DRAFT
monocotyledon flowering plant that has one leaf growing from the seed
Most plants in your school or home garden produce flowers. Flowering plants are called angiosperms. Flowers are the way plants attract birds and insects to encourage pollination. Pollination is the transfer of pollen from the male part of a plant to the female part of a plant. Plants with flowers use pollination to reproduce (produce seeds).


Not all plants have true flowers. Conifers have needle-like leaves and produce cones instead of flowers (Figure 3). Pollen from one cone is often transferred to another cone (pollination) so that a seed can be produced. Plants that produce seeds without true flowers are called gymnosperms.
Monocots and dicots
Flowering plants can be divided into two main groups: monocotyledons and dicotyledons. Monocotyledons (monocots) have a single leaf that grows from the seed. They can usually be recognised by the parallel veins in the leaves and by
Figure 1 Not all plants germinate from seeds. Ferns produce spores instead.
Figure 2 Mosses and liverworts can absorb water through all parts of their structure.
Figure 3 Some plants (gymnosperms) use cones to produce seeds.
counting the number of petals in the flowers. Monocot flowers always have petals that are multiples of three (Figure 4).
Dicotyledons (dicots) grow two leaves from the seed. Their leaves have veins that are reticulated (spread out from a central vein), and they tend to have four or five petals on each flower (Figure 5).
The dichotomous key in Figure 6 can be used to classify plants using their features.


dicotyledon flowering plant that has two leaves growing from the seed
1 Describe how ferns and conifers
2 Use the key in Figure 6 to identify the features of the following plants: a ferns b mosses
3 Use the key in Figure 6 to identify the following plants: a fr uit tree b
e
Figure 4 The number of petals on a monocot flower is always a multiple of three.
Figure 6 A plant dichotomous key
Figure 5 Dicot flowers usually have four or five petals.
f moss on the path g rose bush h vegetables
i pine tree
j g rass and lawn.
4 C ontrast (the differences between) vascular and non-vascular plants.
5 W ho am I? I am large and green. I use sunlight to make my own food. I smell nice and like to come inside at Christmas. Some people do not like me because my leaves can be prickly and needle-like. I make seeds but use cones rather than flowers to reproduce. Use Figure 6 to c ategorise me into the plant group I belong to.
Apply
6 L ocate a plant in your garden.
a Create a labelled diagram of the plant.
b Identify the features that could be used to classify the plant.
c Propose at least one feature that is not currently present that would help you to classify the plant.
d Use Figure 6 to classify the plant.
Skills builder: Problem solving
Lesson 2.14
Aim
To identify the different characteristics that can be used to classify a plant
What you need:
• Camera
DRAFT
7 I s it better to be a vascular or non-vascular plant in a dry climate? Evaluate the advantages of vascular plants and nonvascular plants for surviving in dry weather.
(THINK: Describe the features that help each type of plant to survive and compare them to make your decision.)
Challenge: Identifying plants
What to do:
1 Observe and take digital photos of at least five different types of plants from a local bushland or from your garden.
2 M ake detailed observations of each plant, including:
a the height of the plant
• Measuring tape
• Pencils
• Paper
b the width of the plant
c the shape, smell, texture and size of the leaves (take a close-up photo of the leaves)
d the position and number of leaves on the plant.
3 Describe the plant’s flowers, seeds or nuts.
4 Describe any other unusual or special features of the plant.
5 Repeat steps 2 to 4 for all the plants you observed.
Questions
1 Identify and describe the features the plants have in common.
2 C ontrast the features that you have observed between the plants.
3 C reate a dichotomous key showing these features that can be used by students in other year levels.

Lesson 2.15
The first Australian scientists classified their environment
Key ideas
→ Despite the harsh climate, Australia is home to thousands of different organisms.
→ Aboriginal and Torres Strait Islander Peoples were the first to identify and classify the organisms that are unique to Australia.
The Australian environment
DRAFT
Early European visitors to Australia often depended on the Aboriginal and Torres Strait Islander Peoples to identify and describe the plants and animals that were new and unfamiliar to them. This can be seen in the names that were given to Australian animals “discovered” by European scientists. Uniquely Australian mammals such as the wulaba (wallaby), buduru (potoroo), wularu (wallaroo), wumbat (wombat) and dingu (dingo) were all first classified by the Dharawal people of the Sydney basin region in New South Wales.
Learning intentions and success criteria
Figure 1 Plants can be identified from their features.
Anangu classification system
When Europeans first visited Uluru and Kata Tjuta (the Olgas) in the 1870s, they were confronted with a harsh landscape. Their initial aim was to find a route for the overland telegraph line from Adelaide to the Top End and to set up pastures for sheep and cattle grazing. They soon decided that the region was unsuitable and left.
In contrast, the traditional owners of the land, the An angu people of the Western Desert region in central Australia, which includes Uluru and Kata Tjut a, have lived on this land for thousands of years and understand it well. The Anangu people classify their environment to help them navigate and manage Country. They use the following names:
• puti: open woodland; after the rains, this area has an abundance of grass, which the kangaroos eat, and honey ants build their nests in this area
DRAFT
• pila: spinifex plains, low areas between dunes; this is the best place to gather seeds to eat
• puli: rocky areas, gorges, stony slopes; animals come to this area to find shelter and water.


Mammals are rarely seen during the day in Ulur u-Kata Tjuta National Park. Most are nocturnal and come out in the evening, avoiding the heat of the daytime desert.
Mammals are divided into three groups, placentals, marsupials and monotremes. Australia has unique populations of monotremes found nowhere else in the world. This initially confused European classification scientists who did not believe such animals as the platypus and echidna existed as they did not fit into the classification system that existed at the time.
As Australia has been an island for a long time, it also has a unique population of marsupials. Marsupials such as the bilby (t jalku), which is a very important animal for the Anangu people, give birth to underdeveloped young. They protect


Figure 1 Puti habitat
Figure 2 Pila habitat
Figure 3 Puli habitat
Figure 4 Another example of puli habitat
Figure 5 A bilby (t jalku)
their young by having a pouch in which further development can occur. The pouch is similar to that of a kangaroo; however, it is a backward-opening pouch. When the young are fully developed, they can leave the pouch and survive the harsh climate.
Yanyuwa classification system
The Yanyuwa people of the Gulf of Carpentaria region in the Northern Territory classify all organisms according to where they are found. Their classification system is first divided into two broad categories: coastal/marine or inland. This is then further divided according to the characteristics of the organism.
For example, walya can refer to all dugongs and sea turtles. This is divided into 16 further names according to the dugong’s age, size, biological sex, and even the leadership position the dugong has within its herd. This classification is much more detailed than the descriptions in the Linnaean system and demonstrates a scientific interest in life cycles and behaviour of living things.
Check your learning 2.15
Check your learning 2.15
Retrieve
1 T he A nangu people of the Western Desert region have many names for the different reptiles that live on Country; however, they have fewer names for amphibians. Identify the characteristics of amphibians that would make it difficult for them to live in arid environments.
Comprehend
2 M any early European settlers may have initially thought the bilby (t jalku) was a rat. Identify one reason why they would have made this mistake.
3 Ex plain why the Anangu people devised a system of classification for the natural habitats around them.
Analyse
4 Discuss why monotremes would find it difficult to breed in arid environments.
Apply
5 I nvestigate the animals found in the Ulu r u-Kata Tjuta National Park. Choose
five animals and classify each animal as a mammal, reptile, bird or invertebrate.
6 I nvestigate the kind of environment that the Anangu people lived in and the foods they ate to survive. List at least five animals and five plants they ate.
7 I n a group of four, use a large sheet of paper to create two collages about what you would expect to find in Ulur u-Kata Tjuta National Park. The first collage should show living things; and the second should show nonliving things. One pair should create the “living” collage and the other pair should create the “non-living” collage.
8 I nvestigate which mammals can be found in Australia’s arid environments.
9 C lassify each of these mammals as a placental, monotreme or marsupial.
a List the scientific name (genus and species) of each animal.
b C lassify and name one of these mammals using a classification system of a group of Aboriginal and Torres Strait Islander Peoples.


Lesson 2.16 Science as a human endeavour: Taxonomists classify new species
Introduction
Taxonomists are scientists who research the classification of new species. There are many organisms in Australia that are yet to be identified. Primary and secondary data must be identified and analysed in order to classify and name a new organism.
Unique specimens
When a new organism is discovered, it must first be compared with other known organisms to determine if it is different and unique. This is not as simple as it might first seem. For example, in 2012, a new species of horse fly was identified in Queensland by Australian entomologist Bryan Lessard.
Like many insects, flies have different stages in their life cycle (Figure 1). When a specimen is collected, it is not always known if it is a fully mature organism. The specimen needs to be compared with other type specimens. A type specimen is usually one of the first organisms of a species that was collected and preserved. It could be a dried plant, a preserved animal or a fossil. These specimens are usually stored in a museum or herbarium.


In 2018, the Australian National Insect Collection was digitised to preserve their almost 15 million biological specimens (Figure 2). Each specimen was photographed under a microscope and the details recorded. Citizen scientists (members of the public who collect and record data) then recorded the information from the


type specimen the specimen used for naming and describing a new species
1st larval stage
Adult fly Eggs
3rd larval stage
2nd larval stage Pupa
Figure 1 The fly has many different stages.
Figure 2 This leafcutter bee was collected in Canberra in 1934 and is now stored in the Australian National Insect Collection.
individual labels, allowing the taxonomists to use this information to create an online key that can be used to identify new specimens.
Naming specimens
There are many rules that must be followed when a new organism is identified. Before it can be named, the organism must be accurately described, drawn and a type specimen preserved. The phylum, class, order and genus must be identified before the species can be named. One of the rules is that the organism cannot be named after the scientist who discovered it. This means if you did find a new species and went through the taxonomy process, you could not use your own name.

This does not mean you cannot name it after someone else. Many famous people have animals named after them. After naming almost 50 different species of flies, Lessard named the horse fly with a golden back Scaptia beyonceae, after the singer Beyoncé (Figure 3).
Other taxonomists use names that indicate their sense of humour, including beetles named “not another one” (Cyclocephala nodanotherwon) and flies named “piece of cake” (Pieza kake).
Test your skills and capabilities
Primary and secondary data
There are two sources of data that can be used in scientific research such as taxonomy. Primary data is data collected directly by the scientist. Secondary data is data that has already been collected by other scientists. When naming a new organism, the primary data includes the drawings and descriptions of newly discovered organisms. This is then compared with the secondary data, such as other samples that are stored by the CSIRO in the National Research Collections Australia. However, not all secondary sources of information are as trustworthy as the CSIRO.
Identify a source of information located on a website of your choice and answer the following questions.
1 Identify who wrote the information or gathered the data. Did they make their observations or measurements in a fair manner, or were they biased (had already decided what they wanted to observe)?
2 I s the source of information a primary source (did the authors make the measurements themselves) or a secondary source (reporting on other people’s observations)?
DRAFT
3 W hen was the information generated? How old is the data? Is it still relevant to your needs?
4 W hy did the author write the information or gather the data? Did they want to convince the reader of their view of the world? Does the author gain anything from publishing the data?
5 W hy is it important for taxonomists to be careful in their approach to using primary and secondary data when identifying and naming new species?
primary data information that is collected directly by a researcher for a specific research project secondary data any data collected by a person other than the one using it
Figure 3 Scaptia beyonceae was named after the singer Beyoncé.
Lesson 2.17
Review: Classification
Summary
Lesson 2.1 Classification organises our world
• Classification systems help scientists to organise and communicate the findings of their research.
• Scientists identify all living things through scientific names.
• Carolus Linnaeus developed the modern Linnaean classification system.
Lesson 2.2 Living organisms have characteristics in common
• Biology is the study of living organisms and what it means to be alive.
• L iving things move, reproduce, need nutrition, grow, respond to change, exchange gases, produce waste and need water.
• Dead organisms were once living.
Lesson 2.3 Classification keys are visual tools
• A key is a visual tool used in the classification of organisms.
• A branched key can show the relationship between different organisms.
• Scientists use keys to identify the scientific name of an organism.
Lesson 2.5 The classification system continues to change
• T he Linnaean system has seven main levels of classification.
• Scientific names are binomial (two names): the genus and the species.
Lesson 2.8 Animals that have no skeleton are called invertebrates
• K ingdom Animalia contains approximately 35 phyla.
DRAFT
• T he modified Linnaean taxonomy system is still used today.
Lesson 2.6 Kingdoms can be used to classify organisms
• Taxonomists are scientists who classify living things.
• T he cells of organisms have features that allow us to classify them into five kingdoms: Animalia, Plantae, Fungi, Monera and Protista.
• T he two main groups in the kingdom Animalia are vertebrates and invertebrates.
• E ndoskeletons are skeletons that are found inside the animal.
• E xoskeletons are hard skeletons or shells that are found on the outside of the animal.
Lesson 2.11 Vertebrates can be organised into five classes
• Vertebrates are animals with a spine or backbone.
• Vertebrates can be divided into classes based on their body covering, how their young are born and their body temperature.
• E ndotherms have a constant body temperature.
• E ctotherms have a body temperature that changes with the environment.
Lesson 2.13 Plants can be classified according to their characteristics
• Plants have a variety of different characteristics that allow them to be classified into different phyla.
• Plants can reproduce using spores or through pollination to create seeds.
• T he two groups of flowering plants are monocots and dicots.
• Some plants use vascular tissue to transport water to the leaves.
Lesson 2.15 The first Australian scientists classified their environment
• Despite the harsh climate, Australia is home to thousands of different organisms.
• Aboriginal and Torres Strait Islander Peoples were the first to identify and classify the organisms that are unique to Australia.
Review questions 2.17
Review questions
Retrieve
1 Identify a reason for classifying living things.
A C lassification helps scientists invent more ways of discussing organisms.
B C lassification helps scientists to communicate new discoveries.
C C lassification helps scientists to keep new information to themselves.
D C lassification helps scientists to shelter living things.
2 Identify which of the following is an example of a microorganism.
A Bacterium
B C hicken
C Kelp
D Sand
3 Identify an example of plants moving by themselves.
4 Name the five main classes of vertebrates and give an example of each.
5 Name two phyla of invertebrates and give an example of each.
Comprehend
6 Describe the advantages of using a dichotomous key.
7 Ex plain why it is important for taxonomists to use a common system to group all living things on Earth.
8 Describe two ways the classification system has changed since Carolus Linnaeus first identified three kingdoms of plants, animals and minerals.
9 Identify a plant (or plants) that has the following characteristics.
a Spores
b Seeds
c Vascular tissues
10 Identify an example of a plant that does not have flowers with petals. Describe the alternative structure that allows the plant to produce seeds.
11 “Biodiversity” is the word used by scientists to describe a variety of different organisms in the same region. Explain why it is important to preserve a large biodiversity of plants and animals in the world.
12 I magine that an unknown organism was discovered during a space mission and brought back to Earth. Briefly describe two different methods that scientists could use to decide whether it was living or non-living.
Analyse
13 Compare the identifying characteristics of each of the five kingdoms.
14 C ontrast a monocotyledon leaf and a dicotyledon leaf.
15 C ontrast vertebrates and invertebrates by writing a definition for each.
16 C ategorise the items from the following list into the correct columns in Table 1.
a Stewed apple
b Phone
c Da ffodil bulb
d Headphones
e H airs in your brush
f Your teacher
g Shark’s tooth
h G erms
i Soft drink bottle
j Your pet
k Silver chain
l D inosaur skeleton
Table 1 Living or non-living?

Figure 1 Is this dinosaur skeleton living, non-living or dead?
17 Use Table 2 to help you identify which phylum the following invertebrates belong to.
a Centipede b Octopus c Coral
d L eech
Table 2 Tabular key for identifying invertebrates
1 Body spongy, with many holes
Body not spongy
Poriferan
Go to 2
2 Soft body, no shell Go to 3
Outside shell or hard cover Go to 6
3 Many tentacles or arms Go to 4
Long body without tentacles
4
to 5
Tentacles around the mouth of a sac-like body Cnidarian
Arms with suction discs Mollusc
5 Soft body, large foot (muscular organ used for movement)
Worm-like or leaf-like
6 Proper shell or smooth, hard covering
Spiny skin with rough covering
7 Limbs in pairs
Shell, no segments, large foot (muscular organ used for movement)
Mollusc
Nematode, platyhelminth or annelid
Go to 7
Echinoderm
Arthropod
Mollusc
18 L ook at Figure 2 and Figure 3 and identify which class each vertebrate belongs to.


Apply
19 Refer to Figure 1 (page 86) showing Dr Redback’s family. Propose how the keys in Figure 2 and Table 1 (page 87) could
be modified if his family included his sister, Melinda; his mother, Frances; his two daughters, Stef and Gemma (Stef wears glasses); and he had a pet lizard named Stealth but not a bird named Charlie.
20 One of the main contributors to the Encyclopedia of Life is the Atlas of Living Australia. Do an internet search for the Atlas of Living Australia , select “Community and Schools” and click on “Explore your area”. From this page, you can create a species list and map for the area in which you live.
a Identify the most frequently seen animal in your area.
b Identify the most frequently seen plant in your area.
21 L ook at Table 3, showing the number of living things on Earth.
a Determine the number of plant species that were estimated to be on Earth in 2009.
b C ontrast the number of known plant species with the total number of known animal species (add animals without a backbone and animals with a backbone together).
Source: Chapman, A. D. 2009, Numbers of Living Species in Australia and the World, 2nd edn.
Table 3 Types and numbers of living things on Earth
Figure 2 A cockatoo
Figure 3 A frog
Social and ethical thinking
22 T here is often conflict between the rights of different animals depending on how they are classified. For example, there are many more rules and restrictions around the use of vertebrate animals in research, compared to invertebrates. Write two reasons that support the argument that vertebrates (with a central spinal cord carrying nerves to the brain) should not be used for research. Write two reasons why invertebrates do not have the same protections as vertebrates. Discuss the reasons with others in your class. Compare the different views in the classroom and the arguments that support all the opinions provided.
Critical and creative thinking
23 Download and print a copy of Figure 4.
a Cut out the pictures of the insects.
b On your own, sort the insects into groups based on appearance. Justify your system
of classification (by explaining why you made each decision).
c Compare your groupings with those of a partner. Together, identify a third way to classify the insects.
d With your partner, create a dichotomous key.
24 E ach Aboriginal and Torres Strait Islander Peoples culture has unique words for the different animals on Country. An example is the wombat, which is known as goolung (Duduroa people, Tasmania), wumbat (Barani people, Sydney, NSW) or wambad (Dharuk people, Hawkesbury, NSW). Explain why the name from Sydney was adopted first by European settlers and is used most commonly in Australian schools today.
DRAFT
25 Design an experiment to show that plants are living things that respond to stimuli. Choose one stimulus (such as reaction to light or a lack of water) to investigate. This stimulus is the experimental variable, so you will need to change the variable in some way and control the rest of the variables. Make a list of the equipment you would need.
26 Discuss why the invention of the microscope was important to the development of the classification system.
Research
27 C hoose one of the following topics to present a report in a format of your choice. Some ideas have been included to get you started. Your report must include a classification key.
A newspaper article
Write a newspaper article about how life on Earth is organised. It needs to be about two pages long (no more than 500 words). In your article:
• Ex plain how living things are classified for an audience unfamiliar with science.
• L ist the living things whose images you would like to use to illustrate the article.
• Identify their scientific and common names.
• Develop a key.
A trip to the Kimberley region
You have just returned from a trip to a remote mountain area of the Kimberley, in Western Australia. While there, you took your portable microscope and examined water from a previously unknown lake. To your surprise, you found some new creatures in the water that look a bit like bacteria. They are single-celled and are either square or oval; some are hairy (have hairs either on the end of the cell or along the edge of the whole cell).
• D raw six different versions of these organisms.
• C reate a dichotomous key for these six new organisms so that you can describe them to other scientists.
• Name each of the groups at the bottom of your key.
• A ssuming they are a type of bacterium, identify the kingdom to which they would belong.
Classifying fossils
Living organisms are not the only things that can be classified. The remains or impressions of prehistoric plants or animals that are found in rock can also be classified according to their unique characteristics.
• Identify a photo of a fossil.
• Describe the characteristics that could be used to classify it.
• Identify the group it could belong to in the Linnaean classification system.
• Justify your decision by comparing it to another organisms in the same group.
Module 3 Ecosystems

Overview
Every living thing is affected by its environment, and everything in nature is connected. Understanding these connections helps us see and predict how changes can affect the whole system. Food webs show how energy and matter move through an ecosystem. This helps us to understand how changes like losing habitats, different seasons or losing important animals like pollinators can affect the whole ecosystem. Aboriginal and Torres Strait Islander Peoples have used their knowledge of Country for over 60,000 years to work with and protect ecosystems, and can help us to protect them in the future.
DRAFT

DRAFT
Lessons in this module:
Lesson 3.1 All organisms are interdependent (page 124)
Lesson 3.2 Challenge: Studying food webs (page 127)
Lesson 3.3 All organisms have a role in an ecosystem (page 128)
Lesson 3.4 Experiment: What if more seeds were planted in a pot? (page 133)
Lesson 3.5 Energy flows through an ecosystem (page 134)
Lesson 3.6 Challenge: Exploring leaf litter (page 138)
Lesson 3.7 Population size depends on abiotic and biotic factors (page 139)
Lesson 3.8 Challenge: Bead counting (page 145)
Lesson 3.9 Introducing a new species may disrupt a food web (page 147)
Lesson 3.10 Challenge: Rabbit and fox chasey (page 151)
Lesson 3.11 Experiment: What if the effectiveness of pollinators was reduced? (page 153)
Lesson 3.12 Ecosystems can be disrupted (page 154)
Lesson 3.13 Science as a human endeavour: Human management of ecosystems continues to change (page 159)
Lesson 3.14 Challenge: Eucalypt adaptations (page 164)
Lesson 3.15 Review: Ecosystems (page 165)
Learning intentions and success criteria
Lesson 3.1 All organisms are interdependent
Key ideas
→ Scientists use a food chain to show the flow of food and energy in an ecosystem.
→ Producers make their own food and are found at the start of the food chain.
→ Consumers need to gain their energy from other organisms.
Check the next lesson for a linked practical activity or experiment.
food chain a linear diagram that shows feeding relationships between organisms and how nutrients and energy are passed from one organism to another organism
nutrient substance in food that organisms need for energy, growth and other biological functions
energy the capacity to do work
DRAFT
producer a plant or plant-like organism that is at the start of food chain because it produces its own food, usually using sunlight
consumer an organism that eats other organisms to get the energy it needs to survive
→ Food chains show the flow and direction of energy from a producer to the different consumers.
→ Food webs have many interlinking food chains.
Food chains
A food chain is a way to show the direction that nutrients and energy flow between organisms. It consists of a chain of arrows that always points from the food to the animal doing the eating. For example, a centipede eats a wolf spider. This means the energy flows from the wolf spider to the centipede. This is shown in Figure 1 by the arrow pointing from the wolf spider to the centipede. The wolf spider provides the centipede with energy to grow and move.
If a currawong then eats the centipede, the energy flows from the centipede to the currawong. This adds another level to the food chain and is shown in Figure 1 by an arrow pointing from the centipede to the currawong.


Plants and plant-like organisms are always found at the start of food chains (Figure 2) because they only need air, water, sunlight and a few trace minerals to live and grow. Plants are known as the producers of the ecosystem because they make (produce) their own food. Most producers convert light energy from the Sun into sugars (stored chemical energy). These sugars are known as biological molecules and are stored in the leaves, stems and roots.
Animals cannot use the Sun’s energy like plants do. They are consumers and must eat other organisms to get the energy they need to survive. They use this energy to stay alive – to


Wolf spider
Currawong
Centipede
Figure 1 A simple food chain
Leaf litter
Springtail
Wolf spider
Centipede
Currawong
Figure 2 An example of a backyard food chain
Oxford University Press
pump their blood, to move their muscles and to operate their nerves. The animals that eat plants are the first consumers in a food chain and are also referred to as first-order (primary) consumers.
The animals that eat the first-order consumers are called second-order (secondary) consumers, and so on (Figure 3).
In Figure 4 the mountain water skink is a first-order consumer because it eats plants (berries). Because the noisy miner bird eats a first-order consumer, it is called a second-order consumer. The feral cat eats the second-order consumer and becomes a third-order (tertiary) consumer.
Most food chains only have four to five organisms in them. This is because energy is lost from the food chain at each level, which limits the number of organisms the food chain can support. Approximately 10% of the energy passes from one level of the food chain to the next. The rest of the energy is transformed into heat and movement by the organism.
Food webs
Most animals, including humans, will eat more than one type of food. This can be represented in a food web, which shows several food chains intertwined. Some consumers will have several labels, depending on their eating habits.

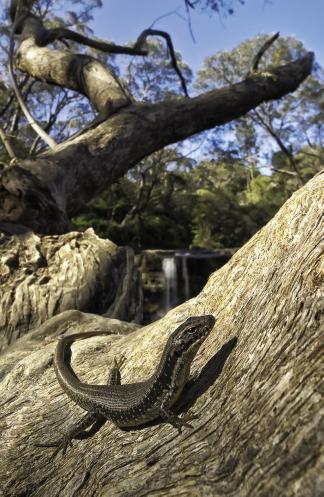


Figure 5 shows a food web in which there are four different producers. In this example, the mouse can be considered both a primary and secondary consumer because it eats a producer (wheat seeds) and primary consumers (snail and beetle). In this food web, the snail is only a primary consumer because it only eats producers (the trees).
Food webs show how every living thing in the environment needs other living things to survive. When people talk about the “web of life”, they are referring to the interactions between all living things.
first-order (primary) consumer an organism that eats only producers such as plants, algae and bacteria; it does not eat other consumers; also called a herbivore second-order (secondary) consumer a carnivore that eats first-order (primary) consumers (herbivores) third-order (tertiary) consumer a carnivore that eats first-order (primary) and secondorder (secondary) consumers and is therefore at the top of the food chain
food web a diagram of interlinked food chains that shows the feeding relationships in an ecosystem
Figure 3 A food chain starts with producers, such as plants, and moves through several orders of consumers.
Berries and fruit
Mountain water skink
Noisy miner bird
Feral cat
Figure 4 A food chain showing the feral cat as a thirdorder consumer


Check your learning 3.1
Check your learning 3.1
Retrieve

DRAFT


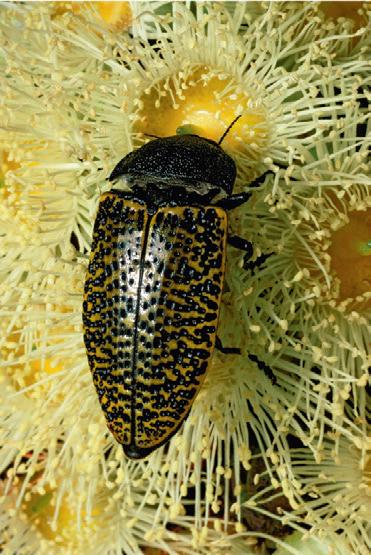


4 Ex amine the food web in Figure 5.
1 Identify where producers get their energy.
Comprehend
2 Describe how the direction of arrows in a food chain is decided.
Analyse
3 C ontrast (the differences between) food chains and food webs.
a Identify an animal that is both a secondary and a tertiary consumer.
b Classify the type of consumer the snake is in this food web.
Apply
5 I magine that you were asked to find out how many different types of animals lived in your backyard or local park. Discuss how
Butcher bird
Eagle
Snake
Mouse
Sparrow
Beetle
Snail
Spider
Grasshopper
Caterpillar
Grass
Thistle
Tree
Wheat seeds
Figure 5 A food web shows the extended relationships between various organisms.
you would go about finding this out. (Hint: Would it be possible to individually count them all?)
6 C onstruct your own food web of organisms that you would find in the local park. Correctly identify the producer and all the consumers.
Skills builder: Planning investigations
7 A g roup of students was asked to go outside of the classroom to observe a food chain in action.
a Identify a location they could use to observe a food chain. (THINK: Where would they likely see a food chain in action?)
b What equipment should they take with them? (THINK: What will they need to record their observations?)
Lesson 3.2 Challenge: Studying food webs
Aim
To identify the producers and consumers in a local food web
What you need:
• Metre-long sticks or metric rulers
• Poster board
• M arkers
What to do:
1 T hink about what you know about food webs in your school grounds or a local park. Write a list of at least 10 organisms you might find in these food webs.
DRAFT
2 Identify two different areas of the school ground or park. Would you expect to find the same number of organisms in both areas? Use your answer to this question to generate a scientific question. For example, would you expect to find more or less animals in an area with a lot of paths?
3 Develop a hypothesis that matches your scientific question.
4 Select two 1 m 2 areas in your backyard, schoolyard or neighbourhood to study. The study areas should be near each other but in two different habitats (e.g. on a footpath and on some grass, or just inside a forest and in a clearing).
5 Use the sticks or metre rulers to mark a square in each area.
6 Observe and record all organisms in the two squares.
7 C onstruct a food web that identifies where each organism gets its energy (who they eat).
Questions
1 Identify the organisms that are producers.
2 Identify the organisms that are consumers.
3 Compare the number of producers and consumers (individuals and species) you observed in each area.
Learning intentions and success criteria
Lesson 3.3
All organisms have a role in an ecosystem
Key ideas
→ An ecosystem is a community of living organisms and their surroundings.
→ Predators eat prey.
→ Organisms can compete for the same food sources.
Check the next lesson for a linked practical activity or experiment.
ecosystem a community of living organisms and their non-living surroundings population a group of individuals of the same species living in the same location at the same time community populations of different species living in the same location at the same time
→ Symbiotic relationships are long-term relationships and vary between organisms. These include symbiosis, commensalism and parasitism.
Ecosystems
When studying the environment, we can look at a small part, such as the organisms living in or on a log, or we can study a whole forest. When we study a large area with living things (such as animals and plants) and non-living things (such as temperature, light or water), we say that we are studying an ecosystem. Ecosystems vary in size. They can be as small as a puddle or as large as a rainforest. Ecosystems are made up of populations. A population is a group of living organisms that are the same species, living in the same place at the same time. When populations of different species interact with one another, they are called a community. For example, a population of humans can live in a town together. When all the plants in their gardens and their pets are included, it becomes a community.

Figure 1 Wetlands, such as those in Kakadu National Park in the Northern Territory, are an example of an ecosystem.
Biodiversity is the variety of all the different living things in an ecosystem. An environment that is biodiverse has many different types of plants and animals.
An ecosystem supplies all the needs of the organisms living in it, such as food, water, the right temperatures, oxygen and minerals. These make up the non-living parts of the ecosystem. If the conditions are not right for a population, the individuals in that population will move to where the conditions are better, or they will die out. A biodiverse environment provides more of the things a plant or animal needs. This means that there is a greater chance for plants and animals to survive.
Relationships between different species
Predator–prey
In a predator–prey relationship, one organism (the predator) eats another (the prey). The relationship between the individual prey and predator only lasts for a short time (until the prey is eaten), and it only happens when a predator is hungry. An example of this is the relationship between a fox and a rabbit (Figure 2). The two species only meet when the fox is hungry and starts hunting the rabbit (the prey). When the rabbit is caught, the relationship ends.

Predator species and their prey species have a balanced relationship. If all the prey are eaten, then the predators will starve. As the number of predators decreases (shown by the red line in the graph going down in Figure 3), the number of prey will increase again because they are not being hunted as often (shown by the blue line in the graph going up in Figure 3). When there are more prey, the predators can hunt more food. This means a predator–prey graph will always show the predator line following the prey line. Figure 3 shows this pattern.
biodiversity the variety of living things in an ecosystem
DRAFT
predator an animal that hunts and feeds on another animal (prey) for food
prey an animal that is hunted and killed by another animal (predator) for food
Figure 3 A predator–prey graph – the scales aren’t shown but the prey numbers are mostly greater than those of the predators. Notice that the increase and decrease in prey numbers usually comes before the increase and decrease in predator numbers.
Figure 2 A fox is the predator of a rabbit (the prey).
competition contest between organisms for the same resources, such as shelter, food and mates
Competition
Competition occurs when organisms need the same resources, such as food or shelter, to survive (Figure 4). If one population or species is better at obtaining resources, then any species trying to compete may “lose” and die. Usually, competing species will balance their numbers so that neither one dominates.
Sometimes inhibition competition occurs when one organism produces a chemical that directly inhibits or blocks the survival or growth of another organism (Figure 5 and Figure 6).


Periwinkle
Limpet
Figure 4 A black periwinkle (Nerita spp ) competes for food with the limpet (Cellana spp.) on a rock platform –both species feed on algae growing on the rocks. The black periwinkle moves faster but does not eat all the algae in its path. This means there is some food left for the limpet, allowing both species to survive in the same environment. When the periwinkles are removed from a rock platform, the limpet population will increase because there is less competition for food.
Figure 5 Penicillium fungus mould (seen here growing on an orange) produces an antibiotic called penicillin that inhibits or blocks the growth of many bacteria.
Figure 6 The Lantana spp. plant was introduced into Australia and has become a weed. It releases a chemical into the soil that inhibits or blocks the growth of native plant species.
Symbiosis
Symbiosis happens when two organisms of different species live physically close to each other for a long time. Mutualism, commensalism and parasitism are all examples of symbiosis.
Mutualism is a relationship between two organisms in which both organisms are able to help each other to survive. They both benefit.

Figure 7 Mutualism A lichen is an alga and a fungus, although you cannot see the two organisms separately (except under a microscope). The alga produces energy from the Sun for both organisms, and the fungus provides support and other nutrients.

Figure 8 Mutualism The anemone fish hides within the tentacles of the sea anemone, where it is camouflaged from its predators. The fish cleans all the algae from the sea anemone.
Commensalism is a relationship in which one organism benefits while the other organism is not affected. Commensalism does not happen very often in an ecosystem because it is unlikely that an organism is not affected by another organism living so close to it.
Parasitism is a relationship in which one organism (the parasite) lives in or on the body of another (the host). The parasite benefits by taking some of the food and nutrients from the host. This means the host is harmed and often struggles to survive. Sometimes the parasite can even kill the host.


symbiosis a close physical relationship between two organisms of different species mutualism a type of relationship between two organisms of different species, in which both organisms benefit
DRAFT
Certain plants have seeds with tiny hooks. These seeds stick to animal fur and are carried away from the parent plant. This distributes the seeds and, with fewer plants growing around it, the parent plant can access more sunlight and nutrients.
attach to the skin of animals and slowly drink their blood. Although the amount of blood it drinks is small, the tick can infect the animal with bacteria, causing it to die.
commensalism a type of relationship between two organisms of different species, in which one organism benefits and the other is not affected parasitism a relationship in which one organism (parasite) lives in or on the body of another organism (host) and benefits while the host is harmed
Figure 9 Commensalism Some animals such as cattle and water buffalo make insects fly up as they walk through the grass. Birds such as cattle egrets benefit by feeding on the insects.
Figure 10 Commensalism
Figure 11 Parasitism Ticks

12 Parasitism Hookworms attach to the inside of animals’ intestines, feeding on passing nutrients. If the host doesn’t eat enough, the worm has been known to burrow out of the intestines and travel to other organs, where it can cause damage to the host.
Check your learning 3.3
Check your learning 3.3
Retrieve
1 Define the terms “symbiosis” and “ecosystem”.
Comprehend
2 Describe an example of the following relationships: a predator–prey b mutualism c commensalism d parasite–host.
3 Ex plain why a large plant that produces a lot of shade prevents smaller plants from growing.
Analyse
4 C ontrast (the differences between) a predator–prey relationship and parasitism.
Apply
5 Some eucalyptus trees have mistletoe plants living on them. Mistletoe has very similar leaves to eucalyptus leaves. Mistletoe can make its own food, but the stems send suckers into the eucalypt to obtain water and

minerals. If too much water and minerals are removed, the eucalypt can die. Identify the type of relationship that exists between the eucalypt and the mistletoe. Justify your answer (by defining the relationship and matching it to this example).
6 Epiphytes are plants, such as ferns and some orchids, that grow high in the branches of other trees, especially rainforest trees. The epiphytes obtain sufficient light to make their own food, collect water from the moist air and obtain minerals from the decaying leaf litter that they catch at their leaf bases. The tree is not affected by these plants. Identify the type of relationship that is described. Justify your answer (by describing how each species benefits from, doesn’t notice or is harmed by the relationship).
Skills builder: Communicating
7 C onstruct a table that summarises the differences between the different symbiotic relationships, including examples of each. (THINK: How can this table help people to understand these relationships?)
Figure 13 Parasitism Leeches are parasites that survive by sucking the blood from other animals.
Figure
Lesson 3.4
Experiment: What if more seeds were planted in a pot?
Aim
To investigate some factors that affect competition in plants
What you need:
• Small plot (20 × 20 c m) in a garden, divided into thirds, or 3 medium-sized pots containing good-quality potting mix
• Packets of seeds (a variety of vegetables or flowers is needed)
• Measuring cylinder or graduated jug for watering
• Water
• Camera
• Measuring tape or ruler
What to do:
1 P repare the plots (or pots) so the soil is moderately deep and smooth. Label them A, B and C.
2 I n plot A, plant six seeds of the same type, spread evenly apart.
3 Plan your inquiry below and plant the appropriate seeds in plots B and C.
4 Water the soil in all plots each day as evenly as possible with the same amount of water.
Inquiry: What if seeds were planted in a different way?
DRAFT
5 Record the growth of the seeds. If possible, take photographs each week or every few days when the seeds begin to germinate. If the seeds become seedlings (small plants), measure their heights and record the results in a table.
Choose one of the inquiry questions.
• W hat if more of the same seeds were planted close together in plot B?
• W hat if different seeds were planted between the original seeds in plot C?
You will now design your own experiment to answer your inquiry question.
1 Identify the types of seeds that you will test.
2 Develop a hypothesis (If … then … because …) for your inquiry.
3 Identify the independent variable that you will change from the first method.
4 Identify the dependent variable that you will measure and/or observe.
5 Identify two variables that you will need to control to ensure a reasonable test. Describe how you will control these variables.
6 Identify the materials that you will need for your investigation.
7 Develop a method for your experiment in your logbook.
8 D raw a table to record your results.
9 Show your teacher your planning to obtain approval before starting your experiment.
Results
Record all results. You could take photos showing the progress of growth and/or record the average heights of plants of different species and record them in a table.
Discussion
1 Identify one piece of advice that you would provide to another student who wants to carry out the experiment.
2 Compare the growth of the plants in each plot by summarising your key observations in two to three sentences.
3 Use evidence from your results to describe any competition between the seeds as they germinated. Use statements such as, “The plants in Pot … grew … than the plants in Pot … This indicates that competition between the plants…”.
4 Identify one other variable that might have affected the growth of the seeds. Describe how this variable could have affected the results of your experiment.
5 Describe how the competition you observed would affect organisms in the natural environment.
Conclusion
Write a conclusion about the factors that affect competition between germinating seeds.

DRAFT
Lesson 3.5
Energy flows through an ecosystem
Key ideas
→ Plants undergo a process called photosynthesis to create energy and oxygen.
→ Animals that only eat plants are called herbivores.
→ Animals that only eat other animals are called carnivores.
→ Microorganisms obtain energy by breaking down dead organisms. Check the next lesson for a linked practical activity or experiment. Learning intentions and success criteria
→ Animals that eat both plants and animals, like humans, are called omnivores.
→ Trophic levels indicate an organism’s position in a food chain.
→ A food pyramid can be created from a food chain and shows the amount of energy at each trophic level.
Figure 1 What affects the growth of seeds?
Energy transfer
All food chains show the transfer of energy from the organism that is eaten to the consumer. This transfer of energy is shown by the direction of the arrow in the food chain or food web. The source of energy in most food webs is light energy from the Sun. Even in caves, where there is no sunlight, there may be energy from dead plants and animals, which originally obtained their energy from the Sun. An exception is chemosynthetic bacteria on the ocean floor and in the craters of volcanoes – t hese bacteria trap the energy from chemicals and chemical reactions occurring under the Earth’s crust.
What is photosynthesis?

Living things need energy to grow and repair, to defend themselves, and to move around. Plants, some algae and some bacteria are able to transform the light energy from the Sun into chemical energy through a process called photosynthesis. In this process, the plant takes in water from the roots and carbon dioxide through their leaves. The water is transported to the leaves, where it is combined with the carbon dioxide to make glucose (a sugar) and oxygen. This can be shown by a word equation for photosynthesis: carbon dioxide + water → glucose + oxygen
Consumers
Sugars like glucose provide chemical energy that plants can use to make new leaves and stems. Animals that eat plants are called primary consumers or herbivores. The chemical energy in the plant is used by the animal to move and grow. Some of the energy is stored in the muscles and fat of the animal. When a secondary consumer or carnivore, such as a dog, eats the herbivore, it is able to use the energy in the fat and muscle to keep hunting. Humans eat both meat and plants, making them omnivores When the plants and animals grow and move, the chemical energy is transferred to movement energy.
DRAFT
photosynthesis a chemical process used by plants to make glucose and oxygen from carbon dioxide, sunlight and water
Trophic level
Each level in a food chain is called a trophic level. If an organism is a primary consumer, it is at trophic level 2 (the second step of a food chain). A top consumer is usually at trophic level 4 or, occasionally, trophic level 5.
Some animals can be placed in more than one trophic level. In Figure 2 the butcher bird is placed in two different food chains. In one food chain (grass, grasshopper, butcher bird) it is in the third trophic level. In another food chain (grass, grasshopper,
herbivore an animal that eats only plants
carnivore an animal that eats other animals
omnivore an animal that eats both plants and animals
trophic level the position an organism occupies in a food web
Figure 1 Plants use energy from the Sun to grow and repair.
spider, butcher bird) it is in the fourth trophic level. The trophic level you use to describe the butcher bird will depend on the food chain that is being followed.
Food pyramid
One way to show the amount of energy at each trophic level in an ecosystem is a food pyramid (Figure 3). The most energy stored in an ecosystem is at the first trophic level (the producers). Producers convert the energy of the Sun into a useable form during photosynthesis. Some of this energy is stored in their leaves and roots. Because all food chains start with a producer, and they store the most energy, a food pyramid always has the producers at the base. Every time an animal eats, energy is transferred through the food chain. Each time the energy is passed on to another trophic level. Some of this energy is stored in the animal’s body and is passed on when a carnivore (secondary consumer) eats the animal.
DRAFT


Each time the energy is transferred to another trophic level, it is less than the previous level. The energy is not “used up”. Instead, the energy is transferred into movement and heat energy and lost from the food chain. This means each trophic level in a food pyramid has less energy than the level below. Because there is less energy available as you move to the next level in the food chain pyramid, the amount
food pyramid a simple visual guide to the types and proportion of foods we should eat every day for good health
Figure 3 An example of the movement of energy through an ecosystem, where each arrow represents the transfer of energy. A food pyramid shows how the amount of energy decreases with each trophic level.
Eagle Spider
Butcher bird
Grasshopper
Caterpillar
Thistle Grass
Figure 2 Linked food chains
of stored energy or biomass (dried amount or mass of organisms) also decreases at each trophic level. The pointed shape of a food chain pyramid shows this decrease in stored energy and biomass at each trophic level. The producers at the bottom of the food pyramid have the most stored energy and biomass and the consumers at the top have the least stored energy and biomass.
Some microorganisms decompose organic matter
As well as energy, inside all organisms is an enormous amount of nutrients. All organisms in a food web end up passing these nutrients and energy on to decomposers. Decomposers – such as bacteria, fungi and invertebrates (slugs and worms) – get the food they need by feeding on dead things. This breaks down the dead organisms and prevents them from piling up. Instead, the chemical energy in the dead organism is used for energy by the decomposers.
When another organism eats a decomposer, the particles (atoms) that make up the nutrients once again become part of the food chain. The nutrients that pass through the decomposers as waste end up in the soil as simpler particles. Plant roots can then absorb the nutrients and the cycle starts again. Imagine what life would be like without decomposers!

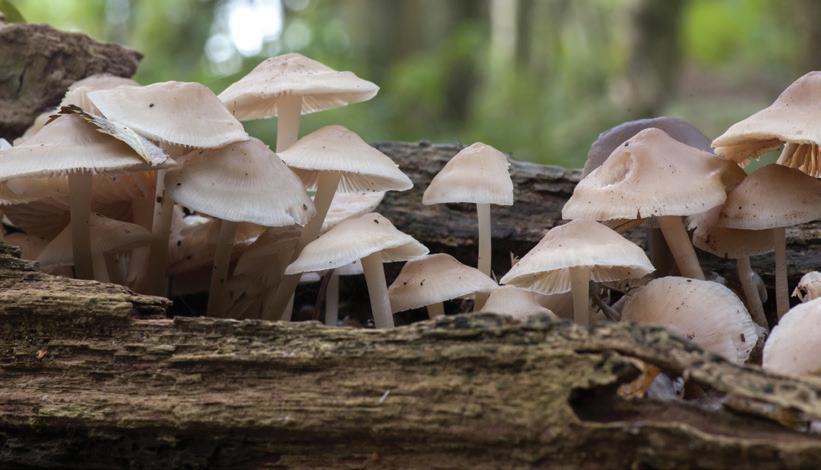
Wetlands and forests help clean water
If you poured dirty water through a filter, you would expect cleaner water to come out. A similar thing happens in nature when water passes through a forest or wetland ecosystem. By slowing the flow of water, the plants and bacteria trap some of the pollutants and sediments that are in the water. But plants are not the only living things that clean water. Aquatic animals, such as freshwater clams, pump water through their bodies to filter out food for themselves and, in so doing, clean the water they live in.
DRAFT

biomass the total amount (or mass) of living organisms in an area decomposer an organism that gains nutrients by breaking down dead organisms into simpler nutrients
Figure 4 Decomposers recycle important nutrients in an ecosystem.
Figure 5 Mushrooms (fungi) are decomposers. They get the nutrients they need by feeding on dead things, such as rotting logs.
Figure 6 Forested water catchment areas are vital for keeping a city’s water supplies clean.
Check your learning 3.5
Check your learning 3.5
Retrieve
1 Identify the term used to describe animals that eat both meat and plants.
2 Identify the following as either an input or an output of photosynthesis:
a carbon dioxide
b glucose c water.
Comprehend
3 Describe one consequence that may occur if decomposers did not exist.
Analyse
4 C ompare (the similarities and differences between) the following terms: producer, firstorder consumer, second-order consumer, herbivore, carnivore, photosynthesising organism, first trophic level, second trophic level.
Apply
5 We get the energy we need by eating other living organisms. Determine the source of energy for the following organisms:
a plants
b herbivores
c decomposer s.
6 Use an example to explain why each tropic level of a food pyramid decreases as you move from the base to the top of the pyramid.
7 “ Photosynthesis is the most important metabolic process on Earth.” Evaluate this statement by:
a descr ibing why photosynthesis is important in an ecosystem
b descr ibing what would happen if photosynthesis was not able to occur
c deciding whether the statement is correct.
Lesson 3.6
Challenge: Exploring leaf litter
Leaf litter is the dead and rotting leaves that lie on the ground under trees and in gardens. Leaf litter helps protect soil and is home to many tiny invertebrates that work together to keep the soil in good condition.
Caution!
• Before you start, ask your teacher about any bull ants, poisonous spiders or centipedes in your area. There may be some animals that could bite you. If in doubt, leave the animals alone and ask your teacher.
Aim
To identify the organisms that make up a leaf litter community
What you need:
• Gloves
• Wet paintbrush
• Plastic specimen jars with lids
• H and lens
• Newspaper
• Pen
• Paper

What to do:
1 Find an undisturbed area approximately 50 cm long by 50 cm wide. Work only in this area.
2 Wearing gloves, lift up the leaves slowly. Use your wet paintbrush to pick up the tiny animals and make sure not to crush them. Gently place the animals in a specimen jar.
3 Use a hand lens to look closely at the animals.
4 M ake a list of the animals you find. Make another list for any other living and nonplant things such as eggs, cocoons, larvae or types of fungi.
5 Return the animals to the place where you found them.
Questions
1 Ex plain why it is important to know about the animals you are likely to find before looking for them in the leaf litter.
2 Ex plain why you should return animals to the place where you found them.
3 A leaf litter community does not contain any producer organisms, such as healthy green plants. Identify the energy source for this community.
4 Describe how this leaf litter community improves the health of the soil.
Lesson 3.7
Population size depends on abiotic and biotic factors
Key ideas
→ All populations are affected by abiotic and biotic factors.
→ Deaths and emigration can decrease a population.
→ Births and immigration can increase a population.
→ Changes in population can affect an ecosystem’s food web.
→ Population dynamics uses counting methods to monitor populations to make predictions about populations and causes for any changes.
Figure 1 Leaf litter
abiotic factor non-living factors that influence an ecosystem, such as wind, water, salinity and temperature
Populations
Like a population of humans in a city, the population of living organisms in an ecosystem is constantly changing. In a drought there are high temperatures and little rain. This can make it hard for plant and animal populations to survive. The amount of water or the temperature are “non-living” factors (called abiotic factors) that can affect the size of a population.
Other abiotic factors that can affect the number of organisms in a population include:
• t he amount of sunlight
• t he amount of salt in the water
• t he amount of soil
• available nutrients
• places for the organism to hide (Figure 1).
biotic factor living factors that influence an ecosystem, such as animals, plants and bacteria
DRAFT
Sometimes it is the number of other organisms competing for food or hunting them which can affect the number of organisms in a population. These “living” factors that affect the survival of organisms are called biotic factors (Figure 1).
Biotic factors (living)
Abiotic factors (non-living)
A dynamic balance
All organisms live in a complex web of interdependent relationships – with each other and with their environment. In an ecosystem, there needs to be a balance so that all species can survive. The more types of organisms there are in an ecosystem, the more stable and healthy the ecosystem will be. This is because the ecosystem is less affected by changes if there are different species that can fulfil similar roles. For example, if there is just one plant species (producer) in an ecosystem, all the herbivores are at risk if these plants die. If the herbivores do not have anything to eat, they will also die.
Figure 1 A comparison of biotic and abiotic factors
If there are many plant species in an ecosystem, all the herbivores have a lot of choice of food and are more likely to survive.
Many things can cause a population of organisms to increase in number. A population of birds will increase when new chicks are born, or when new birds fly into the area (immigrate). In contrast, the number of birds in the population will decrease if some birds die because of hunger or because they are hunted. Sometimes the birds will leave an area (emigrate) to find food or mates (Figure 2).
Whenever the size of a population changes, it can affect other organisms in the ecosystem’s food web.
Consider the food web shown in Figure 3. If the number of frogs decreased in this ecosystem, the effects could include:
• a n increase in grasshopper numbers, which would cause the amount of grass to decrease
• a n initial increase in praying mantis numbers (because there are more grasshoppers to eat)
• a decrease in lizard numbers (because there are fewer frogs to eat)
• birds eating more praying mantises rather than frogs and lizards
• a decrease in praying mantis numbers because they are being eaten by birds
• f urther increase in grasshopper numbers who then eat more grass. If this was severe enough, the ecosystem would be at risk, because all food webs depend on a good supply of producers.

immigrate when an animal or population enters an area or habitat emigrate when an animal or population leaves an area or habitat
DRAFT
Grass
Grasshopper
Praying mantis
Bird
Frog
Lizard
Figure 3 A food web for an ecosystem
Births
Figure 2 The size of a galah population in a particular area depends on the resources available and the number of births and deaths.
dynamic equilibrium a state of balance and stability even when there are continuous small changes
The most likely outcome is that the bird population would decrease, so all species would return to balance with smaller population sizes. A positive effect is that decreased bird numbers might enable the frog population to recover.
Ecosystem balance constantly changes before returning to a new stable balance. This is called a dynamic equilibrium. Changes may upset the equilibrium, but another new equilibrium arises. Often, the change is only a small one.
Changes in ecosystems occur naturally but they may be intensified by external abiotic factors such as floods and bushfires. Reproduction, death, migration, natural events (such as seasonal changes), disasters (floods, droughts, earthquakes) and human intervention occur regularly. Biotic factors, such as the loss of a species or the introduction of a new species, can also change a population.
Population dynamics
population dynamics the study of changes in species population numbers and the factors that may contribute to these changes
quadrat a randomly selected square plot used to estimate the number of organisms capture–recapture a method of estimating the number of organisms in an area by capturing, marking and releasing a sample of the organisms
DRAFT
Population dynamics is the study of changes in population numbers within ecosystems. If scientists can measure how many of each species are in a certain location, they can make predictions and try to prevent populations declining and species becoming extinct.
Regular sampling provides information about increases and decreases in population numbers, and causes can be identified.
Counting organisms
There are many ways to measure the size of a population. The simplest way would be to count all the organisms, but in practice this is very difficult. It is easier to estimate the total population by counting a sample from a helicopter, or by using quadrats or capture–recapture methods. For human populations, a census is the usual method.
For plants and stationary animals, quadrats (randomly selected square plots) are marked in an ecosystem (Figure 4). The organisms in each plot are counted and used to calculate the average number of organisms in each square plot. The total number of organisms in the whole ecosystem can then be calculated by multiplying the average number of organisms by the area of the ecosystem. This method works well if a large number of quadrats are used and the organisms are evenly spread throughout the ecosystem.

Figure 4 Using a quadrat
For animals that are moving, capture–recapture is a popular method. Animals are captured in traps and marked with tags, correction fluid or permanent marker. The number counted on the first capture are called tagged animals (Figure 5). The animals are then released and it is assumed that they move evenly throughout the population. Another capture (recapture) is made one or two days (or nights) later. Some of these recaptured animals will have tags. An estimate of the population is then obtained using these three numbers.
total number of animals =

number of tagged animals × number of recaptured animals
number of tagged animals recaptured
Capture–recapture is a good way to estimate the population size of small Australian mammals, such as the marsupial Antechinus (the common bush rat). Because most native Australian mammals are nocturnal, the traps may be set at night and checked the next morning.
Modern counting methods
When tags or quadrats are used to count organisms, it can disrupt their environment and affect the way the animals behave. Modern counting methods can avoid this disturbance by using remote sensors that detect movement and automatically turn on cameras (Figure 6). These images allow scientists to count the number of animals moving in an area and to study how animals behave when humans are not around.

Another way to identify animals is to record the calls they make to one another. This recording can then be used to identify the species of animal and the number of them making and replying to the calls.
DRAFT
Worked example 3.7A Calculating the population size
Scientists wanted to determine the size of a bilby population in a small reserve. They used the capture–recapture method to estimate the size of the population. They captured and marked nine bilbies on the first night. One week later, they captured eight bilbies, and found that four of them were already marked. Calculate the size of the bilby population.
Figure 5 A scientist tagging a bird
Figure 6 Remote sensors can be used to record and identify animals without disturbing their normal behaviour.
Solution
• Number of tagged/marked animals = 9
• Number of recaptured animals = 8
• Number of tagged animals recaptured = 4
estimated number of bilbies = = = 18 number of tagged animals × number of recaptured animals number of tagged animals recaptured 9 × 8
4
Collaborating with Aboriginal and Torres Islander Peoples
To understand how and why populations change, scientists need to look for evidence over very long periods of time. Aboriginal and Torres Islander Peoples have been part of Country for over 60,000 years. Weaving together the scientific knowledge of traditional owners and Western-trained scientists provides a detailed picture of particular Australian plants and animals.
One example of this is the collaboration between university researchers and the traditional owners of Cloggs Cave near Buchan (East Gippsland). The oral histories of travelling to the caves to eat the Bogong moth during the summer months each year provided a clue to the researchers about where to look. Together, the Gunaikurnai people and researchers found the 2,000-year-old microscopic remains of the moths that were cooked or ground into a paste. This provided a rich energy source for the visiting people when other food sources may have been low. It also provided evidence of where the Bogong moths went in summer each year.
Check your learning 3.7
Check your learning 3.7
Retrieve
1 Identify two examples of abiotic factors and two examples of biotic factors.
Comprehend
DRAFT
2 Describe two ways a population can: a increase b decrease.
3 Describe suitable methods for estimating the population sizes of: a plants and stationar y animals b other animals.
4 Ex plain how predator–prey relationships achieve a state of balance by describing what happens to the number of predators or prey when:
a prey number s increase
b prey number s decrease
c predator number s increase
d predator number s decrease.
Analyse
5 Students on a field trip with a national park ranger set traps for a small nocturnal
marsupial, Antechinus stuartii , in a heathland ecosystem. They captured eight animals on the first night and marked white dots on their tails. Then they released them. On the second night, they captured 10 animals, of which four were marked.
a Calculate the estimated population size of A. stuartii in this ecosystem.
b Descr ibe one way the students could check if their estimated population size was accurate.
Apply
6 Desalination plants take the salt out of sea water to produce fresh water for us to drink. The remaining sea water, which has high levels of salt, is returned to the ocean through a fast flow pipe. A study of the desalination plant in Sydney found that a population of mobile sea sponges decreased near the returning pipe, while a population of barnacles sticking to the rocks increased. Compare (the similarities and differences
Lesson 3.8
between) the two populations and propose a hypothesis that might explain the difference between the survival of the two populations.
7 I nvestigate the rules that regulate the type, number and size of fish that can be caught in your local area. Write a letter to a local paper explaining why these rules are needed.
Skills builder: Conducting investigations
8 W hen research affects an ecosystem, the environmental impacts on both animals and plants, as well as any cultural impacts on researching that particular area, must be considered.
a Think about where you live. Identify one animal species that could be investigated via capture–recapture. (THINK: Is this animal native to your area?)
b Highlight ethical issues of using this method on this animal. (THINK: Does this animal live elsewhere? Will any harm come to the animal? Do you need to think of cultural impacts?)
Challenge: Bead counting
Aim
DRAFT
To compare the accuracy and efficiency of measuring different populations
What you need:
• Small beads
• Paper bag
• Permanent marker
• A4 graph paper
• Pencil
• Ruler
What to do:
Part A: Capture–recapture
1 Place a random number of beads in a paper bag.
2 D raw 10 beads out of the bag. Mark each of the 10 beads with the permanent marker. Place the 10 beads back into the bag. This is the same as tagging the beads and releasing them.
3 M ix the beads in the bag and draw another 10 beads out of the bag. Count the number of “tagged” beads you collected in the “recapture”.
4 Use the formula to estimate how many beads are in the bag.
total number of beads = where:
• N1 is the number of beads drawn out the first time (10)
• N2 is the number of beads drawn the second time (10)
• M 2 is the number of tagged beads drawn during the second draw.
5 Count the number of beads that are actually in the paper bag.
Part B: Quadrats
1 Divide the graph paper into 20 equal-sized squares.
2 Spread a large handful of beads over the graph paper. These represent insects in an ecosystem.
3 Count the number of “bead insects” in four of the squares. Include the beads that are on the top lines or left lines of the squares. Do not include the beads that are on the bottom lines or right lines of the squares. Divide the number counted by 4 to determine the average number of “bead insects” in each square.
4 Multiply the average number of “bead insects” in each square by 20 to estimate the size of the population in the “ecosystem”.
5 Count the number of beads that were actually spread over the graph paper.

Questions
1 Identify the types of organisms that could be counted using: a capture–recapture b quadrats
2 Describe the accuracy of the capture–recapture method in determining population size (by comparing the number of beads estimated in part A step 4 to the “true value” counted in part A step 5).
3 Ex plain which of the following animals would be more likely to be recaptured. Justify your answer (by describing how each animal will react the next time it sees or smells a trap, and deciding which approach is more likely to lead to them being recaptured).
• A n animal that was fed and treated well during the first capture
• A n animal that became frightened and was roughly handled during the first capture
4 Describe the accuracy of the quadrat method in determining the population size.
5 Identify the size a quadrat would need to be to measure a population of fully grown trees.
N1 × N2
Figure 1 Counting the number of “bead insects”
Lesson 3.9
Introducing a new species may disrupt a food web
Key ideas
→ Introduced species can change the amount of food for other organisms.
→ New species can have environmental, social and economic impacts.
→ New species can cause a new equilibrium in an ecosystem.
→ Biological control is the deliberate introduction of a new species to control a non-native plant or animal.
→ Loss of species can have a negative effect on an ecosystem.
Balanced populations
There is a balance between all organisms in a food web. If more grass grows, the number of animals that eat the grass will also grow. In time, the amount of grass available will decrease, which will be balanced by a decrease in the animals who eat the grass. This increase–decrease population cycle is a balance that can be disrupted by introduced species or the removal of predators.
Cane toads
Scarab beetles are a family of beetles that can range in size from 2 to 70 millimeters in length. One species from this family, the cane beetle (Dermolepida albohirtum), can cause a lot of damage to the sugar cane crops in Queensland.
The female of this species lay eggs in the soil of the sugar cane. When the larvae hatch, they eat the roots of the cane plant, causing it to die. Cane toads (Rhinella marina) were introduced to Queensland in 1935 in an attempt to control the beetle population (Figure 1). While the cane toads did eat the scarab beetles, they preferred other insects.

Cane toads also lacked many natural predators in Australia. When larger animals, such as quolls, tried to eat cane toads, they were killed by the poisonous toxin on the toads’ backs. This meant the cane toad population (with a lot of food and few predators) could continue to increase (Figure 2).
The introduction of cane toads has also had negative effects on people who rely on the local ecosystem for food. The yellow-spotted monitor goanna (Varanus panoptes) is an important meat source for some Aboriginal Peoples who live in remote introduced species an organism that has been brought to and has established itself in an area it is not native to
Figure 1 Cane toads were introduced to Australia to control cane beetles in 1935.


Figure 2 The introduction of the cane toad into this food web has affected many other animals.
communities. Many of these goannas are killed when they try to eat cane toads. This decreases the availability of meat in areas where there is already limited supply of meat and protein.
The Yugul Mangi Aboriginal Ranger group work with government departments to help manage the population and spread of cane toads in Queensland.
Gamba grass
In the 1930s, Australian cattle farmers concerned about the lack of grass in the dry parts of the country brought in gamba grass (Andropogon gayanus) from the tropical savannas of Africa (Figure 3). However, because gamba grass grows very quickly, it took over land that would usually grow native Australian grasses.

While farmers might like having more grass for their cattle to eat, gamba grass has an environmental impact on the plant and animal life in the areas it has spread to. It has the potential to prevent small tree seedlings from growing, changing woodlands to grasslands. It also produces a lot of vegetation that can burn in a bushfire. This means it affects the supply of important food sources and medicines for Aboriginal Peoples who live in those areas.
Kites (birds of prey)
Small mammals Fruit Sugar cane
Wild plants
Grasshoppers
Termites
Small spiders
Small toads/frogsSnails
Small birds
Crocodiles Crows
Cane toad
Keelback snakes
Figure 3 Gamba grass
The Kungarakan and Warai people are working with the Australian Government to remove gamba grass from the Rum Jungle mine site near Litchfield National Park in the Northern Territory. This is done by local rangers identifying the plants and removing them before they produce seeds, or spraying the plant to reduce the impact on the surrounding lands.
Macquarie Island rabbits
Not all relationships in a food web are easily predicted. In 1985, scientists on Macquarie Island (halfway between Australia and Antarctica) devised a plan to eradicate the cats that had been introduced to the island since the early nineteenth century. The scientists thought that if the cat population decreased, there would be an increase in the native burrowing bird populations on the island. However, the cats were also predators of rabbits. When the cats were gone, the rabbits were no longer hunted. This allowed more rabbits to survive, destroying native plants and affecting many other organisms that were native to the island (Figure 4). Scientists then needed to find a way to control the rabbits.


Biological control
Rabbits were first released into the wild in Australia in 1859. The climate conditions allowed their population to grow to very large numbers. All efforts to control the rabbit population across Australia by physical means were unsuccessful.
DRAFT
In 1938, CSIRO scientists studied a way to control the population using a living organism ( biological control). They tested a virus called Myxoma for its ability to cause disease in rabbits. This virus causes a disease with symptoms including fever and swelling around the head of the rabbit. Death occurs within 14 days. Myxoma was eventually released in the wild and quickly killed almost all the rabbits that caught the infection. The reduction in the rabbit population increased Australia’s wool and meat production within two years.
However, a small percentage of rabbits were unaffected by the disease. These rabbits survived and bred a new population of rabbits that were immune to the disease. New viruses, such as the rabbit calicivirus, have since been tried, with similar results.
biological control a method of controlling a population by releasing a living organism into an ecosystem disease a disorder or condition that interrupts the normal functioning of an organism
immune able to fight an infection as a result of prior exposure
Figure 4 (A) This slope on Macquarie Island had vegetation as recently as 2007. (B) The same slope a few years later – it has been ravaged by rabbits since cats were eradicated.
A B
indicator species an organism that can be used to measure the environmental condition of an area
Before a species is introduced as part of biological control of pests, scientists must model the possible effects on populations that compete for the same food source and the predators that may prey on them. Effectively, they must map the food web of the ecosystem and assess how the balance between all the organisms in the community will be affected by the introduction of the biological control organism.


Loss of organisms
The removal or loss of organisms from an ecosystem can have dramatic effects. Amphibians, such as frogs, are an important part of many ecosystems. Their thin skin helps them drink and breathe, but it also makes them vulnerable to environmental contaminants, especially agricultural, industrial and pharmaceutical chemicals. Consequently, they are commonly referred to as indicator species –indicators of environmental health. They can also warn us about unsafe environmental conditions that could eventually seriously affect our health.
Amphibians watched the dinosaurs come and go, but today almost one-third of them, representing 1,896 species, are threatened with extinction. As many as 165 amphibian species may already be extinct and the population numbers of at least 43 per cent of all species are declining. This means that there will be even fewer frogs and other amphibians in the future.
Check your learning 3.9
Check your learning 3.9
Retrieve
1 Identify two reasons why the cane toad population was able to increase so quickly when introduced to Australia.
2 Define the term “biological control”.
Comprehend
3 Describe why cane toads are referred to as an introduced species in Australia.
4 Use the food web in Figure 5 to suggest two populations that would increase as a result of the introduction of rabbits.
Termites
Echidnas
Eucalyptus trees Wattle trees
Grasses
Grasshoppers
Frill-necked lizards
Kookaburras Dingoes
Wombats
Rabbits
Kangaroos
Figure 5 Rabbits compete with grasshoppers, wombats, kangaroos and termites for grass.
5 Ex plain why some cattle farmers would have supported the introduction of gamba grass to Australia.
6 Ex plain why local Aboriginal peoples should have been consulted before the gamba grass was introduced.
Apply
7 Evaluate the ethics of using biological control of rabbits, by: a descr ibing how Myxoma infection affects the health of a rabbit
b descr ibing the effect a large rabbit population has on a native environment, including the native plants and animals
c descr ibing how a large rabbit population affects our ability to grow food
d deciding whether the life (and Myxomarelated death) of a rabbit is more or less important than the effects you described above. (Does the end justify the means?)
Lesson 3.10
Challenge: Rabbit and fox chasey
Aim
To model changes in predator and prey populations in different conditions
What you need:
• Measuring wheel
• L arge packet of popcorn
• C loth to represent rabbit tails
• Timer
• Container What to do:
Part A: Rabbit populations
Many scientists use simulations or modelling to determine how the number of organisms of the same species (the population) will be affected by the introduction of a new species.
1 Measure a 30 m 2 area outside in the schoolyard. Count out 40 pieces of popcorn. Randomly throw handfuls of the counted popcorn through the area.

Figure 1 How does food affect a rabbit population?
2 Select five students to represent rabbits. Each “rabbit” should tuck a piece of cloth into their belt to represent a tail. In order to survive, each rabbit must collect at least five pieces of popcorn in the 15-second “season”. The retrieved popcorn is placed
in a container at the end of the time-period and is removed from the available resources.
3 Simulate a second season by adding another 30 pieces of popcorn and having the rabbits collecting popcorn during another 15-second “season”.
4 A ny rabbit that survives the second season “reproduces”. This involves selecting another student to join the simulation as a rabbit.
5 Repeat the simulation, using popcorn in varying amounts to represent the food production in good and poor years, until “starvation” begins to reduce the population.
6 Copy Table 1 and record your data for six seasons. Highlight the seasons that are droughts (poor food supplies) and those that are bumper years (good food supplies).
Table 1 Population of rabbits over six seasons
Season 123456
Number of rabbits at end of season
Part B: Introducing foxes
1 Repeat the simulation from Part A but this time with additional students representing foxes. A fox must catch a rabbit in order to survive. A fox catches

a rabbit by removing the cloth tail hanging from their belt (similar to flag football).
2 Copy Table 2 and record your data for six seasons.
Table 2 Population of rabbits and foxes over six seasons
Season 123456
Number of rabbits at end of season
Number of foxes at end of season
Questions
1 Construct a bar graph showing the number of rabbits and foxes at the end of each season.
2 Identify how the following factors were represented in the simulation:
a increased food supplies b decreased food supplies c competition between rabbits or foxes.
3 Use data from the simulation to explain the effect of:
a increased food supplies
b decreased food supplies
c competition on predator populations
4 Ex plain the characteristics in a population that will help some animals to survive.
Figure 2 How do predators affect a rabbit population?
Lesson 3.11
Experiment: What if the effectiveness of pollinators was reduced?
Aim
To examine factors that affect the pollination of fruit
Materials
• 10 chairs
• 2 large bags of popcorn
• 10 paper bags
• Timer Method
1 Divide the class into groups, with six students in each group. Each group represents a team of bees.
2 G ather the bees in one corner of the room or on the oval. This is the beehive.
3 Place approximately 10 chairs around the room or oval to represent apple trees. On the seat of each tree, place one handful of popcorn and an empty paper bag.
4 E ach group of bees takes turns flying between the apple trees, with bees taking a single piece of popcorn from one tree and putting it in the paper bag of another tree. This represents a bee pollinating the apple trees. Twenty seconds represents one growing season. This can become a competition if the number of pieces of popcorn on each tree is controlled.
5 At the end of 20 seconds, the bees gather back in the hive. A representative counts how many pieces of popcorn are in each
paper bag. Each piece of popcorn represents one apple that was able to grow on that tree during the season.
6 Record how many apples are grown in each group’s first season.
7 E mpty the paper bags and reset the popcorn on each chair tree.
8 Repeat steps 4 to 6 for each group.
9 Calculate the average number of apples grown in the season for all the groups.
Inquiry: What factors can affect the effectiveness of pollinators?
Choose one of the inquiry questions. You will investigate this inquiry question using a pollination modelling activity/simulation like that described above.
• W hat if the weather becomes colder so that the bees fly (walk) more slowly?
• W hat if a harsh winter kills half the bees in the hive?
• W hat if overcrowding in the hive causes half the bees to swarm out of the area?
• W hat if the apple trees are damaged and lose half their leaves?
Complete the following steps for your inquiry question.
1 Develop a hypothesis for your inquiry.
2 Identify how you represent your independent variable in the pollination model.

3 Identify what effect you expect to see on the dependent variable that you will measure and/or observe.
4 Identify the variables you will need to control to ensure a reproducible test. Describe how you will control them.
5 Develop a method for your investigation. (Hint: Use the method above as a guide.)
6 C onstruct a table to record your results.
7 Show your teacher your planning to obtain approval before starting your investigation.
Results
Construct an appropriate table and graph to show the results of your inquiry.
Discussion
1 Describe the effect that changing bee populations has on the amount of fruit produced.
2 Describe one way your pollination model was not an accurate depiction of real-world pollination.
DRAFT
3 P ropose one way to improve the model you used.
4 Identify one situation where scientists may use computer modelling in their research.
Conclusion
Explain why pollinators are important to the supply of fruit.
Lesson
3.12
Ecosystems can be disrupted
Key ideas
→ Humans compete with other organisms for finite resources including land and food.
→ Natural disasters such as floods and draughts can see organisms compete for more limited resources, resulting in a decrease of their population.
→ Humans have impacted ecosystems through deforestation, urban sprawl, climate change and land degradation.
→ Understanding the human impact on ecosystems can allow solutions to be created to protect ecosystems. Learning intentions and success criteria
Figure 1 Bees are an effective pollinator
Limited resources
Animals use resources such as food and water and, in turn, they become food for other organisms. The number of resources in an ecosystem is always limited. As the size of a population reaches its carrying capacity (the ability of the environment to support a population), some of its resources, such as food, space and shelter, will become more limited.
As people build more houses, and cities grow, native plants and animals are pushed into smaller areas. This means some organisms will either die or need to emigrate (leave). Once the animal or plant population decreases, there will be more resources for those remaining. When this occurs, the animal or plant population will stabilise (reach its maximum size). The population will find a new balance, or equilibrium.
Natural events, such as the change in seasons and natural disasters, can disrupt the balance between the biotic (living) and abiotic (non-living) factors in an ecosystem.
Seasonal changes
When the weather becomes colder, many animals migrate to warmer areas (Figure 1). As a result, their populations decrease in one environment and increase in another. During the breeding season, usually spring, the numbers of animals will increase. Flowering plants are pollinated and form seeds, which spread throughout the environment and later germinate into seedlings.
As a population increases, so does competition for resources. As a result of this competition, some members of the population survive and others die, allowing the population to maintain its balance.

carrying capacity the maximum number of organisms in a population that can be sustained by an ecosystem
Figure 1 Short-tailed shearwaters (Puffinus tenuirostris) leave their burrows on Montague Island on the southern coast of New South Wales and fly to feeding grounds in the area of the Bering Sea (between Russia and Alaska) during the northern hemisphere summer (June to August). They return to Montague Island to breed in late September.
natural disaster natural events, such as floods, volcanic eruptions, tsunamis and earthquakes, that can cause severe damage and fatalities flood the overflow of a large body of water
Natural disasters
Australia has a widely fluctuating environment. Years of drought can be followed by flooding rains. When extreme natural change affects humans, we call these changes natural disasters
Floods
A flood is an overflow of water onto dry land, which has an immediate effect on the growth of plants and the germination of seeds.
Floods can be a hazard for some animal life. Small mammals often escape to higher ground. Snakes are flushed out of their cover, as witnessed in the 2022 Queensland floods (Figure 2), and can become a potential danger to humans.

drought a period in which an area experiences water shortage
DRAFT
Some aquatic animals benefit enormously from floods, as their habitat can be expanded by the floodwaters. This can increase the food supply for aquatic animals and breeding. Increases in fish, insects and water-weeds are a food source for water birds. The extra food encourages the water birds to breed in greater numbers, temporarily changing the balance in populations.
Marine ecosystems can also be harmed by floods on land. When the water runs off the land, it brings sediment, pesticides and fertilisers into the marine ecosystem, causing some algal species to dominate the environment. Algal blooms are often deadly to other organisms living in the ocean environment.
Droughts
Droughts pose an even greater challenge than floods (Figure 3). During a drought, animals migrate to find water. Some animal populations “hang on” during a drought, but many populations decrease until the land looks almost bare. Wind can blow dry topsoil away from a drought-affected area, removing many of the nutrients in the ecosystem.
Human impacts

In an ecosystem with limited resources, humans must compete with other organisms for food and shelter. The human population has grown quickly over the last 200 years. We have changed the environment so that we can grow food, build homes and find resources to allow more and more people to live and work. Many of these changes affect the local environment (environmental impacts), how people live (social impacts) and how we work or earn money (economic impacts). Understanding the causes of these impacts will allow us to prevent further damage to ecosystems in the future.
Figure 2 Flooding in Queensland in 2022
Figure 3 Droughts can pose a greater threat to life than floods.
Deforestation
Our planet was once covered by many different types of landscapes, such as swamp, grassland, forest and heath. This variety of vegetation supported many species of animals that moved, reproduced and spread throughout their territories and beyond.

Since European settlement, over 44 per cent of Australia’s original bushland has been cleared. Much of that land is now used for housing, to grow food or to manufacture products. The food webs that existed in these areas have been changed as new predators (such as dogs and cats) moved in and the number of producers decreased (Figure 4).
Land degradation
as the clearing of native vegetation and the introduction of predators, in particular the red fox. The species was reintroduced to
Human activities have led to a degradation of the physical environment. Soil erosion is a major problem caused by the clearing of land for agriculture. In ecosystems with many trees, the soil is stabilised by a dense mat of plant roots. Its surface is covered by a layer of leaf litter, which protects the soil surface from erosion by wind and water. Water from rainfall is quickly absorbed through the top layers of soil.
Once land is cleared of trees for agriculture, there is little to protect the soil from the action of wind and water. Grazing by animals with hard hooves, such as cattle, compacts the soil. This slows the absorption of water into the soil and increases the amount of water runoff. This, in turn, erodes the soil. Wind also contributes to the removal of the nutrient-rich topsoil (Figure 5).
Urban sprawl
More than half of the world’s population lives in cities. The population in global urban areas has grown by more than one billion people since the 1970s. Much of this growth has contributed to a phenomenon or process known as urban sprawl.


Urban sprawl means the spread of urban areas into rural areas, such as farmland, forests and coastal lands that lie on the outer edges of cities. Urban sprawl increases the distance between the city centre and its outer edge (Figure 6).
urban sprawl the spreading and expansion of cities and houses into undeveloped land
Figure 4 The eastern quoll is a medium-sized marsupial that was considered extinct on the Australian mainland due to changes to their habitat, such
sanctuaries in Victoria in 2003.
Figure 5 In 1983, large amounts of topsoil were carried across Melbourne and into the Southern Ocean as a result of wind erosion.
Figure 6 Urban sprawl around many of Australia’s capital cities is on the rise.
Urban sprawl is common in rapidly developing cities or those with large populations. Some of Australia’s cities rate among the world’s worst in terms of their sprawling nature, particularly because everyone wants their own garden and local park.
A changing climate
Human activities are contributing to more significant changes to weather and climate. These changes can have a huge impact on ecosystems.
In alpine areas, changing rainfall and temperature patterns alter the amount of suitable wet alpine habitat (Figure 7). This has made it difficult for animals that need cool environments to survive.
Check your learning 3.12
Check your learning 3.12
Retrieve
1 Define the term “carrying capacity”.
Comprehend
2 Describe two things you can do to reduce your personal environmental impact (your ecological footprint).
3 Describe how a drought would affect the environment and the finances of people (economic impact).
4 Describe a possible social impact that would occur if the environment surrounding a city was protected so that no new houses could be built.
5 E ach winter the cold weather causes the mountain pygmy possum (Figure 8) to hibernate (deep sleep). This allows the possum to save energy when the food supplies are low during the winter. Describe how a warming climate could affect the mountain pygmy possum’s ability to hibernate and survive each winter.


Apply
6 C reate a two-column table with the headings “Problems” and “Solutions”. In the “Problems” column, list the types of things people do that affect wildlife, such as building homes and roads, and cutting down trees. In the “Solutions” column, propose solutions to each problem.
Skills builder: Questioning and predicting
7 C hoose one of the issues outlined in this topic, such as urban sprawl. Identify a question that you could investigate using secondary sources. (THINK: What would you like to know more about? Is the question specific enough to answer without personal opinions or bias?)
Figure 7 Alpine areas are reducing as the climate changes.
Figure 8 Mountain pygmy possum (Burramys parvus)
Lesson 3.13
Science as a human endeavour: Human management of ecosystems continues to change
Introduction
Different communities have different views on how to manage their local ecosystems. A growing population needs food to support it. Maximising food production while maintaining resources, such as soil and nutrients, can be difficult. The ability to see an ecosystem from another’s perspective can be useful.
Historical use of ecosystems
Humans first came to Australia over 60,000 years ago. They travelled out of Africa, through South-East Asia, before arriving at northern Australia. These people were hunter–gatherers and early farmers who respected the land because it provided them with the resources for life – food, water, shelter and medicine.
As original inhabitants of the land, Aboriginal and Torres Strait Islander Peoples are aware of the balance that exists in an ecosystem. For thousands of years, the Kaurareg people of the Torres Strait worked with the traditional owners of the surrounding islands to ensure that the populations of local turtles and dugongs were sustained for future generations. Small or pregnant dugongs, dugong mothers and calves are not hunted, so that the population can continue to reproduce in the future (Figure 1). Experienced hunters can even determine if a dugong has had calves in the past. The Kaurareg people keep the skull bones to check that they have not exceeded their quota.

Aboriginal and Torres Strait Islander Peoples are aware of the seasonal nature of plant and animal life in the surrounding ecosystems. Turtles only lay eggs for a few months each year. If all the eggs are collected and eaten, there will be no turtles to lay eggs in the future. Aboriginal and Torres Strait Islander Peoples use oral stories to explain the importance of keeping this balance and to identify the right time to collect the permitted number of eggs (Figure 2). These traditions continue today through collaboration and shared responsibility for marine conservation.
Figure 1 Dugongs (Dugong) are sea mammals that can live for over 70 years.
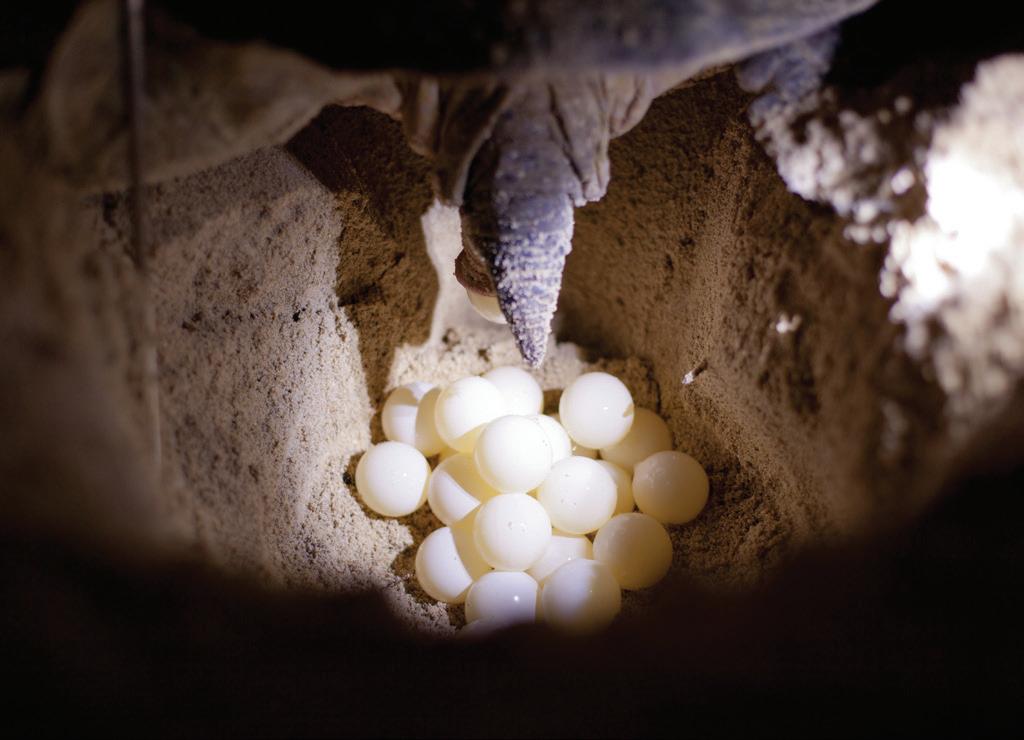

Instead of considering land as being owned by a specific person or group of people who can clear and use it according to their needs, Aboriginal and Torres Strait Islander Peoples consider land management to be based on shared ownership and a deep respect for the land. As Indigenous Person of the Year 1999, Bob Randall, said, “We do not own the land. The land owns us.”
Cool burning
There is increasing recognition of Aboriginal and Torres Strait Islander Peoples’ use of “cool burning” to control bushfires and reduce the emission of greenhouse gases (Figure 3 and Figure 4).


Early in spring, the grasses are not as dry. Any fires burn slowly and are put out by the heavy night-time dew. This means small fires can be lit to reduce the grasses that form the undergrowth under treetops or canopies. If small patches of undergrowth are burnt, the nutrient matter is cycled back into the soil without destroying all the food available. The trees that form shelter for the animals in the area are also protected. Within a short time, new green growth can occur, providing a new source of food for the young animals that are born during this time.
Figure 2 (A) Aboriginal and Torres Strait Islander Peoples use oral traditions to teach the importance of balance in an ecosystem, including restricting the number of turtle eggs that can be collected. (B) The green sea turtle (Chelonia mydas)
Figure 3 A patch of bush after controlled burning in Ipswich, Queensland
Figure 4 Modern land managers practising traditional methods of regenerating bushland
This cool burning process has been used by Aboriginal and Torres Strait Islander Peoples for thousands of years and many plants, such as the grass tree (Xanthorrhoea), have evolved to only flower when the base of the tree has been burnt by fire. Other plants, such as Eucalyptus species have evolved buds that can regrow branches from deep under thick bark, and lignotubers that can grow new shoots from roots protected from fire under the ground (Figure 5).
If cool burning is repeated each year, the slow limited burning reduces the release of greenhouse gases (especially methane and nitrous oxide) and the carbon remains trapped in the unburnt large trees and bushes.
Modern needs

As the population of Australia has increased, so too has the need for food. Meeting this demand must be balanced with protecting Australia’s unique biodiversity and ecosystems.
In Australia, we currently have plenty of food, thanks to a strong agricultural community. Irrigation of large areas allows crops to survive. Australian farmers have become more effective in their use of water, protecting this important resource for future generations (Figure 6).
Figure 6 Modern farming involves using water more wisely.
Figure 5 Grass tree and eucalyptus growth after a fire
In 2018, tropical Cyclone Debbie hit the coast of Queensland, causing major property damage, power outages and millions of dollars of damage to Australia’s sugar cane industry. Global warming is expected to cause storms of this magnitude to become more frequent and spread over larger areas. Some scientists predict that droughts may also become increasingly frequent in all areas of Australia. This will have an impact on the types of crops that can grow in many areas.
In 2010, Australia’s Chief Scientist made some recommendations to enable us to maintain the food production needed to feed Australia and the rest of the world while minimising the impact on the ecosystem.
• Coordinate programs that maintain current food production levels.
• Research methods and crops that will cope in drought conditions.
• Develop methods that allow more efficient use of water and nutrients in agricultural areas.
DRAFT
• E ncourage more scientists and engineers to work in agriculture. This means that agriculture is looking to science and technology to help maintain a balance between food production and protecting biodiversity and ecosystems (Figure 7).


Test your skills and capabilities
Conducting interviews
Aboriginal and Torres Strait Islander Peoples have traditions of using oral stories to pass on their history and culture. These stories have passed on important environmental information.
For generations, the Bidjara people of southern Queensland have shared their knowledge about the journey of the Mundagudda or “rainbow serpent”. The journey of the Mundagudda on land is said to have created rivers, waterways and gorges. These stories provide guidance that helps people navigate the landscape and its different features.
The ability to learn by listening to members of the community is a valuable skill. Interviewing the older people in your life, such as your parent, guardian or grandparent, can allow you to gain an understanding of the environment in your area and how it may have changed over time.
Figure 7 Scientists are developing ways to use water more efficiently. (A) Traditional irrigation (B) Modern micro-irrigation system
Find out who the Aboriginal or Torres Strait Islander Peoples of your local area are. Research how they manage a local ecosystem to answer the following:
1 Describe the area in your local ecosystem that you selected.
2 Describe how the local Aboriginal or Torres Strait Islander Peoples have managed this ecosystem. Use the following questions to guide your research:
a A re there different ways to manage the ecosystem change in different seasons?
b H as the management of the ecosystem changed over time?
3 E xplain how the local Aboriginal or Torres Strait Islander Peoples’ management practices affect the ecosystem.
A good interview that gathers qualitative data requires planning. Consider each of the following points and use them to plan and conduct your own interview.
• Find a good location: people are often more comfortable in a familiar place and will, therefore, tell better stories.
• Write down your questions: consider what you want to know before you start the interview. Is there background knowledge that you should know before the interview?
• Be prepared to wait: your interviewee might need time to think before answering your questions. Despite the awkwardness of silence, it is worth waiting for the answer.
• L isten to the answers: one of the most difficult things to do in an interview is to listen to what is said instead of planning what questions to ask next. If you listen to the answer, you will be able to ask follow-up questions that turn the interview into a conversation.
• Record the answers: this can be as simple as a voice or video recording on your phone. But make sure you ask for permission first. Alternatively, you could write down the answers; however, this can interrupt the flow of conversation.
• C heck the stories against other records to confirm when the events might have occurred: sometimes memories can change, or the dates can become difficult to remember. This can also help you fill in the details when you record the qualitative oral data for future generations.
DRAFT
Lesson 3.14 Challenge: Eucalypt adaptations
Aim
To examine the ways eucalyptus species have adapted to survive fire
What you need:
• R ipened eucalyptus nuts (gumnuts)
• O ven or incubator
• Baking tray
• L eaves and bark of a eucalypt
• Heatproof gloves
Caution!
Take care when using the oven or incubator
What to do:
1 Place the gumnuts in a 40°C oven or incubator for 24 hours to open and release the seeds. Each of these thick, woody capsules contains hundreds of tiny seeds.
2 Feel the leaves of the eucalypt. They have a thick cuticle that is effective in preventing water loss.
3 Hold a leaf up to the light or place under a binocular microscope. Notice the numerous small dots, which are oil glands on the leaf.
4 H ave a close look at the bark of the tree. Many eucalypt trees have bark that is thick and fibrous.
Questions
1 Ex plain why the seed of the gumnut is protected with such a thick external capsule.
2 Identify what might trigger the release of the seed from the gumnut.
DRAFT
3 Ex plain the function of the oil glands in a eucalypt leaf.
4 Ex plain the function of thick, fibrous bark.
5 Ex plain how the following changes could affect a eucalypt, describing how its features will help it to survive:
a a n intense bushfire
b a n introduced herbivore that feeds on eucalypt leaves
c a new mistletoe species that expands into its population
d a drought.

Figure 1 Gum-nuts have a thick external capsule.
Lesson 3.15 Review: Ecosystems
Summary
Lesson 3.1 All organisms are interdependent
• Scientists use a food chain to show the flow of food and energy in an ecosystem.
• P roducers make their own food and are found at the start of the food chain.
• Consumers need to gain their energy from other organisms.
• Food chains show the flow and direction of energy from a producer to the different consumers.
• Food webs have many interlinking food chains.
Lesson 3.3 All organisms have a role in an ecosystem
• A n ecosystem is a community of living organisms and their surroundings.
• P redators eat prey.
• O rganisms can compete for the same food sources.
• Symbiotic relationships are long-term relationships and vary between organisms. These include symbiosis, commensalism and parasitism.
Lesson 3.5 Energy flows through an ecosystem
• Plants undergo a process called photosynthesis to create energy and oxygen.
• A nimals that only eat plants are called herbivores.
• A nimals that only eat other animals are called carnivores.
• A nimals that eat both plants and animals, like humans, are called omnivores.
• Trophic levels indicate an organism’s position in a food chain.
• A food pyramid can be created from a food chain and shows the amount of energy at each trophic level.
• M icroorganisms obtain energy by breaking down dead organisms.
Lesson 3.7 Population size depends on abiotic and biotic factors
• A ll populations are affected by abiotic and biotic factors.
• Deaths and emigration can decrease a population.
• Bi rths and immigration can increase a population.
• C hanges in population can affect an ecosystem’s food web.
• Population dynamics uses counting methods to monitor populations to make predictions about populations and causes for any changes.
Lesson 3.9 Introducing a new species may disrupt a food web
• I ntroduced species can change the amount of food for other organisms.
• New species can have environmental, social and economic impacts.
• New species can cause a new equilibrium in an ecosystem.
• Biological control is the deliberate introduction of a new species to control a non-native plant or animal.
• L oss of species can have a negative effect on an ecosystem.
Lesson 3.12 Ecosystems can be disrupted
• Humans compete with other organisms for finite resources including land and food.
• Natural disasters such as floods and draughts can see organisms compete for more limited resources, resulting in a decrease of their population.
• Humans have impacted ecosystems through deforestation, urban sprawl, climate change and land degradation.
• Understanding the human impact on ecosystems can allow solutions to be created to protect ecosystems.
Review questions 3.15
Review questions
Retrieve
1 Identify the organism in Figure 1 that is the producer in the food chain.
A Corn
B Mouse
C Sn ake
D O wl
2 Identify the organism that is the second-order consumer in Figure 1.
A Corn
B Mouse
C Sn ake
D O wl
3 Identify the organism that is the herbivore in Figure 1.
A Corn
B Mouse
C Sn ake
D O wl
4 Define the term “ecological footprint”.
5 Define the term “urban sprawl”.
Comprehend
DRAFT
6 Describe one practice Aboriginal and Torres Strait Islander Peoples have used to make sure they do not disrupt the environment too much.
7 Describe one example of how humans, especially after European settlement, have changed ecosystems because of an introduced species in Australia.
8 Describe an example of an abiotic condition in an Australian ecosystem that could limit the population of an organism.
9 Ex plain the term “cool burning”.
Mouse Snake Owl Corn
Figure 1 A food chain
Humpback whale
Emperor penguin
Fur seal
Orca
Squid
Deep-sea fish
Krill
Phytoplankton
Figure
10 Ex plain why it is important to have biodiversity in an environment.
11 With a growing population, humans are requiring more from the land around them. Summarise three ways in which humans are changing the environment.
Analyse
12 Compare mutualism, parasitism and commensalism.
13 C lassify the following as either abiotic or biotic factors.
a Salinity
b Bacteria present
c Temperature
d Plant species present
e Water availability
14 C ontrast a producer and a consumer.
15 Compare a herbivore and a carnivore.
16 A nalyse the marine Antarctic food web in Figure 2 by describing the relationship between:
a orcas and fur seals
b emperor penguins and fur seals.
Apply
17 Consider the food web in Figure 5 of L esson 3.1 (page 126). If the mouse were to become locally extinct, list the possible changes that might occur to the other organisms in the food web.
18 Discuss what happened when the cane toad (Figure 3) was introduced into Australian ecosystems. Explain how this impact might have been different if the cane toad had more successful predators.

19 A nalyse the food web shown in Figure 4, which shows organisms from the Yellowstone National Park ecosystem in the United States of America. While coyotes can eat larger elk, this usually only occurs when an elk is injured or sick.
a Identify one example of a producer and one example of a consumer in this food web.
b P redict what would happen to the population of elk in this ecosystem if the grey wolf was removed.
c Use your answer from question b to describe what would happen to the populations of grasses, grains and fruits in the park.
20 D raw a table of advantages and disadvantages of cool burning of bushland. Evaluate the points you raise in the table by judging which points are more important, and deciding if the cool burning advantages outweigh the disadvantages.
Critical and creative thinking
21 I magine a world without spiders. Discuss what the world would be like. In your answer, consider what spiders eat and which organisms eat spiders.
Figure 3 Cane toad (Rhinella marina)
Grey wolf
Coyote Grass, grain, fruits Elk
Vole
Figure 4 A Yellowstone National Park food web
22 I n some cases, introduced animals fail and never become established. In other cases, they are spectacular “successes”, such as the rabbits and foxes across much of southern Australia. In terms of the environment in which these animals live and their interactions with other animals, explain why some animals succeed and others do not.
23 A simple change to your daily habits, such as reusing and recycling paper at school, can make a difference to ecosystems (Figure 5). Use this example, or another, to discuss how your actions have an impact on biodiversity.

24 T he balance of nature is very delicate, and changes to the environment or any member of a food web bring about changes throughout the whole system. Food webs are graphical ways of showing eating relationships inside ecosystems. If the food web is changing, so is the ecosystem. Decide which would be more resistant to change: –big, complicated ecosystems with numerous species interacting –simple ecosystems with relatively few species interacting.
25 I n this module you have learnt about Earth’s growing population. Create a visual representation (sketch, drawing, poster or similar) to represent Earth’s changing population 50 years ago, now and 50 years into the future. This can be done by: –describing an example of how both environments could be disrupted by the same event –deciding which environment would be most disrupted and least likely to recover.
Social and ethical thinking
26 P rior to 1950, most scientists thought that the size and make-up of a population never changed. There were two parts to this. In human populations, the poor people in society would stay poor, and the rich would stay rich. In the animal world, some animals would survive, and some would die, but the population would stay the same. In the 1960s, ecologist Richard Levin started researching ecology and populations. He thought that all populations could change if there was enough change in the environment.
DRAFT
a Decide if you agree or disagree with Richard Levin.
b Describe two arguments from the paragraph above that support your argument.
27 Humans have tried a number of methods to reduce rabbit numbers in Australia, including the introduction of a virus that caused serious deformities and led to a slow and painful death. Discuss if the result (reducing the number of introduced rabbits so that other native wildlife survive) justifies how it was achieved (the painful death of the rabbits).

Research
28 C hoose one of the following topics on which to conduct further research. Present your findings in a format that best fits the information you have found and understandings you have formed.
Figure 5 Reduce, reuse, recycle
Figure 6 The introduction of rabbits to Australia has resulted in considerable environmental damage.
Science communication causing change
Dame Jane Goodall first travelled from England to Tanzania to study chimpanzees at the age of 26. Although she was not a trained ecologist at the time, she was gradually accepted by the chimpanzees. This allowed her to experience the way they behave and how they were affected by changes in their environment. Her regular communication with other groups around the world increased our understanding of the balance between the needs of humans and chimpanzees.
• Research how Dame Jane Goodall was able to change people’s view of chimpanzees by describing people’s views before and after her work.
Laboratory-grown meat
In Australia and many other countries, land is still being cleared so that sheep and cows can be farmed for meat. To prevent this, some laboratories are attempting to grow meat in a Petri dish.
• Ex plain how lab-grown meat could reduce our impact on the environment.
• Describe how the lives of the sheep and cattle farmers could be affected.
• Decide if you would eat lab-produced meat in the future.
Australian megafauna Megafauna are large animals that lived in Australia 2,580,000 to 7,000 years ago. These giant animals included Diprotodon (wombatlike marsupial), Megalania (Varanus priscus) (ancestor to a goanna) and Genyornis (flightless bird ancestor).
There are many hypotheses about why the megafauna became extinct, including that the early Aboriginal and Torres Strait Islander Peoples hunted them.
• Identify when the early Aboriginal and Torres Strait Islander Peoples arrived in Australia.
• Describe how long the megafauna coexisted with the early Aboriginal and Torres Strait Islander Peoples.
DRAFT
• I nvestigate and describe any cultural evidence that relates to megafauna.
• Describe the archaeological evidence that supports or refutes the hypothesis that the early Aboriginal and Torres Strait Islander Peoples contributed to the extinction of the megafauna.

Figure 7 Naracoorte in South Australia is known for its cave system where the fossils of many megafauna have been found.
Module
4 Resources

Overview
We rely on the world around us to survive. How we use Earth’s resources depends on whether they are renewable or non-renewable. Renewable resources can naturally regenerate over time, while non-renewable ones take much longer. By understanding their importance and impact, we can plan how to use soils, water, minerals, plants and energy more efficiently in the future. This helps us explore new technologies like desalination plants, solar energy, and electric or hydrogen-powered cars, which reduce our use of fossil fuels and help to plan our future.
DRAFT

DRAFT
Lessons in this module:
Lesson 4.1 Resources on Earth take different times to renew (page 172)
Lesson 4.2 Easily renewable resources can be quickly replaced (page 175)
Lesson 4.3 Challenge: Can you increase the output of a power station? (page 178)
Lesson 4.4 Easily renewable resources can be harnessed to provide energy (page 180)
Lesson 4.5 Challenge: Can you increase the power of solar cells? (page 185)
Lesson 4.6 Some resources are limited (page 186)
Lesson 4.7 Experiment: What if a metal was obtained from a mineral? (page 190)
Lesson 4.8 Soil is one of our most valuable resources (page 191)
Lesson 4.9 Experiment: What if different soils were exposed to water? (page 194)
Lesson 4.10 Our future depends on careful management of resources (page 196)
Lesson 4.11 Challenge: Resources for your future (page 199)
Lesson 4.12 Review: Resources (page 200)
Learning intentions and success criteria
Lesson 4.1 Resources on Earth take different times to renew
Key ideas
→ Resources on Earth can be classified as easily renewable or long-term renewable.
→ Easily renewable resources are either unlimited or quickly renewed.
→ Long-term renewable resources can take millions of years to be produced.
→ As the human population increases, more resources are required, placing a strain on the easily renewable and long-term renewable resources.
Introduction
Humans have always relied on the natural resources of Earth – in the air, the water and the ground. Oxygen and water are essential for keeping us alive. Soil is necessary for us to grow food for ourselves and our livestock. Minerals from Earth that are extracted by mining are essential to manufacturing and to Australia’s economy. Forests provide habitat for animals and timber products for our buildings. In fact, humans have found and used resources in almost every corner of the planet. As the human population continues to grow, we are putting more pressure on Earth’s resources than ever before.

Figure 1 Our environment provides us with many resources: easily renewable resources (continuous and non-continuous) and long-term renewable resources.
a Oil, a non-renewable resource, is the world’s most commonly used source of energy. It is also used to make many important goods, such as plastics, petrol and fertiliser for farms.
b Plants are a renewable resource because they produce seeds in order to reproduce themselves.
DRAFT
c Ocean waves are a resource for surfers and holiday-makers. They can also be used to generate electricity.
d Soil is formed when rocks break down. We use soil to grow the crops we eat and feed the animals we farm for food.
e Our use of the Earth’s resources is disrupting the Earth’s natural systems.
f In some parts of the world, electricity is generated from heat deep within the Earth. This is known as geothermal energy.
g Wind is used to turn turbines and to produce electricity.
h The amount of oxygen in our atmosphere stays about the same because it is constantly recycled through plants, animals and oceans.
i The Sun provides energy for plants and animals and forms the basis of everything we eat. It can provide electricity.
j Forests are a renewable resource that are under threat. Much of the world’s natural forest cover has been cleared or logged.
k Most of Australia’s electricity comes from the burning of coal. Coal is an important energy resource in many countries.
l Fresh water is vital for life on Earth, including plants, animals and people.
m Minerals are used as a resource in many ways. Uranium is just one of the many minerals mined around the world. It is used at nuclear power stations to produce electricity.
easily renewable resource resource that is made naturally and available in an almost unlimited amount
Types of resources
Resources on Earth can be classified into two major groups: easily renewable resources and long-term renewable resources (Figure 1).
Easily renewable resources are either available in a continuous and unlimited supply (such as sunlight and wind) or are able to naturally regrow in most conditions (such as fast-growing trees in a forest). Despite this, easily renewable resources still need to be managed carefully and used sustainably. Some easily renewable resources are continuous – there is an endless supply that is rarely affected by humans. Others, such as soil and water, can be affected by increased populations and we need to make sure that they are maintained.
long-term renewable resource that is limited because, once used, it takes a long time to replace
Long-term renewable resources, also known as non-renewable resources, are resources that take a very long time to be replaced and are therefore only available in limited supply. If we use them at a faster rate than they can be replaced naturally, they will run out. Minerals such as coal and oil are long-term renewable resources.
Check your learning 4.1
Check your learning 4.1
Retrieve
1 Name the two major groups of resources.
2 Name one easily renewable resource that is continuous without human intervention and one resource that takes a long time to renew.
Comprehend
3 Identify all the long-term renewable resources you have used in the past hour.
Analyse
4 Refer to Figure 1 to answer the following questions.
a Identify all the resources shown.
b Identify which of the resources are available in your local area.
DRAFT
Apply
5 Evaluate the resources in Figure 1 that you consider are well managed. Justify your answer (by listing each resource shown, identifying the number of years it takes to produce the resource, describing how the resource is used and using this data to describe whether the resource is well managed).
6 T housands of years ago, the Ngemba, Ualarai, Murrawarri and Wailwan peoples from the Brewarrina region in New South Wales built elaborate fish traps that caught the large mature fish while letting the smaller breeding stock escape. Compare the way we manage resources today with the way Aboriginal and Torres Strait Islander Peoples traditionally managed Earth’s natural resources.
Lesson 4.2
Easily renewable resources can be quickly replaced
Key ideas
→ Earth’s energy resources are limited.
→ Easily renewable resources, such as sunlight, are resources that can be easily replaced.
→ Australia relies on a variety of easily renewable and long-term renewable resources to provide power for its population.
→ Australia is investing in more renewable energy resources in order to reduce their reliance on long-term renewable resources such as coal and gas and reduce their carbon emissions.
Easily renewable and long-term renewable resources
If you burn 1 L of gas in a Bunsen burner, then there is 1 L less of that gas in the world. Many long-term renewable resources, such as gas, are continually being made, but on a timescale of hundreds of thousands or even millions of years. This makes them effectively non-renewable in our lifetime. If we continue to use a long-term renewable resource and it is not recycled, then it will run out.
It is estimated that Australia’s brown coal will last for another 500 years. By 2030, coal may still be one of our main energy resources, but there will be a shift to other long-term renewable energy resources, such as gas, and easily renewable energy resources, such as solar and wind.
Easily renewable resources are naturally made and available in an almost unlimited amount. Solar energy is energy that comes from the Sun. It is a renewable resource: an unlimited amount of it is available while the Sun shines in the sky. Of course, if the weather is cloudy, solar energy is not available; so it can have some disadvantages too. Other examples of easily renewable resources include clean air, timber and fish. Given the right conditions, they will be available if we do not use them too fast. We need to consider the consequences of taking too much.


the next lesson for a linked practical activity or experiment.
Check
solar energy energy made by atoms colliding with each other in the centre of the Sun
Figure 1 Some of Earth’s natural resources: (A) timber, (B) fish and (C) solar energy
A C B
that
be used for the production of energy
Australia’s energy resources
Australia has a variety of energy resources (Figure 2). For a long time, we have relied on resources such as coal, oil and gas for our energy needs. These long-term renewable energy resources are gradually being replaced by easily renewable energy resources such as solar, wind and hydro (Table 1).
According to recent research, Australia is one of the highest greenhouse gas emitters per capita in the world. Our use of long-term renewable energy resources for transport and generating electricity around the home makes up approximately one-fifth of our emissions.
How a power station works
Coal-fired power stations burn coal and carbon dioxide gas to produce electricity. When coal is burnt, heat is released. This heat is used to boil water to make steam. The steam flows past a turbine, causing it to spin. A turbine is a large wheel with angled sections called vanes, like a propeller. The turbine is connected to a generator. A generator converts the movement from the turbine into electrical energy.
Coal takes much longer to renew than the easily renewable solar or wind energy.
1 Identify Australia’s third-largest electricity production resource in 2007–08.
2 Identify an example of a long-term renewable resource. Explain why it is sometimes considered non-renewable.
3 Identify an example of an easily renewable resource. Justify your decision (by describing how the resource is renewed).
greenhouse gas a gas (carbon dioxide, water vapour, methane) in the atmosphere that can absorb heat emission the production and release of a substance into the air (e.g. gas)
turbine a large wheel with angled sections called vanes, like a propeller, that is used to generate electricity generator a machine that uses the electromagnetic effect to separate charges and produce electricity
4 Describe how long it takes for long-term renewable resources to form.
5 Ex plain why the timescale for renewal of a resource is an important issue.
6 A nalyse Table 1. Compare energy production in 2007–08 and 2023.
7 Describe one reason why electrical energy production has changed in Australia in the last 20 years.
Skills builder: Processing and analysing information
8 Ex amine Figure 2.
a Identify the energy resources found in Western Australia or off the West Australian coast. (THINK: What can the legend tell you?)
b Ex plain why the coal mines in Australia are located where they are. (THINK: Can you see any relationships between features on this map?)
Lesson 4.3
Challenge: Can you increase the output of a power station?
Caution!
• H andle the kettle carefully to avoid burns and scalds.
• T he boiling water in the beaker will have made the sides of the beaker hot. Be careful to avoid burns when placing the foil.
Aim
To model and modify the design of a steamdrive turbine
Design brief
Modify the design of a model power station so that you increase the rate at which the turbine spins.
DRAFT
Criteria restrictions
Only the following materials can be used:
• square paper (15 cm × 15 cm) cut from one A4 sheet
• r uler
• pencil with eraser on the end
• sc issors
• pi n
• t ripod
• Bunsen burner
• heatproof mat
• gauze mat
• 250 mL beaker
• electric kettle
• large nail
• a luminium foil (1 piece, 10 cm × 10 cm)
• matches.
Questioning and predicting
• Describe how you could improve the turbine of a power station.
• Describe how you could increase the production of steam.
• Describe how you could improve the quantity and speed of the steam that hits the turbine.
Planning and conducting
The turbine
1 M ark the square paper as shown in Figure 1 using a pencil and a ruler. Draw a circle in the centre about the size of a 5 cent piece.
2 Cut the paper along the lines but stop at the edges of the circle.
3 Fold all four corners in towards the centre, one at a time, and hold them in place.
4 I nsert a pin through the four corners and into the tip of the pencil’s eraser.
5 Blow on the pinwheel to see if it spins (Figure 2). If it doesn’t spin, pull the pin out slightly to create room for the paper to spin. The pinwheel will act like the turbine of a power station.


The boiler
1 Place the tripod and the Bunsen burner on the heatproof mat. Place the gauze mat and then the beaker on top of the tripod. Don’t light the Bunsen burner yet.
2 Boil the kettle and carefully pour the boiling water to half-fill the 250 mL beaker.
3 Use the nail to punch a small hole in the centre of the aluminium foil.
4 Place the aluminium foil over the top of the beaker and fold it down the sides of the beaker.
DRAFT
5 Safely light the Bunsen burner and move it under the tripod on the heatproof mat. Open the collar on the Bunsen burner to produce a blue flame. Refer to Lesson 1.13 Skills lab: Lighting and using a Bunsen burner (page 42) if you need help safely lighting a Bunsen burner.
6 Heat the water in the beaker until it boils again. Steam should come out of the hole in the foil.
7 Hold your pinwheel over the hole and let the steam spin the “turbine”.
Processing, analysing and evaluating
1 Describe what happened to your pinwheel when it was placed in the steam flow.
2 Describe what else you would need to add to make your “power station” generate electricity.
3 Identify the fuel in your power station.
Communicating
Describe how a power station generates electrical energy.
Figure 1 Marking the square paper
Figure 2 Blowing on the pinwheel
intentions and success criteria
Lesson 4.4
Easily renewable resources can be harnessed to provide energy
Key ideas
→ Resources can provide a source of energy to meet our needs.
→ Renewable resources can provide unlimited amounts of energy to generate electricity.
Check the next lesson for a linked practical activity or experiment.
fossil fuel a nonrenewable energy source formed from the fossilised remains of plants and animals
DRAFT
wind turbine a wheel with blades that turns in the wind to generate energy wind farm a large group of wind turbines in the same location
→ Wind, solar, hydroelectric, tidal and geothermal power are easily renewable resources that can be used to generate electricity.
Wind power
A very important step in generating electricity is turning a turbine. Fossil fuels are often burned to produce the steam that turns a turbine. Wind can also turn a turbine without steam and without emitting carbon dioxide (Figure 1).

To generate a significant amount of energy, many wind turbines are placed in long rows in a wind farm (Figure 2). The stronger the winds, the faster the turbines turn and the more energy is produced. Most wind farms are located on the top of a hill (away from any interruptions to the wind flow) and close to the electrical grid so the energy can be transferred to the towns that need the electricity.
Figure 1 The parts of a wind turbine
Learning
Oxford University Press

Solar power
In Australia we are familiar with using solar power for things such as hot water, outdoor lighting and speed limit signs in school zones (Figure 3). Solar energy is made when solar cells (in solar panels) convert sunlight into electrical energy. When large numbers of solar panels are used to produce electrical energy for large towns or industries, they are called solar farms. Two-thirds of the Australian population live in cities and about 70 per cent of mainland Australia can be classified as arid or semi-arid desert. This means that Australia has large areas of sun-exposed land that can be used to convert the energy of the Sun into energy that can be stored in batteries.
While solar panels do not release greenhouse gases, their construction can have environmental impacts. Many of the materials needed in the solar panels need to be mined, and each panel has a lifespan of 10 to 15 years. This impact can be minimised by recycling the minerals that are used in their construction.


Figure 2 A wind farm in Australia
solar cell a device that transforms sunlight directly into electrical energy
Figure 3 Solar power has many uses, such as generating power for (A) speed limit signs, (B) home electricity and (C) outdoor lighting. Which of these have you seen?
A B C
hydroelectric energy energy produced by falling water that turns turbines to generate electricity
Hydroelectric power
Hydroelectric energy (hydro meaning “water”) is produced by water falling through pipes to turn turbines to produce electricity. It accounts for approximately 17 per cent of the world’s energy production. Hydroelectric schemes need a constant water supply and are often built in areas high above sea level, such as mountains. The water supply is held in dams and then released to cause fast-flowing water, which turns the turbines efficiently. Hydroelectric power in Australia meets approximately 5 per cent of our electricity needs.
Tidal and wave power
tidal energy the energy in the rise and fall of tides, which can be used to drive turbines in the water, producing electricity
Have you ever been to a surf beach and experienced the strength of the waves? The energy of waves can be used to spin air turbines (as explained in Case study: Australian oceans to power floating wind and wave project). It has been estimated that wave energy alone could power the entire Earth five times over! The problem is working out how to do it.
Tidal energy can also be used to drive turbines in the water. The major disadvantage of tidal power is that it only provides a relatively small amount of electricity and has a negative impact on the nearby natural environment. The world’s largest tidal power station is in France.
Case study: Australian oceans to power floating wind and wave project
• T he Land Down Under is well known for its beaches, its sunshine and its oceans. We are the country that is “girt” by sea, after all. Now we are set to harness the power of our oceans in a significant floating wind and wave project that will generate 6 MW of power.
• T he offshore platform is the brainchild of Australia and UK-based energy company Bombora, in collaboration with global energy infrastructure and engineering group TechnipFMC.
DRAFT
• T his project will centre around mWave technology that Bombora developed in Perth. A sister project will also test the technology in a Marine Energy Testing Area off Pembrokeshire, Wales.
• T he process involves air-filled concave cell modules covered by a rubber membrane being placed under the ocean to capture the optimal amount of power.
• “As waves pass over mWave, under-water pressure increases, causing each rubber membrane to compress sequentially, forcing air from inside the cells into a duct. Valves control a one-way airflow to the turbine — directly spinning a generator converting this rotation into electricity,” the Bombora website explains (Figure 4).
• “After passing through the turbine, the air is recycled to re-inflate each membrane in a continuous sequence. The sustainable power generated is transferred to the electrical grid via the same sub-sea cable used for the wind turbine.”
Figure 4 Wave power can be used to drive turbines and generate electricity.
Source: “Australian oceans to power floating wind and wave project”, 2021, Energy Matters, 14 April, www.energymatters.com.au/ renewable-news/australian-oceans-to-power-floating-wind-and-wave-project.
Geothermal energy
Geothermal energy comes from heat beneath Earth’s surface. The super-heated liquid rock under Earth’s surface is called magma. Magma heats the layers of rock above and below it. This heat is geothermal energy and some of it is released as steam. The steam can be used to turn a turbine in a generator, producing electricity.
Australia’s only geothermal power station is in Birdsville, in western Queensland (Figure 5). The power station has a bore (pipe) that extends 1,230 m into the ground and taps into 98°C water from the Great Artesian Basin. This power station provides approximately one-quarter of Birdsville’s energy supply. After the steam has been used to drive the turbine, the cooled water becomes the town’s water supply.
DRAFT
geothermal energy energy that

is squeezed in chamber
comes from heat beneath Earth’s surface
Figure 5 Superheated water is produced at the geothermal power plant in Birdsville, Queensland.
hot dry rock geothermal energy a method of pumping water into deep hot rocks in the ground in order to produce steam, which is then used to drive a turbine to generate electricity
Hot dry rock geothermal energy
Australia has access to a technology that could produce electricity for many years. This technology is called hot dry rock geothermal energy. Australia has the world’s best geology for this type of energy. Hot dry rock has been found in Central Australia, and reserves in the Hunter Valley in New South Wales are being tested.
To use the energy from the hot dry rock, water is injected through bore holes into hot granite rock that is 5 km underground. The hot rocks cause the water to evaporate into water vapour or steam (Figure 6). The steam produced can be used to generate electricity. This technology doesn’t use any of Earth’s valuable resources because the steam can be condensed back into liquid water and injected into the hot granite rock again.
Once the energy has been produced, it often needs to be transferred or stored until it can be used. This can be done through the use of a battery. Most batteries are made of metals, such as lithium, cobalt, nickle and manganese. Australia is one of the largest producers of lithium for batteries in the world. Lithium is a non-renewable resource.
1 Describe how energy is generated by a hydroelectric power station. Comprehend
2 Describe two advantages of hydroelectric power over fossil fuels.
3 A large group of wind turbines in the same location is called a wind farm. Identify the important features of a suitable location for a wind farm.
4 Ex plain why most wind turbines are mounted on towers 40 m to 100 m high. Apply
5 T he major hot dry rock resource is in Central Australia, away from the densely populated coastal regions. Identify why
Hot rock
Cold water pumped in Sediment Electricity
Steam produced
Figure 6 Hot dry rock technology uses steam to generate electricity
this location could be a disadvantage for energy generation.
6 Coal-fired power stations in Victoria run 24 hours a day, seven days a week. Explain why this is considered more reliable than wind power.
Skills builder: Questioning and predicting
7 P redict what would happen to a solar panel’s power-producing abilities in the
following scenarios. Explain your reasoning. (THINK: Use your understanding of how solar power works.)
a T he solar panel was placed in the shade instead of the sun.
b T he solar panel was placed on the roof of a skyscraper.
Lesson 4.5
Challenge: Can you increase the power of solar cells?
Aim
To model the design and arrangement of solar cells to maximise the energy output
Design brief
Modify the design of a solar cell so that it produces the highest voltage.
Materials
• Small solar cells
• Voltmeter
• E lectrical wires
• Transparency sheet (to mimic a dust layer)
• Black cardboard Questioning and predicting
• Describe how you could maximise the amount of sunlight a solar cell receives.
• Describe how a solar panel can be cleaned. Contrast the voltage produced by a clean solar panel and a dusty one.
• Describe how you could connect more than one solar cell so that the amount of voltage produced increases.
Planning and conducting
1 W hile inside a building, connect a solar cell to the voltmeter using the electrical wires.
2 Record the voltmeter reading with the limited light available.
3 Cover the solar cell with black cardboard and record the voltmeter reading.
4 Take the solar cell to a window and record the voltmeter reading.
5 Take the solar cell outside, face it towards the Sun and record the voltmeter reading. If it is cloudy, take a reading and then repeat the measurement when the clouds clear or on another day when it is sunny. While outside, complete steps 6 and 7.
6 Cover the solar cell with a thin transparency sheet to mimic a layer of dust and record the voltmeter reading.
7 Connect solar cells together in series (i.e. in a line) and record the voltmeter reading.
Processing, analysing and evaluating
1 Copy the table into your notebook and record your results.
Inside
Inside, covered
Window
Outside, sunny
Outside, cloudy
Outside, dusty
Outside, multiple cells
intentions and success criteria
Lesson 4.6
Check the next lesson for a linked practical activity or experiment.
2 Use your data to identify the best conditions for generating electricity from a solar cell.
3 Ex plain why a house with a solar energy installation will have six, eight or more solar cells on its roof.
4 Ex plain why the solar panels on a house roof should be cleaned regularly.
Communicating
Describe the conditions that will maximise the electricity produced by solar cells.

Some resources are limited
Key ideas
→ Fossil fuels such as coal, gas and oil are produced when plant and animal remains decompose.
→ Uranium is a radioactive substance that can be used to heat water in energy generation.
→ Minerals such as gold and aluminium, come from the Earth and are used by humans for everyday objects.
Figure 1 The power of solar cells
Fossil fuels
Fossil fuels were formed about 300 million years ago during the Carboniferous period, before the time of the dinosaurs, from the remains of animals, trees and other plants that grew in tropical swamps during this period (Figure 1). When the living things died, they fell into the swamps. Because they were underwater where there was not much oxygen, the dead plants and animals could not completely decompose. The partly rotted material gradually built up, forming a layer of material called peat.

Over time, the layers of peat built up and then rocks formed on top of them. The pressure from the rocks on top and the heat from Earth’s crust underneath caused chemical reactions that gradually changed the peat into fossil fuels, such as coal, gas and oil (Figure 2).
When fossil fuels are burnt, the chemical energy originally stored in the plants is released. Carbon dioxide and water are also produced.

DRAFT

Most of the energy used to produce electricity in Australia comes from fossil fuels, especially coal. Coal is mined in open-cut mines, if it is close to the surface, or in underground mines. The energy stored in the coal is converted into electrical energy in a power station
Traditionally, power stations have been located near the coal deposits such as Latrobe Valley (located near brown coal, Figure 3). Large black coal resources found near Sydney and in central and eastern Queensland were also the site of power stations. Wind and solar farms are now increasingly replacing coal-powered energy.
from the remains of plants that lived about 300 million years ago power station a place where energy is converted into electricity
coal a fossil fuel formed
Figure 1 An artist’s impression of a tropical swamp in the Carboniferous period
Trees and plants fall into swamps.
Plant matter builds up underwater.
Plant matter rots under water and sediment, forming peat.
With pressure and heat, coal is formed.
Figure 2 (A) Formation of fossil fuels (B) A piece of brown coal

DRAFT
To produce and provide electricity to homes and businesses, we use a “big circuit”. This circuit begins with the generators at a power station. Electrical energy is transported from the power station to homes, businesses and factories by transmission wires. The change from coal-powered electricity generation to solar and wind involves a relocation of these transmission lines from one area of a state to another.
Uranium
Uranium is the most common radioactive element on Earth, and Australia has the world’s largest supply. Uranium is a non-renewable resource because it is formed in an exploding star. Uranium gives out energy, called radiation, as it splits into other elements. Many of these other elements are also radioactive. This splitting process continues for a long time until a stable element is formed.
Nuclear power stations use the energy from the splitting of uranium to heat water, turning it into steam (Figure 4). The steam drives turbines, which drive generators, just as in a conventional coal-fired power station. Unlike coal-fired power, nuclear power produces hardly any carbon dioxide emissions; however, it does produce radioactive waste that takes a long time to become safe or stable. Too much exposure to radiation can be harmful for humans.

Figure 4 A nuclear power station in Japan
Figure 3 Loy Yang Power, in the Latrobe Valley in Victoria, generates approximately one-third of Victoria’s electricity.
Minerals
Most of the human-made objects we use every day are made from materials that come from the earth. The process of extracting useful minerals from the earth is known as mining. Minerals are tiny grains or crystals that are the building blocks of rocks. Only a few minerals, such as gold, are found in a pure state. Mostly they are combined with other substances and need to be purified before they can be used.

Aluminium is not found as solid sheets in the ground. It is part of an ore called bauxite, which is made of aluminium, oxygen and iron (Figure 5). Ores are materials that contain a lot of useful minerals mixed in with other substances. Australia is rich in ore deposits and many mines have been in operation for a long time.
How a mineral is mined depends on the location of the ore body. If the ore is on or close to the surface, then open-cut mining is used (Figure 6). If the ore body is deeper, then underground mining is used and shafts are cut down into the ground to reach the ore. This is done to protect the surface environment but can be expensive and sometimes dangerous.

mineral a naturally occurring solid substance with its own chemical composition, structure and properties ore a mineral containing a large amount of useful metal
1 Name three examples of a fossil fuel.
2 Outline how coal is formed.
Comprehend
3 Ex plain why minerals are classified as a long-term renewable resource.
Analyse
DRAFT
4 C ompare (describe the similarities and differences between) energy generation from a nuclear power station and a coal-fired power station.
5 C ontrast (describe the differences between) a mineral and an ore.
Apply
6 Describe one reason why some people in Australia may be reluctant to agree with establishing a nuclear power station.
7 A rthur wants to design an experiment for a school project to observe how long it takes for trees to transform into coal.
a Evaluate this idea for an experiment. Do you think it is possible? Why or why not?
b Descr ibe one quantitative and one qualitative observation that Arthur could realistically make about coal instead.
Skills builder: Planning investigations
8 A student wants to observe how long it takes for trees to turn to coal. Identify the problem with this idea for an investigation. (THINK: Is this problem testable?)
Figure 5 Bauxite ore contains aluminium.
Figure 6 This open-cut mine in Mount Isa, Queensland, produces lead, zinc, copper and silver.
Lesson 4.7
Experiment: What if a metal was obtained from a mineral?
Aim
To obtain pure copper from the mineral copper sulfate
Materials
• 2 electrical leads with alligator clips on one end
• 2 to 12 V power supply
• 2 carbon rods
• 250 mL beaker
• Safety glasses
• 0.5 M copper sulfate solution
• Timer
• Paper towel
Method
1 Plug the electrical leads into the DC terminals of the 2 to 12 V power supply.
2 Connect the top end of the carbon rods to the alligator clips on the end of the electrical leads.
3 Wearing safety glasses, fill the beaker with approximately 100 mL of the copper sulfate solution.
4 Place the carbon rods into the copper sulfate solution, being careful not to let them touch each other or the beaker.
Inquiry: Improving metal production
DRAFT
5 Set the 2 to 12 V power supply knob to 6 V and turn the power on.
6 Observe the carbon rods over the next 10 minutes.
7 A fter 10 minutes, turn the 2 to 12 V power supply off. Remove the carbon rods and place them on paper towel.
Choose one of the inquiry questions.
• W hat if the voltage was increased?
• W hat if more copper sulfate was used?
Questions
You will now design your own experiment to answer your inquiry question.
1 Develop a hypothesis for your inquiry.
2 Identify the independent variable that you will change from the first method.
3 Identify the dependent variable that you will measure and/or observe.
4 Identify two variables you will need to control to ensure a fair test. Describe how you will control them.
5 Develop a method for your experiment and write it in your logbook.
6 C onstruct a table to record your results.
7 Show your teacher your planning to obtain approval before starting your experiment.
Results
Record your observations about the appearance of the carbon rods and the copper sulfate solution.
Discussion
1 Ex amine something else made of copper, such as an old 1 or 2 cent coin or a copper water pipe. Identify the copper as either whole (entirely made of copper) or a coating.
2 Describe how the object could have been coated with copper.
3 Identify where the copper that formed the coating came from.

Lesson 4.8
Conclusion
Describe the conditions that produced the most copper coating in the shortest time.


Soil is one of our most valuable resources
Key ideas
→ Soil consists of minerals, gases, liquids, and living and dead organisms.
→ Soil provides the essential nutrients for plants to grow.
→ If soil is missing any nutrients, different things can be added to improve it.
→ The erosion of soil can impact the ability to grow plants by brining more salty water closer to the surface.
Learning intentions and success criteria
Check the next lesson for a linked practical activity or experiment.
Figure 1 Experimental set-up
Introduction
Most people think of soil as dirt, but good soil contains everything plants need to stay alive and grow. Without plants, many of our food sources would not exist. Pick up some soil – you will be holding your life in your hands (Figure 1).
Ingredients of soil
Soils are formed when weather breaks down rocks over extremely long periods of time. They are complex mixtures of many materials, including sand, silt, clay and humus (decomposed plants and animals), as well as various minerals that plants need for healthy growth. Sand, silt and clay are all valuable natural resources because they can be mixed for use in construction and supply the essential nutrients for the plants we rely on for food (Figure 2).
Soil for life
Good gardeners know what makes good soil and they add different things to the soil to improve it. They might add compost or animal manure to the soil to improve its organic content. They might add fertiliser, wetting agents or chemicals to change the soil structure (Figure 3). Gardeners also need to monitor the tiny organisms that live in the soil. Many organisms, such as worms, help to keep the soil healthy (Figure 4).

DRAFT
Water-loving soil
Many Australian gardeners are frustrated by soils that do not let water soak in. How well a soil holds water plays a big part in how well plants will grow in that soil. Water drains easily through sandy soils, but sandy soils dry out easily. Heavy clay soils drain slowly; however, if the water cannot run off, the clay becomes waterlogged and muddy.


Figure 1 Soil is a valuable resource.
Figure 2 Sand is one of the materials in concrete mix.
Figure 3 Additives are used to improve soil.
Figure 4 Crops do best in soils that are carefully maintained.
Managing soils
When Europeans arrived in Australia, they used the land in very different ways from Aboriginal and Torres Strait Islander Peoples. The Europeans cleared the forests and introduced large numbers of sheep and cattle that grazed the grasslands. This meant there were few grasses and plants to absorb the rain. As a result, water stored underground (the water table) rose, bringing salty water closer to the surface (Figure 5). In addition, much topsoil was compacted by the hard hooves of the sheep and cattle. Land clearing and grazing have caused significant amounts of soil to be washed away in a process called erosion (Figure 6).

Thankfully, many farmers now practise sustainable agriculture (including rotating crops, limiting the tilling of soil and the careful management of water resources), and land care groups help manage damage to the land (Figure 7).


topsoil the upper layer of soil erosion the movement of sediment to another area sustainable agriculture farming in sustainable ways meeting society’s present food and textile needs, without compromising the ability for current or future generations to meet their needs till prepare and cultivate for crops
1 Identify the basic components of soil.
2 Describe how soils are formed.
3 Define the term “erosion”.
4 P ropose four ways that a good gardener might improve their soil.
5 Ex plain how clearing all the plants from an area can cause the soil to become salty.
6 Outline (list the main ways) how your life would be affected if there was no soil.
7 C lay-based soils prevent water from moving down into the roots, while sandy soils cause water to drain quickly past the roots. Explain how the type of soil can affect the growth of a plant.
Skills builder: Conducting investigations
8 Suggest a logical procedure for collecting a sample of soil to test in the lab. Write a step-by-step procedure. (THINK: What equipment would you need? Be specific about quantities.)
Figure 5 Many plants and trees cannot survive in soils that are high in salt.
Figure 6 Planting trees helps prevent further soil erosion. Figure 7 Healthy soil grows healthy plants.
Lesson 4.9
Experiment: What if different soils were exposed to water?
Aim
To compare the components found in different soils
Part A: Looking at dry soil
Materials
• 4 soil samples (beach sand, dry clay, good garden soil, potting mix)
• Mortar and pestle
• 4 Petri dishes
• 4 white tiles
• H and lens (or magnifier)
Method
1 G rind each soil sample with a mortar and pestle and then spread each thinly on a Petri dish on top of a white tile.
2 E xamine each sample with a hand lens.
3 D raw a labelled diagram and describe the following properties of each soil type: – colour – si ze –clear and glossy or dull and grey –rounded or sharp edges.
Method
1 Place the soil in the measuring cylinder and add water (Figure 1).
DRAFT
Part B: What is in soil?
Materials
• Small sample of good garden soil
• 100 mL measuring cylinder
• Water
2 Carefully mix the soil and water by holding the top of the measuring cylinder and rotating the base of the measuring cylinder.
3 A llow the mixture to stand undisturbed for at least 48 hours, or longer if needed. This will allow the components of the soil to separate into layers.
– Describe each of the layers that formed.
– Describe the components that floated to the top or settled on the bottom.
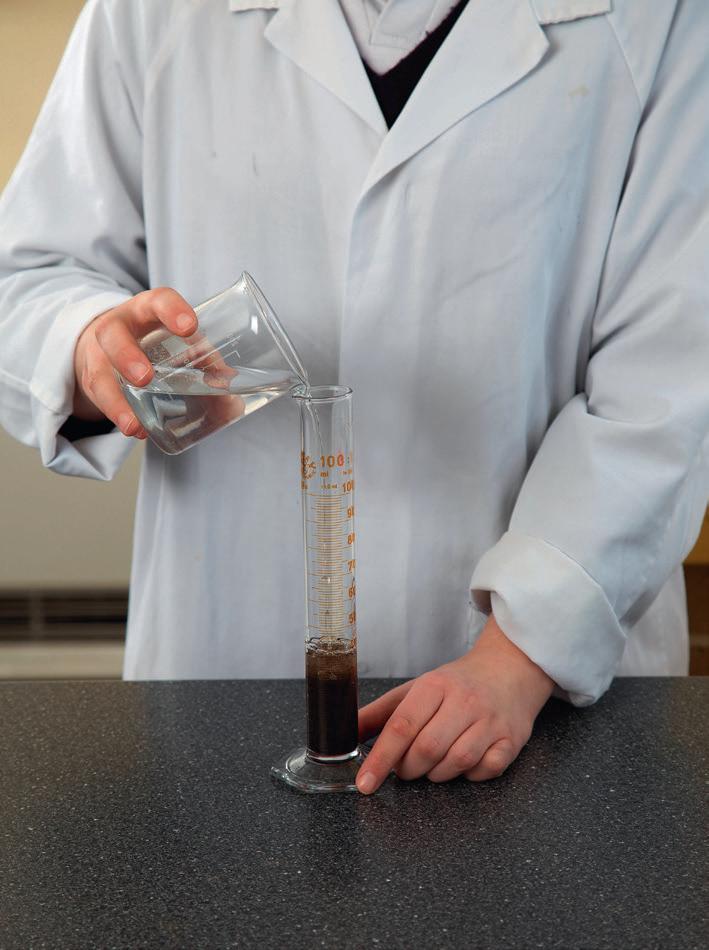
Part C: Testing
After examining the dry soil (part A) and what is in the soil (part B), predict which sample the water will flow through fastest (part C).
Figure 1 Adding soil to a measuring cylinder
Materials
• 4 cotton balls
• 4 f ilter funnels
• Teaspoon
• 4 soil samples (beach sand, dry clay, good garden soil, potting mix)
• 4 × 100 mL measuring cylinders
• 20 mL measuring cylinder
• Water
• Stopwatch
Method
1 P ress a cotton ball firmly into the “V” of each filter funnel.
2 Add 3 teaspoons of each soil sample to different filter funnels and press down firmly.
3 Place one funnel in the top of the measuring cylinder and add 20 mL of water.
4 Record the time it takes for the water to flow into the funnel.
5 Repeat steps 3 and 4 for the remaining three soil samples.

Results
Record your observations and measurements for parts A, B and C in separate tables.
Discussion
1 Identify the independent variable and dependent variable in your experiment.
2 Identify which soil drained the fastest.
3 Identify which soil stopped the most water from flowing.
DRAFT
4 Identify which soil absorbed the most water.
5 Ex plain why the water-holding abilities were different between the soils.
6 Describe the qualities a good soil needs for plants to grow well.
Conclusion
Compare the water-holding ability of the four soils.
Figure 2 Experimental set-up
Learning intentions and success criteria
Lesson 4.10
Our future depends on careful management of resources
Key ideas
→ Resources can be sustainably managed.
→ Designers are considering the end of life of a product during the design process.
Check the next lesson for a linked practical activity or experiment.
electronic waste (e-waste) discarded electrical equipment or devices circular economy a system that minimises or eliminates waste by reusing, recycling and regenerating materials
low-emissions vehicle (LEV) cars or buses that release very few exhaust gases, including carbon dioxide
DRAFT
hybrid car a vehicle that uses two or more energy sources, such as petrol and electricity
→ A circular economy considers how materials can be reused rather than “used up”.
→ To reduce the reliance on petrol or diesel cars and reduce greenhouse gases, electric vehicles are designed to run on a battery and can be recharged.
→ As more homes install solar panels, large batteries can be used to store any excess energy for use later on.
→ Smart homes use less resources such as electricity and water for everyday tasks.
Introduction
The large increase in solar panels in Australia has encouraged people to look for ways to use this renewable resource. Electrical energy is being used to power cars and stored in batteries so that houses can have energy overnight. Minerals used in the batteries are becoming increasingly difficult to find. This encourages the producers of the batteries and other electronic devices to consider how the items can be recycled and the materials reused in the future. Planning this before the batteries are made will make it easier to dismantle the electronic waste (e-waste) at the end of its life. This process of extracting and reusing materials is part of a circular economy
Electric cars
In Australia, gas emissions from petrol or diesel cars are a major contributor to greenhouse gases. Most car companies have designed one or more low-emissions vehicle (LEV). These cars include fully electric or hybrid cars, utes and trucks. Hybrid cars use a mix of petrol and electricity. The electric motor works with the petrol engine to reduce fuel consumption and gas emissions, but it does not eliminate them.
New types of batteries have made fully electric vehicles that can travel long distances a reality. Current car batteries can be heavy. Heavy cars need more energy to move. Lightweight cars need less energy. This means electric cars need to balance their mass with the range they can travel. New materials and developments in the science of batteries are decreasing the weight of the batteries and therefore increasing the range of electric cars.


Large batteries
When the Sun shines on a solar panel, it generates electricity. This electricity is either used by the people in the house, or it is put into the energy grid. The energy grid includes all the high-energy wires connecting houses and the electrical substations that control the level of electrical energy houses can use. As the number of solar panels on people’s homes increases, the amount of energy in the grid increases. If the amount of energy in the grid becomes too high, it could damage the electrical equipment in the houses. To prevent the energy produced by wind or the Sun from being wasted, some Australian states have large batteries to store the extra energy. If there is a sudden need for energy on a cloudy day, or if there is a sudden drop in wind, the supersized battery can maintain the energy supply.

energy grid network of power plants, power lines and electric substations that generates, transmits and distributes electrical energy
Figure 3 South Australia’s Tesla big battery, officially known as the Hornsdale Power Reserve
Figure 1 The Tesla company produces a variety of sustainable electric cars and batteries.
Figure 2 Electric cars can be charged using a normal household power point.
University Press
Homes of the future
Scientists are collaborating with engineers and architects to make our homes smarter and more energy efficient. Homes of the future will have technology that switches off lights when the Sun comes out, will be built from “smart materials” (including paint that helps insulate the walls) and will have plants and solar panels on the roof. “Smart plugs” will monitor the electricity use of each appliance, and you could get an alert at school or work if you have left your television on, allowing you to switch it off remotely. Rainwater tanks will be located under the eaves, meaning that the water can flow into toilets and laundry appliances using gravity rather than a pump. Every external window and surface will have a role in the overall efficiency of the home, and surfaces will be designed to store heat during the day and release it at night. Homes will be smaller and will be designed to not only save energy but also generate energy.

Ex plain why the energy grid needs to
Describe how a supersized battery can be used to stabilise the electricity in the energy grid.
Figure 4 Homes of the future will be designed to be “smarter” and more energy efficient.
Apply
5 Some people do an audit of all the energy they consume. Suggest one reason why a person might do an energy audit of their home.
6 Should a designer consider what will happen to the components of a product at the end of a product’s life? Justify your response.
7 T he longest range of current electric cars is 500 to 550 km. Evaluate how easy it would be to use this car in different parts of Australia (by describing the advantages and disadvantages of using an electric car in different parts of Australia and deciding the locations that would benefit from electric cars).
Lesson 4.11
Challenge: Resources for your future
Aim
To prepare a report on a natural resource that is being mined
What to do:
Working in a small group, investigate the mining of one of Earth’s natural resources in your area and prepare a report of your findings. In your report, include:
• a brief summary of the topic
• how the natural resource is being mined

DRAFT
• why the natural resource is being mined (what is it used for?)
• t he changes in the local environment caused by mining this resource
• how the local environment around the mine could be regenerated to minimise the impact, or what is already being done to minimise the impact around the mine
• t he role of public education in this regeneration.
Present your report to the class as a speech and short multimedia presentation.


Lesson 4.12 Review: Resources
Summary
Lesson 4.1 Resources on Earth take different times to renew
• Resources on Earth can be classified as easily renewable or long-term renewable.
• E asily renewable resources are either unlimited or quickly renewed.
• L ong-term renewable resources can take millions of years to be produced.
• A s the human population increases, more resources are required, placing a strain on the easily renewable and long-term renewable resources.
Lesson 4.2 Easily renewable resources can be quickly replaced
• E arth’s energy resources are limited.
• E asily renewable resources, such as sunlight, are resources that can be replaced.
• Australia is investing in more renewable energy resources in order to reduce their reliance on long-term renewable resources such as coal and gas and reduce their carbon emissions.
Lesson 4.4 Easily renewable resources can be harnessed to provide energy
• Resources can provide a source of energy to meet our needs.
• Renewable resources can provide unlimited amounts of energy to generate electricity.
• Wind, solar, hydroelectric, tidal and geothermal power can be used to generate electricity.
Lesson 4.6 Some resources are limited
• Fossil fuels such as coal, gas and oil are produced when plant and animal remains decompose.
• Uranium is a radioactive substance that can be used to heat water in energy generation.
• M inerals such as gold and aluminium, come from the Earth and are used by humans for everyday objects.
Lesson 4.8 Soil is one of our most valuable resources
• Soil consists of minerals, gases, liquids, and living and dead organisms.
• Soil provides the essential nutrients for plants to grow.
• I f soil is missing any nutrients, different things can be added to improve it.
• T he erosion of soil can impact the ability to grow plants by brining more salty water closer to the surface.
Lesson 4.10 Our future depends on careful management of resources
• Resources can be sustainably managed.
• Designers are considering the end of life of a product during the design process.
• A c ircular economy considers how materials can be reused rather than “used up”.
• To reduce the reliance on petrol or diesel cars and reduce greenhouse gases, electric vehicles are designed to run on a battery and can be recharged.
• A s more homes install solar panels, large batteries can be used to store any excess energy for use later on.
• Smart homes use less resources such as electricity and water for everyday tasks.
Review questions 4.12
Review questions
Retrieve
1 Identify which of the following is considered a long-term renewable resource.
A Wind power
B Solar power
C Nuclear power
D Wave power
2 Identify which of the following is considered an easily renewable resource.
A Metal ore
B Fossil fuel
C Biofuel
D Nuclear power
3 Identify the source of tidal power.
A Movement of fish
B Ocean
C I nland lakes
D Su n
4 Define the terms “easily renewable” and “long-term renewable”.
5 Identify two examples each of:
A easily renewable resources
B long-term renewable resources.
6 Describe three different uses of electrical energy.
7 Define the term “geothermal energy”.

Comprehend
8 Describe the role of a generator in a windmill.
9 Describe how coal is used to generate electricity.
10 Ex plain what tidal and wave power are.
11 Ex plain why e-waste should be recycled.
12 Describe the factors that can affect the amount of electricity generated by a solar panel.
Analyse
13 Ex amine Figure 2 (page 176) in Lesson 4.2.
a Identify a resource that is close to your area.
b Describe how this resource could be used.
14 Ex plain why coal, oil and gas are described as fossil fuels.
15 Ex plain the advantages and disadvantages that electric vehicles have over petrol-driven cars.
16 Ex plain why the terms “easily renewable” and “long-term renewable” are more accurate than renewable and non-renewable.
17 Ex plain the advantages and disadvantages of using wind farming for energy production.
18 Describe the advantages and disadvantages of using uranium as an energy resource.
19 Suggest one reason why it is important for soil to be “water-loving”.
20 L ook at Table 1 (page 176) in Lesson 4.2.
a Identify the percentage of total electricity production in 2007–08 for wind and solar power.
b Compare the 2007–08 percentage with the 2023 percentage for wind and solar power.
21 Ex plain how soil can become full of salt. Describe how this can affect growing plants.
Figure 1 What is geothermal energy?
22 Coal is still widely used for generating electricity. Explain why some people are concerned about building new coal-fired power stations.
23 L esson 4.10 Our future depends on careful management of resources (page 196) talks about homes of the future. Create your own version of a future home that has an energyefficient design.
24 C lassify (select one option) a hybrid car as a low-emission vehicle or a zero-emission vehicle. Justify your answer (by defining the terms “low-emission” and “zero-emission”, comparing the hybrid car to these definitions, and deciding which definition best matches the car).
25 T he Victorian government is aiming for government-operated buildings to be powered by 100 per cent renewable energy by the end of 2025. Discuss the positives of this strategy for the environment.
26 Coal is considered to be a non-renewable energy resource. Discuss the truth of this statement by presenting arguments for and against.
Social and ethical thinking
27 Ex plain Greenpeace’s attitude towards coal and nuclear power. Describe the alternatives they support for Australia.
28 Evaluate the probability of nuclear power being used in Australia in the future (by defining the term “nuclear power”, describing the advantages and disadvantages of using nuclear power and deciding if the advantages are greater than the disadvantages).

DRAFT
29 Passenger cars are responsible for a significant amount of the population’s energy consumption. Evaluate the effectiveness of people walking, cycling or taking public transport to reduce their energy consumption (by describing the access to walking and cycling tracks or public transport in your area, and deciding if improvements need to be made to make them more effective).
30 G oogle Maps can calculate the most eco-friendly direction to your destination. These directions show you the route that has the least CO2 impact. This information empowers individuals to act in an environmentally friendly way, when considering the resources involved in their transport.
a Identify how ideas such as this can educate people about their CO2 consumption.
b Ex plain what might stop people from taking the eco-friendly route.
c Research another eco-friendly initiative that has happened in the world, such as bike lanes in Melbourne and Finland.
Critical and creative thinking
31 C reate a name for your own electricity company. Produce an A4 fact sheet with a diagram of your own electricity company, describing how electricity is produced at your power station. Identify three people that will be employed at your power station and the work that they do. Justify your choices (by providing a reason for each choice that you make).
32 For many years Australia has relied on gas and coal to produce electricity. Today many parts of Australia are using renewable energy to produce electricity. Create an infographic (a series of pictures that can be used to pass on information) that shows the advantages and disadvantages of the different forms of energy production.
Figure 2 Cycling to reduce energy consumption
33 Scientists continuously suggest new ways to reduce reliance on coal. Recently scientists have invented solar-powered roads. These roads are built using hexagon-shaped solar panels, which would store power and deliver it to surrounding homes. A problem with solar roads is that the solar panels might become covered in dust and be obscured by shadows from traffic. Propose a different place solar panels could be placed in the community (such as over buildings). Explain why you have chosen your location and how this would limit the amount of dust and shadows falling on the solar panels. Research
34 C hoose one of the following topics to research. An important part of your report must be to include references to the “big picture” –thinking about how your topic relates to the entire planet.
Desalination plants
Fresh clean water is a resource needed by all living things. As the population of Australia grows, so too does our need for drinking water. Desalination is an artificial process where salty sea water is converted to fresh water.
• Describe the process of desalination used at a desalination plant in Australia.
• Identify when and how much desalinated water was produced at the plant last year.
• Describe what happens to the rest of the seawater when the freshwater is removed.
• Describe how the marine environment is affected by the desalination plant operations.
Clean coal
• Ex plain what is meant by “clean” or “low emissions” coal.
• Compare the information provided by groups such as Environment Victoria and the Minerals Council of Australia.
• Describe who they are writing their information for.
• Identify the key message that they want their audience to remember.
• Ex plain why they are providing this information to the public.
Regeneration of old mines
Mining of resources has occurred across Australia since the first gold rush in 1851. Some mines are abandoned when the cost of extracting the resource is higher than the sale price of the resource. In Victoria, mines that are historic (closed before 1990) need to be rehabilitated by the land owner. Mines that were abandoned after 1990 are the responsibility of the mining company or individual.
• Describe what is meant by the term “land rehabilitation”.
• P rovide an example of mining rehabilitation by describing what the mine looked like when it was operating and, describing how the area was used after it was rehabilitated.
• Identify a historic or abandoned mine in your area.
• Describe how it has been or could be rehabilitated.
Module 5 Earth, Sun and Moon

Overview
Aboriginal and Torres Strait Islander Peoples have long understood the natural world around them, particularly the Moon’s cycles, the tides and the changing seasons. Their deep knowledge helps them predict the best times for activities like reef diving and travelling, based on these natural rhythms. Scientists today use models and simulations to explain the same phenomena, such as how the positions of Earth, the Sun and the Moon create lunar phases and tides, and how Earth’s tilt causes the changing seasons. This ancient knowledge, together with modern research, helps us to extend our understanding of the Earth and space!
DRAFT
Lessons in this module:
Lesson 5.1 The Earth, Sun and Moon interact with one another (page 206)
Lesson 5.2 The Moon reflects the Sun’s light (page 209)
Lesson 5.3 Challenge: Modelling the phases of the Moon (page 213)
Lesson 5.4 The Moon’s gravity causes tidal movements (page 214)
Lesson 5.5 Seasons are caused by the tilt of Earth (page 217)
Lesson 5.6 Science as a human endeavour: Astronomers explore space (page 224)
Lesson 5.7 Review: Earth, Sun and Moon (page 228)
Learning intentions and success criteria
Lesson 5.1
The Earth, Sun and Moon interact with one another
Key ideas
→ The solar system is the collection of planets, their moons and smaller bodies (asteroids, meteors and comets) that orbit the Sun.
→ The Moon orbits Earth every 27.3 days.
DRAFT
star a celestial (outer space) body appearing as a bright, shining point in the night sky solar energy energy made by atoms colliding with each other in the centre of the Sun solar system the Sun and all the planets, dwarf planets, moons and asteroids that travel around it and one another orbit the path a planet follows around the Sun or a star; the path a moon follows around a planet
leap year a year, occurring once every four years, with one extra day (366 days)
→ Earth orbits the Sun every 365.25 days.
→ As the Earth spins about its axis around the Sun, half of the globe will experience daylight, while the other half will experience night time.
→ It takes 24 hours for the Earth to spin once around its axis.
→ A total solar eclipse occurs when the Moon comes between the Earth and the Sun, blocking all the sunlight.
→ A partial solar eclipse occurs when only some of the Moon blocks the sunlight.
Our solar system
Our Sun is a star. It is the closest star to Earth and provides all the energy for every living thing. This solar energy is made by atoms colliding with each other in the centre of the Sun. Without the heat and light given off by the Sun, there would be no life on Earth.
Our small planet, Earth, (the fourth smallest in the solar system) is 1,000,000 times smaller than the Sun. The solar system is made up of the Sun at the centre and all the planets, dwarf planets, moons and asteroids that travel around the Sun or each other. The path taken by a planet is called its orbit because of its oval or “elliptical” shape.
A year
A year is the time it takes a planet to make one orbit around the Sun. It takes 365.25 days for Earth to complete one orbit (Figure 1). This means that every four years our calendar is one full day behind (4 × 0.25 days = 1 day). We account for this by adding an extra day (29 February) every leap year

1 Earth orbits the Sun every 365.25 days. 206 Oxford Science
Figure
Night and day
Day and night are caused by Earth spinning on its axis, an imaginary straight line joining the North Pole and the South Pole. You can model this in your classroom. Stand facing the front of the room and turn around on the spot until you face the front once again. This is one complete rotation. Earth takes 24 hours to complete one full rotation.
Because of its shape, only half of Earth is exposed to sunlight at any given time. The other half is in shadow. The part facing the Sun is experiencing daytime, whereas the part facing away from the Sun is experiencing night. Because Earth rotates, all parts of Earth experience day and night, just at different times. This is why different parts of Earth are in different time zones.
In Figure 2, it is daytime for countries on the right and night-time for countries on the left. Can you tell in which countries the Sun would be rising or setting?
Have you ever watched the New Year’s Eve celebrations around the world on television? The celebrations in New Zealand are always just before those in Australia. This is because the international date line (where a new calendar day is said to start) is located just to the east of New Zealand. As the Earth rotates west to east, a new day starts first in New Zealand, then Australia.
We know this because as Earth spins toward the Sun, we see the Sun rise above the horizon in the eastern sky. Sunset occurs when Earth rotates away from the Sun. New Zealand is east of Australia, so the Sun rises in their sky first.
Solar eclipse

One of the first scientists and mathematicians to investigate the time it took for the Moon to travel around Earth was al-Battani (whose full name was Abu Abdallah Muhammad ibn Jabir ibn Sinan al-Raqqi al-Harrani al-Sabi al-Battani) in the tenth century. Although he was not the first astronomer to build a model of how the Moon travelled around Earth, his model was one of the most accurate. He was able to correctly calculate the cause of a solar eclipse.
The Moon passes between the Sun and Earth once every 27.3 days. Occasionally, the Moon will be in a position where it blocks some of the light from the Sun. This is known as a solar eclipse (Figure 3). During a total solar eclipse, the Moon blocks the maximum amount of light from the Sun and the sky goes dark for a short time during the day. The last total eclipse of the Sun visible from northern Australia was on 20 April 2023 in Western Australia. The next total solar eclipse visible in Australia is expected to occur on 28 July 2028.
axis an imaginary straight line joining the North and South Poles of Earth
solar eclipse when light from the Sun (as seen from Earth) is blocked by the Moon
total solar eclipse when the Moon blocks the maximum amount of light from the Sun, as seen from Earth
Figure 2 The half of Earth facing the Sun experiences day and the half in shadow experiences night.
Retrieve

When a total solar eclipse is visible in Australia, people somewhere else in the world may only see a partial solar eclipse. This is when only some of the Sun’s light is blocked. Because Earth and the Moon are always moving around their orbits, an eclipse takes a few minutes and then gradually passes as Earth and the Moon continue their motion (Figure 4).
You should never look directly into a solar eclipse because it could damage your eyes.

1 Define the terms “rotation” and “orbit”. Comprehend
2 Ex plain why the calendar adds an extra day in February every four years (leap year).
3 Ex plain the difference between a total solar eclipse and a partial solar eclipse.
4 Ex plain why a person in Victoria and their friend in Darwin do not see exactly the same solar eclipse.
Moon’s orbit Earth
Figure 3 When the Moon is positioned between the Sun and Earth, it is called a solar eclipse.
partial solar eclipse when only some of the Sun’s light is blocked by the Moon
Figure 4 The phases of a solar eclipse and a lunar eclipse
5 Figure 3 shows the shadow caused by the Moon during a solar eclipse. If people living in the region of the darkest shadow experience a total solar eclipse, describe the type of eclipse seen by the people living in the region of the lighter shadow.
Analyse
6 C ompare the different time zones around the world. Describe what people in the United States of America, China, Tanzania and France might be doing while you are having lunch in Australia.
7 C onnect the terms “day”, “night” and “year” with the following explanations:
a exper ienced by the part of Earth that is facing away from the Sun
b the name for the rotation of Earth over 24 hours
c the time it takes for Earth to orbit the Sun once.
Skills builder: Questioning and predicting
8 Ex plain what is wrong with the question: “What would happen to the length of days if the length of time it took the Earth to orbit the Sun was increased?” (THINK: Is it testable, specific and objective?)
Lesson 5.2
The Moon reflects the Sun’s light
Key ideas
→ The Moon rotates as it orbits Earth.
→ The same face of the Moon always faces towards Earth.
→ The phases of the Moon are caused by the light from the Sun shining on different parts of the Moon.
→ The moon has eight phases: new moon, waxing crescent, first quarter, waxing gibbous, full moon, waning gibbous, third quarter and waning crescent.
→ A lunar eclipse occurs when Earth moves between the Sun and the Moon.
Introduction
Many scientists believe that a giant collision between two planetary bodies resulted in the formation of Earth and the Moon. Early astronauts collected samples from the surface of the Moon and when they were compared to the surface of Earth they were found to be almost identical.
The first scientific description of the Moon was made in 1609 by Italian astronomer and physicist Galileo Galilei (1564–1642), based on his observations through a telescope. At the time it was believed that the Moon had a smooth surface, which explained its ability to reflect light from the Sun. Galileo knew differently.
He saw the rough, mountainous terrain and vast craters that we know cover the surface of the Moon. He even described large flat plains that we call “maria” (pronounced “MAHR-ee-ah”; Latin for “seas”) because they look like dark oceans. We now know these plains to be solidified lava.
In 2020, NASA’s special Stratospheric Observatory for Infrared Astronomy (SOFIA) telescope mounted in an airplane identified small molecules of water on the surface of the Moon for the first time. The amount of water found was very small (100 times less than the Sahara Desert). This will not be enough to supply all the needs of the NASA astronauts that will be landing on the Moon by 2025.
Moonlight
DRAFT
Unlike the Sun, the Moon does not create its own light. Instead, it reflects sunlight. The amount of light reflected varies with the different phases of the Moon, but even the full Moon only provides a faint light that appears bluish to the human eye. We always see the same side of the Moon from Earth because the Moon rotates at the same speed as it orbits. This is just like walking around a person, making sure you always face toward them. The Moon takes 27.3 days to completely orbit Earth. Sometimes, only a part of the Moon is visible. You might see half a Moon, a crescent or a fully round Moon. Sometimes the Moon cannot be seen at all, even though it is in the sky. These changes in the shape of the Moon are called the phases of the Moon (Figure 1).
Of course, the Moon does not change shape – it is always round. What changes is the amount of the Moon that is lit by the Sun, which makes it possible for us to see

phases of the moon changes in the shape of the Moon as seen from Earth
First quarter half moon
Third quarter half moon
Waxing gibbous moon
Full moon
Waxing crescent moon
New moon
Waning gibbous moon
Waning crescent moon
Figure 1 The phases of the Moon as they appear from Australia (in the southern hemisphere). The images are not true proportions.
the Moon from Earth. We are really looking at the “day” and “night” parts of the Moon. The Moon rises and sets, just like the Sun. The Moon rises approximately 50 minutes later from one day to the next.
The Moon is always in the sky; however, during the day, the sky is usually so light that the Moon is hard to see.
Exploring the Moon
The Moon is the only body in space on which humans have actually stepped. It has a weak gravitational pull and very little atmosphere; therefore, there is not enough oxygen to breathe. Astronauts must wear space suits fitted with breathing apparatus.
In July 1969, Neil Armstrong and Edwin “Buzz” Aldrin were the first humans to walk on the Moon. They were part of the Apollo 11 mission (Figure 2). They found “kangaroo hopping” easier than walking on the Moon. The astronauts could jump higher and further on the Moon because the pull of gravity on them was only about one-sixth of Earth’s gravity.
The surface of the Moon is made of fine grains of dust that stick together like damp sand. The footprints made by the Apollo 11 astronauts should still be visible in a million years because there is no erosion to destroy them. However, the footprints may be covered with dust from future meteor impacts.
It was possible to beam images of the Moon landing around the world because of the satellite dishes located at Honeysuckle Creek in Canberra and Parkes in New South Wales (Figure 3).


Figure 2 The first Moon landing was televised around the world and was front-page news on 21 July 1969.
Figure 3 Australian scientists at the Parkes Observatory played a critical role in the Moon landing.
lunar eclipse when Earth moves between the Moon and the Sun and casts a shadow over the Moon
Lunar eclipse
In eighteenth-century China, a young scientist called Wang Zhenyi developed a way to model a lunar eclipse. A lunar eclipse occurs when Earth moves between the Moon and the Sun. The Moon passes into Earth’s shadow and appears dark (Figure 4). Wang modelled this by hanging a lamp from the roof as a Sun, above a circular table that represented Earth. She then used a circular mirror that acted like the Moon. By moving the Moon mirror under the Earth table, she was able to model the lunar eclipse.
Check your learning 5.2
Check your learning 5.2
Retrieve
1 Identify if these statements are true or false.
a The Moon creates light.
b The Moon does not supply light to Earth.
c The Moon changes shape dur ing different phases.
d The Moon is the closest body in space to Earth.
e Crater s are large indentations on the Moon’s surface.
f Astronomer s are pseudoscientists.
g We can see both sides of the Moon from Earth.
2 Recall why astronauts can jump higher on the Moon than on Earth.
Comprehend
3 Use Figure 1 to describe the waxing and waning of the Moon.

Analyse
4 G reek philosopher and scientist Aristotle noticed that during lunar eclipses, Earth’s shadow was always round. Consider how this led him to suggest that Earth is spherical in shape.
Apply
5 I nvestigate an alternative explanation for the phases of the Moon as told by early Aboriginal and Torres Strait Islander Peoples. Explain how they saw the variation in the appearance of the Moon.
Skills builder: Planning investigation
6 I magine that you have been asked to model a lunar eclipse. Write a list of materials you will need. (THINK: How can you represent Earth, the Sun and the Moon? Remember to think about scale.)
Figure 4 A time-lapse photograph of a lunar eclipse
Lesson 5.3 Challenge: Modelling the phases of the Moon
Aim
To model the different phases of the Moon
What you need:
• Torch or lamp with exposed light bulb
• Basketball
• Tennis ball
• Foam ball
• Black permanent marker
What to do:
1 I n small groups, use a torch or light bulb in a fixed position to represent the Sun. One person should then hold the basketball to represent Earth, and a second person should hold a tennis ball to represent the Moon.
2 Begin by rotating the Earth/basketball as it orbits the Sun/light. Try to work out how the Moon/tennis ball would orbit Earth as Earth orbits the Sun.
3 Shine the light from a torch on the Moon/ tennis ball. Pass the Earth/basketball between the light and the Moon/tennis ball.
4 Use a black permanent marker to colour half of the foam ball. Face the white side of the foam ball towards you. This represents the fully lit face of a full Moon. Slowly rotate the foam ball so that the Moon appears to be getting smaller. (You will gradually see more of the darkened side of the Moon.)
Questions
1 Ex plain why people on Earth only see one side of the Moon.
2 D raw each phase of the Moon as you saw it on the foam ball in step 4.
3 Describe and identify the phenomenon that you modelled in step 3.
4 Use your modelling of the phases of the Moon to explain why the statement “the dark side of the Moon” does not always refer to the side of the Moon away from Earth (the far side).

Figure 1 The Moon
Learning intentions and success criteria
Lesson 5.4
The Moon’s gravity causes tidal movements
Key ideas
→ Earth’s pull force holds the Moon in orbit.
→ The relationship between the Moon and the tides was recognised by early Aboriginal and Torres Strait Islander Peoples.
→ The pull force of gravity causes high and low tides.
high tide when the ocean covers slightly more land; the highest level that the tide reaches on the shore
DRAFT
gravity the effect of a large object (such as a planet) warping space and time, and pulling objects to its centre
low tide when the ocean covers slightly less land; the lowest level on the shore that the tide recedes to
→ Understanding the tides allowed the early Aboriginal and Torres Straight Islander Peoples to collect shells or go fishing.
Introduction
The relationship between the Moon and the tides was recognised by early Aboriginal and Torres Strait Islander Peoples in Australia. In Yolngu traditional stories of Arnhem Land describe water filling the Moon-man (Ngalindi) as he rises. When the Moon is full in the sky, the tidal waters are full (Figure 1). As the tide falls, the Moon is left empty for three days before filling once more.
What causes tidal movements?

Earth’s pull force holds the Moon in orbit. The Moon has its own pull force, even though it is far less than Earth’s. The Moon is approximately one-quarter the size and one-eightieth the mass of Earth, so its pull force is much weaker.
This does not mean the Moon’s pull force does not affect Earth. The pull of the Moon causes Earth’s oceans to bulge toward the Moon. This causes the oceans to cover slightly more land, which we see on Earth as a high tide. Earth is also being pulled toward the Moon (and away from the water on the opposite side), so another high tide occurs on the opposite side of Earth. As the Moon travels around Earth and as both bodies travel around the Sun, the combined pull force from gravity causes Earth’s oceans to rise to high tides and fall to low tides. Because Earth is rotating while this is happening, two high tides occur each day, approximately 11 hours apart.
Figure 1 The Moon


The water on the surface of Earth does not rotate with Earth, instead Earth rotates within the layer of water. As Earth rotates, its land and coastlines move through the bulges of water, which are Earth's high tides. The bulges of water (high tides) are on the side of Earth closest to the Moon and the side of Earth furthest away from the Moon. Low tides happen when the coastlines move away from the water bulges.
When the Sun, Moon and Earth are aligned, the combined pull of the Moon and the Sun causes very high tides on some parts of Earth. These are known as spring tides. Smaller neap tides occur during the Moon’s quarter phases. At these times, the Sun and Moon are at right angles to Earth, causing the tides to be pulled in both directions at once. Spring and neap tides are shown in Figure 2.
Aboriginal and Torres Strait Islander Peoples understand the relationship between the Moon and the tides. The Bardi people of the Western Australian Kimberley region use their knowledge to predict when there will be a very low tide so they can collect the special trochus shells. The Meriam people of the eastern Torres Strait Islands know that the best time to go fishing is when there is a neap tide (a quarter moon), when the difference between high tide and low tide is very small. Less tide movement means that there is less movement of the water. This means that the water is clearer and especially clear for fishing.
Worked example 5.4A shows how to calculate the difference in height between low and high tide.
spring tide when there is maximum difference between high and low tides; caused by the combined pull of the Moon and the Sun neap tide when the difference between high and low tides is smallest; occurs during the Moon’s quarter phase, when the Sun and the Moon pull in different directions
Spring tides Neap tides
The gravity of the Sun and the Moon pull together.
The gravity of the Sun and the Moon pull at right angles to each other.
Figure 2 The Moon’s pull on Earth’s oceans creates spring and neap tides. (The bulges shown here have been exaggerated so that they are easier to see.)
Worked example 5.4A Calculating tides
Table 1 shows the times of high and low tides at Surfers Paradise, Gold Coast, Queensland, over three days in June 2022. Calculate the difference in height between the two high tides on the Friday.
Table 1 High tides at Surfers Paradise, Gold Coast, in June 2024
Solution
One high tide is 1.01 m at 10:17 am and the other high tide is 1.59 m at 10:38 pm.
Subtract the smaller tide from the larger tide: 1.59 – 1.01 = 0.58 m
The difference in height between the two high tides on Friday 3 June is 0.58 m. Check your learning 5.4
Comprehend
1 Ex plain why the Moon has a greater effect on Earth’s tides than the Sun.
Analyse
2 Referring to Table 1, calculate the difference between: a the last high tide on Friday and the first high tide on Saturday b the two high tides on Saturday.
Apply
DRAFT
3 Use the data in Table 1 to predict the times and heights of the tides for Sunday.
4 For 1 week, graph the high and low tide levels of a beach in your state. Compare (the similarities and differences between) this and the times of the Moon rise and set. Discuss the relationship between the Moon’s position and tide levels.
5 Aboriginal and Torres Strait Islander Peoples need to have an understanding of how the Moon affects high and low tides. If a full Moon and a new Moon generates a high tide, explain how someone wanting to dive for lobster would use the Moon to predict a low tide.
Lesson 5.5
Seasons are caused by the tilt of Earth
Key ideas
→ The Sun travels different paths across the sky at different times of the year.
→ The tilt of the Earth is what causes the seasons.
→ During summer, the days are longer and the Sun warms the ground and air.
→ During winter, the days are shorter and the ground and air are cooler.
→ In Antarctica, during periods of Summer, the Sun will sit above the horizon, providing 24 hours of sunlight. During periods during Winter, the Sun will sit below the horizon, providing 24 hours of darkness.
→ The equinox occurs when the length of day is equal to the length of night.
→ Aboriginal and Torres Strait Islander Peoples use regional seasonal calendars, which describe the weather, plants and animals that are common in that area at that time of the year.
Introduction
Wurdi Youang, the egg-shaped arrangement of stones shown in Figure 1, was found at Little River, Victoria, by European settlers nearly 200 years ago. The layout of 100 large boulders is thought to have been set out by the Wathaurong people, the traditional owners of the area. It is only recently that archaeologists have discovered that the 1 m high rocks at the two ends of the egg shape mark the points where the Sun sets at different times of the year. In the middle of winter, the Sun is in the sky for a shorter time and sets at a different place than in the middle of summer. The Wathaurong people found a way to mark the movement of the Sun without using telescopes or undertaking long sailing trips around the world.
Summer
Learning intentions and success criteria

Earth does not rotate evenly. It rotates around an imaginary line (the axis) that is on an angle of 23.5 degrees. This means that, for half of the year, the southern
Summer solstice Equinox Winter solstice
Figure 1 The Wathaurong people, who lived between Melbourne and Geelong, marked the movement of the Sun with waist-high stones.
equinox a day when day and night are the same length; occurs twice each year
hemisphere (including Australia) is tilted towards the Sun (Figure 2). In the other half of the year, the northern hemisphere is tilted towards the Sun.
When a hemisphere is tilted towards the Sun, that part of Earth experiences longer days and shorter nights. The Sun is also higher in the sky and this allows more time for the Sun’s rays to directly hit the ground and warm up the air. We call this part of the year summer (Figure 3). The longest day of the year is called the summer solstice. In the southern hemisphere, the summer solstice occurs around 21 to 23 December.
The northern hemisphere’s seasons are the opposite of ours in Australia. When it is summer in the southern hemisphere, it is winter in the northern hemisphere.
The Wathaurong people in Victoria observed the changes in the Sun’s position, and placed stones that marked where the Sun set on the summer solstice.
DRAFT

Spring and autumn
After 21 to 23 December, Earth continues its orbit of the Sun, slowly angling the southern hemisphere away from the Sun (bringing autumn), and the northern hemisphere towards it (bringing spring).
Twice a year (20 March and 22 September), the positions of Earth and the Sun results in an equal length of day and night in both hemispheres. These days are called the spring equinox and the autumn equinox, depending on which hemisphere you are in.
The Wathaurong people marked the position where the sun set on these days with the equinox stone.
Winter
In winter, Earth is angled away from the Sun. This means the Sun is lower in the sky and the days are shorter. As a result, there is less time for the Sun to warm up the ground and therefore the air is cooler. We experience winter. In the southern hemisphere, the winter solstice occurs around 21 to 23 June.
The position of sunset on the winter solstice was also marked with stones by the Wathaurong people.
solstice either of the times when the Sun is furthest from the equator
Figure 2 Earth’s rotation and orbit cause day and night, as well as the seasons. This image is not to scale.
Antarctic sun
The tilt of Earth is more noticeable in Antarctica. In the southern hemisphere summer, the tilt of Earth causes the Sun to remain in the sky for five months. The Sun does not completely set; instead, it sits just above the horizon for the whole time.
The reverse is also true in winter. The angle of the southern hemisphere away from the Sun means that, in Antarctica, the Sun sets in May and does not rise again until July.
Seasons for Aboriginal and Torres Strait Islander Peoples
Aboriginal and Torres Strait Islander Peoples have lived in all parts of the Australian landscape for more than 60,000 years. Each of the Aboriginal and Torres Strait Islander Peoples’ communities used their observations of the local environment to create a unique calendar. This is different from the Western approach that recognises the same four seasons in all parts of the world from Antarctica to the tropics, despite the vastly different climate and conditions.

Gulumoerrgin (Larrakia) seasons
Aboriginal Peoples in the Darwin area have seven main seasons in their Gulumoerrgin (Larrakia) year. These seasons are divided according to the weather and the plants and animals that are common at that time of the year (Figure 4).
Balnba (November to December) is when the first rains occur – Gulppula (green tree frog) is said to bring the rain. It is also the time to collect shellfish and black plums. Dalay (January to April) is the monsoon season. This is when the saltwater
Figure 3 Deciduous plants change with the seasons described by Westerners.
bme re
S e tp
Da l irrg ang
The hot and very humid build up to thenextrainyseason floodplainsTheareanddryingwind toseemscome from all directions
(rainyseason) ( bu i l d up) )emitdniwgib( yvaeh( wed )emit
(monsoon season) The replenishesmonsoon a drythirsty land
The flowering of speargrass signifies the start of goose egg collection Theseasonofthefirst rains
Thecoldesttime of the year
gge )nosaes
theandclearing areclouds
crocodiles lay their eggs and the barramundi breed. Mayilema (March to April) overlaps the monsoon season and is when the speargrass flowers appear and the magpie goose eggs can be collected.
Damibila (April to June) is the time to collect the barramundi and bush fruit, while heavy dews are on the ground in Dinidjanggama (June to August). During Gurrulwa (July to September) there are often big winds that appear to come from all directions at once. During Dalirrgang (September to October) it is very hot and humid, and the weather slowly builds up to the next rainy season.
Yirrganydji seasons
The traditional lands and waters of the Yirrganydji people covers the Queensland coast from Cairns to Port Douglas. Their seasonal calendar shows two major seasons: Kurrabana (wet season) and Kurraminya (dry season) (Figure 5). The Kurrabana wet season is divided into a time of storms (Jawarranyji) and a time of cyclones (Jimburralji). The dry season is divided into the cool time (Jinjim), the windy time (Yiwanyji) and the hot time (Wumbulji).
Larrakia
Figure 4 The Gulumoerrgin (Larrakia) calendar is used by Aboriginal Peoples in Darwin.
5 The
Gariwerd seasons
The Gariwerd (Grampians) region of Victoria is the traditional lands of the Jadawadjali and Djab Wurrung peoples, who recognise six seasons (Figure 6). Gwangal moronn (late March to June) is the season of the native honey bees, red sunrises and birds flocking as they travel to their winter home. Chunnup is the season of freezing winds and rain, when cockatoos puff up to stay warm. Birds start to nest during Larneuk, when there is much rain and the rivers run high. Wildflowers blooming and the appearance of the emu constellation signals the start of Petyan. Ballambar is the time when butterflies appear and the weather becomes warmer, and Kooyang is the season of eels, bushfires and hot weather.
University Press
5 Earth, Sun and Moon
Figure
Yirrganydji calendar is used by Aboriginal Peoples along the coast of Far North Queensland.
Jimburralji
Kurrabana (wet season)
Kurraminya (dry season)
Cairns
Port Douglas Yirrganydji
Kurrabana (wet season)
Kurraminya (dry season)
Figure 6 The Gariwerd calendar is used by Aboriginal peoples in the Gariwerd (Grampians) region in Victoria.
Gariwerd
VICTORIA
Check your learning 5.5
Check your learning 5.5
Retrieve
1 Identify the four Western seasons experienced in Australia, marked with the letters a, b, c and d in Figure 7.

2 Recall the angle of Earth’s rotational tilt away from the Sun.
Comprehend
3 Represent the seasons in a table. Draw a table with three columns. In the first column, write the 12 months of the year. In the second column, write the names of the four Western seasons next to the appropriate months. In the third column, write the names of the seven Gulumoerrgin (Larrakia) seasons.
Analyse
4 C ompare (the similarities and differences between) the winter solstice, the equinox and the summer solstice.
5 Use the motion of Earth around the Sun to consider why January is hotter than July in Australia.
6 Compare (the similarities and differences between) the Gulumoerrgin (Larrakia), Yirrganydji and Gariwerd calendars.
7 Ex plain why an understanding of the seasons and developing seasonal calendars based on local changes to Country is important to Aboriginal and Torres Strait Islander Peoples.
Apply
8 C reate a paragraph for Year 5 students that discusses how the Wathaurong people gathered and recorded data over many years before placing stones to represent the solstice and equinox.
Skills builder: Processing and analysing information
9 A student has been asked to find some reliable information online that describes what causes the seasons on Earth to change.
a Conduct your own research online to identify one website that you would recommend. (THINK: What kind of website would help the student?)
b Explain why you think this site is a reliable source of information. (THINK: Who wrote the information? When did they write it? Why did they write it?)
Figure 7 Four seasons in Australia
astronomy the study of objects outside Earth's atmosphere
constellation a group of stars that forms a pattern or shape
Lesson 5.6 Science as a human endeavour: Astronomers explore space
Introduction
It can take many years of travel for a rocket to land on another planet. Scientists, therefore, need to rely on other methods to learn about space.
DRAFT
Astronomy
Astronomy is one of the oldest sciences. Ancient astronomers believed that stars were permanently fixed to a heavenly sphere and never changed. Aboriginal and Torres Strait Islander Peoples and European astronomers tracked the movement of the planets against these heavenly lights, which they grouped into constellations (Figure 1). They used these observations to calculate time and develop calendars. From this they determined the seasons and calculated the best time to plant their crops or gather their foods. They observed solar and lunar eclipses and used the positions of the stars and planets to navigate the oceans.

Figure 1 Emu in the sky, a dark constellation that outlines the dark areas of the Milky Way. Depending on its position in the night sky, it informs Aboriginal and Torres Strait Islander Peoples about the different behaviours of the bird.
Telescopes
Telescopes have been used since the seventeenth century to view distant objects. The most common type of telescope used in astronomy is the optical telescope. This works by collecting more light than the human eye can collect and then focusing this light using lenses or mirrors. A distant object viewed through an optical telescope becomes brighter and magnified (Figure 2).

telescope an optical instrument that uses lenses and mirrors to make distant objects appear closer and larger
DRAFT
The Hubble and James Webb space telescopes
In 1990, NASA launched the Hubble Space Telescope, which orbits Earth at 569 k m above our atmosphere. This has given scientists a view of our universe far beyond that of any ground-based telescope because different forms of electromagnetic radiation, such as gamma rays, X-rays and ultraviolet radiation, are available for observation.
From the images beamed back to Earth from the Hubble Space Telescope, astronomers have been able to make an enormous number of new observations and ultraviolet radiation invisible rays that are part of the energy that comes from the Sun
Figure 2 The Antennae galaxies are about 45 million light-years away from the Milky Way, and can only be seen using an optical telescope.
infrared radiation invisible light that has longer wavelengths than visible light
have estimated the age of the universe more accurately at around 13 to 14 billion years. NASA launched the more advanced James Webb Space Telescope on 25 December 2021. It orbits Earth at 1.5 million km above Earth’s atmosphere!
The James Webb Space Telescope looks primarily at infrared radiation, allowing it to see a greater variety of things than the Hubble. The Webb can see more clearly than the Hubble because it has a bigger mirror that reflects more light than the Hubble. The newer space telescope will help astronomers build on the knowledge about the universe that they gained from images taken by the Hubble. The first images from the Webb were released to the public in July 2022. Figure 3 shows the difference in the images taken by the Hubble and the Webb.


Mars mission
DRAFT
NASA is already planning a crewed mission to Mars. But could humans live on Mars? The Mars exploration rovers Spirit and Opportunity were launched in 2003 and landed on Mars in 2004 to find out more about the “red planet”.
In 2008, the Phoenix Mars lander touched down on an ice sheet on the Martian surface. Operated from Earth, its instruments took photographs of ice that was melting. The lander’s robotic arm scooped up soil samples, and analysis from the lander’s instruments revealed traces of magnesium, sodium, potassium and, importantly, water. NASA scientists described this discovery as a “huge step forward”.
In 2021, NASA’s Mars 2020 Perseverance rover landed on Mars. The rover’s mission is to seek signs of ancient life on Mars and to collect rock samples for scientists to study. The Perseverance rover is taking photos of the surface of Mars (Figure 4) and has even sent back the first audio recordings of Mars.

Figure 3 Images of the same galaxy cluster taken by (A) the Hubble Space Telescope and (B) the James Webb Space Telescope
Figure 4 NASA’s Mars Perseverance rover took this photo using one of its onboard cameras.
Space probes
Humans are also able to gather new information about space by using space probes. Typically, space probes are controlled remotely and can be launched into space to measure properties of Earth, the solar system or the universe around us.
The space probe New Horizons was launched by NASA in 2006. After a gravity boost from Jupiter in 2007, its six-month flyby of Pluto in 2015 produced an enormous amount of data on the dwarf planet’s surface properties, geology and atmosphere, which was still being analysed one year later.
Test your skills and capabilities
Understanding the impact of science
In 1967 an Outer Space Treaty that offered a series of guidelines for how countries should explore space was signed by countries in the United Nations. After many more years of negotiations, the Agreement Governing the Activities of States on the Moon and Other Celestial Bodies (also called the Moon Treaty) was created by a group of different nations. It sets out a list of rules for all celestial bodies that countries must follow, including ownership and mining. It is yet to be signed by many of the countries who are currently exploring space.
Science is not just about experiments and making discoveries. Scientists must also develop an understanding of the consequences of their discoveries. Australia is currently building its capacity for space research. Develop a set of guidelines for these scientists to follow. Consider the following to help.
1 Identify whether you would own the section of the Moon you land on or explore.
2 Ex plain how you could use one of the new technologies to explore the Moon.
3 Ex plain what you would do if you discovered a valuable metal or mineral on the Moon. (Note: If you do not mine it, how would you pay for the research?)
4 Describe what you would do if another country claimed the same section of the Moon.
5 Describe the consequences you would face if your rocket crashed into a city in another country.
6 Compare your opinions with others in your class. Justify your opinion by discussing the impact your actions might have on people in affected countries.
7 I magine that you have been asked to explain one of the technologies in this topic to a class of eight-year-olds. Draft a one-minute speech that you would give to them. (THINK: Who is your audience? What kind of language should you use to address your audience? What kind of science understanding would they have?)
Lesson 5.7
Review: Earth, Sun and Moon
Summary
Lesson 5.1 The Earth, Sun and Moon interact with one another
• T he solar system is the collection of planets, their moons and smaller bodies (asteroids, meteors and comets) that orbit the Sun.
• T he Moon orbits Earth every 27.3 days.
• E arth orbits the Sun every 365.25 days.
• A s the Earth spins about its axis around the Sun, half of the globe will experience daylight, while the other half will experience night time.
• It takes 24 hours for the Earth to spin once around its axis.
• A total solar eclipse occurs when the Moon comes between the Earth and the Sun, blocking all the sunlight.
• A partial solar eclipse occurs when only some of the Moon blocks the sunlight.
Lesson 5.2 The Moon reflects the Sun’s light
• T he Moon rotates as it orbits Earth.
• T he same face of the Moon always faces towards Earth.
• T he phases of the Moon are caused by the light from the Sun shining on different parts of the Moon.
• T he moon has eight phases: new moon, waxing crescent, first quarter, waxing gibbous, full moon, waning gibbous, third quarter and waning crescent.
• A lunar eclipse occurs when Earth moves between the Sun and the Moon.
Lesson 5.4 The Moon’s gravity causes tidal movements
• E arth’s pull force holds the Moon in orbit.
• T he relationship between the Moon and the tides was recognised by early Aboriginal and Torres Strait Islander Peoples.
• T he pull force of gravity causes high and low tides.
• Understanding the tides allowed the early Aboriginal and Torres Strait Islander Peoples to collect shells or go fishing.
Lesson 5.5 Seasons are caused by the tilt of Earth
• T he Sun travels different paths across the sky at different times of the year.
• T he tile of the Earth is what causes the seasons.
• D uring summer, the days are longer and the Sun warms the ground and air.
• D uring winter, the days are shorter and the ground and air are cooler.
• I n Antarctica, during periods of Summer, the Sun will sit above the horizon, providing 24 hours of sunlight. During periods during Winter, the Sun will sit below the horizon, providing 24 hours of darkness.
• T he equinox occurs when the length of day is equal to the length of night.
• Aboriginal and Torres Strait Islander Peoples use regional seasonal calendars, which describe the weather, plants and animals that are common in that area at that time of the year.
Review questions 5.7
Review questions
Retrieve
1 Identify which of the following best describes the equinox.
A T he longest day of the year
B A d ay and night of equal length
C A lunar eclipse that occurs every year
D T he shortest day of the year
2 Recall that a total solar eclipse occurs when:
A t he Moon blocks out the maximum amount of light from the Sun.
B E arth blocks out the light on the Moon from the Sun.
C t he Sun blocks out the view of Earth from the Moon.
D a comet blocks out light from the Sun.
3 Identify which of the following statements is true.
A E arth orbits the Sun.
B T he planets orbit the Moon.
C T he Sun orbits the planets.
D E arth orbits the Moon.
4 State the name for one revolution of Earth around the Sun.
5 Identify the season in Norway when it is summer in Australia.
6 Recall the name of the event that occurs when the Moon totally blocks the light from the Sun.
Comprehend
7 Ex plain what causes day and night.
8 Describe how the Sun affects day and night and seasons at the Antarctic.
9 Describe the seven seasons identified by the Gulumoerrgin (Larrakia) people.
10 Describe the phases of the Moon.
11 Ex plain why 29 February only occurs every four years.
12 A student claims that the Moon is a mini Sun that shines at night. Explain why they are incorrect.
13 Ex plain the purpose of the Hubble and James Webb space telescopes.
Analyse
14 Use labelled diagrams to compare a solar eclipse and a lunar eclipse.
15 Use a table to compare astronomy and astrology.
16 Figure 1 shows how the seasons occur. Answer “A” or “B” to each question.
a Identify the drawing that represents summer.
b I f the piece of card was Earth, identify which drawing would represent winter.
c I f the piece of card was Earth, identify which drawing would represent the warmest day.


Figure 1 A model representing how the seasons occur
A B
17 Figure 2 shows the average number of sunlight hours across Australia in January and June. Analyse the two maps and use the data to explain why Australian summers have higher temperatures than Australian winters.

DRAFT

Figure 2 The average amount of sunlight in January and June
230 Oxford Science 7 Victorian Curriculum Oxford University Press
18 Study Figure 3 and answer the following questions.
a Identify the season that has the longest shadows.
b Identify the season that gives the least opportunity for solar heating.
c Identify the season where the Sun travels furthest across the sky.
d Identify which side of the house is best to grow plants that like sunlight.
e I f a plant is growing on the eastern side of a house, describe the amount of sunlight it receives in the morning.

20 T he Persian calendar celebrates the New Year at the moment the Sun crosses the celestial equator on approximately 21 March each year. In 2014 it was celebrated at 4 am on the east coast of Australia. In 2015 it was celebrated at 10 am. Discuss why the exact time of the New Year changes from one year to the next.
21 Visit NASA’s website for the 2020 Perseverance rover mission. Navigate to the gallery of “Raw images” showing recent pictures taken by the rover. Select one image and make five scientific observations about what you can see in the image. Discuss what you know about Mars from looking at this image.
22 Gravity is not considered a force. Instead, gravity is the distortion of space and time caused by a large object. This allows the large object to have a pull force. Evaluate the following sentence and rewrite it so that it is correct.
“The Moon’s gravity forces the water on Earth to cause high tides.”
Social and ethical thinking
Apply
19 L ook at Figure 4, which shows a total eclipse of the Sun as it would be seen in the middle of the day from Earth. Create and label a diagram to illustrate a:
a solar eclipse
b lunar eclipse.
23 Some nations are planning to develop human settlements on the Moon. Discuss an argument for and against this decision. Decide if you do or do not support this plan. Justify your decision (by comparing the arguments for and against this decision and describing why one argument is more important).
24 M any early European settlers claimed that First Nations Australians did not use any of the sciences. Provide evidence that refutes this claim.
Figure 3 The path of the Sun across the sky in winter and summer
Figure 4 Total eclipse of the Sun
25 Scientists are continuously exploring space, including Mars. Discuss the ethical implications of finding life on one of these planets.
Critical and creative thinking
26 Find data for the sunrise and sunset times in your local area over seven days in summer and seven days in winter. From this information, calculate the length of the day and the length of the night. Present your findings in a table. Discuss what you notice about the lengths of the days and nights for each season. Explain why this difference occurs.
27 I n May 2021 there was a lunar eclipse visible in Australia. The Moon was referred to as a “supermoon”. Investigate what the criteria for a supermoon are, and explain why a lunar eclipse may be a supermoon.
Research
28 Choose one of the following topics on which to conduct further research. Present your findings in a format that best fits the information you have found and understandings you have formed.
Search for extraterrestrial intelligence
Astronomers are involved in a Search for Extraterrestrial Intelligence (SETI).
• Identify the instruments the astronomers are using in this search.
• Describe how these instruments will help them to find extraterrestrial intelligence.
• Describe what they may expect to find. You, too, can use your computer to become a part of this search.

Seasonal calendars
Many Aboriginal and Torres Strait Islander Peoples use changes in Country to identify a new season and indicate when to prepare for a change.
• I nvestigate the location of Dharawal Country.
• Identify the time of year that tiger quolls search for a mate.
• Identify the time of year that lilly pilly fruit ripen and the fruit falls.
DRAFT
• Ex plain why these could be used for a sign that the people of Dharawal Country should begin their journey to the coast.
Early warning systems
The United Nations Environment Program is developing an early warning system that will identify the chances of extreme weather events occurring such as cyclones, tidal surges and heatwaves. When a country is particularly at risk, the global reporting system will provide advice to a country so that people can be safely evacuated.
• I nvestigate a recent extreme weather event that occurred.
• Describe what happened and the warning that people were given.
• Describe how people responded to the warning.
• Investigate the evidence that was gathered that led to the warning being given.
• Describe the evidence that they gathered and the equipment they used.

Figure 5 The Search for Extraterrestrial Intelligence (SETI) Institute is the only organisation of the United States entirely dedicated to searching for life in the universe.
Figure 6 Warnings of a superstorm cell allow people to prepare their animals and property to minimise damage.
The far side of the Moon
The Moon rotates at the same rate as Earth, so we never see the far side of the Moon from Earth. So what is it like? Is it the same as the near side of the Moon? Some astronauts have flown over the surface of the far side, but only one has landed a ship.
• Identify how many people have seen the far side of the Moon.
• Identify which country landed a probe on the far side and brought back material from the Moon’s surface.
• Compare the far side of the Moon to the side that faces Earth.
• Describe the complexities of living on the surface of the Moon.

Figure 7 A section of the far side of the Moon
Oxford University Press
Module 5 Earth, Sun and Moon 233
Module 6 Forces

Overview
To understand how objects start moving, stop, or change direction, we need to look at all the forces pushing and pulling on them. There can be many different forces acting on an object. Sometimes these forces are pushing or pulling in the same direction; other times they are pushing or pulling in different directions. Big objects like the Sun or Earth have a strong gravitational pull. This can affect things on Earth, or in space. Diagrams can help show the direction and size of a force. Understanding forces means that we can use simple machines to make tasks easier.
DRAFT
Lessons in this module:
Lesson 6.1 A force is a push, a pull or a twist (page 236)
Lesson 6.2 Experiment: Measuring forces (page 239)
Lesson 6.3 An unbalanced force causes change (page 240)
Lesson 6.4 Forces can be contact or non-contact (page 244)
Lesson 6.5 Magnetic fields can apply a force from a distance (page 247)
DRAFT
Lesson 6.6 Electrostatic forces are non-contact forces (page 250)
Lesson 6.7 Experiment: What if a balloon was electrostatically charged? (page 253)
Lesson 6.8 Earth’s force of gravity pulls objects to the centre of Earth (page 254)
Lesson 6.9 Experiment: Making a parachute (page 257)
Lesson 6.10 Experiment: Dropping mass (page 259)
Lesson 6.11 Gravity affects all objects in space (page 260)
Lesson 6.12 Friction slows down moving objects (page 264)
Lesson 6.13 Experiment: What if the amount of friction was changed? (page 266)
Lesson 6.14 A lever decreases the amount of effort needed to lift or move a load (page 268)
Lesson 6.15 Experiment: Using a first-class lever to lift masses (page 273)
Lesson 6.16 Experiment: Using a second-class lever to lift masses (page 275)
Lesson 6.17 A pulley changes the size or direction of a force (page 276)
Lesson 6.18 Experiment: Calculating mechanical advantage (page 279)
Lesson 6.19 There are different types of machines (page 280)
Lesson 6.20 Experiment: Comparing different machines (page 283)
Lesson 6.21 Science as a human endeavour: The forces in flight (page 286)
Lesson 6.22 Experiment: Comparing the forces in flight (page 289)
Lesson 6.23 Science as a human endeavour: Forces are involved in sport (page 291)
Lesson 6.24 Review: Forces (page 294)
Learning intentions and success criteria
Lesson 6.1
A force is a push, a pull or a twist
Key ideas
→ A force is a push or pull that happens when two objects interact.
→ A spring balance can be used to measure the size of a force.
Check the next lesson for a linked practical activity or experiment.
force of gravity the force of attraction between objects due to their masses
→ A force diagram is a representation of all the forces acting on an object.
→ The force of gravity affects the movement of objects on Earth.
DRAFT
spring balance a device consisting of a spring and a scale, used to measure forces (also called a force meter)
magnitude a measure of size or quantity
Forces in action
Forces act on everything around us all the time. There is usually more than one force acting on an object at one time, but often we do not notice them. You have many forces acting on you at the moment. The force of gravity is pulling you towards the centre of Earth. The chair you are sitting on is pushing back against you, changing the shape of your leg muscles. Because the forces acting on you are in balance (the same strength), you do not move. You sit still on the chair.
When you kick or throw a ball, you use energy to generate a push force. This force causes the ball to move (Figure 1). When you catch a ball, you also give it a push. This time, the push force causes the ball to stop moving.
Forces cause objects to:
• begin to move
• speed up
• slow down or stop moving
• change direction
• change shape
• spin
• remain still.
Measuring forces

One way to “see” a force at work is to measure it. In the kitchen, cooks use scales to measure how much Earth’s gravity pulls on the ingredients. Twenty grams of flour is pulled to the centre of Earth, causing the flour to push down on the scales.
In the laboratory, force is measured using a spring balance (Figure 2). A stiff spring in the balance stretches when an object pulls on it. This moves the marker so that the amount of force can be measured. A rubber band can measure the magnitude or the size of forces in a similar way to a spring balance.
Figure 1 The force of Ronaldo kicking the ball is easy to identify and describe, but what is pulling him towards the centre of Earth?
Before we can use a rubber band to measure a force, it must be calibrated. This means checking that the measures you will make are accurate by matching the stretch of the rubber band to the force pulling on it.
The unit used to measure forces is called the newton (N), after English physicist Sir Isaac Newton (1642–1727), who first described the force used to pull an apple from a tree. Spring balances are also sometimes known as newton meters. Scientists around the world have agreed to this standard measurement so that they can communicate with one another.
In every country, the force of 100 g being pulled to the centre of Earth is about 1 newton (N). This is about the same as one large chocolate bar sitting on your hand.
Representing forces

A force diagram can be used to show all the forces acting on an object. A short arrow is used to show a weak force and a long arrow is used to show a strong force. The direction of the arrow shows the direction of the force.
When drawing a scientific diagram showing the forces acting on a book on a table, there are several steps to follow.
1 Represent the object with a small box.
2 D raw a dot in the centre of the box.
3 Use a pencil and ruler to draw the force arrows.
4 D raw the arrows coming from the dot.
5 L abel the arrow with the name and size of the force.
Figures 4 to 10 show examples of different forces.

Push

calibrate check the accuracy of a measuring device against known measurements
newton the unit used to measure force; symbol N
force diagram a diagram that shows the forces acting on an object
Figure 2 Spring balances are used to measure force.
from table 10 N
Force of gravity 10 N
Figure 3 The forces acting on a book on a table can be shown using two arrows. One arrow shows the force of gravity pulling the book towards the table. The other arrow shows the table pushing up on the book.
Figure 4 Begins to move The golf club pushes the ball. The club exerts a force on the ball, causing it to begin to move. If the club misses the ball, there is no new force on the ball from the club and the ball stays still.
Figure 5 Speeds up When skateboarders want to move faster, they use their feet to exert a force on the ground.


DRAFT
Check your learning 6.1 Check your learning 6.1
1 Define the term “force”.
2 Recall seven things that forces can do.
3 State the unit used when measuring a force.
4 Name the person whom the unit of force is named after.

Comprehend
5 D raw a force diagram of a bike weighing 500 N resting on the ground. Include the force of the ground pushing up on the bike.
6 Use an example to describe how you can see the effects of a force, but not see the force.
Figure 6 Slows down The brake pads on this bicycle wheel push down on the rotor of the wheel, causing the wheel to slow down. This in turn brings the bicycle to a stop.
Figure 7 Changes direction The tennis racquet pushes the ball in a different direction.
Figure 8 Changes shape The hands push the plasticine into a different shape. When the hands stop pushing, the plasticine no longer changes.
Figure 9 Spins The hand turns the knob to open the door.
Figure 10 Remains still The force of gravity pulling down on the pot plant and the weight of air above it are in balance with the force of the ground pushing up on the pot.
7 M any measuring instruments have to be calibrated. Use an example to explain why calibration of equipment is important. (Hint: Describe the consequences of not calibrating the equipment and how this would affect the results of an experiment.)
Analyse
8 R ank these forces from strongest to weakest:
a a truck hitting a pole
b a rocket being launched
c typing one letter on a computer keyboard
d kicking a soccer ball
e pushing a car along the street.
Apply
9 A student was using a rubber band to measure forces in Lesson 6.2 Experiment: Measuring forces when the rubber band broke. Predict how using a different rubber band would affect the results.
Lesson 6.2
Experiment: Measuring forces
Aim
To measure a variety of forces using a force meter
Materials
• Rubber band
• T hin strip of timber (or a ruler)
• M ass carrier and masses
• Pen
Method
A rubber band can measure the size of forces in a similar way to a force meter (also known as a spring balance or newton meter), but it must be calibrated. This means matching the stretch of the rubber band to the number of newtons pulling on it.
DRAFT
2 M ark the distance that the rubber band is stretched on the timber when the mass carrier holds a 100 g mass. Remember: The weight force of 100 g equals 1 N of force.
3 Repeat for masses of 200 g, 300 g, 400 g and so on, marking the timber each time.
4 Use your force meter to measure the force needed to:
a open the door to the room (Figure 2)
b d rag a chair across the floor
c close a drawer in the laboratory (Figure 3)
1 Calibrate the rubber band on the strip of timber, as shown in Figure 1.
d move your pencil case
e pull up your sock
f do three other movements of your choice.
About 30cm
Rubber band
Metal top of mass carrier
Figure 1 Calibrating the force meter
2 Measuring the force needed to open a door
Results
Construct a column graph showing the amount of force needed to move each object.
Discussion
1 Describe the relationship between grams (g) and newtons (N).
2 Identify if the force meter you constructed measures a pull or push force.
3 Measuring the force needed to close a drawer
Lesson 6.3
Learning intentions and success criteria
DRAFT
balanced force two forces that are equal in size and opposite in direction and therefore do not change an object’s speed, direction or shape
3 Describe how you could increase the amount of force needed to shift your pencil case.
An unbalanced force causes change
Key ideas
→ Forces are balanced when they are pushing or pulling equally in opposite directions.
→ Forces are unbalanced when forces from one direction are larger than forces from other directions.
→ If the forces on an object are unbalanced, then the object will change its speed, direction or shape.
→ Net force can be calculated by added or subtracting forces.
Balanced forces
Understanding how forces work together is important for understanding how and why things move. Balanced forces are a way of describing the forces acting on an object even when there is no change in movement or shape. Pushing on a brick wall does not usually cause the brick wall to move. This does not mean your push force did not exist. Your push force was balanced by the wall pushing against your hands. Forces are balanced when both forces are equal in size and acting in opposite directions.
Figure
Figure
Another example of a balanced force can be seen in Figure 1. The push force of the weight lifter is in balance with the pull force of gravity of the barbell. If these forces are equal and in opposite directions, there will be no change in movement. The barbell stays up in the air at a particular height because the forces acting on it are in balance. The weightlifter is pushing the barbell with exactly the same amount of force as Earth is pulling down due to the force of gravity.
Unbalanced forces
Unbalanced forces are different in size and direction. They are unequal. When unbalanced forces act on an object, the object’s speed, direction or shape will change. The barbell in Figure 1 moves up when the weightlifter uses an upward force stronger than the downward pull of gravity. When the barbell is moving up or down, the forces on the barbell are unbalanced.
Forces can be added together

If you tried to lift a heavy object, such as a piano, you would not succeed. The upward force you exert on the piano would be too weak. But if a few of your friends helped you by also adding their force to yours, the combined upward forces would be stronger than the downward pull of gravity acting on the piano. The net force is the combination of all the forces acting on the piano. If the piano is lifted up, the forces are unbalanced and the net force on the piano is upward.
In Figure 1, the direction of a force arrow shows the direction of the force. The downward force (weight) of the barbell is 1,000 N. Each of the weightlifter’s hands is pushing up with a force of 500 N. These two push forces can be added together (500 N + 500 N = 1,000 N). This means the total net force is 1,000 N down and 1,000 N up. The forces are balanced and the barbell does not move.
If an object is stationary (not moving), or is moving at a constant speed in the same direction, then the net force acting on that object is zero (0 N). All the forces are balanced. If an object changes its speed (by speeding up or slowing down), shape or direction, then a net unbalanced force must be acting on it.
Evidence of an unbalanced force
There are three ways you can tell if a force is unbalanced. Forces are unbalanced if there is a change in the speed, direction or shape of an object. If a ball is resting on the ground, then all the forces acting on it are balanced. If a person applies a force to the ball, it will move (Figure 2).
unbalanced force two or more forces that are unequal in size and direction and therefore change an object’s speed, direction or shape net force the vector sum of all the forces acting on an object; also known as resultant force
Lift force
N
Lift force
N
N
Figure 1 A weightlifter applies a push force (500 N + 500 N) to lift the barbell (1,000 N).
If two people are pushing equally in opposite directions on a stationary object, then the forces are balanced and the object does not move. If one person starts pushing harder, then the object will start to move. There is a change in motion because the forces are unbalanced.
Representing unbalanced forces

A force diagram can also be used to represent unbalanced forces. As with balanced forces, a short arrow is used to show a weak force and a long arrow is used to show a strong force.
Figure 3 uses a force diagram to show the unbalanced forces of a weightlifter pushing the barbell upwards. The push force the weightlifter is using is 1,200 N, and the pull force of gravity is 1,000 N. This means the overall net force is 200 N upwards. The barbell will move upwards. Worked example 6.3A shows an example of how to calculate net force.
Worked example 6.3A Calculating net force
Khan and Kim were moving a table tennis table for their parents. Khan pushed the table with a force of 200 N, while Kim pushed with a force of 150 N.
a D raw a force diagram to represent the forces exerted on the table if Khan and Kim were pushing in opposite directions.
Solution
Khan push force 200 N
DRAFT
Push from weightlifter 1200 N
Force of gravity (1000 N)
Figure 3 The forces acting on a barbell are combined to show that it is being lifted up by a weightlifter.
b Calculate the net force if both Khan and Kim pushed in the same direction (left).
c Calculate the net force if Khan pushed to the left and Kim pushed to the right.
d Describe the direction that the table will move if Khan pushed to the left and Kim pushed to the right.
Kim push force 150 N
Figure 2 A soccer ball will change direction when kicked due to the unbalanced force.
b I f both forces are in the same direction (left), they will add together.
• Net force = 200 N + 150 N = 350 N
• T he net force is 350 N to the left.
• Note: Always mention the direction of the net force.
Check your learning 6.3
Check your learning 6.3
Comprehend
1 Describe the evidence that shows the forces acting on the objects are unbalanced in the following situations:
a pushing down the lever on a toaster
b jumping on a trampoline
c a car star ts moving.
2 Ex plain why a brick wall does not fall over when you push against it. Explain why a bulldozer could push the wall over.
3 Ex plain why weightlifters get tired when they hold heavy masses in the air.
4 D raw two people having a tug-of-war. Give them names and draw a force diagram to show the different forces they are exerting on the rope. Explain who will win and why.
Analyse
5 D raw a force diagram to identify one example for each of the following:
a forces that are balanced (net force = 0 N)
b forces that add together to make an object fall.
c I f both forces are in opposite directions, then they will be subtracted from one another.
• Net force = 20 N (left) – 150 N (right) = 50 N (left)
• T he net force is 50 N to the left.
d T he table will move in the direction of Khan (left) as she is pushing with a greater force (it is unbalanced).
6 Sally pushes with a force of 50 N and Marilla pushes with a force of 75 N.
a Draw a force diagram of the forces acting in opposite directions and calculate the net force to determine who will win.
b Draw a force diagram of the forces acting in the same direction and calculate the net force.
Skills builder: Questioning and predicting
7 A teacher wants to investigate if having more people on one side of a tug-of-war will affect the result of the game. They have created this scientific question for their investigation: “Is it good to have lots of people for tug-of-war?”
a Identify what is wrong with the teacher’s question. (THINK: Is this question specific enough and easy to test?)
b Propose your own scientific question for the investigation. (THINK: How does your question improve on the teacher’s question?)
Learning intentions and success criteria
Lesson 6.4 Forces can be contact or non-contact
Key ideas
→ Contact forces involve two objects touching each other.
→ Non-contact forces occur when one object is able to push or pull another without touching the other.
DRAFT
contact force a force acting between two bodies in direct contact non-contact force a force acting between two bodies that are not in direct contact
→ Magnetism is an example of a non-contact force.
→ Magnets have a north and south pole. If two north or south poles are placed near each other, they will repel. If a north and south pole are placed near each other, they will attract.
→ Domains create a magnetic force.
Introduction
All forces occur between two or more objects. These objects can be living or non-living.
Contact forces
Some forces make objects move because of a direct push or pull. For example, if you push a pencil with your finger, the pencil moves. Your finger has to touch the pencil or be in contact before the pencil will move. This is called a contact force.
Non-contact forces
Some forces cause movement without touching. These are called non-contact forces. An example of this is the force of attraction between a magnet and a metal paperclip (Figure 1). When a magnet is held near a metal paperclip, the paperclip is pulled towards the magnet. There is no touching, or contact.
How magnets push and pull

Magnets are made of an alloy (a mixture of metals) that is mostly iron. The bar magnets used most commonly in schools are usually made of the alloy alnico, which is iron mixed with aluminium, nickel and cobalt. New, strong magnets are made
Figure 1 The attraction between the paperclip and the magnet is a non-contact force.
from metals known as “rare earth” metals. These are much stronger than normal magnets and do not lose their magnetism.
One end of a magnet is labelled “N” for north and the other end “S” for south. If you hang a bar magnet from its centre by a piece of string, the north end will swing to point north. The magnet is said to have two magnetic poles – north and south.
When the north pole of one magnet is placed near the south pole of another magnet, the two magnets are pulled to each other (Figure 2). This is called an attraction force. The two unlike poles (a north and a south) attract each other.
Magicians use this attraction force to slide something along a table. You can do this too. Place one magnet on top of a thin table and a second magnet under the table. Can you make the top magnet move? Can you see the pull force? Are the two magnets contacting each other?


When two like poles (two north poles or two south poles) are placed together, they push each other apart (Figure 3). You can also use one magnet to push another magnet along a table. This is called a repulsion force. The two magnets do not need to touch to be affected by the repulsion force. It is a non-contact force.
What causes a magnetic force?
An iron needle can be made into a magnet by sliding a strong magnet along one side of it (in one direction only). The strong magnet pulls tiny groups of particles so that they all line up in one direction. Each time you stroke the needle, these particles line up. This causes larger sections of the magnet called domains to point in the same direction (Figure 4). When most of the domains are pointing the same way, they can pull or attract a metal pin. Dropping the needle can cause the domains to become mixed up again.
Some magnets never lose their magnetic force. These magnets are called permanent magnets. The domains in these magnets are often arranged while the metal is still buried deep under the ground. Breaking these magnets in half does not change the
magnetic poles the north and south ends of a magnet attraction force the force that attracts one object to another
unlike poles the north and south poles of a magnet
like poles two north poles or two south poles of a magnet repulsion force a force that pushes one object away from another
domain a small section of a magnet where the magnetic field of all the atoms is aligned in the same direction
Figure 2 Unlike poles of a magnet attract each other. The north pole of one magnet is pulled by the south pole of another magnet.
Figure 3 Like poles of a magnet push away from/repel each other. Two north or two south poles of magnets push each other apart.
Figure
arrangement of the domains. The two halves become smaller magnets with the same pull or push forces as the larger magnet (Figure 5).
The push forces of magnets are used in the design of Maglev (magnetic levitation) trains (Figure 6). A series of electronic magnets on the train and track suspend the train above the tracks. The magnets on the train and the track have like poles, causing them to push away from each other and for the train to sit above the track. There is no contact between the train and the metal track. To make the train move, the driver changes the pole of the train magnet, and the track magnet pushes the train magnet forward.

Check your learning 6.4
Check your learning 6.4
Retrieve
1 Name three places where you might find a magnet.
Comprehend
2 C ontrast a contact force and a non-contact force.
3 Identify a magnetic force as either a contact or a non-contact force. Explain your answer.
4 Ex plain why one part of a magnet is called the north.
5 Describe what will happen when the following poles of two magnets are pushed close together:
DRAFT
a N and S
b S and S
c N and N
d S and N.
Apply
6 Describe how you would use a contact force to:
a move a stationary ball
b stop a sliding chair
c change the direction of moving bike.
7 D raw how you might arrange bar magnets to create the letters of your name (Figure 7). Label the north and south poles of the magnets.
8 P ropose how you might levitate a magnetic skateboard above a large magnet on the ground. Mention the arrangement of the poles of the magnet in your description.
Figure 5 When a magnet is broken, it forms two magnets.
Figure 6 Repulsive magnetic forces cause this Maglev train to move.
Figure 7 Spelling out a name using magnets
Lesson 6.5
Magnetic fields can apply a force from a distance
Key ideas
→ The Earth has a magnetic field around it due to its magnetic north and south pole (which is different to the geographic North and South Pole).
→ The magnetic north and south pole has occasionally flipped throughout Earth’s history.
→ A magnetic field is the area around a magnet where a magnetic force is experienced.
→ A magnetic field cannot be seen, but we can see the way it interacts with other objects.
→ The further away an object moves from the magnet, the weaker the magnetic field.
→ Animals can use the Earth’s magnetic field to navigate back to their breeding grounds.
How compasses work
A compass needle is a weak magnet. When a compass is placed near a strong magnet, the compass needle points in the direction of the magnetic field. You can see this by moving a compass around the sides and ends of a bar magnet. The north pole of a compass always points to the south pole of a magnet.
Iron filings and iron powder are tiny bits of iron. If you put them near a strong magnet, they become temporary magnets. They line up like tiny compass needles around the strong magnet. You can draw this pattern and make a map of the magnetic field. Figure 1 shows the magnetic fields around one and two bar magnets.
Earth’s magnetic field
There is a large magnetic field around Earth. A compass needle will line up with Earth’s magnetic field. The part of the compass needle with the “N” on it points to the north magnetic pole of Earth.
It is important to note that the magnetic north pole of Earth is not the same as the “geographic” North Pole. They are both in the Arctic Circle, but are hundreds of


Learning intentions and success criteria magnetic pole the points on Earth where the magnetic field points downwards and a magnetic needle dips vertically
Figure 1 Magnetic fields (A) around a single bar magnet, (B) between two attracting bar magnets and (C) between two repelling bar magnets
kilometres apart. The North Pole, also known as geographic North or true North Pole, is the northernmost point of Earth. If you tunnelled through Earth from the North Pole in a straight line, you would come out the other side at the South Pole.
The magnetic north pole is quite different. The magnetic north pole is not a fixed point –it moves about according to the magnetic field of Earth and has done so for millions of years. This movement is caused by Earth’s magnetic field. Also, the magnetic south pole does not always line up with the magnetic north pole.
Geographic North Pole
Magnetic north pole S N
The Earth’s magnetic field

Magnetic south pole
DRAFT
Geographic South Pole
Figure 2 shows the different locations of the geographic North and South Poles and the magnetic north and south poles.
How turtles use Earth’s magnetic field
When a turtle hatches, it crawls down the beach to the water and swims out to the brightest light on the horizon, which is usually the Moon. For the next 30 years, it will swim in the fast-flowing ocean currents around the world. The turtle is able to detect the magnetic field around Earth. It can measure the direction of the magnetic field (just like a compass) and how strong it is. When the turtle is ready to return to the same beach where it hatched, all it needs to do is follow the magnetic field back (Figure 3). Once there, it will mate and lay eggs, completing the cycle of life once again.
Flipping the magnetic poles

Figure 3 What do magnets and turtles have in common? Magnets create a magnetic field, and turtles use the magnetic field to find their way back to the same beach where they hatched.
Throughout history, the magnetic north and south poles have occasionally flipped, swapping positions. The last flip happened 780,000 years ago. The flip can take a few thousand years to complete. While this happens, the poles become very disordered and a magnetic north or south pole can appear anywhere (Figure 4). How will this affect the turtles being able to find their beach?
Axis of rotation
Figure 2 Earth’s magnetic poles are not in the same place as its geographic poles.


Bank cards and magnets
You use magnetic fields in your own life. The black strip on the back of a bank card has a series of small, magnetised zones separated by demagnetised zones (Figure 5). You can see these zones if you sprinkle fine iron filings on them. The iron filings arrange themselves according to the magnetic field surrounding the magnetic zones, which look a bit like a bar code. When the card is swiped through a card reader, the magnetic bar code is read and the person’s name, bank and account number are decoded.

The information on the black strip on a bank card can be changed if it is put next to a strong magnet. This includes the magnetic clasps on a purse, or wallet. Some stores also attach magnetic security devices to their stock to protect against theft. They remove these using a demagnetiser near the cash register. Leaving a bank card on a store demagnetiser will also change the magnetic strips on the card.
1 Describe a magnetic field.
2 Ex plain how you could map the magnetic field around a magnetic nail.
3 Describe in words the shape of the magnetic field when two magnets are: a attracting b repelling.
Figure 4 Earth’s magnetic poles (A) between reversals and (B) during a reversal
Figure 5 The magnetic strip on a bankcard contains zones of magnetised and demagnetised areas.
4 Describe how you could decide which magnet was stronger by looking at the magnetic fields made by different magnets.
5 Ex plain how a compass detects and uses Earth’s magnetic field to detect north.
6 Ex plain why you should never leave a library card on the demagnetising panel of a shop. Apply
7 C reate a drawing of the magnetic field around a broken magnet:
a that has been rejoined
b with the two pieces 10 cm apart
c with the two pieces 1 cm apart.
Lesson 6.6
Skills builder: Conducting investigations
8 I magine that you have been asked to conduct an investigation to test the strength of an electromagnet that is made out of a nail, a copper wire and a battery.
a Assess the risks that you might encounter using this equipment. (THINK: What could go wrong?)
b Suggest ways to reduce each of the risks you have identified. (THINK: What can you do to make sure you are safe when you are using this equipment?)
Electrostatic forces are non-contact forces
Key ideas
Learning intentions and success criteria
Check the next lesson for a linked practical activity or experiment.
DRAFT
→ Rubbing two objects together can cause an electrostatic force due to the build up of electrical charge.
→ Like (two positive or two negative) charges repel.
→ Unlike charges attract.
→ Charged objects attract uncharged objects.
→ A Van de Graaff generator is a machine that is able to create a large electrostatic force with visible sparks seen.
→ You can experience electrostatic forces in everyday life, such as creating a little electric shock when you touch the metal frame of a trampoline after jumping on it.
What causes electrostatic force?
electrostatic force the force between two objects caused by a build-up of negative charges
Have you ever rubbed a balloon on your hair and seen the hair cling to the balloon? This is a result of an electrostatic force. When two objects rub against each other, a small electrical charge builds up. One object becomes positively (+) charged and the other becomes negatively (–) charged. These two charges act like the north and south poles of a magnet. The positively charged objects are pulled, or attracted, to the negatively charged objects. The unlike charges attract each other.
Because the objects do not need to touch each other to attract, electrostatic forces are a non-contact force. Rubbing a balloon on hair causes the hair to become positively charged and the balloon to become negatively charged. When the (negatively charged) balloon moves away, the (positively charged) hair is still attracted to it. The hair lifts up and tries to cling to the balloon (Figure 1).
Van de Graaff generators
A Van de Graaff generator works in the same way as rubbing a balloon on hair. In the long shaft of the machine, two long belts rub against each other, making the rounded dome of the machine positively charged. Negative charges are attracted to the dome. If anything comes close enough to the dome, the negative charges are attracted and jump through the air. You might see this as a spark (Figure 2).
As well as negatively charged objects, uncharged objects (neither positively nor negatively charged) are also attracted to the positively charged dome. If you stand too close to the Van de Graaff generator, your uncharged hair might be attracted to the dome.
Anything touching the Van de Graaff dome also becomes positively charged. The girl in Figure 3 is standing on a rubber mat so that the negative charges cannot move from the ground into the dome. This means that she becomes positively charged like the dome. Every part of her body becomes positively charged, including all her hair. Just like the forces in a magnet, the like charges in the hair repel each other. This makes the strands of the girl’s hair try to push away from one another.
The rules of electrostatic forces are:
• l ike charges repel
• u nlike charges attract
• charged objects attract uncharged objects.


Figure 1 When the negatively charged balloon moves away, the positively charged hair is still attracted to it.
Figure 2 Sparks jump across to a Van de Graaff generator when negative charges come close enough.
Figure 3 This girl has become positively charged, like the dome of the Van de Graaff generator that she is touching. The strands of her hair are repelling each other.
Retrieve
Electrostatic forces in everyday life
You may have experienced electrostatic forces when you were jumping on a trampoline. Every time you jump, your feet rub against the trampoline mat. This causes a charge to build up in your body. Sometimes this causes your hair to stand up because the strands are pushing away from each other. When you touch someone else, or the framework of the trampoline, you may feel the spark as the negative charges are attracted (known as an electric shock).
Electrostatic charge can build up on cars as they drive along the road. It is this charge that can cause explosions when filling up at a petrol station. If the driver gets out of the car without touching the metal of the car, then the car can still have the positive charges built up. It is usually safe to start filling up the car, but if the driver gets in and out of the car when the petrol fumes are in the air, the negative charges can be pulled between the car and the driver. This causes a spark and in rare cases could result in an explosion.
1 Recall if electrostatic charges are contact or non-contact forces.
2 Recall the terms that complete these statements.
a Unlike charges _______________ .
b _______________ charges repel.
c Charged objects _______________ uncharged objects
Comprehend
3 Describe how electrostatic forces can be created.
4 Ex plain why the hair of a person touching a Van de Graaff machine may be standing out from their head.
Apply
5 I saac was leaving the carpeted library to go home. When he touched the door handle, he received an electric shock. Discuss why this happened.
6 W hen it is about to rain, the water particles in the clouds rub against one another and electrostatic charges form similar to the Van der Graaff machine. Explain the similarities between the spark generated by a Van der Graaff machine and lightning.
Lesson 6.7
Experiment: What if a balloon was electrostatically charged?
Caution!
Some students may be allergic to latex balloons.
Aim
To examine the push or pull forces involved in electrostatically charged balloons
Materials
• Balloon pump
• Two balloons
Method
• St ring
• Wool/nylon material
1 Using the balloon pump, inflate both balloons and tie knots in the ends.
2 Tie string to the ends of both balloons.
3 Rub one of the balloons on your jumper or with the material provided.
4 Hold the balloon by the string so that it does not lose its charge.
5 Hold the second balloon by the string and bring it close to the first balloon.
• Identify the force as a push or pull force.
• Describe the force acting on the balloons as a contact or non-contact force. Justify your answer by defining each term.
Inquiry: What if both balloons are charged?
Plan and conduct an experiment that answers the inquiry question.
1 Develop a hypothesis for your inquiry.
2 Identify the independent variable you will change in this experiment.
3 Identify what effect you expect to see on the dependent variable that you will measure and/or observe.
4 Identify two variables that you will need to control to ensure a reproducible test. Describe how you will control them.
5 Develop a method for your experiment. (Hint: Use the method above as a guide.)
6 C onstruct a table to record your results.
7 Show your teacher your planning to obtain approval before starting your experiment.
Discussion
1 Ex plain how the balloons became charged.
2 Ex plain why the balloons moved during your experiment.
3 Describe an example of an electrostatic charge that occurs in everyday life.
Conclusion
Describe what you know about electrostatic forces.

Figure 1 Balloons are a great way to see electrostatic forces in action.
Learning intentions and success criteria
Lesson 6.8
Earth’s force of gravity pulls objects to the centre of Earth
Key ideas
→ Earth’s force of gravity can cause a non-contact force.
→ Large objects (such as planets, moons and stars) pull objects towards their centre.
Check the next lesson for a linked practical activity or experiment.
gravity the effect of a large object (such as a planet) warping space and time, and pulling objects to its centre
DRAFT
→ In physics, there is a difference between the definitions of mass and weight.
→ Mass is measured in kilograms and is how many particles or atoms makes up the object.
→ Weight is a measure of the pull force on an object and can be calculated using: weight = mass × gravity.
→ The units of weight is in Newtons (N).
→ On Earth, the pull of gravity is lower the higher up you are.
Gravity
One day in 1665, a young student named Isaac Newton was sitting under an apple tree when an apple fell to the ground. “Why did it fall?” he wondered. There was nothing he could see that could push it or pull it. He realised that there must be a force that pulled the apple towards Earth. This is how Newton claimed he first had the idea of gravity.
Gravity is the effect of a large object (such as a planet) warping space and time. This results in the large object (Earth) attracting everything nearby to its centre. This means people, animals and apples are pulled to the centre of Earth.
Consider Figure 1. If everyone in the picture dropped an object, those objects would fall towards the centre of Earth.
Every object that is made of matter (small particles called atoms) is able to pull other things towards it. Earth is made up of enormous amounts of matter, allowing it to exert a relatively strong non-contact force on objects around it. Even you have a weak force of gravity surrounding you. Earth has much more matter than you do, and therefore Earth’s pull force is much stronger than yours (Figure 2).
Figure 1 The large mass of Earth can pull objects to its centre.
The more matter an object has, the stronger its pull force. Stars like our Sun have much more matter than Earth. This means that the gravitational pull of the Sun is much stronger. It can even keep the planets from travelling off into space.
The difference between weight and mass
The Moon is made of less matter than Earth. This means that the Moon’s ability to pull objects is much less than Earth’s. An astronaut jumping on the Moon will be able to jump much higher than on Earth. This is because the pull force of the Moon is not as strong as the pull force of Earth.
Weight is a measure of the pull force on an object. Your weight on the Moon would be less than that on Earth (Figure 3). This does not mean you are smaller. It just means the Moon is pulling you down less. Because weight is a measure of the pull force of gravity, it is measured in newtons (N).
If weight is a measure of the pull force, then how do scientists describe the amount of matter of an object? Mass (measured in kilograms) is the term used to describe how many particles or atoms make up an object. The mass of an object does not change, no matter where in the universe it is.
If a brick has a mass of 1 kg on Earth, it has this mass everywhere. However, the weight of the brick will change. On Earth, the 1 kg brick may weigh 9.8 N (mass of 1 × force of gravity 9.8), but on a large planet with a greater pull force, such as Jupiter, it would weigh 23.6 N. On the Moon, the brick would weigh approximately 1.6 N because the Moon is small and has less pull force (Figure 4).

Mass = 120kg
Weight = 120 × 9.8 = 1,177 N


Mass = 120kg
Weight = 120 × 1.6 = 192 N
weight a measure of the gravitational pull on an object and is the same as the force of gravity on Earth
Weight = 9.8N
Weight = 1.6N
mass the amount of matter in a substance, usually measured in kilograms (kg); the mass of an object never changes, even in space
Weight = 23.6N
Figure 2 Earth pulls base jumpers towards its centre, 6,371 km below.
Figure 3 A person who wants to lose weight could go to the Moon. A person who wants to lose mass could take their shoes off.
Mass = 1kg
Mass = 1kg
Mass = 1kg
Earth Moon
Jupiter
Figure 4 The mass of a brick does not change, but its weight is affected by the gravity of the different locations.
The force of gravity changes
As you move away from Earth, the pull force slowly decreases. This means that if you stand on a chair your weight will have decreased slightly. Most scales will not be sensitive enough to measure this small change. However, if you stood on the top of Mount Everest, you would be several kilometres further away from the centre of Earth. As a result, your weight (the amount of pull force Earth exerts on you) is 0.25 per cent less than if you were at sea level.
Gravity is not the same for every object. Objects with a larger mass experience a greater pull than objects with less mass. This means a 3 kg bowling ball has a stronger pull force acting on it than a lighter basketball does. Does this mean that the bowling ball will fall faster than the basketball?
If you do this experiment, you will find that both balls hit the ground at the same time. This is not what most people expect to happen. Logic might suggest that heavier things hit the ground first. You may need to do the experiment a few times until you believe it. The heavy bowling ball needs more force to start it moving than the basketball. This offsets the larger pull, so both balls fall at the same rate and hit the ground at the same time (Figure 5). If both balls were dropped from the top of a building, air resistance may slow the basketball a little more than the bowling ball. We do not recommend that you try this for safety reasons.
Check your learning 6.8
Check your learning 6.8
Retrieve
1 Name the person who first described gravity.
Comprehend
2 I f a half-full water bottle was dropped from the top of a flight of stairs at the same time as a full bottle of water, explain which bottle would hit the ground first.
Analyse
DRAFT

3 Identify whether the following statement is true or false: “The pull of Earth is stronger on an elephant than on a feather.”
4 C ontrast mass and weight.
Apply
5 Ca lculate the weight of an object on Earth if its mass is 2 kg.
6 A n astronaut on the Moon dropped a feather and a hammer at the same time. There is very little atmosphere on the Moon to slow down objects. Discuss why the feather and hammer hit the ground at the same time.
7 Building a settlement on the Moon has been suggested several times since Neil Armstrong first walked on the Moon. Discuss the advantages and disadvantages of building such a structure in a low-gravity environment.
Figure 5 A bowling ball has more mass than a basketball and therefore it takes more force to start it moving. As the balls are falling, Earth pulls more on the bowling ball, causing both balls to fall at the same rate.
Skills builder: Questioning and predicting
8 I magine that you are asked to compare how fast a basketball and a bowling ball fall to the ground when they are dropped from different heights (Figure 5).
a Complete the scientific question for this investigation. (THINK: What variables are you measuring?) How does _____________ affect _____________ ?
b Explain how your question “does” or “does not” satisfy the following criteria: i I s it testable? (THINK: Is it possible to design an investigation to test this question?)
ii Is it specific? (THINK: Would someone know what you wanted to investigate just by reading your question?)
iii I s the answer to this question based on opinion?
Lesson 6.9
Experiment: Making a parachute
Aim
To investigate the forces acting on a parachute
Materials
• Plastic bag
• Plastic plate
• Permanent marker
• Scissors
• M asking tape
• Hole punch
• Ruler
• St ring
• Small mass (e.g. 5 to 10 g of play-dough)
• Timer
Method
DRAFT
3 Remove the plate and use scissors to cut out the drawn circle.

4 Place a small piece of masking tape on four places on the plastic circle you have cut out. (If you think of the circle as a clock face, place the masking tape at 3, 6, 9 and 12 o’clock.)
1 L ay the plastic bag flat on the table and place the plastic plate upside down on the centre of the plastic bag.
2 Use the permanent marker to trace around the plastic plate.
5 Use the hole punch to make a hole in the centre of each piece of masking tape. The masking tape will strengthen the plastic at this point.
Figure 1 Use a plastic plate to measure the parachute so that the size of each parachute is controlled.

6 Measure four lengths of string that are each approximately 30 cm in length.
7 Tie the end of one string through one of the holes you made in the masking tape. Be careful not to rip the masking tape or plastic parachute.
8 Repeat for the remaining strings and holes in the parachute so that you have all four strings tied to a separate hole in the parachute.
9 L ink the free ends of all four strings together so that they are not tangled and tie them to the mass.


DRAFT
10 Find a high place to carefully drop your parachute. Time how long it takes to reach the ground. Record your time in Table 1.
11 Repeat step 10 another two times and determine the average time it takes to reach the ground. Record your result in Table 1.
Inquiry: How can you almost balance the forces acting on the parachute so that it drops more slowly?
Plan and conduct an experiment that answers the inquiry question.
1 Identify what variables you could change in your experiment.
2 Identify how each of these variables might affect the way the parachute will fall.
Variable that could be changed
How this variable could affect the fall of the parachute
Figure 2 Use masking tape to reinforce each hole that is punched.
Figure 3 Tie each of the four strings to a separate hole in the parachute, then link them together and tie them to the mass.
Figure 4 Measure the time it takes for your parachute to drop to the ground.
Table 1 Time the parachute takes to reach the ground.
3 Identify the one variable that you will test. Describe why you selected this variable.
4 Develop a hypothesis for this experiment.
5 Describe how you will control the remaining variables.
6 Develop a method for your experiment. Include a labelled diagram of your parachute.
7 Show your teacher your planning to obtain approval before starting your experiment.
Results
Table 2 Time the parachute takes to reach the ground when _______________ is changed.
Discussion
1 Ex plain why you needed to drop your parachute three times for this experiment.
2 Describe any changes you made to the original method provided. Explain why you made these changes.
3 D raw a force diagram of the forces acting on your parachute.
4 Use your understanding of forces to explain any difference in the time taken for each parachute to reach the ground.
Lesson 6.10
5 Describe how the experiment could be improved if you repeated it.
Conclusion
Describe the forces acting on the parachute as it falls.
Experiment: Dropping mass
Aim
To determine how height affects the way a mass falls
DRAFT
Materials
• Plastic sheet
• L arge ball of play-dough
• 1 m r uler
• 50 g mass
• T hin piece of wooden dowel or wooden skewers
• Permanent marker
Method
1 L ay the plastic sheet out on the desk.
2 Place the ball of play-dough on the plastic sheet and flatten it until it is an even surface 2 cm thick.
3 Place the 1 m ruler vertically next to the play-dough. Hold the 50 g mass 20 cm above the play-dough. Record the way you are holding the mass (vertically on its side or horizontally flat).
4 D rop the 50 g mass onto the play-dough.
5 Carefully remove the mass without changing the shape (indent) in the play-dough.
6 Place the end of the wooden dowel in the deepest part of the indent made by the 50 g mass. Use the permanent marker to mark the depth of the indent in the play-dough.
7 Hold the wooden dowel against the ruler to measure the depth in centimetres. Record your measurement.
8 Roll up the play-dough and flatten it again as you did in step 2.
9 Repeat steps 3 to 8 with the mass held at 30 cm, 40 cm, 50 cm and 60 cm.
Results
Construct a table to record your results. Construct a line graph that shows how the height of the mass affected the depth of the indent in the play dough.
Discussion
1 Describe one of the variables that was difficult to control in this experiment.
DRAFT
2 Describe what steps you took to improve the control of this variable.
3 Describe how increasing the height of the mass affected the depth of the indent in the play-dough.
4 Use your understanding of the force of gravity to explain why the mass made an indent in the play-dough.
Conclusion
Explain how the force of gravity affects a dropped mass.
Lesson 6.11
Gravity affects all objects in space
Key ideas
→ Earth’s gravity constantly pulls the Moon towards its centre, resulting in its orbit around Earth.
→ A planet’s gravity causes moons to orbit it.
→ A star’s gravity causes planets to orbit.
Learning intentions and success criteria
→ A black hole’s gravity causes galaxies to orbit and prevents light from escaping.
Moons orbit a planet
When you throw an object, it has many forces acting on it. Before it leaves your hand, there is the push force of your hand on the object. Because forces always act in pairs, the object also pushes back on your hand (Figure 1).
Once the ball leaves your hand, there is no more push force. Instead, the main force experienced by the ball is the force of gravity that pulls the object down towards the centre of Earth. This is much stronger than the pull force the small object has on Earth. This causes the ball to move in a curved shape (Figure 2).

This is similar to objects moving around a planet. All of the objects in space are constantly moving. As they move through space, they are always being pulled towards bigger objects. Similar to the motion of a thrown ball, the path they take is curved around the object.
Our Moon orbits Earth because the force of Earth’s gravity constantly pulls it down. Because it is moving through space, it travels in the same shaped path as a thrown ball that never quite hits Earth (Figure 3).
DRAFT
orbit the path a planet follows around the Sun or a star; the path a moon follows around a planet
Planets and galaxies are affected by gravity
Planets such as Earth are also constantly moving around the Sun. Their orbit around the Sun is similar to the way the Moon orbits Earth. As the Sun (a star) is much larger than Earth, its force of gravity is much stronger. This pulls Earth towards the Sun. Because we are constantly moving forward, we do not fall into the Sun. Instead, we travel in an orbit around the Sun.
Figure 1 The forces acting on a ball as you throw it
Figure 2 After you throw a ball, the force of gravity is the main force that acts on the moving ball.
galaxy a system of stars and their solar systems, dust and gas held together by gravitational force
black hole an area where gravitational pull is so strong that no matter or light can escape it
DRAFT
supernova explosion of a star singularity a point that has infinite gravity and density; the centre of a black hole
All of the planets in our solar system orbit around our Sun. Each planet travels at a different speed. The further away a planet is from the Sun, the slower it travels. For example, Neptune is 30 times further away from the Sun than Earth. It orbits the Sun six times slower (Earth’s orbit speed is 29.8 km/s, while Neptune’s orbit speed is 5.43 km/s). If Neptune travelled any faster, it would be able to escape the Sun’s force of gravity and travel into space.
When stars are similar masses, their force of gravity is also similar. This means two stars can orbit each other. This is called a binary star system.
When a group of stars travel through space together, they can be held together by a combined force of gravity. A group of stars held together by gravity is called a galaxy
Black holes
A black hole is not a hole in space. Instead, it is a part of space that does not have any light. It is the darkest part of space.
A black hole is made when a large star (many times bigger than our Sun) reaches the end of its life. The energy that held the star together disappears, causing the star to collapse in on itself. This causes a massive explosion called a supernova. All the matter that is left over from the large star shrinks into the smallest space possible. This point is called a singularity
Because there is so much mass in such a small area, a singularity generates the strongest force of gravity that we know. This gravitational field pulls in everything around, even light. That is why it is called a black hole – no light can escape its gravitational field. The area around a black hole, where light can start to be seen, is called the “event horizon” (Figure 4).
Figure 3 The orbit path of the Moon is affected by the force of Earth’s gravity.
A black hole can have many different types of objects orbiting it (similar to the way planets orbit the Sun, or moons orbit a planet). The closer the objects are to the black hole, the faster they orbit. This means they can stretch out and start to glow (Figure 4).
When an object moves too close to a black hole, it is stretched out like a noodle (Figure 5). It happens because the side of the object closest to the centre of the black hole experiences a greater force of gravity than the other side of the object. This causes stretching that is called “spaghettification”. Eventually, the object moves past the event horizon, into the black area of a black hole. This means we can no longer see the object.

The black hole in the centre of our Milky Way galaxy is called Sagittarius A and it is 4 million times the mass of our Sun. Our solar system is too far away from Sagittarius A to ever become spaghettified or move past the event horizon.

Retrieve
1 Define the following terms: a orbit b galaxy c spaghettification.
DRAFT
2 Describe a black hole.
3 Identify the black hole found at the centre of our galaxy.
Analyse
4 Ex plain why the Moon does not “fall” into Earth.
5 Compare a galaxy and a black hole.
Apply
6 Ex plain why our galaxy (the Milky Way) orbits around Sagittarius A.
7 I f Mercury is closer to the Sun than Earth, would you expect it to be travelling faster or slower than Earth? Justify your answer (by describing why planets orbit the Sun rather than falling into it, comparing the speed of travel of Neptune and Earth to their distances from the Sun, and describing the distance between Mercury and the Sun).
event horizon
Figure 4 A black hole is the darkest part of space. Sagittarius A is the black hole in the centre of our Milky Way galaxy.
Figure 5 Spaghettification is the stretching of an object when it moves too close to a black hole.
Learning intentions and success criteria
Lesson 6.12
Friction slows down moving objects
Key ideas
→ Friction is a contact force.
Check the next lesson for a linked practical activity or experiment.
→ Friction (such as air resistance) slows down moving objects.
→ Friction can be reduced by streamlining, using lubricants or ball bearings.
Introduction
friction a force that acts to oppose the motion between two surfaces as they move over each other
DRAFT
It is much easier to slide along ice than along a gravel road. This is because the friction of the gravel road acts to slow the forward motion. Friction is the force that resists movement between two objects in contact. In other words, friction is a contact force that slows down moving objects.
Friction
When buying sports shoes, many people look for shoes with good grip. This grip prevents the shoe from sliding when they run and helps to avoid sliding when they stop. The grip provides friction between the ground and the wearer (Figure 1).
Friction slows everything down that is moving. It acts in the opposite direction to the movement. The greater the friction, the more the movement slows down and eventually stops. Friction happens because objects rub together. When you start walking, you rely on the shoe rubbing against the ground and gripping so that you can push forward. When you try to stop, you rely on the friction between the shoe and the ground to stop your movement. Without friction, your feet would just slip over the ground. It would be like trying to walk on ice.
Evidence of friction
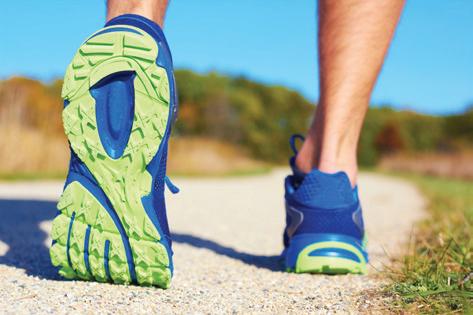
We can see evidence of friction in many parts of our lives. Any time a movement is slowed down, it is because of friction. Without friction, a bike would keep rolling along a flat road without the need to pedal. A pen or pencil would slide over a page without leaving a mark. Friction is very useful to us, but it can create problems and we often try to reduce it.
How to reduce friction
Moving an object across the ground by placing it on balls (or rollers) is one way to reduce friction. Because balls roll, the movement is much easier than dragging the
Figure 1 Friction between the shoe and the ground stops you from sliding around.
object directly along the ground. Balls only have a small area in contact with both the ground and the object being moved. As the object moves forward, the balls roll rather than being dragged. This reduces the friction between the two surfaces (Figure 2).
Hovercrafts and air pucks have low friction because they use a layer of air to glide over a surface. There is no contact between the surfaces and, as a result, almost no friction. The same idea is used in Maglev (magnetic levitation) trains, where the train carriages are held above the tracks by strong magnetic forces.
Lubricants, such as oils and grease, also reduce friction (Figure 3). This is called lubrication. If a kitchen drawer sticks, you can use candle wax or soap as a lubricant. Lubricants work by coating the surface with an oily or greasy substance, which makes them slippery. Putting oil on bicycle chains and grease on the wheel axles makes the wheels spin more easily, with less friction.


Air resistance, or drag, is the friction between a moving object and the air it is moving through. As the object moves, it needs to push the air particles out of the way, limiting the speed of the object.
Parachutes use air resistance to slow the movement of the falling people. While this is an advantage if you are sky diving, it can be a problem for cars and trucks. The greater the air resistance, the more fuel the car will use. Streamlining (making the surface smooth and rounded) helps to reduce friction and overcome air resistance (Figure 4).
Fish and sharks have streamlined bodies. This allows them to move through the water with the least amount of friction.
DRAFT
lubrication the action of applying a substance such as oil or grease to an engine or component so as to reduce friction air resistance friction between a moving object and the air it is moving through streamlining giving an object a form that presents the least resistance to motion
Figure 2 These ball bearings allow the two metal circles to move past each other with very little friction.
Figure 3 Oil is a lubricant that is added to a car engine to reduce friction between engine parts.
Air flows smoothly over the car
Push from ground 1,000 N
Force of gravity 1,000 N Air resistance and tyre friction
N Engine push 1,200 N
Figure 4 Streamlining reduces friction. This can be shown on a force diagram.
Check your learning 6.12
Check your learning 6.12
Retrieve
1 Identify three examples where friction is useful and three examples where friction is a problem.
Comprehend
2 Ex plain why a penguin is streamlined, but a sea anemone is not.
3 Soft wax can have a high level of friction. Explain why surfers wax their surfboards.
4 T he tread on the tyres of your bike wears down with a lot of use. Explain this in terms of friction.
5 A hovercraft moves across water on a cushion of air. Describe this in terms of friction.
Analyse
6 I n a world without friction, identify what would happen if you tried to: a go down a slide in a playground b play tenpin bowling c tie your shoelaces.
Apply
7 Use your knowledge of friction and air resistance to complete the following hypothesis.
If the surface area of a parachute is decreased, the parachute will __________ because __________.
8 Identify the surface (sand, wood or metal coated in oil) that would allow you to move fastest with the same pushing force. Justify your answer (by describing the friction of each surface and deciding which surface will allow for the fastest movement).
Skills builder: Processing and analysing
9 A student used the same pushing force on their textbook to slide it across different surfaces. They recorded their results in the following table.
a Identify what kind of graph you would use to represent this information. (THINK: Would you use a bar chart or a line graph?)
b Constr uct a graph using this data. (THINK: What other features should a graph have? Remember to label your xand y- axes and include a title.)
Lesson 6.13
Experiment: What if the amount of friction was changed?
Aim
To investigate how friction may be reduced
Materials
• Force meter (Lesson 6.2 Experiment: Measuring forces (page 239)) or spring balance
• T hick textbook
• Wooden rollers (e.g. round pencils)
• Book
• Sand
• Safety glasses
Method
1 Use your force meter (or spring balance) to measure the friction of your textbook being dragged along the table. (HINT: Drag it at constant speed.)
2 Place two books on top of each other and measure the friction.
3 Identify what effect you expect to see on the dependent variable that you will measure and/or observe.
4 Identify two variables that you will need to control to ensure a reproducible test. Describe how you will control them.
5 Develop a method for your experiment. (HINT: Use the method above as a guide.)
6 C reate a table to record your results.
7 Show your teacher your planning to obtain approval before starting your experiment.
Results
Push this way
Textbook
Force measurer
Figure 1 Measuring the friction of a textbook
Inquiry: What if different objects
were placed under the textbook?
Choose one of the inquiry questions.
• W hat if rollers were placed under the textbook?
DRAFT
• W hat if sand was placed under the textbook?
You will now design your own experiment to answer your inquiry question.
1 Develop a hypothesis for your inquiry.
2 Identify the independent variable you will change in this experiment.
1 Copy Table 1 in your notebook and record your results.
Table 1 Force needed to move a textbook
Object Force needed to make a textbook move (N)
Trial 1Trial 2Trial 3 Average
Textbook
Textbook with a second book on it
Textbook with rollers under it
Textbook with sand under it
2 C onstruct a column graph showing the effect of sand or rollers on the object’s friction.
Discussion
1 C ompare your results with those of others in the class.
2 Describe the best way to reduce friction when moving the textbook.
3 Ex plain if five rollers would be better than two rollers for reducing friction.
4 Ex plain if bigger or smaller rollers would be better for reducing friction.
5 Describe a practical example of rollers being used to reduce friction.
6 Evaluate if fine sand or coarse (largegrained) sand is better for increasing friction.
Conclusion
Describe what you know about how to reduce friction.
Lesson 6.14
Learning intentions and success criteria
Check the next lesson for a linked practical activity or experiment.
DRAFT
A lever decreases the amount of effort needed to lift or move a load
Key ideas
→ A lever is a solid rod with a turning point.
→ Levers provide a mechanical advantage of force or distance.
→ All levers need an effort (force used), fulcrum (turning point) and a load (the section being moved).
→ To calculate mechanical advantage: mechanical advantage =
size of the load size of the effort
→ To calculate the size of an effort: size of the effort =
mechanical advantage size of the load simple machine device that reduces the effort required to perform tasks
→ Levers can be divided into first-class, second-class or third-class levers and is classified depending on the location of the fulcrum.
→ Aboriginal and Torres Strait Islander Peoples used their understanding of levers to create woomeras (spear throwers) of different shapes and sizes so spears could be thrown further and faster.
Introduction
The ancient Egyptians, Romans and Greeks understood forces very well. They made lots of simple machines that helped them to build the pyramids, fight wars and build cities (Figure 1). The simplest machine they used was a lever.
A lever can be used to decrease the amount of effort needed to do work. You use levers every day. Scissors, pliers, brooms, shovels, wheelbarrows and can openers are all levers.
Levers
A lever is a solid rod or bar that is supported at a turning point called a fulcrum. Figure 2 shows the main features of a simple lever, such as a seesaw. The force used to operate a lever is called the effort, and the resisting force it overcomes is called the load. When one person on a see-saw is pulled down towards Earth, the other person is pushed up. The weight of the two people does not need to be equal for this see-saw lever to work. One person can lift a heavier weight by moving further away from the fulcrum in the middle. In fact, a single person 2 m away from the fulcrum can lift two people who are 1 m away from the other side of the fulcrum.


Mechanical advantage
A lever makes it easier for you to lift the load. It gives you an advantage compared to not using the lever. Mechanical advantage is a mathematical way to describe the amount of help you can get using a machine like a lever. The size of the advantage can be calculated by dividing the size of the load by the size of the effort.
lever a simple machine that reduces the effort needed to do work
fulcrum the turning point of a lever effort the force used to operate a lever load (in physics) resisting force
DRAFT
mechanical advantage =
Worked example 6.14A shows how to calculate mechanical advantage. size of the load size of the effort mechanical advantage size of the load
This formula can also be written as size of the load = mechanical advantage × size of the effort or size of the effort =
Figure 1 Ancient Egyptians used round logs and rope to haul large blocks of stone when they built the pyramids.
Fulcrum
Figure 2 (A) A lever has three features: the fulcrum, effort and load. (B) A see-saw is an example of a lever.
force magnifier a device that can increase the amount of force available (for example, to shift something); an example is a lever
Force magnifiers
Levers like see-saws are called force magnifiers. Force magnifiers can change a weak force into a strong force. A crowbar is another example of a force magnifier – it magnifies the effort so that a small effort can lift a heavy rock (the load).

There is a disadvantage to force magnifiers. The effort force of a lever must move a greater distance to move the load a short distance. Worked example 6.14B shows how to calculate effort.
Distance magnifiers
distance magnifier a lever that changes a strong force that acts over a short distance into a weak force that acts over a longer distance
Other levers are distance magnifiers. These levers magnify the distance the load moves. This means that when the effort moves a short distance, the load will move a long distance.
The disadvantage is that the effort force required will need to be larger than the load. An example of this is a tennis racquet. The end of the tennis racquet moves a greater distance (and faster) than the hand holding the racquet.
Worked example 6.14A Calculating mechanical advantage
Calculate the mechanical advantage of a lever that allows an effort of 4 newtons to lift a load of 12 newtons.
Solution
Effort = 4 N, load = 12 N
mechanical advantage =
DRAFT

Worked example 6.14B Calculating effort
Calculate the effort required to lift a box of books (6 newtons) with a lever with a mechanical advantage of 2.
Solution
Load = box of books = 6 N, mechanical advantage = 2
mechanical advantage =
size of the load
size of the effort
size of the load
Size of the effort = = = 3 N
mechanical advantage
6 N 2
T he effort needed is 3 newtons.
Figure 3 A crowbar is a force magnifier.
Figure 4 A tennis racket is an example of a distance magnifier.
Types of levers
There are three types of levers and they are classified according to the position of the fulcrum (turning point).
• First-class lever: the fulcrum is between the effort and the load (EFL) (Figure 5 and Figure 6).
• Second-class lever: the load is between the effort and the fulcrum (ELF) (Figure 7).
• T hird-class lever: the effort is between the load and the fulcrum (LEF) (Figure 8).
Use FLEE to remember the middle position for each type of lever.
• F (Fulcrum) – first-class lever
• L (Load) – second-class lever
• E (Effort) – third-class lever
• E (Easy to remember!)

Figure 5 (A) In a first-class lever, the fulcrum is between the load and the effort. (B) Scissors are an example of a first-class lever. The fingers provide the effort and the load is the object being cut.

Figure 7 (A) In a second-class lever, the load is between the effort and the fulcrum. (B) A wheelbarrow is an example of a second-class lever. The effort is applied to the handles and the load is in the barrow.
first-class lever a lever that has its fulcrum between the point of effort and the load
second-class lever a lever that has its load between the point of effort and the fulcrum
DRAFT

Figure 8 (A) In a third-class lever, the effort is between the load and the fulcrum. (B) A tennis racquet is an example of a third-class lever. When a person uses a tennis racquet to hit a ball, the muscles exerting the effort are between the shoulder (the fulcrum) and the ball (the load).
third-class lever a lever that has its point of effort between the fulcrum and the load

Figure 6 The trebuchet was a powerful machine used to fling objects such as rocks against enemy defences. The long arm holds the load rocks being thrown.
Fulcrum
A B
Fulcrum
E ort
Fulcrum
How Aboriginal and Torres Strait Islander Peoples use levers
Many Aboriginal and Torres Strait Islander Peoples understand the advantage of levers in hunting.
The word “woomera” comes from the Dharug language and refers to a spear thrower that can launch a spear further and with more force and more acceleration than a hunter can by just using their arm (Figure 9).
A spear is fitted into the 50 to 100 c m long woomera (the lever) and held in place with a short peg that connects to the end. The person throwing the spear holds the woomera and swings it over their head, similar to a catapult action. This makes the arm (the lever) longer, moving the spear faster, increasing the speed that the spear leaves the thrower and making the spear more accurate.

Once the spear has left the woomera, the unbalanced forces of air resistance cause the spear to slow down and the force from Earth’s gravity causes the spear to fall.
The type of lever depends on the position of the fulcrum. If the wrist is used to flick the spear, then the wrist is the fulcrum. If the arm and wrist remain straight, and the motion is like a bowler (in cricket), the fulcrum is located between the thrower’s shoulder blades.
Different Aboriginal and Torres Strait Islander Peoples developed different styles and shapes of spear throwers. Longer spear throwers increase the speed of the spear. This increase in speed (speed magnifier) means that more effort force is needed, so the spears used tend to be lighter.
1 Define the term “lever”.
2 Describe how you would identify a firstclass lever.
3 C ompare (the similarities and differences between) a second-class lever and a thirdclass lever.
4 E xamine Figure 10.
a Identify the type of lever that is shown.
b Calculate whether a mass of less than 20 N would lift the load.
Figure 9 A woomera is a lever used by the Dharug people.
c Descr ibe how you would reposition the fulcrum so that a mass much less than 20 N could lift the load.
Apply
5 A c rowbar can be used to move a load (Figure 11).
a Identify the class of lever used.
b Identify whether this class of lever is a force magnifier or a distance magnifier. Justify your answer.

6 Modern cranes use leverage to lift heavy objects (Figure 12).
a Identify where the load for this lever is located.
b Identify where the effort is located.
c Identify where the fulcrum is located.
d Identify the class of lever being used.
e Identify whether this class of lever is a force magnifier or a distance magnifier. Justify your answer.

Experiment: Using a first-class lever to lift masses
Aim
To determine how a first-class lever balances different masses
Materials
• Rounded glue stick
• Blu-Tack ®
• Wooden or metal ruler
• 50 g masses
10 N
Figure 10 A lever
Figure 11 A crowbar moving a load
Figure 12 A modern crane
Method
1 Place the glue stick flat on the desk and hold it in place with Blu-Tack.
2 Place the centre of the ruler over the glue stick so that it forms a simple see-saw or balance.
3 Add three 50 g masses 4 c m from the centre of the fulcrum on one side.
4 Add three 50 g masses to the other side so that the see-saw becomes balanced (both masses are equal height from the desk).
Inquiry:
What if a different weight was placed in a different location?
Choose one of the inquiry questions.
• W hat if a greater mass was placed closer to the fulcrum?
• W hat if greater mass was placed further from the fulcrum?
• W hat if less mass was placed closer to the fulcrum?
Table 1 Using first-class levers to lift weights
Discussion
1 Describe the pattern of masses and position from the fulcrum on both sides of the lever.
2 Define the term “mechanical advantage”.
3 Ca lculate the mechanical advantage of the lever when the single mass on the left-hand side lifts the five masses on the right-hand side.
• W hat if less mass was placed further from the fulcrum? You will now design your own experiment to answer your inquiry question.
1 Develop a hypothesis for your inquiry.
2 Identify the independent variable that you will change from the first method.
3 Identify the dependent variable that you will measure and/or observe.
4 Identify two variables that you will need to control to ensure a reproducible test. Describe how you will control these variables.
5 Develop a method for your experiment.
6 C onstruct a table to record your results.
7 Show your teacher your planning to obtain approval before starting your experiment and recording your results.
Results
Record your results by copying and completing Table 1.
4 Describe another example of a first-class lever that you have used.
Conclusion
Draw and label a first-class lever and describe how to determine its mechanical advantage.
Lesson 6.16
Experiment: Using a second-class lever to lift masses
Aim
To investigate the mechanical advantage of a second-class lever
Materials
• St icky tape
• 2 rulers
• Shoebox
Method
• Cardboard
• M asses
• 2 spring balances
1 Use sticky tape to stick the rulers together in a “V” shape.
2 D ivide the shoebox into two compartments using the cardboard.
3 Attach the box on the top of the rulers so that it looks like a wheelbarrow with front and rear compartments (Figure 1).
4 Add mass to the front compartment of your second-class lever.
5 Use the spring balances on the handles to calculate the total effort needed to lift this mass.
6 Repeat this measurement three times.
Inquiry:
What if the mass was placed further from the fulcrum?
Plan and conduct an experiment that answers the inquiry question.
1 Develop a hypothesis for your inquiry.
2 Identify the independent variable that you will change from the first method.
3 Identify the dependent variable that you will measure and/or observe.
4 Identify two variables that you will need to control to ensure a reproducible test. Describe how you will control these variables.
5 Develop a method for your experiment.
6 C onstruct a table to record your results.
7 Show your teacher your planning for approval before starting your experiment and recording your results.
Results
1 Copy and complete Table 1 to show the effort required when the front of the wheelbarrow is loaded.
Table 1 The effort required when the front of the wheelbarrow is loaded
Figure 1 Experimental set-up
2 Copy and complete Table 2 to show the effort required when the rear of the wheelbarrow is loaded.
Table 2 The effort required when the rear of the wheelbarrow is loaded
Attempt Spring balance 1 Spring balance 2 Total effort
Attempt 1
Attempt 2
Attempt 3
Average
Discussion
1 Ex plain why you repeated each measurement three times.
2 Describe the difference in total effort required when the mass was shifted further from the fulcrum on the second-class lever.
3 Use the data from your experiment to explain the most effective way to load a wheelbarrow.
Conclusion
Learning intentions and success criteria
DRAFT
Describe the mechanical advantage of using a second-class lever.
Lesson 6.17
A pulley changes the size or direction of a force
Key ideas
→ A pulley is a simple machine that makes it easier to lift an object.
→ Pulleys are wheels with a groove along their edge.
→ The more pulleys used, the greater the mechanical advantage.
→ The wheel is used to change the size or direction of the force used.
→ Effort can be calculated using:
Check the next lesson for a linked practical activity or experiment. size of the load mechanical advantage
→ size of the effort =
History of the pulley
Between the fifteenth and seventeenth centuries, a period known as the Age of Discovery, the people of Europe were desperate for spices, gold and silver. Sailors navigated the seas looking for these treasures. They returned with large loads that included food, weapons and sometimes slaves. All this needed to be loaded on and off the ships as quickly as possible. Sailors used a pulley to help do this work.
A pulley is a simple machine that was invented many centuries earlier by the Ancient Greek mathematician Archimedes (c. 287–212 BCE). Pulleys are still used to lift heavy loads on ships (Figure 1).
Types of pulley
A pulley is a rotating wheel that has a groove along its edge to guide a rope or cable (Figure 2). Pulleys can be connected together with a rope to form a pulley system.
The simplest pulley system is made of one pulley. A single-pulley system only changes the direction of the applied force, not the size of the force. As a person pulls down on the rope, the weight on the other end moves up (Figure 2). This does not change the amount of effort needed, but it makes lifting easier. This is because the person can use their weight to help in the lifting. You have probably used this type of pulley when you pull the cord to open a window blind at home (Figure 3).
The mechanical advantage of a pulley system is calculated by the number of ropes between the upper and lower pulleys. In a roller blind, the mechanical advantage is one (the effort is the same as the load).
The more pulleys that are used, the easier it is to lift a load because its mechanical advantage is increased. For example, if two pulleys are used, the system can lift twice the load of a single-pulley system. The mechanical advantage of this system is 2 (Figure 4).
A four-pulley system can magnify the effect of the effort four times. For example, a 25 N effort can lift a 100 N load in a frictionless pulley system. The simple four-pulley system


a simple machine that is made of a wheel and a cord or rope; used to lift heavy loads
pulley
Figure 1 Sailing ships have pulley systems for lifting heavy sails and cargo.
Load
Figure 2 In a pulley system, a rope is guided through the groove of a rotating wheel.
Figure 3 A roller blind uses a single-pulley system. Load
Figure 4 A two-pulley system doubles the mechanical advantage.
block and tackle a group of pulleys mounted together in a frame or block, which provides significant mechanical advantage
shown in Figure 5 not only changes the direction of the applied force, but it also multiplies it by four. Therefore, a four-pulley system has a mechanical advantage of 4.
Groups of pulleys are often mounted together in a frame or “block”. This device is called a block and tackle (Figure 6). A small effort pulling through a long distance lifts a large load through a much smaller distance.
Worked example 6.17A shows how to calculate effort in a pulley system.

Worked example 6.17A Calculating effort
Use the formula below to calculate the effort needed to lift a load of 150 newtons (N) with a frictionless block and tackle with five pulleys.
size of the effort =
size of the load mechanical advantage
Solution
Load = 150 N, mechanical advantage = 5 (5 pulleys)
size of the load mechanical advantage
150 N
5
size of the effort = = = 30 N
The effort needed is 30 N.
Check your learning 6.17
Check your learning 6.17
Comprehend
1 Ex plain why two pulleys are better than one.
2 Describe three examples where single pulleys or pulley systems are used.
3 Describe how pulleys have made loading and sailing huge cargo vessels possible.
Load
Figure 5 A four-pulley system increases the mechanical advantage by a factor of 4.
Figure 6 A block and tackle
Analyse
4 A block and tackle provides a mechanical advantage because it can lift heavy loads. Describe the disadvantages of this system.
5 Identify the correct option. A pulley system can:
a increase force and distance at the same time
Lesson 6.18
b decrease distance while increasing force
c decrease force and distance at the same time.
6 A 100 N mass is used to lift an 800 N mass.
a Calculate how many pulleys are needed to make this possible.
b Calculate the mechanical advantage of this machine.
Experiment: Calculating mechanical advantage
Aim
To see how the number of pulleys affects the size of the effort needed to lift a load and the distance this load travels
Materials
• Spring balance
• 500 g mass
• Sets of pulley systems (one-, two-, threeand four-pulley systems)
• Retort stand
• St ring
Method
1 Use the spring balance to measure the weight of the 500 g mass.
DRAFT
2 Set up a pulley system using one pulley, the retort stand and string as shown in Figure 1. Attach the spring balance.
3 P ull on the spring balance to raise the load by 10 cm.
4 Record multiple readings on the spring balance in newtons (N).
5 Calculate the average reading on the spring balance in newtons (N).
6 Calculate the mechanical advantage of the one-pulley system.
7 Repeat steps 2 to 5 with a two-pulley system.
8 Repeat steps 2 to 5 with a three-pulley system.
9 Repeat steps 2 to 5 with a four-pulley system.
Figure 1 A single-pulley system set up with retort stand and spring balance
Results
1 Copy and complete Table 1.
2 C onstruct a column graph showing the relationship between the number of pulleys and the mechanical advantage.
Table 1 The mechanical advantage of pulley systems
of pulleys
Learning intentions and success criteria
Lesson 6.19
Discussion
1 Describe how adding more pulleys changed the effort needed to lift a load.
2 Compare the distance the effort moves with the distance the load moves.
3 Ca lculate the effort needed to lift 500 N with five pulleys.
4 Ca lculate the effort that is needed to lift a load of 500 N through six pulleys.
Conclusion
Check the next lesson for a linked practical activity or experiment.
DRAFT
Describe how the number of pulleys affects the size of the effort and the distance moved by the load.
There are different types of machines
Key ideas
→ Inclined planes, such as ramps, can provide a mechanical advantage by reducing the effort needed to move the object.
→ A wedge or screw can reduce the effort needed to split or enter an object by changing the direction of the force applied.
→ A wheel and axle is a special lever that turns about a fulcrum.
Introduction
Many different machines have been developed through the centuries that reduce work for us. A “simple machine” is a mechanical device that changes the direction or magnitude of a force.
There are six types of simple machines: levers, pulleys, inclined planes, wedges, screws, wheels and axles.
Inclined planes
An inclined plane makes moving a load easier. The simplest example of an inclined plane is a ramp
A ramp is used to lift heavy objects (the load) up to a higher level. For example, a piano mover might use a ramp to get a piano from the ground onto a truck (Figure 1). Going up a ramp might take longer than taking a single step up, but it requires a lot less force from your legs. Escalators are moving ramps with steps (Figure 2).

Wedges

ramp a sloping surface joining two different levels
A wedge is made up of two incline planes, and it has a thick end and a thin end. When placed in a crack, a wedge can move through the gap and change the direction of a downward force to a sideways force. An axe is a wedge. When an axe is swung down and hits a log, the downward force is changed to a sideways force, which splits the log (Figure 3).
Humans discovered the benefits of wedges when they used the jagged edges of rocks to cut animal flesh and skin. It is more than likely that you have used a wedge today: a knife is a wedge and so are your fingernails. Each tooth in a zipper is a tiny wedge that fits tightly with the adjacent teeth.
Screws
DRAFT

You might be surprised to know that a screw, like a wedge, is also a simple machine that uses an inclined plane. A screw is an inclined plane called a thread that is wound around a cylinder. The thread looks a little like a road (or ramp) spiralling up the side of a mountain.
wedge a piece of wood, metal or other substance that tapers to a thin edge and is driven between two objects or parts of an object to secure or separate them
screw a sharppointed metal object with a spiral thread running along its length and a slotted head
thread the spiral ridge of a screw
Figure 1 A removalist requires a ramp for heavier objects.
Figure 2 An escalator is an example of a ramp.
Figure 3 An axe is an example of a wedge.
wheel and axle a type of lever that can rotate about its centre, magnifying force or distance
Archimedes invented a device that used a hollow pipe with a screw inside it to carry water to the top of a house. Screws can also penetrate materials such as wood or cork by using the turning effect of a force (Figure 4). The effort needed to turn a screw into an object is much less than that required to hammer the screw into the same object.
Wheels and axles
A wheel is a type of lever that turns in circles about its centre – the fulcrum or pivot point. An axle is a rod that usually links the wheel and the load.
DRAFT

If you have used a circular door-knob today, you have used a simple machine made up of a wheel and axle. When you turn a door-knob, you apply a force to the knob (the wheel). The knob turns, rotating the shaft (the axle) that goes into the door, which exerts a force on the load (the latch). The latch moves, allowing the door to open.
A circular door-knob is an example of a wheel and axle being used as a force magnifier. The outside edge of the door-knob (the wheel) is much larger than the shaft (the axle), so even if you apply a relatively weak force to the knob, it exerts a relatively strong force on the shaft. The force has been magnified.
A wheel and axle can also act as a distance magnifier. For example, when you pedal a bike, you apply a force to the pedals (Figure 6). This force causes the wheels, which are much larger, to turn. The distance the wheel travels is much further than the distance the pedals travel. The distance has been magnified. Where the effort force is applied can determine if a wheel and axle magnifies the distance or the force.
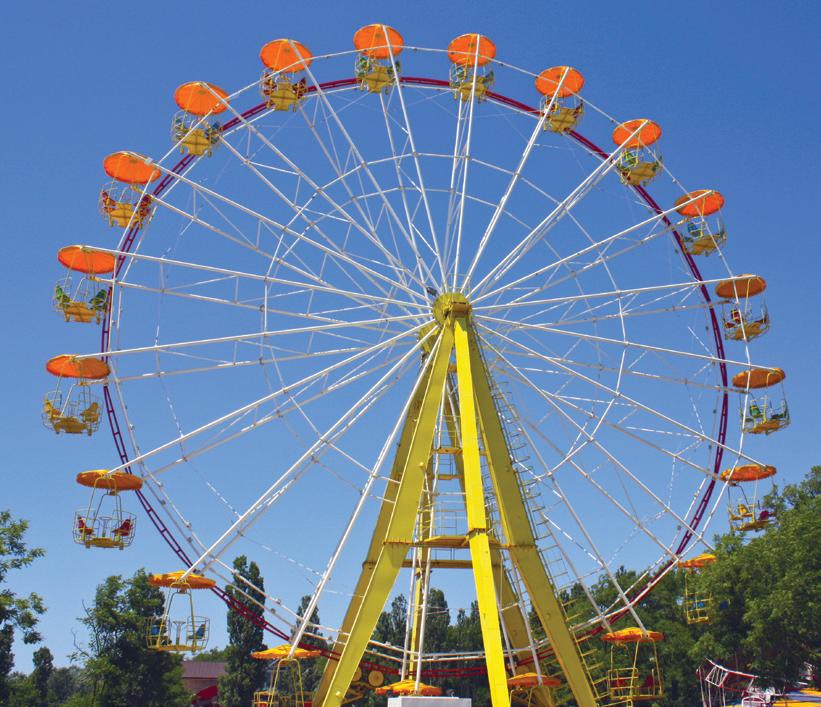

Figure 4 Corkscrews are used to pull the cork out of a bottle.
Figure 5 A Ferris wheel is an example of a wheel and axle.
Figure 6 A bike wheel is an example of a distance magnifier
Check your learning 6.19
Check your learning 6.19
Retrieve
1 Name the six types of simple machines.
2 Identify a circular door-knob as either a force magnifier or a distance magnifier.
Analyse
3 Identify which of the following is not an inclined plane.
A Knife used to cut bread
B Screwdr iver used to turn a screw
C Nail dr iven into a piece of wood
D Spear thr ust into a tree
4 Identify the part of a circular door-knob that is a wheel and the part that is an axle. Draw a labelled diagram to support your answer.
Lesson 6.20
5 Compare (the similarities and differences between) a wedge and a ramp. Apply
6 Discuss how the can opener shown in Figure 7 is acting as a wheel and axle by identifying the effort, load, fulcrum, wheel and axle.

Figure 7 A can opener is an example of a wheel and axle.
Experiment: Comparing different machines
Aim
To determine the force magnification of different machines
DRAFT
Part A: Ramps
Materials
• Box (or pile of books or plastic tub upside down)
• Metre ruler
• Spring balance
• 50 g mass (with a hook to attach to the spring balance)
• R amp (30 c m ruler or a wider or longer piece of thin wood or plastic)
Method
1 Measure and record the height of the box (or pile of books).
2 Using the spring balance, measure and record the force required to carefully lift the 50 g mass vertically at a constant speed on to the top of the box.
3 Repeat step 2 three times and calculate the average force.
4 Position the ramp against the box and measure and record its length.
5 Slowly pull the 50 g mass up the ramp using the spring balance and record the force required.
6 Repeat step 5 three times and calculate the average force.
Discussion
1 Identify the method – lifting or dragging up the ramp – that provided the greatest mechanical advantage. Justify your answer by using data from your experiment.
2 A student claimed an inclined plane is not a machine. Use evidence from the experiment to evaluate the truth of this statement.

Part B: Wedges
Materials
• 2 t hick, tight rubber bands
• 2 blocks of wood
• Wedge-shaped piece of wood
Method
2 Try pulling the blocks apart with your hands.
3 Place the pointed edge of the wedge between the two blocks and push it in.
Discussion
Describe the advantage of using a wedge to separate the two blocks of wood.

DRAFT
1 Place the rubber bands over the two pieces of wood to hold them tightly together.
Part C: Screws
Materials
• 2 matchboxes filled with play-dough
• G -clamp
Method
1 Try crushing the matchbox filled with play-dough using only your fingers. Record your observations.
2 Place the other matchbox filled with play-dough between the faces of the G-clamp and tighten it until it crushes. Record your observations.
Discussion
1 C ontrast the effort needed to crush the matchbox using both methods.
2 Ex plain how the screw mechanism in the G-clamp provides a mechanical advantage in crushing the matchbox.
Figure 1 A pile of books
Figure 2 A wedge

Part D: Wheels and axles
Materials
• Simple machine kit with a wheel-andaxle model or one made from LEGO ® or K’NEX®
• Cotton thread or string
• 2 weights
Method
1 Design and build your own working model of a simple wheel-and-axle machine.
2 Use cotton thread or string and two weights to demonstrate how your model can work as a force magnifier.
3 Modify your model or build another one to demonstrate how it can work as a distance magnifier.
Discussion
1 C ontrast a force magnifier with a distance magnifier.
2 Describe the change you made for the second wheel-and-axle model.
3 Ex plain how the change affected the effectiveness of the second model compared with the first model.

Figure 3 A G-clamp
Figure 4 A wheel and axle
Oxford University Press
thrust force that pushes an object in the direction of motion; force produced by engines
drag force that acts in the opposite direction to an object moving through water or air
weight a measure of the gravitational pull on an object and is the same as the force of gravity on Earth
Lesson 6.21
Science as a human endeavour: The forces in flight
Introduction
Have you ever seen or flown in an airplane? When you consider that it is a large metal tube weighing several tonnes which is moving through the air, you realise there must be some amazing forces involved. You can apply the forces you have learnt about in this module to understand how the wings of a plane keeps the plane (and the people inside it) in the air.
DRAFT
lift force that pushes an object up when it moves through water or air
There are four main forces involved in flying: lift, thrust, drag and weight (Figure 1).

The thrust is the force produced by the engines of the plane. The thrust may come from a propeller, a jet engine or a rocket. All of these engines pull in air and push it out the other end. This propels the plane forward.
The drag is the force caused by the friction of air moving out of the way of the plane. It acts in the opposite direction of the thrust force and tends to slow the plane down.
The weight is the force caused by gravity pulling the plane to the centre of Earth. The greater the mass of the plane, the greater the force caused by gravity.
Faster airflow above = lower air pressure
2
The lift is the force that holds the wings of the plane in the air. The lift force is generated when the plane moves forward and the air moves over the wings. The shape of the wings encourages the air to move up. This decreases the pressure of the air above the wing and reduces the forces pushing down. This makes it easier for the wing to move upwards. The air under the wing pushes up against the surface of the wing generating a lift force (Figure 2).
Lower airflow below = higher air pressure
and low pressure above the wing. This creates the lift force.
Figure 1 The four forces involve in flying a plane are lift, thrust, drag and weight.
Airflow Wing
Figure
The shape of the wing generates high pressure under the wing
When the lift and weight forces are balanced, the plane is able to stay in the air. When the forward thrust from the engine decreases, the air flow will slow down and reduce the lift on the wings. The weight of the plane does not change, so there will be unbalanced forces between the larger weight force and the smaller lift force. The plane will start moving down towards Earth.
Boomerang flight
One of the unique tools of Aboriginal and Torres Strait Islander Peoples is the boomerang. Its unique way of flying was researched by David Unaipon, a Ngarrindjeri man from Coorong region of South Australia. You may recognise him from the Australian $50 note. As well as being the inventor of the modern method for shearing sheep, Unaipon was the first person to describe the forces involved in the movement of a boomerang. In 1914 he developed the idea of a “vertical lift flying machine” based on his understanding of boomerang flight.
The shape of a boomerang is similar to two plane wings joined together at an angle (Figure 3). The top surface of the boomerang generates low pressure, while the bottom surface of the boomerang generates high pressure. These combine to generate lift that keeps the boomerang in the air.
When the return boomerang is thrown correctly, it will fly vertically. As it rotates, one end of the wing-shaped boomerang will be moving forward, while the other wing-shaped end will be rotating backwards. This means there are different air pressures generating lift and causing the the boomerang to gradually turn and fly back to its original position. The boomerang flies vertical or upright with this balance of changing air pressures.
Understanding how and why a boomerang flies meant that Aboriginal and Torres Strait Islander Peoples have been able to develop many types of boomerangs that fulfill different functions. Not all boomerangs are designed to return. Some were designed for hunting animals, while others were designed to generate noise to scare birds into flying into the air where they could be caught with a net or spear.
Test your skills and capabilities
Using infographics
Presenting data to an audience can take many forms. An increasingly common way to present important information is an infographic. Infographics are visual ways to present data so that the viewer can easily see trends and patterns. Information can be communicated using graphs, images and figures.
DRAFT

Select two of the sets of data in Figure 5 and Table 1 and develop an infographic that convinces your peers that flying in airplanes has become safer in the last 50 years.

Figure 3 A boomerang has a unique shape, similar to the wings of an airplane.
Figure 4 Bicycle safety infographic
1 Identify the key information in the set of data. For example, how many airplane crashes were there in 1972? How many crashes were there in 2020? When is the most dangerous part of the flight? Can you explain why?
2 P ropose one possible reason why fewer accidents occur now.
3 D raw a picture that represents an airplane accident. Draw three different variations of the picture to represent more or fewer accidents.
4 I nfographics use short phrases or sentences to pass on the key information. Decide the important information that you want people to remember and write it in a short phrase or sentence.
Figure 5 Airliner accident fatalities by year from 1972 to 2020
Table 1 Fatal accidents and onboard fatalities by phase of flight (2008 to 2017)
Lesson 6.22
Experiment: Comparing the forces in flight
Aim
To model and compare the forces involved in flight
Part A: Lift
Materials
• A strip of paper (3 c m × 15 c m)
Method
1 Use your thumb and index finger to hold one of the short ends of the paper strip under your bottom lip so that it flows forward from your face (Figure 1). The far end of the paper should hang down in a curve from your face. Make sure that your finger is not in front of your lip.
2 G ently blow across the top of the paper.
Discussion
1 Describe the action of the lift force on the far end of the paper.
2 Use your knowledge of the wings of a plane to explain why the lift force was generated.

Part B: Weight
Materials
• A l ight ping pong ball
• A dense golf ball
Method
DRAFT
1 Hold both identically sized balls at the same height from the ground (Figure 2).
2 G ently let go of both balls at the same time and observe the time it takes for the balls to hit the ground.
Discussion
1 C ompare the mass of each ball.
2 Describe how each ball was affected by gravity by comparing the time it took for the balls to hit the ground.

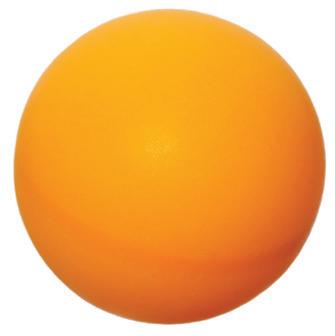
Part C: Drag
Materials
• A strip of paper (3 c m × 15 c m)
• A dense golf ball
Method
1 Hold both the strip of paper and the golf ball at the same height from the ground.
2 G ently let go of the ball and the paper at the same time and observe the time it takes for them to hit the ground.
Figure 1 Hold the strip of paper under your bottom lip
Figure 2 A golf ball and a ping pong ball
3 Scrunch the paper strip into a ball and repeat step 2 (Figure 3).
Discussion
1 Describe the shape of the two objects.
2 Describe how each object was affected by air resistance by describing the time it took for them to hit the ground.

Part D: Thrust
Materials
• A6 paper ( of A4 paper )
• Scissors
• Paper clip
Method
1 Cut out the pattern of a paper helicopter shown in Figure 4.
2 Follow the instructions in Figure 4 to fold the paper into the paper helicopter shape.
3 C lip the paper clip to the bottom of the base of the paper helicopter.
4 Hold the paper helicopter at a height above your head and give it a quick twist as you drop it.
Discussion
1 Describe how the paper helicopter moved as it was dropped.
2 Compare the motion of the paper helicopter and the paper in Part C.
4. Fold propeller blades outward. 5. Test fly by dropping from a height above your head.
Figure 3 A scrunched up ball of paper
3. Fold C up.
1. Cut on the solid black lines. Fold on the dashed lines.
A B C Paper helicopter pattern
2. Fold A and B to the middle.
Figure 4 Making a paper helicopter
Lesson 6.23
Science as a human endeavour: Forces are involved in sport
Introduction
Many athletes dream of winning Olympic gold medals. They train for long periods, control what they eat and make sure they have the best equipment available. Having a good understanding of the forces involved in their sport can give athletes an advantage over their competitors.
Forces in swimming
Swimmers must have a good understanding of how the water moves around them to maximise their speed. First, they must control how they dive into the water. Breaking the water’s surface creates friction and can slow them down. A swimmer must make sure that their whole body enters the water at the place where their hands originally broke the surface.
Many swimmers shave all their body hair before a big competition. A smooth surface allows the water to move along their body with less friction.
The swimmer’s position in the water is important. If the body is straight, the water moves along without interruption. If the legs hang down, the moving water must change direction. This creates more friction and slows the swimmer down.
In 2010 Fédération Internationale de Natation (FINA), the international governing body of swimming, banned the use of full-body smart suits (Figure 1). These suits were designed by scientists to reduce the friction between the swimmer and the water. The suits were made of a material that mimicked the small scales on a shark. This material repelled the water rather than absorbing it, making it lighter for the swimmer to wear. It also reduced the friction between the swimmer and the water. The suits were also designed to be very tight with smooth seams. This helped the swimmer to be more streamlined in the water.
Many world records were broken when this smart suit was first used, but FINA decided that it gave an unfair advantage to the countries that could afford this expensive technology. New rules were made that limited the type of swimming costumes that could be worn in high-level swimming competitions.
DRAFT

Figure 1 Smart suits provide an advantage to the swimmer by reducing friction. They have been banned at major swimming competitions.
Forces in tennis
The human arm acts as a third-class lever for which the shoulder is the fulcrum, the muscle attached to the middle of the upper arm provides the effort and the load is usually near the hand. A tennis racquet acts as an extension of the player’s arm. This increases the distance between the load (where the tennis ball hits) and the fulcrum (the shoulder) (Figure 2).

DRAFT
Third-class levers are speed multipliers as well as distance multipliers. When a player hits the tennis ball with a racquet, the speed of the ball is increased. If the tennis player’s arm is bent, the end of the racquet is travelling more slowly, and therefore the ball will rebound more slowly.
Tennis players will often have longer tennis racquets, not to increase their ability to reach for the ball, but to increase the speed at which they can hit the ball.
Forces in golf
The benefit of a dimpled surface on a golf ball is now widely known. However, golf balls originally had smooth surfaces. When golfers noticed that their old and battered golf balls flew further than the newer, smoother balls, a group of scientists investigated why this occurred.
The dents and bumps in an old golf ball cause the layer of air next to the ball to stay close to the ball, moving in an organised way over the surface (Figure 3). This decreases the overall air resistance of the ball moving through the air, making it fly further. As a result, a golf manufacturer started making the “pre-dented” golf balls that you see today.
Figure 2 Tennis racquets increase the distance between the load and the fulcrum.
Figure
Test your skills and capabilities
Ethics in sport
You may have heard the saying “Winning isn’t everything”. This is an example of the ethics in sport, otherwise known as “fair play”. The main goals in an ethical sports competition are fairness, responsibility and respect.
• Fairness: All participants follow the same rules, and no one is discriminated against on the basis of race, gender or income.
• Responsibility: All participants take responsibility for knowing the rules and regulations, and the way they behave (including their performance and emotions).
• Respect: All participants show respect for other participants. Choose an example of sports technology and discuss how an inappropriate use of the technology could affect the “fair play” of the sport.
1 Describe the ethical problem.
2 Identify the arguments for the use of the technology.
3 Identify the arguments against the use of the technology.
4 Describe who would be affected if the technology was used.
5 Identify your own bias (an opinion you might already have due to your past experiences).
6 Identify if using the technology could lead to other changes in the future that would be unethical.
7 Describe all the possible decisions that you could make.
8 M ake a decision and describe why you made your decision.
Lesson 6.24
Review: Forces
Summary
Lesson 6.1 A force is a push, a pull or a twist
• A force is a push or pull that happens when two objects interact.
• A spring balance can be used to measure the size of a force.
• A force diagram is a representation of all the forces acting on an object.
• T he force of gravity affects the movement of objects on Earth.
Lesson 6.3 An unbalanced force causes change
• Forces are balanced when they are pushing or pulling equally in opposite directions.
• Forces are unbalanced when forces from one direction are larger than forces from other directions.
• I f the forces on an object are unbalanced, then the object will change its speed, direction or shape.
• Net force can be calculated by added or subtracting forces.
Lesson 6.4 Forces can be contact or non-contact
• Contact forces involve two objects touching each other.
• Non-contact forces occur when one object is able to push or pull another without touching the other.
• Magnetism is an example of a non-contact force.
• M agnets have a north and south pole. If two north or south poles are placed near each other, they will repel. If a north and south pole are placed near each other, they will attract.
• T he magnetic north and south pole has occasionally flipped throughout Earth’s history.
• A magnetic field is the area around a magnet where a magnetic force is experienced.
DRAFT
• Domains create a magnetic force.
Lesson 6.5 Magnetic fields can apply a force from a distance
• T he Earth has a magnetic field around it due to its magnetic north and south pole (which is different to the geographic North and South Pole).
• A magnetic field cannot be seen, but we can see the way it interacts with other objects.
• T he further away an object moves from the magnet, the weaker the magnetic field.
• A nimals can use the Earth’s magnetic field to navigate back to their breeding grounds.
Lesson 6.6 Electrostatic forces are non-contact forces
• Rubbing two objects together can cause an electrostatic force due to the build up of electrical charge.
• L ike (two positive or two negative) charges repel.
• Unlike charges attract.
• C harged objects attract uncharged objects.
• A Van de Graaff generator is a machine that is able to create a large electrostatic force with visible sparks seen.
• You can experience electrostatic forces in everyday life, such as creating a little electric shock when you touch the metal frame of a trampoline after jumping on it.
Lesson 6.8 Earth’s force of gravity pulls objects to the centre of Earth
• E arth’s force of gravity can cause a non-contact force.
• L arge objects (such as planets, moons and stars) pull objects towards their centre.
• I n physics, there is a difference between the definitions of mass and weight.
• M ass is measured in kilograms and is how many particles or atoms makes up the object.
• Weight is a measure of the pull force on an object and can be calculated using: weight = mass × gravity.
• T he units of weight is in Newtons (N).
• On Earth, the pull of gravity is lower the higher up you are.
Lesson 6.11 Gravity affects all objects in space
• E arth’s gravity constantly pulls the Moon towards its centre, resulting in its orbit around Earth.
• A planet’s gravity causes moons to orbit it.
• A star’s gravity causes planets to orbit.
• A black hole’s gravity causes galaxies to orbit and prevents light from escaping.
Lesson 6.12 Friction slows down moving objects
• Friction is a contact force.
• Friction (such as air resistance) slows down moving objects.
• Friction can be reduced by streamlining, using lubricants or ball bearings.
Lesson 6.14 A lever decreases the amount of effort needed to lift or move a load
• A lever is a solid rod with a turning point.
• L evers provide a mechanical advantage of force or distance.
• A ll levers need an effort (force used), fulcrum (turning point) and a load (the section being moved).
• To calculate mechanical advantage: mechanical advantage =
size of the load size of the effort
• To calculate the size of an effort: size of the effort =
mechanical advantage size of the load
• L evers can be divided into first-class, secondclass or third-class levers and is classified depending on the location of the fulcrum.
• Aboriginal and Torres Strait Islander Peoples used their understanding of levers to create woomeras (spear throwers) of different shapes and sizes so spears could be thrown further and faster.
Lesson 6.17 A pulley changes the size or direction of a force
• A pulley is a simple machine that makes it easier to lift an object.
DRAFT
• P ulleys are wheels with a groove along their edge.
• T he more pulleys used, the greater the mechanical advantage.
• T he wheel is used to change the size or direction of the force used.
• E ffort can be calculated using: size of the effort =
size of the load mechanical advantage
Lesson 6.19 There are different types of machines
• I nclined planes, such as ramps, can provide a mechanical advantage by reducing the effort needed to move the object.
• A wedge or screw can reduce the effort needed to split or enter an object by changing the direction of the force applied.
• A wheel and axle is a special lever that turns about a fulcrum.
Review questions 6.24
Review questions
Retrieve
1 Identify which of the following is an example of a pull force.
A K icking a soccer ball
B D iving into a swimming pool
C D ragging a box towards you
D P ushing a shopping trolley
2 Identify the scenario that demonstrates balanced forces.
A A ball flying through the air after it was thrown
B A book sitting on a table, not moving
C A piece of modelling clay being moulded into a different shape
D A car slowing down for a stop sign
3 Recall what will happen if the north poles of two magnets are pushed together.
A T hey will repel.
B T hey will attract.
C T hey will remain where they are.
D T hey will move sideways.
4 Recall why a person jumping on a trampoline may have their hair standing out from their head.
Comprehend
5 D raw a force diagram of a bike rider moving forward. Include the following forces on your diagram (peddling force of 400 N, air resistance 50 N, tyre resistance 50 N, weight 750 N).
6 Copy and complete the following sentences.
a A force is a ________ or a ________ between ________ objects.
7 Identify which of the following examples involve forces. Explain the forces involved.
a O pening a window
b Turning a screw with a screwdriver
c Smelling food cooking
d Modelling clay
e Standing on a diving board
f Watching a candle burn
DRAFT
b To measure a force, you can use a ________ ________.
c T he unit used to measure forces is called a ________. Its symbol is ________.
d W hen an object is not moving, its forces are said to be ________. Evidence of an unbalanced force is a change in ________, ________ or ________.
8 Ex plain how mechanical advantage is calculated.
9 Your mass at a given time remains the same, regardless of the force of gravity. Your weight, however, changes as a result of the force of gravity.
a Ex plain why the mass of any object is not changed by the force of gravity.
b Ex plain why the weight of an object sometimes changes.
10 Describe what happens to the magnetic properties of a magnet when it is broken into two.
11 Ex plain how a compass can detect the direction of Earth’s magnetic north pole.
12 Ex plain the following in terms of friction.
a Gymnasts put chalk on their hands.
b People driving cars on ice or snow put chains on their tyres.
c A car uses more petrol when it has a load on the roof.
d It is hard for a person to run on ice.
e Swimsuits are designed for competition.
13 Ex plain what a first-class lever is and provide an example of one.
Fulcrum
Figure 1 A first-class lever
14 Ex plain what a second-class lever is and provide an example of one.
Load E ort
Fulcrum
Figure 2 A second-class lever
15 Ex plain what a third-class lever is and provide an example of one.
Load E ort
Fulcrum
Figure 3 A third-class lever
16 De scribe the four main forces involved in flying. Draw a force diagram to represent these forces. Use the size of the arrows to show the plane moving forwards at a constant speed.
17 W hen skydivers step out of an airplane, they begin to fall towards Earth. Describe the forces acting on the skydivers. Draw a force diagram of these forces. Use the size of the arrows to show that the skydiver is falling.
18 Describe how each of the following is affected by the force of gravity.
a T he Moon orbiting Earth
b T he Earth orbiting the Sun
c Stars travelling together in a galaxy
Analyse
19 Consider the pulley system in Figure 4. Calculate the effort needed to lift the 100 N load.
20 C ompare a contact force and a non-contact force.
21 Compare a lever and a pulley.
Apply
22 Figure 5 shows what happens when you stand on your toes.
a Identify the type of lever that is formed by the foot when you do this.
b Discuss why this lever is a force magnifier.

Pull 2 m of rope
100 N
Figure 4 A pulley system
Figure 5 Standing on your toes
23 Investigate the kicking action of a soccer player.
a D raw a picture of a leg kicking a ball. On your diagram, identify which of the muscles are involved in moving the foot.
b Identify the class of lever that is formed by the muscle and bone attachments.
c Identify the lever as a force magnifier or a distance magnifier.
d Use your understanding of levers to describe coaching advice that would improve a soccer player’s kick.
24 T hink about how far a toy car and a marble would roll along a flat bench. Determine which has the least friction and which rolls the furthest. Discuss how friction can be minimised.
25 I nvestigate the action of an Olympic shot-putter.
a Ex plain why the athlete bends backward just before releasing the shot.
b Identify the class of lever that is formed by the upper torso.
c Identify as many levers acting as possible. Label each lever as first, second or third class.
26 Discuss how the motion of an airplane will change (rise, fall, slow or accelerate) when:
a l ift becomes greater than weight
b d rag becomes greater than thrust
c weight becomes greater than lift
d t hrust becomes greater than drag.
Social and ethical thinking
27 Understanding the forces involved in a flying airplane means that we can modify the design of the airplane to make it more efficient.
a Describe how streamlining will affect the amount of fuel used to generate thrust force.
Critical and creative thinking
Streamlining
DRAFT
28 Suppose Matilda fills her car with petrol and drives 100 km along a freeway. She then turns off the freeway and travels 100 km along country roads.
a Determine which part of the trip would use more petrol.
b Justify your answer using your knowledge of forces and friction.
b Use the information in question a to infer how the environment could benefit from understanding the forces involved in flight.
c Describe how using less fuel could affect the cost (the economics) of people flying in an airplane.
d Use the information in question c to discuss how using less fuel could affect people’s ability to maintain contact with their friends and family (social factors).
29 Design an infographic poster that encourages people to wear their seatbelt when in a car. Use your knowledge of forces to illustrate the dangers of not wearing a seatbelt when in an accident.
Research
30 C hoose one of the following topics on which to conduct further research. Present your findings in a format that best fits the information you have found and the understandings you have formed.
Faster airflow above = lower air pressure
Lower airflow below = higher air pressure
Wing
Figure 6
makes airplanes more efficient.
Musical instruments
Musical instruments often use simple machines to make it easier for the musician to play. Different types of machines are used in a piano, drum kits, the keys of a string instrument and brass instruments. Select one of these instruments and consider the following questions.
• Describe the machine you have identified.
• Describe how the musician uses the machine.
• Describe how the machine makes it easier for the musician playing the instrument.

Spear throwers
Investigate spear throwers that are used in different parts of Australia.
• Identify what the spear throwers are made from.
Careers with space
Astronauts are people who work outside Earth’s atmosphere. Not all astronauts are pilots. Some are flight specialists, flight engineers, botanists, computer specialists or payload specialists.
• I nvestigate one of the careers involved in space programs around the world.
• Describe the types of qualifications you need to work in this area.
DRAFT
• Identify the different names of the spear throwers and in which parts of Australia they are usually produced.
• Describe the different shapes of each spear thrower.
• Describe how the spear throwers are used.
• Use your understanding of forces and machines to describe how a spear thrower works.
• Describe the types of things you would do in an average day.
• Describe the most challenging part of your job.

• Ex plain why you should seek permission to enter ceremonial grounds to study how a spear thrower works.

Figure 7 Levers are part of piano keys.
Figure 8 Becoming an astronaut is just one career available in the space industry.
Figure 9 A spear thrower is used to launch spears further and faster.
Oxford University Press
Module 7 Particle theory

Overview
DRAFT
Everything around us is made of tiny moving particles. Scientists use the particle and kinetic theory of matter to explain how the particles are arranged and move in different substances. These theories help us understand properties like melting and boiling points, density and diffusion. We can use these theories to model how the movement of particles in solids, liquids and gases changes when they are heated or cooled.

DRAFT
Lessons in this module:
Lesson 7.1 There are three states of matter (page 302)
Lesson 7.2 Experiment: Comparing states of matter (page 307)
Lesson 7.3 Scientists’ understanding of matter has developed over thousands of years (page 308)
Lesson 7.4 The particle theory explains matter (page 311)
Lesson 7.5 The particle theory can explain the properties of matter (page 315)
Lesson 7.6 Experiment: The density den (page 318)
Lesson 7.7 Increasing kinetic energy in matter causes it to expand (page 322)
Lesson 7.8 Experiment: Effect of heat (page 325)
Lesson 7.9 Experiment: From ice to steam (page 328)
Lesson 7.10 Science as a human endeavour: Scientists find ways to communicate (page 330)
Lesson 7.11 Review: Particle theory (page 333)
Learning intentions and success criteria
Lesson 7.1
There are three states of
matter
Key ideas
→ All things are made of matter.
→ There are three major states of matter: solid, liquid and gas.
→ Many substances can be found in more than one state.
→ A substance in one state can be changed into another by applying heat or freezing it.
Check the next lesson for a linked practical activity or experiment.
matter anything that has space and volume; matter is made up of atoms states of matter one of the forms in which matter can exist, e.g. solid, liquid or gas
solid a state of matter that has a fixed volume and a fixed shape
liquid a state of matter that has a fixed volume but does not have a fixed shape
gas a state of matter that does not have a fixed volume or a fixed shape
DRAFT
→ Substances in a liquid state can evaporate, so techniques are used to prevent this from happening.
→ The physical property of a substance is what we can observe and measure without changing the substance into something else.
→ The chemical property of a substance is what it does in a chemical reaction.
Solids, liquids and gases
Everything is made of matter and this matter exists in different states. Water is a common substance that we experience in different states of matter. Solid water is called ice (Figure 1), we drink and wash with liquid water (Figure 2), and the gas form of water is known as water vapour (Figure 3). Occasionally we see a fog, clouds or mist in the air. This steam-like substance is actually very small drops of water mixed with the air.

Figure 1 Solid water When heat is removed from liquid water, the movement of the water slows until it freezes. The water has been solidified. This is the solid form of water called ice. Like all solids, ice holds its shape even when it is tipped from a container.

Figure 2 Liquid water When most of us think of water, we think of the liquid form that comes out of our taps. Liquid water sits at the bottom of cups and flows smoothly over surfaces. Water can fit into containers of all shapes and sizes. It is flexible.

Figure 3 Gas water When heat is added to liquid water, the water starts to move faster. Eventually it becomes a gas called water vapour. The gas has much more energy than a liquid or solid. It does not sit at the bottom of a container. Instead, it moves freely around the whole container.
All of these different states of water are made of the same “building blocks” or water particles.
Although the ocean and iceberg shown in Figure 4 may look and behave very differently, they are both different forms of water. The ocean is liquid water, and the iceberg is solid water. There is also water vapour in the air.
Often, substances can be described as just one state. However, some substances contain more than one state of matter, like the solid and gas of honeycomb (Figure 5).


Sometimes we can see all the states in the one mixture – like in the glass of iced soda water in Figure 6 – and sometimes it can be difficult to tell the state of a mixture. For example, would you classify slime or jelly (Figure 7) as a solid, a liquid or a gas?

DRAFT
Change of state
Ice = solid

Drink = liquid
Bubbles = gas (carbon dioxide)
Figure 6 A glass of iced soda water contains the three states of matter: solid, liquid and gas.
The minimum temperature required to melt a solid into a liquid is called its melting point. Any substance above its melting point will be a liquid (or a gas), and any substance below its melting point will be a solid.
melting point the temperature at which a solid becomes a liquid
Figure 4 Solid water (ice) floats on liquid water.
Figure 5 Honeycomb is a combination of solid and gas.
Figure 7 Is jelly a solid, a liquid or a gas?
evaporation a change in state from liquid to gas; also a technique used to separate dissolved solids from water boiling point the temperature at which a liquid boils and becomes a gas
condensation a change in state from gas to liquid
The process of liquid water becoming a gas (water vapour) is called evaporation. Each substance has a different temperature that causes gas to form. This temperature is called the boiling point (Figure 8).
If heat is removed from the water vapour, the gaseous water slows its movement until it once again forms liquid water. This process is called condensation (Figure 9).


sublimation change in state from solid to gas, with no liquid state in between
Figure 10 shows how the state of water changes when heat is added and removed. Sometimes a solid will not melt into a liquid. Instead, it moves from a solid to a gas. This process is called sublimation. Dry ice (solid carbon dioxide) is an example of sublimation as does not change to a liquid. Instead it “stays dry” and immediately becomes a gas.
Melting point is the temperature at which a solid changes to a liquid (melting).


Boiling point is the temperature at which a liquid changes to a gas (evaporation).

Solidification (or freezing) is when a liquid changes to a solid. Condensation occurs when a gas changes to a liquid.
Figure 8 A kettle boils liquid water.
Figure 9 You can sometimes see condensation when you breathe out on a cold morning. The water vapour in your breath becomes a fine liquid when it hits the cold air, making what is commonly called “dragon breath”.
Figure 10 Adding or removing heat energy can change the state of water.
Preventing evaporation
Understanding how water evaporates (changes from liquid to gas) becomes very important when you live in a hot and dry climate like in parts of Australia. Bright sunshine, high temperatures and wind will all cause waterholes to quickly dry up. Before Europeans colonised Australia, Aboriginal and Torres Strait Islander Peoples would cover the waterholes in rocks to prevent evaporation.
If water was found in clay, Aboriginal and Torres Strait Islander Peoples would make the hole deeper, but not wider, so that more water could be stored without increasing the evaporation from the water surface. The Yankunytjatjara Peoples in the Everard Range region of South Australia would also prevent evaporation by adding sand to their local waterholes. The water particles were able to “hide” between the sand grains, preventing evaporation. When it was time to collect the water, a hole was made in the centre of the sand so that the fresh water could drain into a puddle.
Describing matter
The properties of a substance are the characteristics that make it unique. Solids, liquids and gases have unique properties.
• Solids do not change their shape easily and cannot be compressed.
• L iquids cannot be compressed, but they can change their shape to fit the container holding them.
• G ases completely fill the container holding them and can be compressed into a smaller space.
Some substances are important to us because of particular properties. For example, one property of water is that it can be used to dissolve (mix with) many other substances. This makes water useful for cleaning clothes, cooking and experiments in a chemistry laboratory.
The properties of substances can be divided into two groups:
• P hysical properties are what we can observe and measure without changing the substance into something else. Examples of physical properties are colour, texture, boiling point, reversible state changes, density and how much heat it can store (heat capacity). Table 1 lists the physical properties of water.
• C hemical properties are what a substance does in a chemical reaction. Examples include bubbling, permanent colour change and irreversible change of state.
physical property a property of a substance that can be measured or observed without changing the substance into something else; examples are colour and boiling point chemical property how a substance behaves in a chemical reaction, such as how it reacts with an acid
Table 1 Physical properties of water
Check your learning 7.1
Check your learning 7.1
Retrieve
1 Identify the properties of:
a solids
b liquids
c gases
2 Use the information in Table 2 to identify which substance has the:
a lowest melting point
b highest melting point
c lowest boiling point
d highest boiling point.
Table 2 Melting and boiling points
Analyse
7 Compare (the similarities and differences between) the processes of melting and boiling.
8 C ontrast (the differences between) the physical and chemical properties of a substance.
9 C ategorise the following substances as a solid, liquid or a gas (or a combination of states).
a Ice cream
b C hocolate bar
c C louds
d T hick smoke
e Glass
f Honey
g Cake or bread
h M ashed potato
i Paper
j Peanut butter (smooth)
k C ling wrap
l Play-dough
m Sand
n Team
o Slime
3 Select a common substance, such as cling wrap or vinegar. Name some of the physical properties of this substance.
Comprehend
4 Describe what happens to water when it:
a evaporates
DRAFT
b condenses
c freezes
5 Ex plain what is meant by a “property” of a substance.
6 Ex plain why the properties of matter are so important to us.
10 C lassify which one or more of the following properties is a physical property of a material.
a The ability to be hammered into flat sheets (malleability)
b C hanging colour in a chemical reaction
c T he boiling point
11 Identify what would happen to liquid water when heat is applied.
Apply
12 A student claimed a frozen drink bottle was leaking because condensation had formed on the outside of the container. Explain why the student is incorrect by describing where the condensed water came from.
Lesson 7.2 Experiment: Comparing states of matter
Aim
To investigate the characteristics of solids, liquids and gases
Materials
• Clamp
• 250 mL beaker
• Water
• Food colouring
• T hree different-shaped containers
• Plastic syringe
• Rubber stopper
• 100 mL beaker
• E lectronic balance
• Balloon
• Balloon pump
Method
1 Copy Table 1 into your notebook and complete it as you work through the method.
2 E xamine the clamp and record its mass, shape, ability to be compressed and other characteristics you observe in the table.
3 Add 100 mL of water to the 250 mL beaker. Add two drops of food colouring and mix carefully.
4 Pour the coloured water into the three different-shaped containers. Record what happens to the shape of the water in each of the containers.
5 H alf-fill the syringe with water. Hold the end of the syringe upward (plunger at the base) and gently push the plunger until all the air is removed from the syringe. Place the rubber stopper on the bench and push the end of the syringe against it, as shown in Figure 1. Make sure that the syringe is well sealed before compressing it. Record whether water can be compressed (that is, made to take up less volume).
6 Set the empty 100 mL beaker on the electronic balance and press the “TARE” button. Pour in the water from the syringe and measure the mass of the water. Record the results in the table.
7 Draw the syringe full of air and invert the syringe onto the rubber stopper. Compress the syringe. Record whether air can be compressed and takes the shape of the syringe.
8 Record the mass of the empty balloon and then use the balloon pump to blow it up. Record whether the air takes the shape of the balloon. Tie off the end and weigh the balloon again, this time with air in it. Subtract the mass of the empty balloon from that of the blown-up balloon to calculate the mass of the air inside the balloon (mass of blown balloon – mass of empty balloon).


Figure 1 Testing the compressibility of air (A) before and (B) after depressing the plunger on the syringe. A
Results
Complete Table 1.
Table 1 Comparing states of matter
Matter State of matter Mass (g)
Clamp Solid Water Liquid Air Gas
Discussion
Able to take shape of container?
Able to be compressed?
Other characteristics observed
1 Identify which substances had a measurable mass.
2 Identify which substances were able to change their shape to match the container shape.
DRAFT
3 Identify which state of matter can be compressed into a smaller space. Describe how it changed.
Conclusion
Describe the properties of each state of matter (solid, liquid and gas) in a short paragraph.
Lesson 7.3
Scientists’ understanding of matter has developed over thousands of years
Key ideas
→ Science involves developing a hypothesis, testing it with a reproducible experiment and modifying ideas.
→ The particle theory of matter has been tested and refined by scientists for more than 2,000 years. Learning intentions and success criteria
Introduction
Scientists have been investigating and proposing ideas about particles for thousands of years. When an idea becomes supported by the current evidence, it becomes a theory
Democritus
Over 2,400 years ago, Democritus (c. 460–370 BCE) (Figure 1), a Greek philosopher, put forward the idea that all matter is made up of particles. He proposed that if you were to cut up these particles into smaller and smaller pieces, you would eventually have tiny particles that could not be divided any more. Democritus called these particles atomos, which is Greek for “indivisible”. This is the origin of the word atom
John Dalton
It was not until more than 2,000 years later, in the early 1800s, that Englishman John Dalton (1766–1844) (Figure 2) developed Democritus’ idea further. Dalton’s ideas were based on the results of experiments performed by many earlier chemists. Dalton studied these results and proposed a model to explain them. His model was that matter is made of particles.
Dalton’s ideas were:
• A ll matter consists of tiny particles called atoms.
• Atoms cannot be created or destroyed and are indivisible.
• A ll atoms of the same element are identical, but they are different from atoms of other elements.
• W hen atoms combine to form compounds, each atom keeps its identity.
• Atoms combine to form compounds called molecules in simple whole-number ratios. For example, hydrogen and oxygen combine in a ratio of 2:1 to form water, which is written as H 2O.


particle small piece of matter; also called an atom
theory an explanation of a part of the natural world that is supported by a large body of evidence
atom the smallest particle that forms the building blocks of matter; the smallest particle that retains the properties of an element
element a pure substance made up of only one type of atom
compound a substance made up of two or more types of atoms bonded together
molecule a group of two or more atoms bonded together, such as a water molecule
Figure 1 Democritus proposed that all matter is made of atoms.
Figure 2 John Dalton developed Democritus’ ideas about particles.
H2O
Figure 3 A glass of water is made of molecules. Each molecule contains two hydrogen (H) atoms and one oxygen (O) atom.
chemistry the branch of science that deals with matter and the changes that take place within it
Particle theory
This new understanding encouraged scientists to find out more and more about these tiny particles, eventually leading to the branch of science now called chemistry
We can add some new ideas to Dalton’s list to help us explain matter:
• Particles are too small to be seen.
• Particles are always moving. When it is hotter, the particles move faster; when it is cooler, the particles move slower.
• Particles have mass.
• Particles can join to make larger particles. When they combine, their masses add together.
• T here are spaces between particles.
particle theory theory that explains the properties of matter
Retrieve
Solids
The particles are close together. They are held in a regular arrangement and vibrate around a fixed point.
DRAFT
• Forces hold particles together to stop them from separating. All these ideas, or rules, explain how particles act in real substances. Evidence from experiments has shown that particles always follow these rules in all substances. This is why it is called the particle theory.
Liquids
The particles are close together, but they can move and slide over one another.
Gases
The particles are far apart and move quickly on their own. They spread out to fill the space available to them.
1 Identify how an “idea” is different from a “theory”.
2 P repare a table (set up like Table 1) that demonstrates the ideas of Democritus and Dalton. Add Democritus’ ideas in one column and Dalton’s ideas in the other column.
Table 1 Historical ideas on matter
Democritus’ ideas
Dalton’s ideas
Analyse
3 C ontrast (the differences between) the ideas proposed by Democritus and Dalton.
4 Consider a school assembly. Everyone is sitting quietly in their seats in rows. When the assembly finishes, there is a crowd at the doors pushing to go through them to leave. When outside, the students run off in all directions as fast as they can. Explain which parts of this analogy represent a solid, a liquid and a gas.
Figure 4 The particle theory explains the differences between solids, liquids and gases.
5 Some people use analogies, or models, to compare states of matter. Identify which state of matter could be represented by the following situations:
a a swarm of bees crawling over one another
Lesson 7.4
b a thousand tennis balls tidily arranged in a large cardboard box
c eggs in trays in a large egg container
d a school of fish dar ting in all directions as they avoid a predator.
The particle theory explains matter
Key ideas
→ All particles have kinetic (movement) energy.
→ The particle theory of matter can be used to explain the properties of matter.
→ Particles in a solid substance will have less kinetic energy while a gas will have more kinetic energy.
→ Gas diffusion occurs faster than liquid diffusion as the gas particles have more kinetic energy.
→ The kinetic theory of matter explains diffusion.
The kinetic theory of matter
The particle theory of matter is used to describe the properties of all matter. In the particle theory of matter, the particles are always moving. The word “kinetic” refers to the energy of anything that is moving. Therefore, particles always have kinetic energy. The faster they move, the more kinetic energy they have. For this reason, the particle theory has been extended to include the kinetic theory of matter.
Particle energy
The movement of particles is related to their kinetic (movement) energy. We can think of the movement of particles like the movement of people (Figure 1).
• W hen people are sitting quietly, they have little kinetic energy. This is like a solid, where the particles only vibrate, and people only sit quietly and breathe.

Learning intentions and success criteria
kinetic energy the energy possessed by moving objects
kinetic theory of matter theory that explains how the energy and motion of particles influence the properties of matter
Figure 1 We can think of the movement of particles like the movement of people.
mass the amount of matter in a substance, usually measured in kilograms (kg); the mass of an object never changes, even in space
volume the amount of space that a solid, liquid or gas occupies
pressure amount of force applied on an area
• I n a crowd, people are standing and moving around and have more kinetic energy. This is like a liquid, where the particles jostle about. Particles in a liquid have more kinetic energy than particles in a solid.
• W hen people are running, they have much more kinetic energy. This is like a gas, where the particles move fast and on their own. Particles in a gas have the highest amount of kinetic energy.
Using the kinetic theory of matter
The kinetic theory of matter can be used to explain many of the observations and measurements that we make about the substances around us.
Mass is the amount of matter in a substance and is measured in grams (g). Mass depends on the number of particles and the mass of each individual particle.
DRAFT
A particular volume of solid or liquid has a greater mass than the same volume of gas because it has more particles in it (Figure 2). For example, imagine two containers that are the same size. One container is filled with liquid nitrogen. The other is filled with nitrogen gas. The container with liquid nitrogen is much heavier because the liquid has more particles in it than the fast-moving gas particles.
The fast-moving particles of a gas are constantly pushing against the sides of a container. This puts pressure on the walls of the container. The more a gas is heated, the more kinetic energy the gas particles have and the greater the pressure on the container. This is why it is dangerous to heat a container that has gas in it. The pressure of the gas could cause the container to explode.
A piece of lead has a much greater mass than the same-sized piece of aluminium. Both are metals that are made of atom particles that are packed closely together. The difference is the mass of each atom. Lead atoms are bigger and have a greater mass than aluminium atoms (Figure 3).
Figure 2 A container of a solid or a liquid has more particles than the same container of gas.
Figure 3 Lead atoms have a greater mass than aluminium atoms.
Diffusion
When the lid is taken off a bottle of perfume, the smell of the perfume spreads throughout the room (Figure 4). This occurs without any breeze or wind and is called diffusion
Another example of diffusion is tea spreading out from a tea bag in a cup of hot water (Figure 5). The high level of kinetic energy in the hot water will cause the particles to mix quickly. Stirring the cup of tea will also mix the particles and speed up the rate of diffusion.
Diffusion occurs fastest in gases. This is because the particles in gases are moving freely and quickly and there is plenty of space between them. The particles in a gas will spread out quickly and take up the space available (Figure 6).


diffusion the intermingling of substances by the natural movement of their particles
DRAFT
In liquids, the particles jostle against one another. They do not move far before colliding with another particle. As a result, particles in a liquid do not move very far or very fast. Diffusion in liquids is slow (Figure 7).
In solids, the particles are locked into position. The particles vibrate, but they cannot move to a new location. So the particles in a solid cannot spread out and diffusion does not occur in solids (Figure 8).
Figure 4 Perfume diffuses when its bottle is open. Figure 5 Tea diffuses in hot water.
Figure 6 Before (left) and after (right) diffusion in a gas. Diffusion in gases is fast.
Oxford University Press
Check your learning 7.4
Check your learning 7.4
Retrieve
1 L ist the states solid, liquid and gas from having the most to the least energy content.
2 Define the term “mass”.
Comprehend
3 Ex plain the meaning of “kinetic” in the kinetic theory of matter.
4 Ex plain the similarity between the particle theory of matter and the kinetic theory of matter.
5 Describe how the particle theory of matter explains the mass of different substances.
6 Ex plain why a 2 c m 3 block of lead will have a greater mass than a 2 c m 3 block of wood.
7 Describe how the kinetic theory of matter explains diffusion in: a liquids b gases.
Skills builder: Conducting investigations
8 A student was asked to investigate how different factors affect the rate of diffusion in liquids. To test this, they placed a tea bag in one cup of hot water and timed how long it took the tea to completely diffuse through the water. They recorded the time and repeated the exact method again.
a Will the student’s method help them to investigate different factors? Explain your reasoning. (THINK: What are the different factors (independent variable) that the student was testing? Does their method compare factors?)
b Propose how the student could improve their method? (THINK: How can the student make this a fair test, including independent, dependent and controlled variables?)
Figure 8 Solids do not diffuse.
Figure 7 Diffusion in liquids is slow.
Lesson 7.5
The particle theory can explain the properties of matter
Key ideas
→ Strong bonds between particles can make the material stronger (able to withstand force), harder and more viscous.
→ Tightly packed particles make the material dense and less able to be compressed.
Strength
The idea of strength can be considered in different ways. A rubber band is easily stretched, but what about a piece of wire? Different wires made of different metals will break if stretched.
Tensile strength is a measure of the flexibility of the attraction or bonds between the particles. The attraction between the particles in steel are stronger than the attraction between the particles in tin.
Another type of strength is compression strength. Substances that can withstand large forces without being crushed have a high compression strength (Figure 1). These substances often have particles that are strongly attracted or bonded to each other in multiple directions. This means that the particles are held in place and cannot slip sideways.
Hardness
Learning intentions and success criteria
Check the next lesson for a linked practical activity or experiment.

Hardness is the resistance of a substance to scratching. An iron nail will scratch a plastic ruler because the iron is harder than plastic (Figure 2). However, the iron nail will not scratch glass because the iron is softer than glass. For these substances, the order of hardness is glass, next iron and then plastic.
tensile strength a measure of the flexibility of the bonds between particles in a substance bond the force that holds particles (atoms) together compression strength the ability of a substance to withstand large forces
hardness a physical property of a substance that describes its resistance to scratching
Figure 1 Reinforced concrete combines the tensile strength of steel with the compression strength of concrete.
Iron nail Plastic Scratch
Figure 2 An iron nail will scratch plastic because iron is harder than plastic.
viscosity a measure of how slowly a liquid changes its shape; the thickness of a liquid
The particle theory of matter explains hardness in terms of the forces that hold the particles together. The attraction between particles in hard substances means they are held together very strongly and it is difficult to separate them. In plastic, the particles are not as attracted to each other and can be removed or scraped off. Therefore, plastic is not a hard substance.
Hardness is not the same as strength. A very hard substance may shatter easily. If this happens, the material is described as “brittle”.
There is a connection between hardness and melting. Substances that are hard have a strong attraction (bonds) between their particles. This strong attraction means that when hard substances melt, a lot of heat energy is needed. These substances usually have a high melting point.
Viscosity
Viscosity is the thickness, or “gooiness”, of a liquid. It describes how easily the particles move around one another. Highly viscous liquids are hard to pour out of a container. Water has a low viscosity, cooking oil is more viscous and honey is very viscous (Figure 3). Engine oils used in engines have different viscosities, affecting how easily the engine parts move at different temperatures.
Compressibility

compressibility the extent to which a substance can be compressed (squashed); gases can be compressed but solids and liquids cannot
DRAFT
incompressible unable to be compressed; solids and liquids are incompressible
Compressibility refers to the ability of a substance to be squashed or compressed into a smaller shape. You can test for compressibility when substances are in a plastic syringe. If you put your finger over the end of a syringe, you can compress the gas (air) inside it. However, if you put a liquid, such as water, in a syringe, you cannot compress the liquid. Similarly, if you filled the syringe with a solid such as sand, you would not be able to compress the solid.
In solids and liquids, there are fewer empty spaces between the particles than in a gas, so it is not possible to compress the particles closer together. Solids and liquids are said to be incompressible
Gases, like air, can be compressed. This is because the particles are spread out and there is space between them (Figure 4).

Gas in bike pump
Uncompressed
Compressed
4 Compression reduces the space between particles.
Figure 3 Honey has a higher viscosity than water and so can’t be poured as easily as water.
Figure
Density
One way of comparing the “heaviness” of two substances is to compare their densities. Density describes the number of particles and how tightly packed they are. The stronger the attraction between the particles, the closer together the particles will be. The density of a substance will affect its properties, such as its ability to float.
Objects with lower density float on liquid if the liquid has a higher density. For example, a piece of cork will float on water. This is because the water has a higher density than the cork. On the other hand, coins will sink to the bottom of water. This is because the coins have a higher density than the water.
In Figure 5, we see that 1 L of water is heavier than 1 L of air. This means that water has a greater density than air. Sand has a greater density than water or air, but it has a lower density than lead.
The particle theory of matter explains density in terms of both the mass and the closeness of the particles. Gases always have low densities because there is a lot of empty space between the particles. Solids normally have high densities because there is very little space between the particles.
The densities of some common substances are given in Table 1.
Table 1 Densities of some common substances
Figure 5 Density compares the mass of objects of the same volume.
Check your learning 7.5
Check your learning 7.5
Retrieve
1 Identify the most and least dense materials in Table 1.
2 L ist the following in order of compressibility from least to most: gas, solid, liquid.
Comprehend
3 P repare a table (set up like Table 2) that summarises the following physical properties:
a strength
b hardness
c v iscosity
d compressibility e density.
Table 2 Physical properties and their meanings
Physical property Meaning
4 Use the particle theory of matter to explain why steel is stronger than tin.
5 Describe what would happen if you placed a highly viscous liquid, such as oil, into a
Lesson 7.6
water pistol. Explain your reasoning (by comparing the properties of water and oil and how they affect the behaviour of the oil in the water pistol).
Apply
6 Use Table 1 to predict if the following substances would sink or float in water.
DRAFT
a Oi l
b A n iron nail
c A balloon filled with air
d A glass marble
7 Use your understanding of the particle theory of matter to draw the particles in honey and in oil. Compare the attraction bond between the particles of the two substances that explains their different viscosities.
Skills builder: Problem solving, questioning and predicting
8 I magine that you are selecting a substance to use to make a protective case for a mobile phone. What physical properties would you consider when choosing your substance? Explain your reasoning.
Experiment: The density den
To calculate the density of a substance, you first need to know its mass and volume. The most appropriate units for the substances you will be working with are grams (g) for mass and millilitres (mL) or cubic centimetres (cm 3) for volume. Millilitres (mL) tend to be used
for the volume of liquids, whereas cubic centimetres (cm 3) are used for solids.
The formula for calculating density is density = mass (g) volume (cm 3)
Note that 1 mL is the same as 1 cm 3 . Therefore, grams per millilitre (g/mL) is the same as grams per cubic centimetre (g/cm 3).
Station 1
Aim
To measure the density of liquid water
Materials
• E lectronic balance
• 10 m L measuring cylinder
• Water
• Calculator
• 50 m L measuring cylinder
Method
1 Copy Table 1 into your notebook and use it to record your measurements.
2 Use the electronic balance to measure the mass of the 10 mL measuring cylinder. Record its mass in grams (g) in your table.
Table 1 Recording the density of water
Discussion
1 T he standard value for the density of water is 1.00 g/mL at 25°C. Compare the values you obtained to this value.
2 Describe one factor that could have affected the accuracy of your results.
3 Compare the accuracy of the density value of the small volume of water with the density value of the large volume of water.
3 Remove the measuring cylinder from the balance and add 6 mL of water to it.
4 Measure the mass of the cylinder and water. Calculate the mass of the water by subtracting the mass of the cylinder from the combined mass of the cylinder and water (mass of water = mass of measuring cylinder and water – mass of measuring cylinder). Record your answer in your table.
5 Ca lculate the density of the water using the density formula and record your answer in your table. (Do not forget the units!)
6 Repeat steps 2 to 5 using the 50 mL measuring cylinder in step 2 and 20 mL of water in step 3. Calculate the density of the water. Record your results in your table.
7 To obtain a third measurement of the density of water, repeat steps 2 to 5 again, choosing one of the two measuring cylinders in step 2 and any amount of water in step 3. Record your results in your table.
Results
Record your calculations and results in Table 1.
4 Use your answer to question 3 to explain why scientists should repeat their experiments.
Station 2
Aim
To measure the density of regular-shaped blocks made from different materials
Materials
• E lectronic balance
• Several blocks made from different substances (e.g. wood, polystyrene, lead, zinc)
• Ruler
• Calculator
Method
1 Copy Table 2 into your notebook, adding a row for each additional substance.
2 Use the electronic balance to measure the mass of each of the blocks. Record the mass in grams (g) for each block in your table.
3 Use a ruler to measure the length, width and height of each block in centimetres (cm). Record your data in your table.
Table 2 Measuring the density of regular-shaped blocks
4 Ca lculate the volume of each block (volume = length × width × height). An example has been done for you in the first row of Table 2, using the measurements in Figure 1. Record your data in your table.
5 Ca lculate the density of each block using the density formula and record the answers in your table. Remember to state the unit of density.
1 Calculating the volume of a regular-shaped block
Results
Record your measurements in Table 2.
Discussion
1 Define parallax error. (HINT: Look back at Lesson 1.14 Scientists measure and record data accurately (page 44).)
2 Describe how parallax error could have affected the accuracy of your measurements.
3 L ist the blocks from least dense to most dense.
Station 3
Aim
To measure the density of irregular-shaped objects
Materials
• E lectronic balance
• 100 mL measuring cylinder
• Water
• Calculator Method
1 Copy Table 3 into your notebook with four blank rows.
2 Use the electronic balance to measure the mass of the first object. Record the mass (in grams) in your table.
3 Use the following displacement method to work out the volume of the object: –Approximately half-fill the measuring cylinder with water. Record the volume of water in the cylinder (Volume 1).
– Add the object to the measuring cylinder so that it is fully submerged. Record the volume of water in the cylinder (Volume 2).
• Four different objects (e.g. spatula, a small rock, a lump of play-dough, an object of your choice) that each fit into the measuring cylinder
Figure
–
Ca lculate the volume of the object by subtracting the volume of water in the cylinder before the object was added from the volume of water after the object was added (Volume 2 – Volume 1).
4 Ca lculate the density of the object using the density formula. Record your answer in your table.
Table 3 Measuring the density of irregular-shaped objects
5 Repeat steps 2 to 4 with the remaining objects.
Results
Record your measurements in Table 3.
Discussion
1 Describe some of the difficulties that you had using the displacement method for calculating density.
2 Describe an advantage of using the displacement method for measuring volume.
3 Compare the density of the water with the density of the objects.
Station 4
Aim
To use the different densities of liquids to make a density column
Materials
• 3 × 50 mL beakers
• 10 mL maple syrup
• Food dye (different colours)
• 10 mL water
• 2 × plastic pipettes
• 10 mL vegetable oil
• 10 mL isopropyl alcohol
Method
1 Slowly pour a 1 cm layer of maple syrup into the middle of the beaker base. Be careful not to allow the maple syrup to touch the side of the beaker. Allow it to settle for 2 minutes.
2 Use the second beaker to add one colour of food dye to a small amount of water.
3 Very slowly pour the coloured water onto the top of the maple syrup so that it forms a separate layer.
4 Use the plastic pipette to place droplets of the vegetable oil on top of the water so that it forms a third layer in the beaker.
5 Add another colour of food dye to the isopropyl alcohol in the clean beaker. Mix it so the alcohol is completely coloured.
6 Use the clean pipette to slowly drip the coloured isopropyl alcohol down the side of the beaker containing the liquid layers until it forms the fourth and top layer.
Results
Draw a labelled diagram of the density column formed in your beaker.
Discussion
1 Describe some of the difficulties that you had making your density column.
2 Describe the advantage of using different coloured food dye in some layers of your column.
3 Use the results of your density column to list the liquids used in this experiment from the most dense to the least dense.
4 W hen you made the density column, you assumed that the food dye did not change
the density of the liquid. Explain what might have happened if this assumption was not correct (i.e. if the food dye made a liquid more dense).
5 Use the results from all the experiments (Station 1 to 4) to list the objects from lowest to highest density.
Conclusion
Use your understanding of the density of solids and liquids to explain your observations at each station.
Check the next lesson for a linked practical activity or experiment.
Lesson 7.7
DRAFT
Increasing kinetic energy in matter causes it to expand
Key ideas
→ Heating matter increases the kinetic energy of the particles.
→ The particles in warm materials move faster than particles in cool materials.
→ Melting point is the temperature at which the particles in a solid behave like a liquid.
→ Boiling point is the temperature at which the particles in a liquid behave like a gas.
Heating particles
Gold is usually a solid at room temperature (20°C). Like all solids, the particles in gold are packed tightly together. When solid gold is given heat energy, the gold particles start vibrating faster and faster. When the gold reaches its melting point (1,064°C), the particles have enough kinetic energy to move around one another, just like the particles in a liquid (Figure 1). The gold has melted.
Figure 1 Heat adds kinetic energy to the particles and allows them to
Learning intentions and success criteria
If you continue heating the gold, the particles continue to gain kinetic energy, move faster and take up more space. Eventually, when the gold reaches its boiling point (2,807°C), the gold particles have enough kinetic energy to break free from the other gold particles and move off on their own as a gas.
This process can also happen in reverse. If a gas is cooled down, the particles will move more slowly. The attraction to other particles will now keep the particles close together and the gas will condense into a liquid.
If the particles in a liquid are cooled even further, their movement will slow down even more. Eventually, they are held in place by other particles and do not have enough energy to move on their own – they become particles locked into a solid (Figure 2). The liquid has solidified or frozen.

The main difference between a hot and a cold substance is the amount of kinetic energy in the particles. The differences in the movement of hot and cold particles can be seen when food dye is added to a beaker of hot water and a beaker of cold water. The particles in the hot water move faster than the particles in cold water and so the food dye diffuses faster in the hot water (Figure 3).


Heat causes expansion
All objects and substances expand (increase in size or volume) as their temperature increases. These objects contract (shrink) back to their original size when they are cooled back to their original temperature. The expansion is only small – roughly 10 mm in a 30 m bridge – but it is very important for the strength of the object. Expansion effects are seen in bridges, railway tracks and large buildings (Figure 4 and Figure 5).
expand to increase in size or volume
contract to decrease in size or volume
Figure 2 Solidification occurs when a substance cools after it has been heated.
Figure 3 Diffusion occurs much slower in cold water (left) than in hot water (right). The images were taken (A) immediately after adding the dye, and (B) 10 seconds later.

Heat energy causes the particles in a solid, liquid or gas to gain more energy. The particles jostle more and speed up. As they move around faster, they take up more space and push the other particles further apart (Figure 6, Figure 7 and Figure 8).

Expansion and contraction have many important applications, such as liquid-in-glass thermometers. When an alcohol thermometer is placed in your mouth, the heat from your body passes to the liquid inside the thermometer, causing it to expand and move up the tube. Thermometers are filled with red- or green-coloured alcohol, but not the type of alcohol in alcoholic drinks.
1 Recall what precautions are taken with railway tracks and bridges to make sure that they do not buckle and bend when they expand on a hot day.
2 Ex plain how the movement of particles changes when a substance gains heat.
3 Ex plain why objects return to their original size when their temperature returns to normal.
Figure 4 An expansion joint in a suspension bridge
Figure 5 Train tracks would buckle in the heat if they did not have tiny gaps between them.
Cold solid Hot solid
Figure 6 In a hot solid, the particles vibrate faster and move further apart than in a cold solid.
Cold liquid Hot liquid
Figure 7 In a hot liquid, the particles move faster and take up more space than in a cold liquid.
Cold gas
Hot gas
Figure 8 In a hot gas, the particles move faster, and collide with one another harder, than in a cold gas.
4 W hen a solid is heated, it expands. Explain why.
Analyse
5 C ontrast (the differences between) the terms “expand” and “contract”. Describe an object that expands and contracts.
6 D raw a diagram similar to that shown in Figure 9. Add labels to identify the change in kinetic energy between states of matter and describe the change in kinetic energy at each state.

9 Energy changes between states
Skills builder: Planning investigations
7 Decide what equipment you would use to measure the temperature of water that is being heated.
a Identify each piece of equipment you would use and how. (THINK: Imagine the method you would use step by step. What do you need at each step to measure the temperature of water safely?)
b What hazards do you need to be aware of to conduct the investigation safely? (THINK: What are the dangers of conducting this experiment, and how could you use equipment to prepare for these?)
Lesson 7.8
Experiment: Effect of heat
Aim
To compare how introducing or removing heat affects a substance
DRAFT
Station 1: Heating a solid
Caution!
Wear safety glasses and a lab coat, and tie long hair back when using a Bunsen burner.
Materials
• Ball and ring apparatus
• 2 × 250 m L beakers
• Hot water
• Cold water
• Ice
Method
1 L ook at your ball and ring. Try passing the metal ball through the ring before heating and cooling it. Record your observations; for example, “Before heating and cooling the ball, it …”
2 H alf fill a 250 m L beaker with hot tap water. Place your ball in the hot water for 5 minutes. Keep the ring away from the hot water.
Figure
3 Try passing the ball through the ring. Record your observations; for example, “After heating the ball in hot water, it …”
4 H alf fill the other beaker with cold tap water and add ice. Put the ball in the iced water for 5 minutes. Keep the ring away from the iced water.
5 Try passing the ball through the ring. Record your observations; for example, “After cooling the ball in ice, it …”
Results
Record your observations by describing what you did and how the movement of the ball through the ring changed.
Discussion
1 Describe how the size of the metal ball changed with: a heating b cooling.
2 Use the kinetic theory of matter to explain what was happening to the particles in the solid when heat was applied.
3 Describe how the size of the ball changes as the temperature returns to room temperature.
Conclusion
Explain how heating can change the properties of a solid.
Station 2: Heating a liquid
Caution!
• M ake sure the apparatus is not left unattended. The dye and water will spurt out the top of the glass tube if allowed to.
• One-hole rubber stopper fitted with glass tubing
• Permanent marker
• G auze mat
• Tr ipod
• Heatproof mat
• Bunsen burner
• M atches
Method
1 P ut two drops of food colouring in the conical flask and fill the flask to the top with water.
DRAFT
• T he flask and its contents may be hot. Allow all equipment time to cool before handling it.
Materials
• 100 m L conical flask
• Food colouring
• Water
2 Place the rubber stopper fitted with the glass tube in the flask (Figure 1). Some water will rise up the tube. Use the permanent marker to mark this first level on the tube.
3 Place the flask on the gauze mat on the tripod.
4 Safely light the Bunsen burner and place it under the tripod on the heatproof mat. Open the collar on the Bunsen burner to produce a blue flame and gently heat the flask. Refer to Lesson 1.13 Skills lab: Lighting and using a Bunsen burner (page 42) if you need help safely lighting a Bunsen burner.
5 A fter a few minutes of heating, turn off the Bunsen burner. Mark the level of the water in the tube again.
6 Record how the level of the water changes as it cools.
Figure 1 Experimental set-up to show the expansion of a liquid on heating
Results
1 Record your observations of the water level as the flask was:
a heated; for example, “As the water was heated, the water level in the glass tubing …”
b cooled; for example, “As the water cooled, the water level in the glass tubing …”
Discussion
1 Use the kinetic theory of matter to explain how the liquid in the glass tube moved when it was:
a heated b cooled.
Conclusion
Explain how heating can change the properties of a liquid.
Station 3: Heating gases
Caution!
If latex allergies are a concern, use a non-latex balloon.
Materials
• Balloon pump
• Balloon
• 100 m L conical flask
• St ring
• Ruler
• 250 m L beaker of hot water
• Timer
• Ice bath (250 m L beaker of water and ice)
Method
1 Using a balloon pump, blow up the balloon to help stretch the rubber. Let the air out again until it is about the size of an apple.
2 Place the balloon over the neck of the conical flask.
3 Use the string and ruler to measure the circumference (the distance around the middle) of the balloon at room temperature. Copy Table 1 into your notebook and record this measurement.
4 Place the flask with the balloon attached in a beaker of hot water (Figure 2). Wait 2 minutes.
5 Measure and record the balloon’s circumference.
6 Place the flask with the balloon attached in an ice bath with a small amount of water. Wait 4 minutes.
7 Measure and record the balloon’s circumference.
DRAFT
Figure 2 Experimental set-up to show the expansion and contraction of a gas after heating and cooling
Results
Record your observations in Table 1.
Table 1 Measuring balloon circumference at different temperatures
Temperature
Room temperature
Hot water
Ice bath
Discussion
Balloon circumference (cm)
2 Describe how the size of the balloon changed as the flask was moved from hot water to ice.
3 Use the ideas of kinetic energy and the particle theory of matter to explain why the size of the balloon changed with the changes in temperature.
Conclusion
Explain how heating can change the properties of a gas.
1 Describe how the size of the balloon changed as the flask was moved from room temperature to hot water.
Lesson 7.9
Experiment: From ice to steam
Caution!
• Steam and boiling water can both scald. Take great care when measuring the higher temperatures. If scalded, place the area of skin under cold running water for at least 5 minutes and show your teacher.
• Wear safety glasses and lab coat, and tie long hair back when using a Bunsen burner.
Aim
DRAFT
To investigate the melting and boiling points of water
Materials
• 250 mL beaker
• Crushed ice
• Water
• St irring rod
• Timer
• T hermometer (0 to 110°C) or thermistor probe
• Retort stand
• C lamp
• Boss head
• Tripod stand
• G auze mat
• Heatproof mat
• Bunsen burner
• M atches
• G raph paper
Method
1 Copy Table 1 into your notebook and use it to record your measurements.
2 Place some crushed ice and a small amount of tap water in the beaker. Stir with the stirring rod for approximately 1 minute.
3 Measure and record the temperature of the water and ice mixture in your table. This is the melting point of water at 0 minutes.
4 Set up the equipment as shown in Figure 1, checking to make sure the thermometer is not touching the bottom of the beaker and that it is secure in the clamp. Do not stir with the thermometer.
5 Safely light the Bunsen burner and place it under the tripod. Open the collar on the Bunsen burner to produce a blue flame and start heating the ice and water. Refer to Lesson 1.13 Skills lab: Lighting and using a Bunsen burner (page 42) if you need help safely lighting a Bunsen burner.
6 Measure and record the temperature of the mixture in the beaker every minute until the water starts to boil and produce steam. This is the boiling point of water.
7 Continue heating for another 4 minutes, unless most of the water has evaporated.
8 Using graph paper, or a suitable computer program, draw an appropriate graph with temperature on the y -axis (vertical axis) and time on the x -axis (horizontal axis).
Stir gently with stirring rod
Thermometer held in clamp
Figure 1 Experimental set-up for measuring the melting point of ice
Results
Record your observations in your table and graph.
Table 1 Recording melting and boiling points
Discussion
1 a Identify the temperature of the melting point you measured.
b C ontrast between your measured melting point of ice and the standard measurement of 0°C.
2 a Identify the temperature of the boiling point of water you measured.
b C ontrast between your measured boiling point of water and the standard measurement of 100°C.
3 Identify one assumption that could have affected the accuracy of your results.
Describe how you could improve this if you repeated the experiment.
4 Compare your results with those of the rest of the class. Propose why there may be a variation or anomalies in the answers.
Conclusion
Describe what you know about the melting and boiling points of water.
scientific model a physical, mathematical or conceptual representation of an object, system, event or process that is used to explain or predict the behaviour of a scientific process or phenomenon
Lesson 7.10 Science as a human endeavour: Scientists find ways to communicate
Scientific models
Scientists use scientific models to explain and predict how things work. Scientific models are ideas or representations that we can use to explain phenomena that are difficult to observe. For example, the particle theory helps us to explain matter, which we would not normally be able to see (Figure 1). Other examples of scientific models include models of the solar system or DNA. We cannot view either of these things, but you might have an idea in your head of what they look like.
Scientific papers
scientific paper written report of a scientific investigation that has been published in a scientific journal; also called a “research paper” or “journal article”
DRAFT
peer reviewed the evaluation of work by one or more people with similar skills and backgrounds (peers)
Many scientists use formally written scientific papers or reports to describe how they did research and the data they measured, and to explain how it affects the world around them (Figure 2). Scientific papers are usually used to provide information to other scientists who are specialists in the same field. Because scientific papers are meant to be read by other scientists, they often use a lot of complex terminology that can be difficult for the average person to read. Each scientific paper is also peer reviewed. This means other scientists will read the paper and check that the results are reliable before it is published in a scientific journal.

Solid Liquid Gas
Figure 1 The particle theory helps us to understand different states of matter, even though we cannot observe particles.
Figure 2 Scientific papers are reports published to share ideas or findings with other scientists.
Scientific posters
Before a scientist writes a paper for a scientific journal, they will often present it to other scientists as a poster (Figure 3). Posters are a shorter summary of the experimental method and results that can be put on a wall for other scientists to see at a conference (a meeting for scientists). This allows the scientist to discuss their ideas and research with other scientists so that they can offer suggestions on how the research could be improved.
Conferences
Scientists will often travel to other states or countries to share their research with other scientists. A conference occurs when a large number of scientists who are interested in the same research travel to the same place to discuss their ideas (Figure 4). The chance to share ideas and to see their research from another person’s perspective can help good ideas become great ideas.
Social media


Scientists are not the only people who are interested in learning about science. Many people are interested in learning about discoveries on the Moon, new treatments for cancer and new forms of renewable energy. This means that scientists need to be able to share their ideas with non-scientists through newspapers, magazines, television or social media (for example, online blogs, YouTube and X (formerly Twitter)).
Test your skills and capabilities
DRAFT
Communicating with an audience
Before a scientist can communicate effectively, they need to answer a few questions. Use the hints below to create an animation or other form of communication that explains how you could reduce the amount of water evaporating from a waterhole in central Australia. You should use your knowledge of particle theory to explain why your idea will work.
Figure 3 Scientific posters include a short summary of an experiment’s hypothesis, method, results, discussion and conclusion.
Figure 4 Scientists often present their findings at science conferences.
Who is the audience?
Knowing who will be reading or listening to the information is the most important thing a scientist needs to know. Do the people in the audience know the meaning of the scientific words? Will you communicate your science to your classmates, an older or younger class, or a teacher? How much science do they know? What words might you have to change or explain?
How can the scientist make science relevant?
There are many different types of scientific research on many different topics. While some people will be very interested in the topic, others may not be as interested. You will need to consider how your experiment is similar to something in their life. They may have slower train trips on hot days because of the train tracks bending or buckling, or they may wonder why they get condensation on the outside of their glass. A scientist needs to make the science interesting to their audience.
DRAFT
What is the most effective way to communicate science?
Different people use different forms of communication. If a scientist wanted to share their research with the general public, they would not use a scientific paper or a poster. Instead, they might use an oral (talking) report, television report, blog, radio interview or social media app. Which method would be the best way to present to your audience?
How much information should be passed on?
A post on a social media app may be limited to a few hundred words, whereas an online blog can be much longer. Reports on television are often limited to 3 minutes, whereas a scientific paper can be several pages. What information do you need to pass on to your audience? Will they want to hear how you did your research and see the data in graphs or tables? How will you convince them that the experiment was a fair test and that your results are accurate and reliable?
Pictures or words?
The type of communication you use will often determine if you can use pictures or words. Using a lot of words in a small space in a report or on a poster means that the audience needs to stop and concentrate. Do you need to describe the method, or will a single, well-labelled diagram be more useful? If you are presenting an oral report, a pause after saying a word will make it more important and more likely to be remembered.
What are the two things that you want the people in the audience to remember?
Most people in an audience will only remember two things after a communication. What two things are the most important for your audience to remember? How will you make sure that they remember these things? Repeating the important information or including a summary at the end will help people remember the key points.
Good luck with your communication!
Lesson 7.11 Review: Particle theory
Summary
Lesson 7.1 There are three states of matter
• A ll things are made of matter.
• T here are three major states of matter: solid, liquid and gas.
• M any substances can be found in more than one state.
• A substance in one state can be changed into another by applying heat or freezing it.
• Substances in a liquid state can evaporate, so techniques are used to prevent this from happening.
• T he physical property of a substance is what we can observe and measure without changing the substance into something else.
• T he chemical property of a substance is what it does in a chemical reaction.
Lesson 7.3 Scientists’ understanding of matter has developed over thousands of years
• Science involves developing a hypothesis, testing it with a reproducible experiment and modifying ideas.
• T he particle theory of matter has been tested and refined by scientists for more than 2,000 years.
Lesson 7.4 The particle theory explains matter
• A ll particles have kinetic (movement) energy.
• T he particle theory of matter can be used to explain the properties of matter.
• Particles in a solid substance will have less kinetic energy while a gas will have more kinetic energy.
• G as diffusion occurs faster than liquid diffusion as the gas particles have more kinetic energy.
• T he kinetic theory of matter explains diffusion.
Lesson 7.5 The particle theory can explain the properties of matter
• Strong bonds between particles can make the material stronger (able to withstand force), harder and more viscous.
• Tightly packed particles make the material dense and less able to be compressed.
Lesson 7.7 Increasing kinetic energy in matter causes it to expand
• Heating matter increases the kinetic energy of the particles.
• T he particles in warm materials move faster than particles in cool materials.
• Melting point is the temperature at which the particles in a solid behave like a liquid.
• Boiling point is the temperature at which the particles in a liquid behave like a gas.
Review questions 7.11
Review questions
Retrieve
1 Recall where the word “atom” came from.
2 Identify what happens to water during condensation.
A T he solid melts into a liquid.
B T he liquid heats to become a gas.
C T he liquid loses heat to become a solid.
D T he gas loses heat to become a liquid.
3 Identify what would happen to the particles in a beaker of water as it is heated.
A T he particles start moving faster.
B T he particles start moving slower.
C T he particles stop moving.
D T he particles start to disappear.
4 Identify the best description for “density”.
A T he ability of a substance to scratch another substance
B T he ability of a substance to be compressed
C T he mass of a certain volume of a substance
D T he thickness of a liquid substance
5 Define the term “volume”.
6 Define “kinetic energy” in your own words.
7 Identify the three common states of matter.
8 Recall one word to replace each phrase.
a T he spreading out of a substance such as a dye or smell
b T he resistance of a substance to scratching
c T he ratio of the mass divided by the volume
9 Use the information in Table 1 to identify which substance has the:
a lowest melting point
Table 1 Melting and boiling points of different substances
DRAFT
b h ighest melting point
c lowest boiling point
d h ighest boiling point.
Comprehend
10 Identify which state of matter has particles with the most kinetic energy. Explain your reasoning (by describing the amount of kinetic energy in solids, liquids and gases).
11 Use the particle theory to explain the following properties.
a St rength
b H ardness
c Viscosity
d Compressibility
e Density

12 I n your own words, describe the five key ideas identified by Dalton.
13 Ex plain why perfume sprayed on one side of a room will eventually be smelled by someone sitting on the other side of the room.
Figure 1 Glass is a hard, but brittle, substance.
Use the kinetic theory of matter to explain why metal will expand when it is heated.
15 W hen you are boiling water, the volume of the water is reduced as it evaporates. Use the particle model to explain what happened.
16 Use the kinetic theory of matter to explain why the pressure inside car tyres will increase on a hot day.
17 Ex plain how an analogue thermometer containing alcohol determines a difference in temperature.
18 Describe what will happen when the air in a balloon is heated.
19 Ex plain why the train tracks can buckle on very hot days.
Analyse
20 C lassify each of the following substances as a solid, liquid or gas.
a M ilkshake
b C heesecake
c C hewing gum
d Sandcastle
21 C ontrast physical and chemical properties.
22 C ontrast mass and matter.
23 Identify which of the following substances will have particles with the most kinetic energy: ice, milk or the air in a balloon. Justify your answer by using the kinetic theory of matter to compare the kinetic energy of the particles in each substance.
24 D raw the following substances, showing the arrangement and movement of the particles in them: banana, pond water, lollipop, helium balloon, book, honey.
The particles are close together. They are held in a regular arrangement and vibrate around a fixed point. The particles are close together, but they can move and slide over one another.
25 C ontrast solidification and freezing. Identify an example of each.
26 Compare the processes of melting and boiling. Identify an example of each.

DRAFT
The particles are far apart and move quickly on their own. They spread out to fill the space available to them.
Apply
27 Use Table 2 to decide which of the following items would have a greater density.
a 1 L of water or 1 L of oil
b A gold necklace or a crystal necklace
c 10 planks of wood or 10 steel bars (assume they are all equal in size)
Figure 2 Solid, liquid or gas?
Figure 3 Metal train tracks buckle on hot days
Table 2 Density of various substances
M any people have ideas they think will explain observations and events in science. For an idea to become a theory, it must be able to explain a range of different observations. The idea must also be supported by evidence and/or observations.
a P ropose what evidence would have been required to support the idea that all substances are made of atoms.
b It is found that a substance cannot be broken down into a more simple substance. Use the particle model to explain this observation.
29 Ex plain the following observations of solids, liquids and gases by describing the arrangement and/or the movement of particles within the substance. Create labelled diagrams to help your explanations.
a Water left in an open bottle will gradually evaporate and, if the temperature of the water increases, the water will evaporate more quickly.
b Mercury is a unique substance because it is the only metal that is liquid at room temperature, and it even gives off a vapour (which makes it very dangerous because this vapour can be breathed into our lungs and cause damage).
c Polythene plastic can be produced in two different forms: high-density polythene (HDPE) or low-density polythene (LDPE). If the particles in HDPE and LDPE were the same, suggest how the arrangement of the particles in the two substances would be different.
d W hen a piece of polythene is heated, it will melt. While it is changing state from a solid to a liquid, it can be formed into a different shape. When it cools, the polythene will stay in this new shape.
diagrams in this module. Describe one limitation of your drawing or model (i.e. what does it not show).
a T he melting point of a material
b T he boiling point of a material
c T he density of a material
d T he kinetic energy of a particle as it heats up
e D iffusion
Social and ethical thinking
31 Science is communicated in many different ways, including scientific journals and posters, television reports, newspapers and social media, such as blogs and YouTube. Identify which of these forms of communication are most trustworthy. Justify your answer (by describing why the communication you chose is more trustworthy than the other forms of communication).
Critical and creative thinking
DRAFT
30 C reate a way to draw or model one of the following properties. Describe why your drawing or model is better than one of the
32 Democritus identified that all substances were made of tiny particles called atomos, while Dalton suggested how these particles were combined and how they moved. Propose an argument to support the particle theory of matter being called either the Democritus Model or the Dalton Model.
33 T he kinetic theory of matter is supported by data from many different experiments completed by many different scientists across multiple countries. Discuss why a single experiment carried out by a single scientist is not a theory.
34 Discuss how Democritus’s ideas of an atom were expanded by Dalton to produce the current particle theory of matter.
Research
35 C hoose one of the following topics for a research project. Present your research in a format of your own choosing, giving careful consideration to the information you are presenting.
Hot air balloons
Most of our understanding of how gases move and change is a result of the first hot air balloonists.
• Identify the first person who made an unmanned balloon.
• Describe how the balloon was made.
• Use your understanding of density to explain why a hot air balloon flies and how the pilots control the descent and landing safely.
• Identify what is meant by the “flight ceiling” and why it is important to stay beneath it when flying.
People matter
The discovery of air pressure is a long and interesting story.
• I nvestigate the background of Evangelista Torricelli, Blaise Pascal and Otto von Guericke.
• Describe where they lived, the research that they did and how they communicated the outcomes of their work.
For example, Otto von Guericke built a large water thermometer in the front of his house and made the Magdeburg Hemispheres. Two opposing teams of eight horses, working like a tug-of-war, could not pull the hemispheres apart.

Gas warfare
Gas was first used in a battle in 1914 by French soldiers, but it was so unsuccessful that it was only noticed in the records after the battle. It wasn’t until 31 January 1915 that a German soldier witnessed 18,000 gas shells containing xylyl bromide land on the Russian lines. The cold weather prevented the gas from diffusing across the battleground. In April the same year, German chemists started testing chlorine gas as a weapon.
• Compare the different gases that were used in warfare and their effects on the soldiers.
• Ex plain why the use of chemical and biological weapons in war was banned in 1925.
• Compare this ban to the Chemical Weapons Convention signed in 1997 and the Act updated in 2021.
Figure 4 The Magdeburg Hemispheres are represented by a statue in Magdeburg, Germany.

Module 8 Mixtures
DRAFT
Overview
When we drink pure water, it contains only one type of particle – water. Sometimes a substance (a mixture) contains more than one type of particle. Understanding the properties of the particles allows us to predict which method we can use to separate them. This means we can create pure substances from a mixture.
Lessons in this module:
Lesson 8.1 Mixtures are a combination of two or more substances (page 340)
Lesson 8.2 Challenge: Comparing different types of mixtures (page 343)
Lesson 8.3 A solution is a solute dissolved in a solvent (page 345)
DRAFT
Lesson 8.4 Experiment: What if salt was dissolved in water? (page 348)
Lesson 8.5 Experiment: What if the solvent was heated when making a mixture? (page 349)
Lesson 8.6 Mixtures can be separated according to their properties (page 351)
Lesson 8.7 Experiment: What if a flocculant was added to muddy water? (page 354)
Lesson 8.8 Mixtures can be separated according to their size and mass (page 356)
Lesson 8.9 Experiment: What if you centrifuge tomato sauce? (page 359)
Lesson 8.10 The boiling points of liquids can be used to separate mixtures (page 360)
Lesson 8.11 Experiment: Crystallisation of salt water (page 363)
Lesson 8.12 Challenge: Design a way to purify water from sea water (page 364)
Lesson 8.13 Solubility can be used to separate mixtures (page 365)
Lesson 8.14 Challenge: Separation challenge (page 367)
Lesson 8.15 Experiment: Who wrote the nasty note? (page 369)
Lesson 8.16 Science as a human endeavour: Wastewater is a mixture that can be separated (page 371)
Lesson 8.17 Science as a human endeavour: Materials recovery facilities separate mixtures (page 374)
Lesson 8.18 Review: Mixtures (page 377)
Learning intentions and success criteria
Lesson 8.1 Mixtures are a combination of two or more substances
Key ideas
→ A pure substance is one where all the particles are identical.
→ The different substances in a mixture can have different properties.
Check the next lesson for a linked practical activity or experiment.
pure substance something that contains only one type of substance (e.g. a single element or a single compound) mixture a substance made up of two or more pure substances mixed together impure substance mixture that consists of two or more different types of particles homogeneous a mixture that has evenly distributed components heterogeneous a mixture that has unevenly distributed components properties characteristics of a substance
DRAFT
→ A homogeneous mixture has evenly distributed components, while a heterogeneous mixture has unevenly distributed components.
→ The different properties of substances can determine the type of mixture.
→ Solutions, suspensions, colloids and emulsions are all types of different mixtures.
Introduction
In the previous module, you learnt about the particle theory of matter. The particles in a pure sample of ice, water and water vapour are all identical (H 2O). When all particles in a substance are identical, it is called a pure substance. This is different from water found in the sea, which is a mixture of salt, water and many other types of particles. Substances that are a mixture of different types of particles are called impure substances
A salad is often a mixture of different substances (Figure 1). If the mixture is evenly spread so that every part of the bowl contains some of each of the ingredients, then we call it a homogeneous mixture (homo meaning “same”, geneous meaning “kind”). Sometimes a mixture might be uneven, where one ingredient is only on one side of the bowl. This uneven mixture is called heterogeneous (hetero meaning “different”, geneous meaning “kind”).
Properties of mixtures

Figure 1 Most of the things we use every day are mixtures. What mixtures can you see in this photograph? Can you see any pure substances?
There are many different types of mixtures, each with different characteristics. For this reason, scientists group mixtures according to their properties: what they are made of and how they behave. Knowing the type of mixture and the properties of each particle help us to work out ways to separate the different particles into pure substances.
Solutions
When you mix salt into water, it seems to disappear. But we know the salt is still there because we can taste it. The particles of salt become so small that they spread evenly throughout the water. This clear mixture of salt and water will not separate by itself. It is a solution. A solution is a mixture of one substance dissolved evenly throughout another (Figure 2). Solutions are usually transparent (see-through).
Suspensions
Dirty water is an example of a suspension. A suspension is a mixture of two substances, in which a solid is mixed through (dispersed), undissolved, in a liquid (Figure 3). The result is a cloudy liquid where the dirt is suspended or “hanging around” in the middle of the water. Sand in water is also a suspension. If you shake a container of sand and water, the sand spreads through the water, forming a cloudy liquid. The sand will then settle to the bottom of the container as a sediment. Suspensions often need to be shaken or stirred before use to spread the sediment through the liquid.
Colloids
When two types of particles are mixed, they do not always separate out with time. Suspensions that do not separate easily are referred to as colloids These can be formed when a solid is suspended in a liquid, such as hot chocolate in milk. Occasionally, different particles are suspended in a gas. Fog is an example of this: small drops of water suspended in the air (Figure 4).

Figure 2 This glass of cordial is an example of a solution. The small cordial particles are dissolved evenly throughout the water.
solution a mixture of a solute dissolved in a solvent
DRAFT
Figure 3 A snow dome can be described as a suspension, with the larger “snow” particles being suspended in the water for a short time before they fall to the bottom of the dome to form a sediment.

suspension a cloudy liquid containing insoluble particles
sediment substance or matter that settles to the bottom in a mixture

Figure 4 Fog is a colloid because it is made up of suspended liquid particles in air.
The word “colloid” comes from the Greek word kolla , which means “glue”. You can think of a colloid as a substance being “stuck” – suspended – in another substance. The benefit of colloids is that there is no need to mix them before using them. Hair gel and hand cream are examples of colloids.
colloid a type of mixture that always looks cloudy, because clumps of insoluble particles remain suspended throughout it rather than settling as sediment
Suspension
emulsion a type of colloid in which two or more liquids are mixed together, with one suspended in the other as tiny droplets
Emulsions
An emulsion is a colloid of two or more liquids. Usually, one liquid is the “base” and the other is broken into tiny droplets spread throughout the base. Milk is an emulsion, with tiny droplets of fats and oils spread throughout the base, which is water (Figure 5).
In some cases, when mixtures like this are left to settle, the tiny droplets float above the base liquid. (This is different from what happens in a suspension, where the solid particles tend to fall to the bottom.) A substance called an emulsifier can be added to these mixtures to allow the liquids to remain completely mixed.

Figure 5 Milk is an emulsion because it contains many substances suspended in what is mainly water.
The most common emulsions we use are mixtures of different types of oil mixed with water and an emulsifier. Examples include food and drinks, and “emulsion” paints.
Check your learning 8.1 Check your learning 8.1
Retrieve
1 Define the term “pure substance”.
Table 1 Different types of mixtures
Type of mixture
Comprehend
2 Complete Table 1 below to summarise different types of mixtures.
Substances involved Appearance when light shines through
Separates on standing? Example
Suspension Solid + liquid Cloudy Yes, slowly Milo in milk
Emulsion
Colloid
Solution
Analyse
3 Use the particle theory to compare (the similarities and differences between) a pure substance and a mixture.
4 C ontrast (the differences between) the type of substances found in sea water and pure water.
5 C lassify the following substances as pure substances or a mixture.
a Cup of tea
b Soft dr ink
c Table salt
d Soap
e Olive oil
f Milkshake
Apply
6 P redict the types of particles you think the mixtures in question 5 might contain.
7 Use coloured pencils to draw a representation of a:
a pure substance
b heterogeneous mixture
c d ilute substance
d concentrated substance
e supersaturated substance.
Lesson 8.2 Challenge: Comparing different types of mixtures
Aim
To observe the characteristics of different mixtures
Part A: Dirty water
What you need:
• Soil
• Water
• Jar with screw-top lid
• Timer
What to do:
1 P ut some soil and water in the jar to create a watery mixture.
2 Screw the lid on tightly and then shake the jar. Observe the jar for 5 minutes.
• Describe the movement of the soil particles; for example:
• “ When the soil and water was shaken, it …”
• “After 5 minutes …”
• Identify the types of particles that may float, sink or stay suspended.
• Use the terms “solution”, “suspension” and “sediment” to describe the behaviour of this mixture.
• Identify the type of mixture that dirty water is.
Part B: Making a foam
Caution!
Check for egg or dairy allergies.
What you need:
• Cream or egg white
• L arge metal bowl
• H and or electric whisk
What to do:
1 W hip the cream or egg white in the bowl until it increases significantly in size and holds its shape.
• Ex plain why the foam you have created is classified as a colloid (by defining the term and comparing it with the mixture you have produced).
Part C: Mixing olive oil and water
What you need:
• Olive oil
• Water
• Jar with screw-top lid
• Timer
• Detergent
What to do:
1 Two-thirds fill a jar with equal parts of water and oil. Observe what happens and draw a labelled picture to record your observations.
2 Screw the lid on the jar tightly and shake the mixture vigorously (Figure 1A).
Observe what happens immediately after mixing. Record your observations; for example, “After mixing the oil and water …”
3 Wait 5 minutes and record your observations again; for example, “After leaving the mixture to sit for 5 minutes, it …”
4 Add a couple of drops of detergent to the mixture and shake the jar again (Figure 1B).
• De scribe how the mixture changes when you add the detergent; for example, “After adding detergent to the oil and water mixture and shaking it, …”
5 Wait 5 minutes and record your observations again; for example, “After leaving the mixture to sit for 5 minutes, it …”
• Ex plain what is happening using the terms “colloid”, “mixture”, “emulsion” and “emulsifier”.


Part D: Adding sugar to water
What you need:
• Water
• Table sugar
• Beaker or glass
• Teaspoon
What to do:
1 Add a small amount of sugar to water in a glass and stir.
• Describe what happens to the sugar; for example, “When sugar is added to a glass of water, it …”
Part E: Making perfume
What you need:
• L avender flowers
• Scissors
• Jar with a lid
• Methylated spirits
• Cotton bud
Figure 1 Olive oil and water (A) before and (B) after adding an emulsifier
What to do:
1 Cut the lavender flowers (Figure 2) into tiny pieces and place them in the jar.
2 Cover the lavender flowers with methylated spirits.
3 Seal the jar and leave overnight.
4 T he following day, dip the cotton bud in the methylated spirits.
5 A llow the methylated spirits to evaporate and then smell the cotton bud.
• Ex plain why this mixture is a solution. Identify the solute and the solvent.
• P redict if this experiment would work if you put the lavender flowers in a jar of water.
• Ex plain why it is important that the methylated spirits evaporate easily.

Lesson 8.3
A solution is a solute dissolved in a solvent
Key ideas
→ If a substance does not dissolve, it is insoluble.
→ A solvent can be used to dissolve a solute.
→ A dilute solution has very little solute in the solvent.
→ The more solute that is dissolved in the solvent, the more concentrated the solution.
→ A solution is saturated when no more solute will dissolve.
→ Water is a good solvent.
Solubility and insolubility
In some places in Australia, the water from the local water supply has an unpleasant taste, or washing with soap is difficult because the water forms a scum instead of a foamy lather. In these cases, the water contains metal salts that affect its taste and
Learning intentions and success criteria
Check the next lesson for a linked practical activity or experiment.
Figure 2 Lavender is often used in perfume.
soluble can be dissolved in a liquid insoluble cannot be dissolved in a liquid
solute a substance that dissolves in a liquid (solvent)
solvent a liquid in which other substances (solutes) dissolve
dilute containing a small number of solute particles in the volume of solution concentrated containing a large number of solute particles in the volume of solution
behaviour. Because they are so small, these metal salts do not fall to the bottom or float on the top; instead, they remain evenly spread through the liquid. The resulting mixture (a solution) is clear – light will shine through it. We say that the metal salts have dissolved in the water.
A substance that is able to dissolve in a liquid is considered to be soluble, whereas a solid that cannot dissolve is described as insoluble. The substance dissolving is called the solute, and the liquid into which it dissolves is called the solvent. An example of this is salty water. The salt is the solute, and the water is the solvent. Sometimes it is necessary to help a solute such as salt to dissolve. Stirring or warming the solvent (water) is the most common way of making a solute dissolve faster.
Working with solutions
A solution is a solute dissolved in a solvent (Figure 1). Solutions can be compared in terms of their concentration: how much solute is in the solvent. If just a little solute is dissolved, the solution is described as dilute (low concentration). If a lot of a solute is dissolved, the solution is described as concentrated (high concentration) (Figure 2 and Figure 3).

than all that salt!
saturated describes a solution in which no more solute can be dissolved
It is only possible to dissolve a certain amount of a particular solute in a solvent. If no more solute can dissolve into a solution, the solution is described as saturated. If even more solute is added, the solution becomes supersaturated. This means that the extra solute does not dissolve and often sits at the top or bottle of the container. This might be why the taste of a hot chocolate drink becomes stronger (more concentrated) as you get to the bottom of the cup.
We often work with solutions in our everyday lives. By adding solutes to pure liquids, the properties of the pure liquids may change. An example is adding bath crystals to a bath to give the water a pleasant smell.
Water as a solvent
Water is a good solvent. This is one of its most important properties and why it is often called the universal solvent. Our digestive system uses water to dissolve our solid and liquid food, and to break up the food into nutrients that our body needs to build new cells, grow and repair.
Solvent particles
Solute particles
Figure 1 A solute dissolves in a solvent to create a solution.
Solute particle
Dilute solution Concentrated solution
Figure 2 A concentrated solution contains more solute particles in a given volume than a dilute solution.
Figure 3 The concentration of salt in the Dead Sea is so high that when people try to swim in it, they float instead because their body is less dense
Our bodies are more than 60 per cent water. Our blood, which is mainly water, transports oxygen to every cell and carries away dissolved carbon dioxide gas (a waste product).
Humans are not the only living things that depend on water as a solvent. Without water’s ability to dissolve gases, there would be no underwater life in our oceans and lakes and no fish in the rivers. These creatures all live by extracting dissolved oxygen gas from the water (Figure 4).

Imagine that you found a colourless and see-through liquid and were really thirsty. Is it water? There are many other colourless and clear liquids, and you do not know what substances might be dissolved in them. Tasting may be dangerous. There are more scientific ways of working out whether a liquid is pure. This is explored further in Lesson 8.6 Mixtures can be separated according to their properties (page 351).
Check your learning 8.3
Check your learning 8.3
Retrieve
1 Define the following “s” words used in this section.
a Solute
c Solution
e Saturated
b Solvent
d Soluble
2 Someone asks for a dilute glass of cordial. Identify if you would add a lot of cordial or only a little.
Comprehend
3 C ontrast the (differences) between the following terms.
a Soluble and insoluble
DRAFT
b Solute and solvent
c Concentrated and dilute
4 Ex plain if you can see the particles of a solute in a solution.
5 Ex plain why water is described as the universal solvent.
6 You decide to make a bowl of green jelly. You add water to a bowl and pour in the jelly crystals.
a Describe how you could make the jelly crystals (the solute) dissolve faster in the water (the solvent).
b You decide to add another packet of jelly crystals to the water to make the jelly sweeter but the jelly crystals won’t dissolve. Explain what has happened to the jelly solution.
Analyse
7 C ompare (the similarities and differences between) the solubility of particles in suspensions, colloids, emulsions and solutions. (HINT: refer back to Lesson 8.1 Mixtures are a combination of two or more substances (page 340) if required.)
Skills builder: Questioning and predicting
8 P redict what would happen to a teaspoon of sugar particles when the particles dissolve in a cup of water. (THINK: What do you know about solutions, solutes and solvents?)
Figure 4 Oxygen dissolved in water is essential for aquatic organisms.
Lesson 8.4
Experiment: What if salt was dissolved in water?
Aim
To investigate whether a mixture of salt and water forms a solution
Materials
• Water
• Test tubes
• Test-tube rack
• Spatula
• Salt
• 10 m L measuring cylinder
Method
1 Add 5 c m of water to a test tube.
2 Add 1 spatula of salt to the test tube. Carefully stir the mixture. Observe what happens to the mixture.
• Ex plain why this mixture is called a solution.
• Identify the solute and the solvent.

Inquiry: What if other substances were mixed with water?
Use the following powders to design your own experiment to answer the inquiry question.
• Copper carbonate
• Bath salts
• Talcum powder
• Brown sugar
• F lour
Use the following steps to support your planning.
Planning your experiment
1 Identify the independent variable that you will change from the first method.
2 Describe how you will know if your powders are able to form a solution.
3 L ist three variables you will need to control to ensure a reproducible test. Describe how you will control each variable.
4 Identify the equipment you will need to complete this experiment.
5 P redict which powders will form a solution.
6 Develop a method for your experiment. (Hint: Use the method above as a guide.)
7 C onstruct a table that shows the powder you are testing, your prediction and your results.
8 Show your teacher your planning to obtain approval before starting your experiment.
Figure 1 Dissolving salt in water
Results
Complete your experiment by filling in your table of results.
Discussion
1 Identify which substances were soluble in water.
2 Identify which substances formed a suspension.
3 Identify which substances took the longest to dissolve.
4 Compare your results with those of the rest of the class. Explain any unexpected results.
5 Name two other substances you know dissolve in water.
6 Use the results of your experiment to complete the following sentence: “Water is a good solvent because …”
7 Describe how you could change this experiment to find out more about dissolving substances.
Conclusion
Lesson 8.5
Experiment: What if the solvent was heated when making a mixture?
Caution!
Do not eat or drink in the laboratory. Hot plate may cause burns – do not touch.
Many solutes dissolve only in certain solvents. Some dissolve very slowly and, when they do, only a certain amount of solute dissolves before the solution becomes saturated.
DRAFT
Define the terms “solution” and “dissolve” by using examples from your experiment.
Aim
To investigate ways to alter the rate (speed) at which a solute dissolves and/or the amount of solute that will dissolve
Materials
• Measuring cylinder
• M ilk
• Small beaker
• Teaspoon
• M ILO ®
• T hermometer
• Hot plate to heat milk
Method
1 Measure out 50 mL of milk using the measuring cylinder and add it to the small beaker.
2 Carefully measure 1 teaspoon of MILO by smoothing the surface until it is even with the edges of the spoon.
3 Add the spoonful of MILO to the milk and stir until it dissolves.
4 Repeat steps 2 and 3 until the MILO no longer dissolves.
5 Identify how many spoonfuls of MILO dissolved in the room temperature milk. Record your results; for example, “The number of level teaspoons of MILO dissolved in 50 mL of room temperature milk was …”
Inquiry:
What if the milk was heated?
Plan and conduct an experiment that answers the inquiry question.
1 Identify the independent variable that you will change from the first method.
2 Identify the dependent variable that you will measure to determine if it was changed by the independent variable.
3 Identify three variables you will need to control to ensure a reproducible test. Describe how you will control each variable.
4 Identify the equipment you will need to complete this experiment.
5 P redict how many spoonfuls of MILO will dissolve in warm milk.
6 Develop a method for your experiment. (Hint: Use the method above as a guide.)
7 C onstruct a table to record your results.
8 Show your teacher your planning for approval before starting your experiment.
Results
Complete your experiment, and record your results in the table you prepared.
Discussion
1 Describe how the amount of MILO that dissolved changed when the milk was heated.
DRAFT
2 Identify a variable that was difficult to control. Describe how you would change your method to make your results more reproducible in the future.
3 Describe a situation in everyday life that would benefit from understanding the results of your experiment.
Conclusion
Describe how heating a solvent affects the amount of solute that can be dissolved.

Figure 1 MILO must be used in this experiment because of the way it dissolves. What might happen if you used a different chocolate mix?
Lesson
8.6 Mixtures can be separated according to their properties
Key ideas
→ Properties are how a substance looks (size, mass, texture, shape, volume) and how it behaves around other substances (magnetic, soluble).
→ A magnet can be used to separate particular metals.
→ Decanting can be used to separate sediment from a liquid.
→ Aboriginal and Torres Strait Islander Peoples used winnowing to separate seeds from their lighter husks and pods.
Simple separation
Some mixtures are quite simple to separate. Sometimes we can simply pick out the bits we need to separate. The Alyawarre, Anmatyerre, Warlpiri and Pitjantjatjara peoples in the desert parts of the Northern Territory use their fingers to individually separate the good desert raisins (Solanum centrale) from the stalks and rotten fruit (Figure 1). This leaves the ripe fruit that is good for eating. This works well if there is a small number of raisins that are big enough to see. But what if the raisins were too small to see? You may need another way of separating out your favourite fruit.
Magnetic separation

Learning intentions and success criteria
DRAFT
Do you separate recyclables from your rubbish? Have you ever wondered how the different recyclable materials are separated once they are out of your house?
Magnetic separation uses magnets to attract and separate particular objects. Some metals are magnetic. Magnetic substances are attracted to a magnet. They are made of iron or a mixture containing iron.
Magnetism will only separate substances containing iron, cobalt and nickel, so magnetic materials, such as iron nails, can be separated from other non-magnetic materials, such as glass, aluminium and paper.
Iron cans are magnetic, whereas aluminium cans are not. Sometimes large magnets are used to separate iron cans in the rubbish from aluminium cans (Figure 2). This means both types of cans can be recycled in different ways.
Check the next lesson for a linked practical activity or experiment. magnetic separation the process of using magnets to separate magnetic materials from non-magnetic materials
Figure 1 Aboriginal and Torres Strait Islander Peoples use different techniques to separate mixtures.
decanting a technique used to separate sediment from the liquid it is in by carefully pouring the liquid away


DRAFT
Decanting
Have you ever had a piece of food in the bottom of your drink? Did you use a spoon to remove it? Or maybe you carefully poured your drink into another glass, leaving the food behind? The careful pouring of liquid, or decanting, is often done to remove high density sediment from wine (Figure 3).
The objects or liquids that sink are denser than the liquid on the top. The particles in dense objects are packed together more tightly than those in less dense objects. Oil floats on top of water because the particles in the oil are packed very loosely. The water particles pack together more tightly, so they sink to the bottom below the oil.
The particles in a grain of sand are packed together very tightly. The sand is more dense than water. Therefore, the sand settles to the bottom of a glass of water. The sand forms a sediment in the glass.

Figure 3 Decanting separates the undrinkable sediment from the wine.
Figure 2 Magnets can be used to separate (A) iron cans, which are magnetic, from aluminium cans (B), which are not.
Sedimentation and flotation
Sedimentation is the process of particles settling to the bottom of a mixture, while flotation is the process of particles floating to the top of a mixture. Sedimentation and flotation are used in sewage treatment to separate the mixture of substances (Figure 4). Sewage is left in settling ponds to allow the more dense sediment to settle to the bottom. Less dense fats and oils float to the top of the ponds and can be scooped off for digestion by bacteria.
Oil spills can be cleaned up because oil is less dense than water and floats on the surface (Figure 5). Cork and other substances can be sprinkled on top of the oil to soak it up, and these substances are then scooped off and squeezed out.
In certain situations, when sedimentation is more difficult, chemicals called flocculants can be added to a mixture to make suspended particles clump together. This makes them more dense so they settle to the bottom. Flocculation is regularly used to separate substances from water.


How Aboriginal and Torres Strait Islander Peoples separate mixtures
Some mixtures can be separated by their ability to be blown or floated away. The Alyawarre people of the Sandover River in the Northern Territory separate mixtures using these properties. In one technique, a variety of local seeds are collected before being beaten with sticks to remove the seeds from their pods or the surrounding husks. Winnowing is a process of gently throwing the seeds and the lighter husks and pods into the air. The heavier seeds fall straight back into the container, while the lighter husks or seed pods are blown away.
sedimentation the process of a substance settling to the bottom in a mixture
flotation the action of floating in a liquid or gas
DRAFT
flocculant a chemical added to a mixture to make suspended particles clump together
flocculation a process that clumps together suspended particles so they form a sediment
The Yindjibarndi people in Western Australia separate sand and dirt from seeds in a process called yandying. This technique involves placing the mixture in a shallow wooden dish called a yandy (or a coolamon or piti in other parts of Australia). The dish is then gently shaken back and forth. The dense sand sinks to the bottom and the less dense dirt and larger seeds float on the surface, allowing them to be collected for food or growing. This process is very similar to gold panning.
winnowing the use of air to separate of heavier seeds from lighter husks and seed pods; separation technique used by Aboriginal and Torres Strait Island peoples yandying the use of a shallow dish to separate grains of different densities; separation technique used by Aboriginal and Torres Strait Island peoples
Figure 4 Sewage treatment involves sedimentation and flotation.
Figure 5 Oil floats on the surface of water.
Check your learning 8.6
Check your learning 8.6
Retrieve
1 Define the following terms.
a Sediment
b Flocculant
c Decant
d Magnetism
Comprehend
2 Describe the property that allows the separation of tin cans from aluminium cans.
3 Ex plain why flotation allows oil spills to be cleaned up more easily.
4 Use an example to describe what can be done to encourage sedimentation if a suspension does not separate.
Lesson 8.7
5 Use an example to describe a situation where people need to separate a mixture by hand.
Apply
6 Discuss a situation where magnetism cannot be used to separate a mixture. Evaluate how the properties of the materials cause this problem.
Skills builder: Planning investigations
7 You’ve been asked to separate a mixture of sand, iron filings and chocolate chips. Identify a list of equipment you will need to perform this task. (THINK: What separation processes will you need to perform? What equipment do each of these processes need? What about safety equipment?)
Experiment: What if a flocculant was added to muddy water?
Caution!
Handle the aluminium sulfate solution with care; wear eye protection and avoid contact with skin.
DRAFT
Materials
• Muddy water (3 g d irt in 50 m L water)
• 2 ja rs or beakers
• M arker pen
• Test tubes
Aim
To investigate the effect of a flocculant when separating a mixture
• 0.5 M a luminium sulfate solution
• 0.5 M sodium carbonate solution
• Timer
Method
1 H alf fill two jars with muddy water and label one jar “A” and the other jar “B”.
2 Add half a test tube of aluminium sulfate solution to jar A.
3 Slowly add half a test tube of sodium carbonate solution to jar B.
4 L eave both jar A and jar B undisturbed for approximately 15 minutes.
5 Record your observations, comparing the water in jar A with that in jar B; for example:
• “After 15 minutes, the muddy water and aluminium sulfate in jar A was …”
• “After 15 minutes, the muddy water and sodium carbonate in jar B was …”

Inquiry:
How much flocculant is needed to effectively separate a mixture of mud and water?
Flocculants can often be the most expensive part of a separation process. To make the process cheaper, scientists will often try to work out the minimum amount that is needed to complete the process. Design an experiment
to determine the how much of a flocculant is needed to separate the muddy water mixture.
1 Identify which flocculant you will test.
2 Identify the amounts of the flocculant that you will add to the muddy water mixture.
3 Describe how you will measure if the muddy water is separated enough. (Hint: How much light should shine through the mixture?)
4 Name three variables you will keep the same as those in the first method.
5 Develop a method for your experiment. (Hint: Use the method above as a guide to having a reproducible test.)
6 C onstruct a table to record your results.
7 Show your teacher your planning to obtain approval before starting your experiment.
Results
Complete your investigation, filling in your table of results.
Discussion
1 Describe the effect the aluminium sulfate solution had on the muddy water.
2 Describe the effect the sodium carbonate solution had on the muddy water.
3 Identify which of the two substances –aluminium sulfate or sodium carbonate –acted as a flocculant. Justify your answer by providing data from your results.
4 Ex plain why it might be important for water treatment plants to minimise the amount of flocculant added to wastewater.
Conclusion
Describe the effect a flocculant has on some mixtures.
Figure 1 Adding a flocculant to muddy water
Learning intentions and success criteria
Lesson 8.8 Mixtures can be separated according to their size and mass
Key ideas
→ Large particles (residue) can be separated from liquids (filtrate) by filtering.
→ Sieving separates different sized particles, allowing smaller particles to pass through while capturing the larger particles.
Check the next lesson for a linked practical activity or experiment.
filtering a technique used to separate differentsized particles in a mixture depending on the size of the holes in the filter used
filtrate substance that has passed through a filter suspension a cloudy liquid containing insoluble particles
DRAFT
→ Heavy particles (more mass) can be separated from light particles (less mass) by using a centrifuge.
Filtering and sieving
Anyone who has cooked pasta will probably have used a colander to separate the boiling water from the cooked pasta. The holes in the colander are designed to let the water through, but not the cooked pasta.
Filters have a series of holes in them that let through small things but trap larger particles. A grate on a storm-water drain is an example of a filter. The grate lets the water through while filtering out the leaf matter and rubbish. Fly-screens on windows and doors filter bugs and some dust from the air, and tea bags filter the leaves from the liquid (Figure 1).
Filtering separates solids from liquids (or solutions) as the particles of the solution or liquid are smaller than the size of the holes in the filter. Particles that pass through the filter are called the filtrate. The filtrate passes through the filter and the residue is left behind in the filter. Some filters can separate particles from a gas. Vacuum cleaners separate small dust particles from the suction air.
Filter paper has holes that are too small to see. Solutions can flow through the filter paper because the particles in the solution are small enough to fit through the holes; however, most solid particles in suspensions are not (Figure 2).
Different filter papers come with different sized holes. Coffee filters and the filters found in vacuum cleaner bags are both made of paper filters. High-efficiency particulate arrestance (HEPA)

1 Tea
Figure 2 Filters are used in science to separate substances. The filtrate passes through the filter paper, leaving behind the residue.
Figure
bags are a common household filter. Filter paper
Filtrate
filters are used in vacuum cleaners, air conditioners and face masks to remove even tiny dust particles.
Sometimes filters remove substances using chemicals rather than by physically stopping them. Gas masks often contain a special type of charcoal that attracts and holds onto some poisonous gases (Figure 3).

Sieving, on the other hand, separates solids according to the size of their particles (Figure 4). When you use a sieve, anything that is smaller than the hole can pass through and the larger solids are left behind in the sieve. Sieves can separate solids of different sizes.
Centrifuging
Sometimes particles in a suspension are very similar in size and density and they do not easily separate. In these cases, the particles need to be separated by using how heavy they are (their mass).
Some playgrounds have equipment that spins around very fast. When you spin very fast on this equipment, you can feel a pull towards the outside of the spin. Heavy objects feel the pull more than light objects.
Centrifuging separates particles according to their size and density by spinning a mixture. A centrifuge is a machine that spins very quickly. In a laboratory, small test tubes of mixtures are fixed to the inside of the bowl of the centrifuge. The spinning motion causes the heavier particles to move to the bottom of the tubes.
DRAFT
sieving a separation technique based on the difference in particle size
Centrifuges are used in medical research and at blood banks. When blood is spun in a centrifuge, the red blood cells, which are heavier, sink to the bottom of the test tube, leaving the yellowish liquid part of blood (plasma and platelets) at the top (Figure 5). Medical professionals use different parts of blood depending on the medical need.


5 When blood (A) is separated by a centrifuge, the red blood cells collect at the bottom of the tube and the less dense liquid, the plasma and platelets, collects at the top (B).
centrifuging a technique used to separate light and heavy particles by rapidly spinning the mixture
Gravel Sand
Gravel + sand mixture
Figure 4 Sieves can be used to separate solids of different sizes, such as gravel and sand.
Figure 3 A gas mask uses activated charcoal to filter poisonous gases.
Figure
Centrifuges are used in dairy processing factories to separate cream from milk. Salad spinners and washing machines also use centrifuges (Figure 6).

Check your learning 8.8
Check your learning 8.8
Retrieve
1 Recall the missing words and use them to complete the following sentences. Filtering is like using a ______________ . The _______________ lumps are caught in the sieve, and the _______________ goes through the _______________ paper. The substance caught in the filter paper is called the _______________ . The substance that passes through is called the _______________ .
2 Name a place where centrifuges are used. Identify the two substances that are in the mixture and describe how the centrifuge is used to separate them.
3 Describe an example of a filter that is used to separate a solid from air.
Analyse
DRAFT
4 Identify the filters used around your home and school. Identify the substances that these filters allow to pass through them and the substances they collect.
5 C ontrast (the differences between) each of the following pairs.
a Mixture – pure substance
b Sedimentation – flotation
c Residue – filtrate
Apply
6 Discuss how a forensic scientist who is investigating a crime could compare a mixture of different types of dirt, sand and leaves found in a suspect’s car with a similar mixture found at the crime scene.
7 I n traditional times, the Gunditjmara people of south-western Victoria used honeysuckle cones from banksia trees as filtration straws. The straws allowed them to separate clean water from muddy pools. Justify why this is an example of a filter. (HINT: Compare how a filter works with how the honeysuckle cones work.)
Skills builder: Problem solving
8 A doctor needs to extract plasma and platelets from a patient’s blood. She is given two options to perform this task: a centrifuge and a filter.
a Identify which of these separation techniques the doctor should use. (THINK: What is the best way to separate two liquids that have different densities?)
b Justify your choice. (THINK: Why did you choose this option? Why not the alternative method?)
Figure 6 A spinning washing machine is a centrifuge, separating water from the clothes.
Lesson 8.9
Experiment: What if you centrifuge tomato sauce?
Caution!
Do not eat or drink in the laboratory.
Aim
To separate the components of tomato sauce by centrifuging
Materials
• Test tubes to fit centrifuge
• M arker
• D ifferent brands of tomato sauce
• Centrifuge
• Ruler Method
1 L abel your test tube with your name and add tomato sauce to the bottom half of the test tube.
2 Pass your test tube to the teacher and observe how the centrifuge is set up so that each side of the centrifuge is balanced.
3 E xamine your test tube when the centrifuge completes the separation.
4 Use a ruler to measure the amount of each separated component of tomato sauce.
5 D raw your test tube after centrifuging. Identify and label the layers of the tomato sauce (i.e. water, tomatoes).
Inquiry: What if different brands of tomato sauce were centrifuged?
Different brands of tomato sauce have different ingredients in different amounts. Design an experiment to compare different brands.
1 Identify which brand of tomato sauce you will test.
2 Identify the independent variable you will change in this experiment.
3 Identify what effect you expect to see on the dependent variable that you will measure and/or observe.
4 Identify two variables that you will need to control to ensure a reproducible test. Describe how you will control them.
5 Develop a method for your experiment. (Hint: Use the method above as a guide.)
6 C onstruct a table to record your results.
7 Show your teacher your planning to obtain approval before starting your experiment.
Results
1 D raw and label the various layers of the tomato sauce you selected.
2 Compare your results to those from the rest of the class.
3 C onstruct a column graph showing the type of tomato sauce and the amount of each component.
Discussion
1 Describe the differences you noticed between the different brands of tomato sauce after they had been centrifuged.
2 Ex plain why the different types of tomato sauce might vary in their components.
3 Identify which brand of tomato sauce had less water in the mixture. Use evidence from your results to support your claim.
4 C ompare your results to others in the class. Identify if the results from another group conflicted with your results. Describe how you could resolve this conflict.
Conclusion
Describe how centrifuging can be used to separate the components in a mixture.
Lesson 8.10
Learning intentions and success criteria
Check the next lesson for a linked practical activity or experiment.
DRAFT
boiling point the temperature at which a liquid boils and becomes a gas
The boiling points of liquids can be used to separate mixtures
Key ideas
→ The different particles in a mixture will often have different boiling points.
→ The substance with the lowest boiling point will evaporate first.
→ When a solvent evaporates, it will leave behind crystallised solute.
→ If the evaporated solvent is cooled it will condense into a liquid in a process called distillation.
Evaporation and crystallisation
When water in a saucepan is heated, it will quickly start to boil. This means the liquid evaporates: it becomes a gas. Every substance evaporates at different temperatures. Table 1 shows the boiling points of some common liquids.
The different boiling points of liquids can be used to separate them in a mixture. A mixture of water and turpentine can be easily separated because the water will evaporate first. It is more volatile than the turpentine. This means the water will become a gas (water vapour) and move away from the turpentine. Eventually only turpentine will be left behind because it does not become a gas as easily (less volatile).
Table 1 Boiling points of common liquids
Evaporation can also be used to separate the parts of a solution. Salt evaporates at 1,414°C. When a mixture of salt and water is heated, the water is more volatile and evaporates first, leaving behind the salt crystals (Figure 1). This process of evaporating the solvent (the water) and leaving behind the solute (salt) is called crystallisation
Distillation

What if we want to keep the substance that has the lowest boiling point (highest volatility)? Collecting drinkable water from sea water is difficult if all the water evaporates into the air. Distillation uses the different boiling points of liquids to separate components of a mixture.
During distillation, the liquid mixture is boiled in a container such as a flask. When the liquid with the lowest boiling point (highest volatility) evaporates, its gas travels up and out of the flask to another part of the distillation apparatus called the condenser. The gas vapour collects on the cool surface of the condenser and becomes condensation (liquid). The condensation in the condenser drips into a container separate from the original mixture. The liquid collected at the end of the distillation process is called the “distillate” (Figure 2 and Figure 3).
evaporation a change in state from liquid to gas; also a technique used to separate dissolved solids from water crystallisation a separation technique used with evaporation to remove a dissolved solid from a liquid; after the liquid has been evaporated the solid remains, often in the form of small crystals distillation a technique that uses evaporation and condensation to separate a solid from the solvent in which it has dissolved

Figure 1 Water will evaporate from a mixture of salt and water, leaving behind salt crystals.
Clamp
Figure 2 Distillation equipment
Figure 3 Whisky production uses distillation.
Distillation is a process used by many Aboriginal and Torres Strait Islander Peoples to separate the medicinal oils from eucalyptus plants. When the leaves are placed in water over a fire, the heat causes the leaves to break apart and the water and eucalyptus oil are released into the air. If someone is sick, they might lean over the steam to breathe in the eucalyptus oil. This could ease their breathing. If the steam is collected, it will contain a mixture of eucalyptus oil and water. This mixture can then be separated in a slower distillation process that uses the different boiling points of the two liquids (Figure 4).
Check your learning 8.10
Check your learning 8.10
Retrieve
1 Recall the difference between evaporation and crystallisation.
Comprehend
2 Identify an example of a mixture that could be separated by evaporation and crystallisation. Explain why distillation may not be appropriate.
3 Ethanol is an alcohol that boils at 78°C, while water boils at 100°C. In a mixture of alcohol and water, explain which liquid would be the first collected through distillation. (HINT: The word “explain” means you need to provide a reason why.)
4 Identify the separation technique that is being conducted in Figure 5.
Apply
5 C reate a scientific diagram of the equipment set-up that could be used to produce pure water from sea water by distillation.
6 P ropose how you would answer question 5 without using the science equipment found in a laboratory.

Skills builder: Conducting investigations
7 D raw and label the equipment set-up that could be used to produce pure water from sea water by distillation. (THINK: What equipment do you need for distillation and how could it be assembled?)

Figure 4 Eucalyptus oil can be distilled from eucalyptus leaves to use as a medicine. This was first discovered by Aboriginal and Torres Strait Islander Peoples.
Figure 5 Conducting a separation technique
Lesson 8.11
Experiment: Crystallisation of salt water
Caution!
Wear safety glasses and lab coat, and tie long hair back when using a Bunsen burner.
Aim
To separate a salt from a solution by evaporation and crystallisation
Materials
• Concentrated salt solution
• 250 mL beaker
• Evaporating dish
• C lay triangle
• Tr ipod
• Bunsen burner
• Heatproof mat
• M atches
• M agnifying glass
Method
1 Collect a sample of the salt solution in the beaker.
2 H alf fill an evaporating dish with the salt solution.
3 Place the evaporating dish on the clay triangle over the tripod.
4 Safely light the Bunsen burner and place it under the tripod on the heatproof mat. Open the collar on the Bunsen burner to produce a blue flame. Refer to Lesson 1.13 Skills lab: Lighting and using a Bunsen
burner (page 42) if you need help safely lighting a Bunsen burner.
5 Heat the evaporating dish.
6 W hen the solution starts boiling, half close the Bunsen burner collar. (Do not change to a yellow flame – this is not the same.)
7 Add more solution to the dish as the level drops due to evaporation. Be careful as the evaporation nears completion because the hot salt may spit and splatter.
8 Turn off the Bunsen burner when just a little liquid remains with the salt. Leave the dish to cool.
9 E xamine the salt crystals with a magnifying glass.
Results
Draw a diagram of the salt crystals in your notebook.
Discussion
1 Ex plain how effective this method would be if the solution contained a mixture of more than one solute.
2 Identify where the water solvent in the solution went. Describe how the solvent could be collected.
Conclusion
Explain how evaporation and crystallisation can be used to separate a mixture of salt and water.
Lesson 8.12
Challenge: Design a way to purify water from sea water
Aim
To obtain drinking water by removing the salt from sea water
Design brief
You are preparing for a natural disaster that will affect the water supply. Using materials available from a supermarket, design an arrangement of equipment that will enable you to provide drinking water for a single person from sea water indefinitely.
Criteria restrictions
• Your materials must be available in a supermarket or your home.
• You must provide the cost of building your equipment.
• Your only available heat source is the Sun.
Planning and conducting
• How will you heat the water so that it evaporates?
• How will you collect the water vapour?
• How will you cool the water vapour so that it condenses?
Processing, analysing and evaluating
DRAFT
• D raw a labelled diagram of your design.
• Build a prototype of your design.
• C heck the effectiveness of your design with a test.
• I mprove your design as required and test your design again. Repeat this process until your design works effectively.
1 Describe the changes you made to improve your design.
2 Identify the most successful feature of your design. Identify the least successful feature of your design.
3 Ca lculate the final cost of your design.
4 Describe a situation where your design could be useful.
5 Describe how you could modify your design to improve its effectiveness.
Communicating
Present the various stages of your design process in a formal scientific report.

Figure 1 Natural disasters can affect water supply.
Lesson 8.13
Solubility can be used to separate mixtures
Key ideas
→ Some substances are able to dissolve more easily in solvents than others.
→ Paper chromatography and gas chromatography can be used to separate mixtures of substances that have different solubilities.
Solubility
Another property that can differ between substances is solubility. Solubility describes how easily a substance dissolves in a solvent.
Some dyes have a higher solubility than others. This can be used to separate them from one another. Many dyes are small particles that are suspended in a solvent. They are usually made from plants or minerals.
The Ancient Greeks made a mixture of soot and vegetable gum that could be used for writing. One thousand years later, the Chinese made red ink from mercury sulfide and black ink from iron sulfate mixed with sumac tree sap. Today, many of the inks in textas are made of a mixture of dyes. We can separate these dye mixtures because the dyes have different solubilities.
Chromatography
Chromatography is a technique used to separate substances according to their differing solubilities. Scientists use chromatography to separate mixtures into their different parts. This makes it easier to compare and identify mixtures in sciences like forensics.
Paper chromatography is a common way to separate a mixture. Paper chromatography works when the end of an absorbent paper with ink on it is dipped in water, allowing the water to slowly move up the paper. As the water moves past the ink (dye mixture), the most soluble dye dissolves more easily and moves along with the water. The other dyes in the mixture take longer to dissolve and are less mobile. This means they are slower to move up the paper. Finally, the paper has a series of smudged dye colours running up to the top (Figure 1). The coloured dye that is the most soluble is at the top, whereas the dye that is least soluble is at the bottom.
Learning intentions and success criteria
DRAFT

Check the next lesson for a linked practical activity or experiment.
solubility how easily a substance dissolves in a solvent
chromatography a technique used to separate substances according to their differing solubilities
Figure 1 Chromatography is used to separate samples, such as the dyes in inks.
More complex and sensitive chromatography instruments are used to separate mixtures, such as drinks and polluted air. Science laboratories often have chromatography equipment that can be used to detect 1 g of a substance in thousands of litres of solution, even if it is mixed with many other substances (Figure 2).

Chromatography works because different substances move through the chromatography equipment at different times, and produce a graph (called a chromatogram) like the one shown in Figure 3. The area under each peak tells the scientist how much of a particular substance is in the mixture. The higher the area under a peak, the more a substance is present.
0102030405060708090100110
3 A
One of the uses of chromatography today is to identify athletes who use banned substances when they compete by testing their urine. A chromatography machine separates all the substances in the urine, including any illegal drugs that leave the body. Airport security also tests for illegal drugs. A piece of chromatography paper is wiped over a person or their bag and then inserted into a machine (Figure 4). A gas is pushed through the paper. If the drug is soluble in the gas, it will dissolve and be detected by the sensors.

Figure
gas chromatogram obtained from performing chromatography shows what is in an alcohol mixture.
Figure 2 Performing gas chromatography
Figure 4 Airport security uses chromatography to test for illegal drugs.
Check your learning 8.13
Check your learning 8.13
Retrieve
1 Name the substances that were used to make the first inks.
2 Recall the solvent that is used in chromatography when testing for drugs at airports.
3 Define the term “solubility”.
Comprehend
4 Ex plain how chromatography can be used to separate inks and dyes.
5 Describe an example of chromatography being used in real life to separate a substance.
Apply
6 Some people think they can disguise drugs at airports by putting them in a strong-smelling substance, such as coffee beans (Figure 5). Discuss why this will not work with airport security that uses chromatography.

Skills builder: Planning investigations
7 Using scientific language, write a logical procedure for separating the ink in textas (or felt-tip pens) using paper chromatography. (THINK: What order do you need to perform each step? Use the information to recall how chromatography works.)
Remember that when you write a method, you should start each step with a verb and use the third person – avoid “I”, “we” and “you”.
Lesson 8.14
Challenge: Separation challenge
Design brief
How can you separate the different parts of a sand, iron filings, sawdust and salt mixture?
Now that you are a scientist who has trained in separating techniques, it is time to separate a mixture of sand, salt, sawdust and iron filings.
Criteria restrictions
You may only use equipment available in the laboratory.
Figure 5 Coffee beans
Questioning and predicting
• T hink about the properties of each pure substance that is in the mixture. This may help you to decide on a way to separate the substances. Copy Table 1 and write what you know about the properties of sand, iron filings, sawdust and salt.
• Discuss with a partner some possible ways to separate the four substances.
Substance Soluble in water?
Sand
Iron filings
Sawdust
Salt
Attracted to a magnet?
Floats/ sinks in water?

Planning and conducting
• D raw a flow chart showing the steps you will take to separate the four substances.
• Develop an aim and a materials list for your experiment.
• Develop a detailed method for separating the substances. Include at least two diagrams.
• Describe three safety issues that you need to consider when completing this experiment.
• H ave your plan checked by your teacher.
• Conduct your separation experiments and record your observations.
DRAFT
Processing, analysing and evaluating
1 Describe the unique properties of each component of the mixture that allowed you to separate them.
2 Describe the different components that you were able to separate from the mixture including the colour and texture of each final sample.
3 Describe the purity of each of your final samples by describing any contaminants that may have been mixed in the initial pure samples.
4 Describe one way you would change your method to improve the amount or the purity of your final samples.
Communicating
Present your investigation in a formal scientific report.
Table 1 The properties of sand, iron filings, sawdust and salt
Figure 1 Some of the equipment you may need for the separation challenge
Lesson 8.15
Experiment: Who wrote the nasty note?
Background
Your forensic laboratory is investigating a crime of extortion: one person is forcing or frightening another into handing over money.
The police have identified that the extortion note was written with a black felt-tip pen. They have collected a black felt-tip pen from each of the three suspects: Aunt Aggie (A), Cousin Cranky (C) and Uncle Buncle (U).
Other forensic scientists in your laboratory have already run a chromatography test on the note written by the extortionist. After you have tested the three pens from the suspects, collect the chromatogram for the original note from your teacher for comparison.
Aim
To separate the inks from three different watersoluble black felt-tip pens
Materials
• Filter paper or chromatography paper
• Scissors
• Pencil
• Ruler
• 3 black water-soluble felt-tip pens – they must all be different brands and labelled “A”, “C” and “U” (Note: Permanent markers are not suitable for this experiment because they are not water-soluble.)
Method
1 Cut the filter or chromatography paper into three strips, each measuring approximately 2 cm × 10 cm.
2 D raw a faint pencil line across the width of each paper strip, 3 c m from the bottom.
DRAFT
• Salt solution (1 per cent)
• 250 mL beaker
• Glass rod or ice cream stick
• Timer
3 L abel the first strip “A”, the second strip “C” and the third strip “U”. Make sure the label is at the very top of the paper strip.
4 Carefully trace over the pencil line at the bottom of A with the felt-tip pen labelled A, as shown in Figure 1. (Do not make the line too thick.)
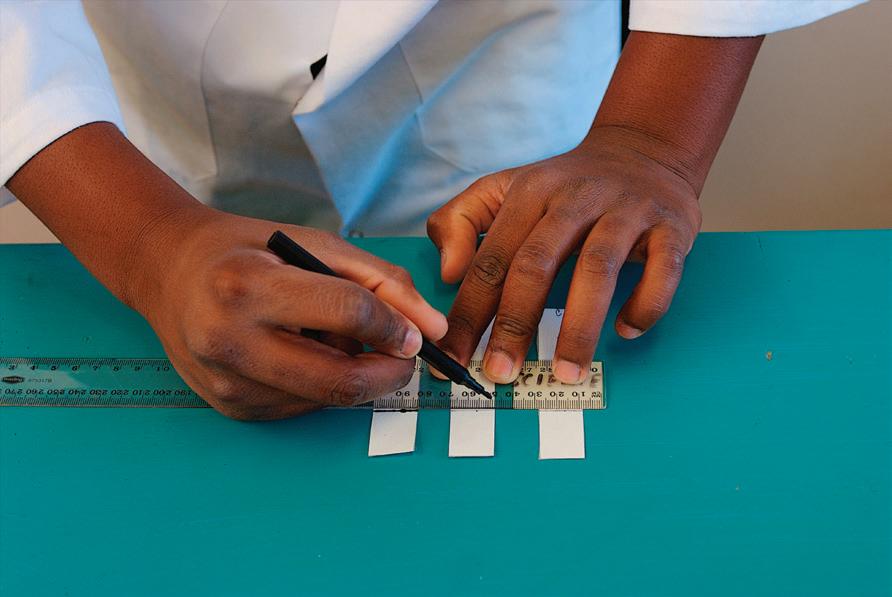
5 Do the same for the other two pens on their separate strips.
6 Add the salt solution to the bottom of the beaker, no deeper than 2 c m.
7 H ang the paper strips over the glass rod so that they just dip into the salt solution (Figure 2). Make sure the salt solution does not touch the pen lines on the paper.
Figure 1 Trace over the pencil lines at the bottom of the chromatography paper.

8 L eave the papers to soak up the salt solution for approximately 10 to 15 minutes, or until the solvent level is up to the top of the paper.
9 I n the meantime, draw a diagram of the chromatography equipment in your notebook, labelling all the parts.
10 W hen the solution has travelled to near the top of the paper, the chromatograms are finished. Take the papers out of the solution to dry (Figure 3).

Results
Tape the dry chromatograms for suspects A, C and U in your notebook. Collect and copy the chromatogram from the original note. Label this as the extortionist’s chromatogram.
Discussion
1 C ompare the chromatogram from the extortionist with the chromatograms from the three suspects. Identify if any of the suspects’ chromatograms match the one from the original note. If so, who is most likely to be guilty?
DRAFT
2 Identify which felt-tip pen – A, C or U –had the most colours in its black ink.
Conclusion
Describe how chromatography can be used to separate the inks from different black felt-tip pens (Figure 4).

Figure 2 Hang the paper strips from a glass rod or ice cream stick so that they just dip into the salt solution.
Figure 3 Take the papers out of the salt solution and let them dry.
Figure 4 Black felt-tip pens are composed of different inks.
Lesson 8.16
Science as a human endeavour: Wastewater is a mixture that can be separated
Introduction
Washing dishes or using the bathroom produces wastewater containing a mixture of vegetable matter, paper, cloth and plastics. This cannot be released directly into waterways without harming the environment. Scientists use their knowledge of separating mixtures to make the water safe.
Many unusual things have been found at wastewater treatment plants, including BMX bikes, toys, false teeth and even money. One of the biggest problems currently is caused by the small stickers found on fruit. If eaten accidentally, the small plastic stickers pass through the digestive system and end up at the water treatment plants (Figure 1).

DRAFT
Primary treatment
Initially, the wastewater is filtered to remove any large products. Aluminium sulfate is added to the wastewater to encourage any remaining suspended particles to coagulate (or clump together). This process is called
Figure 1 A water treatment plant
flocculation. The small clumps are then left to sit in sediment ponds to allow the clumps to form a sediment on the bottom of the pond (Figure 2). This sediment is called sludge, and can be removed and disinfected. Many industries use the sludge as fertiliser or to manufacture biofuels.
Secondary treatment
The remaining wastewater often contains levels of nutrients, such as nitrogen and phosphorus, that would be harmful to rivers or the ocean. When these nutrients enter waterways in large amounts, algae feed off them and grow into large blooms (Figure 3). The large numbers of algae use all the oxygen and nutrients in the water, leaving other aquatic life to starve.
Secondary waste treatment pumps the wastewater through a series of tanks where bacteria remove the excess nutrients from the water.
Tertiary treatment
Sometimes the water will be treated at a tertiary treatment plant. Once again, the water is filtered to remove any particles that may be left in the water. Chlorine can be added (just as in a swimming

DRAFT


pool) to kill any bacteria that may still be in the water (Figure 4). Each stage of the treatment is planned to remove different types of particles from the wastewater mixture, from coagulation and sedimentation of the larger particles to the filtration of smaller particles and disinfection of any bacteria (Figure 5).
Figure 2 Flocculation clumps together the suspended particles in wastewater so they sink to the bottom.
Figure 3 An algal bloom
Figure 4 Chlorine and wastewater tanks in a tertiary water treatment plant
Test your skills and capabilities
Analysing data in graphs
Scientists often gather data from the water treatment plants to help them understand how water is used, as well as the health of the population. Recording, processing and analysing data are essential skills in science.
1 Water use is often an indication of the amount of wastewater produced per person every year. A graph of the annual water consumption per person in Australian cities is shown in Figure 6.
a Identify the city that uses the highest amount of water per person each year.
b Identify the city that uses the lowest amount of water per person each year.
c Identify the amount of water that the average person in Canberra uses in a year.
d Descr ibe one reason why a person living in Brisbane might use more water than a person living in Melbourne.
2 Seqwater, the water supply authority in South East Queensland, encourages locals to try to save 3 L of water per day.
a Use Figure 7 to identify the month that residents in South East Queensland used the most water. Describe a possible reason for this.
b Identify the month that residents in South East Queensland used the least water. Describe a possible reason for this.
c T he number of people (population) of South East Queensland has continued to increase for each of the years shown on the graph in Figure 8. Use this information to decide whether South East Queenslanders have become more or less efficient with their water usage between 2016 and 2023.
3 T he more water that is used by people, the greater the amount of sewage that needs to be treated. Create a poster that encourages the people in your house to use less water in their everyday activities. (HINT: Use the communication skills you learnt in Module 1.)
DRAFT
Figure 6 Annual water consumption per person
Figure 7 Average water use (L) per person per day in South East Queensland for each month in 2021
Lesson 8.17 Science as a human endeavour: Materials recovery facilities separate mixtures
Introduction
DRAFT
A materials recovery facility uses the properties of the items in a recycling bin to separate them so that they can be reused. The items are separated by mass, colour and magnetic properties. Recycling of rubbish saves electricity and water, and reduces the amount of greenhouse gases that would be released by landfill.
Household recyclables
Have you ever wondered what happens to the rubbish in the recycling bins collected by your local council? Most households put their paper, cardboard, glass bottles, cans and recyclable plastics into a separate rubbish bin (Figure 1). These items are collected by a different truck from the general rubbish trucks. Instead of going to landfill, these different trucks take the recyclable rubbish to a materials recovery facility, where the mixture is separated before being sent off to be recycled.
Materials recovery facility
At the materials recovery facility, the truck unloads the recycled rubbish onto a conveyer belt. The conveyer belt carries the rubbish into the facility before allowing the rubbish to drop onto a slight incline belt. Paper, cardboard and other light rubbish stay on the incline belt and are carried up and along to where they are sorted by hand (Figure 2). People separate the paper from the plastic bags, placing each into their special bins for recycling.


Heavier objects, such as larger plastic containers, aluminium and tin cans, fall backwards off the incline conveyer belt onto another moving belt. This conveyer belt uses a large magnet to separate the steel and tin cans into a large bin. Aluminium cans are not strongly attracted to the magnet and remain mixed with the larger glass and plastic containers.
Figure 1 Household recyclables
Figure 2 Hand sorting at a materials recovery facility
The aluminium cans, glass and plastics are exposed to a special eddy current separator. Aluminium is weakly attracted to magnets and this property allows the separator to push the aluminium cans away using a magnetic rotor. When the aluminium cans pass over the magnetic rotor at the end of the conveyor belt, they are pushed further than the glass and plastic bottles and fall into a separate container (Figure 3).
The conveyer belt carries the remaining glass and plastic bottles forward over a pit. The heavier glass containers fall faster and are collected in a bin. The lighter plastic containers are caught by the last conveyer belt and are separated on the basis of colour. A light scans each plastic container for the type of plastic. Each type of recycled plastic is a different colour. Each colour plastic receives a different blast of air that projects it into the correct bin.
Why recycle?
Recycled glass is crushed into a “cullet” and heated to 1,500°C until it is liquid/ molten. The molten glass is then poured into a mould to form new bottles. The energy saved from recycling one glass bottle will run a 100 watt light globe for 4 hours.
Aluminium cans are recycled in a similar manner. Each aluminium can that is recycled will create enough electricity to run a television for 3 hours. Recycling 1 t of paper and cardboard will save 13 trees.
Test your skills and capabilities
Discussing ethical issues
Ethics is the study of making decisions based on what is thought to be right and what is thought to be wrong. Each person will often make different ethical decisions based on what they consider is the right thing to do. Their opinions are often affected by the information (or science communication) provided by local councils or discussions with their neighbours. For example, many people think throwing rubbish away to be buried in a landfill site is wrong. They may be able to communicate their opinion effectively to their neighbours, encouraging them to recycle their rubbish.
DRAFT

1 Describe a possible reason why some people see burying rubbish in landfill as wrong.
2 Suggest why someone might place an aluminium drink can in a rubbish bin that is taken to landfill.
Figure 3 An eddy current separator separates aluminium cans from other items.
Figure 4 Aluminium cans can be almost endlessly recycled.
3 I s it better to place the aluminium can in the rubbish bin or drop the aluminium can on the ground? Explain why you made this decision.
4 Suggest an alternative decision that could be made by the person so that the aluminium can did not go to landfill. Would you make this decision? Explain why or why not.
5 Someone places a non-recyclable wrapper in the recycling bin. Discuss whether it is better or worse to do this or drop the wrapper on the ground.
6 Split your class into five groups. Each group should work together to try to:
DRAFT
a descr ibe what is happening at one of the labelled stages of the recycling plant in Figure 5 b descr ibe how this process may be affected based on your answers to questions 2 and 5.
7 P redict what would happen to an eddy separator (Figure 3) if the magnetic rotator was not working. (THINK: What role does the magnet play in the separation process? What would happen to the production line without it?)
Figure 5 An illustration of a materials recovery facility
Lesson 8.18 Review: Mixtures
Summary
Lesson 8.1 Mixtures are a combination of two or more substances
• A pure substance is one where all the particles are identical.
• T he different substances in a mixture can have different properties.
• A homogeneous mixture has evenly distributed components, while a heterogeneous mixture has unevenly distributed components.
• T he different properties of substances can determine the type of mixture.
• Solutions, suspensions, colloids and emulsions are all types of different mixtures.
Lesson 8.3 A solution is a solute dissolved in a solvent
• I f a substance does not dissolve, it is insoluble.
• A solvent can be used to dissolve a solute.
• A d ilute solution has very little solute in the solvent.
• T he more solute that is dissolved in the solvent, the more concentrated the solution.
• A solution is saturated when no more solute will dissolve.
• Water is a good solvent.
Lesson 8.6 Mixtures can be separated according to their properties
• P roperties are how a substance looks (size, mass, texture, shape, volume) and how it behaves around other substances (magnetic, soluble).
• A magnet can be used to separate particular metals.
• Decanting can be used to separate sediment from a liquid.
• Aboriginal and Torres Strait Islander Peoples used winnowing to separate seeds from their lighter husks and pods.
Lesson 8.8 Mixtures can be separated according to their size and mass
• L arge particles (residue) can be separated from liquids (filtrate) by filtering.
• Sieving separates different sized particles, allowing smaller particles to pass through while capturing the larger particles.
• Heavy particles (more mass) can be separated from light particles (less mass) by using a centrifuge.
Lesson 8.10 The boiling points of liquids can be used to separate mixtures
• T he different particles in a mixture will often have different boiling points.
• T he substance with the lowest boiling point will evaporate first.
• W hen a solvent evaporates, it will leave behind crystallised solute.
• I f the evaporated solvent is cooled it will condense into a liquid in a process called distillation.
Lesson 8.13 Solubility can be used to separate mixtures
• Some substances are able to dissolve more easily in solvents than others.
• C hromatography can be used to separate mixtures of substances that have different solubilities.
Review questions 8.18
Review questions
Retrieve
1 A t ablet is dissolved in a glass of water. Identify the solvent in the scenario.
A T he tablet
B T he water
C T he glass
D T he tablet and water combined
2 Identify the physical property that allows mixtures to be separated by decanting or sedimentation.
A Boiling point
B M agnetism
C Density
D Compressibility
3 Identify the separation technique that can be used to separate materials with different solubilities.
A Evaporation
B D istillation
C M agnetic separation
D C hromatography
4 Blood is a mixture that has many different substances.
a Recall the separation technique that is used to separate the parts of blood.
b Identify the physical property that is being used to separate this mixture.
5 Identify the property used to separate substances through distillation.
6 Define the term “flocculation”.
7 Nail polish remover and paint stripper are both useful solvents for dissolving oil-based substances such as paint.
9 Ex plain two safety recommendations that you would give to someone using evaporation and crystallisation.
10 I magine dropping salt in sawdust. Explain how you would separate the parts of this mixture, using the particle theory.
DRAFT
a Define the term “solvent”.
b Identify the solute for nail polish remover and paint stripper.
Comprehend
8 Describe an example of a mixture that could be separated into its parts by filtration.
11 A c riminal buries an aluminium drink can containing DNA evidence in the sand. Explain whether the aluminium could be separated from the sand using a magnet.
12 Describe each of the processes involved in the primary, secondary and tertiary treatment of wastewater.
13 Daniel was measuring the solubility of two chemicals (A and B) in water. He placed a spatula full of each substance in separate test tubes of water. Figure 1 shows what he saw. Use the terms “dissolve”, “solvent”, “solute” and “suspension” to explain what has happened.

14 I magine that you have just bought a large factory. Due to flood damage, it is filled with tonnes of matchsticks mixed with tonnes of iron scraps.
a Describe how you would separate this mixture.
b L ist the equipment you would need to make this happen on such a large scale.
Figure 1 Test tube A (left) and test tube B (right)
15 A particular coloured dye is being created for Fashion Week.
a L ook at the chromatogram of the dye mixture in Figure 2. Identify how many pure dyes were mixed to create the colour.
b Identify the colour of the pure dye that is the most soluble.
16 T he Alyawarre, Anmatyerre, Warlpiri and Pitjantjatjara Peoples in the desert parts of the Northern Territory use their fingers to separate desert raisins from rotten fruit (Figure 3).
Describe a technique used by Aboriginal and Torres Strait Islander Peoples that separates a mixture based on mass or distillation.

Analyse
17 E xamine Figure 4 and identify the suspension, the solution and the colloid.


18 C ontrast evaporation and distillation.
19 Compare the use of decanting and filtration to separate mixtures. Identify examples of situations where you would use one over the other.
20 Compare a solution of salt dissolved in water, a suspension of muddy water, and a colloid mixture of milk in water (Figure 5).

DRAFT


Apply
21 E xamine the chromatograms in Figure 6, taken from blue pens belonging to suspects A, B, C and D. Compare these with the chromatogram taken from the original forged cheque (X). Decide whether any of the suspects is likely to be the culprit.


Figure 6 Which suspect is the likely culprit?
Module 8 Mixtures 379
Figure 3 Desert raisins
Figure 4 Identifying mixtures
Figure 5 (A) Salty water, (B) muddy water and (C) milk in water
Figure 2 Chromatogram of a dye mixture
Oxford University Press
Social and ethical thinking
22 Do you think that performance-enhancing drugs are spoiling the image of sports? Describe how the drugs are separated from an athlete’s blood. Pair up with a partner and make a list of all the advantages and disadvantages of athletes using these drugs to compete. Use your list to create and justify an argument for or against drug testing competing athletes.
Critical and creative thinking
23 L ist the techniques in the order that you could use them to separate a mixture of iron fillings, sand, marbles and salt. Create a flow chart to present your answer.
24 People sometimes need to enter environments containing poisonous gases. In these situations, they will wear gas masks. Use the internet or other research tools to find out how gas masks interact with poisonous gases and how they change the air before it is inhaled by the person wearing the mask. Create a poster to show how the gas masks make the air safe to breathe.
25 Until recently, Australia would ship all their plastic waste to other countries to be processed (usually burning in high-temperature incinerators). This is no longer possible, because most countries are refusing to accept the waste. Discuss (by presenting arguments for and against) why Australians might not have wanted to process plastic waste in this way close to where it was created. Discuss if it was ethically appropriate to send it to another country for processing.
Research
26 C hoose one of the following topics to research working with mixtures.
How do we work with mixtures?
Pick a separation technique that is used in a different industry or in nature.
• Develop a SWOT analysis as part of your report, listing the strengths, weaknesses, opportunities and threats of the separation technique that you choose to research.
• P resent your report with a series of photographs or illustrations of the technique.
DRAFT
Filters of the sea
Certain types of whales, known as baleen whales, have a filter in their mouth made of a bone-like substance called baleen (Figure 7).
• Identify what these whales eat.
• Describe the baleen and how it filters the food.
• Describe the bubble-net feeding behaviour used by the whales.
• I nvestigate how these whales are different from other filter feeders, such as barnacles, sponges and flamingos.

Figure 7 The humpback whale is one of the baleen whale types.
Distillation for survival
Imagine that you were hiking in central Australia, became separated from your group and then ran out of drinking water.
• Describe the way Aboriginal and Torres Strait Islander Peoples might obtain drinking water in the desert environment.
• Describe how you could turn stagnant or polluted water from a waterhole into drinkable water.
• Describe how you could use your knowledge of separating mixtures to obtain drinkable water if you were isolated near the sea coast.
Filtration in the human body
The human body needs to control what goes into it and what comes out. In particular, the filtering system of the kidneys prevents us from being poisoned by our own wastes, and tiny hairs in our noses filter dust and germs as we breathe (Figure 8).
• Select one of these filtration systems.
• Describe the structure of the system that does the filtering.
• Describe what the system filters.
• Ex plain why it is important to use the filtering system to remove the particles.
• Describe what would happen if these body filtering systems did not work.

Self-cleaning suburbs
As our population grows, new suburbs are being built on the outskirts of cities. In some of these new suburbs, several features have been included to keep the water and air clean.
• I nvestigate strategies that are used to purify water and the air in housing estates.
DRAFT
Figure 8 Hairs in our noses filter dust and germs.
University Press
in the area is protected?
Australia is one of the driest continents in the world. But according to an Australian Government report, Australians consume more water per person than any other country, using an average of 100,000 L per person every year.
Water is an important resource in Australia, so it is critical to manage our waterways carefully.
Australia has many waterways, including rivers, groundwater systems, wetland environments and other human-made passages for water. Waterways are vital to our existence and are valuable economic assets.
Waterways play an important role in supporting biodiversity in our local areas, by providing habitats for wildlife (such as fish and turtles) and plants.
[STEAM project 1] How can we reduce contaminants in local waterways so that biodiversity
Humans rely on local waterways for drinking water, irrigation of crops, industrial processes and recreational activities. But sometimes these human activities can impact waterways, endangering the biodiversity of a local area.
Waterways also hold spiritual significance for many people. Due to the importance of local waterways to Aboriginal and Torres Strait Islander Peoples, waterways are part of our cultural heritage.
We must, therefore, manage our waterways to maintain their complex ecosystems.
Water quality and contaminants
A contaminant is a substance that pollutes or poisons something. Contaminants can occur naturally, or be caused by humans – such as

Your task
Design a device that will reduce the contaminants that are entering your local waterway, in order to protect biodiversity in the area.
microplastics, pesticides and litter. Litter is an example of a physical contaminant, while pesticides are examples of chemical contaminants. There are many types of contaminants, which are often more heavily concentrated in industrial, urbanised or agricultural areas.
Human land-use and major weather events, such as floods and bushfires, can introduce contaminants into local waterways and affect the water quality.
When water becomes contaminated, it can affect the health of an entire ecosystem, leading to serious environmental issues, such as acidic soil or algal blooms. So it is important for all waterways to be managed to protect the organisms that rely on them to survive.

Figure 1 Algal blooms occur when an oversupply of nutrients in the water allows algae populations to quickly increase, covering the water’s surface. Contaminants such as industrial fertiliser running into waterways can cause algal blooms. Algal blooms are often toxic to other aquatic life.


HUMANITIES
In Geography this year, you will learn about water as a resource and how it connects places as it moves through the environment. You will also study the variability and scarcity of water in Australia.
In History, you will investigate the importance of water in sustaining ancient civilisations.
To complete this task successfully, you will need to investigate the health of a local waterway and the nearby land uses that may be introducing contaminants to the water. You will then need to research strategies that will help to reduce these contaminants.
DRAFT
You will find more information on this in Module 2 “Water as a resource” and Module 3 “Valuing and managing water” of Oxford Humanities 7 Victorian Curriculum
MATHS
In Maths this year, you will consolidate your understanding of area and volume and different units for measuring them. You will learn to perform calculations involving fractions, decimals and percentages –both with and without digital technology.
To complete this task successfully, you will need to combine these mathematical skills with your understanding of chemical and physical changes. You can then determine the scale of the problem and design your prototype in detail. You may need to perform calculations that relate the concentrations of contaminants, the dimensions of your prototype, the volume of water that can and needs to be processed, and the quantity of contaminants that need to be disposed of.
You will find help for applying these maths skills in Module 3 “Fractions and ratios”, Module 4 “Decimals and percentages”, and Module 9 “Length, area and volume” of Oxford Maths 7 Victorian Curriculum

SCIENCE
In Science this year, you will learn about how particles move in solids, liquids and gases. Each of these states of matter occurs during the water cycle, which is influenced by both nature and humans. When water is combined with other particles, it forms different types of solutions and mixtures. The unique properties of each particle (including the water molecule) can allow it to be isolated and purified once more.
To complete this task successfully, you will need to consider the properties of each contaminant, and how these properties can be used to separate the contaminants from the water. You will also need to be familiar with the scientific method, and understand how to conduct a fair test.
You will find more information on this in Module 7 “Particle theory” and Module 8 “Mixtures” of Oxford Science 7 Victorian Curriculum
Figure 3 The Yarra River is known to local Wurundjeri people as Birrarung, and has great cultural significance.
Figure 2 Litter is a contaminant in local waterways, such as the River Torrens in Adelaide.
Oxford University Press
[STEAM project 1] The design cycle
To successfully complete this task, you will need to complete each of the phases of the design cycle.
discover
Define
Before you start to design your device, you need to define the criteria that you will use to test that the problem is solved.
Define your version of the problem
Rewrite the problem so that you describe the group you are helping, the problem they are experiencing and the reason it is important to solve it. Use the following question as a guide: “How can we help (the group) to solve (the problem) so that (the reason)?”
Determine the criteria
Discover
When designing solutions to a problem, you need to know who you are helping and what they need. The people you are helping, who will use your design, are called your end-users.
Consider the following questions to help you empathise with your end-users:
• W ho am I designing for?
• W hat problems are they facing? Why are they facing them?
• W hat do they need? What do they not need?
• W hat does it feel like to face these problems?
• W hat words would you use to describe these feelings?
To answer these questions, you may need to investigate using different resources, or even conduct interviews or surveys.
1 Define each contaminant that is present in the waterway. Describe the properties of each contaminant.
2 Describe how you could test whether the contaminant was present in the water.
3 Describe how the contaminant would affect the biodiversity of the area if it were not removed from the waterway.
Ideate
Once you know who you’re designing for, and what the criteria are, it’s time to get creative!
• O utline the criteria or requirements your device must fulfil (for example, the weight and height of your design).
• Brainstorm at least one idea per person that fulfils the criteria.
• Consider whether your idea will prevent contamination from occurring or solve the problem after it has already occurred. Remember that there are no bad ideas at this stage. One silly thought could lead to a genius innovation!
Build
Draw each individual design for your device. Label each part of the design. Include the materials that will be used for its construction.
Include in the individual designs:
a the method you will use to isolate each contaminant
b the location of the device in the waterway.
If there is more than one separation method used in your design, identify the order in which you will carry out each method.
Present your design to your group. Use the criteria or requirements that you identified to decide which design your group will build.
Build the prototype
Build and test the prototype of your group’s chosen device.
Use the following questions as a guideline for your prototype:
• W hat materials will you need to build your prototype?
• How will you test whether each step of the design is successful? What will the outcome of each step look like?
• How will you record the steps you use when testing your device?
• How will you record the details of each extracted contaminant?
• How will you dispose of the extracted contaminants after your project is completed?
Test
Use the scientific method to design and experiment with each separation method to ensure its success. You will need to control your variables between each test. What criteria will you use to determine the success of your prototype?
Conduct your tests and record your results in an appropriate table.
Communicate
DRAFT
Student booklet
This helpful booklet will guide you step-by-step through the project.
What is the design cycle?
This video will help you to better understand each phase in the design cycle.
Present your design to the class as though you are trying to get your peers to invest in your device.
In your presentation, you will need to:
• explain why removing the contaminant is important for the local wildlife
• describe the key features of your design and how it will reduce the amount of contaminant in the waterways
• construct a labelled diagram of your prototype in the natural environment
• explain the principles that support your design – the importance of water in the local environment and in sustaining civilisations, how some waterways become contaminated and how these contaminants can be reduced
• estimate the number of devices needed to reduce contaminants in the waterways in your local area
• c alculate the cost of implementing your design.
How to manage your project
This “how-to” video will help you to manage your time throughout the design cycle.
How to pitch your idea
This “how-to” video will help you with the “Communicate” phase of your project.
[STEAM project 2] How can we reduce waste so
that we don’t exploit
resources?
In 2019, the United Nations estimated that every year 90 billion tonnes of resources (including fossil fuels, precious metals and non-metals) are extracted from the earth and turned into usable products. When these products are no longer used or wanted, only 9 per cent are recycled.
If we want to have enough resources left for future generations, humans cannot continue to extract materials from the earth in this way. It is unsustainable.
E-waste
In Australia, millions of electronic devices are thrown away every year. This is known as e-waste. E-waste can be difficult to recycle, but it often contains valuable metals.
The average mobile phone contains 0.034 g of gold, 16 g of copper and 0.35 g of silver. When a phone is thrown into landfill (along with all the other e-waste that once used electricity or batteries) the materials can take many decades to break down (sometimes releasing toxins into the ground).
Recycling these materials reduces the need to mine new resources.
Fast fashion
DRAFT
Fast fashion is the term used for affordable clothing produced rapidly for the general public. It is designed and produced quickly to reflect current fashion trends. When fashion becomes outdated, the clothes or products that reflect that fashion are often thrown away. The Australian Bureau of Statistics (2020) identified that, on average, each person sends 23 kg of clothing to landfill each year. Over 60 per cent of this clothing is made of synthetic fibres (made from fossil fuels) that can take many years to biodegrade.

Your task
Develop a way to encourage residents or businesses to be part of the circular economy by reducing the amount of waste that is sent to the local landfill site.
What is a circular economy?
One potential solution to our unsustainable use of resources is a “circular economy”. In a circular economy, resources are used and reused as much as possible. This benefits businesses because the longer a resource can be used, the more value it has. A circular economy is based on three key principles:
1 eliminate waste or pollution in the production of a product
2 keep products and materials in use
3 regenerate natural systems.
Some companies are already using the principles of a circular economy in the products they sell in Australia.

Figure 1 In Australia, 6,000 kg of textiles and clothing are dumped in landfill every 10 minutes.


Figure 2 Electronic waste does not belong in landfill. Laptops that are no longer working or wanted are examples of e-waste.
HUMANITIES
In Economics and Business this year, you will learn how consumers and producers respond to and influence each other in the market, particularly through price mechanisms. You will consider how resources are distributed, allocated or used in the production of food, clothing and electronics, and the growing consumer demand for sustainable products.
In Geography, you will investigate how the environment can affect the liveability of a place. You may survey the local area to understand the role of services and facilities provided to minimise, reduce and prevent waste, and strategies used to enhance liveability.
DRAFT

To complete this task successfully, you will need to consider the products you buy and the decisions businesses make when deciding what to produce, and the consequences when a product reaches its end-of-life. You will also need to gain an understanding of people’s perceptions in your local area towards waste management, recycling and the importance of the environment in measuring liveability.
You will find more information on this in Module 5 “Liveable cities” and Module 16 “Making choices” of Oxford Humanities 7 Victorian Curriculum
MATHS
In Maths this year, you will use fractions, percentages and decimals to represent numbers, and ratios between quantities. You will consolidate your knowledge of volume, learning about cubic units and how to convert between different units of volume. You will perform calculations with and without digital technology.
To complete this task successfully, you will need to quantify the problem, which will include using ratios or fractions to scale between individual, local, national and global situations. You will need to cost your solution, accounting for any costs saved by recycling valuable materials.
You will find help for applying these maths skills in Module 3 “Fractions and ratios”, Module 4 “Decimals and percentages”, and Module 9 “Length, area and volume” in Oxford Maths 7 Victorian Curriculum.
SCIENCE
In Science this year, you will learn about separating mixtures, recycling different materials and disruptions to ecosystems. You will need to use your knowledge to consider the role of renewable and ‘nonrenewable’ resources in different products, and how constantly sourcing new materials will affect the surrounding ecosystem.
To complete this task successfully, you may need to consider how the change in state of matter can aid a circular economy. You will also need to be familiar with the scientific method and understand how to conduct a fair test.
You will find more information about these issues in Module 3 “Ecosystems” and Module 8 “Mixtures” of Oxford Science 7 Victorian Curriculum
Figure 3 The average mobile phone contains gold, copper and silver.
Oxford University Press
[STEAM project 2] The design cycle
To successfully complete this task, you will need to complete each of the phases of the design cycle.
Define your version of the problem
Rewrite the problem so that you describe the group you are helping, the problem they are experiencing and the reason it is important to solve it. Use the following phrase as a guide.
“How can we help (the group) to solve (the problem) so that (the reason)?”
Discover
When designing solutions to a problem, you need to know who you are helping and what they need. The people you are helping, who will use your design, are called your end-users. This stage involves thinking about the problem (not possible solutions).
Consider the following questions to help you empathise with your end-users:
• W ho am I designing for?
• W hat problems are they facing? Why are they facing them?
• W hat do they need? What do they not need?
• W ho is producing the waste? Why is the waste being produced?
• W hat does it feel like to face these problems?
• W hat words would you use to describe these feelings?
To answer these questions, you may need to investigate using different resources, or even conduct interviews or surveys.
Define
Before you start to design your solution, you need to define the criteria that you will use to test the success of your solution.
Determine the criteria
DRAFT
1 Describe the product that is being used. How much product is needed for normal functions?
2 Describe the waste that is being produced. In what units could you measure the amount of waste? How could you estimate how much waste is currently being produced?
3 Describe the different things that currently happen to this waste. To what fraction of the waste does this happen?
4 Describe the criteria that you will use to measure the success of your design.
Ideate
Once you know who you’re designing for, and what the criteria are, it’s time to get creative!
As a group, brainstorm ways to solve the problem. Remember that there are no bad ideas at this stage. One silly thought could lead to a genius innovation!
Once you have many possible solutions, select three to five ideas and research whether these ideas have already been produced by someone else. If the prototype idea is already on the market, can you make a better version? If it’s not, what will be needed to make it?
Build
Draw your top two ideas. Label each part of the designs. Include the materials or skills required for their construction.
Include in the designs:
a a descr iption of how the users will interact with the prototype idea
b a descr iption of how the amount of waste will be decreased, and by roughly how much
c a descr iption of how the design will contribute to the circular economy
d at least one advantage and disadvantage of each design.
Select one of the designs to take to the building and testing stage.
Build the prototype
You will need to build at least three versions of your prototype idea. The first version will be tested for usefulness; the second will be used to test or survey the group you are helping; the third will be used for the presentation.
Use the following questions as a guideline for your prototype idea.
• W hat skills will you need?
• How will you produce a physical version of your prototype idea?
• How will you collect data on the effectiveness of your idea?
Test
Prototype 1
Use the scientific method to design an experiment that will test the effectiveness and strength of your first prototype. You will test the prototype more than once so that you can compare, but you will need to control your variables between tests.
What criteria will you use to determine the success of your solution?
Conduct your tests and record your results in an appropriate table.
Prototype 2
If your prototype will be used to reduce waste, then you will need to generate a survey to test whether the prototype is appropriate for the user. (How would they use it? Would it make their work easier or harder? How likely do you think they are to buy it, and why? How will the prototype affect normal behaviours? How will the production of the prototype affect the environment?)
Prototype 3
Use the information you have obtained from testing the first two versions to adapt your last prototype to be more effective and usable for the group you are helping. You may want to use the first two prototypes to demonstrate how the design has been improved over time.
DRAFT
Communicate
Present your solution to the class as though your peers are going to invest their money. How will you convince them it is a good idea?
In the presentation, you will need to:
• explain why we need to reduce the amount of waste going to the local landfill
• describe the key features of your design and how they will reduce the amount of waste in the landfill, using calculations to justify a quantitative estimate of that reduction
• construct a labelled diagram of your prototype in the natural environment
• describe how the ecosystem will be impacted by your prototype idea
• explain the principles that support your design – such as the circular economy
• use calculations to estimate the cost of implementing your design.
This “how-to” video will help you to narrow your ideas down and define a specific problem.
Glossary
Aabiotic factor
non-living factors that influence an ecosystem, such as wind, water, salinity and temperature
accuracy
how carefully, correctly and consistently data has been measured or processed; in science, how close a measured value is to the true value aim
the purpose of an experiment air resistance
friction between a moving object and the air it is moving through amoeba
a type of single-celled organism belonging to Kingdom Protista
Animalia
taxonomic kingdom that includes all animals; all organisms in Animalia are multicellular with a nucleus in their cells (eukaryotes)
anomaly
a result that does not fit in with the pattern of data or what is normally observed
apparatus
equipment placed together for an experiment assumption
statement or belief that is accepted as true without supporting evidence astronomy
the study of objects outside Earth’s atmosphere atom
the smallest particle that forms the building blocks of matter; the smallest particle that retains the properties of an element attraction force
balanced force
two forces that are equal in size and opposite in direction and therefore do not change an object’s speed, direction or shape
binomial
the double-name system created by Linnaeus to name organisms; the first name is the genus and the second name is the species
biodiversity
the variety of living things in an ecosystem
biological control
a method of controlling a population by releasing a living organism into an ecosystem biomass
the total amount (or mass) of living organisms in an area
biotic factor
living factors that influence an ecosystem, such as animals, plants and bacteria
black hole
an area where gravitational pull is so strong that no matter or light can escape it
block and tackle
a group of pulleys mounted together in a frame or block, which provides significant mechanical advantage
boiling point
the temperature at which a liquid boils and becomes a gas bond
the force that holds particles (atoms) together
Bunsen burner

carrying capacity
the maximum number of organisms in
a population that can be sustained by an ecosystem categorical data
information that can be divided into groups or categories
cell wall
DRAFT
the force that attracts one object to another autotroph
an organism that makes its own food axis
an imaginary straight line joining the North and South Poles of Earth
Bbacteria
unicellular organisms that have a cell wall but no nucleus
a piece of equipment used as a heat source in the laboratory
Ccalibrate
check the accuracy of a measuring device against known measurements
capture–recapture
a method of estimating the number of organisms in an area by capturing, marking and releasing a sample of the organisms carnivore
an animal that eats other animals
a structure that provides support around the cell in some organisms, such as plants and fungi
centrifuging
a technique used to separate light and heavy particles by rapidly spinning the mixture
chemical property
how a substance behaves in a chemical reaction, such as how it reacts with an acid
chemistry
the branch of science that deals with matter and the changes that take place within it
chromatography
a technique used to separate substances according to their d iffering solubilities
circular economy
a system that minimises or eliminates waste by reusing, recycling and regenerating materials
class
taxonomic level between phylum and order
classify
arrange in groups or categories that have similar characteristics
coal
a fossil fuel formed from the remains of plants that lived about 300 million years ago
command term
a doing word that requires you to perform a specific thinking task
colloid
a type of mixture that always looks cloudy, because clumps of insoluble particles remain suspended throughout it rather than settling as sediment
column graph
a graph in which the height of the columns represents the number measured
commensalism
a type of relationship between two organisms of different species, in which one organism benefits and the other is not affected
community populations of different species living in the same location at the same time competition
contest between organisms for the same resources, such as shelter, food and mates compound
a substance made up of two or more types of atoms bonded together compressibility
the extent to which a substance can be compressed (squashed); gases can be compressed but solids and liquids cannot
compression strength
the ability of a substance to withstand large forces
concentrated containing a large number of solute particles in the volume of solution conclusion
a statement that “answers” the aim of an experiment condensation
a change in state from gas to liquid constellation
a group of stars that forms a pattern or shape consumer
an organism that eats other organisms to get the energy it needs to survive contact force
a force acting between two bodies in direct contact continuous data
data that are measured and can be any value contract to decrease in size or volume Country
Ddecanting
a technique used to separate sediment from the liquid it is in by carefully pouring the liquid away decomposer
an organism that gains nutrients by breaking down dead organisms into simpler nutrients density
a measure of mass per unit of volume dichotomous key
a diagram used in classification; each “arm” of the key contains two choices dicotyledon
flowering plant that has two leaves growing from the seed diffusion
the intermingling of substances by the natural movement of their particles dilute
containing a small number of solute particles in the volume of solution discrete data
data where the numbers can be separated into different groups discussion
in a scientific report, a summary of findings, and analysis of the design of an experiment, including problems encountered and suggestions for improvement disease
a disorder or condition that interrupts the normal functioning of an organism distance magnifier
a lever that changes a strong force that acts over a short distance into a weak force that acts over a longer distance distillation
a technique that uses evaporation and condensation to separate a solid from the solvent in which it has dissolved domain
Eeasily renewable resource
resource that is made naturally and available in an almost unlimited amount
ecosystem
a community of living organisms and their non-living surroundings
ectotherm
an organism with a body temperature that changes with the environment effort
the force used to operate a lever
DRAFT
a term used by Aboriginal and Torres Strait Islander Peoples to describe the connections between land, water, sky, animals, plants, people, stories, songs, cultural practices and spiritual beliefs that make up a traditional area crystallisation
a separation technique used with evaporation to remove a dissolved solid from a liquid; after the liquid has been evaporated the solid remains, often in the form of small crystals
a small section of a magnet where the magnetic field of all the atoms is aligned in the same direction drag
force that acts in the opposite direction to an object moving through water or air drought
a period in which an area experiences water shortage
dynamic equilibrium
a state of balance and stability even when there are continuous small changes
electronic waste (e-waste)
discarded electrical equipment or devices
electrostatic force
the force between two objects caused by a build-up of negative charges element
a pure substance made up of only one type of atom emigrate
when an animal or population leaves an area or habitat emission
the production and release of a substance into the air (e.g. gas) emulsion
a type of colloid in which two or more liquids are mixed together, with one suspended in the other as tiny droplets endoskeleton
an internal skeleton endotherm
an organism that has a constant body temperature regardless of the temperature of its environment
energy
the capacity to do work
energy grid
network of power plants, power lines and electric substations that generates, transmits and distributes electrical energy
energy resource
resource that can be used for the production of energy equinox
a day when day and night are the same length; occurs twice each year equipment
items used in the laboratory to conduct experiments erosion
the movement of sediment to another area
error
an inaccuracy or inconsistency in measurement
evaporation
a change in state from liquid to gas; also a technique used to separate dissolved solids from water exoskeleton an external skeleton expand to increase in size or volume experiment
an investigation used to test a hypothesis, solve a problem or find an answer to a question
Ffiltering
a technique used to separate differentsized particles in a mixture depending on the size of the holes in the filter used filtrate
substance that has passed through a filter
first-class lever
a lever that has its fulcrum between the point of effort and the load first-order (primary) consumer an organism that eats only producers such as plants, algae and bacteria; it does not eat other consumers; also called a herbivore
flocculant
a chemical added to a mixture to make suspended particles clump together flocculation
a process that clumps together suspended particles so they form a sediment flood
the overflow of a large body of water flotation
the action of floating in a liquid or gas
food chain
a linear diagram that shows feeding relationships between organisms and how nutrients and energy are passed from one organism to another organism
force diagram
a diagram that shows the forces acting on an object force magnifier
a device that can increase the amount of force available (for example, to shift something); an example is a lever force of gravity
the force of attraction between objects due to their masses
fossil fuel
a non-renewable energy source formed from the fossilised remains of plants and animals
friction
a force that acts to oppose the motion between two surfaces as they move over each other fulcrum
the turning point of a lever Fungi
taxonomic kingdom that includes all fungi; organisms in Fungi are multicellular or unicellular and they all have a nucleus in their cells (eukaryotes)
Ggalaxy
a system of stars and their solar systems, dust and gas held together by gravitational force
gas
a state of matter that does not have a fixed volume or a fixed shape generator
a machine that uses the electromagnetic effect to separate charges and produce electricity
genus
a group of closely related species; taxonomic level between family and species
geothermal energy
energy that comes from heat beneath Earth’s surface
herbivore
an animal that eats only plants heterogeneous
a mixture that has unevenly distributed components
heterotroph
an organism that eats other organisms to obtain nutrients
high tide
when the ocean covers slightly more land; the highest level that the tide reaches on the shore
homogeneous
DRAFT
gravity
the effect of a large object (such as a planet) warping space and time, and pulling objects to its centre
greenhouse gas
food pyramid
a simple visual guide to the types and proportion of foods we should eat every day for good health
food web
a diagram of interlinked food chains that shows the feeding relationships in an ecosystem
a gas (carbon dioxide, water vapour, methane) in the atmosphere that can absorb heat
Hhardness
a physical property of a substance that describes its resistance to scratching
a mixture that has evenly distributed components
hot dry rock geothermal energy
a method of pumping water into deep hot rocks in the ground in order to produce steam, which is then used to drive a turbine to generate electricity
hybrid cars
a vehicle that uses two or more energy sources, such as petrol and electricity
hydroelectric energy
energy produced by falling water that turns turbines to generate electricity hypotheses
a proposed explanation for a prediction that can be tested I immigrate
when an animal or population enters an area or habitat
immune
able to fight an infection as a result of prior exposure impure substance
mixture that consists of two or more different types of particles incompressible
unable to be compressed; solids and liquids are incompressible indicator species
an organism that can be used to measure the environmental condition of an area
Indigenous science
a system of knowledge developed by Aboriginal and Torres Strait Islander Peoples over tens of thousands of years that combines careful observation and testing of the natural world with cultural understanding to explain how things work and are connected in nature inference a conclusion based on evidence and reasoning
infrared radiation
invisible light that has longer wavelengths than visible light insoluble
cannot be dissolved in a liquid introduced species
an organism that has been brought to and has established itself in an area it is not native to invertebrate
an organism that has an exoskeleton or no skeleton
Kkey
(in biology) a visual tool used to classify organisms kinetic energy
the energy possessed by moving objects
k inetic theory of matter theory that explains how the energy and motion of particles influence the properties of matter
Llaboratory
a specially designed space for conducting research and experiments leap year
a year, occurring once every four years, with one extra day (366 days) lever
a simple machine that reduces the effort needed to do work lift
force that pushes an object up when it moves through water or air like poles
two north poles or two south poles of a magnet line of best fit
the line on a scatter graph that passes through, or nearly through, as many data points as possible to show any overall trends in the data
long-term renewable resource
resource that is limited because, once used, it takes a long time to replace low tide
when the ocean covers slightly less land; the lowest level on the shore that the tide recedes to low-emissions vehicle cars or buses that release very few exhaust gases, including carbon dioxide
lubrication
the action of applying a substance such as oil or grease to an engine or component so as to reduce friction lunar eclipse
when Earth moves between the Moon and the Sun and casts a shadow over the Moon
Mmagnetic pole (Earth)
the points on Earth where the magnetic field points downwards and a magnetic needle dips vertically magnetic pole (magnet)
the north and south ends of a magnet magnetic separation
the process of using magnets to separate magnetic materials from non-magnetic materials
magnitude
a measure of size or quantity
mass
the amount of matter in a substance, usually measured in kilograms (kg); the mass of an object never changes, even in space matter
anything that has space and volume; matter is made up of atoms
melting point
the temperature at which a solid becomes a liquid meniscus
mixture
a substance made up of two or more pure substances mixed together molecule
a group of two or more atoms bonded together, such as a water molecule
Monera
taxonomic kingdom that includes bacteria and archaea; all organisms in Monera are unicellular with no nucleus (prokaryotes)
monocotyledon
DRAFT
Linnaean taxonomy
a hierarchical system of classification developed by Linnaeus in which all organisms are grouped into kingdom, phylum, class, order, family, genus and species, with each individual organism known by its genus and species names liquid
a state of matter that has a fixed volume but does not have a fixed shape load
(in physics) resisting force
the curved upper surface of a liquid in a tube method
a series of steps explaining how to do an experiment
metric system
a decimal system of measurement; uses units such as metres (m), kilograms (kg) and litres (L)
mineral
a naturally occurring solid substance with its own chemical composition, structure and properties
flowering plant that has one leaf growing from the seed multicellular
an organism consisting of two or more cells
mutualism
a type of relationship between two organisms of different species, in which both organisms benefit
natural disaster
natural events, such as floods, volcanic eruptions, tsunamis and earthquakes, that can cause severe damage and fatalities
natural world
all living things in the world around us, including ecosystems and natural phenomena (e.g. plants, animals, oceans, ecosystems, weather patterns) neap tide
when the difference between high and low tides is smallest; occurs during the Moon’s quarter phase, when the Sun and the Moon pull in different directions
net force
the vector sum of all the forces acting on an object; also known as resultant force
newton
the unit used to measure force; symbol N non-contact force
a force acting between two bodies that are not in direct contact nucleus
a membrane-bound structure in cells that contains most of the cell’s genetic material (DNA)
numerical data
data in the form of numbers
nutrient
substance in food that organisms need for energy, growth and other biological functions
Oobservation
use of the senses to notice and gather information omnivore
an animal that eats both plants and animals orbit
the path a planet follows around the Sun or a star; the path a moon follows around a planet ore
a mineral containing a large amount of useful metal outlier
a data point that does not fit with the rest of the data
Pparallax error
an error, or inaccurate reading, that occurs as a result of reading a scale from an angle parasitism
a relationship in which one organism (parasite) lives in or on the body of another organism (host) and benefits while the host is harmed partial solar eclipse
when only some of the Sun’s light is blocked by the Moon particle theory
theory that explains the properties of matter particle
small piece of matter; also called an atom
peer reviewed
the evaluation of work by one or more people with similar skills and backgrounds (peers) phases of the moon
changes in the shape of the Moon as seen from Earth philosopher
a “lover of knowledge”; someone who studies ideas, theories and questions photosynthesis
physical world
all non-living things in the world around us, including the forces acting upon them (e.g. rocks, planets, energy, matter, and forces such as gravity and magnetism)
plankton
microscopic organisms that float in fresh or salt water
Plantae
taxonomic kingdom that includes all plants; organisms in Plantae are multicellular or unicellular and they all have a nucleus in their cells (eukaryotes)
pollination
the transfer of pollen to a stigma, ovule, flower or plant to allow fertilisation
population dynamics
the study of changes in species population numbers and the factors that may contribute to these changes population
a group of individuals of the same species living in the same location at the same time power station
a place where energy is converted into electricity
predator
an animal that hunts and feeds on another animal (prey) for food prediction
an outcome that is expected based on prior knowledge or observation
pressure
amount of force applied on an area prey
an animal that is hunted and killed by another animal (predator) for food
primary data
information that is collected directly by a researcher for a specific research project
pseudoscience
claims that are supposedly scientific but are made with no evidence to support them
pulley
a simple machine that is made of a wheel and a cord or rope; used to lift heavy loads
pure substance
something that contains only one type of substance (e.g. a single element or a single compound)
Qquadrat
DRAFT
a chemical process used by plants to make glucose and oxygen from carbon dioxide, sunlight and water phylum
taxonomic level between kingdom and class physical properties
a property of a substance that can be measured or observed without changing the substance into something else; examples are colour and boiling point
producer
a plant or plant-like organism that is at the start of food chain because it produces its own food, usually using sunlight properties
characteristics of a substance
Protista
taxonomic kingdom that includes amoeba and plankton; most organisms in Protista are unicellular and they all have a nucleus in their cells (eukaryotes)
a randomly selected square plot used to estimate the number of organisms
qualitative observation
an observation that uses words and is not based on measurements or other data
quantitative observation
an observation that uses a number, such as a measurement
Rramp
a sloping surface joining two different levels reliable
consistency of a measurement, test or experiment
reproduction
the production of offspring by a sexual or asexual process
repulsion force
a force that pushes one object away from another results
the measurements and observations made in an experiment; they are often presented in a table or graph
Ssaturated
describes a solution in which no more solute can be dissolved
scatter graph
a graph used to represent continuous data; it consists of discrete data points science
the study of the natural and physical world
scientific diagram
a clear, side-view, labelled line drawing, usually made using a sharp pencil
scientific model
a physical, mathematical or conceptual representation of an object, system, event or process that is used to explain or predict the behaviour of a scientific process or phenomenon scientific paper
written report of a scientific investigation that has been published in a scientific journal; also called a “research paper” or “journal article” scientist
a person who studies the natural and physical world
screw
a sharp-pointed metal object with a spiral thread running along its length and a slotted head
second-class lever
a lever that has its load between the point of effort and the fulcrum second-order (secondary) consumer
a carnivore that eats first-order (primary) consumers (herbivores)
secondary data
any data collected by a person other than the one using it sediment substance or matter that settles to the bottom in a mixture sedimentation
the process of a substance settling to the bottom in a mixture sieving
a separation technique based on the difference in particle size
simple machine
device that reduces the effort required to perform tasks singularity
a point that has infinite gravity and density; the centre of a black hole
solar cell
a device that transforms sunlight directly into electrical energy
solar eclipse
solstice
either of the times when the Sun is furthest from the equator solubility
how easily a substance dissolves in a solvent soluble
can be dissolved in a liquid solute
a substance that dissolves in a liquid (solvent) solution
a mixture of a solute dissolved in a solvent
solvent
a liquid in which other substances (solutes) dissolve species
a group of organisms that look similar to one another, and can breed in natural conditions and produce fertile offspring spore
a tiny reproductive structure that, unlike a gamete, does not need to fuse with another cell to form a new organism spring balance
a device consisting of a spring and a scale, used to measure forces (also called a force meter) spring tide when there is maximum difference between high and low tides; caused by the combined pull of the Moon and the Sun star
a celestial (outer space) body appearing as a bright, shining point in the night sky states of matter
one of the forms in which matter can exist, e.g. solid, liquid or gas streamlining
giving an object a form that presents the least resistance to motion sublimation
symbiosis
a close physical relationship between two organisms of different species
Ttaxonomist
a scientist who classifies living things into groups telescope
an optical instrument that uses lenses and mirrors to make distant objects appear closer and larger tensile strength
DRAFT
when light from the Sun (as seen from Earth) is blocked by the Moon
solar energy
energy made by atoms colliding with each other in the centre of the Sun
solar system
the Sun and all the planets, dwarf planets, moons and asteroids that travel around it and one another
solid
a state of matter that has a fixed volume and a fixed shape
change in state from solid to gas, with no liquid state in between supernova
explosion of a star suspension
a cloudy liquid containing insoluble particles
sustainable agriculture
farming in sustainable ways meeting society’s present food and textile needs, without compromising the ability for current or future generations to meet their needs
a measure of the flexibility of the bonds between particles in a substance
theory
an explanation of a part of the natural world that is supported by a large body of evidence
third-class lever
a lever that has its point of effort between the fulcrum and the load third-order (tertiary) consumer
a carnivore that eats first-order (primary) and second-order (secondary) consumers and is therefore at the top of the food chain thread
the spiral ridge of a screw thrust
force that pushes an object in the direction of motion; force produced by engines
tidal energy
the energy in the rise and fall of tides, which can be used to drive turbines in the water, producing electricity
till
prepare and cultivate for crops topsoil
the upper layer of soil
total solar eclipse
when the Moon blocks the maximum amount of light from the Sun, as seen from Earth
trophic level
the position an organism occupies in a food web
turbine
a large wheel with angled sections called vanes, like a propeller, that is used to generate electricity
type specimen
the specimen used for naming and describing a new species
Uultraviolet radiation
invisible rays that are part of the energy that comes from the Sun unbalanced force
two or more forces that are unequal in size and direction and therefore change an object’s speed, direction or shape unicellular
an organism consisting of only one cell; an example is bacteria unlike poles
the north and south poles of a magnet urban sprawl
the spreading and expansion of cities and houses into undeveloped land
V valid
a measure of how accurately a method measures what it is intended to measure variable
something that can affect the outcome or results of an experiment
vascular tissue
in a plant, tube-like structures that transport water from the roots to the leaves

vertebrate
an organism that has an endoskeleton and a spine viable
able to survive and grow viscosity
a measure of how slowly a liquid changes its shape; the thickness of a liquid volume
the amount of space that a solid, liquid or gas occupies
W
wedge
a piece of wood, metal or other substance that tapers to a thin edge and is driven between two objects or parts of an object to secure or separate them weight
a measure of the gravitational pull on an object and is the same as the force of gravity on Earth
Western science
a system of knowledge based on careful observation, measurement, testing and experimentation (known as the scientific method) to develop and test hypothesis to explain how things work
wheel and axle
a type of lever that can rotate about its centre, magnifying force or distance wind farm
a large group of wind turbines in the same location
wind turbine
a wheel with blades that turns in the wind to generate energy winnowing
the use of air to separate of heavier seeds from lighter husks and seed pods; separation technique used by Aboriginal and Torres Strait Island Peoples
Y yandying
the use of a shallow dish to separate grains of different densities; separation technique used by Aboriginal and Torres Strait Island Peoples
Index
A
abiotic factors 140, 155
Aboriginal and Torres Strait Islander Peoples 7–12 boomerangs 287 bushfire control 9, 160–1 classification systems 111–13, 116 collaboration with 144 Country, concept of 7 evaporation, preventing 305 Indigenous science 8–11, 72 introduced species control 148, 149 levers, use of 272, 294 management of ecosystems 159–62 megafauna and 169 Moon, understanding of 204, 214, 215 oral traditions 11, 162 population changes, knowledge about 144 scientific knowledge and skills 7–12, 72 scientific research protocols 31 seasonal calendars 8, 9, 16, 219–23, 232 separation of mixtures 351, 353 understanding of natural world 204 woomeras/spear throwers 272, 294, 299 accuracy 49 aim (of experiment) 63 air resistance 265, 292 al-Battani 207 amoeba 95
Amphibia/amphibians 105, 150 angiosperms 108
attraction force 245 Australian environment, classification 111–13 Australian megafauna 169 autotrophs 83 autumn 218 Aves 104 axis 207 axle, wheel and 282, 285, 294
B
bacteria 92, 93, 95, 135, 137, 140 balanced forces 240–1 bank cards and magnets 249 batteries, large 197 bead counting 145–6 beaker 36, 37 binomial system (classification) 91 biodiversity 9, 129, 161 biological control 149–50 biology 5 biomass 137 biotic factors 140, 155 black holes 262–3 block and tackle 278 boiling point 304, 305, 329, 360 common liquids 361 separation of mixtures by 360–4, 377 bond 315
boomerang flight 287 boss head 36, 37 branches of science 5 Bunsen burner 36, 40–4, 73 burns and scalds, treating 41 bushfire control 9, 160–1
C
Chordata 91 chromatography 365–70 circular economy 196 clamp 36, 37 class 90, 91, 104–7, 115 classification 79–121 Aboriginal systems 111–13, 116
Australian environment 111–13 changing system 90–2, 116 classify, definition 86 common names or scientific names 80 double-name system 91 early methods 80 fossils 121 internal or external skeleton 97–100
Country 7 crystal healing 15 crystallisation 361
DDRAFT
Animalia 91, 92, 94, 116 annelids 99 anomaly 61 apparatus 37 Archaea 92, 140
Archimedes’ screw 282 Aristotle 80, 81 arthropods 99, 100 assumptions 60 astrology 15 astronauts 299 astronomy 5, 9, 224–7, 232 atoms 309
calibrate 61, 237, 239 cane toads 147–8, 167 capture–recapture method 142, 143 Carnivora/carnivores 91, 135 carrying capacity 155 categorical data 52 Cavalier-Smith, Thomas 81 cell wall 93, 94 cells 93, 94 centrifuging 357–60 Cesalpino, Andrea 80 chemical properties 305 chemistry 5, 310
invertebrates 97, 98–103, 116 non-living or dead 85, 118 plants 107–11, 116 three-domain system 92 vertebrates 97, 103–7, 116 cnidarians 99 coal 172–7, 186–8 clean coal 203 power stations 177, 187, 188 colloids 341 colour key 55 column graph 53–4 command terms 69–71, 73 commensalism 131 communication 14, 63–7, 330–2 community (ecosystem) 128 competition 130 compounds 309 compressibility 316 compression strength 315 concentrated solution 346 conclusion (of experiment) 64 condensation 304 conferences 330 conical flask 36, 37 constellations 224 consumers 124, 125, 135 contact force 244, 294 continuous data 52 controlled variables 24, 25 cool burning 9, 160–1 counting organisms 142–6 capture–recapture 142, 143 modern methods 143 quadrats 142, 146 remote sensors 143
Dalton, John 309 data evaluating 61–2, 73 primary/secondary 115 processing and analysing 13, 14, 51–62, 73 recording 47–59, 73 data tables 51–2, 73 decanting 352 decomposers 137 deforestation 157 Democritus 309 density 317–22 dependent variables 24, 25 desalination plants 203 dichotomous key 55, 56, 86, 88, 89, 109 dicotyledons 108, 109 diffusion 313 dilute solution 346 discrete data 52 discussion (of experiment) 64 disease 149 disruption of ecosystems 154–8, 165 distance magnifiers 270 distance measurement 46, 47, 48 distillation 361–2, 381 domain 245 drag (in flight) 286, 289 droughts 156 dynamic balance 140–2 dynamic equilibrium 142
Eearly warning systems 232 Earth 5, 206–33 axis, rotating on 207 gravitational pull see gravity magnetic field 247–8 Moon, interaction with see Moon night and day 207 orbit 206 seasons see seasons solar system 206, 228 Sun, interaction with see Sun tilt, seasons caused by 217–23
easily renewable resources 172–6, 180–6, 200 echinoderms 99 ecosystems 9, 122–69 definition 128 disruption 154–8, 165 dynamic balance 140–1 energy flowing through 134–8, 165 human management of 159–63 introduced species 147–52, 165 populations 128, 140–5, 165 relationships between species 129–32 role of organisms in 128–32, 165 ectotherms 105 effort 269, 271 egg bungy jump experiment 67–9 electromagnetic radiation 225 electronic cars 196–7 electronic waste (e-waste) 196 electrostatic force 250–3, 294 elements 309 emigrate/emigration 141 emulsions 342 endoskeleton 97, 116 endotherm 104 energy 124 ecosystem, flowing in 134–8, 165 kinetic 311, 322–9, 333 particle energy 311–12 photosynthesis 135 transfer 135 energy grid 197 energy resources 170–203 Australia 176 coal, gas and oil 172–7, 186–8 continuous 172, 174 definition 176 fossil fuels 180, 186–8, 200 homes of the future 198 human reliance on 172 management 9, 196–8, 200 minerals 172, 189, 200 non-continuous 172 non-renewable 173 renewable see renewable energy resources uranium 173, 176, 186, 188, 200 equinox 218 equipment 36 list in report 64 protective 30, 32–4 scientific 36–9, 73
erosion 193 errors 49, 61 ethical issues 30–1, 168, 293 eucalypt adaptations 164 eukaryotes 94 evaluation 13, 14, 59–62, 73 method 60–1 results 61–2 evaporating dish 36, 37 evaporation 304, 361 preventing 305 separation of mixtures by 360–3 event horizon 262, 263 exchange of gases 84 exoskeleton 97, 98, 99, 116 expand 392 experiment 36 evaluating 13, 14, 59–62, 73 planning and conducting 13, 14, 28–31, 72 recording data 47–59, 73 report 63–7, 73
Ffamily 90, 91 filter funnel 36, 37 filtering 356–7, 380, 381 filtrate 356 fire in laboratory 41 first-class lever 271, 273 first-order consumers 125 flat earth (pseudoscience) 15 flight 286–90 flocculant 353, 354 flocculation 353, 354–5 floods 156 flotation 353 flowers/flowering plants 108, 155
non-contact 244, 250, 251, 294 push, pull or twist 236–8, 294 representing 237 simple machines see simple machines sport, in 291–3 unbalanced 241–3, 294 units of measurement 237 fossil fuels 180, 186–8, 200 friction 264–8, 294 evidence of 264 reducing 264–6, 291 fulcrum 269, 271, 272, 292 fungi 92, 94, 137, 140
Ggreenhouse gas 177 growth (living things) 84
Hhardness 315–16
herbivores 135, 140 heterogeneous mixture 340 heterotrophs 83, 94 high tide 214 homes of the future 198 homogeneous mixture 340 hot dry rock geothermal energy 184
DRAFT
food chain 124–5, 165 trophic levels 135–6 food pyramid 136 food web 125–7, 141, 147, 165 introduced species, impact of 147–52 force diagram 237 force magnifiers 270 force meter 236 forces 234–99 balanced 240–1 contact 244, 294 electrostatic 250–3, 294 flight, in 286–90 friction 264–8, 294 gravity see gravity magnetic 244–50, 294 magnitude 236 measuring 236–7, 239 net force 241, 242
galaxy 262 Galileo 209–10 gamba grass 148–9 gas 302–5, 310 compressibility 316 density 317 diffusion 313 emissions 177 energy resource 172–6 exchange of gases 84 greenhouse gases 177 hot air balloons 337 particle theory 310 state of matter 302–5 gas warfare 337 gauze mat 36, 37 generator 177 genus 90, 91, 115 geothermal energy 173, 176, 177, 183–4 definition 183 hot dry rock 184 golf, forces in 237, 292 Goodall, Jane 169 graphs 52–5, 73 gravity 214, 236, 254–63, 294 black holes 262–3 definition 214, 254 Earth 254, 255, 272 force of 236, 237, 242, 256, 265
galaxies held together by 262 mass and 255, 256, 259 moons orbiting planets 261 newton (N) as unit of 237, 255
planets affected by 261–2 projectile motion 261 singularity 262 tides and 214, 231 weight 255
Hubble Space Telescope 225–6 human impact on ecosystems 156–8
human management of ecosystems 159–63
“human thermometer” 44–5 hybrid cars 196 hydroelectric power 176, 177, 182 hypothesis 13, 23–7, 61, 63, 72
Iimmigration 141 immune/immunity 149 impure substances 340 inclined plane 281, 294 incompressible (matter) 316 independent variables 24, 25
indicator species 150 Indigenous science see Aboriginal and Torres Strait Islander Peoples inference 13, 19, 20 infrared radiation 226 insolubility 345–6 intellectual property 77 interdependence of organisms 124–7 international date line 207 introduced species 147–52 invertebrates 97, 98–103, 116–17
JJames Webb Space Telescope 226
K
keys 55–6, 73, 86 classification keys 85–90 dichotomous 55, 56, 86, 88, 89, 109 tabular 86–7, 98
kinetic energy 311, 322–9, 333 kinetic theory of matter 311–12, 333 kingdoms 90, 91, 92, 94–5, 116
Animalia 91, 92, 94, 116 Fungi 92, 94, 140 Monera 92, 95 Plantae 92, 94 Protista 92, 95, 140 L laboratory 37 equipment 36–7 fire in 41 safety precautions 32–5 laboratory-grown meat 169 land degradation 157 leaf litter 138–9, 157 leap year 206 legend 55 length 46, 47, 48 Lessard, Bryan 114 levers 268–76, 294 Aboriginal people’s use of 272 distance magnifiers 270 effort 269, 271
first-class lever 271, 273 force magnifiers 270 fulcrum 269, 271, 272, 292 load 269, 271, 292 mechanical advantage 269, 270
second-class lever 271, 275 third-class lever 271
Levin, Richard 168 lift (in flight) 286, 287, 289 like poles 245 line of best fit 55
Linnaean classification system 81, 90–2, 116 Linnaean taxonomy 90 Linnaeus, Carolus 81, 116 liquid 302–5, 310 density 317 diffusion 313 viscosity 316 living organisms, characteristics of 83–5 interdependence 124–7 precise name 90 load 269, 271, 292 long-term renewable resources 172–6, 186–8, 200 low emissions vehicle (LEV) 196 low tide 214 lubrication 265 lunar eclipse 212, 228
Mmachines see simple machines Magdeburg Hemispheres 337 Maglev trains 246, 265 magnetic field 247–8 magnetic force 245–50, 294 magnetic poles 245, 247–8 flipping 248, 249 geographic poles and 247–8 magnetic separation 351–2 magnets 244–50, 294 attraction force 245 bank cards and 249 domain 245 like/unlike poles 245 repulsion force 245 separation of mixtures 351–2 magnitude 236 Mammalia/mammals 91, 104, 112 Mars exploration 226 marsupials 104, 112 mass 46, 47, 50, 255, 312 definition 46, 255, 312 gravity and 255, 256, 259 kinetic theory of matter 312 separation of mixtures by 356–60, 377 weight distinguished 255, 256
materials recovery facilities 374–6 mathematical model 56 mathematical relationships 56–7, 73 matter 302–8 change of state 303–4 properties of 315–22 scientists’ understanding of 308–11 states of 302–10, 333 measurement 44–50, 73 accuracy 49 errors 49, 61 metric system 46, 48 units 45–6, 237 measuring cylinder 36, 37 mechanical advantage 269, 270, 277, 279 megafauna 169 melting point 303, 304, 305, 329 metal tongs 36, 37 method 64 metric system 46, 48 minerals 172, 189–90, 200 mining 172, 189, 203
mixtures 338–81 separation see separation of mixtures types of 340–5 models 56, 73 molecules 309 molluscs 99 Monera 92, 95 monocotyledons 108–9 monotremes 104, 112 Moon 206–16, 228 Aboriginal knowledge 9, 204, 214 exploration of 211 far side of 233 gravity and 255, 261 lunar eclipse 212, 228 Moon Treaty 227 moonlight 210 orbiting Earth 261 phases of 210–11, 213, 228 reflecting Sun’s light 209–10 solar eclipse 207–8, 228 tide and 214–16 turtles following 248 movement (living things) 83 MR N GREWW 83 multicellular organisms 93, 94 musical instruments 299 mutualism 131
Nnaming specimens 115 natural disasters 155, 156 natural philosophers 4 natural world 4 neap tide 215 nematodes 99 net force 241, 242 new species 82, 114, 115 newton 237, 255 Newton, Isaac 237, 254 night and day 207 non-contact forces 244, 250, 251, 294 North Pole 247–8 nuclear power stations 188 nucleus 93, 94 numerical data 52 nutrients 124 nutrition 83
Oobservations 17–22, 72 qualitative/quantitative 18, 19 using all senses 18, 21–2 oil (energy resource) 172–6 omnivores 135 orbit 206, 261 order 90, 91, 115 ore 189
Outer Space Treaty 227 outliers 61
Ppaper chromatography 365, 369 parachutes 257–9, 265 parallax error 49 parasitism 131, 132 particle 309 particle energy 311–12 particle theory 300–37 definition 310 kinetic theory 311–12, 333 properties of matter 315–22 states of matter 302–8, 333 peer review 13, 63, 330 philosophers 4 photosynthesis 135 phylum 90, 91, 98, 115 physical model 56 physical properties 305 physical world 4 physics 5 Pisces 105 placentals 104, 112 planets gravity affecting 260–3 Mars exploration 226 moons orbiting 261, 262 orbit of 206, 261–2 solar system 206, 228 plankton 95 planning and conducting research 13, 14, 28–31, 72 Plantae 92, 94 plants classification of 107–11, 116 flowering 108 food chain 124 kingdom Plantae 92, 94 monocot or dicot 108–9 photosynthesis 135 producers 124, 125, 140 seeds or spores 108 vascular tissue 108 platyhelminths 99 pollination 108, 153 population 128, 140–5, 165 population dynamics 142–3 population size 139–45, 165 abiotic factors 140, 155 Aboriginal knowledge 144 biotic factors 140, 155 carrying capacity 155 counting organisms 142–3 dynamic balance 140–2 immigration/emigration 141 measuring size of 142–4
poriferans 99 power stations 394 coal-fired 177, 187, 188 nuclear 188 predator 129 predator-prey relationship 129 predicting 9, 13, 14, 17, 23, 24, 72 hypothesis 13, 23–7, 61, 63, 72 variables, based on 24–5 pressure 312 primary consumers 125, 135 primary data 115 processing and analysing 13, 14, 51–62, 73 producers 124, 125, 140 projectile motion 261 properties of matter 315–22, 333 compressibility 316 density 317–22 hardness 315–16 heat, effect of 325–8 particle theory explaining 315–22 strength 315 viscosity 316 properties of mixtures 340 protective equipment 30, 32–4
Protista 92, 95, 140 protocols 31 pseudoscience 15, 60, 72 pulleys 276–80, 294 block and tackle 278 mechanical advantage 277, 279 types 277–8 pure substances 340
Qquadrat 142, 146 qualitative observations 19 quantitative observations 18, 19
models 56, 73 tables 51–2, 73 recycling facilities 374–6 reliable results 29 reliable science 60 remote sensors 143 renewable energy resources 172–86, 200 easily renewable 172–6, 180–6, 200 geothermal 173, 176, 177, 183–4
hydroelectric 176, 177, 182 long-term renewable 172–6, 186–8, 200 solar 173, 175, 176, 177, 181, 185–6 tidal/wave 177, 182 wind 173, 176, 177, 180, 182 Reptilia/reptiles 105 reproducible test 29 reproduction 83 repulsion force 245 resources 9, 170–203 energy resources see energy resources human reliance on 172 management 9, 196–8, 200 minerals 172, 189, 200 renewable see renewable energy resources soil 191–5, 200 response to change 84 results 36, 64 communicating 63–5 evaluating 61–2 recording 47–59 retort stand 36, 37 risk management 29–30 Rivinus, Augustus Quirinus 80
SDRAFT
questioning 13, 14, 17, 19, 20, 23
Rrabbits 149, 151, 168 rainwater tanks 198 ramp 281, 283, 294 Ray, John 80 recording data 47–59, 73 graphs 52–5, 73 mathematical relationships 56–7, 73 measurements 47–50, 73
safety precautions 32–5, 58, 72 safety rules 34 safety symbols 33 saturated solution 346 scale model 56 scarab beetles 147 scatter graph 54–5 science 4, 72 branches of 5 changing face of 92 reliable 60 scientific claim 61–2 scientific conferences 330 scientific diagrams 37–9 scientific equipment 36–9, 73 scientific method 12–16, 72 scientific models 330
scientific names 80–1 scientific papers 330 scientific posters 331 scientific reports 63–7, 73, 330 scientific research see also experiments measuring and recording data 44–50 planning and conducting 13, 14, 28–31 scientists 4, 77, 330–2 screws 281–2, 284, 294 search for extraterrestrial intelligence (SETI) 232 seasons 217–23 Aboriginal 8, 9, 16, 219–23, 232 Antarctica 219 ecosystem disruption 155 tilt of Earth, caused by 217–23 second-class lever 271, 275 second-order/secondary consumers 125 secondary data 115 sediment 341, 352 sedimentation 353 seeds 108, 133 separation of mixtures 351–77 Aboriginal techniques 351, 353 boiling point, by 360–4, 377 centrifuging 357–60 chromatography 365–70 crystallisation 360–3 decanting 352 distillation 361–2, 381 evaporation 360–3 filtering 356–7, 381 flocculation 353, 354–5 flotation 353 magnetic 351–2 mass, according to 356–60, 377 materials recovery facilities 374–6 properties, according to 351–4, 377 purifying sea water 364 sedimentation 353 sieving 357 simple separation 351 size of particles, by 356–60, 377 solubility, using 365–7, 377 wastewater separation 371–3 winnowing 353 yandying 353
sieving 357 simple machines 268, 280–5, 294 comparing 283–5 definition 268, 280 inclined plane 281, 294 lever 268–76, 294 musical instruments 299 pulley 276–80, 294 ramp 281, 283, 294 screw 281–2, 284, 294 types of 280–5, 294 wedge 281, 284, 294 wheel and axle 282, 285, 294 single-celled organisms 92–5 singularity 262 skeleton dissecting 100–2 endoskeleton 97, 116 exoskeleton 97, 98, 99, 116 internal or external 97–100 smart materials 198 smart plugs 198 soil 191–5, 200 erosion 193 ingredients 192 management 193 tilling 193 water-holding ability 194–5 solar cells 181, 185–6 solar eclipse 207–8, 228 solar energy 173, 175, 176, 177, 181, 185, 206 definition 175, 206 energy grid 197 large batteries 197 solar farms 181 solar system 206, 228, 330 solid 302–5, 310 solidification 304 solstice 218 solubility 345–6, 365 separation of mixtures using 365–7, 377 solute 346 solutions 341, 345–50, 356, 377 solvent 346
South Pole 248 space 5, 206–33 astronomy 5, 224–7 black holes 262–3 careers with 5, 299 exploration 226, 227 gravity affecting objects in 260–3
Moon see Moon orbit of planets/moons 206, 261
Outer Space Treaty 227
solar system 206, 228 stars 206, 224, 262 Sun see Sun telescopes 210, 225–6 space probes 227 spaghettification 263 spatula 36, 37 spear throwers 272, 294, 299 species 90, 91 competing 130 introduced 147–52, 165 naming 115 new, finding 82, 114–15 relationships between 129–32 spores 108 sport, forces in 236, 291–3 spring balance 236, 237 spring (season) 218 spring tide 215 stars 206, 224, 262 states of matter 302–10, 333 change of 303–4 comparing 307 mixtures 303 solid/liquid/gas 302–5, 310 stirring rod 36, 37 streamlining 265, 291 strength 315 compression 315 hardness distinguished 316 tensile 315 sublimation 304 summer 217–18 Sun 206, 228 average sunlight hours 230 eclipse 207–8, 228 gravity, force of 261 Moon reflecting 209–10
night and day 207 seasons and 217–23 solar eclipse 207–8, 228 supernovas 262 suspensions 341, 356 sustainable agriculture 193 swimming, forces in 291 symbiosis 131 symbol key 55
Ttables (data) 51–2, 73 tabular keys 86–7, 98 taxonomists 94, 96, 114 telescopes 210, 225–6 temperature 46, 58 tennis, forces in 238, 270, 271, 292 tensile strength 315 tertiary consumers 125 test tube 36, 37 test tube holder 36, 37 test tube rack 36, 37 thermometer 36, 58, 37 third-class lever 271 third-order consumers 125 thread (of screw) 281 thrust (force in flight) 286, 287, 290 tidal energy 177, 182 tide and Moon 214–16
Aboriginal understanding of 204, 214, 215 gravity 214, 231 high tide 214 low tide 214 neap tide 215 spring tide 215
tilling soil 193 time 46 topsoil 193
Tournefort, Joseph Pitton de 80 tripod stand 36, 37 trophic levels 135–6 turbine 177, 179 turtles 105, 113, 159, 160, 248 type specimens 114
Uultraviolet radiation 225 unbalanced forces 241–3, 294 unicellular organisms 93, 94, 95 unique specimens 114–15 unlike poles 245 uranium 173, 176, 186, 188, 200 urban sprawl 157–8
Vvalidity 13
Van de Graaff generators 251 variables 24–5, 77 vascular tissue 108 vertebrates 97, 103–7, 116 viable 91 viscosity 316 volume 47, 50, 312
Wwaste production 84 wastewater separation 371–3 watch glass 36, 37
water
boiling point 305, 329, 360 desalination plants 203 hydroelectric power 176, 177, 182 Indigenous science 9 living things requiring 84 molecules 309 purifying sea water 364 salt solution in 348 solid/liquid/gas 302–3, 328 solvent 346–7 wastewater separation 371–3
wave power 177, 182–3 wedges 281, 284, 294 weight 255, 256 flight, force in 286, 287, 289 wetlands 137 wheel and axle 282, 285, 294 wind farm 180, 181 wind power 173, 176, 177, 180 floating wind and wave project 182–3 wind turbine 180, 181 winnowing 353 winter 218 Woese, Carl 81 woomera 272, 294, 299
Yyandying 353 year 206
Acknowledgements
The author and the publisher wish to thank the following copyright holders for reproduction of their material.
Cover Image: SAM FALCONER, DEBUT ART/SCIENCE PHOTO
LIBRARY Module 1: Opener: SAM FALCONER, DEBUT ART/SCIENCE
PHOTO LIBRARY Lesson 1.1: Fig. 1, Hein Nouwens/Shutterstock; Fig. 3, Magic Orb Studio/Shutterstock; Fig. 4, paleontologist natural/Shutterstock; Fig. 5, Quality Stock Arts/Shutterstock; Fig. 6, Darren Baker/Shutterstock; Lesson 1.2: Fig. 2, Imago/Alamy Stock Photo; Fig. 3, spline_x/Shutterstock; Fig. 4, Benny Marty/Shutterstock; Fig. 6, BlueSnap/Shutterstock; Fig. 5, Andrew Bain/Alamy Stock Photo; Lesson 1.3: Fig. 2, Sunnydream/Shutterstock; Lesson 1.4: Fig. 2, ratselmeister/Shutterstock; Fig. 3, koblizeek/Shutterstock; Fig. 4, Shuttertum/Shutterstock; Lesson 1.5: Fig. 1, Vera Sever/Shutterstock; Lesson 1.6: Fig. 1, TarikVision/Shutterstock; Fig. 1, MAJstock/Shutterstock; Lesson 1.7: Fig. 1, anythings/Shutterstock; Lesson 1.8: Fig. 2, Katcha_Natsarin/ Shutterstock; Fig. 3, Halfpoint/Shutterstock; Fig. 4, chemical industry/ Shutterstock; Fig. 5(t), Gorodenkoff/Shutterstock; Fig. 5(b), AndriiKoval/ Shutterstock; Fig. 6, bmphotographer/Shutterstock; Lesson 1.9: Top, Kagan Kaya/Shutterstock; Fig. 4, Science Photo Library/Alamy Stock Photo; Lesson 1.10: Fig. 1(a), Shuttertum/Shutterstock; Fig. 1(b), New Africa/Shutterstock; Fig. 1(c), Anwarul Kabir Photo/Shutterstock; Fig. 1(d), Shuttertum/ Shutterstock; Fig. 1(e), Mehmet Cetin/Shutterstock; Fig. 1(f), Pixel-Shot/ Shutterstock; Fig. 1(g), Hora Studio/Shutterstock; Fig. 1(h), PixelSquid3d/ Shutterstock; Fig. 1(i), Peter Sobolev/Shutterstock; Fig. 1(j), Chadchai Krisadapong/Shutterstock; Fig. 1(k), Nataliass/Shutterstock; Fig. 1(l), Rabbitmindphoto/Shutterstock; Fig. 1(m), creativesunday/Shutterstock; Fig. 1(n), Picture-Syndicate/Shutterstock; Fig. 1(o), eczserapyilmaz/ Shutterstock; Fig. 1(p), Jan Kaliciak/Shutterstock; Lesson 1.12: Fig. 3, Science Photo Library/Alamy Stock Photo; Fig. 4, Science Photo Library/Alamy Stock Photo; Lesson 1.14: Fig. 1, Red2000 Creativ/Shutterstock; Fig. 2, Timof/ Shutterstock; Fig. 3, YanLev Alexey Sizov/Shutterstock; Fig. 4, sirtravelalot/ Shutterstock; Lesson 1.16: Fig. 3, PCN Photography/Alamy Stock Photo; Fig. 2, Butterfly Hunter/Shutterstock; Fig 16, VectorMine/Shutterstock; Fig 17, paaruOK/Shutterstock; Lesson 1.18: Fig. 2, sevasaves1/Shutterstock; Fig. 3, litchima/Shutterstock; Fig. 5, Reproduced with permission of Elizabeth Tibbetts; Lesson 1.21: Fig. 1, Edcel Mayo/Shutterstock. Module 2: Opener: SAM FALCONER, DEBUT ART/SCIENCE PHOTO LIBRARY. Lesson 2.1: Fig. 1(A), IrinaK/Shutterstock; Fig. 1(B), Tim Collins/Shutterstock; Fig. 3, The Picture Art Collection/Alamy Stock Photo; Fig. 2, The Picture Art Collection/Alamy Stock Photo; Fig. 5, crbellette/Shutterstock; Fig. 6, earlytwenties/Shutterstock; Lesson 2.2: Fig. 1, Maxim Petrichuk/Shutterstock; Fig. 2, Claudia Paulussen/Shutterstock; Fig. 3, Susan Flashman/Shutterstock; Fig. 4, Anthony Brown/Alamy Stock Photo; Fig. 5, Elana Erasmus/Shutterstock; Fig. 6, Shutterstock; Fig. 7, Blend Images/Shutterstock; Fig. 8, kazoka/ Shutterstock; Lesson 2.3: Fig. 4, bejo/Shutterstock; Lesson 2.5: Fig. 1, gmstockstudio/Shutterstock; Fig. 2, Maks Peoplenko/Shutterstock; Fig. 3, gillmar/Shutterstock; Fig. 4 (A), Lucky-photographer/Shutterstock; Fig. 4 (B), EYE OF SCIENCE/SCIENCE PHOTO LIBRARY; Lesson 2.6 Fig. 2, Berendje Fotografie/Shutterstock; Fig. 3, Nokuro/Shutterstock; Fig. 4, Czintos Odon/Shutterstock; Fig. 5, Science Photo Library/Alamy Stock Photo; Fig. 6, blickwinkel/Alamy Stock Photo; Lesson 2.7 Fig. 1(a), Wako Megumi/ Shutterstock; Fig. 1(b), Emily Li/Shutterstock; Fig. 1(c), Tiplyashina Evgeniya/ Shutterstock; Fig. 1(d), BartTa/Shutterstock; Fig. 1(e), phungatanee/ Shutterstock; Fig. 1(f), barmalini/Shutterstock; Fig. 1(g), ART-ur/Shutterstock; Fig. 1(h), Jacqueline Abromeit/Shutterstock; Fig. 1(i), yilmazsavaskandag/ Shutterstock; Fig. 1(j), Ivica Drusany/Shutterstock; Fig. 1(k), Sari ONeal/ Shutterstock; Fig. 1(l), Ethan Daniels/Shutterstock; Fig. 1(m), dean bertoncelj/ Shutterstock; Fig. 1(n), coramueller/123rf; Fig. 1(o), 3d_man/Shutterstock; Fig. 1(p), LilKar/Shutterstock; Fig. 1(q), deckorator/Shutterstock; Fig. 1(r), Igor Dutina/Shutterstock; Fig. 1(s), Lebendkulturen.de/Shutterstock; Fig. 1(t), Christian Musat/Shutterstock; Fig. 1(u), Nattika/Shutterstock; Fig. 1(v), fusebulb/Shutterstock; Fig. 1(w), Ken Solo/Shutterstock; Fig. 1(x), Lynn Yeh/ Shutterstock; Fig. 1(y), dean bertoncelj/Shutterstock; Fig. 1(z), Berilova Irida/ Shutterstock; Fig. 1(aa), Sergii Kumer/Shutterstock; Fig. 1(ab), Maria Skaldina/ Shutterstock; Fig. 1(ac), Liew Weng Keong/Shutterstock; Fig. 1(ad), Medtech THAI STUDIO LAB 249/Shutterstock; Fig. 1(ae), Pentium5/Shutterstock;
DRAFT
Fig. 1(af), kosam/Shutterstock; Fig. 1(ag), Stu Porter/Shutterstock; Fig. 1(ah), Patila/Shutterstock; Fig. 1(ai), ivvv1975/Shutterstock; Fig. 1(aj), smereka/ Shutterstock; Fig. 1(ak), Nurlan Kalchinov/Shutterstock; Fig. 1(al), boonsom/123rf; Fig. 1(am), Liliana_Cantu/Shutterstock; Fig. 1(an), Mark Bridger/Shutterstock; Lesson 2.8: Fig. 1, Amanda Cotton/Alamy Stock Photo; Fig. 2(a), papkin/Shutterstock; Fig. 2(b), Jolanta Wojcicka/Shutterstock; Fig. 2(c), Doptis/Shutterstock; Fig. 2(d), Natursports/Shutterstock; Fig. 2(e), Damsea/Shutterstock; Fig. 2(f), Aleksandar Grozdanovski/Shutterstock; Fig. 3, irin-k/Shutterstock; Lesson 2.10: Fig. 1(a), yevgeniy11/Shutterstock; Fig. 1(b), NeagoneFo/Shutterstock; Fig. 1(c), jopelka/Shutterstock; Fig. 1(d), Fotyma/ Shutterstock; Fig. 1(e), Pan Stock/Shutterstock; Fig. 1(f), John McQueen/ Shutterstock; Fig. 1(g), Dimijana/Shutterstock; Fig. 1(h), irin-k/Shutterstock; Lesson 2.11: Fig. 1(a), Peggy D. Rismiller, Michael W. McKelvey, Frequency of Breeding and Recruitment in the Short-Beaked Echidna, Tachyglossus Aculeatus, Journal of Mammalogy, Volume 81, Issue 1, February 2000, Pages 1–17, https://doi.org/10.1644/1545-1542(2000)081<0001:FOBARI>2.0.CO;2; Fig. 1(b), Kjuuurs/Shutterstock; Fig. 1(c), Auscape International Pty Ltd/ Alamy Stock Photo; Fig. 2, Eric Isselee/Shutterstock; Fig. 3, Ken Griffiths/ Alamy Stock Photo; Fig. 4, The Natural History Museum/Alamy Stock Photo; Fig. 5, Kristian Bell/Shutterstock; Fig. 6, Tom Wang/Shutterstock; Lesson 2.13: Fig. 1, Ehrman Photographic/Shutterstock; Fig. 2, Brian Maudsley/ Shutterstock; Fig. 3, Taiftin/Shutterstock; Fig. 4, The Natural History Museum/ Alamy Stock Photo; Fig. 5, Anne Saarinen/Alamy Stock Photo; Lesson 2.14: Fig. 1, Katrina Leigh/Shutterstock; Lesson 2.15: Fig. 1, Renata Apanaviciene/ Shutterstock; Fig. 2, John W. Banagan/Getty Images; Fig. 3, ANUJAK JAIMOOK/Shutterstock; Fig. 4, Stanislav Fosenbauer/Shutterstock; Fig. 5, Minden Pictures/Alamy Stock Photo; Lesson 2.16: Fig. 2, Reproduced with permission of Anthony Whalen, Director of the National Research Collections Australia at CSIRO ; Fig. 3, Bryan D. Lessard/CSIRO; Lesson 2.17: Fig. 1, Puwadol Jaturawutthichai/Shutterstock; Fig. 2, Eric Isselee/Shutterstock; Fig. 3, Kristian Bell/Shutterstock. Module 3: Opener: SAM FALCONER, DEBUT ART/SCIENCE PHOTO LIBRARY. Lesson 3.1: Fig. 2(a), WildPictures/Alamy Stock Photo; Fig. 2(b), Fiery Phoenix/Shutterstock; Fig. 2(c), Brooke Whatnall/Shutterstock; Fig. 2(d), Peter Gudella/Shutterstock; Fig. 2(e), fritz16/Shutterstock; Fig. 4(a), Taiftin/Shutterstock; Fig. 4(b), Kristian Bell/Shutterstock; Fig. 4(c), feathercollector/Shutterstock; Fig. 4(d), John Carnemolla/Shutterstock; Lesson 3.3: Fig. 1, Image Professionals GmbH/ Alamy Stock Photo; Fig. 2, slowmotiongli/Shutterstock; Fig. 4, Kevin Maskell/ Alamy Stock Photo; Fig. 5, OolikTM/Shuttersock; Fig. 6, svetlanaspain/ Shutterstock; Fig. 7, withGod/Shutterstock; Fig. 8, stockpix4u/Shutterstock; Fig. 9, mike lane/Alamy Stock Photo; Fig. 10, Boris Pralovszky/Shutterstock; Fig. 11, Henrik Larsson/Shutterstock; Fig. 12, Science Photo Library/Alamy Stock Photo; Fig. 13, Vitalii Hulai/Shutterstock; Lesson 3.4: Fig. 1, Marie C Fields/Shutterstock; Lessom 3.5: Fig. 1, nadiya_sergey/Shutterstock; Fig. 5, phildaint/Shutterstock; Fig. 6, Jackson Stock Photography/Shutterstock; Lesson 3.6: Fig. 1, Yawn_siam/Shutterstock; Lesson 3.7: Fig. 4, Paul Glendell/Alamy Stock Photo; Fig. 5, Shchipkova Elena/Shutterstock; Fig. 6, Pronghorn Productions/Shutterstock; Lesson 3.8: Fig. 1, Rorygez Fresh/Shutterstock; Lesson 3.9: Fig. 1, Chris Ison/Shutterstock; Fig. 2(a), smutan/Shutterstock; Fig. 2(b), Maquiladora/Shutterstock; Fig. 2(c), Alfmaler/Shutterstock; Fig. 2(d), Alfmaler/Shutterstock; Fig. 2(e), StockSmartStart/Shutterstock; Fig. 2(f), PictuLandra/Shutterstock; Fig. 2(g), StockSmartStart/Shutterstock; Fig. 2(h), Anviczo/Shutterstock; Fig. 2(i), Alfmaler/Shutterstock; Fig. 2(j), H.Elvin/ Shutterstock; Fig. 2(k), Hipatia/Shutterstock; Fig. 2(l), nexusby/Shutterstock; Fig. 2(m), amran Karimov/Shutterstock; Fig. 2(n), Spreadthesign/Shutterstock; Fig. 2(o), Pogaryts’kyy/Shutterstock; Fig. 2(p), ideyweb/Shutterstock; Fig. 2(q), Sketchbook Designs/Shutterstock; Fig. 4(a), Arko Lucieer Head of School, Geography, Planning, and Spatial Sciences Professor in Remote Sensing University of Tasmania; Fig. 4(b), Arko Lucieer Head of School, Geography, Planning, and Spatial Sciences Professor in Remote Sensing University of Tasmania; Fig. 3, © Marco Schmidt; Lesson 3.10: Fig. 1, Frank Martins/ Shutterstock; Fig. 2, Eric Isselee/Shutterstock; Lesson 3.11: Fig. 1, dexns/ Shutterstock; Lesson 3.12: Fig. 1, Jason Edwards/Alamy Stock Photo; Fig. 2,
Alex Cimbal/Shutterstock; Fig. 3, Anton Prado PHOTO/Shutterstock; Fig. 4, jindrich_pavelka/Shutterstock; Fig. 5, News Ltd/Newspix; Fig. 6, Greg Brave/ Shutterstock; Fig. 7, Milosz Maslanka/Shutterstock; Fig. 8, Auscape International Pty Ltd/Alamy Stock Photo; Lesson 3.13: Fig. 1, studiaprofi/ Shutterstock; Fig. 2(A), David Evison/Shutterstock; Fig. 2(B), vkilikov/ Shutterstock; Fig. 3, Photography by Rob D/Shutterstock; Fig. 4, Darren McNamara/Newspix; Fig. 5, Adwo/Shutterstock; Fig. 7(A), Rudy Umans/ Shutterstock; Fig. 7(B), Vadym Zaitsev/Shutterstock; Lesson 3.14: Fig. 1, Tabatha Del Fabbro/Shutterstock; Lesson 3.15: Fig. 3, Chris Ison/Shutterstock; Fig. 5, Vlad Ra27/Shutterstock; Fig. 6, John Carnemolla/Shutterstock; Fig. 7, georgeclerk/Getty Images. Module 4: Opener: SAM FALCONER, DEBUT ART/SCIENCE PHOTO LIBRARY. Lesson 4.2: Fig. 1(A), sirtravelalot/ Shutterstock; Fig. 1(B), withGod/Shutterstock; Fig. 1(C), Vibe Images/ Shutterstock; Lesson 4.3: Fig 1, Photographer: Brent Parker Jones; Fig. 2, Photographer: Brent Parker Jones; Lesson 4.4: Fig. 2, David Steele/Shutterstock; Fig. 3 (A), sima/Shutterstock; Fig. 3(B), zstock/Shutterstock; Fig. 3(C), goran cakmazovic/Shutterstock; Fig. 1, DORLING KINDERSLEY/UIG/SCIENCE PHOTO LIBRARY; Fig. 5, mark higgins/Alamy Stock Photo; Lesson 4.5: Fig. 1, mato/Shutterstock; Lesson 4.6: Fig. 2(B), Kletr/Shutterstock; Fig. 3, RobynCharnley/Shutterstock; Fig. 1, Science Photo Library/Alamy Stock Photo; Fig. 4, KPG-Payless/Shutterstock; Fig. 5, www.sandatlas.org/ Shutterstock; Fig. 6, Cam Laird/Shutterstock; Lesson 4.8: Fig. 1, Madlen/ Shutterstock; Fig. 4, Smileus/Shutterstock; Fig. 2, Grandpa/Shutterstock; Fig. 7, oliveromg/Shutterstock; Fig. 3, Science Photo Library/Alamy Stock Photo; Fig. 6, Chris Howes/Wild Places Photography/Alamy Stock Photo; Fig. 5, THP Creative/Shutterstock; Lesson 4.10: Fig. 1, Ingrid Balabanova/ Shutterstock; Fig. 2, Hornsdale Power Reserve; Fig. 3, Haiyin Wang/Alamy Stock Photo; Fig. 4, AngieC333/Shutterstock; Lesson 4.11: Fig. 1(A), ArtisticPhoto/Shutterstock; Fig. 1(B), Maxim Petrichuk/Shutterstock; Fig. 1(C), David Steele/Shutterstock; Lesson 4.12: Fig. 1, iacomino FRiMAGES/ Shutterstock; Fig. 2, blurAZ/Shutterstock. Module 5: Opener: SAM FALCONER, DEBUT ART/SCIENCE PHOTO LIBRARY. Lesson 5.1: Fig. 1, GizemG/Shutterstcok; Fig. 2, MarcelClemens/Shutterstock; Fig. 4, Alhovik/Shutterstock; Lesson 5.2: Fig. 1, © The University of Waikato Te Whare Wānanga o Waikato | www.sciencelearn.org.nz/NASA; Fig. 2, Newspix/File Photo; Fig. 3, Science Photo Library/Alamy Stock Photo; Fig. 4, David de Groot/Getty Images; Lesson 5.3: Fig. 1, godrick/Shutterstock; Lesson 5.4: Fig. 1, godrick/Shutterstock; Lesson 5.5: Fig. 1, © Ray Norris and John Morieson; Fig. 2, Rainer Hartmeyer/Alamy Stock Photo; Fig. 5, Cairns Charts & Maps; Lesson 5.6: Fig. 1, Jason Benz Bennee/Shutterstock; Fig. 2, Hubble/ European Space Agency/NASA; Fig. 3(A), NASA/ESA/STSCI/SCIENCE PHOTO LIBRARY; Fig. 3(B), NASA/ESA/CSA/STSCI/SCIENCE PHOTO LIBRARY; Fig. 4, NASA/JPL-Caltech; Lesson 5.7: Fig. 2, © Commonwealth of Australia , Bureau of Meteorology. Released under CC BY 3.0 AU; Fig. 4, Vladimir Wrangel/Shutterstock; Fig. 5, Joseph Sohm/Shutterstock; Fig. 6, petesphotography/Getty Images; Fig. 7, NASA/SCIENCE PHOTO LIBRARY. Module 6: Opener: SAM FALCONER, DEBUT ART/SCIENCE PHOTO LIBRARY. Lesson 6.1: Fig. 4, Cary Westfall/Shutterstock; Fig. 5, lzf/ Shutterstock; Fig. 6, Vaclav Volrab/Shutterstock; Fig. 7, lev radin/Shutterstock; Fig. 8, David Crausby/Alamy Stock Photo; Fig. 9, Torsak Thammachote/ Shutterstock; Fig. 10, vitor costa/Shutterstock; Fig. 1, Maciej Rogowski Photo/ Shutterstock; Fig. 2, Levent Konuk/Shutterstock; Lesson 6.3: Fig. 1, Mark Dadswell/Getty Images; Fig. 2, skynesher/Getty Images; Lesson 6.4: Fig. 6, Anirban Basu/Alamy Stock Photo; Fig. 1, riphoto3/Shutterstock; Fig. 6.5: Fig. 1(A), CORDELIA MOLLOY/SCIENCE PHOTO LIBRARY; Fig. 1(B), CORDELIA MOLLOY/SCIENCE PHOTO LIBRARY; Fig. 1(C), CORDELIA MOLLOY/SCIENCE PHOTO LIBRARY; Fig. 3, Ed Jenkins/ Shutterstock; Fig. 5, Darelfata/Shutterstock; Fig. 4(A), G.GLATZMAIER, LOS ALAMOS NATIONAL LABORATORY/P.ROBERTS, UCLA/ SCIENCE PHOTO; Fig. 4(B), G.GLATZMAIER, LOS ALAMOS NATIONAL LABORATORY/P.ROBERTS, UCLA/SCIENCE PHOTO; Lesson 6.6: Fig. 2, James Kirkikis/Shutterstock; Fig. 3, sciencephotos/Alamy Stock Photo; Fig. 1, blickwinkel/Alamy Stock Photo; Lesson 6.7: Fig. 1, Hurst Photo/Shutterstock; Lesson 6.8: Fig. 2, Vitalii Nesterchuk/Shutterstock; Lesson 6.9: Fig. 1, © Wikihow; Fig. 2, © Wikihow; Fig. 3, © Wikihow; Fig. 4, © Wikihow; Lesson 6.11: Fig. 1, ziggy_mars/Getty Images; Fig. 2,
DRAFT
grayjay/Shutterstock; Fig. 4, EHT Collaboration/European Southern Observatory (ESO); Fig. 5, TIM BROWN/SCIENCE PHOTO LIBRARY; Lesson 6.12: Fig. 1, Matthew Ennis/Shutterstock; Fig. 2, withGod/Shutterstock; Fig. 3, Ensuper/Shutterstock; Lesson 6.14: Fig. 1, © Look and Learn/Bridgeman Images; Fig. 2(B), TuktaBaby/Shutterstock; Fig. 3, Nakornthai/Shutterstock; Fig. 6, Hemis/Alamy Stock Photo; Fig. 5(B), MNI/Shutterstock; Fig. 7(B), Steve Gorton/Getty Images; Fig. 8(B), Neale Cousland/Shutterstock; Fig. 9, “© Richard Aldridge, sourced from https://www.aboriginal-bark-paintings. com/aboriginal-woomera/.; Fig. 11, New Africa/Shutterstock; Fig. 12, Peter Steiner/Alamy Stock Photo; Fig. 4, PeopleImages/Getty Images; Lesson 6.17: Fig. 1, john photon/Shutterstock; Fig. 6, jada photo/Getty Images; Lesson 6.19: Fig. 2, TommL/Getty Images; Fig. 3, Dorling Kindersley ltd/Alamy Stock Photo; Fig. 4, Geofff/Shutterstock; Fig. 5, Africa Studio/Shutterstock; Fig. 6, Ljupco Smokovski/Shutterstock; Fig. 7, VladyslaV Travel photo/Shutterstock; Fig. 1, Paul Glendell/Alamy Stock Photo; Lesson 6.20: Fig. 1, studiovin/ Shutterstock; Fig. 2, Daniela Pelazza/Shutterstock; Fig. 3, withGod/ Shutterstock; Fig. 4, bergamont/Shutterstock; Lesson 6.21: Fig. 3, vankad/123rf; Fig. 4, © Kidsafe NSW Inc ABN 29 532 079 872 c/o Kidsafe House Westmead NSW 2145 e: schn-kidsafe@health.nsw.gov.au p: 02 9845 0894 w: www. kidsafensw.org; Lesson 6.22: Fig. 2(A), Dan Thornberg/Shutterstock; Fig. 2(B), xpixel/Shutterstock; Fig. 3, anek.soowannaphoom/Shutterstock; Lesson 6.23: Fig. 1, James Croucher/Newspix; Fig. 2, Scott Barbour/Getty Images; Lesson 6.24: Fig. 7, pavelwp/Shutterstock; Fig. 8, Pike-28/Shutterstock; Fig. 9, Bill Bachman/Alamy Stock Photo. Module 7: Opener: SAM FALCONER, DEBUT ART/SCIENCE PHOTO LIBRARY. Lesson 7.1: Fig. 4, Chaykovsky Igor/Shutterstock; Fig. 1, Karkas/Shutterstock; Fig. 2, VitaminCo/Shutterstock; Fig. 3, Firma V/Shutterstock; Fig. 4, G A Goulding/Shutterstock; Fig. 6, omersukrugoksu/Getty Images; Fig. 7, haveseen/Shutterstock; Fig. 8, Petr Malyshev/Shutterstock; Fig. 10(a), Africa Studio/Shutterstock; Fig. 10(b), Nairi Erkir 79/Shutterstock; Fig. 10(c), Magnascan/Getty Images; Fig. 9, illustrissima/ Shutterstock; Lesson 7.3: Fig. 1, GRANGER - Historical Picture Archive/ Alamy Stock Photo; Fig. 2, GRANGER - Historical Picture Archive/Alamy Stock Photo; Lesson 7.4: Fig. 1, Maxiphoto/Getty Images; Fig. 4, Olga Popova/ Shutterstock; Fig. 5, Aleksey Patsyuk/Shutterstock; Lesson 7.5: Fig. 1, Dmitry Kalinovsky/Shutterstock; Fig. 3(A), Simages.com/Shutterstock; Fig. 3(B), MAHATHIR MOHD YASIN/Shutterstock; Lesson 7.7: Fig.2, Rendery/Getty Images; Fig. 4, David R. Frazier Photolibrary, Inc./Alamy Stock Photo; Fig. 5, Fairfax Photos/JOE ARMAO; Fig. 3, RP Library/Alamy Stock Photo; Fig. 4, Matej Kastelic/Shutterstock; Lesson 7.11: Fig. 1, xpixel/Shutterstock; Fig. 3, Calum Robertson/Newspix; Fig. 4, FrimuFilms/Shutterstock. Module 8: Opener: SAM FALCONER, DEBUT ART/SCIENCE PHOTO LIBRARY. Lesson 8.1: Fig.1, Monkey Business Images/Shutterstock; Fig. 2(B), Jodie Johnson/Shutterstock; Fig. 3(B), Kamira/Shutterstock; Fig. 4, Naufal MQ/ Shutterstock; Fig. 5, M. Unal Ozmen/Shutterstock; Lesson 8.2: Fig. 2, nito/ Shutterstock; Lesson 8.3: Fig. 3, Chris Hondros/Getty Images; Fig. 4, bluehand/ Shutterstock; Lesson 8.4: Fig. 1, Steve Holderfield/Shutterstock; Lesson 8.5: Fig. 1, on9store/Shutterstock; Lesson 8.6: Fig. 1, Penny Tweedie/Getty Images; Fig. 2(A), nito/Shutterstock; Fig. 2(B), Roman Samokhin/Shutterstock; Fig. 3, Tikta Alik/Shutterstock; Fig. 4, Kekyalyaynen/Shutterstock; Fig. 5, egd/ Shutterstock; Lesson 8.7: Fig. 1, Alena Brozova/Shutterstock; Lesson 8.8: Fig. 1, gresei/Shutterstock; Fig. 3, Wessel du Plooy/Shutterstock; Fig. 5, Nixx Photography/Shutterstock; Fig. 6, Martin Bergsma/Shutterstock; Lesson 8.10: Fig. 1, Science Photo Library/Alamy Stock Photo; Fig. 2, Brian Goodman/ Shutterstock; Fig. 4, Madeleine Steinbach/Shutterstock; Lesson 8.12: Fig. 1, mTaira/Shutterstock; Lesson 8.13: Fig. 1, GIPHOTOSTOCK/SCIENCE
PHOTO LIBRARY; Fig. 2, Simone Stone/SPL/Alamy; Fig. 4, Polimerek via Wikimedia Commons; Fig. 5, TATSIANAMA/Shutterstock; Lesson 8.15: Fig. 4, Rob Hyrons/Shutterstock; Lesson 8.16: Fig. 1, Graham Taylor Photography/Shutterstock; FIg. 2, Kekyalyaynen/Shutterstock; Fig. 3, Pyty/ Shutterstock; Fig. 4, nostal6ie/Shutterstock; Lesson 8.17: Fig. 1, Avalon/ Construction Photography/Alamy Stock Photo; Fig. 2, pryzmat/Shutterstock; Fig. 4, nito/Shutterstock; Lesson 8.18: Fig. 1, ; Fig. 3, akepong srichaichana/ Shutterstock; Fig. 5(A), Aiman Chehimi/Shutterstock; Fig. 5(B), Pif Paf Puf Studio/Shutterstock; Fig. 5(C), NisanatStudio/Shutterstock; Fig. 7, John Tunney/Shutterstock; Fig.8 , Vera Larina/Shutterstock