Uncorrected pageproofs
This sample is provided in draft format for inspection purposes.


This sample is provided in draft format for inspection purposes.
To access a sample of the digital resources that support the series, visit: oup.com.au/ac-sci-info
Oxford University Press is a department of the University of Oxford. It furthers the University’s objective of excellence in research, scholarship, and education by publishing worldwide. Oxford is a registered trademark of Oxford University Press in the UK and in certain other countries.
Published in Australia by Oxford University Press Level 8, 737 Bourke Street, Docklands, Victoria 3008, Australia.
© Helen Silvester 2023
The moral rights of the author have been asserted
First published 2016 Second edition 2023
All rights reserved. No part of this publication may be reproduced, stored in a retrieval system, or transmitted, in any form or by any means, without the prior permission in writing of Oxford University Press, or as expressly permitted by law, by licence, or under terms agreed with the reprographics rights organisation. Enquiries concerning reproduction outside the scope of the above should be sent to the Rights Department, Oxford University Press, at the address above.
You must not circulate this work in any other form and you must impose this same condition on any acquirer.
ISBN 9780190331818
The Australian Copyright Act 1968 (the Act) allows educational institutions that are covered by remuneration arrangements with Copyright Agency to reproduce and communicate certain material for educational purposes. For more information, see copyright.com.au.
Typeset by QBS Learning
Proofread by Sarah Endacott
Indexed by Max McMaster Printed in XXX
Aboriginal and Torres Strait Islander peoples are advised that this publication may include images or names of people now deceased.
Links to third party websites are provided by Oxford in good faith and for information only. Oxford disclaims any responsibility for the materials contained in any third party website referenced in this work.
No part of this publication may be reproduced, stored in a retrieval system or transmitted in any form or by any means.


Scientists work collaboratively and individually in the laboratory or the field, to plan or conduct investigations safely and ethically. Scientists make predictions, control variables and record their results accurately. Scientists communicate their results using scientific language.


The properties of the different states of matter can be explained using the particle model. Scientists' understanding of matter has developed over thousands of years. 2


All things are made of materials. Many materials are mixtures. Some materials are not mixtures – they consist of one pure substance. Mixtures contain a combination of pure substances that can be separated using a range of techniques.


A force is a push or pull, arising from the interaction between two objects. Change is caused by unbalanced forces acting on the object. Earth’s gravity pulls objects towards the centre of the Earth.

Living things are called organisms. There are differences within and between groups of organisms. Classification is a system that helps organise the diversity of life on Earth. The system of classification continues to develop and change.


Organisms interact with one another in their environments. Scientists use food webs and food chains to represent these interactions. Humans are part of the food chain, and human activity can affect the interaction of the organisms.
The position of the Sun, Earth and Moon in the sky causes change on Earth, including seasons, tides and eclipses. Scientists can make predictions based on the relative positions of the Sun, Earth and Moon.
Introducing Oxford Science 7–10 Australian Curriculum ................. vi
Aus tralian Curriculum: Science 7 scope and sequence .................... x
1.1 Science is the study of the natural and physical world 4
1.2 Scientists use specialised equipment 6
1.3 Scientists take safety precautions 9
1.4 Scientists use observation and inference to answer questions 11
1.5 Science relies on measuring with accuracy 13
1.6 A Buns en burner is an essential piece of laboratory equipment 17
1.7 A fair test is a controlled experiment 19
1.8 Graphs and tables are used to show results 22
1.9 Scientists analyse claims and results 26
1.10 Scientific reports communicate findings 28
1.11 Science as a human endeavour: Science skills are used to solve important problems 30
1.12 Firs t Nations Australians use science 32
1.13 Cognitive verbs identify the tasks in a question 34
Chapter 1 review 36
2.1 There are three states of mat ter 42
2.2 Scientists’ understanding of matter has developed over thousands of years 46
2.3 The particle model explains matter 48
2.4 The particle model can explain the properties of matter 50
2.5 Incr easing kinetic energy in matter causes it to expand 52
2.6 Science as a human endeavour: Scientists find ways to communicate 54 Chap ter 2 review 56
.............
3.1 Mixtures are a combination of two or more substances 62
3.2 A solution is a solute dissolved in a solvent 64
3.3 Mixtures can be separated according to their properties 66
3.4 Mixtures can be separated according to their size and mass 68
3.5 The boiling points of liquids can be used to separate mix tures 70
3.6 Solubility can be used to separate mixtures 72
3.7 Science as a human endeavour: Wastewater is a mixture that can be separated 74
3.8 Science as a human endeavour: Materials recovery facilities separate mixtures 76
Chap ter 3 review 78
.................
4.1 A force is a push, a pull or a twist 84
4.2 An unbalanced force causes change 86
4.3 Forces can be contact or non-contact 88
4.4 Magnetic fields can apply a force from a distance 90
4.5 Elec trostatic forces are non-contact forces 92
4.6 Earth’s gravity pulls objects to the centre of the Earth 94
4.7 Fric tion slows down moving objects 96
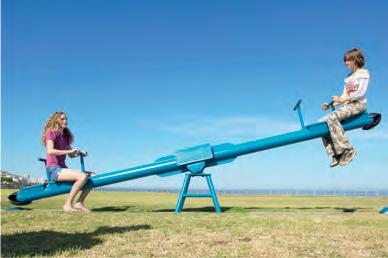
4.8 Simple machines decrease the amount of effort needed to do work................................ 98
4.9 A pulley changes the size or direction of a force 102
4.10 Ther e are different types of machines 104
4.11 Science as a human endeavour: The forces in flight 106
4.12 Science as a human endeavour: Forces are involved in sport 108
Chapter 4 review 110
..
5.1 Classification organises our world 116
5.2 Living organisms have characteristics in common 118
5.3 Clas sification keys are visual tools 120
5.4 The cl assification system continues to change 122
5.5 Kingdoms can be used to classify organisms 124
5.6 Animals that have no skeleton are called invertebrates 126
5.7 Vertebrates can be organised into five classes 128
5.8 Plant s can be classified according to their characteristics 130
5.9 The first Australian scientists classified their environment 132
5.10 Science as a human endeavour: Taxonomists classify new species 134
Chap ter 5 review 136
6.1 All organisms are interdependent 142
6.2 All or ganisms have a role in an ecosystem 144
6.3 Ener gy flows through an ecosystem 148
6.4 Population size depends on abiotic and biotic factors 150
6.5 Intro ducing a new species may disrupt a food web 154
6.6 Ecos ystems can be disrupted 158
6.7 Science as a human endeavour: Human management of ecosystems continues to change 162
Chapter 6 review 166
No part of this publication may be reproduced, stored in a retrieval system or transmitted in any form or by any means.


Oxford Science Victorian Curriculum has been developed to meet the requirements of the Victorian Curriculum: Science across Years 7–10. Taking a concept development approach, each double-page spread of Oxford Science represents oneconcept , onetopic and onelesson. This new edition ensures students build science skills and cross-curriculum capabilities, paving a pathway for science success at VCE.

The series offers a completely integrated suite of print and digital resources to meet your needs, including:

Student Book
Student obook pro
Teacher obook pro.
This Student Book combines complete curriculum coverage with clear and engaging design.
Each print Student Book comes with complete access to all the digital resources available on Student obook pro.
• Students are encouraged to selfassess their learning against a set of success criteria in the Chapter checklist tables at the end of each chapter. If students do not feel confident about their learning, they are directed back to the relevant topic.
• Every chapter begins with a clear learning pathway for students.
• Every topic begins with a concept statement that summarises the key concept of the topic in one sentence.
Learning intentions are clearly stated for every topic.
• Key ideas are summarised for each topic in succinct dot points.
• Key ideas are summarised for each topic in succinct dot points.
• Where relevant, digital icons flag engaging resources that can be accessed via Student obook pro. These resources are directly integrated with the topic being covered.

• Key terms are bolded in the body in blue text, with a glossary definition provided in the margin.
• Each topic finishes with a set of ‘Check your learning’ questions that are aligned to the learning intentions for the topic. Questions are phrased using bolded cognitive verbs from Marzano and Kendall’s taxonomy, which state what is expected of a student and prepares them for studying senior science subjects.
No part of this publication may be reproduced, stored in a retrieval system or transmitted in any form or by any means.


Science toolkit

• The Science toolkit is a standalone chapter that explicitly teaches important science inquiry skills and capabilities.

• ‘Science as a human endeavour’ topics explore real-world examples and case studies, allowing students to apply science understanding.

Challenges, Skills labs and Experiments


• Take the hard work out of cross-curricular learning with engaging STEAM projects. Two fully integrated projects are included at the end of each book in the series, and are scaffolded and mapped to the Science, Maths and Humanities curricula. The same projects also feature in the corresponding Oxford Humanities and Oxford Maths series to assist cross-curricular learning.

Icons found in the student book link to digital resources accessible via the obook pro.
Digital versions of the Chapter review questions
Videos Digital quizzes Interactives
Density of water = mass/ (g/mL) 10 mL 50 20 Average Discussion 1 The standard value for the density of water 1.00 g/mL at 25°C. Compare the values you obtained to this value. 2 Describe one factor that could have affected the accuracy of your results. 3 Compare the accuracy of the density value of the small volume of water with the density value of the large volume 4 Use your answer to question
to
why scientists should repeat their experiments.
Problem solving through design thinking
• Each STEAM project investigates a real-world problem that students are encouraged to problem solve using design thinking.
Full digital support
No part of this publication may be reproduced, stored in a retrieval system or transmitted in any form or by any means. DRAFT
• Each STEAM project is supported by a wealth of digital resources, including student booklets (to scaffold students through the design-thinking process of each project), videos to support key concepts and skills, and implementation and assessment advice for teachers.

> Student obook pro is a completely digital product delivered via Oxford’s online learning platform, OxfordDigital.
> It offers a complete digital version of the Student Book with interactive note-taking, highlighting and bookmarking functionality, allowing students to revisit points of learning.
> A complete ePDF of the Student Book is also available for download for offline use and read-aloud functionality.
• This digital version of the Student Book is true to the print version, making it easy to navigate and transition between print and digital.
• Videos are available online to support understanding of concepts or key practical activities.
• Integrated Quizlet sets, including real-time online quizzes with live leaderboards, motivate students by providing interactive games that can be played solo or as a class. Quizlet can be used for revision or as a topic is introduced to keep students engaged.

• Each topic in the Student Book is accompanied by an interactive assessment that can be used to consolidate concepts and skills.

These interactive quizzes are autocorrecting, with students receiving instant feedback on achievement and progress. Students can also access all their online assessment results to track their own progress and reflect on their learning.
> integrated Australian Concise Oxford Dictionary look-up feature

> targeted instructional videos for key concepts, practicals and worked examples
> interactive assessments to consolidate understanding
> integrated Quizlet sets, including real-time online quizzes with live leaderboards
> access to their online assessment results to track their own progress.
> Teacher obook pro is a completely digital product delivered via OxfordDigital.
> Each chapter and topic of the Student Book is accompanied by full teaching support. Teaching programs are provided that clearly direct learning pathways throughout each chapter, including ideas for differentiation and practical activities.
> Teachers can use their Teacher obook pro to share notes and easily assign resources or assessments to students, including due dates and email notifications.
• Teaching support includes full lesson and assessment planning, ensuring there is more time to focus on students.
• Each chapter of the Student Book is accompanied by additional worksheets and learning resources to help students progress.
> In addition to online assessment, teachers have access to editable class tests that are provided at the conclusion of each chapter. These tests can be used as formative or summative assessment and can be edited to suit the class’s learning outcomes.
> Teachers are provided with laboratory support through experiment answer guidance, laboratory technician notes and risk assessments to ensure safe learning experiences.

• Teachers are provided with clear and tangible evidence of student learning progress through curriculum and assessment reports.
• Assessment reports directly show how students are performing in each online interactive assessment, providing instant feedback for teachers about areas of understanding.


• Curriculum reports summarise student performance against specific curriculum content descriptions and curriculum codes.
No part of this publication may be reproduced, stored in a retrieval system or transmitted in any form or by any means.
In Year 7, the curriculum focus is on explaining phenomena involving science and its applications. Students explore changes in matter at a particle level, and distinguish between chemical and physical change. They explain changes in an object’s motion by considering the interaction between multiple forces. Students explain the role of classification in ordering and organising information about living and non-living things. They use and develop models including food chains, food webs and the water cycle to represent and analyse the flow of energy and matter through ecosystems and explore the impact of changing components within these systems. Students investigate relationships in the Earth–Sun–Moon system and use models to predict and explain astronomical phenomena. Students make accurate measurements and control variables in experiments to analyse relationships between system components and explore and explain these relationships using appropriate representations. They use observations and other evidence to draw conclusions about data, and start to gain an appreciation for ethical and cultural considerations when acquiring data.
Science as a human endeavour
All chapters
Nature and development of science
• Explain how new evidence or different perspectives can lead to changes in scientific knowledge (AC9S7H01)
• Investigate how cultural perspectives and world views influence the development of scientific knowledge (AC9S7H02)
All chapters Use and influence of science
• Examine how proposed scientific responses to contemporary issues may impact on society and explore ethical, environmental, social and economic considerations (AC9S7H03)
• Explore the role of science communication in informing individual viewpoints and community policies and regulations (AC9S7H04)
Biological sciences
Chapter 5 Investigate the role of classification in ordering and organising the diversity of life on Earth and use and develop classification tools including dichotomous keys (AC9S7U01)
Chapter 6 Use models, including food webs, to represent matter and energy flow in ecosystems and predict the impact of changing abiotic and biotic factors on populations (AC9S7U02)
Earth and space sciences
Chapter 7 Model cyclic changes in the relative positions of the Earth, Sun and Moon and explain how these cycles cause eclipses and influence predictable phenomena on Earth, including seasons and tides (AC9S7U03)
Physical sciences
Chapter 6 Investigate and represent balanced and unbalanced forces, including gravitational force, acting on objects, and relate changes in an object’s motion to its mass and the magnitude and direction of forces acting on it (AC9S7U04)
Chemical sciences
Chapter 2 Use particle theory to describe the arrangement of particles in a substance, including the motion of and attraction between particles, and relate this to the properties of the substance (AC9S7U05)
Chapter 3 Use a particle model to describe differences between pure substances and mixtures and apply understanding of properties of substances to separate mixtures (AC9S7U06)
All chapters develop investigable questions, reasoned predictions and hypotheses to explore scientific models, identify patterns and test relationships (AC9S7I01)
All chapters Plan and conduct reproducible investigations to answer questions and test hypotheses, including identifying variables and assumptions and, as appropriate, recognising and managing risks, considering ethical issues and recognising key considerations regarding heritage sites and artefacts on Country/Place (AC9S7I02)
All chapters Select and use equipment to generate and record data with precision, using digital tools as appropriate (AC9S7I03)
All chapters Select and construct appropriate representations, including tables, graphs, models and mathematical relationships, to organise and process data and information (AC9S7I04)
All chapters Analyse data and information to describe patterns, trends and relationships and identify anomalies (AC9S7I05)
All chapters Analyse methods, conclusions and claims for assumptions, possible sources of error, conflicting evidence and unanswered questions (AC9S7I06)
All chapters Construct evidence-based arguments to support conclusions or evaluate claims and consider any ethical issues and cultural protocols associated with using or citing secondary data or information (AC9S7I07)
All chapters Write and create texts to communicate ideas, findings and arguments for specific purposes and audiences, including selection of appropriate language and text features, using digital tools as appropriate (AC9S7I08)
By the end of Year 7, students explain how biological diversity is ordered and organised. They represent flows of matter and energy in ecosystems and predict the effects of environmental changes. They model cycles in the Earth-Sun-Moon system and explain the effects of these cycles on Earth phenomena. They represent and explain the effects of forces acting on objects. They use particle theory to explain the physical properties of substances and develop processes that separate mixtures. Students identify the factors that can influence development of and lead to changes in scientific knowledge. They explain how scientific responses are developed and can impact society. They explain the role of science communication in shaping viewpoints, policies and regulations. Students plan and conduct safe, reproducible investigations to test relationships and aspects of scientific models. They identify potential ethical issues and intercultural considerations required for field locations or use of secondary data. They use equipment to generate and record data with precision. They select and construct appropriate representations to organise data and information. They process data and information and analyse it to describe patterns, trends and relationships. They identify possible sources of error in methods and identify unanswered questions in conclusions and claims. They identify evidence to support their conclusions and construct arguments to support or dispute claims. They select and use language and text features appropriately for their purpose and audience when communicating their ideas and findings.
Australian Curriculum, Assessment and Reporting Authority 2022
No part of this publication may be reproduced, stored in a retrieval system or transmitted in any form or by any means.
The author and the publisher wish to thank the following reviewers: Professor Bradley Moggridge, James Kennedy, Paguiel Meunier, Michelle Moore and Eliza Ba Than.
They also wish to thank the following copyright holders for reproduction of their material.


Cover: All Canada Photos / Alamy Stock Photo.


Chapter1: Donald Hobern/CC BY 2.0, https://creativecommons.org/licenses/by/2.0/, p.24 fig 2; Dani Gawlik / Newspix, p.25 fig 3; Getty/The Washington Post, p.3 fig 6; Getty/Nick Dolding, p.11; Getty/Peter Macdiarmid, p.18 fig 1a; PCN Photography/ Alamy Stock Photo, p.18 fig 1b; Rolf Schulten/ImageBROKER/Alamy, p.3 fig 9; Simone Stone/SPL/Alamy, p.6 fig 1a; Science Photo Library/Alamy Stock Photo, p.14 fig 3 & 4; Shutterstock, p.2 fig 1, p.3 fig 3, 4, 5, 7, 8, p.5 fig 2, p.6 fig 1b, p.7 fig 4, p.8 fig 1, p.11 fig 1, 2, 3, p.12 fig 6, p.16 fig 1, p.19 fig 6, p.24 fig 1, p.27 fig 2, p.28 fig 1.
Chapter2: Calum Robertson/Newspix, p.47 fig 4; David R. Frazier Photolibrary, Inc./Alamy Stock Photo, p.43 fig 5; Fairfax Photos/JOE ARMAO, p.43 fig 6; Granger Historical Picture Archive/ Alamy Stock Photo, p.36 fig 1 & 2; istock/ omersukrugoksu, p.32 fig 2; istock/ Logray-2008, p.32 fig 3; istock/small frog, p.40, istock/prill, p.42 fig 1; istock/ Rendery, p.42 fig 2; John Sirlin/Alamy Stock Photo, p.38 fig 1; Shutterstock, p.32 fig 1, p.33 fig 4, 5, 6, 7, p.34 fig 8 & 9, p.35 fig 10, p.39 fig 5 & 8, p.41 fig 3, p.42 fig 3a & 3b, p.44 fig 1, p.45 fig 4 & 5, p.46 fig 1; Valvoline, p.46 fig 2.
Chapter3: Avalon/Construction Photography/Alamy Stock Photo, p.64 fig 1; Polimerek via Wikimedia Commons, p.61 fig 4; Stocksy.com/Hugh Sitton, p.52 fig 2; Simone Stone/SPL/Alamy, p.60 fig 2; Shutterstock, p.50 fig 1, p.51 fig 4 & 5, p.53 fig 4, p.54 fig 2, 3, 4, 5, 6, p.56 fig 1, p.57 fig 4, 5, 6, 7, p.58 fig 1 & 2, p.59 fig 4, p.62 fig 1, 2, 3, p.63 fig 4.
Chapter4: Auscape/Reg Morrison, p.74 fig 1; Fairfax Photos/Adam McLean, p.76 fig 2; Getty/PETER HARRISON, p.79 fig 2; Shutterstock, p.61 fig 5, p.65 fig 3 & 4, p.70 fig 1, p.72 fig 1(a) & 1(b), p.73 fig 4, p.75 fig 4, p.77 fig 3 & 4, p.78 fig 1.
Chapter5: Adrian Morphett, p.96 fig 1; Chris Howes/Wild Places Photography/ Alamy Stock Photo, p.93 fig 7; Haiyin Wang/Alamy Stock Photo, p.95 fig 4; mark higgins/Alamy Stock Photo, p. 88 fig 5; Melissa Supangat, p.97 fig 2; Neoen/ Hornsdale Power Reserve, p.95 fig 3; Science Photo Library/Alamy Stock Photo, p.87 fig 3; Science Photo Library/Alamy Stock Photo, p.90 fig 3; Science Photo Library/Alamy Stock Photo, p.93 fig 5;
Shutterstock, p.84 fig 1(a), (b), (c), p.86 fig 1, fig 2 (a), (b), (c), p.90 fig 2, p.91 fig 4, 5, 6, p.92 fig 1, 2, 3, fig 4, p.93 fig 6, p.94 fig 1 & 2, p.97 fig 3, p.98 fig 1, p.99 fig 2 & 3.


Chapter6: David de Groot/Getty, p.105 fig 3; NASA, p.102 fig 1, fig 2, p.108 fig 1, p.109 fig 4; Newspix/File Photo, p.105 fig 2; Ray Norris, p.106 fig 1; Rainer Hartmeyer/ Alamy Stock Photo, p.106 fig 2; Science Photo Library/Alamy Stock Photo, p.105 fig 4; Shutterstock, p.101 fig 1, p.102 fig 3, p.108 fig 2, p.109 fig 3 & 5, p.110 fig 1, p.111 fig 4.
Chapter7: Amanda Cotton/Alamy Stock Photo, p.124 fig 1; Anne Saarinen/Alamy Stock Photo, p.129 fig 4; blickwinkel/ Alamy Stock Photo, p.123 fig 6(a); BSIP SA / Alamy Stock Photo, p.123 fig 6(b); Bryan D. Lessard, p.133 fig 4; CSIRO, p.133 fig 3; Guy Holt, p. 132 fig 1; CSIRO/Martin Ollman, p.132 fig 2; Eye of Science, p. p.121 fig 4(b); Ed Reschke/ Getty, p.123 fig 5(b); Jean-Paul Ferrero/ AUSCAPE/Alamy, p.126 fig 1(c); John W Banagan/Getty, p.130 fig 2; Ken Griffiths/ Alamy Stock Photo, p.126 fig 2(a); Michael McKelvey & Dr Peggy Rismiller of Pelican Lagoon Research & Wildlife Centre, Kangaroo Island, South Australia, p.126 fig 1(a); Minden Pictures/Alamy Stock Photo, p.131 fig 4; Nick Volpe and Museum Victoria, p.115 fig 5; Raymond Gehman p.121 fig 4 (a); Science Photo Library/Alamy Stock Photo, p.123 fig 5(a); The Natural History Museum/Alamy Stock Photo, p.129 fig 5; Shutterstock, p.114 fig 1, 2 (a) & (b), p.116 fig 1, 2, 3, 4, p.117 fig 5, 6, 7, 8, p.120 fig 1, 2, 3, p.122 fig 2, 3, 4, p.124 fig 2, p.125 fig 3, p.126 fig 1(b), p.126 fig 2(b) & (c), p.127 fig 3, 4, 5, 6, p.128 fig 1, 2, 3, p.130 fig 1, p.131 fig 3, fig 4, p.134 fig 1, p.139 fig 4.
Pics Inc/Alamy Stock Photo, p.175 fig 7; dkimages/Tim Ridley, p.176 fig 2; Hemis/Alamy Stock Photo, p. 171 fig 3; istockphoto/Nancy Nehring, p.175 fig 6; istockphoto/TommL, p.176 fig 1; Jasper Juinen/Getty, p.154 fig 2; James Croucher/ Newspix, p.180 fig 1; John Sylvester/Alamy Stock Photo p.167 fig 4; Kidsafe nsw, p.179 fig 2; Rawpixel Ltd/Alamy Stock Photo, p.157 fig 3; © Look and Learn/Bridgeman Images, p.170 fig 1; Mark Dadswell /Getty, p.156 fig 2; Science Photo Library/Alamy Stock Photo, p.161 fig 4; Ole Graf, p. 170 fig 2(b); Peter Steiner/Alamy Stock Photo, p.173 fig 10; Robin Smith/Getty, p.167 fig 3, p.173 fig 7; sciencephotos/Alamy Stock Photo, p. 163 fig 3; Steve Gorton/ Getty, p.172 fig 5(b); Scott Barbour/Getty Images, p. 181 fig 2; Shutterstock, p.154 fig 1, 3, 4, 5, 6, p.155 fig 8 & 9, p.156 fig 1, p.161 fig 3 & 5, p.162 fig 2, p.164 fig 2, p.166 fig 1, p.168 fig 1 & 2, p.169 fig 3, p.172 fig 4(b), fig 6(b), p.173 fig 9, p.174 fig 1, 176 fig 3, p.177 fig 4, 5, 6.
Chapter10 : Brian Jackson/Alamy Stock Photo, p.190 fig 1; Natural Visions/ Alamy Stock Photo, p.222 fig 1(platypus); Shutterstock, p.188 fig 5, p.200 fig 2 & 3, p.201 fig 1, p.202, fig 1, p.204 fig 1, p.207 fig 1, p.211 fig 1, p.212 fig 1, p.214 fig 1, p.215 fig 1, p.218 fig 1, p.219 fig 1, p.220 fig 1, p.222 fig 1, p.223 fig 1, p.226 fig 1, p.228 fig 1, p.229 fig 1, p.230 fig 1, p.233 fig 1, p.239 fig 1 & 2, p.240 fig 3 & 4.

Chapter8: All Canada Photos/Alamy Stock Photo, p.140 fig 1; Auscape International Pty Ltd/Alamy Stock Photo, p.145 fig 5; Bon Appetit/Alamy Stock Photo, p. 148 fig 1; Craig Greenhill/ Newspix, p. 146 fig 2; CSIRO, p.151 fig 4; David Wall/Alamy Stock Photo, p.146 fig 1; Darren McNamara/Newspix, p.149 fig 4; Fernando Quevedo de Oliveira/Alamy Stock Photo, p.147 fig 4; John Woudstra/ Fairfax, p. 141 fig 4; Ken Griffiths/Alamy Stock Photo, p.143 fig 2; NSW Office of Environment & Heritage/E Slater, p.144 fig 1; News Ltd, p.144 fig 2; Nature Picture Library/Alamy Stock Photo, p.147 fig 5; Roger Donovan/Alamy Stock Photo, p.147 fig 3; Shutterstock, p.138 fig 2, p.140 fig 2, p.141 fig 5, p.143 fig 3 & 4, p.145 fig 3 & 4, p.149 fig 3, p.150 fig 2, p.151 fig 3; WildPictures/Alamy Stock Photo, p138 fig 2 (Springrail).
Chapter9 : Anirban Basu/Alamy Stock Photo, p. 159 fig 6; blickwinkel/Alamy Stock Photo, p.162 fig 1; David Crausby / Alamy Stock Photo, p.155 fig 7; Design
The Victorian Curriculum F–10 content elements are © VCAA, reproduced by permission. Victorian Curriculum F–10 elements are accurate at the time of publication. The VCAA does not endorse or make any warranties regarding this resource. The Victorian Curriculum F–10 and related content can be accessed directly at the VCAA website (https://www.vcaa.vic.edu.au/ Pages/HomePage.aspx).
Every effort has been made to trace the original source of copyright material contained in this book. The publisher will be pleased to hear from copyright holders to rectify any errors or omissions.
to rectify any errors or omissions.
No part of this publication may be reproduced, stored in a retrieval system or transmitted in any form or by any means.


By the end of this topic, you will be able to:
• Describe the questions scientists might ask.
• Describe where and how scientific investigations can occur.
Video 1.1A
Ask a scientist –
Dr Aaron Stewart (entomologist)
Video 1.1B
Ask a scientist –
Dr Jo Whittaker (geologist)
Video 1.1C
Ask a scientist –Dr Niraj Lal (physicist)
Video 1.1D
Ask a scientist –
Ms Jenny Powell (environmental scientist)
• Science measures what we observe (see, hear, smell and feel) and organises it into testable explanations.
• Scientists have jobs that focus on asking questions and finding answers.
• Some scientists work in a laboratory; all scientists work in teams.
• Scientists answer questions by observing, recording and interpreting what they find.
Many scientific discoveries start with one person who is curious about something. Our world would be a very different place without people asking questions, such as ‘How does this work?’ or ‘Why is this so?’
Sometimes curiosity comes from necessity. To survive, the fi rst humans had to discover through trial and error which foods were edible and which were poisonous. This was curiosity with lifeand-death results! The information was then passed from person to person to benefit many more people.
Figure 1 Early scientists were called natural philosophers.

Science is in the news every day. Some issues that scientists are curious about right now include alternative and ‘green’ energy sources, clean drinking water and food for a growing world population, and new cures for diseases such as the Ebola or Corona viruses. Scientists ask questions about the survival of the human race and space travel, and whether the human brain could be replaced by a computer. Science is an ongoing process that is never ‘fi nished’ – it is always changing.
Scientists find cause of disease outbreak Scientists develop cervical cancer vaccine
Scientists create tsunami warning system
OF THE YEAR
scientist a person who studies the natural and physical world
philosopher a ‘lover of knowledge’; someone who studies ideas, theories and questions
the study of the natural and physical world
Curiosity can also come from the desire to know more. In ancient Greece, there was much curiosity about the stars, the Sun, the Moon and our own planet. Early scientists were not called scientists at all – they were called ‘natural philosophers’ because of their interest in studying nature (Figure 1). Philosopher means ‘lover of knowledge’. Natural philosophers used their observations to develop calendars, to locate the Earth in the universe and to show that the Earth is round and not fl at.
Finding answers to problems that affect people and society is another result of curiosity (Figure 2). Many of the great advances in medicine, such as vaccinations and the discovery of penicillin, are the result of years of research. They have changed our lives, mostly for the better.
Figure 2 Curiosity leads scientists to new discoveries.
There are four main branches of science: biology, physics, chemistry, and earth and space science. Within each of these branches there are many different specific science professions that can overlap with one another. Usually, a scientist has dedicated years of study to specialise in one particular area. Figures 3–8 show six different types of scientists and a question they may spend time researching. Science is an ever-expanding search for knowledge and, as you will read, there is still a lot of research to be done.
No part of this publication may be reproduced, stored in a retrieval system or transmitted in any form or by any means.
Figure 3 A pharmacologist studies medicines and drugs and their effects on the human body. Is an experimental vaccine for the Ebola or Corona viruses safe for human trials?
Figure 4 A palaeontologist studies
ancient life, including dinosaur fossils. What can the mass extinction of dinosaurs teach us about modern life on Earth?

Figure 6 A meteorologist studies the atmosphere and weather patterns. How can we accurately predict cyclones?


Retrieve
Figure 7 A marine biologist studies life in the oceans and seas. How will rising sea waters affect the Great Barrier Reef?

Figure 8 A nanotechnologist studies substances at the atomic (very small) scale. Can we design drugs to target individual cells?
1Identify (write) the name that was given to the early scientists.
2Identify the four main branches of science described in this section.
Comprehend
3Describe one reason why being curious and asking questions is important in science.
4Describe one idea or invention that has changed in your lifetime due to science.

5 The meteorologist in Figure 6 is studying how to predict cyclones. Describe one advantage of this research.
Analyse

6 The environmental scientist in Figure 5 is investigating climate change. Identify two other scientists in this section who may work with an environmental scientist.
Apply
7 It is often said that science is never ‘fi nished’. Evaluate the truth of this
statement (by providing examples of science that are never fi nished and deciding if this statement is true).
8 Look carefully at Figure 9. Propose a possible question about gorillas that the scientist may be investigating. Describe the risk the close contact may have to: a the scientist b the gorillas.
atmosphere the envelope of gases surrounding the Earth or another planet cell (in biology) the building block of living things
Figure 9 A scientist observes gorillas

Quiz me
Complete the Quiz me to check how well you’ve mastered the learning intentions and to be assigned a worksheet at your level.
No part of this publication may be reproduced, stored in a retrieval system or transmitted in any form or by any means.
Learning intentions
• Describe a variety of different pieces of specialised science equipment.


Interactive 1.2 Types of equipment used in the laboratory
equipment items used in the laboratory to conduct experiments experiment an investigation used to solve a problem or fi nd an answer to a question results the measurements and observations made in an experiment; they are often presented in a table laboratory a specially designed space for conducting research and experiments apparatus equipment placed together for an experiment

Key ideas

Equipment is the name given to the beakers, Bunsen burners, fl asks, stands and other items used by scientists to conduct experiments . Using the correct equipment ensures reliable results and the safety of scientists. Commonly used equipment is shown in Figure 1. Some of the names


may sound unfamiliar, but you will soon learn what each piece of equipment is called and how it is used. The equipment in your school laboratory may look slightly different because each laboratory has its own types of equipment. Some items of equipment can be used together in an experiment. Equipment placed together for an experiment is called an apparatus
Measuring cylinder Bunsen burner Filter funnel Conical ask Tripod stand Test tubeStirring rods Watch glassThermometer Test tube holder Test tube rack Metal tongs
may be reproduced, stored in a retrieval system
or
1.2: Drawing scientific diagrams Go to page 191
1 Your class will divide into two teams and revise Figure 2. Spend 2 minutes reminding your self of the correct names for the pieces of equipment.
2 Your teacher will uncover a mystery tray containing 16 pieces of equipment. You will be able to view the tray for 60 seconds; it will then be re-covered.
3 Write down the names of all the pieces of equipment you can remember.
4 When you check your answers: score 2 points for each piece remembered and spelt correctly; score 1 point if the spelling was incorrect.
5 Add up the points for each team. The team with the most points wins.
Retort stand with boss head and clamp
Beaker
Measuring cylinder Bunsen burner Filter funnel
Conical ask Tripod stand
Test tube Stirring rods
Gauze mat
Evaporating dish Watch glass Thermometer
Test tube holder Test tube rack Spatula Metal tongs
Figure 2 Scientific drawings of laboratory equipment
No part of this publication may be reproduced, stored in a retrieval system or transmitted in any form or by any means.
scientific diagram a clear, side-view, labelled line drawing, usually made using a sharp pencil
To show others how to set up an experiment, scientists write a list of equipment needed and draw how it should be set up.
Scientists have a quick and simple way to show scientific equipment. They use drawings called scientific diagrams. Using scientific diagrams means you do not have to be an artist to be a good scientist and you have more time to do the experiments.
The procedure for drawing scientific diagrams is as follows:
1 Draw clearly and neatly.
2 Use a sharp grey pencil.
1Identify the name of each scientific diagram. a b
3 Draw the equipment from the side view.
4 Do not show any detail – just a simple outline with no shading.


5 Draw lines using a ruler.
6 Write labels neatly and connect them to the diagram with a line or arrow.
7 Spell labels correctly. Incorrect spelling makes good science look bad!
8 Diagrams should be between 6 and 10 cm high.
2Contrast (describe the differences between) a scientific diagram and an artist’s drawing.
3 Complete these sentences by writing them in your notes. a Laboratory equipment that is put together to do an experiment is called … b Experiment beakers, stands and other items used for experiments are called …

4Draw scientific diagrams for: a a fi lter funnel b a beaker c metal tongs d a measuring cylinder.
Figure 3 Scientific diagrams
Complete the Quiz me to check how well you’ve mastered the learning intentions and to be assigned a worksheet at your level.
Figure 4 Selecting the correct equipment for an investigation can improve the reliability of results.
No part of this publication may be reproduced, stored in a retrieval system or transmitted in any form or by any means.
• Scientists may be exposed to a variety of hazards in their work in a laboratory or in the field.
• Scientists need to plan experiments so that they can complete them safely.
• Experiments in a laboratory are easier to control.
As a science student, just like every scientist, it is your responsibility to be familiar with your laboratory and to know where the safety equipment is located, what the warning signs mean and what to do in an emergency. Most safety is common sense – common sense can prevent many dangerous situations.
Safety symbols are used in many different settings. You may have seen the symbols in Figure 1 on building sites, at entrances to buildings, at school or on roads.
Your laboratory may already have some of these symbols displayed.
Symbols are often simple drawings, although sometimes words are also used. If a picture can show a message clearly, words may not be needed.

A class laboratory is not like a normal classroom – there are additional rules to follow. The class laboratory is a place where people are learning to be better scientists, but they may not always get it right the fi rst time. You will notice your science skills improving as you do more and more experiments carefully in the laboratory.
> wear a lab coat for practical work
> keep your workbooks and paper away from heating equipment, chemicals and fl ames
> tie long hair back whenever you do an experiment
> wear safety glasses while mixing or heating substances
> tell your teacher immediately if you cut or burn yourself, break any glassware or spill chemicals
By the end of this topic, you will be able to:
Video 1.3A
Test tube skills
Video 1.3B
> wash your hands after an experiment > listen to and follow the teacher’s instructions
> wear gloves when your teacher instructs you to.
> run or push others or behave roughly > eat anything or drink from glassware or laboratory taps
> look down into a container or point it at a neighbour when heating or mixing chemicals
> smell gases or mixtures of chemicals directly; instead, waft them near your nose and only when instructed > mix chemicals at random > put matches, paper or other substances down the sink
> carry large bottles by the neck
> enter a preparation room without your teacher’s permission.
Flammable DRAFT
Can cause irritation or redness Corrosive Toxic Environmental hazard
The science laboratory a b
Figure 2 a Vulcanologists (scientists who study volcanoes) wear heatresistant silver suits to protect themselves against heat, ash and molten rock.
b Microbiologists researching infectious diseases wear protective clothing to ensure they do not get sick.

Welcome to our fabulous fashion show for the label that is taking the fashion world by storm – Labfab
Olivia is wearing our new designer lab coat, which has three- and four-button options. Note that the buttons are worn done up.
Lab coats are going to be loose this year for stylish comfort during those tricky experiments. And this year, knee length is the length to protect yourself from stray chemicals.

Safety glasses are hot and big. Top model and scientist Corey is modelling a pair from the new range, which are hipper than the latest sunglasses. If you already wear glasses, you may not need to wear safety glasses.
This year, laboratory shoes are solid –no tootsies please! Solid and sensible, they scream ‘enduring style’.
Finally, you can never have too many accessories. The latest in latex or plastic is our fabulous range of disposable gloves. They are available in a range of colours to suit your every experimental mood.
1.3 Check your learning
1Identify the three safety symbols shown in Figure 4. Describe the meaning of each symbol.
Look at Figure 3 and then consider the following:
> How many potentially dangerous activities can you identify in this picture?
> What rules might be needed to prevent potential danger?
> Create a list of rules you think might be needed in your science laboratory. Give a possible consequence if the rule is not followed.
> Compare your list of do’s and don’ts rules with those listed on the opposite page.
> Type up your list on a computer, print it out and stick it on the inside front cover of your workbook.

6Describe why do you think it is dangerous to drink from laboratory glassware. Apply
Figure 4 Three safety symbols
2aName three items of protective clothing you might wear in the laboratory.
bDescribe what might happen if you do not wear one of these items of clothing.
3Identify five things you should do to remain safe in the laboratory.
4Identify five things you should not do in the laboratory.
Comprehend
5 With a partner, take turns to mime a safety rule for your partner to guess.
7Evaluate the effectiveness of the protective equipment being worn by the students in Figure 5 (by identifying the ways the students are using the equipment safely and the ways they are being unsafe). Write a list of suggestions you could offer the students to improve their safety.
Quiz me
Complete the Quiz me to check how well you’ve mastered the learning intentions and to be assigned a worksheet at your level. No part of this publication may be reproduced, stored in a retrieval system or transmitted in any form or by any means.
• Good scientists need to be observant and notice things around them.
• Quantitative observations usually contain numbers with units.
• Qualitative observations contain words and descriptions.
• Scientists use observations to infer (explain) what is happening.

The skill of observation usually requires you to notice small differences. Figure 1 shows two scenes. There are 10 differences between the two. Can you find them all?

Quantitative observations use measurement – they are ‘amounts’ or quantities and are normally written using numbers. The numbers are usually accompanied by units that describe the size or what is being measured, such as 2.7 m or 23. 4 degrees Celsius (°C). For example, 10 m is a me asurement of length, while 10 L is a mea surement of volume.
Figure 2 A qualitative observation would be that this substance was dark yellow.
Qualitative observations use words to describe anything that is not an amount. The five main sense organs of the human body are essential for qualitative observations. What you see, hear, smell, taste or feel are generally qualitative observations. ‘Rough’, ‘sour’ and ‘yellow’ are all words describing qualitative observations.
The secret to being observant is to use your senses. The activities in this unit will make you more aware of your senses. In some activities you will need a blindfold. It is best to use safety glasses that have been painted black or covered with dark paper. You will not test your fifth sense, taste, because it is not good safety practice to eat in a laboratory.
By the end of this topic, you will be able to:
• Define observation and inference as scientific terms.
• Explain the difference between qualitative and quantitative data.
qualitative observation an observation that uses words and is not based on measurements or other data
quantitative observation an observation that uses a number, such as a measurement
No part of this publication may be reproduced, stored in a retrieval system or transmitted in any form or by any means.
Your teacher will provide you with some test tubes (wrapped in paper) lined up in a test-tube rack. Gently smell each one by wafting the smell towards your nose with your hand. See if you can name the smell.
CAUTION! Never smell things in a test tube unless your teacher specifically instructs you that it is safe.

Based on your responses to Figures 3–5, answer the following questions.
Wearing your blindfold, feel some common objects. They may be fruit, fabric, sandpaper, plastic or something else. Describe each of them and try to recognise each substance by touch.


Figure 5 Test your sense of hearing
Sit at your desk and put on your blindfold. As your partner taps on the desk or clicks their fingers, point to where you think the noise is coming from. How good are you at finding the direction of a sound?
explanation of an observation. It is how you explain your observation. An inference does not necessarily guarantee that something is true, but it is likely to be true.
Table 1 contains examples of observations, paired with possible inferences.
> Which is your strongest sense and which is your weakest?
> Did you discover anything surprising while responding to these figures? If so, what was it?
> What is one thing that you have learnt about your senses of smell, touch, sight and hearing? Write this in your workbook.
Scientists need to be skilled at inference as well as observation. An inference is a likely
Your house smells like cooked onions when you get home from school.
A fabric feels like satin.
You are probably having cooked onions with dinner.
The fabric is either satin or something that feels very much like satin.
You see a man running down the street.The man is either running away from something or running to something.
You hear a house alarm ringing.Someone has entered the house.
Lemon juice tastes sour.
Lemons contain an acid.
1Define (describe the meaning of) the term ‘observation’. Use an example to support your defi nition.
2Define the term ‘inference’. Use an example to support your defi nition.
3Contrast (describe the differences between) quantitative observations and qualitative observat ions.
4Classify which of the following are observations and which are inferences.
a You smell a strong odour from a garbage bin.
b Coffee stays hotter if you add the milk before the hot water.
c I measured the temperature today at 37°C.
d It is so hot that the temperature must be 37°C.
e There is a person in a Santa suit. It must be Christmas.
f This soup is so hot that it hurts my teeth.
5Identify one observation from question 4 that is quantitative and one observation that is qualitative.
Apply
6Discuss why scientists do not use the sense of taste in a laboratory.
7 Observation and inference are very important tools for scientists. Propose (suggest) one reason why you think they are important.
Complete the Quiz me to check how well you’ve mastered the learning intentions and to be assigned a worksheet at your level.
• Scientists use equipment to measure their results.
• Scientists need to compare their measurements with one another.
• The standard metric system is used by scientists around the world to measure distance (metres), volume (litres) and mass (grams).
What you need:
Very warm water, 3 ice-cream containers, room temperature water, cold water, ice cubes, thermometer
What to do:
1 Half fill the first container with cold water and add the ice cubes.
2 Half fill the second container with room temperature water.
CAUTION! Make sure it is safe to put your hand in the water.
3 Half fill the third container with very warm water.
4 Place one hand in the cold water and the other in the warm water for 2 minutes.
5 Remove both hands and place them both in the room temperature water.
» What do you notice about how hot/ cold the water is?
» Do both hands tell your brain the water is the same temperature?
6 Use a thermometer to measure the temperature of the water in all three containers.
What if?
» What if a foot was put in the water instead of a hand?
As you discovered in the ‘Human thermometer’ activity, your body picks up changes in the environment, but it cannot tell you the exact temperature of the water or air. Your body will also become used to warmer temperatures in summer and colder temperatures in winter.
What might seem like a nice 18 degrees in winter, might feel cold in summer. For this reason scientists rely on accurately measuring all things during their experiments.
For thousands of years, distances have been measured by comparing them to parts of the human body (see Table 1). The height of a horse, for instance, is still measured in hands. Some countries, such as the United States of America, measure distance in feet. A standard system is now used, instead of human hands and feet.
Using human body parts for basic measurements caused confusion and arguments because everyone’s body size is different. So many different systems were being used to measure things that people were often cheated, such as when buying goods by weight.
Table 1 Measurements used in ancient civilisations
Old unit
Royal foot
Royal cubit
Finger
Palm
Fathom
Knuckle
Lick
Civilisation
By the end of this topic, you will be able to:
• Describe how to accurately measure data using a variety of equipment.
Video 1.5
Measurement, errors and accuracy
Estimated equivalent today (cm)
Ancient Egypt 25.4
Ancient Egypt 52.4
Ancient Mesopotamia 1.9
Ancient Mesopotamia 7.5
Ancient Mesopotamia 180.0
Ancient Greece 3.9
Ancient Greece 15.4
units standard measurements
metric system a decimal system of measurement; uses metres, kilograms, litres and so on


In 1790, the then king of France, Louis XVI, decided that in his country at least a uniform system should be established. This was ultimately called the metric system.

The idea of having standard units for measurement soon spread, so all types of measurement were included. The metric system is now used by scientists worldwide. A measurement of 2.45 m has to be the same in Cairns, Queensland, as in New York, USA. A temperature of 37°C is just as hot in
Kolkata, India, as in Toowoomba, Queensland. Scientists often check each other’s work by repeating experiments to see if they get the same results. To do this they need to use measurements that are consistent with the original experiment. By using a standard system of measurement, scientists everywhere can understand and build on each other’s work. Five kinds of measurement are important when you are exploring science: volume, mass, temperature, time and length.
Figure 1 Length Measurements of length can be shown using a unit called metres, with the symbol ‘m’. For long distances, kilometres (km) are used. For short distances, centimetres (cm) or millimetres (mm) can be used. In school science, the devices we use to measure length and distance are the trundle wheel (pictured), metre rule and tape measure.
Figure 2 Mass This measures the amount of matter or substance in an object. Mass is measured in units called grams (g), kilograms (kg) and tonnes (t). Smaller masses are measured in milligrams (mg). Mass-measuring devices are called scales or balances. You will use an electronic balance to measure mass.
Figure 3 Time A watch or clock set to the correct time tells you the time of day. A stopwatch measures how much time has passed. In your experiments, measurements of time will often have the unit called seconds (s).
Place the measuring cylinder on a level surface. Look in line with the top of the water.

matter anything that has space and volume; matter is made up of atoms DRAFT
Meniscus Read level here
40
30 20
Read the water level at the bottom of the meniscus. (Here the correct measurement is 34mL.)
Figure 4 Temperature This is usually measured using a thermometer. Some thermometers have a digital scale. Measurements of temperature have the unit called degrees Celsius. Its symbol is ‘°C’.
meniscus the curved upper surface of a liquid in a tube No part of this publication may be reproduced, stored in a retrieval system or transmitted in any form or by any means.
All measurements have two parts: a number and a unit (see Table 2). For example, 5 metres is written as ‘5 m’. Not ice that the unit does not have an ‘s’ after it, even though it stands for ‘metres’. This is so that it does not become confused with milliseconds.
Measurements are usually recorded in a table or a graph so that they can be easily read, compared or used for further calculations.
> To change a larger unit (such as kilometres) into a smaller unit (such as metres), you need to multiply.
> To cha nge a smaller unit (such as millimetres) into a larger unit (such as centimetres), you need to divide.
Change fromChange to Conversion km m × 1000 m cm × 100 cm mm × 10 m km ÷ 1000 cm m ÷ 100 mm cm ÷ 10
To compare two measurements, their units must be the same. It is difficult to compare 10 000 m with 13 km – which is longer?
Comparing 10 km wit h 13 km is easier. The metric system works in multiples of 10, so we can convert using a formula (see Table 3). Worked examples 1.5A and 1.5B show how to convert between units.
1 kilometre = 1000 metres
1 metre = 100 centimetres
1 centimetre = 10 millimetres
Two scientists measured the height of two trees. The first tree was 150 m tall, while the second tree was 12 000 cm tal l. Identify which tree is the tallest.
Before you can compare the numbers, they need to be changed so that they have the same units.
1 m = 100 cm (mu ltiply by 100) 150 m = 150 × 100 = 15 000 cm 15 000 cm is longer than 12 000 cm. Therefore, the 150 m tree is taller than the 12 000 cm t ree.
Instrument used
Distance or length kilometre km trundle wheel metre m metre rule centimetre cm tape measure or ruler millimetre mm tape measure or ruler
Volume litre L beaker millilitre mL measuring cylinder
Mass tonne t weighbridge kilogram kg beam balance gram g spring balance milligram mg electronic scales
Time hour h clock minute min stopwatch second s stopwatch

Temperature degree Celsius °C thermometer
No part of this publication may be reproduced, stored in a retrieval system or transmitted in any form or by any means.
accuracy how carefully, correctly and consistently data has been measured or processed; in science, how close a measured value is to the true value
parallax error an error, or inaccurate reading, that occurs as a result of reading a scale from an angle
Worked example 1.5B:
A scientist wanted to send a 295 cm long metal pipe to a laboratory in England. Should they choose a 2.5 m or a 3.0 m postage cylinder for their pipe?
100 cm = 1.0 m (divide by 100) 295 cm = 2.95 m
Therefore the 2.95 m pipe will fit in the 3.0 m postage cylinder and will be too long for the 2.5 m cylinder.
Accurate measurement in science is important so that your results are a true record of your experiment. Comparing measurements with other scientists is useful only if your results are accurate.
You can do several things to improve your accuracy in the science laboratory. Always
1List everything you have measured today. Think carefully – you have probably measured more things than you realise. Try to list at least five things.
2Identify the part of the meniscus that you should read when measuring volume.
3Identify which tools you would use to measure the following things.
a Distance around a cricket ground
b Time it takes a sprinter to run 100 m
c Mass of a carrot
d Volume of water in a fi sh tank
e Volume of a square block
f Temperature of a swimming pool
g Your mass
h Thickness of this book
4Explain why using body parts as a measuring tool might cause problems for scientists.
Figure 7 Parallax error occurs when you read a scale from an angle.
take your time when measuring and make sure you write down the result straight away. When reading a scale, line up your eye directly in front of the object and the scale. Looking from above or from the side can produce different readings. This is called parallax error (Figure 7).
5 In the United States of America, people use imperial units of measurement (foot, pound, mile), but scientists use metric units.
aExplain why the scientists in the United States need to use metric units.
bExplain why problems might arise if scientists in the United States used imperial units.
6 Use a labelled diagram to describe a meniscus.
7Explain why you might prefer to walk 14 900 cm instead of 3 km.
8 Provide an example to explain that errors in measurement are sometimes unavoidable.
Analyse
9Identify which is longer: 10 000 mm or 500 m.
10Identify which is shorter: 3 km or 1000 m.
11 Convert 1 km into metres, centimetres and millimetres.
Complete the Quiz me to check how well you’ve mastered the learning intentions and to be assigned a worksheet at your level.
No part of this publication may be reproduced, stored in a retrieval system or transmitted in any form or by any means.
• A Bunsen burner is used to heat things in the laboratory.
• The yellow flame is called the safety flame because it is easier to see.


• The blue flame produces more heat than the yellow flame (over 1500°C).

A mixture of liquid petroleum gas (LPG) or methane and air is used to produce a good flame for heating. The Bunsen burner has a collar that can be turned to open or close the air hole. The position of the collar controls how much air enters the burner and therefore how hot the fl ame is. If the hole is closed, less air can mix with the gas. This results in a yellow safety flame.
Hand below ame
Match held to one side of top of burner
If the collar hole is open, air mixes with the gas, allowing a hotter blue fl ame to burn (Figure 2).
When alight but not being used for heating, the Bunsen burner should be left on the yellow (safety) fl ame, which is not as hot and is easy to see. The safety fl ame is always used when lighting the burner.
By the end of this topic, you will be able to:
• Use a Bunsen burner safely and accurately.
Video 1.6 How to use a Bunsen burner
Air hole closed
Figure 1 The right way to light a Bunsen burner
Heating flame
Air hole open Air hole closed Safety flame
Figure 2 Blue (heating) and yellow (safety) flames on the Bunsen burner
1 Let the teacher know immediately (they will turn off the main gas tap if gas is involved).
2 The class fi re officer should take a message to the school administration as quickly as possible.
3 If the fi re is small, the teacher will use the fi re extinguisher.
4 Evacuate the area in an orderly manner.
5 Check that everyone is safe.
1 Immediately run cold tap water on the scald or burn for at least 15 minutes. Do not use ice or very cold water.
2 Ask another student to tell your teacher about the scald or burn.
3 Remove nearby clothing (unless it is stuck to the burnt area) and jewellery (such as watches, rings and bracelets) because burnt areas can swell quickly.
4 Try not to touch the area if possible. Do not use any creams.
5 Seek medical attention if necessary.
Interactive 1.6 Lighting a Bunsen burner
Bunsen burner a piece of equipment used as a heat source in the laboratory
Figure 3 A scalded hand

Figure 4 A burnt hand


CAUTION! Remember to keep your hand below the flame.
CAUTION! Keep your notebook and other materials well away from the Bunsen burner.
CAUTION! Never sit at eye level in front of a Bunsen burner. Stand while you are conducting the experiment.
CAUTION! The porcelain you heat will remain very hot for a long time. Do not pick it up with your fingers – use tongs. Wear safety goggles and a lab coat.

Bunsen burner, heatproof mat, matches, notebook, coloured pencils, grey pencil, metal tongs, two pieces of white ceramic or porcelain
Figure 5 Place the Bunsen burner on a heatproof mat.


Figure 6 Connect the rubber hosing firmly to the gas tap.
Figure 7 Close the air hole by turning the collar.

1 Follow the steps shown in Figures 5–10 to light your Bunsen burner.
2 Change the flame to blue by opening the air hole on the collar.
3 Write down and draw what happens to the flame when the hole is closed, half open and fully open.
4 Close the collar so that a yellow flame is produced.
5 Using tongs, hold a piece of porcelain in the top of the yellow flame for a minute. Place the hot porcelain on the heatproof mat when you have finished. Describe what happens to the porcelain and draw it.
1Describe the colour of the Bunsen burner’s safety fl ame.
2Describe the colour of the Bunsen burner’s heating flame.

3Explain how (what you do) to get a heating fl ame with your Bunsen burner.
4Explain how you should treat a scald.
5 If you were heating a substance to check for colour change, describe the fl ame that you would use to make it easier to observe.
6Explain why hair should be tied back when using a Bunsen burner.
Figure 8 Light a match and place it above the barrel, with your hand below the flame.
Figure 9 Open the gas tap fully. Figure 10 After you have followed these steps, the Bunsen burner will have a yellow (safety) flame.
6 Hold the other piece of porcelain with the tongs. Change the flame to blue and heat the porcelain for 1 minute by holding it in the top part of the flame. Describe what happens to this piece of porcelain and draw it.
> Describe two reasons why the yellow fl ame is called the safety fl ame.
> Identify which flame is noisier: blue or yellow? Explain why this is useful to know.
> Identify which fl ame leaves a sooty carbon black deposit on whatever object it heats.
> Identify which fl ame is the ‘clean’ fl ame for heating.
> Describe two reasons why you might use a blue fl ame for heating in an experiment.
7 A student claimed that the top part of the Bunsen burner fl ame was hotter than the bottom of the fl ame. Design an experiment that will allow you to test the student’s claim.
Complete the Quiz me to check how well you’ve mastered the learning intentions and to be assigned a worksheet at your level.
• Scientists are reliable sources of information because of the way they test their ideas.
• Pseudoscience is when people use the language of science to promote unscientific information.
• Scientists control the variables and repeat their experiments.
• Reasonable experiments occur when an experiment tests a hypothesis.
Have you ever seen advertisements for weight loss or hair growth ‘miracles’ or ‘miraculous’ wrinkle treatments? Although some of these products may have been partly developed by scientists, the results are usually less fabulous than they seem. The word ‘pseudo’ (pronounced ‘seoo-doe’) means ‘false’ – pseudoscience is false science. Real science is based on asking questions that can be investigated so that the results can be reproduced by other scientists. The Australian Government has regulations about many of the products sold here, but not all types of products are covered (Figure 1).

A variable is something that can affect the results of an experiment. When the variable is changed, the results of the experiment will change. If the variables are kept the same, they are described as controlled. Controlling variables ensures that an experiment is fair and that the results can be trusted.
Once you can control the test, you can experiment with it. To do this you must choose only one variable to change. This is called the independent variable because an independent scientist makes the decision. This can be done in the form of a ‘What if’ question; for example:
> What if the amount of vinegar was increased?
> What i f the amount of bicarbonate soda was decreased?
Once you ask a ‘What if’ question, you can predict what may happen (Figure 2). A reasoned prediction can be written by
removing the ‘What’ at the start and adding a ‘then’ at the end of the question.
• Explain the term ‘variable’ and describe the difference between independent and dependent variables.
The first half of the reasoned prediction is the independent variable, and the second half of the prediction is what we are testing for. This is called the dependent variable because the measurements may depend on any other changes. All other variables must remain the same; these variables are called controlled variables. A hypothesis is a suggested explanation for the reasoned prediction. A good hypothesis can be tested to see if it is supported (the prediction is correct) or refuted (the prediction was wrong).
Once the hypothesis has been written, its time to plan how to do the experiment. All methods need to have a controlled test that can be repeated to get the same results. Your hypothesis should then tell you the only variable that needs to be changed.
Reasonable tests ensure that experimental results can be used to make the right decisions. When you consider the results of an experiment and try to draw some conclusions, you need to consider the following questions:
> Did you control every factor/variable, except the one you were changing on purpose?
> Were t here any variables in the environment you could not control?
> If you d id the same experiment again, would you expect the results to be exactly the same?
> Did you estimate or assume any measurements during the experiment?
• Describe how repetition increases the reliability of results. No part of this publication may be reproduced, stored in a retrieval system or transmitted in any form or by any means.
pseudoscience claims that are supposedly scientific but are made with no evidence to support them
Figure 1 ‘Miracle’ products are often the result of pseudoscience.
variable something that can affect the outcome or results of an experiment dependent variable a variable in an experiment that may change as a result of changes to the independent variable
independent variable a variable (factor) that is changed in an experiment
By the end of this topic, you will be able to:
controlled variable a variable that is kept constant and unchanged throughout an experiment hypothesis a proposed explanation for a prediction that can be tested reasonable test a test where all variables are controlled except for the one being changed on purpose
Independent variable: the variable that is changed


Dependent variable: the variable that is tested or measured at the end
IF the amount of vinegar is increased, THEN the number of bubbles produced will increase BECAUSE more vinegar will react with the baking soda.

Figure 2 A hypothesis can be made once you ask your ‘What if’ question.
Choose one of the questions from the ‘What if?’ activity shown on this page to investigate.
1 Write a reasoned prediction for your inquiry.
2 Identify the independent variable that you will change from the fi rst method.
3 Identify the dependent variable that you will measure and/or observe.
4 Write a hypothesis for your inquiry.
5 List the variables that you will need to control to ensure a fair test.
6 Describe how you will control these variables.
7 Test your hypothesis. Repeat your experiment at least three times to make sure your results are reliable.
8 Record your results in a table.
9 Write a summary of your results.
What you need:
A large plastic cup, teaspoon, permanent marker, bicarbonate soda, vinegar, ruler
What to do:
1 Add a small amount of vinegar to the plastic cup and then a teaspoon of bicarbonate soda.

2 Describe what happens. Use the permanent marker to mark on the side of the cup how far up the reaction reached.
3 Use the ruler to measure the distance between the table and the mark on the cup.
4 Rinse the cup with water.
5 Repeat steps 1–4 until you can get the reaction to rise to the same mark three times in a row.
What if?
» What if you did not add the same amount of vinegar each time?
» What if you did not add the same amount of bicarbonate soda each time?
» What if you used a smaller cup for the reaction?
Figure 3 If you were testing the effect of sunlight on plant growth you would need to control variables such as watering levels, soil type, fertiliser and pot size.
No part of this publication may be reproduced, stored in a retrieval system or transmitted in any form or by any means.
Repetition of experiments is very important. If you performed an experiment and achieved certain results, you would conclude that the results were reliable. But what if you did the experiment a second time and the results were slightly different? Did you do something slightly different? Were the conditions slightly different? Did you use the same materials from the same source? If you measured the same results the second time, was it a coincidence?
Performing an experiment at least three times will give you greater confidence in your results. If other people repeat your experiment and achieve the same results, then your results are supported even more.

1Define the term ‘variable’.
Figure 4 Repeating an experiment improves the reliability of your results.
2Identify the name given to the variable that is being tested and therefore changed on purpose.
Comprehend
3Explain why most variables need to be controlled.
4 Justin decided to conduct an experiment to fi nd out whether his cats preferred full-cream or low-fat milk. He gave one cat a saucer of full-cream milk and the other cat a saucer of low-fat milk and then left them alone. When he returned an hour later, the low-fat milk was gone and there was a small amount of full-cream milk left. Justin concluded that his cats preferred low-fat milk.
aExplain why you agree or disagree with Justin’s conclusion.
bExplain whether Justin conducted a reasonable test (by describing if he controlled all other variables, describing
if he would have the same results if he repeated the experiment, and deciding if the test was fair).
cIdentify two variables that needed to be controlled. Explain how these variables could have affected the results.
dDescribe two ways you could improve Justin’s experiment so that his results were more reliable.
5 When repeating experiments, a scientist claimed that: ‘One set of results was random. Two sets were a coincidence. Three sets is evidence.’ Discuss what the scientist meant by this saying.
Complete the Quiz me to check how well you’ve mastered the learning intentions and to be assigned a worksheet at your level.
No part of this publication may be reproduced, stored in a retrieval system or transmitted in any form or by any means.
By the end of this topic, you will be able to: • Use graphs and tables appropriately to communicate the data from investigations.
• Scientists need to collect data and present it in an organised manner.
• Tables or graphs allow scientists to identify patterns that may exist in their results.
• Tables should have a heading, column headings with units of measurement, and data in each column.
• Different graphs should be used depending on the type of data (discrete or continuous) being displayed.
When recording the results of experiments, the data collected should be neatly presented in a table or logbook. There are four steps for drawing a table:
1 Use a ruler to draw a table with the correct number of columns.
2 Write a heading that describes the contents of the table; for example, ‘The change in water temperature over time’ (see Table 1).
3 Give each column a label and units (what the number means), such as ‘Temperature (°C)’.
4 Add your data in the correct columns.
Table 1 Change in water temperature over time Time (min) Temperature (˚C) 5 43 10 37 15 35 20 24
discrete data data where the numbers can only be whole numbers column graph a graph in which the height of the columns represents the number measured continuous data data that are measured and can be any value scatter graph a graph used to represent continuous data; it consists of discrete data points
There are two main types of data. The first type, discrete data , is obtained when the numbers can only be whole numbers, such as the number of people in a class (you cannot have half a person). Discrete data is often represented in a column graph
The second type of data, continuous data, is obtained when the numbers can be any value. For example, the fastest time in the world for a 100 m race is currently 9.58 s; the tallest person in the world is 251 cm tall (Figure 1). Continuous data should always be represented in a line or scatter graph

a b
Figure 1 a Sultan Kosen is 251 cm tall. b Usain Bolt ran 100 m in 9.5 8 s. Height and time are examples of continuous data.
No part of this publication may be reproduced, stored in a retrieval system or transmitted in any form or by any means.

Heating water
In a column graph, the height of the columns represents the number that you were measuring. This type of graph is good for showing discrete data. The steps for drawing a column graph are listed below.
Step1: Use a pencil and a ruler to draw a large set of axes (the horizontal and vertical lines of a graph).
For example, when graphing the number of insects caught at each location, the independent scientist changes the independent location variable and the number of insects is counted at each point. Therefore, location is the independent variable and is on the horizontal axis. The number of insects is the dependent variable and is on the vertical axis.

Step2: Label each axis. The horizontal (flat) axis should show the independent variable, and the vertical (up) axis should be the dependent variable.
Insects caught
Figure 2 Drawing a set of axes
Step3: Add numbers at regular intervals to the lines on the vertical axis, making sure you will fit the largest number. If the numbers are small, spread them out to use the whole graph.
70
60
50
Location
Step4: Add units (what the numbers mean) to the axis. These units are usually metres (m), seconds (s) or minutes (min), but they can also be the number (n) of things.
70
60
50
40
30
20
10
Insects caught 0
Location
Figure 4 Adding numbers to the axes at regular intervals
40
30
20
10
Insects caught ( n ) 0
Location
Figure 5 Adding units to the axes
Figure 6 Make sure to keep a careful record of insects caught at different locations.
No part of this publication may be reproduced, stored in a retrieval system or transmitted in any form or by any means.
line of best fit the line on a scatter graph that passes through, or nearly through, as many data points as possible to show any overall trends in the data
Step5: Plot your data on the graph. Rule the lines carefully, making sure there is a gap between the columns.
70
60
Step6: A completed column graph shows the number of insects caught at different locations.
70
60
50
40
30
20
10
Insects caught ( n ) 0 AB
Location
In a scatter graph, the relationship between two sets of data is compared. The steps for drawing a scatter graph are listed below.
Step1: Use a pencil and a ruler to draw a large set of axes (the horizontal and vertical lines of a graph). Label each axis. The horizontal (flat) axis should show the independent variable, and the vertical (up) axis should be the dependent variable.
Temperature
Time
Figure 9 Drawing a set of axes
Step3: Plot your data on the graph. Use small crosses rather than dots. It is easier to find the centre of a cross than the centre of a dot.
10 20 30 40 50 60 70 80
Temperature (°C) 12345678910
Time (min)
Figure 11 Potting data on the graph using small crosses
50
40
30
20
10
Insects caught ( n ) 0 ABCDEFGH
Figure 7 Plotting data on the column graph Location
Figure 8 Finishing the column graph
For example, when graphing how temperature changes over time, the independent scientist changes the independent variable (time) and then measures the temperature. Therefore, time is on the horizontal axis and temperature is on the vertical axis.
Step2: Add numbers at regular intervals to the lines on the axes, making sure you will fit the largest number. If the numbers are small, spread them out to use the whole graph. Add units (what the numbers mean) to the axes.
10 20 30 40 50 60 70 80
Temperature (°C) 12345678910
Time (min)
Figure 10 Adding numbers to axes at regular intervals
Step4: Draw a line of best fit or a smooth curve that passes through or near to as many data points as possible. In this case a line of best fit is shown.
10 20 30 40 50 60 70 80
Temperature (°C) 12345678910
Time (min)
Figure 12 Drawing a line of best fit
No part of this publication may be reproduced, stored in a retrieval system or transmitted in any form or by any means.
Step5: If you are plotting more than one set of data on the one graph, then use a small circle instead of a cross. Add a legend to help identify which set of data is which.
Temperature (°C) 12345678910
10 20 30 40 50 60 70 80 Distilled water Honey
Figure 13 Using small crosses and circles when plotting more than one set of data
1Identify the two types of quantitative data that scientists collect.
The change in temperature of honey and distilled water over time Temperature (°C) 12345678910
Time (min)
Time (min)
10 20 30 40 50 60 70 80 Distilled water Honey
Figure 14 Writing a descriptive title for the scatter graph
2Identify which variable (independent or dependent) is located on the horizontal axis of a graph.
3Identify the type of graph that would be used to show the number of birds found in a particular area each month.
4 Figure 15 shows a graph drawn by a student. List all the things that should be corrected on the graph.
200
175
120
30
20
0
Step6: Write a descriptive title at the top of the graph. 102530404550607085100
Figure 15 A graph drawn by a student
Comprehend
5 For each set of data that follows: adescribe the type of graph that should be drawn bexplain what has happened during each of the following events:
i the number of accidents in the science laboratory during the first six months of the year
Time Number of accidents Jan 0 Feb 10 Mar 6 April 3 May 2 June 1
ii how the number of cigarettes smoked per day by a pregnant woman affects the birth weight of her baby
Number of cigarettes smoked per day Birth weight of baby (kg) 0 3.5 10 3.1 20 2.6 30 2.2 iii how the number of trees in an area affects the amount of birds.
Number of trees Number of birds 1 2 2 3 3 7 4 10 5 13 6 18 7 20
Quiz me Complete the Quiz me to check how well you’ve mastered the learning intentions and to be assigned a worksheet at your level.
No part of this publication may be reproduced, stored in a retrieval system or transmitted in any form or by any means.
By the end of this topic, you will be able to:
• Describe how errors can affect the results of an experiment.
• Describe the evidence a scientist uses when making a claim.
• Science experiments are planned and analysed carefully to minimise errors.
• Before claiming that a hypothesis is supported or refuted, experiment data must be checked to identify if it contains any errors or unexpected results.
Earlier in the chapter you learnt about how pseudoscience claims are commonly made on the internet or in the media. These claims will often use scientific words and describe poorly designed experiments that did not have all variables controlled. A good science experiment needs to be carefully planned, and the results will be carefully analysed to make sure that all errors have been minimised.
When you are planning your methods, or analysing the results of your experiment, there are a few hints you can use to help you avoid making pseudoscientific claims.
error an inaccuracy or inconsistency in measurement
One of the most difficult things to do in an experiment is to control all variables. Sometimes random things, like someone opening a door or window, can cause an error in an experiment (Figure 1). An example of this might be when a scientist is testing if salty water takes longer to boil than fresh water. A window opening might cause cold air to change the temperature of the surrounding air. This is why it is important to check if an experiment was repeated at least three times with the same results. Repeated experiments are more reliable than single experiments.

your science teacher has given you the correct materials for the experiment. Other assumptions should be questioned, such as, are the scales you used to measure a material accurate?
When you are planning your own experiment, or reading about someone else’s experiment, it is important to check if any assumptions have been made.
Occasionally the scientist can make a mistake in the way they do an experiment. Mistakes should be fixed immediately, or the experiment should be started again. An error is different from a mistake – it can happen for various reasons, no matter how careful you are. Errors can occur if the object you are measuring falls between two markings on a scale; this will mean that you have to estimate the exact measurement. When this occurs, it is important to use a more accurate scale or a digital device. Sometimes scales can be calibrated (set up) incorrectly, which means that no matter what you measure you will get a slightly inaccurate result (Figure 2). You can minimise the effect of this kind of error by always using the same measuring device.
Figure 1 Even something as small as having a window open can impact the results of an experiment.
When a scientist decides that the temperature of the room does not change without measuring it, they have made an assumption. Assumptions are beliefs that are accepted as true without any evidence or testing. Some assumptions are reasonable. An example of this is the assumption that
Figure 2 Scales should always be calibrated to avoid an error.
No part of this publication may be reproduced, stored in a retrieval system or transmitted in any form or by any means.

An effective scientist will always look for ways to improve their experiments. It is important to be open and honest about how the method could be changed to improve the reliability of your results.
An experiment does not fi nish when the results have been recorded. A scientist should check the data to identify if it contains errors or unexpected results before they claim that their hypothesis is supported or refuted.
Sometimes when plotting data on a graph, there may be a single dot or number that is unexpected or that does not fit with the rest of the graph (Figure 3). This is called an anomaly in the data. It is important not to remove or ignore this value. If you can, try to explain what might have caused this unexpected result.
10000
8000
6000
4000
2000
If the data has no anomalies, and it matches the original reasoned prediction, then the scientist can claim their hypothesis is supported. When making a claim, the scientist will:
> rewrite their hypothesis > describe the experiment and data that matches it > explain the science of why the dependent variable was changed by the independent variable
> describe any examples that have not yet been tested (the limitations).
2040
Figure 3 A data anomaly can be identified by a graphed data point that is away from the other data.
1Define the term ‘anomaly’.
2Identify an assumption that a scientist may make when completing an experiment that tests how fast water boils.
3Describe how not calibrating scales at the start of an experiment could affect the results of the experiment.
4Contrast the terms ‘mistake’ and ‘error’.
anomaly 6080100
If there is no match between the data and reasoned prediction, or there are several anomalies, the scientist must admit that the hypothesis is refuted (not supported by the evidence). It is always exciting when a hypothesis is shown to be wrong. As stated by famous scientist, Isaac Asimov, ‘The most exciting phrase to hear in science, the one that heralds new discoveries, is not “Eureka!” but “That’s funny …”’.
5 Associate Professor Elizabeth Tibbets had difficulty putting marks on the wasps she was studying. When looking closely at the wasps, she realised that they all had different markings (Figure 4). This encouraged her to test if the wasps could tell one another apart. Propose a hypothesis that the associate professor could test based off this idea.
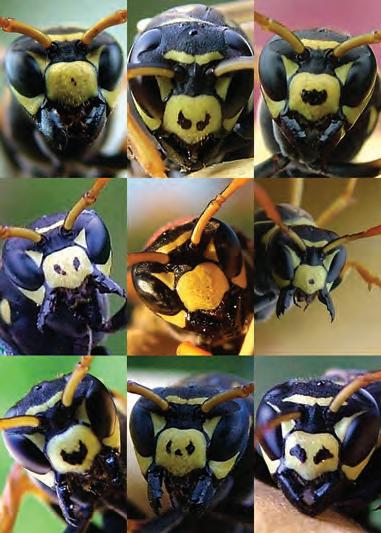
6 A scientist tested how the amount of light in a glasshouse affected
the growth of wheat plants. When they analysed their results, they described that these results could not be used for all plants growing outside the glasshouse. Discuss why the scientist put a limit on how the results could be used.
Complete the Quiz me to check how well you’ve mastered the learning intentions and to be assigned a worksheet at your level.
anomaly a result that does not fit in with the pattern of data No
By the end of this topic, you will be able to:
• Construct a scientific report that uses data and scientific language.
conclusion a statement that ‘answers’ the aim of an experiment
• A scientific report is where results and findings are recorded.
• Scientists use a similar style and language in their reports so that they can be understood by scientists worldwide.
• Scientists communicate with other scientists so that they can learn from one another and expand on one another’s work.
A report is a written account of an experiment and usually has eight parts:
1 Title,dateandpartners (if you are working in a group) – do not forget to write your own name.
8 Conclusion – this is the answer to the aim or question. It should be clear and reasoned and should relate very closely to the starting aim or question. It should be written in the third person.
aim the purpose of an experiment discussion a summary of findings, and analysis of the design of an experiment, including problems encountered and suggestions for improvement
2 Aim or question – this is what you were trying to find out or why you were doing the experiment.
3 Hypothesis – this is your initial prediction about the outcome of the experiment and a possible explanation based on your research that will be supported or refuted by the experiment.
4 Equipmentormaterials – this is a detailed list of the equipment used.
The best type of scientific report lets the results speak for themselves. If an experiment has been controlled to make it a fair test, then it shou ld not matter whether Einstein or your 5-year-old brother conducted the experiment.
T his is one reason why personal pronouns (‘I’, ‘me’, ‘our’) are usually left out of scientific reports. When you use personal pronouns, it is tempting to put in a lot of information that is not relevant.
method a series of steps explaining how to do an experiment
5 Method – this is the steps or procedure that you use to carry out the experiment, including diagrams of the equipment. There are two reasons to write a method. The first is to plan what you are going to do. This method should be in the present tense. The second type of method is for a formal report. Past tense should be used for this method.
6 Results – these are measurements and observations taken in an experiment, usually presented in a table, graph and/or diagram. A few sentences can be used to provide a description of the data in the tables or graphs.
7 Discussion – this is your opportunity to discuss the patterns you see in the findings and any anomalies identified. You should describe any assumptions or errors and any suggestions for improvement or further investigation. This should be written in the third person.
Now it is your turn to do an experiment and produce your first scientific report. Read through the following instructions before you begin. You will be working in pairs.
> Create an outline of the scientific report, including a table for your results, before you begin.
> Conduct the experiment and fill in the table of results.
> Answer the discussion questions, practising using the third person.
> Check back to the aim to remind you of what your conclusion is answering.
> Write a conclusion by following the instructions in the example on page 29.
> Evaluate the design of this experiment.
The title heading sets out what you are trying to discover. It is the ‘question’ you are asking and will be different for each experiment.
Possible results: create a table showing the distance the egg fell for each rubber band added, or draw a graph of the distance the egg fell against the number of rubber bands.
To drop an egg close to the ground safely.
> Rubber bands
> Plastic or mesh bag
> Raw egg or small bag of water
> Wire or paper clip
> Retort stand
> Boss head
> Clamp
> Metre ruler
1 Place the egg in the plastic or mesh bag and seal the bag with the wire or paper clip. Be careful to tie it tightly to prevent the egg from slipping through and spilling on the floor. Make a loop at the top of the wire – this is where the rubber bands will be attached.
2 Connect the rubber band around the wire loop and hook it over the retort stand clamp (as shown in Figure 1). One person will need to hold down the retort stand to ensure that it does not tip.
Rubber band Wire (paper clip works well)
Mesh bag Raw egg
Retort stand
Pendulum holder
Hold here
3 Carefully hold the egg so that it is level with the clamp and let it drop. One member of the group may need to catch the egg on its return back up to ensure that it does not hit the clamp.
4 Measure the distance the egg travelled from the clamp. Be careful to avoid parallax error for this measurement.
5 Repeat steps 2–4 using additional rubber bands connected in a chain.
1 Describe the difficulties you had when measuring the distance that the egg fell.
2 Describe how your results would have been affected if the rubber bands were different sizes.
3 Identify one other variable that could have affected the results. Describe how you tried to control this variable.
4 Extend your graph so that it shows how many rubber bands would be needed for a 2 m drop. From this extrapolation/ extension, calculate how many rubber bands you would need to safely drop the egg as close to the floor as possible.
5 Explain how your results may have changed if extra weight was added to the egg before dropping it.
6 Explain how your results could help people who want to bungy jump off a bridge.
7 Describe two safety recommendations that should be made to anyone trying this experiment.
Figure 1 Connecting the rubber band around the wire loop and then hooking it over the retort stand clamp
This gives step-by-step instructions and often a diagram of equipment.
This is a list of what you need.
1Define the term ‘hypothesis’.
2List the eight steps used when writing a scientific report.
Comprehend
3Explain why a conclusion is written at the end of an experiment.
4Explain why personal pronouns are not used in scientific reports.
This is where any set questions are answered and where you describe any unusual or interesting results. You can also suggest improvements to an experiment.
This is the answer to the question you set out to investigate. Look back at the aim and see whether the results support the aim before writing the conclusion. Try to use one to two sentences and to write in the third person.
5Explain why it is important that scientists complete scientific reports.
6Explain why using a common format for all scientific reports might make it easier for scientists to communicate with one another.
Complete the Quiz me to check how well you’ve mastered the learning intentions and to be assigned a worksheet at your level.
No part of this publication may be reproduced, stored in a retrieval system or transmitted in any form or by any means.
In 1935, 101 cane toads were brought to Australia from Hawaii to eat an annoying pest – the cane beetle – which was destroying sugar cane crops and costing Australian sugar cane farmers a lot of money. The cane toads quickly multiplied and ate everything in sight: rubbish, plants and Australian native animals, including lizards, fish, frogs and birds. The toads ate just about everything except the cane beetle they were originally brought here to eat!

In this chapter you have learnt about asking questions and about doing science safely. You have used your skills of experimentation, observation, inference and measurement. You are now going to apply these skills to a problem facing our country: an invasion of cane toads.
Cane toads have been successful in Australia for a number of reasons. They can live in a wide range of environments and can breed in almost any body of water, no matter how small. They produce very large numbers of eggs several times a season, and the adults live for a long time. Also, many of the diseases and parasites that keep cane toad populations under control in their native countries are not found in Australia (Figure 1).
Cane toads are a threat to native Australian animals. When cane toads feel threatened, they release a poison from poison sacs behind their eyes. This poison can kill almost all animals, including the saltwater crocodile and humans. They eat a very wide range of native animals, including small vertebrates, such as birds, and invertebrates, such as beetles. They will also eat processed food, such as pet food. Because they are toxic to most animals that try to eat them, cane toads have very few predators.
When they arrived, cane toads ate everything in sight except for the cane beetle that they were brought here to eat (Figure 2). Cane beetles lived halfway up the cane plant where the toads could not reach, or in thick fields where the toads had no reason to go. Also, within five years, an insecticide – a chemical that kills insects – became available and the sugar cane farmers no longer needed to rely on the cane toad to destroy the cane beetle.
We can learn much from the introduction of cane toads into Australia. Foxes, rabbits and carp (a type of fish) are three other types of animals that have been introduced into Australia and have since created problems.
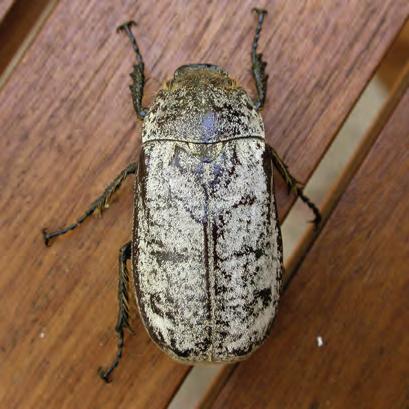
Australia is now home to more than 200 million cane toads. A group of people called the Kimberley Toad Busters have joined together to get rid of the cane toad and to stop it entering Western Australia (Figure 3). They have organised outings to capture and then humanely (respectfully and without pain) kill the toads.

Scientists will often provide advice to governments. They will do this by asking questions and working with other scientists to fi nd answers, before writing a report with recommendations of how governments could make datadriven policies and laws.
1 Look back in time. What are some simple questions that a scientist might have asked about cane toads before they were brought to Australia? Try to think of at least one question that starts with each of these words: ‘why’, ‘what’, ‘where’ and ‘when’. Here is one to get you started: ‘How quickly do cane toads breed?’
2 Many of your questions may be answered using your library or a trustworthy site on the internet, such as universities or zoos. Any website that ends in .edu is an educational institution, while a zoo or wildlife fund will end in .org. If the website address ends in .com, then it is usually owned by a company whose primary focus is to make money. Identify two websites that can be used to answer your questions. Write the answers to your questions. Include the title of the website and the address at the end of your answers.
3 The Kimberley Toad Busters want to contribute to your report by completing some fieldwork. Special safety rules need to be developed for fieldwork. Write a list of general safety rules for fieldwork. You may wish to interview or video call a field environmental biologist to ask them about some of these general safety rules for fieldwork.
4 In 2014, researchers tested a variety of cane toad traps to determine which would be the best for their study of cane toads. They tested traps that had a light turned on inside the trap against a trap that had the light turned off. Their results are shown in Figure 4. Describe what type of trap you would recommend. Use the data from the graph to support your recommendation.
Figure 4 The percentage of male, female and young juvenile cane toads trapped with and without lights.
5 In a recent toad-busting mission, the largest toad caught was 14.5 cm long and the smallest was 7 cm long. If the toads are such a pest, why do the toad busters measure them?
6 Design an experiment that scientists could have conducted before cane toads were brought to Australia. (Remember how quickly the cane toad breeds in the wild – your experiment must be controlled.)
a Describe the aim of your experiment.
b Write a list of equipment that you would need.
c Write a list of questions you would ask yourself during the experiment.
d Imagine that you have conducted the experiment. Using the information on this page, write the results of your experiment.
e Write the conclusion. Remember to look back at the aim when you write this.
7 Use the conclusion of your experiment to write a report to the Environment Minister in 1934 (the year before cane toads were introduced), requesting that cane toads not be introduced. Make sure you back up your argument with at least three scientific facts.
By the end of this topic, you will be able to:
• Describe how First Nations peoples use science skills in their own unique cultures.

• First Nations peoples come from many diverse nations that have their own unique cultures and knowledge.
• First Nations peoples use science skills.
Aboriginal and Torres Strait Islander cultures are some of the oldest continuous cultures in the world and have lived on this land for at least 60 000 year s. First Nations peoples have been using scientific skills and methods for thousands of years. They have observed the world around them, carried out experiments and collected data and repeated those experiments with similar results so that they can understand and manage the world around them.
As we will learn throughout Year 7 Science, Indigenous knowledge incorporates a wide variety of ideas and contexts, such as understanding ecosystems, medicine and astronomy.
We say First Nations peoples (not ‘people’) because there are many diverse language groups across Australia (more than 250 different languages), each of whom have their own unique cultures, laws, practices and languages. The map in Figure 1 shows how many different social or language groups or Nations there are in modern-day Australia. L ang u age groups refer to First Nations peoples or groups who share the same language.
Note: This map attempts to represent the language, social or nation groups of Aboriginal Australia. It shows only the general locations of larger groupings of people which may include clans, dialects or individual languages in a group. It used published resources from the eighteenth century-1994 and is not intended to be exact, nor the boundaries fixed. It is not suitable for native title or other land claims. David R Horton (creator), © AIATSIS, 1996. No reproduction without permission. To purchase a print version visit: https://shop.aiatsis.gov.au/
No part of this publication may be reproduced, stored in a retrieval system or transmitted in any form or by any means.
When you learn about the Dreaming stories or cultural practices of one Nation, it is important to understand that not all Nations have the same cultural practices or knowledge.
First Nations peoples made many observations of all living things in the land, waters and sky. While Europeans grouped turtles as reptiles, the dugong as mammals and barramundi as fi sh, First Nations peoples group these animals together because they all live in water and have fi ns or fl ippers. This grouping is also used in the separation of the different parts of a mixture. Many of the living things can be culturally significant and, like their totems, are not used as a food source.
1Define the word ‘observation’.
2Identify the traditional custodians of your school’s land.
Comprehend
3Describe why it is important to refer to First Nations peoples as ‘peoples’ and not ‘people’.
4Describe one example of First Nations peoples observing the world.
First Nations peoples use their skills to observe and identify plants that are able to be eaten and those that are poisonous, and to make water safe to drink. For example, First Nations peoples across Far North Queensland developed techniques to detoxify many poisonous plants. One such technique involved roasting the seeds and stems of cycads. After roasting, the cycads are crushed and left to soak for a day before they are roasted again. This process removes the toxin (cycasin) from seeds and stems and provides an edible food source. These processes are understood as a result of observing the surrounding environment, planning and conducting experiments, and analysing, communicating and repeating the results through oral traditions.

totem a spiritual being, symbol or object that is sacred to a group of people
5Describe one example of an experiment that First Nations peoples may have conducted thousands of years ago.
6Explain why it is important to communicate the results of the experiment on producing clean water or plants that are safe to eat.
Quiz me
Complete the Quiz me to check how well you’ve mastered the learning intentions and to be assigned a worksheet at your level. No part of this publication may be reproduced, stored in a retrieval system or transmitted in any form or by any means.
By the end of this topic, you will be able to:
• Recognise the cognitive verb in a question.
• Understand the different tasks involved for different cognitive verbs.
cognitive verb
a doing word that requires you to perform a specific thinking task
• Cognitive verbs are ‘doing words’ that ask you to perform a specific task.
• Cognitive verbs can be grouped into categories based on how much thinking and understanding is required to perform the task.
A cognitive verb is a verb or ‘doing word’ that requires thinking to perform a set task. For example, the word ‘describe’ is a cognitive verb because it requires you to remember what you know about something and talk about its features. Cognitive verbs are commonly used in questions which means you will encounter a variety of cognitive verbs in school as you learn new information.
Common cognitive verbs and the task/s associated with them are given in Table 1. Understanding these cognitive verbs and the tasks behind them can help you figure out how to best answer a question.
Figure 1 Familiarising yourself with different cognitive verbs can help you answer questions and improve your learning.
Define give the meaning of a word
Identify recognise and state a distinguishing factor or feature
Name provide the correct term or noun
Recall present remembered ideas, facts or experiences
Use operate or put into effect
Select pick out
Describe give an account of a situation, event, pattern or process, or of the characteristics or features of something
Explain make an idea or situation plain or clear by describing it in more detail or revealing relevant facts
Summarise give a brief statement of a general theme or major point/s; present ideas and information in fewer words and in sequence
Retrieve – Recall information from permanent memory.
Comprehend – Activate and transfer knowledge from your permanent memory to your working memory.

Categorise place in or assign to a particular class or group Analyse – Use your reasoning to go beyond what was directly taught.
Classify arrange, distribute or order in classes or categories according to shared qualities or characteristics
Compare display recognition of similarities and differences and recognise the significance of these similarities and differences
Contrast give an account of the differences between two or more items or situations
No part of this publication may be reproduced, stored in a retrieval system or transmitted in any form or by any means.
Distinguish recognise as distinct or different; note points of difference between
Interpret use knowledge and understanding to recognise trends and draw conclusions from given information
Calculate determine or find (e.g. a number, answer) by using mathematical processes
Create reorganise or put elements together into a new pattern or structure
Discuss examine by argument; sift the considerations for and against; talk or write about a topic
Evaluate examine and determine the merit, value or significance of something
Elaborate investigate, inspect or scrutinise
Justify give reasons or evidence to support an answer, response or conclusion
Predict give an expected result of an upcoming action or event
Some cognitive verbs require more thinking and understanding than others. For example, if you were asked to name the two fruits in Figure 2, you might instantly remember ‘apple’ and ‘orange’ and could write the names down without much trouble. However, if you were asked to compare the two fruits, you would need to consider the two fruits and identify at least one similarity and one difference between them. In this sense, ‘compare’ requires a deeper level of thinking than ‘name’.

Apply – Use your knowledge in specific situations.
working in order from retrieve to comprehend to analyse and fi nally to apply helps your learning process.
Table 1 shows how the type/s of thought processes behind the task can be used to categorise cognitive verbs. Throughout this book you will notice that you are usually tasked with ‘retrieve’ type questions before you are asked an ‘apply’ type questions. This is because Figure 2 Two healthy fruits
1Define the term ‘cognitive verb’.
2Identify the cognitive verb that requires you to describe at least one similarity and one difference between two things.
Comprehend
3Describe what is required to correctly answer: a a ‘classify’ question b a ‘distinguish’ question c an ‘explain’ question.
4Distinguish the different categories of cognitive verbs.
Apply
5 A student was asked to ‘distinguish’ between the apple and orange in Figure 2. Their response was ‘Both the apple and orange are round in shape’. Evaluate whether the student has correctly answered the question.
Quiz me
Complete the Quiz me to check how well you’ve mastered the learning intentions and to be assigned a worksheet at your level.
1Identify which of the following is most accurate when measuring 10 mL of liquid.
A conical fl ask B beaker C measuring cylinder D test tube
2Identify which of the following could be used to measure the temperature of the air.
A balance B electronic scales C stopwatch D thermometer
3Identify the step that should be completed first when lighting a Bunsen burner.
A Open the air hole.
B Light the match.
C Turn on the gas.
D Place the lit match over the Bunsen burner.
4Identify the metric units used for the following measurements.
a volume b temperature c time d mass
5Define the term ‘mass’.
6Identify the following as either quantitative or qualitative observations.
a The bus is red.
b The swimming pool smells of chlorine. c I am older than 12 years old.
d The line to the tuckshop is 4 m long.
7Name the section of a scientific report that would contain the measurements collected.
8Illustrate a diagram of a: a conical fl ask b tripod stand c test tube.
9 Consider the image of the Bunsen burner with a blue flame (Figure 1). Identify whether the air hole on the burner would be open or closed. Explain how the position of the air hole produces a blue flame.

10Explain what this safety sign means.
11Describe a reasonable test.
12Explain why it is important to control variables in an experiment.
13Explain why a measurement is not very useful if you do not include the correct units.
14 Answer the following questions about a Bunsen burner. aProvide an example of when the Bunsen safety fl ame is important.
bExplain what steps you need to use to achieve a safety fl ame with your Bunsen burner.
cDescribe two reasons why the safety fl ame is not good for heating.
dIdentify which part of the blue flame is best for heating.
15 A student is conducting an experiment and measuring the amount of water they need to use in a measuring cylinder. They look at their measuring cylinder from three angles A, B and C. aIdentify which angle would provide them with the most accurate reading.
bExplain your answer to part a.
16 Write three observations and three inferences about: a this textbook b your own hand.
17Consider what would happen if the units used by scientists were not the same everywhere in Australia.
18Identify the correct graph to use to represent the following set of data on the number of road deaths each year due to car accidents.
Year Number of road deaths 2004 1583 2005 1627 2006 1602 2007 1603 2008 1437 2009 1488 2010 1352 2011 1291 2012 1310 2013 1193 2014 1155 2015 1212
19 Measure the length of the palm of your hand. Check the length of your own palm against the suggested value (see Table 1 on page 13) in centimetres.
aCalculate the length of 50 standard ‘palms’.
bCalculate the length of 50 values of the measurement of your palm.
cCalculate the difference in the two measurements.
20 There are many unusual measurements. Determine how you might find the answers to these measurement problems.
a What is the temperature inside a furnace?
b What is the thickness of a sheet of paper?
c How fast do your fingernails grow? How could you measure this?
21 The number of koalas has been steadily decreasing across many of the eastern states in Australia since 2012. The size of the decrease in each state is shown in Figure 4.
aEvaluate why a column graph would be the most appropriate graph to use for this data.
b Use the data to draw a column graph.
cDiscuss why you could not use this data to determine which state has the largest koala population.
The decline of koala populations in Australia
Note: Overall population decline –24%
Source: Adams-Hoskin et al. (2016)
Figure 4 The decline of koala populations in Australia
22 Pseudoscience challenge: Your teacher will provide you with a set of last week’s horoscopes. They will be randomly numbered, and the dates and star signs removed.
• Decide which horoscope from last week best fits you.
• Coll ate all the horoscope numbers and class members’ names on the board.
• Your teacher will list the corresponding star signs for each number.
Once you have carried out the above tasks: aidentify how m any horoscopes were correct bdetermine what this tells you about astrology c use the evidence from questions a and b to determine if astrology is a science or a pseudoscience ddiscuss two new things you learnt from this activity.
23 Many forms of science research are dependent on government funding. Scientists need to apply for the funding, which can result in their projects competing against one another for the limited funds. A selection panel will often need to decide which research project will receive funding and which will not. Read the following Ig Nobel proposals and decide which research proposal should receive funding. Discuss how you made your choice.
• How to identify a narcissist (self-absorbed) person by the shape of their eyebrows?
• What h appens to the shape of an earthworm when it is vibrated?
• What does a crocodile who breathes helium sound like when they bellow?
24Design one of the following experiments. Write an aim, prediction and method for the experiment. Identify the variables and make sure you control all but the independent variable. Make note of any safety issues. Set it out like one of the experiments in this book.
• An experiment to test if three types of material are waterproof.
• An experiment to see how high a rubber ‘bouncyball’ can bounce on different surfaces.
25Describe how you would determine if you could trust the information you read on a website. Identify which of the following factors you would consider; who wrote the information; when the information was written; how old is the author of the website, and why did the author make the website. Develop one more question that you would ask when you read the website information.
26 Choose one of the following topics for a research project. Your job is to plan the project, rather than actually do the research. Planning is a very important tool. Place the topic in the centre of a mind map and fill the surrounding bubbles with big questions. Make sure your questions are big enough to give you an insight into the topic, as well as broader issues.
Scientists become famous when they have become experts in their area of research. They may have spent many years working on one particular area or have made an important discovery. Some have even won awards for their work.
» Select one of the scientists from this list: Frank Macfarlane Burnet, Douglas Mawson, Gustav Nossal, Mark Oliphant, Helen Caldicott, Nancy Millis, William McBride, Struan Sutherland, Suzanne Corey.
» Desc ribe the area in which they do research.
» Expl ain any significant discoveries that they may have made.
» Create a list of questions that you would ask them if you had the chance.
Scientific discoveries rely on carefully controlling experiments. This means that the methods must be able to be repeated and all the variables have to be controlled.
» Expl ain the difference between controlled variables and the independent variable.
» Desc ribe what would happen if the variables in an experiment were not controlled.
» Desc ribe two experiments: one that was controlled and one that was not controlled.
» Expl ain how the reputation of a scientist may be affected if they made a claim based on an uncontrolled experiment.
When you develop a new product or idea, it is said to be your intellectual property. This means you have time to to use your idea or product to produce something to sell and cover the cost of your research. If you were shown by First Nations peoples how a native plant could cure an infected finger, would you need to ask their permission before you researched the plant to make a new antibacterial medicine?
» Identify what is meant by the term ‘biopiracy’.
» Desc ribe the things you would need to consider before you started your research.
Now that you have completed this chapter, reflect on your ability to do the following.
I can do this.
• Describe the questions scientists might ask.
• Describe where and how scientific investigations can occur.
• Describe a variety of different pieces of specialised science equipment.
• Describe safe practices within the laboratory.
• Define observation and inference as scientific terms.
• Explain the difference between qualitative and quantitative data.
• Describe how to accurately measure data using a variety of equipment.
• Use a Bunsen burner safely and accurately.
• Explain the term ‘variable’ and describe the difference between dependent and independent variables.
• Describe how repetition increases the reliability of results.
• Use graphs and tables appropriately to communicate the data from investigations.
• Describe how errors can affect the results of an experiment.
• Describe the evidence a scientist uses when making a claim.
• Construct a scientific report that uses data and scientific language.
• Describe how the scientists plan, conduct and communicate their investigative strategies and conclusions.
• Describe how First Nations peoples use science skills in their own unique cultures.
• Recognise the cognitive verb in a question.
• Understand the different tasks involved for different cognitive verbs.
I cannot do this yet.
Go back to Topic 1.1 ‘Science is the study of the natural and physical world’.
Page 4
Go back to Topic 1.2 ‘Scientists use specialised equipment’.
Page 6
Go back to Topic 1.3 ‘Scientists take safety precautions’.
Page 9
Go back to Topic 1.4 ‘Scientists use observation and inference to answer questions’.
Page 11
Go back to Topic 1.5 ‘Science relies on measuring with accuracy’.
Page 13
Go back to Topic 1.6 ‘A Bunsen burner is an essential piece of laboratory equipment’.
Page 17
Go back to Topic 1.7 ‘A fair test is a controlled experiment’.
Page 19
Go back to Topic 1.8 ‘Graphs and tables are used to show results’.
Page 22
Go back to Topic 1.9 ‘Scientists analyse claims and results’.
Page 26
Go back to Topic 1.10 ‘Scientific reports communicate findings’.
Page 28
Go back to Topic 1.11 ‘Science as a human endeavour: Science skills are used to solve important problems’.
Page 30
Go back to Topic 1.12 ‘First Nations Australians use science’.
Page 32
Go back to Topic 1.13 ‘Cognitive verbs identify the tasks in a question’.
Page 34
>
>
2.2 The particle model explains matter
> Define the particle theory of matter and diffusion. > Explain how kinetic energy affects particle


2.3 There are three states of matter > Describe the three states of matter and identify the processes that change substances from one state to another. 2.1 No part of this publication may be reproduced, stored in a retrieval system or transmitted in any form or


By the end of this topic, you will be able to:
• Describe the three states of matter.
• Identify the processes that change substances from one state to another.
•
All things are made of matter.
• There are three major states of matter – solid, liquid and gas.


• Many substances can be found in more than one state.


Water is a common substance that we experience in different states of matter. Solid water is called ice, we drink and wash with liquid water, and the gas form of water is known as water vapour. Occasionally we see a fog or mist in the air. This steam-like substance is actually very small drops of water mixed with the air.

Although the ocean and iceberg shown in Figure 1 may look and behave very differently, they are both different forms of water. The ocean is liquid water, and the iceberg is solid water. There is also water vapour in the air. Clouds and fog are made of small liquid water droplets. All of these different states of water are made of the same ‘building blocks’ or water particles.

Often, substances can be described as just one state. However, some substances contain more than one state of matter, like honeycomb (Figure 2). Sometimes we can see all the states in the one mixture – like in the glass of iced soda water in Figure 3 – and sometimes it can be difficult to tell the state of a mixture. For example, would you classify slime or jelly (Figure 4) as a solid, a liquid or a gas?
Ice = solid Drink = liquid Bubbles = gas (carbon dioxide)

Figure 3 A glass of iced soda water contains the three states of matter.


Figure 4 Is jelly a solid, a liquid or a gas?
Figure 2 Honeycomb is a combination of solid and gas. Or is it?
Figure 1 Solid water (ice) floats on liquid water.
No part of this publication may be reproduced, stored in a retrieval system or transmitted in any form or by any means.
The minimum temperature required to melt a solid is called its melting point. Any substance above its melting point will be a liquid (or a gas), and any substance below its melting point will be a solid.

The process of water becoming a gas (water vapour) is called evaporation . Each substance has a different temperature that causes the gas to form. This temperature is called the boiling point . If heat is removed from the water vapour, the gaseous water slows its movement until it once again forms liquid water. This process is called condensation . Figure 9 shows how the state of water changes when heat is added and removed.
Figure 7 Solid water When heat is removed from liquid water, the movement of the water slows. The water has been solidified. This is the solid form of water called ice. Like all solids, ice holds its shape even when it is tipped from a container.
evaporation a change in state from liquid to gas; also a technique used to separate dissolved solids from water boiling point the temperature at which a liquid boils and becomes a gas condensation the cooling down of gas into a liquid
Figure 5 A kettle boils liquid water.


Figure 6 Liquid water When most of us think of water, we think of the liquid form that comes out of our taps. Liquid water sits at the bottom of cups and flows smoothly over surfaces. Water can fit into containers of all shapes and sizes. It is flexible.
Figure 8 Gas water When heat is added to liquid water, the water starts to move faster. Eventually it becomes a gas called water vapour. The gas has much more energy than a liquid or solid. It does not sit at the bottom of a container. Instead, it moves freely around the whole container.
Melting point is the temperature at which a solid changes to a liquid (melting).
Add heat energy
Solidi cation (or freezing) is when a liquid changes to a solid.

100°C 0°C
Freezing
physical property a property of a substance that can be measured or observed without changing the substance into something else; examples are colour and boiling point
chemical property how a substance behaves in a chemical reaction, such as how it reacts with an acid
Table 1 Physical properties of water

Physical property Value
Melting point 0°C
Boiling point 100°C
ColourColourless
Remove heat energy (cool down)
Understanding how water evaporates (liquid to gas) becomes very important when you live in a hot and dry climate like in parts of Australia. Bright sunshine, high temperatures and wind will all cause waterholes to quickly dry up. Before Europeans colonised Australia, First Nations peoples would cover the waterholes in rocks to prevent evaporation.
If water was found in clay, First Nations peoples would make the hole deeper but not wider so that more water could be stored without increasing the evaporation from the water surface. The Yankuntjatjara peoples in the Everard Range region of South Australia would also prevent evaporation by adding sand to their local waterholes. The water particles were able to ‘hide’ between the sand grains, preventing evaporation. When it was time to collect the water, a hole was made in the centre of the sand so that the fresh water could drain into a puddle.
The properties of a substance are the characteristics that make it unique. Solids, liquids and gases have unique properties. Solids

Boiling Condensing
Boiling point is the temperature at which a liquid changes to a gas (evaporation).
Condensation occurs when a gas changes to a liquid.
do not change their shape easily and cannot be compressed. Liquids cannot be compressed, but they can change their shape to fit the container holding them. Gases completely fill the container holding them and can be compressed into a smaller space.
Some substances are important to us because of particular properties. For example, one property of water is that it can be used to dissolve (mix with) many other substances. This makes water useful for cleaning clothes, cooking and experiments in a chemistry laboratory.
The properties of substances can be divided into two groups:
1 Physical properties are what we can observe and measure without changing the substance into something else. Examples of physical properties are colour, texture, boiling point, reversible state changes, density and how much heat it can store (heat capacity). Table 1 lists the physical properties of water.
2 Chem ical properties are what a substance does in a chemical reaction. Examples include bubbling, permanent colour change and irreversible change of state.
Density 1.00 g/mL at 25°C No part of this publication may be reproduced, stored in a retrieval system or transmitted in any form or by any means.
Figure 10 You can sometimes see condensation when you breathe out on a cold morning. The water vapour in your breath becomes a fine liquid when it hits the cold air, making what is commonly called ‘dragon breath’.

Retrieve
1Identify the: a melting point of water b boiling point of water.
2 Use the information in Table 2 below to identify which substance has the: a lowest melting point b highest melting point c lowest boiling point d highest boiling point.
Substance Melting point (°C) Boiling point (°C) Water 0 100 Iron 1535 2750 Lead 327 1750 Mercury –39 357
Table salt 805 1413
Oxygen –219 –183 Nitrogen –210 –196
3 Select a common substance, such as cling wrap or vinegar. Name some of the physical properties of this substance.
Comprehend
4Describe what happens to water when it: a evaporates b condenses c freezes.
5Explain what is meant by a ‘property’ of a substance.
6Explain why the properties of matter are so important to us.
7Compare (describe the similarities and differences between) the processes of melting and boiling.
8Contrast (describe the differences between) the physical and chemical properties of a substance.
9Categorise the following substances as a solid, liquid or a gas (or a combination of states). ice cream, chocolate bar, clouds, thick smoke, glass, honey, cake or bread, mashed potato, paper, peanut butter (smooth), cling wrap, play dough, sand, steam, slime
10Classify each of the following properties as either a physical or a chemical property: the ability to be hammered into fl at sheets (malleability), the ability to explode, the amount of vapour released at different temperatures.
11Identify what would happen to liquid water when heat is applied.
Apply
12 A student claimed a frozen drink bottle was leaking because condensation had formed on the outside of the container. Develop an explanation for the student that describes where the condensed water came from.
Complete the Quiz me to check how well you’ve mastered the learning intentions and to be assigned a worksheet at your level.

By the end of this topic, you will be able to:
• Describe how our understanding of matter has changed over time.


• Contrast the arrangement of particles in solids, liquids and gases.


theory an explanation of a small part of the natural world that is supported by a large body of evidence
atom the smallest particle of matter; cannot be created, destroyed or broken down (indivisible)
• Science involves developing a hypothesis, testing it with a reproducible experiment and modifying ideas.
• The particle theory of matter has been tested and refined by scientists for more than 2000 years.
Scientists have been investigating and proposing ideas about particles for thousands of years. When an idea becomes supported by the current evidence, it becomes a theory


Over 2400 years ago, Democritus (c. 460–370 BCE ) (Figure 1), a Greek philosopher, put forward the idea that all matter is made up of particles. He proposed that if you were to cut up these particles into smaller and smaller pieces, you would eventually have tiny particles that could not be divided any more. Democritus called these particles atomos, which is Greek for ‘indivisible’. This is the origin of the word atom.


It was not until more than 2000 years later, in the early 1800s, that Englishman John Dalton (1766–1844) (Figure 2) developed Democritus’s idea further. Dalton’s ideas were based on the results of experiments performed
by many earlier chemists. Dalton studied these results and proposed a model to explain them. His model was that matter is made of particles. Dalton’s ideas are outlined below.

> All matter consists of tiny particles called atoms.
> Atoms cannot be created or destroyed and are indivisible.
> All atoms of the same element are identical, but they are different from atoms of other elements.
> When atoms combine to form compounds, each atom keeps its identity.
> Atoms combine to form compounds called molecules in simple whole-number ratios. For example, hydrogen and oxygen combine in a ratio of 2:1 to form water, which is written as H 2O.
Figure 1 Democritus proposed that all matter is made of atoms.
element a pure substance made up of only one type of atom compound a substance made up of two or more types of atoms bonded together molecule a group of two or more atoms bonded together, such as a water molecule
Figure 2 John
ideas about particles.
Figure 3 A glass of water is made of molecules. Each molecule contains two hydrogen atoms and one oxygen atom.
This new understanding encouraged scientists to fi nd out more and more about these tiny particles, eventually leading to the branch of science now called chemistry
We can add some new ideas to Dalton’s list to help us explain matter:
> Particles are too small to be seen.
> Particles are always moving. When it is hotter, the particles move faster; when it is cooler, the particles move slower.
> Particles have mass.
> Particles can join to make larger particles. When they combine, their masses add together.
> There are spaces between particles.
> Forces hold particles together to stop them from separating.
All these ideas, or rules, explain how particles act in real substances. The real particles follow these rules in all substances.
chemistry
the branch of science that deals with matter and the changes that take place within it
The particles are close together. They are held in a regular arrangement and vibrate around a xed point.


The particles are close together, but they can move and slide over one another.
Figure 4 The particle model explains the differences between solids, liquids and gases.
1Identify how an ‘idea’ is different from a ‘theory’.
2 Prepare a table (set up like Table 1) that demonstrates the ideas of Democritus and Dalton. Add Democritus’s ideas in one column and Dalton’s ideas in the other column.
Table 1 Historical ideas on matter
Democritus’s ideas Dalton’s ideas
3Contrast (the differences between) the ideas proposed by Democritus and Dalton.
4Consider a school assembly. Everyone is sitting quietly in their seats in rows. When the assembly fi nishes, there is a crowd at the doors pushing to go
The particles are far apart and move quickly on their own. They spread out to ll the space available to them.
through them to leave. When outside, the students run off in all directions as fast as they can. Explain which parts of this analogy represent a solid, a liquid and a gas.
5 Some people use analogies, or models, to compare states of matter. Identify which state could be represented by the following situations.
a a swarm of bees crawling over one another b a thousand tennis balls tidily arranged in a large cardboard box c eggs in trays in a large egg container d a school of fi sh darting in all directions as they avoid a predator

Complete the Quiz me to check how well you’ve mastered the learning intentions and to be assigned a worksheet at your level.
No part of this publication may be reproduced, stored in a retrieval system or transmitted in any form or by any means.
By the end of this topic, you will be able to:
• Define the particle theory of matter and diffusion.
• Explain how kinetic energy affects particle movement.
• All particles have kinetic (movement) energy.
• Adding heat increases the kinetic (movement) energy of particles.
• Removing heat decreases the kinetic (movement) energy.
• The particle model of matter can be used to explain the properties of matter.
The particle model of matter is always true. Every observation and every experiment can be explained with this model.
In the particle model of matter, the particles are always moving. The word ‘kinetic’ refers to the energy of anything that is moving. Therefore, particles always have kinetic energy. The faster they move, the more kinetic energy they have.
For this reason, the particle model can also be called the kinetic theory of matter.
The movement of people and particles is related to their kinetic (movement) energy.
The kinetic theory of matter can be used to explain many of the observations and measurements that we make about the substances around us.
Mass is the amount of matter in a substance and is measured in kilograms (kg). Mass depends on the number of particles and the mass of each individual particle.
A particular volume of solid or liquid has a greater mass than the same volume of gas because it has more particles in it (Figure 2). For example, imagine two containers that are the same size. One container is fi lled with liquid nitrogen. The other is fi lled with nitrogen gas. The container with liquid nitrogen is much heavier because the liquid has more particles in it than the fast-moving gas particles.
Figure 1 Some of the energy in storms comes from the condensation of vapour into liquid, which we see as rain.

kinetic energy the energy possessed by moving objects
When people are sitting quietly, they have little kinetic energy. This is like a solid, where the particles only vibrate, and people only sit quietly and breathe.
> In a crowd, people are standing and moving around and have more kinetic energy. This is like a liquid, where the particles jostle about. Particles in a liquid have more kinetic energy than particles in a solid.
> When people are running, they have much more kinetic energy. This is like a gas, where the particles move fast and on their own. Particles in a gas have the highest amount of kinetic energy.
Solid Gas
Figure 2 A container of a solid has more particles than the same container of gas.
A piece of lead has a much greater mass than the same-sized piece of aluminium. Both are metals that are made of atom particles that are packed closely together. The difference is the mass of each atom. Lead atoms are bigger and have a greater mass than aluminium atoms (Figure 3).
Modelling matter
2.3B: Making a cuppa
Lead Aluminium
Figure 3 Lead atoms have a greater mass than aluminium atoms.
When the lid is taken off a bottle of perfume, the smell of the perfume spreads throughout the room (Figure 4). This occurs without any breeze or wind and is called diffusion. Another example of diffusion is tea spreading out from a tea bag in a cup of hot water (Figure 5). Stirring the cup of tea will mix the particles and speed up the rate of diffusion.


Diffusion occurs fastest in gases. This is because the particles in gases are moving freely and quickly and there is plenty of space between them. The particles in a gas will spread out quickly and take up the space available (Figure 6).
Figure 6 Before (left) and after (right) diffusion in a gas
In liquids, the particles jostle against one another. They do not move far before colliding with another particle. As a result, particles in a liquid do not move very far or very fast. Diffusion in liquids is slow (Figure 7).
In solids, the particles are locked into position. The particles vibrate, but they cannot move to a new location. So the particles in a solid cannot spread out and diffusion does not occur in solids (Figure 8).
open.
Figure 7 Diffusion is slow in liquids.
Figure 8 Solids do not diffuse.
1Name the states solid, liquid and gas from having the most to the least energy content.
2Define the term ‘mass’.
Comprehend
3Explain the meaning of ‘kinetic’ in the kinetic theory of matter.
4Explain the similarity between the particle model of matter and the kinetic theory of matter.
5Describe how the kinetic molecular theory (or particle model) of matter explains the mass of different substances.
6Explain why a 2 cm3 block of lead will have a greater mass than a 2 cm 3 block of wood.
7Describe how the kinetic molecular theory of matter explains diffusion in: a liquids b gases.
Quiz me
Complete the Quiz me to check how well you’ve mastered the learning intentions and to be assigned a worksheet at your level. No part of this publication
Figure 5 Tea diffuses in hot water.
By the end of this topic, you will be able to:
• Define and explain tensile strength, hardness, viscosity, compressibility and density in terms of the particle model.
Video 2.4
Calculating density
tensile strength a measure of the flexibility of the bonds between particles in a substance compressional strength the ability of a substance to withstand large forces
• Strong bonds between particles can make the material stronger (able to withstand force), harder and more viscous.
• Tightly packed particles make the material dense and less able to be compressed.
The idea of strength can be considered in different ways. A rubber band is easily stretched, but what about a piece of wire? Different wires made of different metals will break if stretched. Tensile strength is a measure of the flexibility of the links or bonds between the particles. The bonds between the particles in steel are stronger than those between tin particles. Another type of strength is compressional strength. Substances that can withstand large forces without being crushed have a high compression strength.
Figure 2 An iron nail will scratch plastic because iron is harder than plastic.
hardness how easily a mineral can be scratched
Hardness is the ability of a substance to scratch another substance. An iron nail will scratch a plastic ruler because the iron is harder than plastic (Figure 2). However, the iron nail will not scratch glass because the iron is softer than glass. For these substances, the order of hardness is glass, next iron and then plastic.
Viscosity is the thickness, or ‘gooiness’, of a liquid. It describes how easily the particles move around one another. Viscous liquids are hard to pour out of a container. Water has a low viscosity, cooking oil is more viscous and honey is very viscous (Figure 3). Engine oils used in engines have different viscosities.
Figure 1 Reinforced concrete combines the tensile strength of steel with the compressional strength of concrete.

viscosity a measure of how slowly a liquid changes its shape; the thickness of a liquid compressibility the extent to which a substance can be compressed (squashed); gases can be compressed but solids and liquids cannot

Hardness is not the same as strength. A very hard substance may shatter easily. If this happens, the material is described as ‘brittle’. The particle model of matter explains hardness in terms of the forces that hold the particles together. The particles in hard substances are held together very strongly and it is difficult to separate them. In plastic, the particles are not held together as strongly and can be removed or scraped off. Therefore, plastic is not a hard substance.
There is a connection between hardness and melting. Substances that are hard have strong forces (bonds) between their particles. These strong forces mean that for hard substances to melt, a lot of heat energy is needed. These substances usually have a high melting temperature.
Figure 3 Honey has a higher viscosity than water and so can’t be poured as easily as water.

Compressibility refers to the ability of a substance to be squashed or compressed. You can test for compressibility when substances are in a plastic syringe.
If you put your fi nger over the end of a syringe, you can compress the air inside it.
However, if you replace the air with a liquid such as water, you cannot compress the water. Similarly, if you fi lled the syringe with a solid such as sand, you would not be able to compress it.
In solids and liquids, there are no empty spaces between the particles, so it is not possible to compress the particles closer together. Solids and liquids are said to be incompressible Gases, like air, can be compressed. This is because the particles are spread out and there is space between them (Figure 4).
One way of comparing the ‘heaviness’ of two substances is to compare their densities. Density describes the number of particles and how tightly packed they are. The density of a substance will affect its properties, such as its ability to float.
Objects with lower density float on liquid if the liquid has a higher density. For example, a piece of cork will float on water. This is because the water has a higher density than the cork. On the other hand, coins will sink to the
bottom of water. This is because the coins have a higher density than the water.
In Figure 5, we see that 1 L of water is heavier than 1 L of air. We say that water has a greater density than air. Sand has a greater density than water or air, but it has a lower density than lead.
The particle model of matter explains density in terms of both the mass and the closeness of the particles. Gases always have low densities because there is a lot of empty space between the particles. Solids normally have high densities because there is no space between the particles.
The densities of some common substances are given in Table 1.
Table 1 Densities of some common substances
Substance Density (g/cm3)
Air 0.001
rubber 0.05
Gas in bike pump Normal
Figure 4 Compression reduces the space between particles.
incompressible unable to be compressed; solids and liquids are incompressible
By the end of this topic, you will be able to:
• Describe what happens to particles when they are heated.
• Explain how heat can cause expansion.
• Heating matter increases the kinetic energy of the particles.

• The particles in warm materials move faster than particles in cool materials.
• Melting point is the temperature at which the particles in a solid behave like a liquid.
• Boiling point is the temperature at which the particles in a liquid behave like a gas.
Gold is usually a solid at room temperature (20°C). Like all solids, the particles in gold are packed tightly together. When solid gold is given heat energy, the gold particles start vibrating faster and faster. When the gold reaches its melting point (1064°C), the particles have enough kinetic energy to move around one another, just like the particles in a liquid. The gold has melted.
If you continue heating the gold, the particles continue to gain kinetic energy, move faster and take up more space. Eventually, when the gold reaches its boiling point (2807°C), the gold particles have enough kinetic energy to break free from the other gold particles and move off on their own as a gas. This process can also happen in reverse. If a gas is cooled down, the particles will move more slowly. The attraction to other particles will now keep the particles close together and the gas will condense into a liquid.

If the particles in a liquid are cooled even further, their movement will slow down even more. Eventually, they are held in place by other particles and do not have enough energy to move on their own – they become particles locked into a solid. The liquid has solidified or frozen.
Remember that the main difference between a hot and a cold substance is the amount of kinetic energy in the particles. The differences in the movement of hot and cold particles can be seen in a beaker of water. As the particles move around, they cause diffusion. If the particles move faster, diffusion should occur faster.

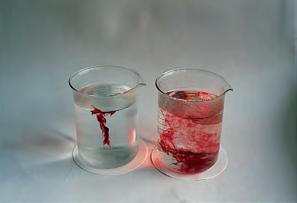
All objects and substances expand (increase in size or volume) as their temperature increases. These objects contract (shrink) back to their original size when they are cooled back to their original temperature. No part
The expansion is only small – roughly 10 mm in a 30 m bridge – but it is very important for the strength of the object. Expansion effects are seen in bridges, railway tracks and large buildings (Figures 4 and 5).

Applying heat energy causes the particles in the liquid or gas to gain more energy. The particles jostle more and speed up. As they move around faster, they take up more space and push the other particles further apart.
Expansion and contraction have many important applications, such as liquid-in-glass thermometers. When an alcohol thermometer is placed in your mouth, the heat from your body passes to the liquid inside the thermometer, causing it to expand and move up the tube. Thermometers are fi lled with redor green-coloured alcohol, but not the type of alcohol in alcoholic drinks.
Figure 4 An expansion joint in a suspension bridge

Figure 6 In a hot solid, the particles vibrate harder, faster and wider than in a cold solid.

Cold water Hot water
Figure 7 In a hot liquid, the particles jostle around faster and take up more space than in a cold liquid.
Figure 8 In a hot gas, the particles move faster, and collide with one another harder, than in a cold gas.
6 Draw a diagram similar to that shown in Figure 9. Add labels to identify the energy changes between states.
Comprehend
2Explain how the movement of particles changes when a substance gains heat.
3Explain why objects return to their original size when their temperature returns to normal.
4 When a solid is heated, it expands. Explain why. Analyse
5Contrast (the differences between) the terms ‘expand’ and ‘contract’.
Figure 9 Energy changes between states
Quiz me
Complete the Quiz me to check how well you’ve mastered the learning intentions and to be assigned a worksheet at your level. No part of this publication may be reproduced, stored in a retrieval system or transmitted in any form or by any means.
By the end of this topic, you will be able to:

• Identify ways that scientists can share ideas and theories with different audiences.
scientific model a physical, mathematical or conceptual representation of an object, system, event or process that is used to explain or predict the behaviour of a scientific process or phenomenon
Scientists can research many exciting and different things in the world around them. This research needs to be explained to those people who do not have an understanding of science. To do this, they need to be able to communicate their ideas clearly and in a number of different ways.
The ability to describe scientific ideas is an essential skill for all scientists so that the non-scientists do not become confused or scared of the scientific ideas or information. There are many different ways a scientist can describe their research.
Other examples of scientific models include models of the solar system or DNA. We cannot view either of these things, but you might have an idea in your head of what they look like.

Many scientists use formally written scientific reports or papers to describe how they did research and the data they measured, and to explain how it affects the world around them (Figure 2). These reports are usually used to provide information to other scientists who are specialists in the same field. Because these reports are meant to be read by other scientists, they often use a lot of complex terminology that can be difficult for the average person to read. Each report is also peer reviewed. This means other scientists who work on the same research will read the report and check that it was a fair experiment before it is published in a scientific journal.
Figure 1 The particle model helps us to understand different states of matter, even though we cannot observe particles.
Scientists use scientific models to explain and predict how things work. Scientific models are ideas or representations that we can use to explain phenomena that are difficult to observe. For example, the particle model helps us to explain matter, which we would not normally be able to see (Figure 1).
Before a scientist writes a paper for a scientific journal, they will often present it to other scientists as a poster (Figure 3). Posters are a shorter summary of the experimental method and results that can be put on a wall for other scientists to see at a conference (a meeting for scientists). This allows the scientist to discuss their ideas and research with other scientists walking past so that they can offer suggestions on how the research could be improved.
Communication statement reporting the key nding of the investigation as a one-sentence summary
Figure 3 Scientific posters include a short summary of an experiment’s hypothesis, method, results, discussion and conclusion.
Scientists will often travel to other states or countries to share their research with other scientists. A conference occurs when a large number of scientists who are interested in the same research travel to the same place to discuss their ideas (Figure 4). The chance to share ideas and to see their research from another person’s perspective can cause good ideas to become great ideas.


Scientists are not the only people who are interested in learning about science. Many people are interested in learning about discoveries on the Moon, new treatments for cancer and new forms of renewable energy. This means that scientists need to be able
to share their ideas with nonscientists through newspapers, magazines, television or social media (for example, online blogs, YouTube and Twitter) (Figure 5).
Before a scientist can communicate effectively, they need to answer a few questions. Use the hints below to create an animation or other form of communication that explains how you could reduce the amount of water evaporating from a waterhole in central Australia. You should use your knowledge of particle theory to explain why your idea will work.
1 Who is the audience?
Knowing who will be reading or listening to the information is the most important thing a scientist needs to know. Do the people in the audience know the meaning of the scientific words? Will you communicate your science to your classmates, an older or younger class, or a teacher? How much science do they know? What words might you have to change?


2 How can the scientist make science relevant? There are many different types of scientific research on many different topics. While some people will be very interested in the topic, others may not be as interested. You will need to consider how your experiment is similar to something in their life. They may have slower train trips on hot days because of the train tracks bending or buckling, or they may wonder why they get condensation on the outside of their glass. A scientist needs to make the science interesting to their audience.
3 What is the most effective way to communicate science? Different people use different forms of communication. If a scientist wanted to share their research with the general public, they would not use a scientific paper or a poster. Instead, they might use an oral (talking) report,


television report or a blog. Which method would be the best way to present to your audience?

4 How much information should be passed on?
A single tweet is limited to 280 characters, while an online blog can be much longer. Reports on television are often limited to three minutes while a scientific paper can be several pages of information. What information do you need to pass on to your audience? Will they want to hear how you did your research and see the data in graphs or tables? How will you convince them that the experiment was a fair test and that your results are accurate?
5 Pictures or words?
The type of communication you use will often determine if you can use pictures or words. Using a lot of words in a small space in a report or on a poster means that the audience needs to stop and concentrate. Do you need to describe the method, or will a single, well-labelled diagram be more useful? If you are presenting an oral report, a pause after saying a word will make it more important and more likely to be remembered.
6 What are the two things that you want the people in the audience to remember?
Most people in an audience will only remember two things after a communication. What two things are the most important for your audience to remember? How will you make sure that they remember these things? Will you repeat the important information or have a summary at the end?
Good luck with your communication.

1Recall where the word ‘atom’ came from.
2Identify what happens to water during condensation.
A The solid melts into a liquid.
B The liquid heats to become a gas.
C The liquid loses heat to become a solid.
D The gas loses heat to become a liquid.
3Identify what would happen to the particles in a beaker of water as it is heated.
A The particles start moving faster.
B The particles start moving slower.
C The particles stop moving.
D The particles start to disappear.
4Identify the best description for ‘density’.
A the ability of a substance to scratch another substance
B the ability of a substance to be compressed
C the mass of a certain volume of a substance


D the thickness of a liquid substance
5Define the term ‘volume’.
6Define kinetic energy in your own words.
7Identify the three common states of matter.
8Recall one word to replace each phrase.

a the spreading out of a substance such as a dye or smell

b the ability of one substance to scratch another substance
c the ratio of the mass divided by the volume
9 Use the information in Table 1 to identify which substance has the: a lowest melting point b highest melting point c lowest boiling point d highest boiling point.


Table 1 Melting and boiling points
Substance Melting point (°C) Boiling point (°C)
Water 0 100
Iron 1535 2750
Lead 327 1750
Mercury –39 357
Table salt 805 1413
Oxygen –219 –183
Nitrogen –210 –196
10Identify which state of matter has particles with the most kinetic energy. Explain your reasoning (by describing the amount of kinetic energy in solids, liquids and gases).
11 Use the particle model to explain the following properties. a strength b hardness c viscosity
d compressibility e density
12 In your own words, explain the five key ideas identified by Dalton.
13Explain why perfume sprayed on one side of a room will eventually be smelled by someone sitting on the other side of the room.
14 Use the kinetic theory of matter to explain why metal will expand when it is heated.
15 When you are boiling water, the volume of the water is reduced as it evaporates. Use the particle model to explain what happened.
16 Use the kinetic theory of matter to explain why the pressure inside car tyres will increase on a hot day.
17Explain how a thermometer determines a difference in temperature.

18Explain what will happen when the air in a balloon is heated.
19Explain why the train tracks can buckle on very hot days.
20Classify each of the following substances as a solid, liquid or gas. a milkshake b cheesecake c chewing gum d sandcastle
21Contrast physical and chemical properties.
22Contrast (the differences between) mass and matter.
23Identify which of the following substances will have particles with the most kinetic energy: ice, milk or the air in a balloon.
24Identify each of the following in Figure 3 as a solid, liquid or gas.
The particles are close together. They are held in a regular arrangement and vibrate around a xed point.
The particles are close together, but they can move and slide over one another.
The particles are far apart and move quickly on their own. They spread out to ll the space available to them.
Substance
Density (g/cm3)
Air 0.001
Foam rubber 0.05 Wood 0.3 Oil 0.75 Water 1.0 Glass 2.6 Steel 7.8
Iron 7.8 Copper 8.9 Lead 11.3 Mercury 13.6 Gold 19.3
Figure 3 Solid, liquid or gas?
25Contrast (the differences between) solidification and freezing.
26Compare the processes of melting and boiling.
28 Many people have ideas they think will explain observations and events in science. For an idea to become a theory, it must be able to explain a range of different observations. The idea must also be supported by evidence and/or observations.
aPropose what evidence would have been required to support the idea that all substances are made of atoms.
b It is found that a substance cannot be broken down into a more simple substance. Use the particle model to explain this observation.
29Explain the following observations of solids, liquids and gases by describing the arrangement and/or the movement of particles within the substance. Create labelled diagrams to help your explanations.
a Water left in an open bottle will gradually evaporate and, if the temperature of the water increases, the water will evaporate more quickly.
Apply
27 Use Table 2 to decide which of the following items would have a greater density.

a 1 L of water or 1 L of oil
b a gold necklace or a crystal necklace
c 10 planks of wood or 10 steel bars (assume they are all equal in size)
b Mercury is a unique substance because it is the only metal that is liquid at room temperature, and it even gives off a vapour (which makes it very dangerous because this vapour can be breathed into our lungs and cause damage).
c Polythene plastic can be produced in two different forms: high-density polythene (HDPE) or lowdensity polythene (LDPE). If the particles in HDPE and LDPE are the same, suggest how the structure of the two substances would be different.
d When a piece of polythene is heated, it will melt. While it is changing state from a solid to a liquid, it can be formed into a different shape. When it cools, the polythene will stay in this new shape.
30Create a way to draw or model the following. a the melting point of a material b the boiling point of a material c the density of a material d the ki netic energy of a particle as it heats up e diffusion
31 Science is communicated in many different ways, including scientific journals and posters, television reports, newspapers and social media, such as blogs, YouTube and Twitter. Identify which of these forms of communication are most trustworthy. Justify your answer (by describing why the communication you chose is better than the other forms of communication).
32 Democritus identified that all substances were made of tiny particles called atomos, while Dalton suggested how these particles were combined and how they moved. Propose an argument to support the particle theory of matter being called either the Democritus Model or the Dalton Model.
33 The kinetic theory of matter is supported by data from many different experiments completed by many different scientists across multiple countries. Discuss why a single experiment carried out by a single scientist is not a theory.
34Discuss how Democritus’s ideas of an atom were expanded by Dalton to produce the current particle model of atoms.
35 Choose one of the following topics for a research project. Present your research in a format of your own choosing, giving careful consideration to the information you are presenting.
Most of our understanding of how gases move and change is a result of the first hot air balloonists.
» Identify the first person who made an unmanned balloon.
» Desc ribe how the balloon was made.
» Use your understanding of density to explain why a hot air balloon flies and how the pilots control the descent and landing safely.
» Identify what is meant by the ‘flight ceiling’ and why it is important to stay beneath it when flying.
The discovery of air pressure is a long and interesting story.
» Rese arch the background of Evangelista Torricelli, Blaise Pascal and Otto von Guericke.
» Desc ribe where they lived, the research that they did, and how they communicated the outcomes of their work.
For example, Otto von Guericke built a large water thermometer in the front of his house and made the Magdeburg Hemispheres. Two opposing teams of eight horses, working like a tug-of-war, could not pull the hemispheres apart.

Gas was first used in a battle in 1914 by French soldiers, but it was so unsuccessful that it was only noticed in the records after the battle. It wasn’t until 31 January 1915 that a German soldier witnessed 18,000 gas shells containing xylyl bromide land on the Russian lines. The cold weather prevented the gas from diffusing across the battleground. In April the same year, German chemists started testing chlorine gas as a weapon.
» Compare the different gases that were used in warfare and their effects on the soldiers.
» Expl ain why the use of chemical and biological weapons in war was banned in 1925.
» Compare this ban to the Chemical Weapons Convention signed in 1997.
No part of this publication may be reproduced, stored in a retrieval system or transmitted in any form or by any means.
Now that you have completed this chapter, reflect on your ability to do the following
I can do this.
I cannot do this yet.
• Describe the three states of matter.
• Identify the processes that change substances from one state to another.
• Describe how our understanding of matter has changed over time.
• Contrast the arrangement of particles in solids, liquids and gases.
• Define the particle theory of matter and diffusion.
• Explain how kinetic energy affects particle movement.
• Define tensile strength, hardness, viscosity, compressibility and density.
• Explain these properties in terms of the particle model.
• Describe what happens to particles when they are heated.
• Explain how heat can cause expansion.
• Identify ways that scientists can share ideas and theories with different audiences.
Check your Student obook pro for these digital resources and more:
Play a Quizlet game to test your knowledge.
Test your understanding of this chapter with the chapter review quiz.
Go back to Topic 2.1 ‘There are three states of matter’.
Page 42
Go back to Topic 2.2 ‘Scientists’ understanding of matter has developed over thousands of years’.
Page 46
Go back to Topic 2.3 ‘The particle model explains matter’.
Page 48
Go back to Topic 2.4 ‘The particle model can explain the properties of matter’.
Page 50
Go back to Topic 2.5 ‘Increasing kinetic energy in matter causes it to expand’.
Page 52
Go back to Topic 2.6 ‘Science as a human endeavour: Scientists find ways to communicate’. Page 54
Check your Teacher obook pro for these digital resources and more:
Launch a live team or individual quiz for your students on key concepts in this chapter.
No part of this publication may be reproduced, stored in a retrieval system or transmitted in any form or by any means.
3.1
Mixtures are a combination of two or more substances
> Describe the properties of various mixtures, including solutions, suspensions, colloids and emulsions.
3.2
A solution is a solute dissolved in a solvent
> Contrast the terms ‘soluble’ and ‘insoluble’, ‘solute’ and ‘solvent’, and ‘concentrated’ and ‘dilute’.
> Describe the properties of a saturated solution.
> Explain the importance of water as a solvent.

3.3
Mixtures can be separated according to their properties

> Describe the processes of decanting, sedimentation, flotation and magnetic separation.
> Define sediment, magnetism and flocculant.
> Explain how the properties of a substance can be used to separate them from a mixture.
No part of this publication may be reproduced, stored in a retrieval system or transmitted in any form or by any means.
3.4
Mixtures can be separated according to their size and mass
> Describe the processes of filtration, sieving and centrifuging.
> Expl ain how the size and mass of molecules of a substance relate to methods used to separate them from mixtures.
3.5
The boiling points of liquids can be used to separate mixtures
> Describe the processes of evaporation, distillation and crystallisation.
> Expl ain how different boiling points can be used to separate mixtures.
3.6

Solubility can be used to separate mixtures
> Describe the process of chromatography.
> Expl ain how the solubility of a substance can be used to separate it from a mixture.
Science as a human endeavour: Wastewater is a mixture that can be separated
> Describe the separation processes involved in water treatment.
3.8
Science as a human endeavour: Materials recovery facilities separate mixtures
> Describe the separation processes involved in recycling at a materials recovery facility.

What you need:
A variety of different pencil cases (size, shape, colour)
What to do:
1 Place all the pencil cases in one pile.
2 List your pencil case’s properties that will allow it to be identified easily, such as colour, weight, shape and size.
3 Give the list to another student. Can they identify your case by using the list?
What if?
» What if you were blindfolded? Could you still find your pencil case?
» What if the pencil cases were too small to feel? How could you identify yours?
» What if all the pencil cases were exactly the same? Would it still be a mixture?
By the end of this topic, you will be able to:
• Describe
• A pure substance is one where all the particles are identical.
• The different substances in a mixture can have different properties.
• The different properties of substances can determine the type of mixture.

In the previous chapter, you learnt about the particle model of matter. The particles in a pure sample of ice, water and water vapour are all identical (H 2O). This is different from water found in the sea, which is a mixture of salt, water and many other types of particles.
pure substance something that contains only one type of substance (e.g. a single element or a single compound)
mixture a substance made up of two or more pure substances mixed together solution a mixture of a solute dissolved in a solvent suspension a cloudy liquid containing insoluble particles
sediment substance or matter that settles to the bottom in a mixture colloid a type of mixture that always looks cloudy, because clumps of insoluble particles remain suspended throughout it rather than settling as sediment
emulsion
a type of colloid in which two or more liquids are mixed together, with one suspended in the other as tiny droplets
There are many different types of mixtures, each with different characteristics. For this reason, scientists group mixtures according to their properties: what they are made of and how they behave. Knowing the type of mixture and the properties of each particle help us to work out ways to separate the different particles into pure substances
When you mix salt into water, it seems to disappear. But we know the salt is still there because we can taste it. The particles of salt become so small that they spread evenly throughout the water. This clear mixture of salt and water will not separate by itself. It is a solution . A solution is a mixture of one substance dissolved evenly throughout another (Figure 2). Solutions are usually transparent (see-through).
Dirty water is an example of a suspension . A suspension is a mixture of two substances, in which a solid is mixed through (dispersed), undissolved, in a liquid (Figure 3). The result is a cloudy liquid where the dirt is suspended or ‘hanging around’ in the middle of the water. Sand in water is also a suspension. If you shake a container of sand and water, the sand spreads through the water, forming a cloudy liquid. The sand will then settle to the bottom of the container as a sediment . Suspensions often need to be shaken or stirred before use to spread the sediment through the liquid.
When two types of particles are mixed, they do not always separate out with time. Suspensions that do not separate easily are referred to as colloids. These can be formed when a solid is suspended in a liquid, such as hot chocolate in milk. Occasionally, different particles are suspended in a gas. Fog is an example of this: small drops of water suspended in the air (Figure 4).
Figure 1 Most of the things we use every day are mixtures. What mixtures can you see in this photograph? Can you see any pure substances?
the properties of various mixtures, including solutions, suspensions, colloids and emulsions.
3.1: Comparing different types of mixtures Go to page 201
The word ‘colloid’ comes from the Greek word kolla , which means ‘glue’. You can think of a colloid as a substance being ‘stuck’ – suspended – in another substance. The benefit of colloids is that there is no need to mix them before using them. Hair gel and hand cream are examples of colloids.
An emulsion is a colloid of two or more liquids. Usually, one liquid is the ‘base’ and the other is broken into tiny droplets spread throughout the base. Milk is an emulsion, with tiny droplets of fats and oils spread throughout the base, which is water. (Figure 5)
In some cases, when mixtures like this are left to settle, the tiny droplets float above the base liquid. (This is different from what happens in a suspension, where the solid particles tend to fall to the bottom.) A substance called an emulsifier can be added to these mixtures to allow the liquids to remain completely mixed.
The most common emulsions we use are mixtures of different types of oil mixed with water and an emulsifier. Examples include food and drinks, and ‘emulsion’ paints.
Solution

Figure 2 This glass of cordial is an example of a solution. The small cordial particles are dissolved evenly throughout the water.
Figure 4 Fog is a colloid because it is made up of suspended liquid particles in air.


Figure 3 A snow dome can be described as a suspension, with the larger ‘snow’ particles being suspended in the water for a short time before they fall to the bottom of the dome to form a sediment.
Figure 5 Milk is an emulsion because it contains many substances suspended in what is mainly water.

6Predict the types of particles you think the mixtures in question 4 might contain. 7Predict the type of mixture(s) that would form a sediment.
Quiz me Complete the Quiz me to check how well you’ve mastered the learning intentions and to be assigned a worksheet at your level. No part of this publication may be reproduced, stored in a retrieval system or transmitted in any form or by any means.
By the end of this topic, you will be able to:
• Contrast the terms ‘soluble’ and ‘insoluble’, ‘solute’ and ‘solvent’, and ‘concentrated’ and ‘dilute’.
• Describe the properties of a saturated solution.
• Explain the importance of water as a solvent.

soluble can be dissolved in a liquid solute a substance that dissolves in a liquid (solvent) solvent a liquid in which other substances dissolve
dilute containing a small number of solute particles in the volume of solution concentrated containing a large number of solute particles in the volume of solution
• A solvent can be used to dissolve a soluble solute.
• A dilute solution has very little solute in the solvent.
• The more solute that is dissolved in the solvent, the more concentrated the solution.
• A solution is saturated when no more solute will dissolve.
In some places in Australia, the water from the local water supply has an unpleasant taste, or washing with soap is difficult because the water forms a scum instead of a foamy lather. In these cases, the water contains metal salts that affect its taste and behaviour. Because they are so small, these metal salts do not fall to the bottom or float on the top; instead, they remain evenly spread through the liquid. The resulting mixture (a solution) is clear – light will shine through it. We say that the metal salts have dissolved in the water.
A substance that is able to dissolve in a liquid is considered to be soluble, whereas a solid that cannot dissolve is described as insoluble. The substance dissolving is called the solute, and the liquid into which it dissolves is called the solvent . An example of this is salty water. The salt is the solute, and the water is the solvent. Sometimes it is necessary to help a solute such as salt to dissolve. Warming the solvent (water) is the most common way of making a solute dissolve faster.
You have seen that a solution is a solute dissolved in a solvent (Figure 1). Solutions can be compared in terms of their concentration: how much solute is in the solvent. If just a little solute is dissolved, the solution is described as dilute (low concentration). If a lot of a solute is dissolved, the solution is described as concentrated (high concentration). This is shown in Figures 2 and 3.
Solute particle
Dilute solution Concentrated solution
Figure 3 A concentrated solution contains more solute particles in a given volume than a dilute solution.
Solvent particles
Solute particles
Figure 1 A solute dissolves in a solvent to create a solution.
Figure 2 The concentration of salt in the Dead Sea is so high that when people try to swim in it, they float instead because their body is less dense than all that salt!
3.2A: What if salt was dissolved in water?
Go to page 203 EXPERIMENT
It is only possible to dissolve a certain amount of a particular solute in a solvent. If no more solute can dissolve into a solution, the solution is described as saturated . What sort of cordial drink do you prefer: dilute, concentrated or saturated?
We often work with solutions in our everyday lives. By adding solutes to pure liquids, the properties of the pure liquids may change. An example is adding bath crystals to a bath to give the water a pleasant smell.
Water is a good solvent. This is one of its most important properties. Our digestive system uses water to dissolve our solid and liquid food, and to break up the food into nutrients that our body needs to build new cells, grow and repair.
3.2B: What if the solvent was heated when making a mixture? Go to page 204 EXPERIMENT
Our bodies are more than 60 per cent water. Our blood, which is mainly water, transports oxygen to every cell and carries away dissolved carbon dioxide gas (a waste product).
Humans are not the only living things that depend on water as a solvent. Without water’s ability to dissolve gases, there would be no underwater life in our oceans and lakes and no fi sh in the rivers. These creatures all live by extracting dissolved oxygen gas from the water (Figure 4).

Imagine that you found a colourless and see-through liquid and were really thirsty. Is it water? There are many other colourless and clear liquids, and you do not know what substances might be dissolved in them. Tasting may be dangerous. There are more scientific ways of working out whether a liquid is pure. This is explored further in Topic 3.3.
saturated describes a solution in which no more solute can be dissolved
1Define the following ‘s’ words used in this section: solute, solvent, solution, soluble and saturated.
2 Someone asks for a dilute glass of cordial. Identify if you would add a lot of cordial or only a little.
Comprehend
3Describe how you could increase the amount of a solute that will dissolve in a solvent.
4Explain if you can see the particles of a solute in a solution.
5Explain why water cannot be a solute for all substances.
6Explain what happens to sugar particles when they dissolve in water.
Analyse
7Compare the solubility of particles in suspensions, colloids, emulsions and solutions.
Quiz me Complete the Quiz me to check how well you’ve mastered the learning intentions and to be assigned a worksheet at your level.
Figure 4 Oxygen dissolved in water is essential for aquatic organisms.
By the end of this topic, you will be able to:
• Describe the processes of decanting, sedimentation, flotation and magnetic separation.
• Define sediment, magnetism and flocculant.
• Explain how the properties of a substance can be used to separate them from a mixture.
• Properties are how a substance looks (size, mass, texture, shape, volume) and how it behaves around other substances (magnetic, soluble).
• A magnet can be used to separate particular metals.
• Decanting can be used to separate sediment from a liquid.
Some mixtures are quite simple to separate. Sometimes we can simply pick out the bits we need to separate. The Alyawarre, Anmatyerre, Warlpiri and Pitjantjatjara peoples in the desert parts of the Northern Territory use their fingers to individually separate the good desert raisins (Solanum centrale) from the stalks and rotten fruit (Figure 1). This leaves the ripe fruit that is good for eating. This works well if there is a small number of raisins that are big enough to see. But what if the raisins were too small to see? You may need another way of separating out your favourite fruit.
Do you separate recyclables from your rubbish? Have you ever wondered how the different recyclable materials are separated once they are out of your house?
Figure 2 Magnets can be used to separate tin cans (left), which are magnetic, from aluminium cans (right), which are not.
Figure 1 First Nations peoples use different techniques to separate mixtures.

magnetic separation the process of using magnets to separate magnetic materials from non-magnetic materials decanting a technique used to separate sediment from the liquid it is in by carefully pouring the liquid away
Magnetic separation uses magnets to attract and separate particular objects. Some metals are magnetic. Magnetic substances are attracted to a magnet. They are made of iron or a mixture containing iron.
Magnetism will only separate substances containing iron, so magnetic materials such as iron nails can be separated from other nonmagnetic materials such as glass, aluminium and paper.
Tin cans are magnetic, whereas aluminium cans are not. Sometimes large magnets are used to separate tin cans in the rubbish from aluminium cans (Figure 2). This means both types of cans can be recycled in different ways.


Have you ever had a piece of food in the bottom of your drink? Did you use a spoon to remove it? Or maybe you carefully poured your drink into another glass, leaving the food behind? The careful pouring of liquid, or decanting , is often done to remove high density sediment from wine (Figure 3).
The objects or liquids that sink are denser than the liquid on the top. The particles in dense objects are packed together more tightly than those in less dense objects. Oil floats on top of water because the particles in the oil are packed very loosely. The water particles pack together more tightly, so they sink to the bottom below the oil.

Figure 3 Decanting wine separates the undrinkable sediment.
No part of this publication may be reproduced, stored in a retrieval system or transmitted in any form or by any means.
3.3A: Separation using magnetic properties
Go to page 205 SKILLS LAB
3.3B: Separating mixtures using sedimentation and flotation Go to page 205 SKILLS LAB
The particles in a grain of sand are packed together very tightly. The sand is more dense than water. Therefore, the sand settles to the bottom of a glass of water. The sand forms a sediment in the glass.
Sedimentation and flotation are used in sewage treatment to separate the mixture of substances (Figure 4). Sewage is left in settling ponds to allow the sediment to settle to the bottom. Fats and oils that float to the top of the ponds can be scooped off for digestion by bacteria.

Oil spills can be cleaned up using the fact that oil floats on the surface of water (Figure 5). Cork and other substances can be sprinkled on top of the oil to soak it up, and these substances are then scooped off and squeezed out.
In certain situations, sedimentation is more difficult. Chemicals called flocculants can be added to a mixture to make suspended particles clump together. This makes them heavy enough to settle to the bottom. Flocculation is regularly used to separate substances from water.
Some mixtures can be separated by their ability to be blown or floated away. The Alyawarre people of the Sandover River in the Northern Territory separate mixtures using these properties. In one technique, a variety of local seeds are collected before being beaten with sticks to remove the seeds from their pods. Blowing air gently under the mixture blows away the light pods, leaving the heavier seeds to be used for food.
1Define the following terms. a sediment b flocculation c decant d density
Comprehend
2Describe the property that allows the separation of tin cans from aluminium cans.
3.3C: What if a flocculant was added to muddy water? Go to page 206 EXPERIMENT
The Yindjibarndi people in Western Australia separate sand and dirt from seeds in a process called yandying. This technique involves placing the mixture in a shallow wooden dish, called a yandy or a coolamon in other places in Australia, which is gently shaken back and forth. The dense sand sinks to the bottom and the less dense dirt and larger seeds float on the surface, allowing them to be collected for food or growing. This process is very similar to gold panning.
sedimentation the process of a substance settling to the bottom in a mixture
flotation the action of floating in a liquid or gas
flocculant a chemical added to a mixture to make suspended particles clump together

3Explain why flotation allows oil spills to be cleaned up more easily.
4 Use an example to describe what can be done to encourage sedimentation if a suspension does not separate.
5 Use an example to describe a situation where people need to separate a mixture by hand.
Apply
6Discuss a situation where magnetism cannot be used to separate a mixture. Evaluate how the properties of the materials cause this problem.
Quiz me
Complete the Quiz me to check how well you’ve mastered the learning intentions and to be assigned a worksheet at your level.
By the end of this topic, you will be able to:
• Describe the processes of filtration, sieving and centrifuging.
• Explain how the size and mass of molecules of a substance relate to methods used to separate them from mixtures.
Video 3.4
Separation techniques (filter paper)
fi ltering a technique used to separate different-sized particles in a mixture depending on the size of the holes in the fi lter used sieving a separation technique based on the difference in particle size
• Large particles (residue) can be separated from liquids (filtrate) by filtering.
• Heavy particles can be separated from light particles by using a centrifuge.
Anyone who has cooked pasta will probably have used a colander to separate the boiling water from the cooked pasta. The holes in the colander are designed to let the water through but not the cooked pasta.
Filters have a series of holes in them that let through small things but trap larger particles. A grate on a stormwater drain is an example of a fi lter. The grate lets the water through while fi ltering out the leaf matter and rubbish. Flyscreens on windows and doors fi lter bugs and some dust from the air, and tea bags fi lter the leaves from the liquid (Figure 1).
Filtering separates solids from liquids (or solutions) as the particles of the solution or liquid are smaller than the size of the holes in the fi lter paper (Figure 2). The fi ltrate passes through the fi lter and the residue is left behind in the fi lter.
Sieving , on the other hand, separates solids according to the size of their particles (Figure 3). When you use a sieve, anything that is smaller than the hole can pass through and the larger solids are left behind in the sieve. Sieves can separate solids of different sizes.
Glass funnel Solid residue
Filter paper
Filtrate
Figure 2 Filters are used in science to separate substances. Particles that pass through the filter are called the filtrate. The filter paper traps the residue.
Filter paper has holes that are too small to see. Solutions can flow through the fi lter paper because the particles in the solution are small enough to fit through the holes; however, most solid particles in suspensions are not. Different fi lter papers come with differentsized holes. Coffee fi lters and the fi lters found in vacuum cleaner bags are both made of paper fi lters. High-efficiency particle arrestance (HEPA) fi lters are used in vacuum cleaners, air conditioners and face masks to remove even tiny dust particles.
Figure 1 Tea bags are a common household filter.

Figure 3 Sieves can be used to separate solids of different sizes, such as gravel and sand.
No part of this publication may be reproduced, stored in a retrieval system or transmitted in any form or by any means.
3.4A: Filtering a mixture of sand and water Go to page 207 SKILLS LAB
Sometimes fi lters remove substances using chemicals rather than by physically stopping them. Gas masks often contain a special type of charcoal that attracts and holds onto some poisonous gases (Figure 4).

3.4B: What if you centrifuge tomato sauce? Go to page 208
Centrifuging separates light and heavy particles by spinning a mixture. A centrifuge is a machine that spins very quickly. In a laboratory, small test tubes of mixtures are fi xed to the inside of the bowl of the centrifuge. The spinning motion causes the heavier particles to move to the bottom of the tubes.
Centrifuges are used in medical research and at blood banks. When blood is spun in a centrifuge, the red blood cells, which are heavier, sink to the bottom of the test tube, leaving the yellowish liquid part of blood (plasma and platelets) at the top (Figure 5). Medical professionals use different parts of blood depending on the medical need.
Centrifuges are used in dairy processing factories to separate cream from milk. Salad spinners and washing machines also use this principle (Figure 6).
Sometimes mixtures do not separate well using sedimentation because the particles are not dense enough. Sometimes things need to be separated using their weight.
Some playgrounds have equipment that spins around very fast. When you spin very fast on this equipment, you can feel a force pulling you towards the outside of the spin. Heavy objects feel the pull more than light objects.

Figure 6 A spinning washing machine is a centrifuge, separating water from the clothes.
centrifuging a technique used to separate light and heavy particles by rapidly spinning the mixture
Figure 5 When blood (right) is separated by a centrifuge, the red blood cells collect at the bottom of the tube and the less dense liquid, the plasma and platelets, collects at the top (left).

1Recall the missing words and use them to complete the sentences below. Filtering is like using a _______________. The _______________ lumps are caught in the sieve, and the _______________ goes through the _______________ paper. The substance caught in the _______________ paper is called the _______________. The substance that passes through is called the _______________.
2Name two places where centrifuges are used.
Analyse
3Identify the fi lters used around your home and school. Identify the substances that these fi lters allow to pass through them and the substances they collect.
4Contrast (the differences between) each of the following pairs. a mixture – pure substance b sedimentation – flotation c residue – fi ltrate
5Discuss why a forensic scientist, who was investigating a crime, would want to compare a mixture of different types of sand found in a suspect’s car with a similar mixture found at the crime scene.
6 In traditional times, the Gunditjmara people of Southwest Victoria used honeysuckle cones from banksia trees as fi ltration straws. The straws allowed them to separate clean water from muddy pools. Justify why this is an example of a fi lter. (HINT: Compare how a fi lter works with how the honeysuckle cones work.)
Complete the Quiz me to check how well you’ve mastered the learning intentions and to be assigned a worksheet at your level. No part of this publication
By the end of this topic, you will be able to:
• Describe the processes of evaporation, distillation and crystallisation.
• Explain how different boiling points can be used to separate mixtures.
• The different particles in a mixture will often have different boiling points.
• The substance with the lowest boiling point will evaporate first.
• When a solvent evaporates, it will leave behind crystallised solute.
• If the evaporated solvent is cooled it will condense into a liquid in a process called distillation.
When water in a saucepan is heated, it will quickly start to boil. This means the liquid evaporates: it becomes a gas. Every substance has a different volatility. This means they evaporate at different temperatures. Table 1 shows the boiling points of some common liquids.
The different boiling points of liquids can be used to separate them in a mixture. A mixture of water and turpentine can be easily separated because the water will evaporate first. This means the water will become a gas (water vapour) and move away from the turpentine. Eventually only turpentine will be left behind.
What if we want to keep the substance that has the lowest boiling point? Collecting drinkable water from sea water is difficult if all the water evaporates into the air. Distillation is a way of collecting the gas that evaporates from a m ixture and cooling it down so that it becomes a liquid again (Figures 2 and 3). This cooling down of a gas into a liquid is cal led condensation.
Figure 1 Water will evaporate from a mixture of salt and water, leaving behind salt crystals.

crystallisation a separation technique used with evaporation to remove a dissolved solid from a liquid; after the liquid has been evaporated the solid remains, often in the form of small crystals
distillation a technique that uses evaporation and condensation to separate a solid from the solvent in which it has dissolved
Evaporation can also be used to separate the parts of a solution. Salt evaporates at 1414°C. When a mixture of salt and water is heated, the water evaporates first, leaving behind the salt crystals (Figure 1). This process of evaporating the solvent (the water) and leaving behind the solute (salt) is called crystallisation.
Liquid Boiling point (°C)
Water 100 Alcohol 78
Petrol 95 Olive oil 300 Tar 30 Turpentine 160
Figure 2 Whisky production uses distillation.

Distillation was a process used by many First Nations Australians to separate the medicinal oils from eucalyptus plants (Figure 4). When the leaves are placed over a fi re, the heat causes the leaves to break apart and the water and eucalyptus oil to be released into the air. If someone is sick, they might lean over the steam to breathe in the oil. This could ease their breathing. If the steam is collected, it will contain a mixture of oil and water which can be separated in a slower distillation process that uses the different boiling points of the two liquids.
Figure 4 Eucalyptus oil was distilled from eucalyptus leaves by First Nations Australians to use as a medicine.

Figure 3 Equipment set-up for distillation
1Recall the difference between evaporation and crystallisation.
Comprehend
2Identify an example of a mixture that could be separated by evaporation and crystallisation. Explain why distillation may not be appropriate.
3 Alcohol boils at 78°C, while water boils at 100°C. In a mixture of alcohol and water, explain which liquid would be the fi rst collected through distillation. (HINT: The word ‘explain’ means you need to provide a reason why.)

4Identify the separation technique that is being conducted in Figure 5. Apply
5Create a scientific diagram of the equipment set-up that could be used to produce pure water from sea water by distillation.
6Propose how you would answer question 5 without using the science equipment found in a laboratory.
Quiz me
Complete the Quiz me to check how well you’ve mastered the learning intentions and to be assigned a worksheet at your level.
No part of this publication may be reproduced, stored in a retrieval system or transmitted in any form or by any means.
By the end of this topic, you will be able to:
• Describe the process of chromatography.
• Explain how the solubility of a substance can be used to separate it from a mixture.
• Some substances are able to dissolve more easily in solvents than others.
• Chromatography can be used to separate mixtures of substances that have different solubilities.

Video 3.6
Separating mixtures
solubility how easily a substance dissolves in a solvent
chromatography a technique used to separate substances according to their differing solubilities
Another property that can differ between substances is solubility. Solubility describes how easily a substance dissolves in a solvent. Some dyes have a higher solubility than others. This can be used to separate them from one another. Many dyes are small particles that are suspended in a solvent. They are usually made from plants or minerals. The Ancient Greeks made a mixture of soot and vegetable gum that could be used for writing. One thousand years later, the Chinese made red ink from mercury sulfide and black ink from iron sulfate mixed with sumac tree sap. Today, many of the inks in textas are made of a mixture of these dyes. We can separate these dye mixtures because the dyes have different solubilities.
Paper chromatography is a common way to separate a mixture. Chromatography works when the end of an absorbent paper is dipped in water, allowing the water to slowly move

up the paper. As the water moves past the dye mixture, the most soluble dye dissolves fi rst and starts to move with the water. The other dyes in the mixture take longer to dissolve. Eventually the next dye forms a solution and starts moving towards the top of the paper. Finally, the paper has a series of smudged dye colours running up to the top (Figure 1). The coloured dye that is the most soluble is at the top, whereas the dye that is least soluble is at the bottom.
More complex and sensitive chromatography instruments are used to separate mixtures, such as drinks and polluted air. Science laboratories often have chromatography equipment that can be used to detect 1 g of a substance in thousands of litres of solution even if it is mixed with many other substances. Scientists use chromatography to fi nd out what substances are in a mixture. Chromatography works because different substances move through the chromatography equipment at
page 210
102030405060708090100110 Time (s)
Airport security also tests for illegal drugs. A piece of chromatography paper is wiped over a person or their bag and then inserted into a machine (Figure 4). A gas is pushed through the paper. If the drug is soluble in the gas, it will dissolve and be detected by the sensors.

3.6 Check your learning Pentanol
1Name the substances that were used to make the fi rst inks.
2Recall the solvent that is used in the chromatography for drugs at airports.
3Define the term ‘solubility’.
Comprehend
4Explain how chromatography can be used to separate inks and dyes.
Apply 6 Some people think they can disguise drugs at airports by putting them in a strong-smelling substance, such as coffee beans. Discuss why this will not work with airport security that uses chromatography. Butanol

Hexanol 120130140150160170180190200
Figure 5 Some people try to use strong-smelling coffee beans to disguise drugs at airports. DRAFT
Quiz me Complete the Quiz me to check how well you’ve mastered the learning intentions and to be assigned a worksheet at your level.
No part of this publication may be reproduced, stored in a retrieval system or transmitted in any form or by any means.
By the end of this topic, you will be able to: • Describe the separation processes involved in water treatment.
Washing dishes or using the bathroom produces wastewater containing a mixture of vegetable matter, paper, cloth and plastics. This cannot be released directly into waterways without harming the environment. Scientists use their knowledge of separating mixtures to make the water safe.
Initially, the wastewater is filtered to remove any large products.


Aluminium sulfate is added to the wastewater to encourage any remaining suspended particles to coagulate (or clump together). This process is called flocculation (Figure 2).

The small clumps are then left to sit in sediment ponds to allow the clumps to form a sediment on the bottom of the pond. This sediment is called sludge, and can be removed and disinfected. Many industries use the sludge as fertiliser or to manufacture biofuels.
Figure
Many unusual things have been found at wastewater treatment plants, including BMX bikes, toys, false teeth and even money. One of the biggest problems currently is caused by the small stickers found on fruit. If eaten accidentally, the small plastic stickers pass through the digestive system and end up at the water treatment plants.
The remaining wastewater often contains levels of nutrients, such as nitrogen and phosphorus, that would be harmful to rivers or the ocean. When these nutrients enter waterways in large amounts, algae feed off them and grow into large blooms (Figure 3). The large numbers of algae use all the oxygen and nutrients in the water, leaving other aquatic life to starve. Secondary waste treatment pumps the wastewater through a series of tanks where bacteria remove the excess nutrients from the water.
Sometimes the water will be treated at a tertiary treatment plant, as shown in Figure 4. Once again, the water is filtered to remove any particles that may be left in the water. Chlorine can be added (just as in a swimming pool) to kill any bacteria that may still be in the water.
Scientists often gather data from the water treatment plants to help them understand how water is used, as well as the health of the population. Recording, processing and analysing data are essential skills in science.

1 Water use is often an indication of the amount of wastewater produced per person every year. A graph of the annual water consumption per person in Australian cities is shown in Figure 6.
a Identify the city that uses the highest amount of water per person each year.
b Identify the city that uses the lowest amount of water per person each year.
c Identify the amount of water that the average person in Canberra uses in a year.
d Describe one reason why a person living in Brisbane might use more water than a person living in Melbourne.
2 Seqwater, the water supply authority in South East Queensland, encourages locals to try to save 3 L of water per day.
a Use Figure 7 to identify the month that residents in South East Queensland used the most water.
b Identify the month that residents in South East Queensland used the least water.
c The number of people (population) of South East Queensland has continued to increase for each of the years shown on the graph in Figure 7. Use this information to decide whether South East Queenslanders have become more or less efficient with their water usage between December 2012 and March 2020.
3 The more water that is used by people living in Brisbane, the greater the amount of sewage that needs to be treated. Create a poster that encourages the people in your house to use less water in their everyday activities. (HINT: Use the communication skills you learnt in Chapter 1.)
A materials recovery facility uses the properties of the items in a recycling bin to separate them so that they can be reused. The items are separated by mass, colour and magnetic properties. Recycling of rubbish saves electricity and water, and reduces the amount of greenhouse gases that would be released by landfill.

Have you ever wondered what happens to the rubbish in the recycling bins collected by your local council? Most households put their paper, cardboard, glass bottles, cans and recyclable plastics into a separate rubbish bin. These items are collected by a different truck from the general rubbish trucks. Instead of going to landfill, these different trucks take the recyclable rubbish to a materials recovery facility (MRF). As the name suggests, this facility separates the mixture of rubbish before sending it off to be recycled.
At the materials recovery facility, the truck unloads the recycled rubbish onto a conveyer belt. The conveyer belt carries the rubbish into the facility before allowing the rubbish to drop onto a slight incline belt. Paper, cardboard and other light rubbish stay on the incline belt and are carried up and along to where they are sorted by hand (Figure 1). People separate the paper from the plastic bags, placing each into their special bins for recycling.

Heavier objects, such as larger plastic containers, aluminium and tin cans, fall backwards off the incline conveyer belt onto another moving belt. This conveyer belt uses a large magnet to separate the steel and tin cans into a large bin. Aluminium cans are not attracted to the magnet and remain mixed with the larger glass and plastic containers.
The aluminium cans, glass and plastics are exposed to a special eddy current separator. This separator pushes the aluminium cans away so that the cans fall further than the glass and plastic bottles (Figure 2).
The conveyer belt carries the remaining glass and plastic bottles forward over a pit. The heavier glass containers fall faster and are collected in a bin. The lighter plastic containers are caught by the last conveyer belt and are separated on the basis of colour. A light scans each plastic container for the type of plastic. Each type of recycled plastic is a different colour. Each colour plastic receives a different blast of air that projects it into the correct bin.
The recycled glass is crushed into a ‘cullet’ and heated to 1500°C until it is liquid/molten. The molten glass is then poured into a mould to form new bottles. The energy saved from recycling one glass bottle will run a 100 watt light globe for four hours. Aluminium cans are recycled in a similar manner. Each aluminium can that is recycled will create enough electricity to run a television for three hours. Recycling 1 t of paper and cardboard will save 13 trees.

Ethics is the study of making decisions based on what is thought to be right and what is thought to be wrong. Each person will often make different ethical decisions based on what they consider is the right thing to do. Their opinions are often affected by the information (or science communication) provided by local councils or discussions with their neighbours. For example, many people think throwing rubbish away to be buried in a landfi ll site is wrong. They may be able to communicate their opinion effectively to their neighbour, encouraging their neighbour to recycle their rubbish.
1 Describe a possible reason why some people see burying rubbish in landfi ll as wrong.
2 Suggest why someone might place an aluminium drink can in a rubbish bin that is taken to landfi ll.

3 Is it better to place the aluminium can in the rubbish bin or drop the aluminium can on the ground? Explain why you made this decision.
4 Suggest an alternative decision that could be made by the person so that the aluminium can did not go to landfi ll. Would you make this decision? Explain why or why not.
5 Someone places a non-recyclable wrapper in the recycling bin. Discuss whether it is better or worse to do this or drop the wrapper on the ground.
6 Split your class into five groups. Each group should work together to try to: a describe what is happening at one of the labelled stages of the recycling plant in Figure 5 b describe how this process may be impacted based on your answers to questions 2 and 5.

1 A tablet is dissolved in a glass of water. Identify the solvent in the scenario.
A The tablet
B The water
C The glass
D The tablet and water combined
2Identify the physical property that allows mixtures to be separated by decanting or sedimentation.
A Boiling point
B Magnetism
C Density
D Compressibility
3Identify the separation technique that can be used to separate materials with different solubilities.
A Evaporation
B Distillation
C Magnetic separation
D Chromatography
4aRecall the separation technique that is used to separate the parts of blood.
bIdentify the physical property that is being used to separate this mixture.
5Identify the property used to separate substances through centrifuging.
6Define the term ‘flocculation’.
7 Nail polish remover and paint stripper are both useful solvents.
aDefine the term ‘solvent’.
bIdentify the solute for nail polish remover and paint stripper.
8Describe an example of a mixture that could be separated into its parts by filtration.
9Explain two safety recommendations that you would give to someone using evaporation and crystallisation.
10 Imagine dropping salt in sawdust. Explain how you would separate the parts of this mixture, using the particle model.
11 A criminal buries an aluminium drink can containing DNA evidence in the sand. Explain whether the aluminium could be separated from the sand using a magnet.
12Describe each of the processes involved in the primary, secondary and tertiary treatment of wastewater.
13 Daniel was measuring the solubility of two chemicals (A and B) in water. He placed a spatula full of each substance in separate test tubes of water. Figure 1 shows what he saw.
Use the terms ‘dissolve’, ‘solvent’, ‘solute’ and ‘suspension’ to explain what has happened.
14 Imagine that you have just bought a large factory. Due to flood damage, it is filled with tonnes of matchsticks mixed with tonnes of iron scraps. aDescribe how you would separate this mixture. bList the equipment you would need to make this happen on such a large scale.
15 A particular coloured dye is being created for Fashion Week. a Look at the chromatogram of the dye mixture in Figure 2. Identify how many pure dyes were mixed to create the colour. bIdentify the colour of the pure dye that is the most soluble.
Figure 2 Chromatogram of a dye mixture
16 The Alyawarre, Anmatyerre, Warlpiri and Pitjantjatjara peoples in the desert parts of the Northern Territory use their fingers to separate desert raisins from rotten fruit. Describe a situation where you would use the same separation technique.

17 Examine Figure 4 and identify the suspension, the solution and the colloid.
21 Examine the chromatograms in Figure 6, taken from blue pens belonging to suspects (A–D). Compare these with the one taken from the original forged cheque (X). Decide whether any of the suspects is likely to be the culprit.
18Contrast evaporation and distillation.
19Compare the use of decanting and filtration to separate mixtures. Identify examples of situations where you would use one over the other.
20Compare a solution of salt dissolved in water, a suspension of muddy water, and a colloid mixture of milk in water. a b c


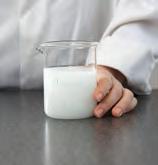
22 Do you think that performance-enhancing drugs are spoiling the image of sports? Pair up with a partner and make a list of all the advantages and disadvantages of athletes using these drugs to compete. Use your list to create and justify an argument for or against drug testing competing athletes.
23List the techniques in the order that you could use them to separate a mixture of iron fillings, sand, marbles and salt. Create a flow chart to present your answer.
24 People sometimes need to enter environments containing poisonous gases. In these situations, they will wear gas masks. Use the internet or other research tools to find out how gas masks interact with poisonous gases and how they change the air before it is inhaled by the person wearing the mask. Create a poster to show how the gas masks make the air safe to breathe.
25 Until recently, Australia would ship all their plastic waste to other countries to be processed. This is no longer possible, because most countries are refusing to accept the waste. Discuss and suggest reasons why Australia did not previously process their own plastic waste.
26 Choose one of the following topics to research working with mixtures.
Research a separation technique that is used in a different industry or in nature.
» Prepare a ‘SWOT’ analysis as part of your report, listing the strengths, weaknesses, opportunities and threats of the separation technique that you choose to research.
» You could present your report with a series of photographs of the technique.
Certain types of whales, known as baleen whales, have a filter in their mouth made of a bone-like substance called baleen.

» Identify what these whales eat.
» Desc ribe the balleen and how it filters the food.
» Desc ribe the bubble-net feeding behaviour used by the whales.
» Inve stigate how these whales are different from other filter-feeders, such as barnacles, sponges and flamingos.
Imagine that you were hiking in central Australia, became separated from your group and then ran out of drinking water.
» Desc ribe the way First Nations peoples might obtain drinking water in the desert environment.
» Desc ribe how you could turn stagnant or polluted water from a waterhole into drinkable water.
» Desc ribe how you could use your knowledge of separating mixtures to obtain drinkable water if you were isolated near the sea coast.

The human body needs to control what goes into it and what comes out. In particular, the filtering system of the kidneys prevents us from being poisoned by our own wastes, and tiny hairs in our noses filter dust and germs as we breathe.
» Select one of these filtration systems.
» Desc ribe the structure of the system that does the filtering.
» Desc ribe what the system filters.
» Expl ain why it is important to use the filtering system to remove the particles.
» Desc ribe what would happen if these body filtering systems did not work.
As our population grows, new suburbs are being built on the outskirts of cities. In some of these new suburbs, several features have been included to keep the water and air clean.
» Find out about strategies that are used to purify water and the air in housing estates.
Now that you have completed this chapter, reflect on your ability to do the following.
I can do this.
• Describe the properties of various mixtures, including solutions, suspensions, colloids and emulsions.
• Contrast the terms ‘soluble’ and ‘insoluble’, ‘solute’ and ‘solvent’, and ‘concentrated’ and ‘dilute’.
• Describe the properties of a saturated solution.
• Explain the importance of water as a solvent.
• Describe the processes of decanting, sedimentation, flotation and magnetic separation.
• Define sediment, magnetism and flocculant.
• Explain how the properties of a substance can be used to separate them from a mixture.
• Describe the processes of filtration, sieving and centrifuging.
• Explain how the size and mass of molecules of a substance relate to methods used to separate them from mixtures.
• Describe the processes of evaporation, distillation and crystallisation.
• Explain how different boiling points can be used to separate mixtures.
• Describe the process of chromatography.
• Explain how the solubility of a substance can be used to separate it from a mixture.
• Describe the separation processes involved in water treatment.
• Describe the separation processes involved in recycling at a materials recovery facility.
I cannot do this yet.
Go back to Topic 3.1 ‘Mixtures are a combination of two or more substances’.
Page 62
Go back to Topic 3.2 ‘A solution is a solute dissolved in a solvent’.
Page 64
Go back to Topic 3.3 ‘Mixtures can be separated according to their properties’.
Page 66
Go back to Topic 3.4 ‘Mixtures can be separated according to their size and mass’.
Page 68
Go back to Topic 3.5 ‘The boiling points of liquids can be used to separate mixtures’.
Page 70
Go back to Topic 3.6 ‘Solubility can be used to separate mixtures’.
Page 72
Go back to Topic 3.7 ‘Science as a human endeavour: Wastewater is a mixture that can be separated’.
Page 74
Go back to Topic 3.8 ‘Science as a human endeavour: Materials recovery facilities separate mixtures’.
Page 76

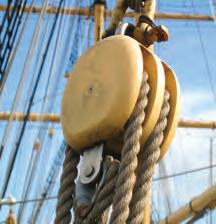

By the end of this topic, you will be able to:
• Explain why a measuring device must be calibrated.


• Provide examples of forces in reallife situations.
gravity the force of attraction between objects due to their masses

• A force is a push or pull that happens when two objects interact.
• The effect of a force can be measured.

• Gravity affects the movement of objects on Earth.
Forces act on everything around us all the time. Usually, more than one force is acting on an object at one time, but often we do not notice them. You have many forces acting on you at the moment. Gravity is pulling you towards the centre of the Earth. The chair you are sitting on is pushing back against you, changing the shape of your leg muscles. Because the forces acting on you are in balance (the same strength), you do not move. You sit still on the chair.

When you kick or throw a ball, you use energy to generate a push force. This force causes the ball to move (Figure 1). When you catch a ball, you still give it a push. This time, the push force causes the ball to stop moving.
Forces act on everything around us all the time. Forces cause objects to: > begin to move > speed up
Figure 2 Spring balances are used to measure force.
spring balance

a device consisting of a spring and a scale, used to measure forces calibrate check the accuracy of a meter or measuring device against known measurements newton the unit used to measure force; symbol N
> slow down or stop moving > change direction > change shape > spin
> remain still.
Examples of these forces are shown in Figures 3–9.
One way to ‘see’ a force at work is to measure it. In the kitchen, cooks use scales to measure how much the Earth’s gravity pulls on the ingredients. Twenty grams of flour is pulled to the centre of the Earth, causing the flour to push down on the scales. In the laboratory, force is measured using a spring balance (Figure 2). A stiff spring in the balance stretches when an object pulls on it. This moves the marker so that the amount of force can be measured. A rubber band can measure the size of forces in a similar way to a spring balance.
4.1: Measuring forces
to


Figure


3 Begins


Figure 4 Speeds up When skateboarders want to move faster, they use their feet to exert a force on the ground.
Figure 5 Slows down The brakes on this bicycle wheel push down on the rotor of the wheel, causing the wheel to slow down. This in turn brings the


bicycle to a stop. The
Figure 9 Remains still gravity pulling down on the pot plant and the weight of air above it are in balance with the force of the ground pushing up on the pot.

Figure 7

4.1 Check your learning

Retrieve

2Recall seven things that forces can do.
3State the unit used when measuring a force.
4Name the person whom the unit of force is named after.
Comprehend

5Describe how force can be measured.
6 Use an example to describe how you can see the effects of a force, but not see the force.
The hand turns the knob to open the door.
7 Many measuring instruments have to be calibrated. Use an example to explain why calibration of equipment is important. ( HINT: Describe the consequences of not calibrating the equipment and how this would affect the results of an experiment.)
Analyse
a a truck hitting a pole b a rocket being launched c typing one letter on a computer keyboard
d kicking a soccer ball e pushing a car along the street
Apply
DRAFT
Complete the Quiz me to check how well you’ve mastered the learning intentions and to be assigned a worksheet at your level.
By the end of this topic, you will be able to:
• Identify balanced and unbalanced forces.
• Describe how force diagrams can represent forces in a situation.
• Forces are balanced when they are pushing or pulling equally in opposite directions.
• If the forces on an object are unbalanced, then the object will change its speed, direction or shape.
Balanced forces are very important. Pushing on a brick wall does not usually cause the brick wall to move. This does not mean your push force did not exist. This is because the forces are balanced. If the forces of the two people in Figure 1 balance each other, then there is no movement. The people are pushing or pulling with equal and opposite forces.
Unbalanced forces are also very important. Consider the forces acting on the barbell in Figure 2. The barbell stays up in the air at a particular height because the forces acting on it are in balance. The weightlifter is pushing the barbell up with exactly the same amount of force as the Earth is pulling down due to gravity. To move the barbell up, the weightlifter must use a force stronger than the Earth’s pull. This will make the forces on the barbell unbalanced.
balanced forces
Figure 2 A weightlifter applies a force to lift the barbell.

Consider a soccer ball rolling towards the goal. If the goalkeeper kicks it away, then the ball will change direction because the goalkeeper’s kick unbalanced the forces.
Figure 1 Forces can balance each other.
two forces equal in size and opposite in direction

unbalanced forces describes two or more forces that are unequal in size and direction and therefore change an object's speed, direction or shape
• Calculate net force. No
There are three ways you can tell if a force is unbalanced. Forces are unbalanced if there is a change in the speed, direction or shape of an object. If a ball is resting on the ground, then all the forces acting on it are balanced. If two people are pushing equally in opposite directions on a stationary object, then the forces are balanced and the object does not move. If one person starts pushing harder, then the object will start to move. There is a change in motion because the forces are unbalanced.
Force diagrams can be represented using an arrow. A short arrow shows a weak force and a long arrow shows a strong force. The direction of the arrow shows the direction of the force. Figure 3 shows a tug-of-war between two teams. The arrows show the pull force they are exerting on the rope. One team is much stronger than the other team. Which team will win? What evidence will you see in real life that this team is stronger?
If you tried to lift a heavy object such as a piano, you would not succeed because the upward force you exert on the piano would be too weak. But if a few of your friends helped you by also adding their force to yours, the combined upward forces would be stronger than the downward pull of the Earth. The net force is the combination of all the forces acting on the piano. If the piano is lifted up, the forces are unbalanced and the net force on the piano is upward.
If an object is stationary (not moving) or moving at a constant speed in the same direction, then the net force acting on that object is zero. All the forces are balanced. If an object changes its speed (by speeding up or slowing down), shape or direction, then a net unbalanced force must be acting on it. Worked example 4.2 shows how to calculate net force.
1Describe the evidence that shows the forces acting on the objects are unbalanced in the following situations. a pushing down the lever on a toaster b jumping on a trampoline c a car starts moving
2Explain why a brick wall does not fall over when you push against it. Explain why a bulldozer could push the wall over.
3Explain why weightlifters get tired when they hold heavy masses in the air.
4 Draw two people having a tug-of-war. Give them names and draw arrows to show the different forces they are exerting on the rope. Explain who will win.


Khan and Kim were moving a table tennis table for their parents. Khan pushed the table with a force of 200 newtons, while Kim pushed with a force of 150 newtons.
a Calculate the net force if both Khan and Kim pushed in the same direction (left).
b Calculate the net force if Khan pushed to the left and Kim pushed to the right.
a If both forces are in the same direction (left), they will add together.
Net force = 200 N + 150 N = 350 N
The net force is 350 newtons to the left.
Note: Always mention the direction of the net force.
b If both forces are in opposite directions, then they will be subtracted from one another.
Net force = 200 N (left) – 150 N (right) = 50 N (left)
The net force is 50 newtons to the left.
net force the vector sum of all the forces acting on an object; also known as resultant force
5Identify one example for each of the following.
a Forces that are balanced (net force = 0)
b Forces that add together to make an object fall
6 Sally pushes with a force of 150 newtons and Marilla pushes with a force of 200 newtons.
aCalculate the net force if both forces are in the same direction.
bCalculate the net force if they push in opposite directions. Identify who will win.
Quiz me
Complete the Quiz me to check how well you’ve mastered the learning intentions and to be assigned a worksheet at your level.
Figure 3 When forces are unbalanced, a change in motion will occur, with the greatest force ‘winning’. In a game of tug-of-war, if one team pulls with a force of 200 N to the left and the other team pulls with a force of 100 N to the right, the net force is 100 N to the left. The team on the left will win the game because both teams will move that way. Unbalanced forces lead to a movement in the direction of the greater force.


By the end of this topic, you will be able to:
• Define and provide examples of contact forces and non-contact forces.
• Contact forces involve two objects touching each other.
• Non-contact forces occur when one object is able to push or pull another without touching the other.
• Magnetism is an example of a non-contact force.
All forces occur between two or more objects. These objects can be living or non-living.
attraction force the force that attracts one object to another
unlike poles the north and south poles of a magnet
Some forces make objects move because of a direct push or pull. For example, if you push a pencil with your fi nger the pencil moves. Your fi nger has to touch the pencil or be in contact before the pencil will move. This is called a contact force


This is called an attraction force (Figure 2). The two unlike poles (a north and a south) attract each other. Magicians use this attraction force to slide something along a table. You can do this too. Place one magnet on top of a thin table and a second magnet under the table. Can you make the top magnet move? Can you see the pull force? Are the two magnets contacting each other?
non-contact force a force acting between two bodies that are not in direct contact
like poles two north poles or two south poles of a magnet
repulsion force a force that pushes one object away from another
contact force a force acting between two bodies in direct contact magnetic poles (here) the north and south ends of a magnet
Some forces cause movement without touching. These are called non-contact forces. An example of this is the force of attraction between a magnet and a metal paperclip (Figure 1). When a magnet is held near a metal paperclip, the paperclip is pulled towards the magnet. There is no touching, or contact.
Magnets are made of an alloy (a mixture of metals) that is mostly iron. The bar magnets used most commonly in schools are usually made of the alloy alnico, which is iron mixed with aluminium, nickel and cobalt. New, strong magnets are made from metals known as ‘rare earth’ metals. These are much stronger than normal magnets and do not lose their magnetism.
One end of a magnet is labelled ‘N’ for north and the other end ‘S’ for south. If you hang a bar magnet from its centre by a piece of string, the north end will swing to point north. The magnet is said to have two magnetic poles – north and south.
When the north pole of one magnet is placed near the south pole of another magnet, the two magnets are pulled to each other.
When two like poles (two north poles or two south poles) are placed together, they push each other apart. You can use one magnet to push another magnet along a table. This is called a repulsion force (Figure 3). The two magnets do not need to touch to be affected by the repulsion force. It is a non-contact force.
Figure 1 The attraction between the paperclip and the magnet is a non-contact force.
Figure 2 The north pole of one magnet is pulled by the south pole of another magnet.
Like
Figure 3 poles push away from/repel each other.
4.3: Can you use the push and pull of a magnet? Go to page 214
An iron needle can be made into a magnet by sliding a strong magnet along one side of it (in one direction only). The strong magnet pulls tiny groups of particles so that they all line up in one direction. Each time you stroke the needle, these particles line up. This causes larger sections of the magnet called domains to point in the same direction. When most of the domains are pointing the same way, they can pull or attract a metal pin. Dropping the needle can cause the domains to become mixed up again.
Strongly magnetic Non-magnetic
Some magnets never lose their magnetic force. These magnets are called permanent magnets. The domains in these magnets are often arranged while the metal is still buried deep under the ground. Breaking these magnets in half does not change the arrangement of the domains. The two halves become smaller magnets with the same pull or push forces as the larger magnet (Figure 5).
domain a small section of a magnet where the magnetic field of all the atoms is aligned in the same direction
Weakly magnetic SN
Figure 4 The magnetic domain theory
Figure 5 When a magnet is broken, it forms two magnets. Retrieve
One magnetic domain
The push forces of magnets are used in the design of Maglev (magnetic levitation) trains (Figure 6). A series of electronic magnets on the train and track suspend the train above the tracks. The magnets on the train and the track have like poles, causing them to push away from each other and for the train to sit above the track. There is no contact between the train and the metal track. To make the train move, the driver changes the pole of the train magnet, and the track magnet pushes the train magnet forward.
Figure 6 Repulsive magnetic forces cause this Maglev train to move.

4.3 Check your learning Figure 7 Spelling out your name using magnets
1Name three places where you might fi nd a magnet. Comprehend
2Identify a magnetic force as either a contact or a noncontact force. Explain your answer.
3Explain why one part of a magnet is called the north.
4Describe what will happen when the following poles of two magnets are pushed close together.
a N and S c S and S b N and N d S and N Apply
5 Draw how you might arrange bar magnets to create the letters of your name. Label the north and south poles of the magnets.
6Propose how you might levitate a magnetic skateboard above a large magnet on the ground. Mention the arrangement of the poles of the magnet in your description.
Quiz me
Complete the Quiz me to check how well you’ve mastered the learning intentions and to be assigned a worksheet at your level.
By the end of this topic, you will be able to:
• Describe the natural magnetic field of the Earth.
• Provide examples of how magnetism is used in real-life situations.
• A magnetic field is the area around a magnet where a magnetic force is experienced.


• A magnetic field cannot be seen, but we can see the way it interacts with other objects.
• The further away an object moves from the magnet, the weaker the field.
A compass needle is a weak magnet. When a compass is placed near a strong magnet, the compass needle points in the direction of the field. You can see this by moving a compass around the sides and ends of a bar magnet. The north pole of a compass always points to the south pole of a magnet.
a b c magnetic pole the north and south ends of a magnet; (here) each of the points near the extremities of the axis of rotation of the Earth or another body where a magnetic needle dips vertically
Figure 1 Magnetic fields: a around a single bar magnet; b between two attracting bar magnets; c between two repelling magnets
Iron fi lings and iron powder are tiny bits of iron. If you put them near a strong magnet, they become temporary magnets. They line up like tiny compass needles around the strong magnet. You can draw this pattern and make a map of the magnetic fi eld. Figure 1 shows the magnetic fi elds around one and two bar magnets.
There is a large magnetic fi eld around the Earth. A compass needle will line up with the Earth’s magnetic fi eld. The part of the compass needle with the ‘N’ on it points to the north magnetic pole of the Earth. It is important to note that the ‘geographic’ North Pole of the Earth is not the same as the magnetic north pole. They are both in the Arctic Circle but hundreds of kilometres apart.
The North Pole, also known as the geographic North or true North Pole, is the northernmost point of Earth. If you tunnelled through the Earth from the North Pole in a straight line, you would come out the other side at the South Pole. The magnetic north pole is quite different. The magnetic north pole is not a fi xed point – it moves about according to the magnetic fi eld of the Earth and has done so for hundreds of years. This movement is caused by the Earth’s magnetic fi eld.
The Earth’s magnetic field Axis of rotation Magnetic north pole S N

Geographic North Pole Magnetic south pole
Geographic South Pole
Figure 2 The Earth’s geographic poles are not in the same place as its magnetic poles.
When a turtle hatches, it crawls down the beach to the water and swims out to the brightest light on the horizon, which is usually the Moon. For the next 30 years, it will swim in the fastflowing sea currents around the world. When it is ready, the turtle is able to detect the magnetic field around the Earth. It can measure the direction of the magnetic field (just like a compass) and how strong it is. All it needs to do is follow the magnetic field back to exactly the same beach where it hatched (Figure 3). Once there, it will mate and lay eggs, completing the cycle of life once again.
The magnetic south pole does not always line up with the magnetic north pole. Figure 2 shows the different locations of the geographic North and South Poles and the magnetic north and south poles. No part of this publication may be reproduced, stored in a retrieval system or transmitted in any form or by any means.
Throughout history, the magnetic north and south poles have fl ipped upside down every now and then. The last fl ip happened 780 000 years ago. The fl ip can take a few thousand years to complete. While this happens, the poles become very disordered and a magnetic north or south pole can appear anywhere (Figure 4). How will this affect the turtles being able to fi nd their beach?
You use magnetic fi elds in your own life. The black strip on the back of a bankcard has a series of small, magnetised zones separated by demagnetised zones (Figure 5). You can see these zones if you sprinkle fi ne iron fi lings on them. The iron fi lings arrange themselves according to the magnetic fi eld surrounding the magnetic zones, which look a bit like a bar code. When the card is swiped through a card reader, the magnetic bar code is read and the person’s name, bank and account number are decoded.
The information on the black strip on a bankcard can be changed if it is put next to a strong magnet. This includes the magnetic clasps on a purse, or wallet. Some stores also attach magnetic security devices to their stock to protect against theft. They remove these using a demagnetiser near the cash register. Leaving a bankcard on a store demagnetiser will also change the magnetic strips on the card.
4.4 Check your learning
1Describe a magnetic field.

2Explain how you could map the magnetic field around a magnetic nail.
3Describe in words the shape of the magnetic field when two magnets are: a attracting b repelling.
4Describe how you could decide which magnet was stronger by looking at the magnetic fields made by different magnets.
5Explain how a compass works.
6Explain why you should never leave a library card on the demagnetising panel of a shop.

7Create a drawing of the magnetic field around a broken magnet: a that has been re-joined b with the two pieces 10 cm apart c with the two pieces 1 cm apart.

Complete the Quiz me to check how well you’ve mastered the learning intentions and to be assigned a worksheet at your level.
Figure 3 What do magnets and turtles have in common? Magnets create a magnetic field, and turtles use the magnetic field to find their way back to the same beach where they hatched.
Figure 5 The magnetic strip on a bankcard contains zones of magnetised and demagnetised areas.
By the end of this topic, you will be able to: • Define electrostatic forces and charge. • Provide examples of electrostatic forces in real-life situations.


• Rubbing two objects together can cause an electrostatic force.


• Like (two positive or two negative) charges repel.
• Unlike charges attract.
• Charged objects attract uncharged objects.
Have you ever rubbed a balloon on your hair and seen the hair cling to the balloon? This is a result of a force called an electrostatic force


When the (negatively charged) balloon moves away, the (positively charged) hair is still attracted to it. The hair lifts up and tries to cling to the balloon (Figure 1).


electrostatic force the force between two objects caused by a build-up of negative charges
When two objects rub against each other, a small electrical charge builds up. One object becomes positively (+) charged and the other becomes negatively (–) charged. These two charges act like the north and south poles of a magnet. The positively charged objects are pulled, or attracted, to the negatively charged objects. The unlike charges attract each other. Because the objects do not need to touch each other to attract, electrostatic forces are a noncontact force. Rubbing a balloon on hair causes the hair to become positively charged and the balloon to become negatively charged.
A Van de Graaff generator works in the same way as rubbing a balloon on hair. In the long shaft of the machine, two long belts rub against each other, making the rounded dome of the machine positively charged. Negative charges are attracted to the dome. If anything comes close enough to the dome, the negative charges are attracted and jump through the air. You might see this as a spark (Figure 2).
As well as negatively charged objects, uncharged objects (neither positively nor negatively charged) are also attracted to the positively charged dome. If you stand too
Figure 1 When the negatively charged balloon moves away, the positively charged hair is still attracted to it.
Figure 2 Sparks jump across to a Van de Graaff generator when negative charges come close enough.
4.5: What if a balloon was electrostatically charged? Go to page 215
close to the Van de Graaff generator, your uncharged hair might be attracted to the dome.

Anything touching the dome also becomes positively charged. The girl in Figure 3 is standing on a rubber mat so that the negative charges cannot move from the ground into the dome. This means that she becomes positively charged like the dome. Every part of her body becomes positively charged, including all her hair. Just like the forces in a magnet, the like charges in the hair repel each other. This makes the strands of the girl’s hair try to push away from one another.
The rules of electrostatic forces are:
> unlike charges attract
> charged objects attract uncharged objects
> like charges repel.
1Recall if electrostatic charges are contact or non-contact forces.
2Recall the terms that complete these statements.
a Unlike charges _______________.
b _______________ charges repel.
c Charged objects _______________ uncharged objects. Comprehend
3Describe how electrostatic forces can be created.
4Explain why the hair of a person touching a Van de Graaff machine may be standing up. Apply
5 Isaac was leaving the carpeted library to go home. When he touched the door handle, he received an electric shock. Discuss why this happened.
6 When it is about to rain, the water particles in the clouds rub against one another and electrostatic charges form. Discuss how this may cause lightning.
Complete the Quiz me to check how well you’ve mastered the learning intentions and to be assigned a worksheet at your level.
You may have experienced electrostatic forces when you were jumping on a trampoline. Every time you jump, your feet rub against the trampoline mat. This causes a charge to build up in your body. Sometimes this causes your hair to stand up because the strands are pushing away from each other. When you touch someone else, or the framework of the trampoline, you may feel the spark as the negative charges are attracted.
Electrostatic charge can build up on cars as they drive along the road. It is this charge that can cause explosions when fi lling up at a petrol station. If the driver gets out of the car without touching the metal of the car, then the car can still have the positive charges built up. It is usually safe to start fi lling up the car, but if the driver gets in and out of the car when the petrol fumes are in the air, the negative charges can be pulled between the car and the driver. This causes a spark and in rare cases could result in an explosion.
Figure 3 This girl has become positively charged, like the dome of the Van de Graaff generator that she is touching. The strands of her hair are repelling each other.
By the end of this topic, you will be able to:
• Calculate weight when given the mass of an object and gravitational force.
• Explain why the weight of an object does not affect the rate that it falls.
• Earth’s gravity can cause a non-contact force.
• Large objects (such as planets, moons and stars) pull objects towards their centre.
Video 4.6
Geomagnetism
weight a measure of the gravitational pull on an object mass the amount of matter in a substance, usually measured in kilograms; the mass of an object never changes, even in space
One day in 1665, a young student named Isaac Newton was sitting under an apple tree when an apple fell to the ground. ‘Why did it fall?’ he wondered. There was nothing he could see that could push it or pull it. He realised that there must be a force that pulled the apple towards the Earth. This is how Newton claimed he fi rst had the idea of gravity.
Gravity is the effect of a large object (such as a planet) warping space and time. This results in the large object (Earth) attracting everything nearby to its centre. This means people, animals and apples are pulled to the centre of the Earth. Consider Figure 1. If everyone in the picture dropped an object, those objects would fall towards the centre of the Earth.
Every object that is made of matter (small particles called atoms) is able to pull other things towards it. The Earth is made up of enormous amounts of matter, allowing it to exert a relatively strong non-contact force on objects around it. Even you have weak gravity surrounding you. The Earth has much more matter than you do, and therefore the Earth’s pull force is much stronger than yours (Figure 2). The more matter an object has, the stronger its pull force. Stars like our Sun have much more matter than the Earth. This means that the gravitational pull of the Sun is much stronger. It can even keep the planets from travelling off into space.
to jump much higher than on Earth. This is because the Moon does not have as strong a pull force as the Earth. Weight is a measure of the pull force on an object. Your weight on the Moon would be less than that on Earth. This does not mean you are smaller. It just means the Moon is pulling you down less. Because weight is a measure of pull force, it is measured in newtons.
If weight is a measure of the pull force, then how do scientists describe the amount of matter of an object? Mass (measured in kilograms) is the term used to describe how many particles or atoms make up an object. The mass of an object does not change, no matter where in the universe it is. If a brick has a mass of 1 kg on Earth, it has this mass everywhere. However, the weight of
Figure 1 The large mass of the Earth can pull objects to its centre.
The Moon is made of less matter than the Earth. This means that the Moon’s ability to pull objects is much less than the Earth’s. An astronaut jumping on the Moon will be able
Figure 2 The Earth pulls base jumpers towards its centre, 6371 km below.

4.6B:
Mass = 120kg Weight = 120 × 10 = 1200N
Mass = 1kg Weight = 9.8N
Mass = 1kg Weight = 1.6N
Jupiter Figure 3 The mass of a brick does not change, but its weight is affected by gravity.
Mass = 1kg Weight = 23.6N
the brick will change. On Earth, the brick may weigh 9.8 newtons, but on a large planet such as Jupiter it would weigh 23.6 newtons. On the Moon, the brick would weigh approximately 1.6 newtons because the Moon is small and has less pull force (Figure 3).
As you move away from the Earth, the pull force slowly decreases. This means that if you stand on a chair your weight will have decreased slightly. Most scales will not be sensitive enough to measure this small change. However, if you stood on the top of Mount Everest, you would be several kilometres further away from the centre of the Earth. As a result, your weight (the amount of pull force the Earth exerts on you) is 0.25 per cent less than if you were at sea level.


1Name the person who fi rst described gravity.


Comprehend
2 If a half-full water bottle was dropped from the top of a fl ight of stairs at the same time as a full bottle of water, explain which bottle would hit the ground fi rst.
Mass = 120kg Weight = 200N

Figure 4 A person who wants to lose weight could go to the Moon. A person who wants to lose mass could take their shoes off.
Gravity is not the same for every object. Objects with a larger mass experience a greater pull than objects with less mass. This means a 3 kg bowling ball feels a stronger pull force than a basketball that is lighter does. Does this mean that the bowling ball will fall faster than the basketball?
If you do this experiment, you will fi nd that both balls hit the ground at exactly the same time. This is not what most people expect to happen. Logic might suggest that heavier things fall faster. You may need to do the experiment a few times until you believe it. The heavy bowling ball needs more force to start it moving than the basketball. This offsets the larger pull, so both balls fall at the same rate and hit the ground at the same time (Figure 5).
3Identify whether the following statement is true or false. The pull of the Earth is stronger on an elephant than on a feather.
4Contrast mass and weight.
Apply
5 An astronaut on the Moon dropped a feather and a hammer at the same time. There is very little atmosphere on the Moon to slow down objects. Discuss why the feather and hammer hit the ground at the same time.


Figure 5 A bowling ball has more mass than a basketball and therefore takes more force to start it moving. The Earth pulls more on the bowling ball, causing both balls to fall at the same speed.

6 Building a settlement on the Moon has been suggested several times since Neil Armstrong fi rst walked on the Moon. Discuss the advantages and disadvantages of building such a structure in a low-gravity environment.

Quiz me
Complete the Quiz me to check how well you’ve mastered the learning intentions and to be assigned a worksheet at your level.
By the end of this topic, you will be able to: • Define and provide examples of friction, lubrication, air resistance, drag and streamlining.
a force that acts to oppose the motion between two surfaces as they move over each other
• Friction is a contact force.
• Friction (such as air resistance) slows down moving objects.
• Friction can be reduced by streamlining, lubricants or ball bearings.
It is much easier to slide along ice than along a gravel road. This is because the friction of the gravel road acts to slow the forward motion. Friction is the force that resists movement between two objects in contact. In other words, friction generally slows down moving objects.
When buying sports shoes, many people look for shoes with good grip. This grip prevents the shoe from sliding when they run and helps to avoid sliding when they stop. The grip provides friction between the ground and the wearer (Figure 1). Friction slows everything down that is moving. It acts in the opposite direction to the movement. The greater the friction, the more the movement slows down and eventually stops. Friction happens because objects rub together. When you start walking, you rely on the shoe rubbing against the ground and gripping so that you can push forward. When you try to stop, you rely on the friction between the shoe and the ground to stop your movement. Without friction, your feet would just slip over the ground. It would be like trying to walk on ice.

We can see evidence of friction in many parts of our lives. Any time a movement is slowed down, it is because of friction. Without friction, a bike would keep rolling along a road without the need to pedal. A pen or pencil would slide over a page without leaving a mark. Friction is very useful to us, but it can create problems and we often try to reduce it.
Rollers or balls are one way to reduce friction. Because the balls roll across the ground, it is much easier than being dragged along. Tiny balls are often used as bearings to allow two surfaces to slide over one another easily (Figure 2).
Figure 2 These ball bearings allow the two met al circles to move past each other with very little friction.
Hovercrafts and air pucks have low friction because they use a layer of air to glide over a surface. There is no contact between the surfaces and, as a result, almost no friction. The same idea is used in magnetic levitation (Maglev) trains, where the train carriages are held above the tracks by strong magnetic forces.

4.7:
Air resistance, or drag, is the friction between a moving object and the air it is moving through. As the object moves, it needs to push the air particles out of the way, limiting the speed of the object. Parachutes use air resistance to slow the movement of the falling people. While this is an advantage if you are sky diving, it can be a problem for cars and trucks. The greater the air resistance, the more fuel the car will use. Streamlining (making the surface smooth and rounded) helps to overcome air resistance (Figure 4).
Fish and sharks have streamlined bodies. This allows them to move through the water with the least amount of friction.
lubrication the action of applying a substance such as oil or grease to an engine or component so as to reduce friction

air resistance
friction between a moving object and the air it is moving through streamlining giving an object a form that presents the least resistance to motion
Air ows smoothly over the car
Figure 3 Oil is added to a car engine to reduce friction between engine parts.
Lubricants, such as oils and grease, also reduce friction (Figure 3). This is called lubrication. If a kitchen drawer sticks, you can use candle wax or soap as a lubricant. Lubricants work by coating the surface with an oily or greasy substance, which makes them slippery. Putting oil on bicycle chains and grease on the wheel axles makes the wheels spin more easily, with less friction.
1Identify three examples where friction is useful and three examples where friction is a problem.
Comprehend
2Explain why a penguin is streamlined, but a sea anemone is not.
3 Soft wax can have a high level of friction. Explain why surfers wax their surfboards.
4 The tread on the tyres of your bike wears down with a lot of use. Explain this in terms of force.
5 A hovercraft moves across water on a cushion of air. Describe this in terms of friction.
Analyse
6 In a world without friction, identify what would happen if you tried to: a go down a slide in a playground b play tenpin bowling c tie your shoelaces.
Apply
7 Use your knowledge of friction and air resistance to complete the hypothesis below.
If the surface area of a parachute is decreased, the parachute will because
8Identify the surface (sand, wood, or metal coated in oil) that would allow you to move fastest with the same pushing force. Justify your answer (by describing the friction of each surface and deciding which surface will allow for the fastest movement).
Quiz me
Complete the Quiz me to check how well you’ve mastered the learning intentions and to be assigned a worksheet at your level.
By the end of this topic, you will be able to:
• Compare and contrast distance magnifiers and force magnifiers.
• Provide examples of first-, secondand third-class levers.
• Calculate mechanical advantage and effort.
• A lever is a solid rod with a turning point.
• Levers provide a mechanical advantage of force or distance.
• All levers need an effort (force used), fulcrum (turning point) and a load (the section being moved).
• Levers can be divided into first-class, second-class or third-class levers.
Interactive 4.8A
Simple machines

Interactive 4.8B Types of levers
The ancient Egyptians, Romans and Greeks understood forces very well. They made simple machines that helped them to build the pyramids, fi ght wars and build cities (Figure 1). The simplest machine they used was a lever. A lever can be used to decrease the amount of effort needed to do work. You use levers every day. Scissors, pliers, brooms, shovels, wheelbarrows and can openers are all levers.

A lever is a solid rod or bar that is supported at a turning point called a fulcrum . Figure 2 shows the main features of a simple lever – a see-saw. The force used to operate a lever is called the effort , and the resisting force it overcomes is called the load . Load
lever a simple machine that reduces the effort needed to do work fulcrum the turning point of a lever effort the force used to operate a lever load (in physics) resisting force
a b
Effort Fulcrum
Figure 2 a A lever has three features: the fulcrum, effort and load. b A see-saw is an example of a lever.
No part of this publication may be reproduced, stored in a retrieval system or transmitted in any form or by any means.
4.8A: Using a first-class lever to lift weights
When one person on a see-saw is pulled down by the Earth, the other person is pushed up. The weight of the two people does not need to be equal for this see-saw lever to work. One person can lift a heavier weight by moving further away from the fulcrum in the middle. In fact, a single person 2 m away f rom the fulcrum can lift two people who are 1 m on the ot her side of the fulcrum.

The lever gives you a mechanical advantage. The size of the advantage can be calculated by dividing the size of the load by the size of the effort:
Mechanical advantage = size of the load size of the effort
The magnification of the force comes with a disadvantage. For this type of lever, the distance the effort must move is greater than that moved by the load. Worked example 4.8A shows how to calculate mechanical advantage. Worked example 4.8B shows how to calculate effort.
These levers are called force magnifiers They can change a weak force into a stronger force. A crowbar can be used to lift a heavy rock even though the rock is heavier than the effort used. There is a disadvantage to force magnifiers. The effort section of the lever must move a greater distance to move the rock a short distance.
Other levers are distance magnifiers. They magnify the distance the effort moves. This means that when the effort moves a short distance, the load will move a long distance. The disadvantage is that the effort force required will need to be larger than the load. An example of this is a tennis racquet. The end of the tennis racquet moves a greater distance (and faster) than the hand holding the racquet.
4.8B: Using a second-class lever to lift weights
to page 219 EXPERIMENT
Calculate the mechanical advantage of a lever that allows an effort of 4 newtons to lift a load of 12 newtons.
Solution
Effort = 4 N, load = 12 N
Mech anical advantage = size of the load size of the effort = 12 4 = 3
The mechanical advantage is 3.
Calculate the effort required to lift a box of books (6 newtons) with a lever with a mechanical advantage 2.
Solution
Load = box of books = 6 N, mechanical advantage = 2
Mechanical advantage = size of the load size of the effort 2 = 6 N effor t
Effort = 6 N 2 = 3 N
The ef fort needed is 3 newtons.
force magnifier a device that can increase the amount of force available (for example, to shift something); an example is a lever distance magnifier a lever that changes a strong force that acts over a short distance into a weak force that acts over a longer distance
Figure 3 A crow bar is a force magnifier.

a b Load Effort Fulcrum
a b
fi rst-class lever a lever that has its fulcrum between the point of effort and the load
second-class lever a lever that has its load between the point of effort and the fulcrum
Figure 5 a In a first-class lever, the fulcrum is between the load and the effort.
b Scissors are an example of a first-class lever.

a Load Effort Fulcrum

Figure 6 a In a second-class lever, the load is between the effort and the fulcrum. b A wheelbarrow is an example of a second-class lever.

Figure 7 a In a third-class lever, the effort is between the load and the fulcrum. A tennis racquet is an example of a third-class lever. When a person uses a tennis racquet to hit a ball, the muscles exerting the effort
There are three types of levers and they are classified according to the position of the fulcrum (turning point):
> First-class lever: the fulcrum is between the effort and the load (EFL) (Figure 4).
> Second-class lever: the load is between the effort and the fulcrum (ELF) (Figure 5).
> Third-class lever: the effort is between the load and the fulcrum (LEF) (Figure 6).
Use FLEE to remember the middle position for each type of lever.
F (Fulcrum) – fi rst-class lever
L (Load) – second-class lever
Many First Nations peoples understand the advantage of levers in hunting. The word ‘woomera’ comes from the Dharag language and refers to a spear thrower that can launch a spear further and with more force and with more acceleration. A spear is fi tted into the 50–100 cm long lever and held in place with a short peg that connects to the end. The person throwing the spear could then hold the woomera and swing it over their head, similar to a catapult action. This makes the lever arm longer, moving the spear faster, increasing the speed that the spear left the thrower and making the spear more accurate.
E (Effort) – third-class lever
E (Easy to remember!)
third-class lever a lever that has its point of effort between the fulcrum and the load No part of this publication may be reproduced, stored in a retrieval system or transmitted in any form or by any means.
The type of lever depends on the position of the fulcrum. If the wrist is used to fl ick the spear, then this becomes the fulcrum. If the arm and wrist remain straight, and the motion is like a bowler (in cricket), the fulcrum is located between the thrower’s shoulder blades.
Once the spear has left the spear thrower, the unbalanced forces of air resistance cause the spear to slow down and the force from the Earth’s gravity causes the spear to fall.

1Define the term ‘lever’.
Comprehend
2Describe how you would identify a fi rst-class lever.
Analyse
3Compare a second-class lever with a third-class lever.
4 Examine Figure 9.
Different First Nations groups developed different styles and shapes of spear throwers. Longer spear throwers are able to increase the speed more than shorter spear throwers. This increase in speed means that the spears used need to be lighter. 200 kg Figure 9
aIdentify the type of lever that is shown.

bCalculate whether a mass of less than 200 kg would lift the load.
cDescribe how you would reposition the fulcrum so that a mass much less than 200 kg could lift the load.
6 Modern cranes use leverage to lift heavy objects (Figure 11).

aIdentify where the load for this lever is located.
bIdentify where the effort is located.
cIdentify where the fulcrum is located.
dIdentify the class of lever being used.
eIdentify whether this class of lever is a force magnifier or a distance magnifier. Justify your answer.

5 A crowbar can be used to move a load (Figure 10).
aIdentify the class of lever used.
bIdentify whether this class of lever is a force magnifier or a distance magnifier. Justify your answer.
Complete the Quiz me to check how well you’ve mastered the learning intentions and to be assigned a worksheet at your level.
• A pulley is a simple machine that makes it easier to lift an object.
• Pulleys are wheels with a groove along their edge.
• The wheel is used to change the size or direction of the force used.
Between the fi fteenth and seventeenth centuries, a period known as the Age of Discovery, the people of Europe were desperate for spices, gold and silver. Sailors navigated the seas looking for these treasures. They returned with large amounts of bounty that included food, weapons and slaves. All this cargo needed to be loaded on and off the ships as quickly as possible. To help the sailors do this work, they used a simple machine invented by Archimedes many centuries before.
The simplest pulley system is made of one pulley. This system only changes the direction of the applied force, not the size of the force. As a person pulls down on the rope, the weight on the other end moves up (Figure 2). This does not change the amount of effort needed, but it makes lifting easier. This is because the person can use their weight to help in the lifting. You have probably used this type of pulley when you pull the cord to open a window blind at home (Figure 3). The mechanical advantage is calculated by the number of ropes between the upper and lower pulleys; in the roller blind system, it is one.
Load
Figure 2 A single-pulley system – rope is guided through the groove of a rotating wheel.
The more pulleys that are used, the easier it is to lift a load because its mechanical advantage is increased. For example, if two pulleys are used, the system can lift twice the load of a single-pulley system. The mechanical advantage of this system is 2 (Figure 4).
Figure 1 Sailing ships have pulley systems for lifting heavy sails and cargo. Load

Figure 3 The simplest pulley system is made of one pulley.
Figure 4 A two-pulley system doubles the mechanical advantage.

4.9: Calculating mechanical advantage
Calculate the effort needed to lift a load of 150 newtons with a frictionless block and tackle with five pulleys.
Mechanical advantage = 5 (5 pulleys) Load = 150 newtons
Mechanical advantage = size of the load size of the effort
5 = 150 N effort
Effort = 150 N 5 = 30 N
The effort needed is 30 newtons.
Figure 5 A four-pulley system increases the mechanical advantage by a factor of four.
A four-pulley system can magnify the effect of the effort four times. For example, a 25 kg effort can lift a 100 kg load in a frictionless pulley system. The simple system shown in Figure 5 not only changes the direction of the applied force, but it also multiplies it by four. This system has a mechanical advantage of 4. Worked example 4.9 shows how to calculate effort in a pulley system.
Groups of pulleys are often mounted together in a frame or ‘block’. This device is called a block and tackle. A small effort pulling through a long distance lifts a large load through a much smaller distance.
1Explain why two pulleys are better than one.
2Describe three examples where single pulleys or pulley systems are used.
3Describe how pulleys have made loading and sailing huge cargo vessels possible.
Analyse
4 A block and tackle provides a mechanical advantage because it can lift heavy loads. Infer the disadvantages of this system.
5Identify the correct option. A pulley system can: a increase force and distance at the same time
Figure 6 A block and tackle
b decrease distance while increasing force
c decrease force and distance at the same time.
6 A 100 kg mass is used to lift an 800 kg mass.
aCalculate how many pulleys are needed to make this possible.
bCalculate the mechanical advantage of this machine.
Quiz me
Complete the Quiz me to check how well you’ve mastered the learning intentions and to be assigned a worksheet at your level.
block and tackle a group of pulleys mounted together in a frame or block, which provides significant mechanical advantage

• Inclined planes such as ramps can provide a mechanical advantage.
• A wedge or screw can reduce the effort needed to split or enter an object.
• A wheel and axle is a special lever that turns about a fulcrum.
Many different machines have been developed through the centuries that make less work for us. Ancient Greek mathematician Archimedes (c. 287–212 bce) developed a screw that carried water to the top of a house. The screw was just a hollow pipe with an inclined pla ne (a simple machine) wound around the inside.
ramp a sloping surface joining two different levels
wedge a piece of wood, metal or other substance that tapers to a thin edge and is driven between two objects or parts of an object to secure or separate them
screw a sharp-pointed metal object with a spiral thread running along its length and a slotted head
thread the spiral ridge of a screw

As wel l as pulleys and levers, other simple machines are ramps, wedges, screws and wheels and axles.

Ramps are the simplest types of inclined planes. A ramp is used to lift heavy objects (the load) up to a higher level. For example, a piano mover might use a ramp to get a piano from the ground onto a truck. Ramps are used to bridge gaps between uneven surfaces. Escalators are moving ramps with steps (Figure 1). A ramp is called a simple machine bec ause it makes moving a load easier. Going up the ramp might take longer than a single step up, but it requires a lot less force from your legs.
A wedge is an inclined plane that moves through another object and changes the direction of a downward force to a sideways force. An axe is a wedge. When an axe hits a log, the downward force is changed to a sideways force, which splits the log (Figure 2).

Figure 1
Humans discovered the benefits of wedges when they used the jagged edges of rocks to cut animal flesh and skin. It is more than likely that you have used a wedge today: a knife is a wed ge and so are your teeth. Each tooth in a zipper is a tiny wedge that fits tightly with the adjacent teeth.
You might be surprised to know that a screw, like the wedge and the ramp, is also an inclined plane. The indent that spirals around a screw, called the thread , looks almost like a road (a ramp) spiralling up the side of a mountain. Screws penetrate materials such as wood or cork by using the turning effect of a force (Figure 3). The effort needed to turn a screw into an object is much less than that required to hammer the screw into the same object.
By the end of this topic, you will be able to:
Define and provide examples of ramps, wedges, screws and wheels.
If you have used a circular door handle or travelled in a car, bus or train today, you have used a wheel-and-axle simple machine. A wheel is a type of lever that turns in circles about its centre – the fulcrum or pivot point. An axle usually links the lever and the wheel. For example, when you turn a doorknob, you apply an effort force to the door handle and the axle exerts a force on the load (the latch), which opens the door.
A wheel and axle is sometimes a force magnifier. For example, you apply a small effort to a doorknob to move a larger load, the latch. This is because the outside edge of the wheel, or doorknob, moves a larger distance than the axle, or latch. A Ferris wheel is an example of a wheel and axle (Figure 4).


Wheel-and-axle machines can also act as distance magnifiers. When you pedal a bike, you apply a force to the pedals (Figure 5). This force causes the larger wheels to turn. The distance the wheel travels is much further than the distance the pedal travels. The distance has been magnified.
wheel and axle a type of lever that can rotate about its centre, magnifying force or distance
Figure 4 A Ferris wheel is an example of a wheel and axle.
1Name the six types of simple machines.

2Identify a circular doorknob as either a force magnifier or a distance magnifier.
3Identify which of the following is not an inclined plane. a knife used to cut bread b screwdriver used to turn a screw c nail driven into a piece of wood d spear thrust into a tree
Figure 5 A bike wheel is an example of a distance magnifier.
6Discuss how the can opener shown in Figure 6 is acting as a wheel and axle by identifying the effort, load, fulcrum, wheel and axle.
4Identify the part of a circular doorknob that is a wheel and the part that is an axle. Draw a labelled diagram to support your answer.
5Compare a wedge with a ramp.
Figure 6 A can opener is a lever.
Complete the Quiz me to check how well you’ve mastered the learning intentions and to be assigned a worksheet at your level.
No part of this publication may be reproduced, stored in a retrieval system or transmitted in any form or by any means.
By the end of this topic, you will be able to:
• Identify and describe the four main forces in flying: lift, thrust, drag and weight.
• Use an infographic to communicate with an audience.
Have you even seen or flown in an airplane? When you consider that it is a large metal tube weighing several tonnes, moving through the air, you realise that there must be some amazing forces involved. You can apply the forces you have learnt about in this chapter, to understand how the wings of a plane keeps the plane and people in the air.
There are four main forces involved in flying: lift, thrust, drag and weight (Figure 1). The thrust is the force produced by the engines of the plane. They may be a propeller, a jet engine or a rocket. All of these engines pull in air and push it out the other end. This propels the plane forward.
The drag is the force caused by the friction of air moving out of the way of the plane. It acts in the opposite direction of the thrust force and tends to slow the plane down.
The weight is the force caused by gravity pulling the plane to the centre of the earth. The greater the mass of the plane, the greater the force caused by gravity.
Lift is the force that holds the wings of the plane in the air. The lift force is generated when the plane moves forward and the air moves over the wings. The shape of the wings encourages the air to move up. This decreases the pressure
Faster air ow above = lower air pressure
of the air above the wing and reduces the forces pushing down. This makes it easier for the wing to move upwards. The air under the wing pushes up against the surface of the wing generating a lift force (Figure 2).
When the lift and weight forces are balanced, the plane is able to stay in the air. When the forward thrust from the engine decreases, the air flow will slow down and reduce the lift on the wings. The weight of the plane does not change so there will be unbalanced forces between the larger weight force and the smaller lift force. This means the plane will start moving down towards the Earth.

Air ow
Wing
Lower air ow below = higher air pressure
Figure 2 The shape of the wing generates high pressure under the wing and low pressure above the wing.
One of the unique tools of First Nations peoples is the boomerang. Its unique way of flying was researched by David Unaipon, a Ngarrindjeri man from Coorong region in South Australia. You may recognise him from the Australian $50 note. As well as being the inventor of the modern method for shearing sheep, he was the first person to describe the forces involved in the movement of a boomerang and in 1914 he developed the idea of a ‘vertical lift flying machine’ based on his understanding of boomerang flight.
Its shape is similar to two plane wings joined together at an angle (Figure 3). The top surface of the boomerang generates low pressure, while the bottom surface of the boomerang generates high pressure. These combine to generate lift that keeps the boomerang in the air.
4.11: Comparing the forces in flight
When the return boomerang is thrown correctly, it will fly vertically. As it rotates, one end of the wing-shaped boomerang will be moving forward, while the other wing-shaped end will be rotating backwards. This means there are different air pressures generating lift and causing the the boomerang to gradually turn and fly back to its original position. The boomerang fl ies vertical or upright with this balance of changing air pressures.
Understanding how and why a boomerang fl ies meant that First Nations peoples have been


able to develop many types of boomerangs that fulfi ll different functions. Not all boomerangs are designed to return. Some were designed for hunting animals, while others were designed to generate noise to scare birds into flying into the air where they could be caught with a net or spear.

Figure 3 A boomerang has a unique shape similar to the wings of an airplane.
Presenting data to an audience can take many forms. An increasingly common way to present important information is an infographic. Infographics are visual ways to present data so that the viewer can easily see the patterns. This can be through the use of graphs, pictures and important fi gures.

Select two of the sets of data in Figure 5 and Table 1 and develop an infographic that convinces your peers that flying in airplanes has become safer in the last 50 years.
1 Identify the key information in the set of data. For example, how many airplane crashes were there in 1972? How many crashes were there in 2020? When is the most dangerous part of the fl ight? Can you explain why?
2 Propose one possible reason why fewer accidents occur now.
3 Draw a picture that represents an airplane accident. Draw three different variations of the picture to represent more or fewer accidents.
Figure 5 Airliner accident fatalities by year from 1972–2020
Source: Aviation Safety Network
Table 1 Fatal accidents and onboard fatalities by phase of flight (2008–2017)
Learning intentions
By the end of this topic, you will be able to:
• Explain how understanding of forces has improved sporting abilities and technologies.
Swimmers must have a good understanding of how the water moves around them to maximise their speed. First, they must control how they dive into the water. Breaking the water’s surface creates friction and can slow them down. So they must make sure that their whole body enters the water at the place where their hands originally broke the surface.
Many swimmers shave all their body hair before a big competition. A smooth surface allows the water to move along their body with less friction.
The swimmer’s position in the water is important. If the body is straight, the water moves along without interruption. If the legs hang down, the moving water must change direction. This creates more friction and slows the swimmer down.
In 2012 Fédération Internationale de Natation (FINA), the international governing body of swimming, banned the use of fullbody smart suits (Figure 1). These suits were designed by scientists to reduce the friction between the swimmer and the water. The suits were made of a material that mimicked the small scales on a shark. This material repelled the water rather than absorbing it, making it lighter for the swimmer to wear. It also reduced the friction between the swimmer and the water. The suits were also designed to be very tight with smooth seams. This helped the swimmer to be more streamlined in the water. Many world records were broken when this smart suit was first used, but FINA decided that it gave an unfair advantage to the countries that could afford this expensive technology. New rules were made that limited the type of swimming costumes that could be worn in high-level swimming competitions.

Many athletes dream of winning Olympic gold medals. They train for long periods, control what they eat and make sure they have the best equipment available. Having a good understanding of the forces involved in their sport can give athletes an advantage over their competitors.Figure 1 Smart suits provide an advantage to the swimmer by reducing friction. They have been banned at major swimming competitions.
The human arm acts as a third-class lever for which the shoulder is the fulcrum, the muscle attached to the middle of the upper arm provides the effort and the load is usually near the hand. A tennis racquet acts as an extension of the player’s arm. This increases the distance between the load (where the tennis ball hits) and the fulcrum (Figure 2). Third-class levers are speed multipliers as well as distance multipliers. When a player hits the tennis ball with a racquet, the speed of the ball is increased. If the tennis player’s arm is bent, the end of the racquet is travelling more slowly, and therefore the ball will rebound more slowly.

Tennis players will often have longer tennis racquets, not to increase their ability to reach for the ball, but to increase the speed at which they can hit the ball.
The benefit of a dimpled surface on a golf ball is now widely known. However, golf balls originally had smooth surfaces. When golfers noticed that their old and battered golf balls flew further than the newer, smoother balls, a group of scientists investigated why this occurred.
The dents and bumps in an old golf ball cause the layer of air next to the ball to stay close to the ball, moving in an organised way over the surface (Figure 3). This decreases the overall air resistance of the ball moving through the air, making it fly further. As a result, a golf manufacturer started making the ‘pre-dented’ golf balls that you see today.
You may have heard the saying ‘Winning isn’t everything’. This is an example of the ethics in sport, otherwise known as ‘fair play’. The main goal in an ethical sports competition is fairness, responsibility and respect:
> Fairness: All participants follow the same rules, and no one is discriminated against on the basis of race, gender or fi nancial capability.
> Responsibility: All participants take responsibility for knowing the rules and regulations, and the way they behave (including their performance and emotions).
> Respect: All participants show respect for other participants.
Choose one of the examples of sports technology and discuss how an inappropriate use of technology could affect the ‘fair play’ of the sport.
1 Describe the ethical problem.
2 Identify the facts for the use of the technology.
3 Identify the facts against the use of the technology.
4 Describe who would be affected if the technology was used.
5 Identify your own bias (an opinion you might already have due to your past experiences).
6 Identify if using the technology could lead to other changes in the future that would be unethical.
7 Describe all the possible decisions that you could make.
8 Make a decision and describe why you made your decision.
1Identify which of the following is an example of a pull force.
A kicking a soccer ball
B diving into a swimming pool
C dragging a box towards you
D pushing a shopping trolley
2Identify the scenario that demonstrates balanced forces.
A a ball flying through the air after it was thrown
B a book sitting on a table, not moving
C a piece of modelling clay being moulded into a different shape
D a car slowing down for a stop sign
3Recall what will happen if the north poles of two magnets are pushed together.
A They will repel.
B They will attract.
C They will remain where they are.
D They will move sideways.
4Recall why a person jumping on a trampoline may have their hair standing out from their head.
5 Think back to the start of your day. Describe the forces that you experienced from the time you got up to the time you arrived at school.
6 Copy and complete the following sentences.
a A force is a or a between objects.
b To measure a force, you can use a
c The unit used to measure forces is called a . Its symbol is . The weight force of 50 g is about newtons.
d When an object is not moving, its forces are said to be . Evidence of an unbalanced force is a change in , or
7Identify which of the following examples involve forces.
Explain the forces involved.
a opening a window
b turning a screw with a screwdriver
c smelling food cooking
d modelling clay
e standing on a diving board
f watching a candle burn
8Explain how mechanical advantage is calculated.
9 Your mass at a given time remains the same, regardless of gravity. Your weight, however, changes as a result of gravity.
aExplain why the mass of any object is not changed by gravity.
bExplain why the weight of an object sometimes changes.
10Describe what happens to the magnetic properties of a magnet when it is broken into two.
11Explain the following in terms of friction.
a Gymnasts put chalk on their hands.
b People driving cars on ice or snow put chains on their tyres.
c A car uses more petrol when it has a load on the roof.
d It is hard for a person to run on ice.
12Explain what a first-class lever is and provide an example of one.
Load Effort
Fulcrum
Figure 1 A first-class lever
13Explain what a second-class lever is and provide an example of one.
Load Effort
Fulcrum
Figure 2 A second-class lever
14Explain what a third-class lever is and provide an example of one.
Load Effort
Fulcrum
Figure 3 A third-class lever
15Describe the four main forces involved in flying.
16 When skydivers step out of an airplane, they begin to fall towards the Earth. Describe the forces acting on the skydivers. No part
17 Consider the pulley system in Figure 4. Calculate how far the 100 kg load will rise if 2 m of rope is pulled through the pulleys.
21Investigate the kicking action of a soccer player.
a Draw a picture of a leg kicking a ball. On your diagram, identify which of the muscles are involved in moving the foot.

bIdentify the class of lever that is formed by the muscle and bone attachments.
cIdentify the lever as a force magnifier or a distance magnifier.
Pull 2m of rope 100 kg
Figure 4 A pulley system
18Compare a contact force and a non-contact force.
19Compare a lever and a pulley.
Apply
20 Figure 5 shows what happens when you stand on your toes.
aIdentify the type of lever that is formed by the foot when you do this.
bDiscuss why this lever is a force magnifier.
22 Think about how far a toy car and a marble would roll along a flat bench. Determine which has the least friction and which rolls the furthest. Discuss how friction can be minimised.
23Investigate the action of an Olympic shot-putter. aExplain why the athlete bends backward just before releasing the shot.
bIdentify the class of lever that is formed by the upper torso.
cIdentify as many levers acting as possible. Label each lever as first, second or third class.
24Discuss how the motion of an airplane will change (r ise, fall, slow or accelerate) when: a lift becomes greater than weight b drag becomes greater than thrust c weig ht becomes greater than lift d thrust becomes greater than drag.
25 Understanding the forces involved in a flying airplane means that we can modify the design of the air plane to make it more efficient.
aDescribe how streamlining will affect the amount of fuel used to generate thrust force. b Use the information in question a to infer how the environment could benefit from understanding the forces involved in flight.
cDescribe how using less fuel could affect the cost (the economics) of people flying in an airplane.
d Use the information in question c to discuss how using less fuel could affect people’s ability to maintain contact with their friends and family (social factors).
Faster air ow above = lower air pressure
Air ow Wing
Lower air ow below = higher air pressure
Figure 5 Standing on your toes
Figure 6 Streamlining makes airplanes more efficient.
26 Suppose Matilda fills her car with petrol and drives 100 km along a freeway. She then turns off the freeway and travels 100 km along country roads.
aDetermine which part of the trip would use more petrol.
bJustify your answer using your knowledge of forces and friction.
27Design an infographic poster that encourages people to wear their seatbelt when in a car. Use your knowledge of forces to illustrate the dangers of not wearing a seatbelt when in an accident.
28 Choose one of the following topics on which to conduct further research. Present your findings in a format that best fits the information you have found and the understandings you have formed.
Musical instruments often use simple machines to make it easier for the musician to play. Different types of machines are used in a piano, drum kits, the keys of a string instrument and brass instruments. Select one of these instruments and consider the following questions.

» Desc ribe the machine you have identified.
» Desc ribe how the musician uses the machine.
» Desc ribe how the machine makes it easier for the musician playing the instrument.
Astronauts are people who work outside the Earth’s atmosphere. Not all astronauts are pilots. Some are flight specialists, flight engineers, botanists, computer specialists or payload specialists.

» Rese arch one of the careers involved in space programs around the world.
» Desc ribe the types of qualifications you need to work in this area.
» Desc ribe the types of things you would do in an average day.
» Desc ribe the most challenging part of your job.
The wearing of seatbelts in cars was made law in Australia in the early 1970s.

» Desc ribe what happens when a car hits a tree.
» Desc ribe how you know that an unbalanced force is involved.
» Desc ribe what happens to the car and the tree.
» Desc ribe what would happen if you were not wearing a seatbelt.
» Desc ribe how a seatbelt is made and the materials that are used.
» Expl ain how a seatbelt could save your life if your car hit a tree.
Figure 7 Levers are part of piano keys. Figure 8 Becoming an astronaut is only one career available in the space industry.Now that you have completed this chapter, reflect on your ability to do the following.
I can do this.
• Explain why a measuring device must be calibrated provide examples of forces in real-life situations.
• Identify balanced and unbalanced forces.
• Describe how force diagrams can represent forces in a situation.
• Calculate net force.
• Define and provide examples of contact forces and non-contact forces.
• Describe the natural magnetic field of the Earth.
• Provide examples of how magnetism is used in real-life situations.
• Define electrostatic forces and charge.
• Provide examples of electrostatic forces in real-life situations.
• Calculate weight when given the mass of an object and gravitational force.
• Explain why the weight of an object does not affect the rate that it falls.
• Define and provide examples of friction, lubrication, air resistance, drag and streamlining.
• Compare and contrast distance magnifiers and force magnifiers.
• Provide examples of first-, second- and third-class levers.
• Calculate mechanical advantage and effort.
• Explain how a pulley makes it easier to lift a load.
• Calculate effort in a pulley system.
• Define and provide examples of ramps, wedges, screws and wheels.
• Identify and describe the four main forces involved in flying: lift, thrust, drag and weight.
• Use an infographic to communicate with an audience.
• Explain how understanding of forces has improved sporting abilities and technologies.
Check your Student obook pro for these digital resources and more:
Play a Quizlet game to test your knowledge.
Chapter quiz Test your understanding of this chapter with the chapter review quiz.
I cannot do this yet.
Go back to Topic 4.1 ‘A force is a push, a pull or a twist’.
Page 84
Go back to Topic 4.2 ‘An unbalanced force causes change’.
Page 86
Go back to Topic 4.3 ‘Forces can be contact or non-contact’.
Page 88
Go back to Topic 4.4 ‘Magnetic fields can apply a force from a distance’.
Page 90
Go back to Topic 4.5 ‘Electrostatic forces are non-contact forces’.
Page 92
Go back to Topic 4.6 ‘Earth’s gravity pulls objects to the centre of the Earth’.
Page 94
Go back to Topic 4.7 ‘Friction slows down moving objects’.
Page 96
Go back to Topic 4.8 ‘Simple machines decrease the amount of effort needed to do work’.
Page 98
Go back to Topic 4.9 ‘A pulley changes the size or direction of a force’.
Page 102
Go back to Topic 4.10 ‘There are different types of machines’.
Page 104
Go back to Topic 4.11 ‘Science as a human endeavour: The forces in flight’.
Page 106
Go back to Topic 4.12 ‘Science as a human endeavour: Forces are involved in sport’.
Page 108
Check your Teacher obook pro for these digital resources and more:
Launch a live team or individual quiz for your students on key concepts in this chapter.


By the end of this topic, you will be able to:
• Explain the purpose of classification systems and how they are used by scientists.
• Classification systems help scientists to communicate.
• Scientists identify all living things through scientific names.
• Carolus Linnaeus developed the modern Linnaean classification system.
Early humans first classified plants by learning which plants were edible and which were poisonous. A new plant or animal discovered by humans was (and still is) studied and put into a group. Some plants were found to help sick people and others were poisonous. Some animals could produce food, such as milk and eggs. Each generation of scientists worked to improve how these groups were classified.
Both birds looked so similar that they were given the same common name, ‘magpie’. However, their scientific names are different. The name Cracticus tibicen for the Australian magpie means the same to scientists in every country around the world.


b Figure 2 A timeline of classification
Greek philosopher Aristotle (384–322 bce) was the first scientist to start using systems to describe plants and animals. By the seventeenth century the early classification systems used a hierarchy list of names, starting with large general groups (such as plants and animals) and then dividing
b the Australian magpie Cracticus tibicen
Scientists try to communicate with each other regularly to help with their research. Before the existence of photographs or computers, scientists would have to draw creatures, such as birds, by hand and describe them in as much detail as they could. This was difficult, and it was easy to make mistakes, as the photographs of the American magpie and the Australian magpie show in Figure 1.
Figure 3 Part of Linnaeus’s classification system
Aristotle (384–322 BCE) sent his students out to gather local samples and stories. He ordered the samples and stories from least important (rocks) to the most important (wild animals, men, kings, fallen angels, angels and God).
Andrea Cesalpino (1519–1603) suggested classifying plants into groups according to their trunks and fruits.
John Ray (1627–1705) suggested that organisms needed to be observed over the whole of their lifespans.
Augustus Quirinus Rivinus (1652–1723) and Joseph Pitton de Tournefort (1656–1708) suggested using a hierarchy of names. Each organism had a long Latin name that described the characteristics of each level of the hierarchy.
No part of this publication may be reproduced, stored in a retrieval system or transmitted in any form or by any means.
5.1: Department store classification
each group into smaller and smaller groups based on their characteristics. Each organism ended up with a long Latin name that described the characteristics of each level of the hierarchy. Swedish botanist Carolus Linnaeus (1707–1778) tried these classification systems but found their descriptions to be too long. He decided that a simpler system was needed. He changed the descriptions to single words and reduced the number of classification groups to seven.

There are many living things that are still to be discovered or named. In 2020, seven new species of peacock spiders were identified in Australia. These spiders are the same size as a grain of rice. During their courtship dance, they wave their brightly coloured abdomens.


Small groups of scientists are trying to fi nd undiscovered plants in Brazilian rainforests before they are destroyed by logging and farming. Often the scientists are supported by large pharmaceutical companies from other countries in the hope that it may lead to the discovery of new medications. The antibiotic penicillin was discovered from a type of mould; aspirin comes from a substance in the bark of willow trees. The next painkiller could come from a small fungus in the rainforest or an insect that relies on the fungus for food. Without a name, the new discoveries would be lost and forgotten.


1Explain why Linnaeus simplified the classification system used by previous scientists.


2Explain why it would be difficult to classify frogs and tadpoles using the early methods of classification.


Apply

3Propose two reasons why scientists still classify organisms today.
4 The earliest scientists did not have pens or paper. Describe how they would have passed on the
Carolus Linnaeus (1707–1778) introduced the Linnaean classi cation system.
information they discovered. Discuss the accuracy of this approach (by describing the advantages and disadvantages of using this method).
5 Aristotle was one of the first scientists to gather information from wide regions. Propose the method he might have used to tell the differences between a horse and a fly.
Complete the Quiz me to check how well you’ve mastered the learning intentions and to be assigned a worksheet at your level.
Thomas Cavalier-Smith (1942–2021) suggested the kingdom Plantae be split into two kingdoms because of differences in their cells.
Carl Woese (1928–2012) suggested that the bacterial kingdom Monera be split into two domains, and the third domain contain all other organisms.
No part of this publication may be reproduced, stored in a retrieval system or transmitted in any form or by any means.
By the end of this topic, you will be able to:
• Describe the eight characteristics shared by all living things using the acronym MR N GREWW.
• Biology is the study of living organisms and what it means to be alive.
• Living things move, reproduce, need nutrition, grow, respond, exchange gases, produce waste and need water.

• Dead organisms were once living.
It has taken many years of observation and discussion for scientists to develop eight characteristics that all living things – plants, animals and even micro-organisms such as bacteria – have in common. To remember all eight characteristics, just remember: MR N GREWW.

Figure 1 Living things move.
Animal movements are easy to see. But do plants move? Look at the leaves on an indoor plant – they usually face the window (a source of light). Turn the plant around so that the leaves face into a darker part of the room. In a few days, the leaves will again be facing the window. The leaves have moved by themselves. Sunflowers turn their heads to follow the Sun as it moves across the sky each day.
All living things grow during their lives. Mushrooms start off as tiny spores. Humans are born as babies and develop into children, teenagers and then adults. Insects hatch from eggs as larvae and then metamorphose into adult insects (Figure 4). In every case, living things, when fully grown, resemble their parents.

Figure 2 Living things reproduce.
reproduction the production of offspring by a sexual or asexual process
autotroph an organism that makes its own food heterotroph an organism that absorbs nutrients from other living things
Living things can make new individuals that grow up to look like them. Animals mate and produce offspring, plants produce seeds that grow into new plants, and bacteria divide to produce more bacteria. Reproduction is the process by which living things make new life.

All living things need nutrients to survive. Animals obtain most of their nutrients by eating food and drinking. Plants absorb nutrients through their roots and fungi feed on decaying organisms. Plants are autotrophs, which means they make their own food. Animals and fungi are heterotrophs, which means they rely on other living things for food or nutrients.
Figure 3 Living things need nutrients to survive.
Figure 4 Living things grow during their lives.
When an animal realises it is being chased, like the springbok in Figure 5, it runs. It is responding to stimuli (the sight and sound of a charging predator) or to changes in its
Figure 5 Living things respond to change.
environment (the sudden brush of leaves or movement of shadows). The sunflowers shown in Figure 1 are responding to the changing stimuli of light and warmth.
Plants and animals have organs and structures that allow them to exchange oxygen and other gases. Some animals, such as humans, use their lungs to inhale and then exhale. Other animals, such as fish and the axolotl (Figure 6), have gills.

Some animals, such as worms, breathe through their skin. Even plants need to exchange gases with their environment.
We, like other animals, take in food, water and air to fuel our bodies. Chemical reactions occur in our bodies and wastes are produced as a result. We get rid of these wastes by exhaling, sweating, urinating and defecating (emptying our bowels). Plants get rid of their wastes through their leaves.

All living things need water; it is required for many jobs. For example, it transports substances in our bodies to where they are needed, and it is involved in many essential chemical reactions. In animals such as humans, water helps maintain body temperature. No wonder a large proportion of our body is water!
Something classified as living needs nutrition and water, and is able to move by itself, reproduce, exchange gases, grow, respond to stimuli and produce wastes.
If something does not have these characteristics, it would seem logical to assume that the thing is non-living. But what about something that is dead? Something dead, such as a dried flower or an Egyptian mummy, was once living; when it was alive it did have the characteristics of a living thing. Something that is non-living, such as a computer or your watch, has never had these characteristics.
Retrieve
1 The system scientists use to classify things divides the things fi rst into two groups. Name the two groups.
2Identify what the letters of MR N GREWW represent when discussing the characteristics of living things.
Analyse
3 Consider the following things: eucalyptus tree, water, paper, robot, leather belt, wombat, roast chicken, plastic chair.
With a partner or by yourself, classify each thing as living, non-living or dead
4Contrast non-living and dead things.

5Identify the items listed in question 3 that are dead. Justify your answer (by defi ning the term ‘dead’ and comparing the defi nition to the item).
6Identify a bushfi re as either living, non-living or dead . Justify your answer (by describing the characteristics of a living thing and comparing it with the properties of a fi re).

Complete the Quiz me to check how well you’ve mastered the learning intentions and to be assigned a worksheet at your level.
Figure 8 The human body uses water for many jobs, including maintaining body temperature. No
By the end of this topic, you will be able to: • Construct and use tabular and dichotomous keys for classification.
Interactive 5.3 Using a dichotomous key
• A key is a visual tool used in the classification of organisms.
• A branched key can show the relationship between different organisms.
• Scientists use keys to identify the scientific name of an organism.
When you visit an outdoor market, you might wander around for some time before you fi nd what you want. A department store is more organised, with similar items grouped together. Scientists use a system similar to this to sort things into groups or classify them. A visual tool called a key helps scientists identify the names and descriptions of organisms.
Dr Redback loved to send out Christmas cards with a family photo on the front. One year, just for fun, he included two dichotomous keys to help everyone identify all his family and pets.
Use the picture of Dr Redback’s family (Figure 1) and one of the dichotomous keys provided (Figures 2 and 3) to work out who is who.
dichotomous key a diagram used in classification; each `arm' of the key contains two choices
One common type of key is called the dichotomous key (pronounced ‘dye-COT-omuss’) because the branches always split into two (di meaning ‘two’). Scientists use this type of key to make simple ‘Yes’ or ‘No’ decisions at each branch. For example, does the animal have fur (Yes/No)? Does it have scales (Yes/No)? Each answer leads to another branch and another question. This key only works if the animal has already been identified by someone else. A newly discovered organism would need to be studied fi rst and then new branches added to an existing key.
classify arrange in classes or categories key (in biology) a visual tool used to classify organisms Figure 2 A dichotomous key
If a scientist is going out into the bush to study plants and animals, a large drawing like the one in Figure 2 may not be useful. Instead, a fi eld guide or tabular key, such as that shown in Figure 3, can be used. This is used in the same way as the diagram version (Figure 4). Two choices are offered at each stage. When a decision is made, the scientist is led to the next characteristic choice.
No part of this publication may be reproduced, stored in a retrieval system or transmitted in any form or by any means.
Round
Bugs Scott
Moggie Buddy
Go to 2 Go to 9 Go to 3 Go to 4 Go to 5 Go to 6 Go to 8 Go to 7
All beetles
Antennae
Figure 3 Tabular key for Dr Redback's family
Remember and understand
1Define the term ‘dichotomous key’.
2State why it is called ‘dichotomous’.
3Define the term ‘classify’. Apply
Oval
No antennae
Antennae No antennae
Stripes Spots Stripes Spots Stripes Spots Stripes Spots
Wings No wings Wings No wings Wings No wings Wings No wings Wings No wings Wings No wings Wings No wings Wings No wings
Fring Frong Frap Frip Fripe Frope Frot Frit Gring Grong Grip Grop Gripe Grope Grot Grit
Figure 4 A dichotomous key to help identify 16 different types of beetles
4 A scientist needs to carefully select the characteristics that are used to classify organisms in a dichotomous key. For each of the characteristics listed below, consider if it is appropriate for use in a dichotomous key of birds. Justify your answer (by explaining how it can or cannot be used to identify a bird).
a eating bird seed b a blue stripe above the eye c a broken leg d sitting on the ground
5Create a key that could be used to identify laboratory equipment. Include these items: tripod stand, Bunsen burner, gauze mat, 50 mL beaker, 150 mL beaker, 100 mL measuring cylinder, 10 mL measuring cylinder, 500 mL beaker, 500 mL measuring cylinder, retort stand, clamp.
6 Use the dichotomous key in Figure 4 to help with the following tasks. aIdentify the four beetles in Figure 5. bCreate a simple sketch of the following: i frope beetle ii gring beetle iii gripe beetle iv frong beetle.
Quiz me Complete the Quiz me to check how well you’ve mastered the learning intentions and to be assigned a worksheet at your level. No part of this publication may be reproduced, stored in a retrieval system or transmitted in any form or by any means.
By the end of this topic, you will be able to:
• Describe the two-part naming system devised by Linnaeus.
• Identify the genus and species of an organism from its two-part name.
• Carolus Linnaeus was the first scientist to use a dichotomous key to classify every living thing.
• Scientific names are binomial (two names), the genus and the species.
• The Linnaean taxonomy system is still used today.
When trying fi nd your house on Google Earth, you fi rst fi nd Australia and then the state you live in. Each time you narrow your search closer to your town, your suburb, your street until you fi nally fi nd your house.

These double names are given to every living thing using the Linnaean classification system. Our homes can easily be found by using only the two smallest groups in an address – the street and the suburb. The information about the bigger groups, such as the Earth and the country, is not really necessary.
KINGDOM: Animalia e.g. insect, sh, bird, lizard, kangaroo, fox, lion, jungle cat, domestic cat
PHYLUM: Chordata
e.g. sh, bird, lizard, kangaroo, fox, lion, jungle cat, domestic cat
CLASS: Mammalia e.g. kangaroo, fox, lion, jungle cat, domestic cat
Linnaean taxonomy a hierarchical system of classification developed by Linnaeus in which all organisms are grouped into kingdom, phylum, class, order, genus and species, with each individual organism known by its genus and species names kingdom the highest category in taxonomic classification
Figure 1 How do you find your house on Google
The Linnaean taxonomy for classifying living things works in a similar way. It starts with large groups called kingdoms and then divides into smaller groups called phyla. Each phylum has several classes. The classes have orders and so on. There are seven different levels to get to the fi nal name of each organism: kingdom, phylum, class, order, family, genus and species. (Tip: Some people use the following mnemonic to remember the Linnaean system: ‘K ing Phillip Crawled Over Four Gooey Snails’.)
ORDER: Carnivora e.g. fox, lion, jungle cat, domestic cat
FAMILY: Felidae e.g. lion, jungle cat, domestic cat
GENUS: Felis e.g. jungle cat, domestic cat

SPECIES: catus domestic cat

Figure 2 Musa sapientum is the Linnaean name for a banana.
Have you eaten a Musa sapientum lately or have they been too expensive to buy? And did you pat your Canis familiaris this morning?
No part of this publication may be reproduced, stored in a retrieval system or transmitted in any form or by any means.
5.4: Can you understand scientific names?
In much the same way, an organism can also be named from the two last groupings on the Linnaean dichotomous key – the genus and the species.
In the double-name (or binomial) system, the genus group name always starts with a capital letter. The second word is the species name and it does not have a capital letter. The double name is always written using italics (sloping letters).
A species is a group of organisms that look similar to one another. When they breed in natural conditions, their offspring are fertile (in other words, they can also breed and have babies). Domestic cats belong to the one species because they can breed together and have living kittens.
After 250 years, scientists are still testing and modifying the Linnaean classification system. The development of microscopes led to the discovery of single-celled organisms (bacteria). This led to the number of kingdoms increasing from three – plants, animals and minerals – to the current five – Plantae, Animalia, Fungi, Protista and Monera. In the 1970s, a group of organisms previously thought to be bacteria was discovered to be something else: singlecelled organisms that could live in extreme conditions, such as very salty or hot waters.
The genetic material (DNA) of these organisms was different from that of other bacteria. This led to the suggestion that a sixth kingdom, Archaea, was needed. Scientists have been discussing this approach of six kingdoms and comparing it with a whole new level that comes before kingdoms.


The ‘three-domain system’ was fi rst suggested in 1990. This system suggests one super domain, Eukaryota, for plants, animals, protists and fungi. The singlecelled organisms in Kingdom Monera would then be split into two domains according to their genetic material.
binomial the double-name system created by Linnaeus to name organisms; the fi rst name is the genus and the second name is the species
genus a group of closely related species species a group of organisms that look similar to one another, and can breed in natural conditions and produce fertile young
1Identify the person responsible for the naming system that is still used today to name living things.
2Recall the seven levels or groups that are used to divide all living things. Write them in order from the largest group or level to the smallest level of organisation.
3Explain how you would know whether two organisms are the same species.
4 Select three species of animal. For each animal: adescribe its appearance bidentify its common and scientific names.
5Identify which two organisms would be most alike: Felis catus, Canis familiaris and Felis bieti . Apply
6Discuss how an understanding of genetic material changed the classification of bacteria.
Quiz me
Complete the Quiz me to check how well you’ve mastered the learning intentions and to be assigned a worksheet at your level.
By the end of this topic, you will be able to:
• Explain how living things have been classified into different kingdoms.
• Taxonomists are scientists that classify living things.


• New information that compares genetic material may change the five kingdoms.
• The nature of science is to change and develop as new evidence becomes available.
Cells are often called the building blocks of life. Think of the way bricks are used to build a house. Cells build living things in a similar way. However, there are usually many more cells in living things than bricks in a house. Any living thing with more than one cell is multicellular (Figures 1a and 1b). Many living things, such as bacteria, consist of only one cell. These are single-celled or unicellular organisms (Figure 1c).

multicellular consisting of two or more cells unicellular consisting of only one cell; an example is bacteria taxonomist a scientist who classifies living things into groups nucleus a membrane-bound structure in cells that contains most of the cell's genetic material cell wall a structure that provides support around the cell in some organisms, such as plants and fungi
Taxonomists ask three questions when they are trying to classify the cells of an organism:
1 Does the cell keep all of its genetic material (called DNA) inside a nucleus? The nucleus protects the DNA that carries all the instructions for living and reproducing.
2 Does the cell have a cell wall around it for extra support?
3 Does the cell use sunlight to make its own nutrients (autotroph)? Plant cells can do this, but fungi (like mushrooms) need to absorb their nutrients from other living things (heterotrophs).
These three features are used to divide all living things into big groups called kingdoms.
a b c
• Describe how classification of organisms changes as new information becomes available. No
All organisms in this kingdom are multicellular. Each cell stores its genetic material in a nucleus but does not have a cell wall. Animals gain energy from other living things. We belong in this kingdom. Zoologists are the scientists who study animals.
Plants include trees, vines, bushes, ferns, mosses, weeds and grasses (Figure 3). They all gain energy by converting the energy from sunlight into food (autotrophs). They are multicellular and their cells are surrounded by a cell wall. There is a nucleus inside each cell. Botanists are the scientists who study the plant kingdom.
Figure 3 Kingdom Plantae: the smelliest plant, the Rafflesia, is found in South-East Asia (its flower can measure up to 90 cm across and weigh about 11 kg, and it gives off a rotten meat odour when it blossoms to attract insects).

Kingdom Fungi includes mushrooms, toadstools, yeasts, puffballs, moulds and truffles (Figure 4). Some fungi grow in wood and soil, and develop from tiny spores. Fungi store their genetic material in a nucleus and do not make their own food. Instead, they feed on the remains of dead animals and plants. Some fungi can cause diseases, such as tinea (athlete’s foot). Mycologists are the scientists who study Kingdom Fungi.
Kingdom Monera is made up of the simplest and smallest living things. There are approximately 75 000 different organisms in Kingdom Monera, and they are all unicellular and have a cell wall but no nucleus. Bacteria are the most common in this kingdom. Many people think of bacteria as harmful to humans, but this is not always true.
Retrieve


1Identify where a plant cell stores its genetic material (DNA).
2Name four features of Kingdom Fungi.
3Define the term ‘multicellular’.
4Name an organism made up of just one cell.
Analyse
bacteria unicellular organisms that have a cell wall but no nucleus
plankton microscopic organisms that float in fresh or salt water amoeba a type of single-celled organism belonging to the Protista kingdom
Figure 4 Kingdom Fungi: mushrooms


Bacteria in the soil break down rubbish and wastes produced by animals (especially humans). Without bacteria, we would be surrounded by mountains of smelly rubbish. Bacteria have been put to use by humans to make food, such as cheese and yoghurt (Figure 5). Microbiologists are the scientists who study micro-organisms in Kingdoms Monera and Protista.
There are approximately 55 000 species of protists. Their cell structure is more complex than that of the Monera. Often, organisms that do not fit into any other kingdom will belong in Protista. Protists may range in size from singlecelled organisms to much larger ones, such as kelp (seaweed). They all have one feature in common: they store their genetic material in a nucleus. Plankton, the tiny sea creatures eaten in their millions by whales, are part of this kingdom. Amoeba , microscopic organisms that change their shape to trap their food, also belong to this group (Figure 6).
Figure 5 Kingdom Monera, as seen under a microscope: Lactobacillus casei, a helpful bacteria used to make some dairy foods
Apply
7Discuss why the invention of the microscope was important to our understanding of living things.
a b Quiz me Complete the Quiz me to check how well you’ve mastered the learning intentions and to be assigned a worksheet at your level. DRAFT
5Contrast a protist with a bacterium.
6Compare the cells in Kingdom Plantae with those in Kingdom Fungi.
By the end of this topic, you will be able to:
• Explain that invertebrates have either an exoskeleton or no skeleton.
• Kingdom Animalia contains approximately 35 phyla.
• The two main groups in Kingdom Animalia are vertebrates and invertebrates.
• Endoskeletons are skeletons that are found inside the animal.
• Exoskeletons are hard skeletons or shells that are found on the outside of the animal.
Video 5.6A
Squid dissection

Video 5.6B
Classification confusion
endoskeleton an internal skeleton vertebrate an organism that has an endoskeleton exoskeleton an external skeleton invertebrate an organism that has an exoskeleton or no skeleton
• Identify the six main phyla of invertebrates. No
In the same way as using a dichotomous key, dividing the animal kingdom into groups fi rst requires a question. The system scientists use to divide animals into groups is based on their structure. The question is: ‘Does this animal have an internal or external skeleton?’
Animals such as cats, humans and birds with an internal skeleton (called an endoskeleton) are known as vertebrates. Because these animals often have a spinal cord that threads its way along the vertebrate bones, the phylum is called Chordata. Animals with an external skeleton (exoskeleton), such as beetles and crabs, and those with no skeleton at all, such as slugs, are known as invertebrates Invertebrates dominate the animal kingdom.
There are many more invertebrates on the Earth than there are vertebrates: 96 per cent of all animals are invertebrates. Invertebrates have either an external skeleton (exoskeleton) or no skeleton at all. As well as enormous animals such as the giant squid (Figure 1), thousands of tiny insects and other creatures belong to the invertebrate group.
In the same way that vertebrates are classifi ed, invertebrates are grouped into six main groups of phyla on the basis of their characteristics.
Characteristics used to classify invertebrates include the presence of a shell or hard cover, tentacles or spiny skin. Organisms with similar features are placed in the same group. The dichotomous tabular key in Table 1 can be used to place an organism in a particular phylum.
1 Body spongy, with many holes Poriferan
Body not spongyGo to 2
2 Soft body, no shellGo to 3 Outside shell or hard cover Go to 6
3 Many tentacles or arms Go to 4
Long body without tentacles Go to 5
4 Tentacles around the mouth of a sac-like body
Cnidarian
Arms with suction discs Mollusc
5 Soft body, large foot Mollusc Worm-like or leaf-like Nematode, platyhelminth or annelid
6 Proper shell or smooth, hard covering Go to 7 Spiny skin with rough covering Echinoderm
7 Limbs in pairs Arthropod Shell, no segments, large foot Mollusc
Arthropods have segmented bodies, paired and jointed legs and an exoskeleton. Examples include insects, spiders, centipedes and scorpions (Figure 2a).
Poriferans have spongy bodies with holes and are found in water, attached to rocks. Examples include breadcrumb sponges (Figure 2b) and glass sponges.


Cnidarians have soft, hollow bodies with tentacles and live in water. Examples include coral, sea jellies (Figure 2c) and anemones.
Nematodes, platyhelminths and annelids have soft, long bodies and can be segmented, fl at or round. Examples include leeches (Figure 2d), tapeworms and fl atworms.
Echinoderms have rough, spiny skin, their arms radiate from the centre of the body, and they are found in the sea. Examples include sea urchins, sea cucumbers and brittle star (Figure 2e).


Molluscs have soft bodies and usually have a protective shell. Examples include snails (Figure 2f), octopuses and oysters.
1 Animals are divided into two main groups.
aIdentify the names of the groups.
bName the main characteristic of each group.
2State the percentage of animals that are invertebrates.
3Recall two examples of animals with an exoskeleton.
4Recall two examples of animals with no skeleton at all.

5 Beetles have segmented bodies and jointed legs. Identify the phylum that contains the beetles.

6 Use Table 1 to identify the group that a scientist would place the following animal in: a non-spongy soft body, with many tentacles around the mouth. Apply
7 Eighty per cent of animals on the Earth are arthropods.
aDiscuss what characteristic the name arthropod suggests. ( HINT: Consider ‘arthritis’ and ‘podiatrist’.)
b Draw three different arthropods and label the features that make them part of this phylum.
Quiz me
Complete the Quiz me to check how well you’ve mastered the learning intentions and to be assigned a worksheet at your level.
By the end of this topic, you will be able to:
• Distinguish between vertebrates and invertebrates.
• Identify the five classes of vertebrates and use the terms ‘endotherm’ and ‘ectotherm’ to group them.
Video 5.7
Classes of vertebrates
endotherm an organism that has a constant body temperature regardless of the temperature of its environment
• Vertebrates are animals with a spine or backbone.
• Vertebrates can be broken down into classes based on their body covering, how their young are born, and their body temperature.
• Endotherms have a constant body temperature.
• Ectotherms have a body temperature that changes with the environment.
Mammalia is a class of vertebrates well known to many people. Many of our pets belong to this class: horses, dogs, cats, rabbits, guinea pigs and mice. We belong to this class too.
Mammals are animals with hair or fur and they can keep their body temperature constant (endotherms). This means their body temperature remains the same despite the environment being hot or cold. Female mammals give birth to live young and feed their young with their own milk.
Class Mammalia can be further broken down into three subgroups, as shown in Figure 1. The main feature used to separate mammals is the way in which their young develop.
a b c
All birds in phylum Chordata belong in this class. Like mammals, they are endotherms (having a constant body temperature). Two of their main distinguishing characteristics (the way they differ from the other classes) are their covering of feathers and their scaly legs (Figure 2). All animals in this class lay eggs with a hard shell.
an organism with a body temperature that changes with the environment

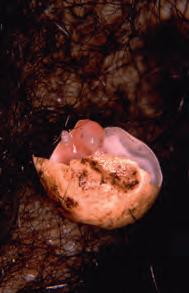
monotremes lay soft-shelled eggs; marsupials are born immature and need to spend the first few months in their mother’s pouch; born with the general shape of the adult animal.


A cockatoo is part of Class Aves.

The skin of reptiles, such as snakes (Figure 3) and lizards, is usually covered in a layer of fi ne scales. Reptiles use lungs to breathe, even if they live under water (sea snakes). These animals are ectotherms because their body temperature is always very similar to the environment. We do not use the term ‘coldblooded’ to describe these animals because a lizard that has been lying in the Sun has very warm blood, even though at night its blood is cool.
Turtles also belong to this class. Many people become confused by the hard outer shell of turtles and tortoises, thinking it is an exoskeleton. Underneath the shell there is a hard backbone with a nerve cord running through it (Figure 4). a growling grass frog


1 The vertebrates have five classes: Mammalia, Reptilia, Amphibia, Aves and Pisces. Identify the common names for each of these classes.
Comprehend
2Describe the main characteristics of mammals.
Analyse
3Contrast the appearance of a placental mammal when it is born with that of monotremes and marsupials.
Apply
Like reptiles, amphibians are ectotherms; however, the skin of amphibians is usually soft and slimy to touch. They lay their eggs, without hard shells, in water. For the fi rst part of their life, amphibians have gills and live in the water. As they get older, lungs develop and they become able to live on land. The only remaining group of native amphibians in Australia is frogs. In other parts of the world, caecilians and salamanders may be found.
Most fi sh are ectotherms. They are covered in a layer of scales and most have fi ns. They spend all their life in water and so need gills to breathe. Fish are further grouped according to their skeleton. Sharks, rays and skates have a skeleton made entirely of cartilage, whereas all other fi sh have bony skeletons.

4 A dolphin lives in the ocean and has fi ns. It breathes air, gives birth to live young and feeds them milk. Identify the class that the dolphin belongs in. Justify your answer (by comparing the characteristics of the class with the characteristics of the dolphin).
5 A flying fox can glide through the air like a bird but is covered in fur. Identify the class that the flying fox belongs in. Justify your answer.
6 Seals have fi ns like fi sh and live on the land and in the water like amphibians.
aInvestigate how a seal’s young are born.
b Given that the seal has long whiskers, is endothermic and breathes air, identify the class of vertebrate in which a seal belongs.
Complete the Quiz me to check how well you’ve mastered the learning intentions and to be assigned a worksheet at your level.
By the end of this topic, you will be able to:
• Explain that plants are generally classified according to how they transport nutrients or how they reproduce.
• Categorise plants using a key.
spore a tiny reproductive structure that, unlike a gamete, does not need to fuse with another cell to form a new organism vascular tissue in a plant, tube-like structures that transport water from the roots to the leaves pollination the transfer of pollen to a stigma, ovule, flower or plant to allow fertilisation
• Plants belong in one of the five kingdoms of living things.
• All plants are multicellular organisms that use sunlight to produce their own energy.
• Plants have a variety of different characteristics that allow us to classify them into different phyla.
Planting a seed and watching it grow is something many people do. But not all plants have seeds. Some plants, such as ferns, produce spores. Spores are much smaller than seeds and only contain half the genetic material needed to make a fern. They can be found clinging to the underside of a fern frond (Figure 1).
Most plants in your school or home garden produce flowers. Flowers are the way plants attract birds and insects to encourage pollination and therefore enable them to produce seeds. Not all plants have true flowers. Conifers have needle-like leaves and produce cones instead of flowers (Figure 3). Pollen from one cone is often transferred to another cone (pollination) so that a seed can be produced.
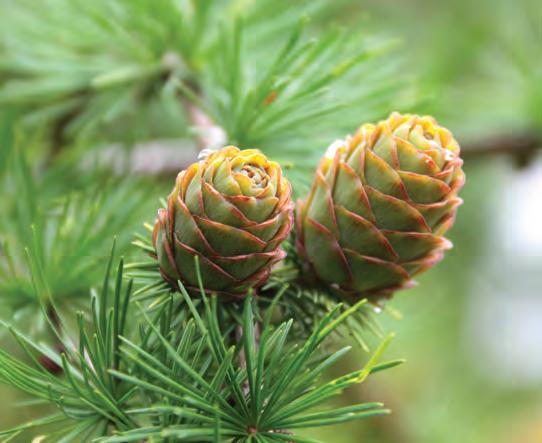
Flowering plants can be divided into two main groups. Monocotyledons (monocots) have a single leaf that grows from the seed. They can usually be recognised by the parallel veins in the leaves and by counting the number of petals in the flowers. Monocot flowers always have petals that are multiples of three (Figure 4).
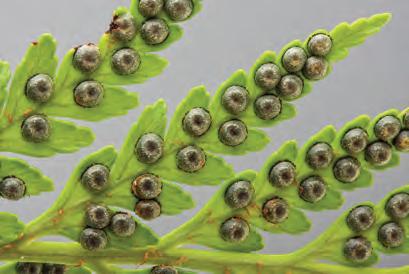
Figure 1 Not all plants germinate from seeds. Ferns produce spores instead.

Figure 2 Mosses and liverworts can absorb water through all parts of their structure.
Plants, like all living things, need water to survive. Many plants use their roots to absorb water and transport it through tube-like structures to the leaves. This system of tubes is called the vascular tissue of the plant. Not all plants are so organised. Many plants, such as mosses and liverworts, need to live in damp places where they can absorb water through all parts of their structure (Figure 2).
Figure 3 Some plants use flowers or cones to produce seeds.
Dicotyledons (dicots) grow two leaves from the seed. Their leaves have veins that are reticulated (spread out from a central vein), and they tend to have four or five petals on each flower (Figure 5).
1Describe how mosses, ferns and conifers reproduce.
Analyse
2 Use the key in Figure 6 to identify the features of the plants below. a ferns b mosses
3 Use the key in Figure 6 to identify the kinds of plants below. a fruit tree b palm tree c green weed in a fi sh tank d maidenhair fern e bird nest fern
f moss on the path g rose bush h vegetables i pine tree j grass and lawn
4Contrast vascular and nonvascular plants.
5 Who am I? I am large and green. I use sunlight to make my own food. I smell nice and like to come inside at Christmas. Some people do not like me because my leaves can be prickly and needle-like. I use a cone to help me reproduce. Categorise me into the plant phylum I belong to.
Apply
6 Locate a plant in your garden. aCreate a labelled diagram of the plant.
bIdentify the features that could be used to categorise your plant.


cPropose at least one feature that is not currently present that would help you to categorise your plant.
Complete the Quiz me to check how well you’ve mastered the learning intentions and to be assigned a worksheet at your level.
By the end of this topic, you will be able to:
• Describe some of the ways in which First Nations peoples classified and communicated their understanding of local flora and fauna.
• Australia is the second driest continent in the world and the driest inhabited continent.
• Despite the harsh climate, Australia is home to hundreds of different organisms.
• First Nations peoples were the first to identify and access the organisms that are unique to Australia.
When Europeans first visited Uluru and Kata Tjuta (the Olgas) in the 1870s, they were confronted with a harsh landscape. Their initial aim was to find a route for the overland telegraph line from Adelaide to the Top End and to set up pastures for sheep and cattle grazing. They soon decided that the region was unsuitable and left.
However, the Traditional Owners of the land, the Anangu people, had lived on this land for thousands of years and understood it well.
The Anangu people classified their environment to help them navigate and manage Country. They use the following names:
> Puli: rocky areas, gorges, stony slopes; animals come to this area to find shelter and water
> Puti: open woodland; after the rains, this area has an abundance of grass, which the kangaroos eat, and honey ants build their nests in this area
> Pila: spinifex plains, low areas between dunes; this is the best place to gather seeds to eat.


The Yanyuwa people in the Northern Territory classified all organisms according to where they were located. Their classification system was first divided into two broad categories: coastal/marine or inland. This was then further divided according to the characteristics of the organism. For example, walya can refer to all dugong but this is divided into 16 further names according to the dugong’s age, size and gender, and even the dugong’s status in its herd. This is much more detailed than the descriptions in the Linnaean system.
Early European visitors to Australia often depended on the First Nations peoples to identify and describe the plants and animals in the unique environment. This can be seen with the names that were used when these animals were ‘discovered’ by European scientists.
Uniquely Australian mammals such as the wulaba (wallaby), buduru (potoroo), wularu (wallaroo), wumbat (wombat) and dingu (dingo) were all fi rst classified by the Dharawal people of New South Wales.
Mammals are rarely seen during the day in Uluru–Kata Tjuta National Park. Most are nocturnal and come out in the evening, avoiding the heat of the daytime desert. The most abundant groups of mammals are the placentals and the marsupials.
1 One of the classes of vertebrate is Amphibia. Identify the characteristic of amphibians that would make it difficult for them to live in arid environments. Identify the other animal classes that would struggle to survive in arid environments.

2Identify one reason why the bilby’s pouch is rear facing.

Comprehend
3Explain why the Anangu people devised a system of classification for the natural habitats around them.
Analyse
4Infer why monotremes would fi nd it difficult to breed in arid environments.
Apply


5Investigate the mammals, reptiles, birds and invertebrates found in the Uluru–Kata Tjuta National Park. Make a list of five for each category. Classify each one into its correct group.
6Investigate the kind of environment that the Anangu people lived in and the
Marsupials, such as the bilby (Tjalku , a very important animal for the Anangu people), give birth to underdeveloped young but protect them by having a pouch in which further development can occur. The pouch is similar to that of a kangaroo; however, it is a backward-opening pouch. When the young are fully developed, they can leave the pouch and survive the harsh climate.
foods they ate to survive. List at least five animals and five plants they ate.
7 Early Europeans left this environment because they could not survive. Propose why they struggled to fi nd food and water here.
8 In a group of four, use a large sheet of paper to create two collages about things you would expect to fi nd in Uluru–Kata Tjuta National Park. The fi rst collage should show living things; and the second, non-living things. One pair should create the ‘living’ collage and the other should create the ‘non-living’ collage.
9Investigate which mammals can be found in Australia’s arid environments. Classify each of these mammals as placentals, monotremes or marsupials. List any specific Latin double names (genus and species) given for each animal.
Quiz me
Complete the Quiz me to check how well you’ve mastered the learning intentions and to be assigned a worksheet at your level.
No part of this publication may be reproduced, stored in a retrieval system or transmitted in any form or by any means.


• Describe the role of taxonomists in identifying and naming new species.
• Evaluate the reliability of primary and secondary data.
Taxonomists are scientists who research the classification of new species. There are many organisms in Australia that are yet to be identified. This requires the identification and analysis of primary and secondary data to classify and name the new organism.
type specimen the specimen used for naming and describing a new species
When a new organism is discovered, it must fi rst be compared with other known organisms to determine if it is different and unique. This is not as simple as it might fi rst seem. For example, in 2012, a new species of horse fly was identified in Queensland by Australian entomologist Bryan Lessard. Like many insects, fl ies have different stages in their life cycle (Figure 1).
When a specimen is collected, it is not always known if it is a fully mature organism. The specimen needs to be compared with other type specimens. A type specimen is usually one of the fi rst organisms that were collected of each species. It could be a dried plant, a preserved animal or a fossil. These specimens are usually stored in a museum or herbarium.

In 2018, the Australian National Insect Collection was digitised to preserve their almost 15 million biological specimens (Figures 2 and 3). Each specimen was photographed under a microscope and the details recorded. Citizen scientists (members of the public who collect and record data) then recorded the information from the individual labels, allowing the taxonomists to use this information to create an online key that can be used to identify new specimens.


There are many rules that must be followed when a new organism is identified. Before it can be named, the organism must be accurately described, drawn and a type specimen preserved. The phylum, class, order and genus must be identified before the species can be named. One of the rules is that the organism cannot be named after the scientist who discovered it. This means if you did fi nd a new species and sent through the taxonomy process, you could not use your own name.
This does not mean you cannot name it after someone else. Many famous people have animals named after them. After naming almost 50 different species of fl ies, Lessard named the horse fly with a golden back Scaptia beyonceae , after the singer Beyoncé (Figure 4).
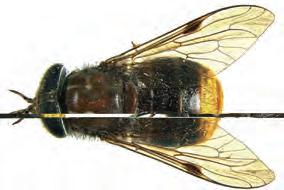

Other taxonomists used names to indicate their sense of humour, including beetles named ‘not another one’ (Cyclocephala nodanotherwon) and fl ies named ‘piece of cake’ (Pieza kake).
There are two sources of data that can be used in scientific research such as taxonomy. Primary data is data collected by the scientist. Secondary data is the data that has already been collected by other scientists. When naming a new organism, the primary data includes the drawings and descriptions of newly discovered organisms. This is then compared with the secondary data of other samples that is stored by the CSIRO in the National Research Collections Australia.
Not all secondary sources of information are as trustworthy as the CSIRO.
Identify a source of information located on a website and answer the following questions.
1 Identify who wrote the information or gathered the data. Did they make their observations or measurements in a fair manner, or were they biased (had already decided what they wanted to observe)?
2 Is the source of information a primary source (did the authors make the measurements themselves) or a secondary source (reporting on other people’s observations)?
3 When was the information generated? How old is the data? Is it still relevant to your needs?
4 Why did the author write the information or gather the data? Did they want to convince the reader of their view of the world? Does the author gain anything from publishing the data?
1Identify a reason for classifying living things.
A Classification helps scientists invent more ways of discussing organisms.
B Classification helps scientists to communicate new discoveries.
C Classification helps scientists to keep new information to themselves.
D Classification helps scientists to shelter living things.
2Identify which of the following is an example of a micro-organism.
A bacterium
B chicken C kelp D sand
3Identify an example of plants moving by themselves.
4Name the five main classes of vertebrates and give an example of each.
5Name two phyla of invertebrates and give an example of each.
6Describe the advantages of using a dichotomous key.
7Explain why it is important for scientists to use a common system to group all living things on the Earth.
8Describe an example of a plant that has the following characteristic: a spores b seeds c vascular tissues.
9Identify an example of a plant that does not have flowers with petals. Describe the alternative structure that allows the plant to produce seeds.
10 ‘Biodiversity’ is the word used by scientists to describe a variety of different organisms in the same region. Explain why it is important to preserve a large biodiversity of plants and animals in the world.
11 Imagine that an unknown organism was discovered during a space mission and brought back to Earth. Briefly describe two different methods that scientists could use to decide whether it was living or non-living.
12Contrast a monocotyledon leaf and a dicotyledon leaf.
13Contrast vertebrates and invertebrates by writing a definition for each.
14Categorise the items from the following list into the correct columns in Table 1: stewed apple, iPod, daffodil bulb, DVD, hairs in your brush, your teacher, shark’s tooth, germs, soft drink bottle, your pet, silver chain, dinosaur skeleton.
Table 1 Living or non-living? Living Non-living Currently living Dead
Figure 1 Is this dinosaur skeleton living, non-living or dead?
15 Use Table 2 to help you identify which phylum the following invertebrates belong to: a centipedes b octopuses c coral d leeches.

1 Body spongy, with many holes Poriferan
Body not spongyGo to 2
2 Soft body, no shellGo to 3 Outside shell or hard cover Go to 6
3 Many tentacles or arms Go to 4 Long body without tentacles Go to 5
4 Tentacles around the mouth of a sac-like body
Cnidarian Arms with suction discs Mollusc
5 Soft body, large foot Mollusc Worm-like or leaf-like Nematode, platyhelminth or annelid
6 Proper shell or smooth, hard covering Go to 7 Spiny skin with rough covering Echinoderm
7 Limbs in pairs Arthropod Shell, no segments, large foot Mollusc
Table 3 Types and numbers of living things on the Earth
Group
Number of species described
16 Look at Figure 2 and Figure 3 and identify which class each vertebrate belongs to.
Figure 2 A cockatoo Figure 3 A frog

17 Refer to Figure 1 in Topic 5.3 showing Dr Redback’s family. Propose how the dichotomous keys in Figures 2 and 3 could be modified if his ‘family’ included his sister, Melinda; his mother, Frances; he had two daughters, Stef and Gemma (Stef wears glasses); and he had a pet lizard named Stealth but not a bird named Charlie.
18 One of the main contributors to the Encyclopedia of Life is the Atlas of Living Australia. Do an internet search for the Atlas of Living Australia and click on ‘Explore’. From this page, you can create a species list and map for the area in which you live.
aIdentify the most frequently seen animal in your area.
bIdentify the most frequently seen plant in your area.
19 Look at Table 3, showing the number of living things on the Earth.
aDetermine the number of plant species that were estimated to be on the Earth in 2009.
bContrast the number of known plant species with the total number of known animal species (add animals without a backbone and animals with a backbone together).
Number of species estimated to exist
Percentage of total estimated number of living things (%)
Animals with internal backbones (vertebrates) 64 788 80 500 0.7
Animals without a backbone (invertebrates)
1 359 365 6 755 830 61.8
Plants 297 857 390 800 3.6
Fungi 98 998 1 500 000 13.7
Bacteria (Monera) 35 351 >1 200 500 11
Algae and protozoa (Protista) 28 871 >1 000 000 9.2
Total number of species
1 885 230 >10 927 630 100
Source: Chapman, A. D. 2009, Numbers of Living Species in Australia and the World, 2nd edn.

20 There is often conflict between the rights of animals and those of humans. Animal rights supporters believe it is wrong to use animals in any way. In contrast, animal welfare supporters believe it is acceptable for humans to use animals (such as testing vaccines) as long as the animals do not suffer. Write two reasons that support the view of each group. Discuss the reasons with others in your class.
21 Download and print a copy of Figure 4 from your obook.
a Cut out the pictures of the insects.
b On you r own, sort the insects into groups based on appearance. Justify your system of classification (by explaining why you made each decision).
cCompare your groupings with those of a partner. Together, identify a third way to classify the insects.
d With your partner, create a dichotomous key.
24 Choose one of the topics to present a report in a format of your choice. Some ideas have been included to get you started. Your report must include a classification key.
Write a newspaper article about how life on Earth is organised. It needs to be about two pages long (no more than 500 words). You should explain how living things are classified for an audience unfamiliar with science. Make a list of the living things whose images you would like to use to illustrate the article. Try to find their scientific and common names. Your article must contain a key of some description.
You have just returned from a trip to a remote mountain area of the Kimberley, in Western Australia. While there, you took your portable microscope and examined water from a previously unknown lake. To your surprise, you found some new creatures in the water that look a bit like bacteria. They are singlecelled and are either square or oval; some are hairy (have hairs either on the end of the cell or along the edge of the whole cell).
» Draw six different versions of these organisms.
» Create a dichotomous key for these six new organisms so that you can describe them to other scientists.
» Name e ach of the groups at the bottom of your key.
» Assu ming they are a type of bacterium, identify the kingdom to which they would belong.
22 Design an experiment to show that plants are living things that respond to stimuli. Choose one stimulus (such as reaction to light or a lack of water) to investigate. This stimulus is the experimental variable, so you will need to change the variable in some way and control the rest of the variables. Make a list of the equipment you would need.
23Discuss why the invention of the microscope was important to the development of the classification system.
Living organisms are not the only things that can be classified. The remains or impression of prehistoric plants or animals that are found in rock can also be classified according to their unique characteristics.
» Identify a photo of a fossil.
» Desc ribe the characteristics that could be used to classify it.
» Identify the group it could belong to in the Linnaean classification system.
» Just ify your decision by comparing it to another organisms in the same group.
Now that you have completed this chapter, reflect on your ability to do the following.
I can do this.
• Explain the purpose of classification systems and how they are used by scientists.
• Describe the eight characteristics shared by all living things using the acronym MR N GREWW.
• Construct and use tabular and dichotomous keys for classification.
• Describe the two-part naming system devised by Linnaeus.
• Identify the genus and species of an organism from its two-part name.
• Explain how living things have been classified into different kingdoms.
• Describe how classification of organisms changes as new information becomes available.
• Explain that invertebrates have either an exoskeleton or no skeleton.
• Identify the six main phyla of invertebrates.
• Distinguish between vertebrates and invertebrates.
• Identify the five classes of vertebrates and use the terms ‘endotherm’ and ‘ectotherm’ to group them.
• Explain that plants are generally classified according to how they transport nutrients or how they reproduce.
• Categorise plants using a key.
• Describe some of the ways in which First Nations peoples classified and communicated their understanding of local flora and fauna.
• Describe the role of taxonomists in identifying and naming new species.
• Evaluate the reliability of primary and secondary data.
Chapter quiz Test your understanding of this chapter with the chapter review quiz.
Launch
I cannot do this yet.
Go back to Topic 5.1 ‘Classification organises our world’. Page 116
Go back to Topic 5.2 ‘Living organisms have characteristics in common’. Page 118
Go back to Topic 5.3 ‘Classification keys are visual tools’. Page 120
Go back to Topic 5.4 ‘The classification system continues to change’. Page 122
Go back to Topic 5.5 ‘Kingdoms can be used to classify organisms’. Page 124
Go back to Topic 5.6 ‘Animals that have no skeleton are called invertebrates’. Page 126
Go back to Topic 5.7 ‘Vertebrates can be organised into five classes’. Page 128
Go back to Topic 5.8 ‘Plants can be classified according to their characteristics’. Page 130
Go back to Topic 5.9 ‘The first Australian scientists classified their environment’. Page 132
Go back to Topic 5.10 ‘ Science as a human endeavour: Taxonomists classify new species’. Page 134


By the end of this topic, you will be able to:
• Define producer and consumer and identify examples of each.
• Construct and interpret food chains and food webs.
Interactive 6.1 Food chains
a diagram that shows who eats whom in an ecosystem, and how nutrients and energy are passed on
• Scientists use a food chain to show the flow of food and energy in an ecosystem.
• Producers are found at the start of the food chain.

• Consumers need to gain their energy from other organisms.

• Food webs have many interlinking food chains.

A food chain is a way to show the direction that nutrients and energy flow between organisms. It consists of a chain of arrows that always points from the food to the animal doing the eating. For example, a centipede eats a wolf spider. This means the arrow points from the wolf spider to the centipede (Figure 1). The wolf spider provides the centipede with energy to grow and move.
In Figure 4 the mountain water skink is a fi rst-order consumer because it eats plants. Because the noisy miner bird eats a fi rstorder consumer, it is called a second-order (secondary) consumer. The feral cat eats the second-order consumer and becomes a thirdorder (tertiary) consumer. Most food chains only have four to five organisms in them. This is because only some of the energy is stored in the consumers. The rest is converted into heat and movement by the organism.
Plants and plant-like organisms are always found at the start of food chains because they only need air, water, sunlight and a few trace minerals to live and grow. These organisms are known as the producers of the ecosystem. Most producers convert light energy from the Sun into sugars (stored chemical energy). These sugars are known as biological molecules and are stored in the leaves, stems and roots.
Animals cannot use the Sun’s energy in this way. They are consumers and must eat other organisms to get the energy they need to survive. They use this energy to stay alive – to pump their blood, to move their muscles and to operate their nerves. The fi rst consumers in a food chain are also referred to as fi rst-order (primary) consumers
Most animals, including humans, will eat more than one type of food. This can be represented in a food web, which shows several food chains intertwined. Some consumers will have several labels, depending on their eating habits.
Figure 5 shows a food web in which there are four different producers. In this example, the mouse can be considered both a primary and secondary consumer because it eats a producer (wheat seeds) and primary consumers (snail and beetle). In this food web, the snail is only a primary consumer because it only eats producers (the trees).
Food webs show how every living thing in the environment needs every other living thing to survive. When people talk about the ‘web of life’, they are referring to the interactions between all living things.

Figure 4 A food chain showing the feral cat as a thirdorder consumer


producer a plant or plant-like organism that is at the start of food chain because it produces its own food, usually using sunlight
6.1 Check your learning
Retrieve


1Identify where producer plants get their energy.


Comprehend


2Describe how the direction of arrows in a food chain is decided.
Analyse
3Contrast food chains and food webs.


4Examine the food web in Figure 5.
aIdentify an animal that is both a secondary and a tertiary consumer.


bClassify the type of consumer of the snake in this food web.

Apply
5 Imagine that you were asked to fi nd out how many different types of animals lived in your backyard or local park. Discuss how you would go about fi nding this out. ( HINT: Would it be possible to individually count them all?)
6Construct your own food web of organisms that you would fi nd in the local park. Correctly identify the producer and all the consumers.
Quiz me
Complete the Quiz me to check how well you’ve mastered the learning intentions and to be assigned a worksheet at your level.
consumer an animal that can’t convert the Sun’s energy into sugars and instead must eat to get the energy it needs to survive
fi
rst-order (primary) consumer an organism that eats only producers such as plants, algae and bacteria; it does not eat other consumers second-order (secondary) consumer a carnivore that eats primary consumers third-order (tertiary) consumer a carnivore that eats primary and secondary consumers and is therefore at the top of the food chain food web several intertwined food chains, showing the extended relationships between different organisms
No part of this publication may be reproduced, stored in a retrieval system or transmitted in any form or by any means.
By the end of this topic, you will be able to:
• Define the term ‘ecosystem’.
• Explain the different types of relationships that can exist within ecosystems.
ecosystem a community of living organisms and their nonliving surroundings population a group of individuals of the same species living in the same location at the same time community different populations living in the same location at the same time predator an animal that hunts and feeds on another (prey) for food prey an animal that is hunted and killed by another (predator) for food
• An ecosystem is a community of living organisms and their surroundings.
• Predators eat prey.
• Symbiotic relationships are long term relationships.
When studying the environment, we can look at a small part such as the organisms living in or on a log, or we can study a whole forest. When we study a large area with a lot of living organisms and non-living things (such as hot temperatures, little light or water), we say that we are studying an ecosystem .
Ecosystems vary in size. They can be as small as a puddle or as large as the Earth itself. Ecosystems are made up of populations.
A population is a group of living organisms that are the same species, living in the same place at the same time. When different populations interact with one another, they are called a community. For example, a population of humans can live in a town together. When all the plants in their gardens and their pets are included, then it becomes a community.
An ecosystem must supply all the needs of the organisms, such as food, water, warm temperatures, oxygen and minerals. These make up the non-living parts of the ecosystem. If these conditions are wrong for a population, then the individuals in that population will move to a better ecosystem or they will die out.
In a predator–prey relationship, one organism (the predator) eats another (the prey). This relationship only lasts for a short time (until the prey is eaten), and it only happens when a predator is hungry. An example of this is the relationship between a fox and a rabbit (Figure 2). The two species only meet when the fox is hungry and starts hunting the rabbit (the prey). When the rabbit is caught, the relationship ends.

Figure 1 Wetlands such as those in Kakadu National Park in the Northern Territory are an example of an ecosystem.

Predator species and their prey species have a balanced relationship. If all the prey are eaten, then the predators will starve. As the number of predators decreases (shown by the graph going down in Figure 3), the number of prey will increase again because they are not being hunted as often. This makes the prey numbers in a graph go up. When the number of prey goes up, the predators can hunt more food. This means a predator–prey graph will always show the predator line following the prey line. Figure 3 shows this pattern.
Prey Predator
Time
Figure 3 A predator–prey graph – the scales aren’t shown but the prey numbers are mostly greater than those of the predators. Notice that the increase and decrease in prey numbers usually comes before the increase and decrease in predator numbers.
Competition may also exist between members of different species that need the same food (Figure 4) or shelter. If one species grows quicker, then any species trying to compete may ‘lose’ and die. Usually, competing species will balance their numbers so that neither one dominates.
Sometimes inhibition competition occurs when one organism produces a chemical that directly inhibits or blocks the survival or growth of another organism (Figures 5 and 6).
Periwinkle Limpet


competition contest between organisms that require or seek similar resources such as shelter and food
Figure 4 A
)
food
(
) on a
platform –both species feed on algae growing on the rocks. The periwinkle moves faster but does not eat all the algae in its path. This means there is some food left for the limpet. Both species can survive because the periwinkles usually leave some algae behind for the limpets. However, when the periwinkles are removed, the limpet population increases.
No part of this publication may be reproduced, stored in a retrieval system or transmitted in any form or by any means.

symbiosis a close physical relationship between two organisms of different species

mutualism a type of relationship between two organisms of different species, in which both organisms benefit
a type of relationship between two organisms of different species, in which one organism benefits and the other is not affected
parasitism a relationship in which one organism (parasite) lives in or on the body of another organism (host) and benefits while the host is harmed
Symbiosis happens when two organisms of different species live physically close to each other for a long time. Mutualism, commensalism and parasitism are all examples of symbiosis.

Mutualism is a relationship between two organisms in which both organisms are able to help each other to survive. They both benefit.


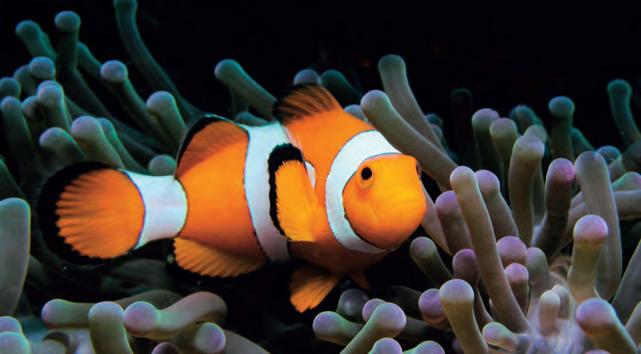
Commensalism is a relationship in which one organism benefits and survives while the other organism does not notice and is not affected. Commensalism does not happen very often in an ecosystem because it is unlikely that an organism does not notice another organism is living so closely to it.
Parasitism is a relationship in which one organism (the parasite) lives in or on the body of another (the host). The parasite benefits by taking some of the food and nutrients from the host. This means the host often struggles to survive with less food. Sometimes that parasite can even kill the host.
6.2: What if more seeds were planted in a pot? Go to
Figure 13 Parasitism Leeches are parasites that survive by sucking the blood from other animals.

Figure 12 Parasitism Hookworms attach to the inside of a human or animal intestine, feeding on passing nutrients. If the host doesn’t eat enough, the worm has been known to burrow out of the intestines and travel to other organs, where they can cause damage to the host.

Retrieve
1Define symbiosis. Comprehend
2Describe an example of the following relationships. a predator–prey b mutualism c commensalism d parasite–host
3Explain why a large plant that produces a lot of shade prevents smaller plants from growing.
Analyse
4Contrast (note the similarities and differences between) a predator–prey relationship and parasitism.
Apply
5 Some eucalyptus trees have mistletoe plants living on them. Mistletoe has very similar leaves to eucalyptus leaves. Mistletoe can make its own food, but the stems send suckers into the eucalypt to obtain water and minerals. If too
much water and minerals are removed, the eucalypt can die. Identify the type of relationship that exists between the eucalypt and the mistletoe. Justify your answer (by defi ning the relationship and matching it to this example).
6 Epiphytes are plants, such as ferns and some orchids, that grow high in the branches of other trees, especially rainforest trees. The epiphytes obtain sufficient light to make their own food, collect water from the moist air and obtain minerals from the decaying leaf litter that they catch at their leaf bases. The tree is not affected by these plants. Identify the type of relationship that is described. Justify your answer (by describing how each species benefits from, doesn’t notice or is harmed by the relationship).
Quiz me
Complete the Quiz me to check how well you’ve mastered the learning intentions and to be assigned a worksheet at your level.
No part of this publication may be reproduced, stored in a retrieval system or transmitted in any form or by any means.
By the end of this topic, you will be able to:
• Define the terms ‘herbivore’, ‘carnivore’ and omnivore’.
• Describe how energy flows through an ecosystem.
• Animals that only eat plants are called herbivores.
• Animals that only eat other animals are called carnivores.
• Animals that eat both plants and animals, like humans, are called omnivores.
• Microorganisms obtain energy by breaking down dead organisms.
All food chains show the transfer of energy from the organism that is eaten to the consumer. This transfer of energy is shown by the direction of the arrow in the food chain or web. The source of energy in most food webs is light energy from the sun. Even in caves, where there is no sunlight, there may be energy from dead plants and animals, which originally obtained their energy from the Sun. An exception is chemosynthetic bacteria on the ocean floor and in the craters of volcanoes – these bacteria trap the energy from chemicals and chemical reactions occurring under the Earth’s crust.
Sugars like glucose provide chemical energy that plants can use to make new leaves and stems. Animals that eat plants are called fi rstorder consumers or herbivores. The chemical energy in the plant is used by the animal to move and grow. Some of the energy is stored in the muscles and fat of the animal. When a second-order consumer or carnivore such as a dog eats the herbivore, it is able to use the energy in the fat and muscle to keep hunting. Humans eat both meat and plants, making them omnivores. Every time the plants and animals grow and move, the chemical energy is transferred to movement energy.
Figure 1 Plants use energy from the Sun to grow and repair.

Living things need energy to grow and repair, to defend themselves, and to move around. Plants, some algae and some bacteria are able to transform the light energy from the sun into chemical energy through a process called photosynthesis . In this process, the plant takes in water from the roots and carbon dioxide through their leaves. The water is transported to the leaves, where it is combined with the carbon dioxide to make glucose (a sugar) and oxygen. This can be shown by a word equation for photosynthesis:
carbon dioxide + water → glucose + oxygen


Sun
herbivore an animal that eats only plants carnivore an animal that eats other animals DRAFT
Figure 2 An example of the movement of energy through an ecosystem, where each green arrow represents the transfer of energy

As well as energy, locked inside all organisms is an enormous amount of nutrients. All organisms in a food web end up passing these nutrients and energy on to decomposers. Decomposers – such as bacteria, fungi and invertebrates (slugs and worms) – get the food they need by feeding on dead things. This breaks down the dead organisms and prevents them from piling up. Instead, the chemical energy in the dead organism’s muscle and fat are used for energy by the decomposers. When another organism eats a decomposer, the particles (atoms) that make up the nutrients once again become part of the food chain. The nutrients that pass through the decomposers as waste end up in the soil as
Figure 3 Decomposers recycle important nutrients in an ecosystem.
6.3 Check your learning
simpler particles. Plant roots can then absorb the nutrients and the cycle starts again. Imagine what life would be like without decomposers!
Figure 4 Mushrooms (fungi) are decomposers. They get the nutrients they need by feeding on dead things, such as rotting logs.


If you poured dirty water through a fi lter, you would expect cleaner water to come out. A similar thing happens in nature when water passes through a forest or wetland ecosystem. By slowing the flow of water, the plants and bacteria trap some of the pollutants and sediments. But plants are not the only living things that clean water. Aquatic animals, such as freshwater clams, pump water through their bodies to fi lter out food for themselves and, in so doing, clean the water they live in.


1Identify the term used to describe animals that eat both meat and plants.
2Identify the following as either an input or an output of photosynthesis. a carbon dioxide b glucose c water Comprehend

3Describe one consequence that may occur if decomposers did not exist. Analyse
4Compare the similarities between the following terms: producer, fi rst-order consumer, second-order consumer, herbivore, carnivore, photosynthesising organism.
Apply
5 We get the energy we need by eating other living organisms. Determine the source of energy for the following organisms. a Plants b Herbivores c Decomposers
6 ‘Photosynthesis is the most important metabolic process on Earth.’ Evaluate the above statement by: adescribing why photosynthesis is important in an ecosystem bdescribing what would happen if photosynthesis was not able to occur cdeciding whether the statement is correct.
Quiz me
Complete the Quiz me to check how well you’ve mastered the learning intentions and to be assigned a worksheet at your level.
decomposer an organism that gains nutrients by breaking down dead organisms into simpler nutrients No part of this publication may be reproduced, stored in a retrieval system or transmitted in any form or by any means.
By the end of this topic, you will be able to:
• Distinguish between abiotic and biotic factors.
• Explain how different factors can cause a population to increase or decrease.
• All populations are in a constantly changing equilibrium.
• Deaths and emigration can decrease a population.
• Births and immigration can increase a population.
Like a population of humans in a city, the population of living organisms in an ecosystem is constantly changing. In a drought there are high temperatures and little rain. This can make it hard for plant and animal populations to survive. The amount of water or temperature are non-living factors (called abiotic factors) that can affect the size of a population. Other abiotic factors that can affect the number of organisms in a population include the amount of sunlight, salt in the water, soil, available nutrients or places for the organism to hide.
All organisms live in a complex web of interdependent relationships – with each other and with their environment. In an ecosystem, there needs to be a balance so that all species can survive. The more types of organisms in an ecosystem, the healthier the community of organisms in the ecosystem.
abiotic factors non-living factors that influence an ecosystem, such as wind, water, salinity and temperature biotic factors living factors that influence an ecosystem, such as animals, plants and bacteria immigrate when an animal enters a new ecosystem emigrate when an animal leaves an ecosystem No part of this publication
Sometimes it is the number of other organisms competing for food or hunting them which can affect the number of organisms in a population. These ‘living’ factors that affect the survival of organisms are called biotic factors
Many things can cause a population of organisms to increase in number. A population of birds will increase when new chicks are born, or when new birds fl y into the ecosystem ( immigrate). In contrast, the number of birds in the population will decrease if some birds die because of hunger or because they are hunted. Sometimes the birds will leave to fl y to another ecosystem (emigrate) (Figure 2). Figure 1 A comparison of abiotic and biotic factors
Ecosystem balance constantly changes before returning to a new stable balance. This is called a dynamic equilibrium. Changes may upset the equilibrium, but another new equilibrium arises. Often, the change is only a small one. Changes in ecosystems occur naturally but they may be intensified by external abiotic factors such as floods and bushfi res. Reproduction, death, migration, natural events (such as seasonal changes), disasters (floods, droughts, earthquakes) and human intervention occur regularly. Biotic factors, such as the loss of a species or the introduction of a new species, can also change a population.
Whenever the size of a population changes, it can affect other organisms in the ecosystem’s food web.
Consider the food web for an ecosystem shown in Figure 3. If the number of frogs decreased in this ecosystem, the effects could include:
> an increase in grasshopper numbers, causing the amount of grass to decrease
> an initial increase in praying mantis numbers because of more grasshoppers
> a decrease in lizard numbers
> more birds eating praying mantises rather than frogs and lizards
> a decrease in praying mantis numbers because they are being eaten by birds
> further increase in grasshopper numbers who then start eating the grass. If this was severe enough, the ecosystem would be at risk, because all food webs depend on a good supply of producers.
The most likely outcome is that the bird population would decrease, so all species would return to balance with smaller population sizes. A positive effect is that decreased bird numbers might enable the frog population to recover.

Population dynamics is the study of changes in population numbers within ecosystems. If scientists can measure how many of each species are in a certain location, they can make predictions and try to prevent a species becoming extinct.
Regular sampling provides information about increases and decreases in population numbers, and causes can be identified.
population dynamics the study of changes in species population numbers and the factors that may contribute to these changes
No part of this publication may be reproduced, stored in a retrieval system or transmitted in any form or by any means.
a randomly selected square plot used to estimate the number of organisms
capture–recapture a method of estimating the number of organisms by capturing, marking and releasing a sample of the organisms

There are many ways to measure the size of a population. The simplest way would be to count all the organisms, but in practice this is very difficult. It is easier to estimate the total population by counting a sample from a helicopter, or by using quadrats or capture–recapture methods. For human populations, a census is the usual method.
For plants and stationary animals, quadrats (randomly selected square plots) are marked in an ecosystem (Figure 4). The organisms in each plot are counted and used to calculate the average number of organisms in each square plot. The total number of organisms in the whole ecosystem can then be calculated by multiplying the average number of organisms by the area of the ecosystem. This method works well if a large number of quadrats are used and the organisms are evenly spread throughout the ecosystem.

For animals that are moving, capture–recapture is a popular method. Animals are captured in traps and marked with tags, correction fluid or permanent marker on their tails.
The number counted on the first capture are called tagged animals (Figure 5). The animals are then released and it is assumed that they move evenly throughout the population. Another capture (recapture) is made one
or two days (or nights) later. Some of these recaptured animals will have tags. An estimate of the population is then obtained using these three numbers:
Total number of animals = number of tagged animals × number of recaptured animals ÷ number of tagged animals recaptured
Capt ure–recapture is a good way to estimate the population size of small Australian mammals, such as the marsupial Antechinus (the common bush rat). Because most native Australian mammals are nocturnal, the traps may be set at night and checked the next morning.
When tags or quadrats are used to count organisms, it can disrupt their environment and affect the way the animals behave. Modern counting methods can avoid this disturbance by using remote sensors that detect movement and turn on unmanned cameras (Figure 6). These images allow scientists to count the number of animals moving in an area and to study how animals behave when humans are not around. Other ways to identify animals is to record the calls they make to one another. This recording can then be used to identify the species of animal and the number of them making and replying to the calls.
Figure 4 Using a quadrat
Scientists wanted to determine the size of a bilby population in a small reserve. They used the capture–recapture method to estimate the size of the population. They captured and marked 9 bilbies on the fi rst night and 8 bilbies (4 marked) one week later. Calculate the size of the bilby population.

Solution
Number of tagged/marked animals = 9 Number of recaptured animals = 8
Number of tagged animals recaptured = 4
Estimated number of bilbies = number of tagged animals × number of recaptured animals ÷ number of tagged animals recaptured = 9 × 8 ÷ 4 = 18
Retrieve
1Identify two examples of abiotic factors and two examples of biotic factors. Comprehend
2Describe two ways a population can: a increase b decrease.
3Describe suitable methods for estimating the size of populations of: a plants and stationary animals b other animals.
4Explain how predator–prey relationships achieve a state of balance by describing what happens to the number of predators or prey when: a prey numbers increase b prey numbers decrease c predator numbers increase d predators numbers decrease.
Analyse
5 Students on a field trip with a national park ranger set traps for a small nocturnal marsupial, Antechinus stuartii , in a heathland ecosystem. They captured 8 animals on the fi rst night and marked white dots on their tails. Then they released them. On the second night, they captured 10 animals, of which 4 were marked.
aCalculate the estimated population size of A. stuartii in this ecosystem. bDescribe one way the students could check if their estimated population size was correct.
Apply 6 Desalination plants take the salt out from sea water to produce fresh water for us to drink. The remaining sea water with high levels of salt is returned to the ocean through a fast flow pipe. A study of the desalination plant in Sydney found that the population of the mobile sponges decreased near the returning pipe, while populations of barnacles sticking to the rocks increased. Compare the two populations and propose a hypothesis that might explain the difference between the survival of the two populations.
7Investigate the rules that regulate the type, number and size of fi sh that can be caught in your local area. Write a letter to a local paper explaining why these rules are needed.
Quiz me
Complete the Quiz me to check how well you’ve mastered the learning intentions and to be assigned a worksheet at your level.


By the end of this topic, you will be able to:
• Define introduced species.
• Explain how an introduced species can impact an ecosystem.
• Introduced species can change the amount of food for other organisms.
• New species can cause a new equilibrium in an ecosystem.
• Biological control is the deliberate introduction of a new species to control a non-native plant or animal.

There is a balance between all organisms in a food web. If more grass grows, the number of animals that eat the grass will also grow. In time, the amount of grass available will decrease, which will be balanced by a decrease in the animals who eat the grass. This increase–decrease population cycle is a balance that can be disrupted by introduced species or the removal of predators.

Scarab beetles are a family of beetles that can range in size from 2–70 millimeters in length.

One species from this family, Dermolepida albohirtum can cause a lot of damage to the sugar cane crops in Queensland. The female of this species lay eggs in the soil of the sugar cane. When the larvae hatch, they eat the roots of the cane plant, causing it to die. Cane toads (Rhinella marina) were introduced to Queensland in 1935 in an attempt to control the beetle population (Figure 1). While the cane toads did eat the scarab beetles, they preferred other insects. Cane toads also lacked many natural predators in Australia. When larger animals such as quolls tried to eat the toad, they were killed by the poisonous toxin on the toads’ backs. This meant the cane

Figure 1 Cane toads were introduced to Australia to control scarab beetles in 1935.
Figure 2 The introduction of the cane toad into this food web has affected many other animals.
introduced species an organism that has been brought to and has established itself in an area it is not native to No part of this publication may be reproduced, stored in a retrieval system or transmitted in any form or by any means.
6.5A: Rabbit and fox chasey Go to page 235
toad population (with a lot of food and few predators) could continue to increase.
The introduction of cane toads has also had negative social effects on First Nations peoples who rely on the local ecosystem for food. The yellow-spotted monitor goanna is an important meat source for some First Nations peoples who live in remote communities. Many of these goannas are killed when they try to eat cane toads. This decreases the availability of meat in areas where there is already limited supply of meat and protein.
The Yugul Mangi Aboriginal Ranger group work with government departments to help manage the population and spread of cane toads in Queensland.
In the 1930s, farmers concerned about the lack of grass in the dry parts of Australia brought gamba grass from the tropical savannas of Africa (Figure 3). This grass grows very quickly, taking over land that would usually grow native Australian grasses. Because gamba grass grows so quickly, it produces a lot of vegetation that burns in a bushfire.
6.5B: What if the effectiveness of pollinators was reduced? Go to page 236 EXPERIMENT
It also has the potential to prevent small tree seedlings from growing, changing woodlands to a grassland. While cattle farmers might like the increase in grass for their cattle to eat, it has an environmental impact on the plant and animal life in Kakadu National Park. This means it also has an impact on important food sources and medicines for First Nations peoples who live in that area.
Not all relationships in a food web are easily predicted. In 1985, scientists on Macquarie Island (halfway between Australia and Antarctica) devised a plan to eradicate the cats that had been introduced to the island since the early nineteenth century. The scientists thought that if the cat population decreased, there would be an increase in the native burrowing bird populations on the island. However, the cats were also predators of rabbits. When the cats were gone, the rabbits were no longer hunted. This allowed the rabbits to survive, destroying native plants and affecting many other organisms that were native to the island. Scientists needed to find a way to control the rabbits.

biological control a method of controlling a population by releasing a living organism into an ecosystem disease a disorder or condition that interrupts the normal functioning of an organism immune able to fight an infection as a result of prior exposure

Figure 4 a Before: This slope on Macquarie Island had vegetation as recently as 2007.

b After: The same slope a few years later – it has been ravaged by rabbits since cats were eradicated.
All efforts to control the rabbit population by physical means were unsuccessful. In 1938, CSIRO scientists studied a way to control the population using a living organism ( biological control). They tested a virus called Myxoma for its ability to cause disease in rabbits. This virus causes a disease with symptoms including fever and swelling around the head of the rabbit. Death occurs within 14 days. Myxoma was eventually released in the wild and quickly killed almost all the rabbits that caught the infection. This increased Australia’s wool and meat production within two years. A small percentage of rabbits were unaffected by the disease. These rabbits survived and bred a new population of rabbits that were immune to the disease. New viruses, such as the rabbit calicivirus, have been tried, with similar results.
Before a species is introduced as part of biological control of pests, scientists must model the possible effects on populations that compete for the same food source or the predators that may prey on them. Scientist must effectively map the food web of the ecosystem and how the balance between all organisms in the community will be affected by the introduction of the biological control organism.
The removal or loss of organisms from an ecosystem can have dramatic effects. Amphibians, such as frogs, are an important part of the biosphere: they may be warning us of unsafe environmental conditions that could eventually seriously affect our health. The thin skin of amphibians helps them drink and breathe, but it also makes them vulnerable to environmental contaminants, especially agricultural, industrial and pharmaceutical chemicals. Consequently, they are commonly referred to as indicator species – indicators of environmental health, as well as protectors of human health.
Amphibians watched the dinosaurs come and go, but today almost one-third of them, representing 1896 species, are threatened with extinction. As many as 165 amphibian species may already be extinct and the population numbers of at least 43 per cent of all species are declining. This means that there will be even fewer frogs and other amphibians in the future.
1Identify two reasons why the cane toad population was able to increase so quickly when introduced to Australia.


2Define the term ‘biological control’.
Comprehend
3Describe why cane toads are referred to as an introduced animal in Australia.
4 Use the food web in Figure 5 to suggest two populations that would increase as a result of the introduction of rabbits.
5Explain why some cattle farmers would have supported the introduction of gamba grass to Australia.
6Explain why local First Nations peoples should have been consulted before the gamba grass was introduced.


indicator species an organism that can be used to measure the environmental condition of an area
7Evaluate the ethics of using biological control of rabbits, by: adescribing how Myxoma infection affects the health of a rabbit bdescribing the effect a large rabbit population has on a native environment, including the native plants and animals cdescribing how a large rabbit population affects our ability to grow food ddeciding whether the life (and Myxoma -related death) of a rabbit is more or less important than the effects you described above. (Does the end justify the means?)
Complete the Quiz me to check how well you’ve mastered the learning intentions and to be assigned a worksheet at your level.
By the end of this topic, you will be able to:
• Describe how natural disasters can impact ecosystems.
• Describe how human activity can impact ecosystems.
• Humans compete with other organisms for resources.
• New species can have environmental, social and economic impacts.
• Understanding the impacts allow ecosystems to be maintained.
Animals use resources such as food and water and, in turn, become food for other organisms. The number of resources in an ecosystem is always limited. As the size of a population reaches its maximum carrying capacity (ability of the environment to support it), some of its resources, such as food, space and shelter, will become more limited. This means some organisms will either die or need to emigrate (leave). Once the population decreases, there will be enough resources for those remaining. When this occurs, the population will stabilise (reach its maximum size). The population will find a new balance, or equilibrium.
Natural events, such as the change in seasons, or natural disasters, can disrupt the balance between the biotic (living) and abiotic (non-living) factors in an ecosystem.
natural disasters natural events, such as floods, volcanic eruptions, tsunamis and earthquakes, that can cause severe damage and fatalities
When the weather becomes colder, many animals migrate to warmer areas (Figure 1). As a result, their populations decrease in one environment and increase in another. During the breeding season, usually spring, the numbers of animals will increase. Flowering plants are pollinated and form seeds that spread throughout the environment, and later germinate into seedlings. As the population increases, so does competition for resources. As a result of this competition, some members of the population survive and others die, allowing the population to maintain its balance.

Australia has a widely fluctuating environment. Years of drought can be followed by flooding
carrying capacity the maximum number of organisms in a population that can be sustained by an ecosystem flood the overflow of a large body of water No part of this publication may be reproduced, stored in a retrieval system or transmitted in any form or by any means.
rains. When extreme natural change affects humans, we call these changes natural disasters
Floods are an overflow of water onto dry land, which has an immediate effect on the growth of plants and the germination of seeds. Marine ecosystems do not benefit from floods on land. When the water runs off the land, it brings sediment, pesticides and fertilisers into the marine ecosystem, causing some algal species to dominate the environment. Algal blooms are often deadly to other animals living in the ocean environment.
Floods can be a hazard for some animal life. Small mammals often escape to higher ground. Snakes are flushed out of their cover, as witnessed in the 2022 Queensland floods (Figure 2), and became a potential danger to humans. Aquatic animals benefit enormously from floods. Fish can breed in waters, such as a lake. The increase in fish, insects and waterweeds are a food source for water birds. The extra food encourages the water birds to breed in great numbers, temporarily changing the balance in populations.

Droughts pose an even greater challenge than floods (Figure 3). During a drought, animals migrate to find water. Some animal populations ‘hang on’ during drought, but many populations will decrease until the land looks almost bare. Wind can blow the dry topsoil away from the drought affected area, removing many of the nutrients in the ecosystem.
In an ecosystem with limited resources, humans must compete with other organisms for food and shelter. The human population has grown quickly over the last 200 years. This means we have needed to change the environment so that we can grow food, build homes and find resources so that more and more people can live and work. Many of these changes can affect the local environment (environmental impacts), how people live (social impacts) and how we can work or earn money (economic impacts). Understanding the causes of these impacts will allow us to prevent further damage in the future.
Our landscape was once covered by patches of different types of landscapes, such as swamp, grassland, forest and heath. This variety of vegetation supported many species of animals that moved, reproduced and spread throughout their territories and beyond.
drought a period in which an area experiences water shortage

Today, over 44 per cent of Australia’s original bushland has been cleared since European settlement. Much of that land is used for housing, to grow food or to manufacture products. The food webs that existed in these areas have been changed as new predators (such as dogs and cats) move in and the number of producers decreases.

Figure


Human activities have led to a degradation of the physical environment. Soil erosion is a major problem caused by the clearing of land for agriculture. In ecosystems with many trees, the soil is stabilised by a dense mat of plant roots. Its surface is covered by a layer of leaf litter, which protects the soil surface from erosion by wind and water. Water from rainfall is quickly absorbed through the top layers of soil.
Once land is cleared of trees for agriculture, there is little to protect the soil from the action of wind and water. Grazing by animals with hard hooves, such as cattle, compacts the soil. This slows the absorption of water into the soil and increases the amount of water runoff. This, in turn, erodes the soil. Wind also contributes to the removal of the nutrient-rich topsoil (Figure 5).


More than half of the world’s population lives in cities. The population in the world’s urban areas has grown by more than one billion people since the 1970s. Much of this growth has contributed to a phenomenon or process known as urban sprawl
Urban sprawl means the spread of urban areas into rural areas, such as farmland, forests and coastal lands that lie on the outer edges of cities. Urban sprawl increases the distance between the city centre and its outer edge (Figure 6).


Urban sprawl is common in rapidly developing cities or those with large populations. Some of Australia’s cities rate among the world’s worst in terms of their sprawling nature, particularly because everyone wants their own garden and local parks.


urban sprawl the spreading and expansion of cities and houses into undeveloped land
6.6B: Calculating your ecological footprint Go to page 238
Human activities are contributing to more significant changes to weather and climate. These changes can have a huge impact on ecosystems.
In alpine areas, changing rainfall and temperature patterns alter the amount of suitable wet alpine habitat. This has made it difficult for animals that need the cool environments to survive.

Figure 7 Alpine areas are reducing as the climate changes.
Retrieve
1Define the term ‘carrying capacity’.
Comprehend
2Describe two things you can do to reduce your personal environmental impact (your ecological footprint).
3Describe a possible economic impact of a drought.
4Describe a possible social impact that would occur if the environment surrounding a city was protected so that no new houses could be built.
5 Each winter the cold weather causes the mountain pygmy possum to hibernate (deep sleep). This allows the possum to save energy when the food supplies are low during the winter. Describe how a warming climate could affect the mountain pygmy possum’s ability to hibernate and survive each winter.

6Create a two-column table with the headings ‘Problems’ and ‘Solutions’. In the ‘Problems’ column, list the types of things that people do that affect wildlife, such as building homes and roads, and cutting down trees. In the ‘Solutions’ column, propose solutions to each problem.
Quiz me Complete the Quiz me to check how well you’ve mastered the learning intentions and to be assigned a worksheet at your level.
No part of this publication may be reproduced, stored in a retrieval system or transmitted in any form or by any means.
Different communities have different views on how to manage their local ecosystems. The growing population needs food to support it. Maximising food production while maintaining resources, such as soil and nutrients, can be difficult. The ability to see an ecosystem from another’s perspective can be useful.
Humans first came to Australia over 60 000 ye ars ago. They travelled out of Africa, through South-East Asia, before arriving at northern Australia.
These First Nations peoples were hunter–gatherers and early farmers who respected
the land because it provided them with the resources for life – food, water, shelter and medicine.
As original inhabitants of the land, First Nations peoples are aware of the balance that exists in an ecosystem. For thousands of years, the Kaurareg people of the lower Western Islands of the Torres Strait worked with the traditional owners of the surrounding islands so that the harvesting of the local turtles and dugongs was sustained for future generations. Small or pregnant dugongs, and dugong mothers and calves are not hunted so that the population can continue to reproduce in the future (Figure 1). Experienced First Nations ecologists can even determine if a dugong has had calves in the past. The Western Islanders keep the skull bones to check that they have not exceeded their quota.
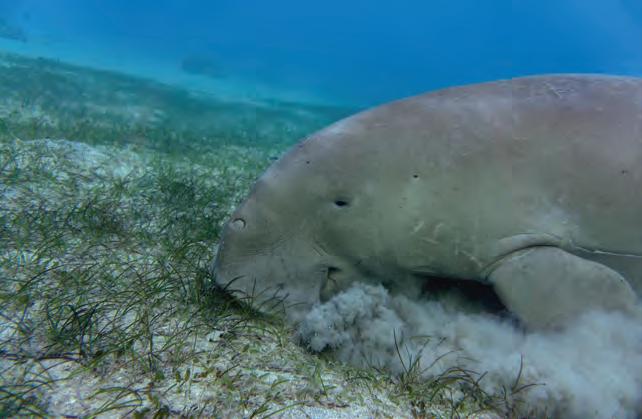
First Nations peoples are aware of the seasonal nature of plant and animal life in the surrounding ecosystems. Turtles only lays eggs for a few months each year. If all the eggs are collected and eaten, then there will be no turtles to lay eggs in the future. First Nations peoples use oral stories to explain the importance of keeping this balance and to identify the right time to collect the number of eggs that is allowed (Figure 2). These traditions continue today through the collaboration and shared responsibility for marine conservation.
Instead of considering the land to be owned by a person or group of people, to be cleared and used according to their needs, First Nations peoples consider land management to be based on shared ownership and a deep respect for the land. As Indigenous Person of the Year 1999, Bob Randall, said, ‘We do not own the land. The land owns us.’


There is increasing recognition of the First Nations peoples’ use of ‘cool burning’ to control bushfires and reduce the emission of greenhouse gases (Figure 4). Early in spring, the grasses are not as dry. Any fires lit burn slowly and are put out by the heavy nighttime dew. This means small fires can be lit to reduce the grasses that form the undergrowth under treetops or canopies. If small patches of undergrowth are burnt, the nutrient matter is cycled back into the soil without destroying all the food available. The trees that form shelter for the animals in the area are also protected. Within a short time, new green growth can occur, providing a new source of food for the young animals that are born during this time. This cool burning process has been used by First Nations peoples for thousands of years and many plants, such as the grass tree (Xanthorrhoea), have evolved to only flower when the base of the tree has been burnt by fire. Other plants, such as Eucalyptus species have evolved epicormic buds with the ability to regrow branches from deep under thick bark, and lignotubers that can grow new shoots from roots protected from fire under the ground (Figure 5).


First Nations peoples are also careful to not waste the resources in their environment. A good example is the way they use the different parts of the grass tree. They use:
> the shaft as a spear
> resi n from the plant for sticking things together
> necta r from the flowers for food
> leaf bases for food
> insects that feed on the flowers for food.
If cool burning is repeated each year, the slow limited burning reduces the release of greenhouse gases (especially methane and nitrous oxide) and the carbon remains trapped in the unburnt large trees and bushes.
As the population of Australia has increased, so too has the need for food. This need for food must be balanced with keeping the variety of unique plants and animals (the biodiversity) of the unique Australian ecosystem.
In Australia, we currently have plenty of food, thanks to a strong agricultural community. Irrigation of large areas allows the crops to survive. As shown in Figure 6, Australian farmers have become more effective in their use of water, protecting this important resource for future generations.
In 2018, tropical Cyclone Debbie hit the coast of Queensland, causing major property damage, power outages and millions of dollars of damage to Australia’s sugar cane industry. Global warming is expected to cause storms of this magnitude to become more frequent and spread over larger areas. Some scientists predict that droughts may also become increasingly frequent in all areas of Australia. This will have an impact on the types of crops that can grow in many areas.
In 2010, Australia’s Chief Scientist made some recommendations to enable us to maintain the food production needed to feed Australia and the rest of the world while minimising the impact on the ecosystem.
> Coordinate programs that maintain current food production levels.
> Research methods and crops that would be able to cope with drought conditions.
> Develop methods that allow more efficient use of water and nutrients in agricultural areas.
> Encou rage more scientists and engineers to work in agriculture. This means that agriculture is looking to science and technology to help maintain a balance between food production and biodiversity of the environment (Figure 7).
Figure 7 Scientists are developing ways to use water more efficiently. a Traditional irrigation b Modern micro-irrigation system

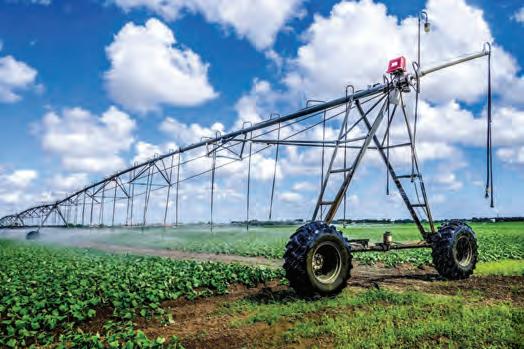
First Nations peoples have traditions of using oral stories to pass on their history and culture. These stories have passed on important environmental information. For example, elders of the Bidjara people of southern Queensland have shared the knowledge for generations about the journey of the Mundagudda or ‘rainbow serpent’. The journey of the Mundagudda on land is said to have created rivers, waterways and gorges. These stories provide guidance to navigating the environmental landscape and its different features.
The ability to learn from listening to members of the community is a valuable skill. Interviewing the older people in your life, such as your parent, guardian or grandparent, can allow you to gain an understanding of the environment in your area and how it may have changed over time.
A good interview that gathers qualitative data requires planning. Consider each of the following points and use them to plan and conduct your own interview.
1 Find a good location: people are often more comfortable in a familiar place and will therefore tell better stories.
2 Write down your questions: consider what you want to know before you start
the interview. Is there background knowledge that you should know before the interview?
3 Be prepared to wait: your interviewee might need time to think before answering your questions. Despite the awkwardness of silence, it is worth waiting for the answer.
4 Listen to the answers: one of the most difficult things to do in an interview is to listen to what is said instead of planning what questions to ask next. If you listen to the answer, you will be able to ask follow-up questions that turn the interview into a conversation.
5 Record the answers: this can be as simple as a voice or video recording on your phone. But make sure you ask for permission fi rst. Alternatively, you could write down the answers; however, this can interrupt the flow of conversation.
6 Check the stories against other records to confi rm when the events might have occurred: sometimes memories can change, or the dates can become difficult to remember. It can also help to fi ll in the details when you record the qualitative oral data for future generations.
1Identify the organism in Figure 1 that is the producer in the food chain.
Mouse Snake Owl Corn
Figure 1 A food chain
A Corn B Mouse C Snake D Owl
2Identify the organism that is the second-order consumer in Figure 1.
A Corn B Mouse C Snake D Owl
3Identify the organism that is the herbivore in Figure 1. A Corn B Mouse C Snake D Owl
4Define the term ‘ecological footprint’.
5Define the term ‘urban sprawl’.
6Describe one practice First Nations peoples have used to make sure they do not disrupt the environment too much.
7Describe one example of how humans, especially after European settlement, have changed ecosystems because of an introduced species in Australia.
8Describe an example of an abiotic condition in an Australian ecosystem that could limit the populations of a living organism.
9Explain the term ‘cool fires’.
10Explain why it is important to have biodiversity in an environment.
11 With a growing population, humans are requiring more from the land around them. Summarise three ways in which humans are changing the environment.
12Compare (the similarities and differences between) mutualism, parasitism and commensalism.
13Classify the following as either abiotic or biotic factors. a Salinity b Bacteria present c Temperature d Plant species present e Water availability
14Contrast a producer and a consumer.
15Compare a herbivore and a carnivore.
16Analyse the marine Antarctic food web in Figure 2 below.
a Describe the relationship between: i orca whales and fur seals ii emperor penguins and fur seals.
Humpback whale Emperor penguin
Orca whale Squid Deep-sea sh Krill Phytoplankton
Fur seal
Figure 2 A marine Antarctic food web
17Consider the food web in Figure 5 of Topic 6.1 (page 143). If the mouse were to become locally extinct, list the possible changes that might occur to the other organisms in the food web.
18Discuss what happened when the cane toad was introduced into Australian ecosystems. Explain how this impact might have been different if the cane toad had more successful predators.
Figure 3 Bufo marinus, the cane toad
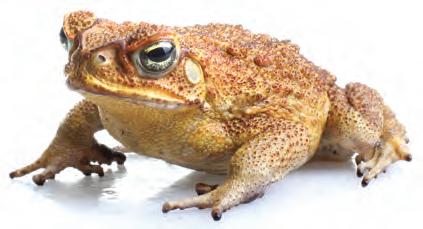
19Analyse the following food web shown in Figure 4 that shows organisms from the Yellowstone National Park ecosystem in America. While coyotes can eat larger elk, this usually only occurs when an elk is injured or sick. aIdentify one example of a producer and one example of a consumer in this food web. bPredict what would happen to the population of elk in this ecosystem if the grey wolf was removed.
c Use your answer from question b to describe what would happen to the populations of grasses, grains and fruits in the park.
20Draw up a table of advantages and disadvantages of cool fire burning of bushland. Evaluate the points you raise in the table by judging which points are more important, and deciding if the cool fire burning advantages are better or worse than the disadvantages.
21 Imagine a world without spiders. Discuss what the world would be like. In your answer, consider what spiders eat and which organisms eat spiders.
22 In some cases, introduced animals fail and never become established. In other cases, they are spectacular ‘successes’, such as the rabbits and foxes across much of southern Australia. In terms of the environment in which these animals live and their interactions with other animals, explain why some animals succeed and others do not.
23 A simple change to your daily habits, such as reusing and recycling paper at school, can make a difference to ecosystems. Use this example, or another, to discuss how your actions impact on biodiversity.

24 The balance of nature is very delicate, and changes to the environment or any member of a food web bring about changes throughout the whole system. Food webs are graphical ways of showing eating relationships inside ecosystems. If the food web is changing, so is the ecosystem. Decide which would be more resistant to change:
• big, complicated ecosystems with numerous species interacting
• simple ecosystems with relatively few species interacting. This can be done by: a describing an example of how both environments could be disrupted by the same event b deciding which environment would be most disrupted and least likely to recover.
25 In this chapter you have learnt about the Earth’s growing population. Create a visual representation (sketch, drawing, poster or similar) to represent the Earth’s changing population 50 years ago, now and 50 years into the future.
26 Prior to 1950, most scientists thought that the size and make-up of a population never changed. There were two parts to this. In human population, the poor people in society would stay poor, and the rich would stay rich. In the animal world, some animals would survive, and some would die, but the population would stay the same. In the 1960s, ecologist Richard Levin started researching ecology and populations. He thought that all populations could change if there was enough change in the environment. aDecide if you agree or disagree with Richard Levin. bDescribe two arguments from the paragraph above that support your argument.
27 Humans have tried a number of methods to reduce rabbit numbers in Australia, including the introduction of a virus that caused serious deformities and led to a slow and painful death. Discuss if the result (reducing the number of introduced rabbits so that other native wildlife survive) justifies how it was achieved (the painful death of the rabbits).

In Australia and many other countries, land is still being cleared so that sheep and cows can be farmed for meat. To prevent this, some laboratories are attempting to grow meat in a petri dish.
» Expl ain how the lab-grown meat could reduce the impact on the environment.
» Desc ribe how the lives of the sheep and cattle farmers could be affected.
» Decide if you would eat lab-produced meat in the future.
Earth is particularly special because, as far as we know, it is the only planet that sustains life – our biosphere. The biosphere concept has been looked at as a means of long-distance space travel and as a way to colonise planets such as Mars. As a class project, undertake the mission to Mars project to set up a biosphere on Mars. This means we will need to identify the abiotic conditions that exist on Mars and consider the biotic factors that we will need to survive.
28 Choose one of the following topics on which to conduct further research. Present your findings in a format that best fits the information you have found and understandings you have formed.
Dame Jane Goodall first travelled from England to Tanzania to study chimpanzees at the age of 26. Although she was not a trained ecologist at the time, she was gradually accepted by the chimpanzees. This allowed her to experience the way they behave and how they were affected by changes in their environment. Her regular communication with other groups around the work increased our understanding of the balance between the needs of humans and chimpanzees.

» Rese arch how she was able to change people’s view of chimpanzees by describing people’s views before and after Dame Jane Goodall’s communications.
» Rese arch the abiotic conditions that exist on Mars.
» Expl ain whether these conditions are suitable for human habitation. If not, describe how we could survive in these conditions (what would we need to take with us).
» Desc ribe the most basic food web that we would need to survive on Mars.
» Desc ribe the abiotic conditions that each of these organisms would need to survive.
» Use the information you have gathered to evaluate the chances of success for a colony to exist on the surface of Mars.
Now that you have completed this chapter, reflect on your ability to do the following.
I can do this. I cannot do this yet.
• Define producer and consumer and identify examples of each.
• Construct and interpret food webs.
• Define the term ‘ecosystem’.
• Explain the different types of relationships that can exist within ecosystems.
• Define the terms ‘herbivore’, ‘carnivore’ and omnivore’.
• Describe how energy flows through an ecosystem.
• Distinguish between abiotic and biotic factors.
• Explain how different factors can cause a population to increase or decrease.
• Define introduced species.
• Explain how an introduced species can impact an ecosystem.
• Describe how natural disasters can impact ecosystems.
• Describe how human activity can impact ecosystems.
• Describe how First Nations peoples have used different practices to manage ecosystems.
Check your Student obook pro for these digital resources and more:
Play a Quizlet game to test your knowledge.
Test your understanding of this chapter with the chapter review quiz.
Go back to Topic 6.1 ‘All organisms are interdependent’.
Page 142
Go back to Topic 6.2 ‘All organisms have a role in an ecosystem’.
Page 144
Go back to Topic 6.3 ‘Energy flows through an ecosystem’.
Page 148
Go back to Topic 6.4 ‘Population size depends on abiotic and biotic factors’. Page 150
Go back to Topic 6.5 ‘Introducing a new species may disrupt a food web’.
Page 154
Go back to Topic 6.6 ‘Ecosystems can be disrupted’.
Page 158
Go back to Topic 6.7 ‘Science as a human endeavour: ‘Human management of ecosystems continues to change’.
Page 162
Check your Teacher obook pro for these digital resources and more:
Launch a live team or individual quiz for your students on key concepts in this chapter.
The Earth, Sun and Moon interact with one another

> Explain how the length of a day and a year relate to the movements of the Earth.
> Describe the differences between a total and partial solar eclipse.
7.2
The Moon reflects the Sun’s light
> Identify and describe the phases of the Moon and lunar eclipse.
> Contrast a solar and a lunar eclipse.

The Moon’s gravity causes tidal movements
> Explain how the Moon’s gravity causes tidal movements.
> Describe the relationship between the Moon and tides that was recognised by early First Nations Australians.


Seasons are caused by the tilt of the Earth
> Define the terms ‘solstice’ and ‘equinox’.
> Explain how seasons are related to the position of the Sun and Earth.

> Describe the importance of seasons and seasonal calendars to First Nations Australians.
Science as a human endeavour: Astronomers explore space


> Identify examples that show how advances in technology and scientific knowledge have improved our understanding of the solar system.


What you need: Ruler, 2 balloons
What to do:

1 Blow up one balloon until it is 20 cm in diameter. This balloon represents the Earth.
2 Blow up the other balloon to 5 cm in diameter. This balloon represents the Moon.
3 Move the two balloons until they are 5 m apart. This represents approximately how far the Earth is from the Moon.
4 With your partner, discuss what effect the Moon has on the Earth. Does the Moon always appear to be the same size when viewed from Earth?
What if?
» What if the Moon was closer to the Earth? Would we notice any differences?
By the end of this topic, you will be able to:
• Explain how the length of a day and a year relate to the movements of the Earth.
• Describe the differences between a total and partial solar eclipse.
star a celestial body appearing as a luminous point in the night sky solar energy energy made by atoms colliding with each other in the centre of the Sun
axis an imaginary straight line joining the North and South Poles of the Earth
• The solar system is the collection of planets, their moons and smaller bodies (asteroids, meteors and comets) that orbit the Sun.
• The Moon orbits the Earth every 27.3 days.
• The Earth orbits the Sun every 365.25 days.
Our Sun is a star. It is the closest star to Earth and provides all the energy for every living thing. This solar energy is made by atoms colliding with each other in the centre of the Sun. Without the heat and light given off by the Sun, there would be no life on Earth.
Day and night are caused by the Earth spinning on its axis, an imaginary straight line joining the North and South Poles. You can model this in your classroom. Stand facing the front of the room and turn around on the spot until you face the front once again. This is one complete rotation. The Earth takes 24 hours to complete one full rotation.


Because of its shape, only half the Earth is exposed to sunlight at any given time. The other half is in shadow. The part facing the Sun is experiencing daytime, whereas the part facing away from the Sun is experiencing night. Because the Earth rotates, all parts of the Earth experience day and night, just at dif ferent times.
Figure 1 The Earth is held in orbit by the Sun’s gravitational pull.
solar system the Sun and all the planets, dwarf planets, moons and asteroids that travel around it and one another orbit
the path a planet follows around the Sun or a star; the path a moon follows around a planet
Our small planet (it is the fourth smallest in the solar system) is 1 000 000 ti mes smaller than the Sun. The solar system is made up of the Sun at the centre and all the planets, dwarf planets, moons and asteroids that travel around the Sun or each other. The path taken by a planet is called its orbit because of its oval or ‘elliptical’ shape.
leap year a year, occurring once every four years, with 366 days
A year is the time it takes a planet to make one orbit around the Sun. It takes 365.25 days for the Earth to complete one orbit. This means that every four years our calendar is one full day behind (4 × 0.25 days). We account for this by adding an extra day (29 February) every leap year
In Figure 2, it is daytime for countries on the right and night-time for those on the left. Can you tell in which countries the Sun would be rising or setting?
Figure 2 The half of the Earth facing the Sun experiences day and the half in shadow experiences night.
Have you ever watched the New Year’s Eve celebrations around the world on television? The celebrations in New Zealand are always just before those in Australia. The Earth rotates west to east.
We know this because as the Earth spins toward the Sun, we see the Sun rise above the horizon in the eastern sky. Sunset occurs when the Earth rotates away from the Sun. New Zealand is east of Australia, so the Sun rises in their sky fi rst.


One of the fi rst scientists and mathematicians who investigated the time it took for the Moon to travel around the Earth was al-Battani (whose full name was Abu Abdallah Muhammad ibn Jabir ibn Sinan al-Raqqi al-Harrani al-Sabi al-Battani) in the tenth century. Although he was not the fi rst astronomer to build a model of how the Moon travelled around the Earth, his was one of the most accurate. He was able to correctly calculate the cause for a solar eclipse.


This occurs when the Moon passes between the Sun and the Earth once every 27.3 days. Occasionally, the Moon will be in a position where it blocks some of the light from the Sun. This is known as a solar eclipse (Figure 3). During a total solar eclipse , the Moon blocks the maximum amount of light from the Sun and the sky goes dark for a short time during the day. The last total eclipse of the Sun visible from northern Australia was on 13 November 2012; the next one is due on 20 April 2023 in Western Australia.


1Dene the terms ‘rotation’ and ‘orbit’.


When a total solar eclipse is visible in Australia, people somewhere else in the world may only see a partial solar eclipse. This is when only some of the Sun’s light is blocked. Because the Earth and Moon are always moving around their orbits, an eclipse takes a few minutes and then gradually passes as the Earth and Moon continue their motion (Figure 4).


You should never look directly into a solar eclipse because it could damage your eyes.


solar eclipse when light from the Sun (as seen from Earth) is blocked by the Moon total solar eclipse when the Moon blocks the maximum amount of light from the Sun, as seen from Earth partial solar eclipse when only some of the Sun’s light is blocked by the Moon
2Explain why the calendar adds an extra day in February every four years (leap year).
3Explain the difference between a total solar eclipse and a partial solar eclipse.
4Explain why a person in Victoria and their friend in Darwin do not see exactly the same solar eclipse.
5 Figure 3 shows the shadow caused by the Moon during a solar eclipse. If people living in the region of the darkest shadow experience a total solar eclipse, describe the type of eclipse seen by the people living in the region of the lighter shadow.
6Contrast the different time zones around the world. Describe what people in the United States of America, China, Tanzania and France might be doing while you are having lunch in Australia.
7Connect the terms ‘day’, ‘night’ and ‘year’ with the listed explanations: a experienced by the part of the Earth that is facing away from the Sun b the name for the rotation of the Earth over 24 hours c the time for the Earth to orbit the Sun once.
Quiz me Complete the Quiz me to check how well you’ve mastered the learning intentions and to be assigned a worksheet at your level.
By the end of this topic, you will be able to:
•
• Contrast a solar and a lunar eclipse.
• The Moon rotates as it orbits the Earth.
• The same face of the Moon always faces towards the Earth.
• The phases of the Moon are caused by the light from the Sun shining on different parts of the Moon.
Many scientists believe that a giant collision between two planetary bodies resulted in the formation of Earth and the Moon. Early astronauts collected samples from the surface of the Moon and compared them with the surface of Earth; they are almost identical.
‘seas’) because they look like dark oceans. We now know these plains to be solidified lava.
In 2020, NASA’s special SOFIA telescope mounted in an airplane (the Stratospheric Observatory for Infrared Astronomy) identified small molecules of water on the surface of the Moon for the first time. The amount of water found was very small (100 times less than the Sahara Desert). This will not be enough to supply all the needs of the NASA astronauts that will be landing on the Moon by 2024.
phases of the Moon changes in the shape of the Moon as seen from Earth

The first scientific description of the Moon was made in 1609 by Italian astronomer and physicist Galileo Galilei (1564–1642), based on his observations through a telescope. At the time it was believed that the Moon had a smooth surface, which explained its ability to reflect light from the Sun. Galileo knew differently. He saw the rough, mountainous terrain and vast craters that we know cover the surface of the Moon. He even described large flat plains that we call ‘maria’ (pronounced ‘MAHR-ee-ah’; Latin for (the southern hemisphere)
Unlike the Sun, the Moon does not create its own light. Instead, it reflects sunlight. The amount of light reflected varies with the different phases of the Moon, but even the full Moon only provides a faint light that appears bluish to the human eye. We always see the same side of the Moon from Earth because the Moon rotates at the same speed as it orbits. This is just like walking around a person, making sure you always face toward them. The Moon takes 27.3 days to completely orbit the Earth.
Sometimes, only a part of the Moon is visible. You might see half a Moon, a crescent or a fully round Moon. Sometimes the Moon cannot be seen at all, even though it is in the sky. These changes in the shape of the Moon are called the phases of the Moon (Figure 1). Of course, the Moon does not change shape – it is always round. What changes is the amount of the Moon that is lit by the Sun, which makes it possible for us to see the Moon from Earth. We are really looking at the ‘day’ and ‘night’ parts of the Moon. The Moon rises and sets, just like the Sun. The Moon rises approximately 50 minutes later from one day to the next. The Moon is always in the sky; however, during the day, the sky is usually so light that the Moon is hard to see.
7.2: Modelling the phases of the Moon Go to page 239
The Moon is the only body in space on which humans have actually stepped. It has a weak gravitational pull and very little atmosphere; therefore, there is not enough oxygen to breathe. Astronauts must wear space suits fitted with breathing apparatus.
Neil Armstrong and Edwin ‘Buzz’ Aldrin were the fi rst humans to walk on the Moon in July 1969 as part of the Apollo 11 mission (Figure 2). They found ‘kangaroo hopping’ easier than walking on the Moon. The astronauts could jump higher and further because the pull of gravity on them was only about one-sixth of Earth’s gravity.
The surface of the Moon is made of fi ne grains of dust that stick together like damp sand. The footprints made by the Apollo 11 astronauts should still be visible in a million years because there is no erosion to destroy them. However, the footprints may be covered with dust from future meteor impacts.
It was possible to beam images of the Moon landing around the world because of the satellite dishes located at Honeysuckle Creek in Canberra and Parkes in New South Wales (Figure 3).


In eighteenth-century China, a young scientist called Wang Zhenyi developed a way to model a lunar eclipse. This eclipse occurs when the Earth moves between the Moon and the Sun. The Moon passes into the Earth’s shadow and appears dark (Figure 4). Wang modelled this by hanging a lamp from the roof as a Sun, above a circular table that acted like the Earth. She then used a circular mirror that acted like the Moon. By moving the Moon mirror under the Earth table, she was able to model the lunar eclipse.
Figure 2 The first Moon landing was televised around the world and was front-page news on 21 July 1969.

7.2 Check your learning
Retrieve
1Identify if these statements are true or false.
a The Moon creates light.
b The Moon does not supply light to the Earth.
c The Moon changes shape during different phases.
d The Moon is the closest body in space to the Earth.
e Craters are large indentations on the Moon’s surface.
f Astronomers are pseudoscientists.
g We can see both sides of the Moon from the Earth.
2Recall why astronauts can jump higher on the Moon than on Earth.
Comprehend
3 Use Figure 1 to describe the waxing and waning of the Moon.
4 Greek philosopher and scientist Aristotle noticed that, during lunar eclipses, the Earth’s shadow was always round. Consider how this led him to suggest the Earth was spherical in shape. Apply
5Investigate an alternative explanation for the phases of the Moon as told by early First Nations Australians. Explain how they saw the variation in the appearance of the Moon.
Complete the Quiz me to check how well you’ve mastered the learning intentions and to be assigned a worksheet at your level.
No part of this publication may be reproduced, stored in a retrieval system or transmitted in any form or by any means.
By the end of this topic, you will be able to:
• Explain how the Moon’s gravity causes tidal movements.
• Describe the relationship between the Moon and tides that was recognised by early First Nations Australians. high tide when the ocean covers slightly more land; the highest level that the tide reaches on the shore low tide when the ocean covers slightly less land; the lowest level on the shore that the tide recedes to
• The Earth’s pull force holds the Moon in orbit.
• The relationship between the Moon and the tides was recognised by early First Nations Australians.


• The pull force of gravity causes high and low tides.

The relationship between the Moon and the tides was recognised by early First Nations peoples in Australia. In Yolngu traditions of Arnhem Land, stories describe water fi lling the Moon-man (Ngalindi) as he rises. When the Moon is full in the sky, the tidal waters are full. As the tide falls, the Moon is left empty for three days before fi lling once more.
The Earth’s pull force holds the Moon in orbit. The Moon has its own pull force, even though it is far less than the Earth’s. The Moon is approximately one-quarter the size and oneeightieth the mass of the Earth, so its pull force is much weaker.

This does not mean the Moon’s pull force does not affect the Earth. The pull of the Moon causes the Earth’s oceans to bulge toward the Moon. This causes the oceans to cover slightly more land, which we see on the Earth as a high tide. The Earth is also being pulled toward the Moon (and away from the water on the opposite side), so another high tide occurs on the opposite side of the Earth. As the Moon travels around the Earth and as both bodies travel around the Sun, the combined pull force from gravity causes the world’s oceans to rise to high tides and fall to low tides. Because the Earth is rotating while this is happening, two high tides occur each day, approximately 11 hours apart.
Spring tide: the gravity of the Sun and the Moon pull together

Neap tide: the gravity of the Moon and the Sun pull at right angles to each other

High tides happen when the land is rotated toward the water being pulled in by the Moon or Sun. Low tides happen when the land rotates away from the water bulge.
When the Sun, Moon and Earth are aligned, the combined pull of the Moon and the Sun causes very high tides in some parts of the Earth.
Table 1 shows the times of high and low tides at Surfers Paradise, in Gold Coast, Queensland, over three days in June 2022. Calculate the difference in height between the two high tides on the Friday.
These are known as spring tides. Smaller neap tides occur during the Moon’s quarter phases. At these times, the Sun and Moon are at right angles to the Earth, causing the sea tides to be pulled in both directions at once. Spring and neap tides are shown in Figure 2. Worked example 7.3 shows how to calculate the difference in height between low and high tide.
One high tide is 1.01 m at 10.17 am and the other high tide is 1.59 m at 10.38 pm.
Subtract the smaller tide from the larger tide: 1.59 – 1.01 = 0.58 m
Table 1 High tides at Surfers Paradise, Gold Coast, in June 2022
Thursday, 2 June 2022 Friday, 3 June 2022 Saturday, 4 June 2022
Time Height (m) Time Height (m) Time Height (m)
4.01 am 0.35 4.42 am 0.38 5.26 am 0.42
9.36 am 1.05 10.17 am 1.01 11.02 am 0.98
3.12 pm 0.33 3.49 pm 0.38 4.31 pm 0.44 9.58 pm 1.64 10.38 pm 1.59 11.21 pm 1.53
1Explain why the Moon has a greater effect on the tide levels than the Sun.
Analyse
2 Referring to Table 1, identify the difference between: a the last high tide on Friday and the fi rst one on Saturday b the fi rst high tide and the following low tide on Saturday.
Apply
3 Use the data in Table 1 to predict the times and heights of the tides for Sunday.
4 For 1 week, graph the high and low tide levels of a beach in your state. Compare this against the times of the Moon rise and set. Discuss the relationship between the Moon’s position and tide levels.
5 Gravity is not considered a force. Instead, gravity is the distortion of space and time caused by a large object. This allows the large object to have a pull force. Evaluate the following sentence and rewrite it so that it is correct.
‘ The force of the Moon’s gravity pulls the water on Earth to cause high tides.’
spring tide when there is maximum difference between high and low tides; caused by the combined pull of the Moon and the Sun
neap tide when the difference between high and low tides is smallest; occurs during the Moon’s quarter phase, when the Sun and the Moon pull in different directions
Complete the Quiz me to check how well you’ve mastered the learning intentions and to be assigned a worksheet at your level.
No part of this publication may be reproduced, stored in a retrieval system or transmitted in any form or by any means.

By the end of this topic, you will be able to:
• Define the terms ‘solstice’ and ‘equinox’.
• Explain how seasons are related to the position of the Sun and Earth.
• The Sun travels different paths across the sky at different times of the year.
• During summer, the days are longer and the Sun warms the ground and air.
• During winter, the days are shorter and the ground and air are cooler.
• The equinox occurs when the length of day is equal to the length of night.
• First Nations Australians use regional seasonal calendars which describe the weather, plants and animals that are common in that area at that time of the year.
• Describe the importance of seasons and seasonal calendars to First Nations Australians.

The Wurdi Youang egg-shaped arrangement of stones shown in Figure 1 was found at Little River, Victoria, by European settlers nearly 200 years ago. The layout of 100 large boulders is thought to have been set out by the Wathaurong people, the Traditional Owners of the area. It is only recently that archaeologists have discovered that the 1 m high rocks at the two ends of the egg shape mark the points where the Sun sets during the middle of winter (the winter solstice) and the middle of summer (the summer solstice). solstice either of the times when the Sun is furthest from the equator
Interactive 7.4 The path of the Sun No part of this publication may be reproduced, stored in a retrieval system or transmitted in any form or by any means.
The Earth does not rotate evenly. Rather, the Earth rotates around an imaginary line (the axis) that is on an angle of 23.5 degrees. This means that, for part of the year, the southern hemisphere (including Australia) is tilted towards the Sun (Figure 3). The days are longer and the nights are shorter. The Sun is higher in the sky. This allows more time for the Sun’s rays to hit the ground and therefore warm up the air. We experience summer. The Wathaurong people in Victoria knew this, and placed stones that marked the place where the Sun set during the longest day (21 December). This is called the summer solstice.
After 21 December, the Earth continues its orbit of the Sun, slowly angling the southern hemisphere away from the Sun. Twice a year (in autumn on 20 March and in spring on 22 September), the position of the Earth allows an equal length of day and night. This is called the equinox. The Wathaurong people marked the sunset of these events with the equinox stone.
In winter, the southern hemisphere is angled away from the Sun. This means the Sun shines lower in our skies and for less time. As a result, there is less time for the Sun to warm up the ground and therefore the air is cooler. We experience winter. The shortest day (21 June), the winter solstice, was also marked by the Wathaurong people.
The Wathaurong people found a way to mark the movement of the Sun, and hence the seasons, without using telescopes or undertaking long sailing trips around the world.
The northern hemisphere’s seasons are the opposite of ours in Australia, so during a northern summer there is a southern winter.
The tilt of the Earth is more noticeable in the Antarctic. In the summer, the tilt of the Earth causes the Sun to remain in the sky for five months. The Sun does not set; instead, it sits just above the horizon for the whole time.
The reverse is true for winter in the Antarctic. The angle of the southern hemisphere away from Sun means the Sun sets in May and does not rise again until July.
First Nations Australians have lived in all parts of the Australian landscape for more than 60 000 years. There are over 700 groups and most recognise the different seasons that are unique to their area. First Nations peoples in the Darwin area have seven main seasons in their Gulumoerrgin (Larrakia) year. These seasons are divided according to the weather and the plants and animals that are common at that time of the year. The rainy season (Balnba) from November to December is when the fi rst rains occur. Gulppula (green tree fog) is said to bring the rain. It is also the time to collect shellfi sh and the black plum. The monsoon season (Dalay: January–April) is when the saltwater crocodiles are laying their eggs and the barramundi are breeding.
equinox a day when day and night are the same length; occurs twice each year


Mayilema season (March–April) overlaps the monsoon season and is when the speargrass flowers appear and the magpie goose eggs can be collected. Damibila (April–June) is the time to collect the barramundi and bush fruit, while heavy dews are on the ground in the Dinidjanggama season (June–August). During Gurrulwa
(July–September) there are often big winds that appear to come from all directions at once, while Dalirrgang (September–October) is very hot and humid as the weather slowly builds up to the next rainy season. Figures 4, 5 and 6 show the seaonal calendars unique to Larrakia Country in the Northern Territory, Yirrganydji Country in Far North Queensland and Gariwerd Country in Victoria.
The traditional lands and waters of the Yirrganydji people covers the Queensland coast from Cairns to Port Douglas. Their seasonal calendar shows two major seasons: Kurrabana (wet season) and Kurraminya (dry season). The Kurrabana wet season is divided into a time of storms (Jawarranyji) and a time of cyclones (Jimburralji). The dry season is divided into the cool time (Jinjim), the windy time (Yiwanyji) and the hot time (Wumbulji).
Each of the First Nations peoples used their observations of the local environment to create a unique calendar. This is different from the European approach that recognises the same four seasons in all parts of the world from the Antarctic to the tropics, despite the very different climate and conditions.
Figure 6 The Gariwerd calendar is used by First Nations peoples in the Gariwerd (Grampians) region in Victoria.
1Identify the four seasons experienced in Australia, marked with the letters a, b, c and d on Figure 7.
d a c Sun
b

Figure 7 Four seasons in Australia
2Recall the angle of the Earth’s rotational tilt away from the Sun.

Comprehend
3Represent the seasons in a table. Draw a table with three columns. In the fi rst column, write the months of the year. In the second column, write the names of the
four European seasons next to the appropriate months. In the third column, write the names of the seven Gulumoerrgin (Larrakia) seasons.
Analyse
4Compare the winter solstice with the summer solstice.
5 Use the motion of the Earth around the Sun to consider why January is hotter than July in Australia.
6Compare the Gulumoerrgin (Larrakia), Yirrganydji and Gariwerd calendars.
Apply
7Create a paragraph for year five students that discusses how the Wathaurong people gathered and recorded data over many years before placing stones to represent the solstice and equinox.
Quiz me Complete the Quiz me to check how well you’ve mastered the learning intentions and to be assigned a worksheet at your level.

By the end of this topic, you will be able to:
• Identify examples that show how advances in technology and scientific knowledge have improved our understanding of the solar system.
Astronomy is one of the oldest sciences. Ancient astronomers believed that stars were permanently fixed to a heavenly sphere and never changed. Both First Nations and European astronomers tracked the movement of the planets against these heavenly lights, which they grouped into constellations, and used these observations to calculate time and develop calendars. From this they determined the seasons and calculated the best time to plant their crops or gather their foods. They observed solar and lunar eclipses and used the positions of the stars and planets to navigate the oceans.
Figure 2 The Antennae galaxies are about 45 million light-years away from the Milky Way.

collect and then focusing this light using lenses or mirrors. A distant object viewed through an optical telescope becomes brighter and magnified (Figure 2).
ultraviolet radiation invisible rays that are part of the energy that comes from the Sun
infrared radiation invisible light that has longer wavelengths than visible light
Figure 1 Emu in the sky, a constellation seen by First Nations Australians in the dark areas of the Milky Way. Depending on its position in the night sky, it informs people about the different behaviours of the bird.
telescope an optical instrument that uses lenses and mirrors to make distant objects appear closer and larger DRAFT
In 1990, NASA launched the Hubble Space Telescope which orbits the Earth at 569 km ab ove our atmosphere. This has given scientists a view of our universe far beyond that of any ground-based telescope because different forms of electromagnetic radiation, such as gamma rays, X-rays and ult raviolet radiation , are available for observation.
From the images beamed back to Earth from the Hubble Space Telescope, astronomers have been able to make an enormous number of new observations and have estimated the age of the universe more accurately at around 13–14 bil lion years. NASA launched the more advanced James Webb Space Telescope on 25 December 2021. It orbits the Earth at 1.5 million km above Earth’s atmosphere!
The Webb looks primarily at infrared radiation, allowing it to see a greater variety of things than the Hubble. The Webb can see things more clearly than the Hubble because it has a bigger mirror that reflects more light than the Hubble. The newer space telescope will help astronomers build on the knowledge about the universe that they gained from images taken by the Hubble. The first images from the Webb were released to the public in July 2022. Figure 3 shows the difference in the images taken by the Hubble and the Webb.
It can take many years of travel for a rocket to land on another planet. Scientists therefore need to rely on other methods to learn about space.
NASA is already planning a crewed mission to Mars. But could humans live on Mars? The Mars exploration rovers Spirit and Opportunity were launched in 2003 and landed on Mars in 2004 to fi nd out more about the ‘red planet’.
In 2008, the Phoenix Mars lander touched down on an ice sheet on the Martian surface. Operated from Earth, its instruments took photographs of ice that was melting. The lander’s robotic arm scooped up soil samples and analysis from the lander’s instruments revealed traces of magnesium, sodium, potassium and, importantly, water. NASA scientists described this discovery as a ‘huge step forward’.
In 2021, NASA’s Mars 2020 Perseverance rover landed on Mars. The rover’s mission is to seek signs of ancient life on Mars and to collect rock samples for scientists to study. The Perseverance
In 1967 an Outer Space Treaty that offered a series of guidelines for how countries should explore space was signed by countries in the United Nations. After many more years of negotiations, the Agreement Governing the Activities of States on the Moon and Other Celestial Bodies (also called the Moon Treaty) was created by a group of different nations. It sets out a list of rules for all celestial bodies that countries must follow, including ownership and
rover is taking photos of the surface of Mars (Figure 4) and has even sent back the fi rst audio recordings of Mars.

Humans are also able to gather new information about space by using space probes. Typically, space probes are controlled remotely and can be launched into space to measure properties of Earth, the solar system or the universe around us.

The space probe New Horizons was launched by NASA in 2006. After a gravity boost from Jupiter in 2007, its six-month flyby of Pluto in 2015 produced an enormous amount of data on the dwarf planet’s surface properties, geology and atmosphere, which was still being analysed one year later.

mining. It is yet to be signed by the countries who are currently exploring space.
Science is not just about experiments and making discoveries. Scientists must also develop an understanding of the consequences of their discoveries. Australia is currently building its capacity for space research. Develop a set of guidelines for these scientists to follow. Consider the following to help.
1 Identify whether you would own the section of the Moon you land on or explore.
2 Explain what you would do if you discovered a valuable metal or mineral on the Moon. (Note: If you do not mine it, how would you pay for the research?)
3 Describe what you would do if another country claimed the same section of the Moon.
4 Describe the consequences you would face if your rocket crashed into a city in another country.
5 Compare your opinions with others in your class.
1Identify which of the following best describes the equinox.

A the longest day of the year
B a day and night of equal length
C a lunar eclipse that occurs every year
D the shortest day of the year
2Recall that a total solar eclipse occurs when:
A the Moon blocks out the maximum amount of light from the Sun
B the Earth blocks out the light on the Moon from the Sun
C the Sun blocks out the view of the Earth from the Moon
D a comet blocks out light from the Sun.
3Identify which of the following statements is true.
A The Earth orbits the Sun.
B The planets orbit the Moon.
C The Sun orbits the planets.
D The Earth orbits the Moon.
4State the name for one revolution of the Earth around the Sun.
5Identify the season in Norway when it is summer in Australia.
6Recall the name of the event that occurs when the Moon totally blocks the light from the Sun.
7Explain what causes day and night.
8Describe how the Sun affects day and night and seasons at the Antarctic.


9Describe the seven seasons identified by the Gulumoerrgin (Larrakia) people.
10Describe the phases of the Moon.
11Explain why 29 February only occurs every four years.
12 A student claims that the Moon is a mini Sun that shines at night. Explain why they are incorrect.
13Explain the purpose of the Hubble and James Webb Space Telescopes.
14Compare a solar eclipse and a lunar eclipse.


15Compare astronomy and astrology.
publication
16 Figure 1 shows how the seasons occur. Answer ‘A’ or ‘B’ to each question.
aIdentify the drawing that represents summer.
b If the piece of card was the Earth, identify which drawing would represent winter.
c If the piece of card was the Earth, identify which drawing would represent the warmest day.
A B
Figure 1 How the seasons occur
17 Figure 2 shows the average number of sunlight hours across Australia in January and June. Analyse the two maps and use the data to explain why Australian summers have higher temperatures than Australian winters.


18 Study Figure 3 and answer the following questions.
aIdentify the season that has the longest shadows.
bIdentify the season that gives the least opportunity for solar heating.
cIdentify the season where the Sun travels furthest across the sky.
dIdentify which side of the house is best to grow plants that like sunlight.
e If a plant is growing on the eastern side of a house, describe the amount of sunlight it receives in the morning.
20 The Persian calendar celebrates the New Year at the moment the Sun crosses the celestial equator on approximately 21 March each year. In 2014 it was celebrated at 4 am on the east coast of Australia. In 2015 it was celebrated at 10 am. Discuss why the exact time of the New Year changes from one year to the next.
21 Visit NASA’s website for the 2020 Perseverance rover mission (the link is on your obook pro). Navigate to the gallery of ‘Raw images’ showing recent pictures taken by the rover. Select one image and make five scientific observations about what you can see in the image. Discuss what you know about Mars from looking at this image.
22 Gravity is not considered a force. Instead, gravity is the distortion of space and time caused by a large object. This allows the large object to have a pull force. Evaluate the following sentence and rewrite it so that it is correct.
‘The force of the Moon’s gravity pulls the water on Earth to cause high tides.’
23 Some nations are planning to develop human settlements on the Moon. Discuss an argument for and against this decision. Decide if you do or do not support this plan. Justify your decision (by comparing the arguments for and against this decision and describing why one argument is more important).
24 Many early European settlers claimed that First Nations Australians did not use any of the sciences. Provide evidence that refutes this claim.
25 Scientists are continuously exploring space, including Mars. Discuss the ethical implications of finding life on one of these planets.
19 Look at Figure 4, which shows a total eclipse of the Sun as it would be seen in the middle of the day from Earth. Create and label a diagram to illustrate a: a solar eclipse b lunar eclipse.

26 Find data for the sunrise and sunset times over seven days in summer and winter. From this information, calculate the length of the day and the length of the night. Present your findings in a table. Discuss what you notice about the lengths of the days and nights for each season. Explain why this difference occurs.
27 In May 2021 there was a lunar eclipse visible in Australia. The Moon was referred to as a ‘supermoon’. Investigate what the criteria for a supermoon are, and explain why a lunar eclipse may be a supermoon. Research
28 Choose one of the following topics on which to conduct further research. Present your findings in a format that best fits the information you have found and understandings you have formed.
Astronomers are involved in a Search for Extraterrestrial Intelligence (SETI).

» Find out what instruments the astronomers are usi ng in this search.
» Desc ribe how these instruments will help them to find extraterrestrial intelligence.
» Desc ribe what they may expect to find. You, too, can use your computer to become a part of this search.
The huge Saturn rocket that took Apollo 11 to the Moon was an extremely powerful system in its day. The rocket had three ‘stages’; each carried its own fuel and dropped off as the rocket went higher into the sky. The rocket carried the ‘lunar lander’, which was itself a very complicated piece of technology.

» Build a model of the Saturn rocket and explain the role of each stage and how it performed.
America’s only organisation entirely dedicated to searching for life in the universe.

Investigate what it means to be a science communicator.
» Research the work of Wiradjuri astrophysicist and science communicator, Kirsten Banks.
» Desc ribe how she combines First Nations astronomy knowledge with her current work.
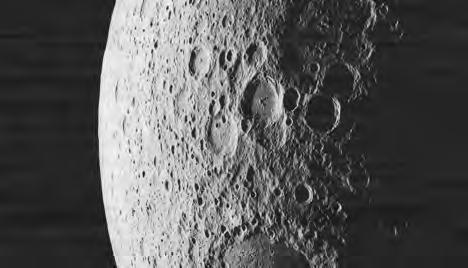
The Moon rotates at the same rate as the Earth, so we never see the far side of the Moon from Earth. So what is it like? Is it the same as the near side of the Moon? Some astronauts have flown over the surface of the far side, but only one has landed a ship.
» Identify how many people have seen the far side of the Moon.
» Identify which country landed a probe on the far side and brought back material from the Moon’s surface.
» Compare the far side of the Moon to the side that faces Earth.
» Desc ribe the complexities of living on the surface of the Moon.
Now that you have completed this chapter, reflect on your ability to do the following.
I can do this.
I cannot do this yet.
• Describe the differences between a total and partial solar eclipse.
• Explain how the length of a day and a year relate to the movement of the Earth.
• Identify and describe the phases of the Moon and lunar eclipse.
• Contrast a solar and a lunar eclipse.
• Explain how the Moon’s gravity causes tidal movements.
• Describe the relationship between the Moon and tides that was recognised by early First Nations Australians.
• Define the terms ‘solstice’ and ‘equinox’.
• Explain how seasons are related to the position of the Sun and Earth.
• Describe the importance of seasons and seasonal calendars to First Nations Australians.
• Identify examples that show how advances in technology and scientific knowledge have improved our understanding of the solar system.
Go back to Topic 7.1 ‘The Earth, Sun and Moon interact with one another’.
Page 172
Go back to Topic 7.2 ‘The Moon reflects the Sun’s light’.
Page 174
Go back to Topic 7.3 ‘The Moon’s gravity causes tidal movements’.
Page 176
Go back to Topic 7.4 ‘Seasons are caused by the tilt of the Earth’.
Page 178
Go back to Topic 7.5 ‘Science as a human endeavour: Astronomers explore space’.
Page 182
Check your Teacher obook pro for these digital resources and more: Check your Student obook pro for these digital resources and more:
Play a Quizlet game to test your knowledge.
Chapter quiz Test your understanding of this chapter with the chapter review quiz. No part of this publication may be reproduced, stored in a retrieval system or transmitted in any form or by any means.
Launch a live team or individual quiz for your students on key concepts in this chapter.
CHAPTER 7 EARTH, SUN AND MOON


Being safe in the lab is essential to prevent you and others from getting hurt. Whenever you are in the lab, you must always follow the rules below.
» wear a l ab coat for practical work

» keep your workbooks and paper away from heating equipment, chemicals and flames
» tie long hair back whenever you do an experiment
» wear s afety glasses while mixing or heating substances

» tell your teacher immediately if you cut or burn yourself
» tell your teacher immediately if you break any glassware or spill chemicals


» wash your hands after any experiments
» listen to and follow the teacher’s instructions
» wear gloves when your teacher instructs you to.
» run in a laboratory » push others or behave roughly in a laboratory » eat in a l aboratory » drink from glassware or laboratory taps » look down into a container or point it at a neighbour when heating or mixing chemicals » smell gases or mixtures of chemicals directly; instead, waft them near your nose and only when instructed » mix chemicals at random » put matches, paper or other substances down the sink » carr y large bottles by the neck
» enter a preparation room without your teacher’s permission.
To identify the factors that affect the horizontal movement of a ping pong ball.

Ping pong ball, measuring tape or ruler, cardboard cylinder, retort stand, boss head and clamp
1 Working in pairs, use the retort stand to hold the cardboard cylinder 30 cm above the desk or table (Figure 1).
2 Place the ping pong ball at the top end of the cylinder and let it roll through the tube to the floor. Do not throw or flick it.
3 Measure how far the ball travels hor izontally from the end of the tube to the floor. Record your result in a table.
4 Repeat steps 2 and 3 twice. This is your baseline to compare a potential change.
5 Select one of the questions below to test if it causes a change in the horizontal distance travelled by the ping pong ball. Record your results in a table.
6 Write a sentence that describes the change you made and how the movement of the ball changed.
> What if you change the colour of the ball?
> What i f you change the type of floor covering?
> What i f you drill holes in the ball?
> What i f you change the angle of the tube?
> What i f you push the ball down the tube?
> What i f you vary the height from which the ping pong ball is dropped?
Figure 1 Making a ping pong ball bounce sideways
Figure 2 Ping pong bats and ball

To correctly identify and draw scientific diagrams of science equipment.
Five boxes from your teacher (each containing five different pieces of equipment), grey pencil, ruler, piece of plain A4 paper
1 Share a box with a partner. Write down the name of each piece of equipment in the box and draw a scientific diagram of the equipment in pencil.
2 When finished, return the box to the teacher and collect a different box. Repeat step 1 until you have named and drawn the equipment in all five boxes.
3 Check the names and diagrams (and spelling) for the pieces of equipment from Figures 1 and 2 on pages 6–7 of Chapter 1. Correct any mistakes you may have made.
4 Look at your list of equipment. Decide how you could divide the equipment into two groups. For example, you might group all pouring equipment, all heating equipment or all safety equipment together. In your notebook, write down the names of the group and the equipment that belongs in that group.
Large flask, retort stand, boss head, clamp, funnel, small beaker (100 mL)
1 Set up the stand with the boss head and clamp, placing the boss head approximately two-thirds of the way up the stand, as shown in Figure 1.
2 Carefully place the flask neck into the clamp and tighten the clamp so that the flask is secure. (The flask should be approximately 10 cm above the bench, not resting on it.)
3 Predict how many beakers of water you think it will take to fill the flask. In your notebook write: ‘Step 2 Prediction = __ beakers of water to fill the flask’.
4 Fill the beaker with water. Use the funnel to transfer the water into the flask until it is full. Write the answer in your notebook: ‘Number of beakers of water needed to fill the flask = __’
5 Draw a scientific diagram of the equipment that was set up. Label the equipment.
6 Take the apparatus apart and place each piece of equipment in its appropr iate cupboard.
1 Name the piece of equipment that was the most difficult to draw.
2 Name the piece of equipment that was the easiest to draw
3 Name up to five pieces of equipment that you had not seen before and list their uses in a laboratory.
4 Name two pieces of equipment that can be used for: a holding things b mixing chemicals c pouring.
5 Describe where in your laborator y you could find: a test tubes b Bunsen burners c tongs d retort stands e test-tube racks f heatproof mats g a rubbish bin h beakers.

To identify the difference between observations and inferences.
How good are you at making observations? Do you confuse observations with inferences? There are many things you can observe.
1 Draw up a table with two columns: one for observations and the other for inferences.
2 Examine Figure 1, which is a drawing of a crime scene. Write six observations from the crime scene in the observation column.
3 Write down three inferences you can make from your observations in the inference column.
4 Use your inferences to describe what could have happened before you started observing the scene.
No part of this publication may be reproduced, stored in a retrieval system or transmitted in any form or by any means.
To accurately weigh the sugar mass and liquid volume in a variety of drinks.
A variety of soft drinks, flavoured milk, fruit juices, bottled water, sugar, scales, measuring cylinder, beakers, small spoon
1 On the sides of each drink container, you will find a nutrition panel showing the volume of one standard serve and the amount of sugar in each serve. An example is shown in Figure 1.
2 Place a beaker on the scales and press the ‘TARE’ button that returns the numbers to zero.
3 Add sugar to each beaker until it reaches the mass of sugar in one serve of drink (as shown by the nutrition panel).
4 Add water to another beaker to carefully measure the volume of a single ser ve of the drink.
5 Create a table to record the name of each drink, the sugar content per ser ve for each serve, the volume of each serve and the number of serves of drink that were in each container.
1 Identify the drink that had the most sugar in a single serve.
2 Identify the drink that had the most serves in a single container.
3 Identify the drink that has the most sugar in a whole container.
4 Identify a type of drink that had an unexpected amount of sugar content, and explain why you were surprised.
Figure 1 A nutrition panel
No part of this publication may be reproduced, stored in a retrieval system or transmitted in any form or by any means.

CAUTION! Wear safety glasses and lab coat, and tie long hair back when using a Bunsen burner. Do not touch hot equipment.
Choose one of the inquiry questions below.
To identify how adding sugar or salt to water affects the boiling point of water.
Beaker (250 mL), water, thermometer, retort stand, boss head, clamp, tripod, gauze mat, heatproof mat, stopwatch, Bunsen burner, matches, glass stirring rod, salt (optional), sugar (optional), teaspoon
1 Set up the equipment as shown in Figure 1. Add 150 mL of water to the 250 mL beaker.
> What i f sugar was added to the water?
> What i f salt was added to the water?
Answer the following questions about your inquiry question.
1 Write a hypothesis for your inquir y.
2 Identify the independent variable that you will change from the first method.
3 Identify the dependent variable that you will measure and/or observe.
4 List the variables you will need to control to ensure a reasonable test. Describe how you will control each variable.
5 Test your hypothesis by repeating the method with the independent variable you chose.
6 Collect the data in a table.
7 Draw an appropriate g raph for your data.
Thermometer held in clamp
Stir gently with stirring rod
1 Identify the type of data you have collected.
2 Identify the type of graph you could draw for this type of data.
3 Explain how your graph suppor ts or does not support your hypothesis.
4 Describe how your exper iment was a reasonable test by providing a definition of a reasonable test and matching this to your method.
Figure
2 Draw a labelled scientific diagram of the equipment in your notebook.
3 Draw a table with two columns: one for time (in minutes) and the other for temperature (in degrees Celsius), as in the example below.
Time (min) Temperature (°C)
4 Measure the starting temperature of the water and write it in the table. This is the temperature at 0 minutes.
5 Safely light the Bunsen burner and then open the collar to get a blue flame.
6 Heat the water over the Bunsen burner. Record the temperature of the water every minute for a total of 12 minutes.
No part of this publication may be reproduced, stored in a retrieval system or transmitted in any form or by any means.
To
> Clamp
> 250 mL beaker
> Water
> Food colouring
> Three different-shaped containers
> Plast ic syringe
> Rubber stopper
> 100 mL beaker
> Elec tronic balance
> Bal loon
> Balloon pump
1 Copy Table 1 into your notebook and complete it as you work through the method.
2 Examine the clamp and record its mass, shape, ability to be compressed and other data in the table.
3 One-third fill the 250 mL beaker with water. Add two drops of food colouring and mix carefully.
4 Pour the coloured water, in turn, into the three other containers. Record what happens to the shape of the water in each of the containers.
5 Half-fill the syringe with water. Hold the end of the syringe upward (plunger at the base) and gently push the plunger until all the air is removed from the syringe. Place the stopper on the bench and push the end of the syringe against it, as shown in Figure 1. Make sure that the syringe is well sealed before compressing it. Record whether water can be compressed (that is, made to take up less volume).
6 Set the empty 100 mL beaker on the electronic balance and press the ‘TARE’ button. Pour in the water from the syringe and measure the mass of the water. Record the results in the table.


7 Draw the syringe full of air and invert the syringe onto the stopper. Compress the syringe. Record whether air is compressible and takes the shape of the syringe.
8 Record the mass of the empty balloon and then use the balloon pump to blow it up. Record whether the air takes the shape of the balloon. Tie off the end and weigh the balloon again, this time with air in it. Subtract the mass of the empty balloon from that of the blown-up balloon to calculate the mass of the air inside the balloon (mass of blown balloon – mass of empty balloon).
Table 1 Comparing states of matter
a
depressing the plunger on the syringe.
b Results
Complete Table 1.
1 Identify which substances had a measurable mass.
2 Identify which substances were able to change their shape to match the container shape.
3 Identify which state of matter can be compressed into a smaller space. Descr ibe how it changed.
Write a short paragraph to describe the properties of each state of matter (solids, liquids and gases).
Matter State of matter Mass (g) Able to take shape of container?Able to be compressed? Other characteristics observed ClampSolid WaterLiquid AirGas
No part of this publication may be reproduced, stored in a retrieval system or transmitted in any form or by any means.
investigate the characteristics of solids, liquids and gases.
CAUTION! Do not touch hot equipment.
5 Observe any changes in the water and ice as the water is heated. Record your observations; for example:
To observe the three states of water.
Large test tube, tap water, Bunsen burner, heatproof mat, wooden test-tube holders, ice cube, copper wire (approximately 8–10 cm long), pliers, matches, test-tube rack
1 Collect an ice cube that will fit into a test tube.
2 Wrap copper wire around the ice cube so it sinks in the water.
3 Pour tap water into the test tube until it is one-third full. Drop the ice cube with the wire around it into the water so that the water level is two-thirds up the test tube.
4 Light the Bunsen burner and turn it to a blue flame. Use the test-tube holder to gently heat the water at the top of the test tube. Face the opening of the test tube away from your face, body and other people.
> ‘When the water in the top of the tube was heated, it …’
> ‘When the water was heated, the ice …’
Test-tube holder
Condensation Water vapour Boiling water Liquid water Ice weighed down with wire
Figure 1 Three states of water in a test tube
1 Explain how you could have ice and boiling water in the same test tube.
2 Use the particle model to draw a picture of the three states of water.
No part of this publication may be reproduced, stored in a retrieval system or transmitted in any form or by any means.
To model the three states of matter.
Items such as table tennis balls, coins, lollies, marbles, pieces of modelling clay
1 Use one of the items listed to represent the particles of matter. Make models of a solid, a liquid and a gas.
2 Draw a labelled diagram of each model.
1 Describe how your modelled particles represented the characteristics of real particles.
2 Describe how your model could represent the kinetic energy in a solid, liquid and gas.
3 Describe how your model of a solid could be used to explain the process of melting.
No part of this publication may be reproduced, stored in a retrieval system or transmitted in any form or by any means.
Aim
To observe how tea moves through hot water and cold water.
Two large beakers, cold water, hot water, two tea bags
1 Fill one beaker with hot water and the other with cold water.
2 Allow the beakers to sit still for a few minutes so that the movement of the water inside them is reduced.
3 Place a tea bag in each beaker. Brown colour from the tea leaves should seep into the water and then diffuse throughout the beaker of water.
4 Compare qualitatively how quickly the colour diffuses through the hot water and the cold water; for example, ‘In the hot water, the brown tea moved …’
1 Identify which beaker of water diffused the brown tea fastest through the water.
2 Use particle theory to explain your obser vations of how the brown tea molecules spread through the water molecules.
No part of this publication may be reproduced, stored in a retrieval system or transmitted in any form or by any means.
To calculate the density of a substance, you first need to know its mass and volume. The most appropriate units for the substances you will be working with are grams (g) for mass and millilitres (mL) or cubic centimetres (cm 3) for volume. Millilitres tend to be used for the volume of liquids, whereas cubic centimetres are used for solids.
Density = mass (g) volume (cm3)
Note that 1 mL is the same as 1 cm 3. Therefore, grams per millilitre (g/mL) is the same as grams per cubic centimetre (g/cm 3).
To measure the density of liquid water.
> 10 mL measuring cyl inder
> Elec tronic balance
> Water
Method
> Calculator
> 50 mL measuring cylinder
1 Copy Table 1 into your notebook and use it to record your measurements.
2 Measure the mass of the 10 mL measuring cylinder. Record its mass in grams.
3 Remove the measuring c ylinder from the balance and add 6 mL of water to it.
4 Measure the mass of the cylinder and water. Calculate the mass of the water by subtracting the mass of the cylinder from the combined mass of the cylinder and water (Mass of water = mass of measuring cylinder and water – mass of measuring cylinder).
5 Use the density equation to calculate the density of the water and record your answer. (Do not forget the units!)
6 Repeat the experiment with the 50 mL measuring cylinder and 20 mL of water. Calculate the density of the water.
7 To obtain a third measurement of the density of water, choose one of the two measuring cylinders and any amount of water. Measure the mass of the water and its volume. Calculate the density of the water.
Record your calculations and results in Table 1.
Table 1 Recording the density of water
Measuring cylinder Mass of measuring cylinder (g)
Volume of water (mL)
10 mL 6 50 mL 20
Mass of measuring cylinder and water (g)
Mass of water (g)
Density of water = mass/ volume (g/mL)
Average =
1 The standard value for the density of water is 1.00 g/mL at 25°C. Compare the values you obtained to this value.
2 Describe one factor that could have affected the accuracy of your results.
3 Compare the accuracy of the density value of the small volume of water with the density value of the large volume of water.
4 Use your answer to question 3 to explain why scientists should repeat their experiments.
To measure the density of regular-shaped blocks made from different materials.
> Several blocks made from different substances (e.g. wood, polystyrene, lead, zinc)
> Ruler
> Elec tronic balance
> Calculator
1 Copy Table 2 into your notebook, adding a row for each additional substance.
2 Measure and record the mass of each of the blocks.
3 Use a ruler to measure the length, width and height of each block.
4 Calculate the volume of each block (Volume = length × width × height). An example has been done for you in the first row of Table 2, using the measurements in Figure 1.
5 Calculate the density of each block.
To measure the density of irregular-shaped objects.
Materials
> Four different objects (e.g. spatula, a small rock, a lump of pl asticine, an object of your choice) that each fit into the measuring cylinder
> Elec tronic balance
> 100 mL measuring cylinder
1 Copy Table 3 into your notebook with four blank rows.
2 Measure the mass of the first object. Record the mass (in grams) in your table.
3 Use the displacement method to work out the volume of the object:
> Approximately half-fill the measuring cylinder. Record the volume of water in the cylinder (Volume 1).
> Add the object to the measuring cylinder so that it is fully submerged. Record the volume of water in the cylinder (Volume 2).
> Calc ulate the volume of the object by subtracting the volume of water in the cylinder before the object was added from the volume after the object was added (Volume 2 – Volume 1).
1 cm 3cm 2cm
Figure 1 Calculating the volume of a regular-shaped block
Record your measurements in Table 2.
Table 2 Measuring the density of regular-shaped blocks
Substance Length (cm) Width (cm) Height (cm) Volume (cm3) Mass (g) Density (g/cm3)
Wood 321 3 × 2 × 1 = 6 3 3 ÷ 6 = 0.5
1 Define parallax error.
2 Describe how parallax error could have affected the accuracy of your measurements.
3 Rank the blocks from least dense to most dense.
4 Calculate the density of the object.
5 Repeat the experiment with the remaining objects.
Record your measurements in Table 3.
Table 3 Measuring the density of irregular-shaped objects
Object Mass (g)
Volume before (mL)
Volume after (mL)
Volume of object (after –before, in mL)
Density (g/mL)
1 Describe some of the difficulties that you had using the displacement method for calculating density.
2 Describe an advantage of using the displacement method for measur ing volume.
3 Compare the density of the water with the density of the objects.
4 Use the results from all the experiments to rank the objects from lowest to highest density
Describe how the density of objects can vary.
No part of this publication may be reproduced, stored in a retrieval system or transmitted in any form or by any means.
To compare how introducing or removing heat affects a substance.
CAUTION! Wear safety glasses and a lab coat, and tie long hair back when using a Bunsen burner.
Materials
> Ball and ring apparatus
> 2 × 250 mL beakers
> Hot tap water > Ice
4 Half-fill the other beaker with cold tap water and add ice. Put the ball in the iced water and leave it for 5 minutes. Keep the ring away from the iced water.
5 Try passing the ball through the ring. Record your observations; for example, ‘After cooling the ball in ice, it …’
Record your observations by describing what you did and how the movement of the ball through the ring changed.
1 Look at your ball and ring. Try passing the ball through the ring before heating and cooling. Record your observations; for example, ‘Before heating and cooling, the ball …’
2 Half-fill a 250 mL beaker with hot tap water. Place your ball in the hot water for 5 minutes. Keep the ring away from the hot water.
3 Try passing the ball through the ring. Record your observations; for example, ‘After heating in hot water, the ball …’
CAUTION!
> Make sure the apparatus is not left unattended. The dye and water will spurt out the top of the glass tube if allowed to.
> The flask and its contents may be hot. Allow all equipment time to cool before handling it.
Materials
> 100 mL conical fl ask
> Narrow glass tubing
> One-hole rubber stopper to fit glass tubing
> Food colouring > Water
> Permanent marker > Bunsen burner and heatproof mat > Gauze mat > Tripod > Matches
1 Put two drops of food colouring in the flask and fill the flask to the top with water.
2 Place the stopper fitted with the tube in the flask. Some water will rise up the tube. Using the permanent marker, mark this first level on the tube.
3 Place the flask on the gauze mat on the tripod and heat gently.
4 After a few minutes of heating, turn off the Bunsen burner. Mark the level of the water in the tube again.
1 Describe how the size of the metal ball changed with: a heating b cooling.
2 Use the kinetic theory of matter to explain what was happening to the particles in the solid when heat was applied.
3 Describe how the size of the ball changes as the temperature returns to room temperature.
5 Record how the level of the water changes as it cools.
No part of this publication may be reproduced, stored in a retrieval system or transmitted in any form or by any means.
Record your observations of the water level as the fl ask was: a heated (for example, ‘As the water was heated, the water level in the glass tubing …’) b cooled (for example, ‘As the water cooled, the water level in the glass tubing …’).
> Balloon
> 100 mL conical fl ask
> String
> Ruler
> 250 mL beaker of hot water
> Ice bath (250 mL beaker of water and ice)
> Timer
> Balloon pump
1 Use the kinetic theory of matter to explain how the liquid in the straw moved when it was: a heated b cooled.
1 Using a balloon pump, blow up the balloon to help stretch the rubber. Let the air out again until it is about the size of an apple.
2 Place the balloon over the neck of the flask.
3 Use the string and ruler to measure the circumference (the distance around the middle) of the balloon at room temperature. Copy Table 1 into your notebook and record this measurement.
4 Place the flask with the balloon in a beaker of hot water. Wait 2 minutes.
5 Measure and record the balloon’s circumference.
6 Place the flask with the balloon in an ice bath with a small amount of water. Wait 4 minutes.
7 Measure and record the balloon’s circumference.
Record your observations in Table 1.
Table 1 Measuring balloon circumference at different temperatures
Temperature Balloon circumference (cm) Room temperature
Hot water Ice bath
1 Describe how the size of the balloon changed as the flask was moved from room temperature to hot water.
2 Describe how the size of the balloon changed as the flask was moved from hot water to ice.
3 Use the ideas of the particle model of matter to explain how the size of the balloon changed with the changes in temperature.
Explain how heating can change the properties of a gas.
Hot water
Ice bath
Figure 2 Experimental set-up to show the expansion and contraction of a gas after heating and cooling
No part of this publication may be reproduced, stored in a retrieval system or transmitted in any form or by any means.
> Steam and boiling water can both scald. Take great care when measuring the higher temperatures. If scalded, place the area of skin under cold running water for at least 5 minutes and show your teacher.
> Wear s afety glasses and lab coat, and tie long hair back when using a Bunsen burner.
To investigate the melting and boiling points of water.
> 250 mL beaker
> Crushed ice
> Water
> Tripod stand
> Bunsen burner and heatproof mat
> Gauze mat
> Stirr ing rod
> Timer
> Retort stand, clamp and boss head
> Thermometer (0–110°C) or thermistor probe
> Matches
1 Place some crushed ice and a small amount of tap water in the beaker. Stir with the stirring rod for approximately 1 minute.
2 Measure and record the temperature of the water and ice mixture in Table 1. This is the melting point of water at 0 minutes.
3 Set up the equipment as shown in Figure 1, checking to make sure the thermometer is not touching the bottom of the beaker and that it is secure in the clamp. Do not stir with the thermometer.
4 Light the Bunsen burner and start heating the ice and water.
5 Measure and record the temperature of the mixture in the beaker every minute until the water starts to boil and produce steam. This is the boiling point of water.
6 Continue heating for another 4 minutes, unless most of the water has evaporated.
7 Using graph paper, or a suitable computer program, draw an appropriate graph with temperature on the vertical axis and time on the horizontal axis.
Thermometer held in clamp
Stir gently with stirring rod
Figure 1 Experimental set-up for measuring the melting point of ice
Record your observations, including your table and graphs.
Table 1 Recording melting and boiling points Time (m) Temperature (°C) 0 1 2 3 4 5
1 a Identify the temperature of the melting point you measured.
b Contrast between your measured melting point of ice and the standard measurement of 0°C.
2 a Identify the temperature of the boiling point of water you measured.
b Contrast between your measured boiling point of water and the standard measurement of 100°C.
3 Identify one assumption that could have affected the accurac y of your results. Describe how you could improve this if you repeated the experiment.
4 Compare your results with those of the rest of the class. Suggest why there may be a variation or anomalies in the answers.
Describe what you know about the melting and boiling points of water.
To observe the characteristics of different mixtures.
need:
Soil, water, jar with screw-top lid, timer
1 Put some soil and water in the jar to create a watery mixture.
2 Screw the lid on tightly and then shake the jar. Observe the jar for 5 minutes.
Cream or egg white, hand or electric whisk, large metal bowl
What you need:
Olive oil, water, jar with screw-top lid, detergent
1 Two-thirds fill a jar with equal parts of water and oil. Observe what happens and draw a labelled picture to record your observations.
2 Screw the lid on the jar tightly and shake the mixture vigorously. Observe what happens immediately after mixing. Record your observations; for example, ‘After mixing the oil and water …’


3 Wait 5 minutes and record your observations again; for example, ‘After leaving the mixture to sit for 5 minutes, it …’
4 Add a couple of drops of detergent to the mixture and shake the jar again.
> Desc ribe how the mixture changes when you add the detergent; for example, ‘After adding detergent to the oil and water mixture and shaking it, …’
5 Wait 5 minutes and record your observations again; for example, ‘After leaving the mixture to sit for 5 minutes, it …’
> Expl ain what is happening using the terms ‘colloid’, ‘mixture’, ‘emulsion’ and ‘emulsifier’.
> Describe the movement of the soil particles; for example: ‘When the soil and water was shaken, it … ‘After 5 minutes …’
> Identify the types of particles that may float, sink or stay suspended.
> Use the terms ‘solution’, ‘suspension’ and ‘sediment’ to describe the behaviour of this mixture.
> Identify the type of mixture that is dirty water.
Whip the cream or egg white until it increases significantly in size and holds its shape.
> Expl ain why the foam you have created is classified as a colloid by defining the term and comparing it with the mixture you have produced.
Water, table sugar, teaspoon, beaker or glass
1 Add a small amount of sugar to water in a glass and stir.
> Desc ribe what happens to the sugar; for example,‘When sugar is added to a glass of water, it …’
Figure 2 Do sugar cubes react differently from granulated sugar?

Lavender flowers, methylated spirits, scissors, jar with a lid, cotton bud
1 Cut the lavender flowers into tiny pieces and place them in the jar.
2 Cover the lavender flowers with methylated spirits.
3 Seal the jar and leave overnight.
4 The following day, dip the cotton bud in the methylated spirits.
5 Allow the methylated spir its to evaporate and then smell the cotton bud.
> Expl ain why this mixture is a solution. Identify the solute and the solvent.
> Pred ict if this experiment would work if you put the lavender flowers in a jar of water.
> Expl ain why it is important that the methylated spirits evaporate easily.
Figure 3 Lavender is often used in perfume.
No part of this publication may be reproduced, stored in a retrieval system or transmitted in any form or by any means.

What if salt was dissolved in water?
To investigate whether a mixture of salt and water forms a solution.
> Test tubes
> Test-t ube rack
> Spat ula
> Salt
> 10 mL measuring cylinder
Method
1 Add 5 cm of water to a test tube.
2 Add 1 spatula of salt to the test tube. Carefully stir the mixture. Obser ve what happens to the mixture.
> Expl ain why this mixture is called a solution. Identify the solute and the solvent.
Answer the following questions about your inquiry question.
1 Identify the independent variable that you will change from the first method.
2 Describe how you will know if your powders are able to form a solution.
3 List three variables you will need to control to ensure a reasonable test. Describe how you will control each variable.
4 Identify the equipment you will need to complete this experiment.
5 Predict which powders will form a solution.
6 Write down the method you will use to complete your investigation. (HINT: Use the method above as a guide.)
7 Prepare a table that shows the powder you are testing, your prediction and your results.
8 Show your teacher your planning to obtain approval before starting your experiment.
Complete your investigation by filling in your table of results.
1 Identify which substances were soluble in water 2 Identify which substances formed a suspension. 3 Identify which substances took the longest to dissolve. 4 Compare your results with those of the rest of the class. Explain any unexpected results.
5 Name two other substances you know dissolve in water.
6 Use the results of your experiment to complete the following sentence: ‘Water is a good solvent because …’
7 Describe how you could change this exper iment to find out more about dissolving substances.
Define the terms ‘solution’ and ‘dissolve’ by using examples from your experiment.
Figure 1 Dissolving salt in water

Inquiry: What if other substances were mixed with water?
Additional powders to test include:
> copper carbonate
> bath salts
> talc um powder
> brown sugar
> flou r.
CAUTION! Do not eat or drink in the laboratory. Hot plate may cause burns – do not touch.
Many solutes dissolve only in certain solvents. Some dissolve very slowly and, when they do, only a certain amount of solute dissolves before the solution becomes saturated.
To investigate ways to alter the rate (speed) at which a solute dissolves and/or the amount of solute that will dissolve.
> MILO ®
> Milk
> Teaspoon
> Smal l beaker
> Measuring cylinder
> Ther mometer
> Hot plate to heat milk
1 Measure out 50 mL of milk and add it to the small beaker.
2 Carefully measure 1 teaspoon of MILO by smoothing the surface until it is even with the edges of the spoon.
3 Add the spoonful of MILO to the milk and stir until it dissolves.
4 Repeat steps 2 and 3 until the MILO no longer dissolves.
5 Identify how many spoonfuls of MILO dissolved in the room temperature milk. Record your results; for example, ‘The number of level teaspoons of MILO dissolved in 50 mL of room temperature milk was …’
1 Identify the independent variable that you will change from the first method.
2 Identify the dependent variable that you will measure to determine if it was changed by the independent variable.
3 Identify three variables you will need to control to ensure a reasonable test. Describe how you will control each variable.
4 Identify the equipment you will need to complete this experiment.
5 Predict how many spoonfuls of MILO will dissolve in warm milk.

6 Write down the method you will use to complete your investigation. (HINT: Use the method above as a guide.)
7 Prepare a table to record your results.
8 Show your teacher your planning for approval before starting your experiment.
Complete your investigation, and record your results in the table you prepared.
1 Describe how the amount of MILO that dissolved changed when the milk was heated.
2 Identify a variable that was difficult to control. Describe how you would change your method to make your results more accurate in the future.
3 Describe a situation in ever yday life that would benefit from understanding the results of your investigation.
Describe how heating a solvent affects the amount of solute that can be dissolved.
Figure 1 MILO must be used in this experiment because of the way it dissolves. What might happen if you used a different chocolate mix?
No part of this publication may be reproduced, stored in a retrieval system or transmitted in any form or by any means.
To use a magnet to separate the metal from a mixture.
Mixture of iron fi lings and sand, magnet, plastic bag
1 Place the magnet inside the plastic bag.
2 Pass the bagged magnet over the mixture so that the iron filings are attracted.
3 Turn the plastic bag inside out so that all the iron filings are trapped.
1 Evaluate how effective this method was for separating the iron filings from the sand by: a describing if ALL the iron filings were removed b suggesting any alternative method of removing iron filings
c comparing which method would remove the most iron filings.
2 Identify one metal that could not be removed in this way. Explain why the properties of the metal would prevent this method from being used.
Sand


No part of this publication may be reproduced, stored in a retrieval system or transmitted in any form or by any means.
To use sedimentation and flotation to separate parts of a mixture.
Two mixtures (‘A’ contains sand and sawdust; ‘B’ contains sand and salt), water, spatula, stirring rod, two beakers
1 Place at least three heaped spatulas of mixture A into a beaker.
2 Add water and stir the mixture.
3 Wait until sedimentation has occurred.
4 Scoop off any floating mater ial from the top of the water. Decant the water to retrieve the sand.
5 Repeat the procedure for mixture B.
6 Draw a labelled diagram of both mixtures before and after separation.
After separating a mixture, make sure that all insoluble solids go into a specially provided container. Only throw substances in the bin if your teacher says it is okay to do so. Never wash solids down the sink.
1 Describe how successful this method was for separating and collecting the sand from mixture A.
2 Describe how successful this method was for separating and collecting the sand from mixture B.
3 Describe some of the difficulties with using decanting for separating mixtures.
4 List the advantages of the combined sedimentation–flotation separation system.
5 After separating the two substances from mixture B, descr ibe a method that could be used to collect the salt as a solid.
6 Think of three reasons why disposing of solids down the sink is not a good idea.
No part of this publication may be reproduced, stored in a retrieval system or transmitted in any form or by any means.
CAUTION! Handle the aluminium sulfate solution with care, wear eye protection and avoid contact with skin.
To investigate the effect of a flocculant when separating a mixture.
> Muddy water (3 g dirt i n 50 mL water)
> 2 jars or beakers
> 0.5 M sodium carbonate solution
> 0.5 M alum inium sulfate solution
> Test t ubes
> Marker pen
> Timer
1 Half-fill each jar with muddy water and label one jar ‘A’ and the other jar ‘B’.
2 Add half a test tube of aluminium sulfate solution to A.
3 Slowly add half a test tube of sodium carbonate solution to B.
4 Leave both A and B undisturbed for approximately 15 minutes.
5 Record your observations, comparing the water in A with that in B; for example:
> ‘After 15 minutes, the muddy water and aluminium sulfate in jar A was …’
> ‘After 15 minutes, the muddy water and sodium carbonate in jar B was …’
1 Identify which flocculant you will test.
2 Identify the amounts of the flocculant that you will add to the muddy water mixture.
3 Describe how you will measure if the muddy water is separated enough. (HINT: How much light should shine through the mixture?)
4 Name three variables you will keep the same as those in the fir st method.
5 Write down the method you will use to complete your investigation. (HINT: Use the method above as a guide.)
6 Prepare a table to record your results.
7 Show your teacher your planning to obtain approval before starting your experiment.
Complete your investigation, filling in your table of results.
1 Describe the effect the aluminium sulfate solution had on the muddy water.
2 Describe the effect the sodium carbonate solution had on the muddy water.
3 Identify which of the two substances – aluminium sulfate or sodium carbonate – acted as a flocculant. Justify your answer by providing data from your results.

4 Explain why it might be important for water treatment plants to minimise the amount of flocculant added to wastewater.
Describe the effect a flocculant has on some mixtures.
What if a flocculant was added to muddy water?
Aim:
5 Place the filter paper into the funnel as shown in Figure 5.
Mixture of sand and water, beaker, 100 mL con ical flask, spatula, small funnel, filter paper, stirring rod
1 Fold the round filter paper in half, then in half again to get quarters and then in half again to get eighths, as shown in Figure 1.
Figure 1 Folding the filter paper
2 Unfold the filter paper and lay it flat (Figure 2).
Figure 5 Placing the filter paper into the funnel
6 Dampen the filter paper with some extra water to help it stick to the sides of the funnel (Figure 6).
Figure 2 Unfolding the paper and laying it flat
3 Re-fold back and forth over the creases in the filter paper to obtain a fluted shape as shown in Figure 3.
Figure 6 Dampening the filter paper
7 Swirl the sand mixture and slowly pour it from the beaker into the funnel (Figure 7). Do not overfill the funnel.
Figure 3 Re-folding to obtain a fluted shape
4 Set up the funnel and flask as shown in Figure 4.
Figure 7 Pouring the sand mixture into the funnel
8 Keep adding the mixture slowly until the beaker is empty.
9 Extra water can be added to the beaker mixture to pour out the last solid particles


10 Wait for the filtering to finish. Remove the filter paper carefully and allow it to dry. In most experiments the residue (the solid on the paper) is kept and the filtrate (the liquid in the flask) is discarded.
1 Draw a scientific diagram of your equipment. Label the filtrate and residue.


2 Identify the physical properties that are being used to separate mixtures by filtering.
Figure 4 Setting up the funnel and flask
To use filtration to separate sand from water. No part of this publication may be reproduced, stored in a retrieval system or transmitted in any form or by any means.
3 Describe at least three things you need to be careful about when filter ing.
CAUTION! Do not eat or drink in the laboratory.
To separate the components of tomato sauce by centrifuging.
> Centrifuge
> Test t ubes
> Test tubes to fit centrifuge
> Different brands of tomato sauce
> Ruler
1 Label your test tube with your name and partially fill it with tomato sauce.
2 Pass your test tube to the teacher and observe how the centrifuge is set up so that each side of the centrifuge is balanced.
3 Examine your test tube when the centrifuge completes the separation.
4 Use a ruler to measure the amount of each separated component of tomato sauce.
5 Draw your test tube after centrifug ing. Identify and label the layers of the tomato sauce (i.e. water, tomatoes).
Inquiry: What if different brands of tomato sauce were centrifuged?
1 Identify which tomato sauce you will test.
2 Identify the independent variable you will change in this experiment.
3 Identify what effect you expect to see on the dependent variable that you will measure and/or observe.
4 Identify two variables that you will need to control to ensure a reasonable test. Describe how you will control them.
5 Write down the method you will use to complete your investigation. (HINT: Use the method above as a guide.)
6 Draw a table to record your results.
7 Show your teacher your planning to obtain approval before starting your experiment.
1 Draw and label the various layers of the tomato sauce you selected.
2 Draw a column graph showing the type of tomato sauce and the amount of each component.
1 Describe the differences you noticed between the different brands of tomato sauce after they had been centrifuged.
2 Explain why the different types of tomato sauce might var y in their components.
Describe how centrifuging can be used to separate the components in a mixture.
No part of this publication may be reproduced, stored in a retrieval system or transmitted in any form or by any means.
CAUTION! Wear safety glasses and lab coat, and tie long hair back when using a Bunsen burner.
To separate a salt from a solution by evaporation and crystallisation.
> Evaporating dish > Tripod
> Clay t riangle
> Bunsen burner and mat
> 250 mL beaker
> Concentrated salt solution
> Magni fying glass > Matches
1 Collect a sample of the salt solution in the beaker.
2 Half-fill an evaporating dish with the salt solution.
3 Place the evaporating dish on the clay triangle over the tripod.
4 Heat the evaporating dish, with a blue flame.
5 When the solution starts boiling, half-close the Bunsen burner collar. (Do not change to a yellow flame – this is not the same.)
6 Add more solution to the dish as the level drops due to evaporation. Be careful as the evaporation nears completion because the hot salt may spit and splatter.
7 Turn off the Bunsen burner when just a little liquid remains with the salt. Leave the dish to cool.
8 Examine the salt crystals with a magnifying glass.
Draw a diagram of the salt crystals in your notebook.
1 Explain how effective this method would be if the solution contained a mixture of more than one solute.
2 Identify where the water solute in the solution went. Describe how the solute could be collected.
Explain how evaporation and crystallisation can be used to separate a mixture of salt and water.
No part of this publication may be reproduced, stored in a retrieval system or transmitted in any form or by any means.
You are preparing for a natural disaster that will affect the water supply. Using materials available from a supermarket, design equipment that will enable you to provide drinking water for a single person from sea water indefinitely.

> Your materials must be available in a supermarket or you r home.
> You must provide the cost of building your equipment.
> Your only available heat source is the Sun.
> How will you heat the water so that it evaporates?
> How wil l you collect the water vapour?
> How wil l you cool the water vapour so that it condenses?
> Draw a l abelled diagram of your design.
> Build a prototype of your design.
> Check the effectiveness of your design with a test, and improve it as required.
1 Describe the changes you made to improve your design.
2 Identify the most successful feature of your design. Identify the least successful feature of the design.
3 Calculate the final cost of your design.
4 Describe a situation where your design could be useful.
5 Describe how you would modify your design to improve its effectiveness.
Present the various stages of your investigation in a formal experimental report.
How can you separate the different parts of a sand, salt, sawdust and iron filing mixture? Now that you are a scientist who has trained in separating techniques, it is time to separate a mixture of sand, salt, sawdust and iron filings.

You may only use equipment available in the laboratory.
> Think about the properties of each pure substance that is in t he mixture. This may help you to decide on a way to separate the substances. Copy Table 1 and write what you know about the properties of sand, iron filings, sawdust and salt.
Table 1 The properties of sand, iron filings, sawdust and salt
Substance Soluble in water? Attracted to a magnet? Floats/sinks in water?
Sand Iron filings Sawdust Salt
> Discuss with a partner some possible ways to separate the fou r substances.
> Draw up a flow chart showing the steps you will take to separate the four substances.
> Devise an aim and a materials list for your experiment.
> Write a detailed method for separating the substances. Include at least two diagrams.
> Describe three safety issues that you need to consider when completing this experiment.
> Have your plan checked by your teacher.
> Perform your separation experiments and make relevant observations.
1 Describe the unique properties of each component of the mixture that allowed you to separate them.
2 Describe the different components of the mixture that you were able to separate from the mixture including the colour and texture of each final sample.
3 Describe the purity of each sample by describing any contaminants that may have been mixed in the pure samples.
4 Describe one way you would change your method to improve the amount or the pur ity of your samples.
Present your investigation in a formal experimental report.
No part of this publication may be reproduced, stored in a retrieval system or transmitted in any form or by any means.
Your forensic laboratory is investigating a crime of extortion: one person is forcing or frightening another into handing over money.

The police have identified that the extortion note was written with a black felt-tip pen. They have collected a black felt-tip pen from the three suspects: Aunt Aggie (A), Cousin Cranky (C) and Uncle Buncle (U).
Other forensic scientists in your laboratory have already run a chromatography test on the note written by the extortionist. After you have tested the three pens from the suspects, collect the chromatogram for the original note from your teacher for comparison.
To separate the inks from three different water-soluble black felt-tip pens.
> 3 black water-soluble felt-tip pens – they must all be dif ferent brands and labelled ‘A’, ‘C’ and ‘U’ (Note: Permanent markers are not suitable for this experiment because they are not water-soluble.)
> 250 mL beaker
> Glass rod or paddle pop stick
> Salt solution (1 per cent)
> Filter paper or chromatography paper
> Scissors
> Penc il
> Ruler
Figure 1 Trace over the pencil lines at the bottom of the chromatography paper.
1 Cut the filter or chromatography paper into three str ips measuring approximately 2 cm × 10 cm.
2 Draw a faint pencil line across the width of each paper strip, 3 cm from the bottom.
3 Label the first strip ‘A’, the second strip ‘C’ and the third strip ‘U’. Make sure the label is at the very top of the paper strip.
4 Carefully trace over the pencil line at the bottom of A with the felt-tip pen labelled A, as shown in Figure 1. (Do not make the line too thick.)
5 Do the same for the other two pens on their separate strips
6 Add the salt solution to the bottom of the beaker, no deeper than 2 cm.
7 Hang the paper strips over the glass rod so that they just dip into the salt solution (Figure 2). Make sure the salt solution does not touch the pen lines on the paper.
Figure 2 Hang the paper strips over a glass rod so that they just dip into the salt solution.
(Experiment continues on the next page.)

8 Leave the papers to soak up the salt solution for approximately 10–15 minutes, or until the solvent level is up to the top of the paper.
9 In the meantime, draw a diagram of the chromatography equipment in your notebook, labelling all the parts.
10 When the chromatogram is finished, take the paper s out of the solution to dry (Figure 3).
Tape the dry chromatograms for suspects A, C and U in your notebook. Collect and copy the chromatogram from the original note. Label this as the extortionist’s chromatogram.
1 Compare the chromatogram from the extortionist with the chromatograms from the three suspects. Identify if any of the suspects’ chromatograms match the one from the original note. If so, who is most likely to be guilty?
2 Identify which felt-tip pen – A, C or U – had the most colours in its black ink.
Describe how chromatography can be used to separate the inks from different black felt-tip pens.

Figure 3 Take the papers out to dry.
Figure 4 Black felt-tip pens are composed of different inks.
No part of this publication may be reproduced, stored in a retrieval system or transmitted in any form or by any means.

To measure a variety of forces in common situations.
> Rubber band
> Thin strip of timber (or a ruler)
> Mass carrier and masses
> Pen
A rubber band can measure the size of forces in a similar way to a spring balance, but it must be calibrated. This means matching the stretch of the rubber band to the number of newtons pulling on it.
1 Calibrate the rubber band on the strip of timber, as shown in Figure 1.
Figure 2 Measuring the force needed to open a door
Rubber band
About 30cm
Metal top of mass carrier
Figure 1 Calibrating the force measurer
2 Mark the distance that the rubber band is stretched on the timber when the mass carrier holds a 100 g mass. Remember: The weight force of 100 g equals 1 N of force.
3 Repeat for masses of 200 g, 300 g, 400 g and so on, marking the timber each time.
4 Use your measuring device to measure the force needed to: a open the door to the room (Figure 2) b drag a chair across the floor c close a drawer in the laboratory (Figure 3) d move your pencil case e pull up your sock f do three other movements of your choice.
Figure 3 Measuring the force needed to close a drawer
Draw a column graph showing the amount of force needed to move each object.
1 Describe the relationship between grams and newtons.
2 Identify if the force meter you constructed measures a pull or push force.
3 Describe how you could increase the amount of force needed to shift your pencil case.
No part of this publication may be reproduced, stored in a retrieval system or transmitted in any form or by any means.
Design equipment that uses a block of wood to hit a tennis ball. A block of wood from home or your school’s woodwork room is ideal. You must not push the block.
> Describe how you will generate a contact force between the wooden block and the ball.
> Desc ribe how you will make the wooden block swing.
> Desc ribe how far you want your ball to move.
> Figure 1 shows one way to set this up. Suggest two ways to mod ify this design.
1 Describe the changes you made to move the ball further.
2 Identify the most successful feature of your ball whacker.
3 Contrast the effectiveness of a heavy block and a light block.
4 Describe a real-life example of a ‘whacker’ similar to this
5 Describe how you would modify your design if you were doing this experiment again.
Retort stand and boss head
Figure 1 A possible design for the experiment
Clamp String Wooden block
Present the various stages of your investigation in a formal experimental report.
No part of this publication may be reproduced, stored in a retrieval system or transmitted in any form or by any means.
Choose one of the following design briefs.
> Create a magnet race to identify who can push a magnet across the length of a desk the fastest using another magnet.
> Use the push force between two magnets to suspend the end of one magnet above the end of the other.
> Design an experiment to determine how far away your magnet needs to be to attract a metal paperclip.
> Design an experiment to test if a second magnet has a stronger pulling force than the first magnet. Remember to control all other variables.
> Identify the arrangement of poles that would be most appropriate: like or unlike poles.
> Identify the part of a magnet that has the strongest force.
1 Describe the changes you would make to improve your design.
2 Describe the most successful feature of your design.
3 Describe how you would modify your design if you were doing this experiment again.
Present the various stages of your investigation in a formal experimental report.
No part of this publication may be reproduced, stored in a retrieval system or transmitted in any form or by any means.
To examine the push or pull forces involved in electrostatically charged balloons.
> Balloon pump
> Two ba lloons
> Stri ng
> Wool/nylon material
1 Using the balloon pump, inflate both balloons and tie knots in the ends.
2 Tie string to the ends of both balloons.
3 Rub one of the balloons on your jumper or with the material provided.
4 Hold the balloon by the string so that it does not lose its charge.
5 Hold the second balloon by the string and bring it close to the fir st balloon.
> Identify the force as a push or pull force.
> Describe the balloon as a contact or non-contact force. Justify your answer by defining each term.
1 Write a hypothesis for your inquiry.
2 Identify the independent variable you will change in this experiment.
3 Identify what effect you expect to see on the dependent variable that you will measure and/or observe.
4 Identify two variables that you will need to control to ensure a reasonable test. Describe how you will control them.
5 Write down the method you will use to complete your investigation. (HINT: Use the method above as a guide.)
6 Draw a table to record your results.
7 Show your teacher your planning to obtain approval before starting your experiment.
1 Identify electrostatic charges as contact or non-contact forces. Justify your answer.
2 Describe the movement of the balloons as a push or pull force.
3 Explain how the balloons became charged.
4 Explain why the balloons moved dur ing your experiment.
Describe what you know about electrostatic forces.
Figure 1 Balloons can be filled with different types of gas, such as air, helium or hydrogen. CHAPTER 8 EXPERIMENTS
No part of this publication may be reproduced, stored in a retrieval system or transmitted in any form or by any means.

What if a balloon was electrostatically charged?
To determine how the weight of a person could vary on different planets.
The effects of gravity depend on the mass of the objects involved. Gravity on Earth is determined by the mass of the Earth.
By doing some simple calculations, you can work out what your weight would be if you lived on the Sun, on other planets in the solar system or on the Moon. Note that the Earth has a gravity factor of 1.00, which is often referred to as 1g. To calculate weight, multiply mass (the reading on the bathroom scales) by the gravity factor for the planet, the Sun or Moon. Remember that weight is measured in newtons.
1 Using the Earth’s gravity factor, calculate the weight of a 65 kg person on the Earth and record it in Table 1 (in the first row).
2 Complete Table 1, filling in the weight for the 65 kg person on the other planets, the Sun and the Moon.
3 Imagine holding an Olympic Games on the different astronomical bodies listed in Table 1. Based on your calculations, explain how the gravity factor for the planet
would affect the results of the events. For example, would diving or high jump be affected?
4 Describe how gravity would affect your lifestyle on Jupiter. Identify one everyday task that would be easier or harder. Justify your answer by explaining how it would be affected.
Table 1 A person’s weight in the solar system
Planet Gravity factor Person’s mass (kg)Person’s weight (N) Earth 1.00 65.00
Mercury 0.38 65.00 Venus 0.90 65.00
Mars 0.38 65.00
Jupiter 2.87 65.00
Saturn 1.07 65.00 Uranus 0.93 65.00
Neptune1.23 65.00 Sun 27.80 65.00 Moon 0.16 65.00
No part of this publication may be reproduced, stored in a retrieval system or transmitted in any form or by any means.
Many scientists describe the gravity in space as acting like a trampoline. If the trampoline is flat, a marble is able to roll straight across the surface, much like an asteroid through empty space. If the trampoline is not flat because a brick is sitting on it, the marble will curve around the object as it rolls along, much like the distortion of space and time that causes an asteroid to curve around a planet as it moves through the solar system. You can mimic this using a hula hoop to represent space.
To model how the gravity of a planet could affect the movement of an asteroid.
1 thin stretchable plastic sheet (e.g. garbage bag, cling wrap), 2–4 small marbles, 5 cm Sty rofoam ® ball, ½ cup playdough, 1 small hula hoop
1 Cover the hula hoop with the thin sheet of plastic.
2 Suspend your model universe on books or br icks.
3 Roll a marble across the tight plastic sheet. Describe its movement.
4 Place a marble one-third of the way across the plastic, and the second two-thirds of the way across the plastic. Describe how the marbles move.
5 Place the rounded half-cup of play dough in the centre of the plastic sheet.
6 Describe what happens when one marble is placed one-third of the way across the plastic and the second two-thirds of the way across the plastic.
7 Replace the play dough with the Styrofoam ball. Describe the motion of the marbles when they are dropped onto the sheet a second time.
1 In your model, describe how gravity was represented.
2 Identify the item that had the strongest ‘gravitational pull’: the play dough ball or the Styrofoam ball. Describe the evidence that supports your answer.
3 Identify the type of object in the solar system that the Styrofoam ball represented. (HINT: Think about large and low densities.)
4 Black holes are space objects with such strong gravity that nothing can escape them. Explain why they are called black holes.
No part of this publication may be reproduced, stored in a retrieval system or transmitted in any form or by any means.
To investigate how friction may be reduced.
3 Identify what effect you expect to see on the dependent variable that you will measure and/or observe.
4 Identify two variables that you will need to control to ensure a reasonable test. Describe how you will control them.
> Force measurer (see Experiment 4.1) or spring balance
> Thick textbook
> Wooden rollers (round pencils)
> Book
> Sand
> Safety glasses
Method
1 Use your force measurer or spring balance to measure the friction of your textbook being dragged along the table.
(HINT: Drag it at constant speed.)
2 Place two books on top of each other and measure the friction.
5 Write down the method you will use to complete your investigation. (HINT: Use the method above as a guide.)
6 Draw a table to record your results.
7 Show your teacher your planning to obtain approval before starting your experiment.
1 Copy Table 1 in your notebook and record your results.
Table 1 Force needed to move a textbook
Push this way
Textbook
Force measurer
Figure 1 Measuring the friction of a textbook
Inquiry: What if different objects were placed under the textbook?
Choose one of the inquiry questions below.
> What if rollers were placed under the textbook?
> What i f sand was placed under the textbook?
Answer the following questions about your inquiry question.
1 Write a hypothesis for your inquiry.
2 Identify the independent variable you will change in this experiment.
Object
Force needed to make it move (N) Trial 1Trial 2Trial 3 Average Textbook Textbook with a second book on it Textbook with rollers under it Textbook with sand under it
2 Draw a column graph showing the effect of sand or rollers on the object’s friction.
1 Compare your results with those of others in the class.
2 Describe the best way to reduce fr iction when moving the textbooks.
3 Explain if five rollers would be better than two for reducing friction.
4 Explain if bigger or smaller rollers would be better for reducing friction.
5 Provide a practical example of rollers being used to reduce friction.
6 Evaluate if fine sand or coarse (large-g rained) sand is better for increasing friction.
Describe what you know about how to reduce friction.
No part of this publication may be reproduced, stored in a retrieval system or transmitted in any form or by any means.
What if the amount of
To determine how a first-class lever balances different weights.
> Wooden or metal ruler
> 50 g weights
> Rounded glue stick
> Blu-Tack ®
1 Place the glue stick flat on the desk and hold it in place with Blu-Tack.
2 Place the centre of the ruler over the glue stick so that it forms a simple see-saw or balance.
3 Add three 50 g weights 4 cm from the centre of the fulcrum on one side.
4 Add three 50 g weights to the other side so that the see-saw becomes balanced (both weights are equal height from the desk).
Inquiry: What if a different weight was placed in a different location?
Choose one of the inquiry questions below.
> What i f a greater weight was placed closer to the fulcrum?
> What i f greater weight was placed further from the fulcrum?
> What i f less weight was placed closer to the fulcrum?
> What i f less weight was placed further from the fulcrum?
Answer the following questions about your inquiry question.
1 Write a hypothesis for your inquir y.
2 Identify the independent variable that you will change from the first method.
3 Identify the dependent variable that you will measure and/or observe.
4 Identify two variables that you will need to control to ensure a reasonable test. Describe how you will control these variables.
5 Write down the method you will use to complete your investigation.
6 Draw a table to record your results.
7 Show your teacher your planning to obtain approval before starting your experiment.
Record your results by copying and completing Table 1.
Table 1 Using first-class levers to lift weights Left-hand side Right-hand side
Number of 50 g weights
No
Position from fulcrum (cm)
Number of weights × distance from fulcrum
Number of 50 g weights
Position from fulcrum (cm)
Number of weights × distance from fulcrum 34 12 3 3 2 3 1 1 5
1 Describe the pattern of weights and position from the fulcrum on both sides of the lever
2 Define the term ‘mechanical advantage’.
3 Calculate the mechanical advantage of the lever when the single weight on the left-hand side lifts the five weights on the right-hand side.
4 Provide another example of a first-class lever that you have used.
Draw and label a first-class lever and describe how to determine its mechanical advantage.
To investigate the mechanical advantage of a second-class lever.
> Shoebox > 2 spri ng balances > Cardboard
> Sticky tape > 2 rulers > Weig hts
1 Use sticky tape to stick the rulers together in a ‘V’ shape.
2 Divide the shoebox into two compartments using the cardboard.
3 Attach the box on the top of the rulers so that it looks like a wheelbarrow with front and rear compartments.
4 Add weight to the front of your second-class lever
5 Use the spring balances on the handles to calculate the total effort needed to lift this weight.
6 Repeat this measurement three times.
Figure 1 Experimental set-up
Inquiry:
1 Write a hypothesis for your inquiry.
2 Identify the independent variable that you will change from the first method.
3 Identify the dependent variable that you will measure and/or observe.
4 Identify two variables that you will need to control to ensure a reasonable test. Describe how you will control these variables.
5 Write down the method you will use to complete your investigation.
6 Draw a table to record your results.
7 Show your teacher your planning for approval before starting your experiment.
1 Copy and complete Table 1 to show the effort required when the front of the wheelbarrow is loaded.
Table 1 The effort required when the front of the wheelbarrow is loaded
Spring balance 1Spring balance 2 Total effort Attempt 1 Attempt 2 Attempt 3
Average
2 Copy and complete Table 2 to show the effort required when the rear of the wheelbarrow is loaded.
Table 2 The effort required when the rear of the wheelbarrow is loaded
Spring balance 1Spring balance 2 Total effort Attempt 1 Attempt 2 Attempt 3
Average Discussion
1 Explain why you repeated each measurement three times
2 Describe the difference in total effort required when the weight was shifted further from the fulcrum on the secondclass lever.
3 Use the data from your experiment to explain the most effective way to load a wheelbarrow.
Describe the mechanical advantage of using a second-class lever.
No part of this publication may be reproduced, stored in a retrieval system or transmitted in any form or by any means.
What if the weight was placed further from the fulcrum?
Aim
To see how the number of pulleys affects the size of the effort needed to lift a load and the distance this load travels.
> Retort stand
> 500 g weight
> Spri ng balance
> Sets of pulley systems (two-, three- and fourpulley systems)
> Stri ng
1 Set up a pulley system using one pulley. Attach the spr ing balance.
2 Pull on the spring balance to raise the load by 10 cm.
3 Record the average reading on the spring balance and the distance moved by the spring balance.
4 Calculate the mechanical advantage of the pulley ar rangement.
5 Repeat steps 2–4 with a two-pulley system.

6 Repeat steps 2–4 with a three-pulley system.
7 Repeat steps 2–4 with a four-pulley system.
1 Copy and complete Table 1.
2 Draw a column graph showing the relationship between the number of pulleys and the mechanical advantage.
1 Describe how adding more pulleys changed the effort needed to lift a load.
2 Compare the distance the effort moves with the distance the load moves.
Table 1 The mechanical advantage of pulley systems
Figure 1 A one-pulley system
3 Calculate the effort needed to lift 500 g with six pulleys.
4 Calculate the length of string that would have to be pulled through four pulleys to lift the 500 g load 20 cm.
Describe how the number of pulleys affects the size of the effort and the distance moved by the load.
Number of pulleys Effort reading on the spring balance (N)Distance the effort has to move (cm) Mechanical advantage (load ÷ effort)
1 2 3 4
No part of this publication may be reproduced, stored in a retrieval system or transmitted in any form or by any means.
To determine the force magnification of different machines.
> 50 g mass (with a hook to attach to the spring balance)
> Ramp (30 cm ruler or a wider or longer piece of thin wood or plastic)


1 Measure and record the height of the box (or pile of books).
2 Using the spring balance, measure and record the force required to carefully lift the 50 g mass vertically at a constant speed on to the top of the box.
3 Repeat step 2 several times and calculate the average force.
4 Position the ramp against the box and measure and record its length.
5 Slowly pull the 50 g mass up the ramp using the spring balance and record the force required.
6 Repeat step 5 three times and calculate the average force.
> Box (or pile of books or plastic tub upside down)
> Spring balance
> Metre ruler
1 Identify the method – lifting or dragging up the ramp – that provided the greatest mechanical advantage. Justify your answer by using data from your experiment.
2 A student claimed an incline plane was not a machine. Use evidence from the experiment to evaluate the truth of this statement.
Figure 1 A pile of books
Materials
> 2 blocks of wood
> 2 thick, tight rubber bands
> Wedge-shaped piece of wood
1 Place the rubber bands over the two pieces of wood to hold them tightly together.
2 Try pulling the blocks apart with your hands.
3 Place the pointed edge of the wedge between the two blocks and push it in.


Describe the advantage of using a wedge to separate the two blocks of wood.

Figure 2 Wedge
No part of this publication may be reproduced, stored in a retrieval system or transmitted in any form or by any means.
> G-clamp
> 2 matchboxes filled with play dough
1 Try crushing the matchbox using only your fingers. Record your observations.
2 Place the matchbox between the faces of the G-clamp and tighten it until it cr ushes. Record your observations.
1 Contrast the effort needed to crush the matchbox using both methods.
2 Explain how the screw mechanism in the G-clamp provides a mechanical advantage in crushing the matchbox.

> Simple machine kit with a wheel-and-axle model or one made from LEGO ® or K’NEX™
> Cotton thread or string
> 2 weig hts
1 Design and build your own working model of a simple wheel-and-axle machine.
2 Use cotton thread or string and two weights to demonstrate how your model can work as a force magnifier.
3 Modify your model or build another one to demonstrate how it can work as a distance magnifier.
1 Contrast a force magnifier with a distance magnifier.
2 Describe the change you made for the second wheel-andaxle model.
3 Explain how the change affected the effectiveness of the second model compared with the first model.

No part of this publication may be reproduced, stored in a retrieval system or transmitted in any form or by any means.
To model and compare the forces involved in flight.
Materials
> A strip of paper (3 cm × 15 cm)
1 Use your thumb and index finger to hold one of the short ends of the paper strip under your bottom lip so that it flows forward from your face (Figure 1). The far end of the paper should hang down in a curve from your face. Make sure that your finger is not in front of your lip.

2 Gently blow across the top of the paper.
1 Describe the action of the lift force on the far end of the paper.
2 Use your knowledge of the wings of a plane to explain why the lift force was generated.
Materials

> A light ping pong ball

> A dense golf ball
Method
1 Hold both identically sized balls at the same height from the ground.
2 Gently let go of both balls at the same time and observe the time it takes for the balls to hit the g round.
1 Compare the mass of each ball.
2 Describe how each ball was affected by gravity by comparing the time it took for the balls to hit the ground.
No part of this publication may be reproduced, stored in a retrieval system or transmitted in any form or by any means.
> A strip of paper (3 cm × 15 cm)
> A dense golf ball
1 Hold both the strip of paper and the golf ball at the same height from the ground.
2 Gently let go of the ball and the paper at the same time and observe the time it takes for them to hit the g round.
3 Scrunch the paper strip into a ball and repeat step 2.
Discussion
1 Describe the shape of the two objects.
2 Describe how each object was affected by air resistance by describing the time it took for them to hit the ground.
> A6 paper (1/4 of A4 paper)
> Scissors
> Paper clip
1 Cut out the pattern of a paper helicopter shown in Figure 4.
2 Fold the paper into the paper helicopter shape.
1. Cut on the solid black lines. Fold on the dashed lines.
2. Fold A and B to the middle.

3 Clip the paper clip to the bottom of the base of the paper helicopter.
4 Hold the paper helicopter at a height above your head and give it a quick twist as you drop it.
1 Describe how the paper helicopter moved as it was dropped.
2 Compare the motion of the paper helicopter and the paper in part C.
AB C
Paper helicopter pattern
Figure 4 Making a paper helicopter
AB C
3. Fold C up. C
4. Fold propeller blades outward.
5. Test y by dropping from a height above your head.
No part of this publication may be reproduced, stored in a retrieval system or transmitted in any form or by any means.


To use the characteristics of different items to classify them into identifi able groups.

1 With a partner, divide the items listed below into six department store groupings of your choice. Justify your choices.
Snowboard, CD, ‘miracle’ moisturiser, waterproof tent, golf balls, jeans, mountain bike, T-shirt, atlas, cricket bat, Hacky Sack®, laptop computer, sleeping bag, nail polish, digital alarm clock, TV celebrity poster, backpack, surfing magazine, ultrashine lip gloss, smart TV, winter coat, wetsuit, R&B CD box set, glitter eye shadow, perfume, swimming costume, MP3 player, travel book, CD player, hoodie jumper


2 Divide the products in your six departments into smaller groups or ‘sub-departments’.
3 Draw a plan of your department store layout. Think carefully about what departments you will put next to each other and why.
4 Join up with another pair and ‘take them on a tour’ through your department store.
5 Describe how your department store is different from the one prepared by the other pair. Contrast the advantages and disadvantages of each design.
To design a dichotomous key.
Think about objects that could be sorted into two groups; for example, you might like to use snack foods, such as corn chips, flavoured chips or plain chips, or common products, such as bolts, nuts and screws.

> Compare the similarities and differences of each object.
> Desc ribe the similarities that will allow the objects to be divided into two groups.
> Select one of the groups and compare the similarities and differences of objects in that group.
> Desc ribe the similarities that will allow these objects to be divided into two groups.
> Repeat this procedure until all objects are in a group of one.
1 Draw a dichotomous key to show how you grouped the objects.
2 Describe the difficulties of classifying the objects into groups.
3 Describe how you would improve your grouping if you repeated the challenge.
Swap your dichotomous key with another group. Ask them to evaluate your key by comparing how easy it was to identify the key feature of each object that allowed it to be classified.
No part of this publication may be reproduced, stored in a retrieval system or transmitted in any form or by any means.
Aim
The scientific names of organisms usually come from Latin (and sometimes Greek) words. Latin was the language of science for many centuries. This enabled scientists who lived in different countries and spoke different languages to communicate their work and discoveries with one another.
The words used in the scientific names of organisms describe physical features, behaviours and even colours. Some examples are given in Table 1.
Table 1 Some scientific words and their meanings
Latin or Greek root word English meaning
Aculeat Spiny Arctos Bear Anatinus Duck-like Cinereus Grey Gloss Tongue Hynchus Snout Macro Large Ornitho Bird Phascol Pouch Pus Foot Rufus Red Tachy Fast Chlamy Caped Saurus Lizard
To identify the scientific names of different animals. No
1 Use the information in Table 1 to match the scientific names of the Australian animals with their pictures in Figure 1. a Macropus rufus b Tachyglossus aculeatus c Phascolarctos cinereus d Ornithorhynchus anatinus e Chlamydosaurus kingii
2 What do you think a Macroglossus aculeatus might look like? On a sheet of A4 paper, sketch this imaginary animal, using the information in Table 1 to help you.

The scientist whose main role it is to classify living things is known as a taxonomist. In this activity, you become the taxonomist.


To use the identifying features of different organisms to classify them into kingdoms.


A3 card or paper, scissors, glue, pictures of different living things from Figure 1 (or from the internet or magazines)


1 On a sheet of A3 card or paper, mark up a table with four columns.
2 Label the columns ‘Animalia’, ‘Plantae’, ‘Fungi’ and ‘Other (Monera and Protista)’. (Do not try to distinguish between Monera and Protista.)


3 Go to your obook pro to access and print out Figure 1. Cut and paste each of the pictures in Figure 1 into the correct column of your table.

1 Describe the identifying features for each kingdom.
2 Name one organism that was difficult to identify. Describe why it was difficult to identify the key feature that allowed it to be classified.
Figure 1 A collection of living things
No part of this publication may be reproduced, stored in a retrieval system or transmitted in any form or by any means.
> Scal pels are extremely sharp. Use with great care.
> Alwa ys wear gloves when handling the animals. Some students may have latex allergies.
> Anim als must always be on the dissecting board when they are being handled or dissected.
> Cut aw ay from hands.
> If cut , remove gloves and wash the cut under clean water. Tell your teacher. Apply antiseptic to the cut and cover it with a dressing.
5 Cut the prawn in half and observe the insides
To examine the skeletal structures of three marine organisms.
Materials
> 1 fish (whole)
> 1 praw n
> 1 squ id
> Newspaper
> Dissec ting board
> Dissec ting kit
> Pair of vinyl or latex gloves
1 Observe the external features of the fish.
Figure 3 Cut the prawn in half.
6 Feel the outside surface of the squid.
7 Cut the squid in half and observe the insides.
8 Place scalpels in a container to be cleaned. Wrap dissected fish, squid and prawn in the newspaper. Place in a sealed plastic bag and dispose of in the general rubbish bin.


Figure 1 Observe the external features of the fish.
2 Carefully cut the fish in half lengthways so that you can see the internal skeleton.
Draw labelled diagrams of the skeleton of each specimen.
Discussion
1 Consider the fish.
a Identify the location of the fish skeleton.
b Identify the type of skeleton found in the fish.
2 Consider the prawn.
a Identify the location of the prawn skeleton.
b Identify the type of skeleton found on the prawn.
3 Describe how the squid maintains its shape.
4 Identify the group of animals (vertebrate or invertebrate) that each of the organisms – prawn, fish and squid – belongs to. Justify your answer by comparing the key features that are used to identify the classification group with features you identified on your organism.
Figure 2 Cut the fish in half.
3 Observe the skeleton of the fish.
4 Touch the outside surface of the prawn. Identify the connections between the hard surfaces. Peel the prawn.
5 Identify the classification group to which you belong: a vertebrate or an invertebrate. Justify your answer by comparing the features that are used to identify you with the features that are used to identify your chosen group.
Describe the types of skeletons that you observed and how they helped you in classifying the organism.
No part of this publication may be reproduced, stored in a retrieval system or transmitted in any form or by any means.
To use the identifying features of invertebrates to classify using a tabular key.
Magnifying glass or stereomicroscope, Petri dishes, jars with lids, tweezers, vinyl or latex gloves, newspaper
Alternatively, your teacher may provide prepared samples for you to look at. Complete the classification exercise for each prepared sample.
1 Visit a local natural environment (e.g. a garden, beach, park or pond) and observe invertebrate specimens.


2 Wearing gloves, use tweezers to collect up to 10 invertebrate specimens in separate jars.
> Do not touch any animal that might bite or sting. Check with your teacher if you are unsure.
> Use tweezers to pick up the animals.
> Place any animal immediately in a jar and secure the lid.


3 Use the tabular key in Table 1 on page 126 of Chapter 5 to classify the invertebrates into their particular phylum.


Figure 1 Some common invertebrates
4 Use a magnifying glass or stereomicroscope to help you sketch each animal. Write the common name for the animal (if you can) and write down its classification group under the drawing.
5 Return the invertebrates to their natural environment after you have finished.
1 Identify the common characteristic that all invertebrates displayed.
2 Describe the key characteristics that allowed you to recognise and classify the organisms you collected.
No part of this publication may be reproduced, stored in a retrieval system or transmitted in any form or by any means.
To identify a variety of different vertebrates.
A3 paper, pencils
This task could also be completed as a webpage, with images and links to further information about each animal.
1 Divide students into five groups, each of which will be allocated one class of vertebrate.
2 Label an A3 sheet of paper with the name of your class of ver tebrate.
3 Write the letters of the alphabet down the left-hand side of the page.
4 For each letter, write the name of an animal that fits this category.
5 When finished, you will have the names of up to 26 different vertebrates. Some categories will be harder to fill than others.
6 Put the finished sheets up around the room.
A jellyfish graphic organiser is a good way to show how subgroups make up a whole. It can also be used to list specific examples at the same time.
1 Individually, go around to each of the five lists of vertebrates from Task 1 and select six animals from each class.
2 On a full page, draw five ‘jellyfish’ connected to the main group (vertebrates), as shown in Figure 1.
Figure
3 Label each jellyfish with the class name: birds, mammals, fish, reptiles and amphibians.
4 Write a description of the characteristics of each class in the appropr iate body of each jellyfish.
5 Place the six animals you selected along the six tentacles of each jellyfish.
No part of this publication may be reproduced, stored in a retrieval system or transmitted in any form or by any means.
5.8
Identifying pl ants
What you need:
What to do:
2 Make detailed observations of each plant, including: a the height of the plant b the width of the plant c the shape, smell, texture and size of the leaves (take a close-up photo of the leaves) d the position and number of leaves on the plant.
3 Describe the plant’s flowers, seeds or nuts.
4 Describe any other unusual or special features of the plant.
5 Repeat steps 2–4 for all the plants you observed.
2 Contrast the features that you have observed between the plants.

3 Use these differences to develop a dichotomous key that can be used by students in other year levels.
DRAFT
To identify the producers and consumers in a local food web.
Metre-long stick, metric rulers, poster board, markers, photographs of ecosystems
1 Think about what you know about food webs in your school grounds or a local park. Write a list of at least 10 organisms you might find in these food webs. Compare the number of different animals found in different areas of the school ground or park. Use this to generate a scientific question. For example, would you expect to find more or less animals in an area with a lot of paths?
2 Write a hypothesis that matches your scientific question.
3 Select two 1 m2 areas in your backyard, schoolyard or neighbourhood to study. The study areas should be near each other but in two different habitats (e.g. on a footpath and on some grass, or just inside a forest and in a clearing).
4 Observe and record all organisms in the area above and within this study area.
5 Construct a food web that identifies where each organism gets its energy (who they eat).
1 Identify the organisms that are producers.
2 Identify the organisms that are consumers.
3 Compare the number (of individuals and species) of producers and consumers you obser ved in each area.
No part of this publication may be reproduced, stored in a retrieval system or transmitted in any form or by any means.
To investigate some factors that affect competition in plants.
Materials
> Packets of seeds (a variety of vegetables or flowers is ne eded)
> Smal l plot (20 × 20 cm) in a g arden, divided into thirds, or 3 medium-sized pots containing good-quality potting mix
> Measuring cylinder or graduated jug for watering
1 Prepare the plots (or pots) so the soil is moderately deep and smooth. Label them A, B and C.

2 In each plot, plant six seeds of the same type, spread evenly apar t.
3 Plant more seeds in plots B and C as described in the inquiry section, below.
4 Water the soil in all plots each day as evenly as possible with the same amount of water.
5 Record the growth of the seeds. If possible, take photographs each week or every few days when the seeds begin to germinate. If the seeds become seedlings (small plants), measure their heights and record the results in a table.
Choose one of the inquiry questions below.
> What i f more of the same seeds were planted close together in plot B?
> What i f different seeds were planted between the original seeds in plot C?
Answer the following questions about your inquiry question.
1 Identify the types of seeds that you will test.
2 Write a hypothesis (If … then … because …) for your inquir y.
3 Identify the independent variable that you will change from the first method.
4 Identify the dependent variable that you will measure and/or observe.
5 Identify two variables that you will need to control to ensure a reasonable test. Describe how you will control these variables.
6 Identify the mater ials that you will need for your experiment.
7 Write down the method you will use to complete your investigation in your logbook.
8 Draw a table to record your results.
9 Show your teacher your planning to obtain approval before starting your experiment.
Record all results. You could take photos showing the progress of growth and/or record the average heights of plants of different species and record them in a table.
1 Identify one piece of advice that you would provide to another student who wants to carry out the experiment.
2 Compare the growth of the plants in each plot by summar ising your key observations in 2–3 sentences.
3 Use evidence from your results to describe any competition between the seeds as they germinated. Use statements such as, ‘The plants in Pot … grew … than the plants in Pot … This implies that competition between the plants…’.
3 Identify one other variable that might have affected the growth of the seeds. Describe how this variable could have affected the results of your experiment.
4 Describe how the competition you obser ved would affect organisms in the natural environment.
Write a conclusion about the factors that affect competition between germinating seeds.

Figure 1 What affects the growth of seeds?
No part of this publication may be reproduced, stored in a retrieval system or transmitted in any form or by any means.
Leaf litter is the dead and rotting leaves that lie on the ground under trees and in gardens. Leaf litter helps protect soil and is home to many tiny, fragile invertebrates that work together to keep the soil in good condition.

To identify the organisms that make up a leaf litter community.
2 Lift up the leaves slowly. Use your brush to pick up the tiny animals and make sure not to crush them.
3 Make a list of the animals you find. Make a separate list for eggs, cocoons, larvae or types of fungi.
4 Return the animals to the place where you found them.
1 Explain why it is important to know about the animals you are likely to find before looking for them in the leaf litter.
2 Explain why you should return animals to the place where you found them.
1 Find an undisturbed area approximately 50 cm long by 50 cm wide. Work only in this area.
3 A leaf litter community does not contain any producer organisms, such as healthy g reen plants. Identify the energy source for this community.
4 Describe how this leaf litter community improves the health of the soil.
What you need:
Small beads, permanent marker, paper bag, A4 graph paper, pencil, ruler
1 Place a random number of beads in a paper bag.
2 Draw 10 beads out of the bag. Mark each of the 10 beads with the permanent marker. Place the 10 beads back into the bag. This is the same as tagging the beads and releasing them.
1 Divide the graph paper into 20 equal-sized squares.
2 Spread a large handful of beads over the graph paper. These represent insects in an ecosystem.
3 Count the number of ‘bead insects’ in four of the squares. Include the beads that are on the top lines or left lines of the squares. Do not include the beads that are on the bottom lines or right lines of the squares. Divide the number counted by 4 to determine the average number of bead insects in each square.
4 Multiply the number of ‘bead insects’ found in each square by 20 to estimate the size of the population in the ecosystem.

5 Count the number of beads that were actually spread over the graph paper.
3 Mix the beads in the bag and draw another 10 beads out of the bag. Count the number of ‘tagged’ beads you collected in the ‘recapture’.
4 Use the formula to estimate how many beads are in the bag. Total number of beads= N1 × N2 M2 where N1 is the number of beads drawn out the first time (10), N2 is the number of beads drawn the second time (10) and M2 is the number of tagged beads drawn during the second draw.
5 Count the number of beads that are actually in the paper bag.
Figure 4 Counting the number of ‘bead insects’
1 Identify the types of organism populations that could be counted using: a capture–recapture b quadrats.
2 Describe the accuracy of the capture–recapture method in determining population size (by comparing the number of beads estimated in part A step 4 to the ‘true value’ counted in part A step 5).
3 Explain which of the following animals would be more likely to be recaptured:
> an animal that was fed and treated well during the first capture
> an animal that became frightened and was roughly handled dur ing the first capture.
Justify your answer (by describing how each animal will react the next time it sees or smells a trap, and deciding which behaviour is more likely to lead to them being recaptured).
4 Describe the accuracy of the quadrat method in determining the population size.
5 Identify the size a quadrat would need to be to measure a population of fully g rown trees.
Large packet of popcorn, material to represent rabbit tails, outdoor space, container, measuring wheel, timer

Many scientists use simulations or modelling to determine how the number of organisms of the same species (the population) will be affected by the introduction of a new species.

1 Measure a 30 m2 area outside in the schoolyard. Count out 40 pieces of popcorn. Randomly throw handfuls of the counted popcorn through the area.
2 Select five students to represent rabbits. Each ‘rabbit’ should tuck a piece of material into their belt to represent a tail. In order to survive, each rabbit must collect at least five pieces of popcorn in the 15-second ‘season’. The retrieved popcorn is placed in a container at the end of the time-period and is removed from the available resources.
3 Simulate a second season by adding another 30 pieces of popcorn and having the rabbits collecting popcorn during another 15-second period. After the second season, any rabbit that survives then ‘reproduces’. This involves selecting another student to join the simulation as a rabbit. The simulation is repeated, using popcorn in varying amounts to represent the food production in good and poor years, until ‘starvation’ begins to reduce the population.
4 Copy Table 1 and record your data for six seasons. Highlight the seasons that are droughts (poor food supplies) and those that are bumper years (good food supplies).
Table 1 Population of rabbits over many seasons
Season
Number of rabbits at end of season
1 2 3 4 5 6


Figure 2 How do predators affect a rabbit population?
1 Repeat the simulation from Part A but this time with additional students modelling foxes. A fox must catch a rabbit in order to survive. A fox catches a rabbit by removing the cloth tail hanging from their belt (similar to flag football).
2 Copy Table 2 and record your data for six seasons.
Table 2 Populations of rabbits and foxes over many seasons
Season 1 2 3 4 5 6
Number of rabbits at end of season Number of foxes at end of season

1 Graph the results of the model as a bar graph showing the number of each animal at the end of a time period.
2 Identify how the following factors were represented in the model. a increased food supplies b decreased food supplies c competition between rabbits or foxes
3 Use data from the modelling to explain the effect of: a increased food supplies b decreased food supplies c competition on predator populations.
4 Explain the characteristics in a population that will help some animals to survive.
To examine factors that affect the pollination of fruit.
> 10 chairs
> 2 large bags of popcorn
> 10 paper bags
> Timer
1 Divide the class into groups, with six students in each group. Each group represents a team of bees.
2 Gather the bees in one corner of the room or on the oval. This is the beehive.
3 Place approximately 10 chairs around the room or oval to represent apple trees. On the seat of each tree, place one handful of popcorn and an empty paper bag.
4 The bees must fly from tree to tree, taking a single piece of popcorn from one tree and putting it in the paper bag of another tree. This represents a bee pollinating the apple trees. Twenty seconds represents one growing season. This can become a competition if the number of pieces of popcorn on each tree is controlled.
5 At the end of 20 seconds, the bees gather back in the hive. A representative counts how many pieces of popcorn are in each paper bag. Each piece of popcorn represents one apple that was able to g row on that tree during the season.
6 Record how many apples are grown in each team’s first season. Calculate the average number of apples grown that season for all the teams.
7 Empty the paper bags and reset the popcorn on each chair tree.

Choose one of the inquiry questions below.
> What if the weather becomes colder so that the bees fly (wa lk) more slowly?
> What i f a harsh winter kills half the bees in the hive?
> What i f overcrowding in the hive causes half the bees to swarm out of the area?
> What i f the apple trees are damaged and lose half their leaves?
Answer the following questions about your inquiry question.
1 Write a hypothesis for your inquiry.
2 Identify how you represent your independent variable in the pollination model.
3 Identify what effect you expect to see on the dependent variable that you will measure and/or observe.
4 What variables will you need to control to ensure a reasonable test? How will you control them?
5 Write down the method you will use to complete your investigation. (HINT: Use the method above as a guide.)
6 Draw a table to record your results.
7 Show your teacher your planning to obtain approval before starting your experiment.
Draw up an appropriate table and graph to show the results of your inquiry.
1 Describe the effect that changing bee populations has on the amount of fruit produced.
2 Describe one way your pollination model was not an accurate depiction of real-world pollination.
3 Suggest one way to improve the model you used.
4 Name one situation where scientists may use computer modelling to research.
Describe why pollinators are important to the supply of fruit.
was reduced?Figure 1 A bee, an effective pollinator
Large map of Australia, colour-coded pins or small cardboard squares (e.g. red for bushfires, blue for floods, black for cyclones), copy of Table 1
Table 1 Some natural disasters in Australia, 1974–2022
Year
December 1974 Cyclone Tracy Darwin, NT
February 1983 Ash Wednesday bushfires Victoria and South Australia 1989 Earthquake Newcastle, NSW February 1993 Heatwave South-eastern Australia 1997 Landslide Thredbo, NSW 2003 Bushfires Canberra, ACT
June 2007 Storm and flood Hunter Valley and central coast, NSW
February 2009 Black Saturday bushfires Victoria
December 2010–January 2011 Flooding Queensland and Victoria
February 2011 Cyclone Yasi Queensland
October 2013 Bushfires New South Wales
February 2015 Cyclone Lam Northern Territory March 2017 Cyclone Debbie Queensland March 2018 Bushfires New South Wales September 2019–March 2020 Bushfires Queensland, New South Wales, Victoria, ACT, South Australia and Western Australia
February 2021 Bushfires Wooloroo, WA
March 2021
Floods Queensland and New South Wales April 2021 Cyclone Seroja Western Australia
February–April 2022 Floods Queensland and New South Wales
1 Work in small groups to place pins or attach squares of the appropriate colour to the map where Australia was affected by each natural disaster.
2 If a large area is involved, place a number of pins or squares across the area.
1 Identify the areas that were more affected by these natural events than others.
2 A student suggested that monsoonal rains should have been included in this map. Evaluate this suggestion (by defining ‘natural disaster’, describing monsoonal rains and deciding whether monsoon rains are classified as a natural disaster).
3 Describe the positive and negative effects of these events.
4 Identify and describe patterns in the alternation of floods and bushfires.
Figure 1 Bushfires occur frequently in Australia.
No part of this publication may be reproduced, stored in a retrieval system or transmitted in any form or by any means.

To determine your personal ecological footprint.
Scientists often need to calculate the effect an organism has on the environment. There are a number of different methods to do this. Most commonly, scientists assign value to different activities according to their impact on the environment. Complete the following survey to determine your personal ecological footprint.
1 The amount of my food that has packaging is: All (10) Most (7.5) Half (5) Some (2.5) None (0)
2 The amount of food I waste each day is: All (10) Most (7.5) Half (5) Some (2.5) None (0)
3 The amount of my food that is grown locally is: All (0) Most (2.5) Half (5) Some (7.5) None (10)

4 The amount of meat I eat each day is: > Once (60) Once (40) < Once (30) Vegetarian (20) Vegan (15)
5 The number of cars in my family is: > 2 (30) 2 (20) 1 (10)
6 The size of the car is: Large (20) Medium (10) Small (5)
7 The number of times I shower each day is: > 1 (10) Once (5) 3–4 times/week (2.5)
8 The number of energy-saving appliances I have is: All (0) Some (2.5) None (10)
9 The number of electronic devices that I have is: >15 (20) 10–15 (10) 5–10 (7.5) < 5 (2.5)
10 I reuse items before putting them in the rubbish: Yes (0) No (2.5)
Add the number of points to determine the impact you have on the environment. Compare your results with the rest of your class. Describe how their environmental impacts were increased or reduced compared to your results.
Evaluate how you could reduce your impact on the environment and provide a response to the following prompts.
1 Describe two alternative responses to the questions.
2 Describe how these changes will impact on you and your family.
3 Decide if the changes are more or less important than the impact.
No part of this publication may be reproduced, stored in a retrieval system or transmitted in any form or by any means.
Ripened eucalyptus nuts (gumnuts), leaves and bark of a eucalypt

1 Place the nuts in a 40°C oven for 24 hours to open and release the seeds. Each of these thick, woody capsules contains hundreds of tiny seeds.
2 Feel the leaves of the eucalypt. They have a thick cuticle that is effective in preventing water loss.
3 Hold a leaf up to the light or place under a binocular microscope. Notice the numerous small dots, which are oil glands on the leaf.
4 Have a close look at the bark of the tree. Many eucalypt trees have bark that is thick and fibrous.
1 Explain why the seed of the gumnut is protected with such a thick external capsule.
2 Identify what might trigger the release of the seed from the gumnut.
3 Explain the function of the oil glands in a eucalypt leaf.
4 Explain the function of thick, fibrous bark.
No part of this publication may be reproduced, stored in a retrieval system or transmitted in any form or by any means.
To model the different phases of the Moon.
Torch or lamp with exposed light bulb, globe or basketball, tennis ball, small foam ball, black permanent marker
1 In small groups, use a torch or light bulb in a fixed position to represent the Sun. One person should then hold a globe or basketball to represent the Earth, and a second person should hold a tennis ball to represent the Moon.
2 Begin by rotating the Ear th as it orbits the Sun. Try to work out how the Moon would orbit the Earth as the Earth orbits the Sun.
3 Use a black permanent marker to colour half of the foam ball. Face the white side of the foam ball towards you.
This represents the fully lit face of a full Moon. Slowly rotate the foam ball so that the Moon appears to be getting smaller. (You will gradually see more of the darkened side of the Moon.)
4 Shine the light from a torch on the white section of the Moon. Pass the tennis ball between the light and the foam ball.
1 Explain why people on Earth only see one side of the Moon.
2 Draw each phase of the Moon as you saw it on the foam ball in step 3.
3 Describe and identify the phenomenon that you modelled in step 4.
4 Explain why the statement ‘the dark side of the Moon’ does not refer to the side of the Moon away from Earth.
No part of this publication may be reproduced, stored in a retrieval system or transmitted in any form or by any means.
To model how the movement of the Earth can generate different seasons.
Torch or lamp with exposed light bulb, globe
1 Use a torch or light bulb in a fixed position to represent the Sun. One per son should then hold the globe or basketball to represent the Earth.
2 The Earth is tilted as it orbits the Sun. Hold your globe or basketball (model Ear th) so that it is tilted slightly. Imagine that the axis is tilted to point towards the numbers 1 and 7 on a clock face. Do not change this tilt during the activity.
3 Walk slowly in a circle around the lamp, at the same time rotating the model Earth. Make sure the tilt always points in the same direction. When it is summer in Australia, the Sun is almost overhead. In winter, the sunlight arrives at an angle and is more spread out.
1 When you have walked half a circle around your Sun, stop and look at the model Earth. Describe which part of the model Earth would be experiencing summer.
2 Describe how the seasons changed on one point of the model Earth as it moved around the Sun.
3 A student claimed it is hotter in summer because Australia is closer to the Sun. Evaluate the truth of this statement using your model as evidence.
Figure 1 The Earth is tilted as it orbits the Sun.
No part of this publication may be reproduced, stored in a retrieval system or transmitted in any form or by any means.

No part of this publication may be reproduced, stored in a retrieval system or transmitted in any form or by any means.


 OXFORD UNIVERSITY PRESS CHAPTER 8 EXPERIMENTS
Australia is one of the driest continents in the world. But according to an Australian Government report, Australians consume more water per person than any other country, using an average of 100 000 L per person every year.
Water is an important resource in Australia, so it is critical to manage our waterways carefully.
Australia has many waterways, including rivers, groundwater systems, wetland environments and other human-made passages for water. Waterways are vital to our existence and are valuable economic assets.
Waterways play an important role in supporting biodiversity in our local areas, by providing habitats for wildlife (such as fi sh and turtles) and plants.
Humans rely on local waterways for drinking water, irrigation of crops, industrial processes and recreational activities. But sometimes these human activities can impact waterways, endangering the biodiversity of a local area.
Waterways also hold spiritual significance for many people. Due to the importance of local waterways to First Nations peoples, waterways are part of our cultural heritage.
We must, therefore, manage our waterways to maintain their complex ecosystems.

A contaminant is a substance that pollutes or poisons something. Contaminants can occur naturally, or be caused by humans – such as microplastics, pesticides and litter. Litter is an example of a physical contaminant,
Design a device that will reduce the contaminants that are entering your local waterway, in order to protect biodiversity in the area.
Figure 1 Algal blooms occur when an oversupply of nutrients in
increase, covering the water’s surface. Contaminants, such as industrial fertiliser running into waterways, can cause algal blooms. Algal blooms are often toxic to other aquatic life.

while pesticides are examples of chemical contaminants. There are many types of contaminants, which are often more heavily concentrated in industrial, urbanised or agricultural areas.
Human land use and major weather events, such as floods and bushfi res, can introduce contaminants into local waterways and affect the water quality.
When water becomes contaminated, it can affect the health of an entire ecosystem, leading to serious environmental issues, such as acidic soil or algal blooms. So it is important for all waterways to be managed to protect the organisms that rely on them to survive.

Figure
Figure 3 The Yarra River is known to local Wurundjeri people as Birrarung, and has great cultural significance.
In Geography this year, you will learn about water as a resource and how it connects places as it moves through the environment. You will also study the variability and scarcity of water in Australia.


In History, you will investigate the importance of water in sustaining ancient civilisations.

To complete this task successfully, you will need to investigate the health of a local waterway and the nearby land uses that may be introducing contaminants to the water. You will then need to research strategies that will help to reduce these contaminants.
You will find more information on this in Chapter 2 ‘Water as a resource’ and Chapter 3 ‘Valuing and managing water’ of Oxford Humanities and Social Sciences 7 Australian Curriculum
In Maths this year, you will consolidate your understanding of area and volume and different units for measuring them. You will learn to perform calculations involving fractions, decimals and percentages –both with and without digital technology.
To complete this task successfully, you will need to combine these mathematical skills with your understanding of chemical and physical changes. You can then determine the scale of the problem and design your prototype in detail. You may need to perform calculations that relate the concentrations of contaminants, the dimensions of your prototype, the volume of water that can and needs to be processed, and the quantity of contaminants that need to be disposed of.
You will find help for applying these maths skills in Chapter 3 ‘Fractions and ratios’, Chapter 4 ‘Decimals and percentages’, and Chapter 9 ‘Length, area and volume’ of Oxford Maths 7 Australian Curriculum.
In Science this year, you will learn about how particles move in solids, liquids and gases. Each of these states of matter occurs during the water cycle, which is influenced by both nature and humans. When water is combined with other particles, it forms different types of solutions and mixtures. The unique properties of each particle (including the water molecule) can allow it to be isolated and purified once more.
To complete this task successfully, you will need to consider the properties of each contaminant, and how these properties can be used to separate the contaminants from the water. You will also need to be familiar with the scientific method, and understand how to conduct a reasonable test.
You will find more information on this in Chapter 2 ‘Particle model’ and Chapter 3 ‘Mixtures’ of Oxford Science 7 Australian Curriculum.
To successfully complete this task, you will need to complete each of the phases of the design cycle.

When designing solutions to a problem, you need to know who you are helping and what they need. The people you are helping, who will use your design, are called your end-users.
Consider the following questions to help you empathise with your end-users:
• Who am I designing for?
• What problems are they facing? Why are they facing them?
• What do they need? What do they not need?
• What does it feel like to face these problems?
• What words would you use to describe these feelings?
To answer these questions, you may need to investigate using different resources, or even conduct interviews or surveys.
Before you start to design your device, you need to defi ne the criteria that you will use to test that the problem is solved.
Rewrite the problem so that you describe the group you are helping, the problem they are experiencing and the reason it is important to solve it. Use the following question as a guide: ‘How can we help (the group) to solve (the problem) so that (the reason)?’
1 Define each contaminant that is present in the waterway. Describe the properties of each contaminant.
2 Describe how you could test whether the contaminant was present in the water.
3 Describe how the contaminant would affect the biodiversity of the area if it were not removed from the waterway.
Once you know who you’re designing for, and what the criteria are, it’s time to get creative!
• Outline the criteria or requirements your device must fulfil (for example, the weight and height of your design).
• Brainstorm at least one idea per person that fulfils the criteria.
• Consider whether your idea will prevent contamination from occurring or solve the problem after it has already occurred.
Remember that there are no bad ideas at this stage. One silly thought could lead to a genius innovation!
Draw each individual design for your device. Label each part of the design. Include the materials that will be used for its construction. Include in the individual designs: a the method you will use to isolate each contaminant b the location of the device in the waterway. If there is more than one separation method used in your design, identify the order in which you will carry out each method.
Present your design to your group. Use the criteria or requirements that you identified to decide which design your group will build.
Build and test the prototype of your group’s chosen device.
Use the following questions as a guideline for your prototype:
• What materials will you need to build your prototype?
• How will you test whether each step of the design is successful? What will the outcome of each step look like?
• How will you record the steps you use when testing your device?
• How will you record the details of each extracted contaminant?
• How will you dispose of the extracted contaminants after your project is completed?
Use the scientific method to design and experiment with each separation method to ensure its success. You will need to control your variables between each test. What criteria will you use to determine the success of your prototype?
Conduct your tests and record your results in an appropriate table.
Present your design to the class as though you are trying to get your peers to invest in your device.
In your presentation, you will need to:
• explain why removing the contaminant is important for the local wildlife
• describe the key features of your design and how it will reduce the amount of contaminant in the waterways
• construct a labelled diagram of your prototype in the natural environment
• explain the principles that support your design – the importance of water in the local environment and in sustaining civilisations, how some waterways become contaminated and how these contaminants can be reduced
• estimate the number of devices needed to reduce contaminants in the waterways in your local area
• calculate the cost of implementing your design.
Check your Student obook pro for the following digital resources to help you with this STEAM project:
Student guidebook
This helpful booklet will guide you step-by-step through the project.
What is the design cycle? This video will help you to better understand each phase in the design cycle.
Check your Teacher obook pro for these digital resources and more:
Implementation advice
Find curriculum links and advice for this project.
Assessment resources
Find information about assessment for this project.
How to manage your project
This ‘how-to’ video will help you to manage your time throughout the design cycle.
How to pitch your idea This ‘how-to’ video will help you with the ‘Communicate’ phase of your project.
In 2019, the United Nations estimated that every year, 90 billion tonnes of resources (including fossil fuels, precious metals and non-metals) are extracted from the earth and turned into usable products. When these products are no longer used or wanted, only 9 per cent are recycled.


If we want to have enough resources left for future generations, humans cannot continue to extract materials from the earth in this way. It is unsustainable.

In Australia, millions of electronic devices are thrown away every year. This is known as e-waste. E-waste can be difficult to recycle, but it often contains valuable metals.
The average mobile phone contains 0.034 g of gold, 16 g of copper and 0.35 g of silver. When a phone is thrown into landfi ll (along with all the other e-waste that once used electricity or batteries) the materials can take many decades to break down (sometimes releasing toxins into the ground).
Recycling these materials reduces the need to mine new resources.
Fast fashion is the term used for affordable clothing produced rapidly for the general public. It is designed and produced quickly to reflect current fashion trends. When fashion becomes outdated, the clothes or products that reflect that fashion are often thrown away. The Australian Bureau of Statistics (2020) identified that, on average, each person sends 23 kg of clothing to landfi ll each year. Over 60 per cent of this clothing is made of synthetic fibres (made from fossil fuels) that can take many years to biodegrade.
Develop a way to encourage residents or businesses to be part of the circular economy by reducing the amount of waste that is sent to the local landfill site.
One potential solution to our unsustainable use of resources is a ‘circular economy’. In a circular economy, resources are used and reused as much as possible. This benefits businesses because the longer a resource can be used, the more value it has. A circular economy is based on three key principles:
1 eliminate waste or pollution in the production of a product
2 keep products and materials in use
3 regenerate natural systems.
Some companies are already using the principles of a circular economy in the products they sell in Australia.
Figure 2 Electronic waste does not belong in landfill. Laptops that are no longer working or wanted are examples of e-waste.

In Economics and Business this year, you will learn how consumers and producers respond to and influence each other in the market, particularly through price mechanisms. You will consider how resources are distributed, allocated or used in the production of food, clothing and electronics, and the growing consumer demand for sustainable products.
In Geography, you will investigate how the environment can affect the liveability of a place. You may survey the local area to understand the role of services and facilities provided to minimise, reduce and prevent waste, and strategies used to enhance liveability.
To complete this task successfully, you will need to consider the products you buy and the decisions businesses make when deciding what to produce, and the consequences when a product reaches its end-of-life. You will also need to gain an understanding of people’s perceptions in your local area towards waste management, recycling and the importance of the environment in measuring liveability.
You will find more information on this in Chapter 5 ‘Liveable cities’, and Chapter 15 ‘Economic choices, rights and responsibilities’ of Oxford Humanities and Social Sciences 7 Australian Curriculum
In Maths this year, you will use fractions, percentages and decimals to represent numbers, and ratios between quantities. You will consolidate your knowledge of volume, learning about cubic units and how to convert between different units of volume. You will perform calculations with and without digital technology.
To complete this task successfully, you will need to quantify the problem, which will include using ratios or fractions to scale between individual, local, national and global situations. You will need to cost your solution, accounting for any costs saved by recycling valuable materials.
You will find help for applying these maths skills in Chapter 3 ‘Fractions and ratios’, Chapter 4 ‘Decimals and percentages’, and Chapter 9 ‘Length, area and volume’ in Oxford Maths 7 Australian Curriculum.
In Science this year, you will learn about separating mixtures, recycling different materials and disruptions to ecosystems. You will need to use your knowledge to consider the role of renewable and ‘non-renewable’ resources in different products, and how constantly sourcing new materials will affect the surrounding ecosystem.


To complete this task successfully, you may need to consider how the change in state of matter can aid a circular economy. You will also need to be familiar with the scientific method and understand how to conduct a fair test.
You will find more information about these issues in Chapter 3 ‘Mixtures’ and Chapter 6 ‘Ecosystems’ in Oxford Science 7 Australian Curriculum.
To successfully complete this task, you will need to complete each of the phases of the design cycle.
Rewrite the problem so that you describe the group you are helping, the problem they are experiencing and the reason it is important to solve it. Use the following phrase as a guide. ‘How can we help (the group) to solve (the problem) so that (the reason)?’
1 Describe the product that is being used. How much product is needed for normal functions?
2 Describe the waste that is being produced. In what units could you measure the amount of waste? How could you estimate how much waste is currently being produced?
When designing solutions to a problem, you need to know who you are helping and what they need. The people you are helping, who will use your design, are called your end-users. This stage involves thinking about the problem (not possible solutions).
Consider the following questions to help you empathise with your end-users:
• Who am I designing for?
• What problems are they facing? Why are they facing them?
• What do they need? What do they not need?
• Who is producing the waste? Why is the waste being produced?
• What does it feel like to face these problems?
• What words would you use to describe these feelings?
To answer these questions, you may need to investigate using different resources, or even conduct interviews or surveys.
Before you start to design your solution, you need to defi ne the criteria that you will use to test the success of your solution.
3 Describe the different things that currently happen to this waste. To what fraction of the waste does this happen?
4 Describe the criteria that you will use to measure the success of your design.
Once you know who you’re designing for, and what the criteria are, it’s time to get creative!
As a group, brainstorm ways to solve the problem. Remember that there are no bad ideas at this stage. One silly thought could lead to a genius innovation!
Once you have many possible solutions, select three to five ideas and research whether these ideas have already been produced by someone else. If the prototype idea is already on the market, can you make a better version? If it’s not, what will be needed to make it?
Draw your top two ideas. Label each part of the designs. Include the materials or skills required for their construction.
Include in the designs:
a a description of how the users will interact with the prototype idea
b a description of how the amount of waste will be decreased, and by roughly how much c a description of how the design will contribute to the circular economy
d at least one advantage and disadvantage of each design. Select one of the designs to take to the building and testing stage.
You will need to build at least three versions of your prototype idea. The fi rst version will be tested for usefulness; the second will be used to test or survey the group you are helping; the third will be used for the presentation.
Use the following questions as a guideline for your prototype idea.
• What skills will you need?
• How will you produce a physical version of your prototype idea?
• How will you collect data on the effectiveness of your idea?
Use the scientific method to design an experiment that will test the effectiveness and strength of your fi rst prototype. You will test the prototype more than once so that you can compare, but you will need to control your variables between tests.
What criteria will you use to determine the success of your solution?
Conduct your tests and record your results in an appropriate table.
If your prototype will be used to reduce waste, then you will need to generate a survey to test whether the prototype is appropriate for the user. (How would they use it? Would it make their work easier or harder? How likely do you think they are to buy it, and why? How will the prototype affect normal behaviours? How will the production of the prototype affect the environment?)
Use the information you have obtained from testing the fi rst two versions to adapt your last prototype to be more effective and usable for the group you are helping. You may want to use the fi rst two prototypes to demonstrate how the design has been improved over time.
Present your solution to the class as though your peers are going to invest their money. How will you convince them it is a good idea?
In the presentation, you will need to:
• explain why we need to reduce the amount of waste going to the local landfill
• describe the key features of your design and how they will reduce the amount of waste in the landfill, using calculations to justify a quantitative estimate of that reduction
• construct a labelled diagram of your prototype in the natural environment
• describe how the ecosystem will be impacted by your prototype idea
• explain the principles that support your design – such as the circular economy
• use calculations to estimate the cost of implementing your design.
Check your Student obook pro for the following digital resources to help you with this STEAM project:
Student guidebook
This helpful booklet will guide you step-by-step through the project.
What is the design cycle?
This video will help you to better understand each phase in the design cycle.
Check your Teacher obook pro for these digital resources and more:
Implementation advice
Find curriculum links and advice for this project.
Assessment resources Find information about assessment for this project.
How to manage your project
This ‘how-to’ video will help you to manage your time throughout the design cycle.
How to define a problem
This ‘how-to’ video will help you to narrow your ideas down and define a specific problem.


abiotic factors non-living factors that influence an ecosystem, such as wind, water, salinity and temperature accuracy how carefully, correctly and consistently data has been measured or processed; in science, how close a measured value is to the true value aim the purpose of an experiment air resistance friction between a moving object and the air it is moving through amoeba a type of single-celled organism belonging to the Protista kingdom anomaly a result that does not fit in with the pattern of data apparatus equipment placed together for an experiment atmosphere the envelope of gases surrounding the Earth or another planet atom

the smallest particle of matter; cannot be created, destroyed or broken down (indivisible) attraction force the force that attracts one object to another autotroph an organism that makes its own food (e.g. plants) axis an imaginary straight line joining the North and South Poles of the Earth


unicellular organisms that have a cell wall but no nucleus balanced forces two forces equal in size and opposite in direction binomial the double-name system created by Linnaeus to name organisms; the first name is the genus, the second name is the species

biological control a method of controlling a population by releasing a living organism into an ecosystem biotic factors living factors that influence an ecosystem, such as animals, plants and bacteria block and tackle a group of pulleys mounted together in a frame or block, which provides significant mechanical advantage boiling point the temperature at which a liquid boils and becomes a gas Bunsen burner a piece of equipment used as a heat source in the laboratory
calibrate check the accuracy of a meter or measuring device against known measurements capture–recapture a method of estimating the number of organisms by capturing, marking and releasing a sample of the organisms carnivore an animal that eats other animals carrying capacity the maximum number of organisms in a population that can be sustained by an ecosystem cell (in biology) the building block of living things cell wall a structure that provides support around the cell in some organisms, such as plants and fungi centrifuging a technique used to separate light and heavy particles by rapidly spinning the mixture
chemical property how a substance behaves in a chemical reaction, such as how it reacts with an acid chemistry the branch of science that deals with matter and the changes that take place within it

chromatography a technique used to separate substances according to their differing solubilities classify arrange in classes or categories cognitive verb a doing word that requires you to perform a specific thinking task colloid a type of mixture that always looks cloudy, because clumps of insoluble particles remain suspended throughout it rather than settling as sediment column graph a graph in which the height of the columns represents the number measured commensalism a type of relationship between two organisms of different species, in which one organism benefits and the other is not affected community different populations living in the same location at the same time competition contest between organisms that require or seek similar resources such as shelter and food compound substances made up of two or more types of atoms bonded together, e.g. water compressibility the extent to which a substance can be compressed (squashed); gases can be compressed but solids and liquids cannot
compressional strength the ability of a substance to withstand large forces concentrated containing a large number of solute particles in the volume of solution conclusion a statement that ‘answers’ the aim of an experiment condensation the cooling down of gas into a liquid consumer an animal that can’t convert the Sun’s energy into sugars and instead must eat to get the energy it needs to survive
contact force a force acting between two bodies in direct contact continuous data data that are measured and can be any value controlled variable a variable that is kept constant and unchanged throughout an experiment crystallisation a separation technique used with evaporation to remove a dissolved solid from a liquid; after the liquid has been evaporated the solid remains, often in the form of small crystals
distillation a technique that uses evaporation and condensation to separate a solid from the solvent in which it has dissolved domain a small section of a magnet where the magnetic field of all the atoms is aligned in the same direction drought a period in which an area experiences water shortage
decanting a technique used to separate sediment from the liquid it is in by carefully pouring the liquid away decomposer an organism that gains nutrients by breaking down dead organisms into simpler nutrients density a measure of mass per unit of volume dependent variable a variable in an experiment that may change as a result of changes to the independent variable dichotomous key a diagram used in classification; each ‘arm’ of the key contains two choices dilute containing a small number of solute particles in the volume of solution discrete data data where the numbers can only be whole numbers
discussion a summary of findings, and analysis of the design of an experiment, including problems encountered and suggestions for improvement disease a disorder or condition that interrupts the normal functioning of an organism
distance magnifier a lever that changes a strong force that acts over a short distance into a weak force that acts over a longer distance
ecosystem a community of living organisms and their non-living surroundings ectotherm an organism with a body temperature that changes with the environment effort the force used to operate a lever electrostatic force the force between two objects caused by a build-up of negative charges element a pure substance made up of only one type of atom, e.g. oxygen, carbon emigrate when an animal leaves an ecosystem emulsion a type of colloid in which two or more liquids are mixed together, with one suspended in the other as tiny droplets endoskeleton an internal skeleton endotherm an organism that has a constant body temperature regardless of the temperature of its environment equinox a day when day and night are the same length; occurs twice each year equipment items used in the laboratory to conduct experiments error an inaccuracy or inconsistency in measurement evaporation a change in state from liquid to gas; also a technique used to separate dissolved solids from water No part of this publication may be reproduced, stored in a retrieval system or transmitted in any form or by any means.
exoskeleton an external skeleton experiment an investigation used to solve a problem or find an answer to a question
filtering a technique used to separate differentsized particles in a mixture depending on the size of the holes in the filter used first-class lever a lever that has its fulcrum between the point of effort and the load first-order (primary) consumer an organism thats eat only producers such as plants, algae and bacteria; it does not eat other consumers
flocculant a chemical added to a mixture to make suspended particles clump together flood the overflow of a large body of water flotation the action of floating in a liquid or gas food chain a diagram that shows who eats whom in an ecosystem, and how nutrients and energy are passed on food web several intertwined food chains, showing the extended relationships between different organisms force magnifier a device that can increase the amount of force available (e.g. to shift something); an example is a lever friction a force that acts to oppose the motion between two surfaces as they move over each other fulcrum the turning point of a lever
G genus a group of closely related species gravity the force of attraction between objects due to their masses
hardness how easily a mineral can be scratched herbivore an animal that eats only plants heterotroph an organism (e.g. fungi, animals) that absorbs nutrients from other living things high tide when the ocean covers slightly more land; the highest level that the tide reaches on the shore hypothesis a proposed explanation for a prediction that can be tested
I immigrate when an animal enters a new ecosystem immune able to fight an infection as a result of prior exposure incompressible unable to be compressed; solids and liquids are incompressible independent variable a variable (factor) that is changed in an experiment indicator species an organism that can be used to measure the environmental condition of an area infrared radiation invisible light that has longer wavelengths than visible light introduced species an organism that has been brought to and has established itself in an area it is not native to invertebrate an organism that has an exoskeleton or no skeleton K key (in biology) a visual tool used to classify organisms kinetic energy the energy possessed by moving objects
kingdom the highest category in taxonomic classification
L laboratory a specially designed space for conducting research and experiments leap year a year, occurring once every four years, with 366 days lever a simple machine that reduces the effort needed to do work like poles two north poles or two south poles of a magnet line of best fit the line on a scatter graph that passes through, or nearly through, as many data points as possible to show any overall trends in the data
Linnaean taxonomy a hierarchical system of classification developed by Carl Linnaeus (1707–1778) in which all organisms are grouped into kingdom, phylum, class, order, genus and species, with each individual organism known by its genus and species names load (in physics) resisting force low tide when the ocean covers slightly less land; the lowest level on the shore that the tide recedes to lubrication the action of applying a substance such as oil or grease to an engine or component so as to reduce friction
magnetic pole the north and south ends of a magnet; each of the points near the extremities of the axis of rotation of the Earth or another body where a magnetic needle dips vertically magnetic separation the process of using magnets to separate magnetic materials from non-magnetic materials
mass
the amount of matter in a substance, usually measured in kilograms; the mass of an object never changes, even in space matter
anything that has space and volume; matter is made up of atoms meniscus the curved upper surface of a liquid in a tube method a series of steps explaining how to do an experiment metric system a decimal system of measurement; uses metres, kilograms, litres and so on mixture a substance made up of two or more pure substances mixed together molecule a group of two or more atoms bonded together multicellular consisting of two or more cells mutualism a type of relationship between two organisms of different species, in which both organisms benefit
natural disasters natural events such as floods, volcanic eruptions, tsunamis and earthquakes that can cause severe damage and fatalities neap tide when the difference between high and low tides is smallest; occurs during the Moon’s quarter phase, when the Sun and the Moon pull in different directions net force the vector sum of all the forces acting on an object; also known as resultant force newton the unit used to measure force; symbol N non-contact force a force acting between two bodies that are not in direct contact nucleus a membrane-bound structure in cells that contains most of the cell’s genetic material
omnivore an animal that eats both plants and animals orbit
the path a planet follows around the Sun or a star; the path a moon follows around a planet
parallax error an error, or inaccurate reading, that occurs as a result of reading a scale from an angle parasitism a relationship in which one organism (parasite) lives in or on the body of another organism (host) and benefits while the host is harmed partial solar eclipse when only some of the Sun’s light is blocked by the Moon phases of the Moon changes in the shape of the Moon as seen from Earth philosopher a ‘lover of knowledge’; someone who studies ideas, theories and questions photosynthesis a chemical process used by plants to make glucose and oxygen from carbon dioxide, sunlight and water physical property a property of a substance that can be measured or observed without changing the substance into something else; examples are colour and boiling point plankton microscopic organisms that float in fresh or salt water pollination the transfer of pollen to a stigma, ovule, flower or plant to allow fertilisation population a group of individuals of the same species living in the same location at the same time population dynamics the study of changes in species population numbers and the factors that may contribute to these changes predator an animal that hunts and feeds on another (prey) for food
prey an animal that is hunted and killed by another (predator) for food producer a plant or plant-like organism that is at the start of food chain because it produces its own food, usually using sunlight pure substance something that contains only one type of substance (e.g. a single element or a single compound) pseudoscience claims that are supposedly scientific but are made with no evidence to support them
quadrat a randomly selected square plot used to estimate the number of organisms qualitative observation an observation that uses words and is not based on measurements or other data quantitative observation an observation that uses a number, such as a measurement
ramp a sloping surface joining two different levels reasonable test a test where all variables are controlled except for the one being changed on purpose reproduction the production of offspring by a sexual or asexual process repulsion force a force that pushes one object away from another results the measurements and observations made in an experiment; they are often presented in a table
saturated describes a solution in which no more solute can be dissolved scatter graph a graph used to represent continuous data; it consists of discrete data points No part of this publication may be reproduced, stored in a retrieval system or transmitted in any form or by any means.
the study of the natural and physical world
scientific diagram a clear, side-view, labelled line drawing, usually made using a sharp pencil scientific model a physical, mathematical or conceptual representation of an object, system, event or process that is used to explain or predict the behaviour of a scientific process or phenomenon scientist a person who studies the natural and physical world screw a sharp-pointed metal object with a spiral thread running along its length and a slotted head
second-class lever a lever that has its load between the point of effort and the fulcrum second-order (secondary) consumer a carnivore that eats primary consumers sediment substance or matter that settles to the bottom in a mixture sedimentation the process of a substance settling to the bottom in a mixture sieving a separation technique based on the difference in particle size solar eclipse when light from the Sun (as seen from Earth) is blocked by the Moon solar energy energy made by atoms colliding with each other in the centre of the Sun solar system the Sun and all the planets, dwarf planets, moons and asteroids that travel around it and each other solstice either of the times when the Sun is furthest from the equator solubility how easily a substance dissolves in a solvent soluble can be dissolved in a liquid
solute a substance that dissolves in a liquid (solvent) solution a mixture of a solute dissolved in a solvent solvent a liquid in which other substances dissolve species a group of organisms that look similar to one another, and can breed in natural conditions and produce fertile young spore a tiny reproductive structure that, unlike a gamete, does not need to fuse with another cell to form a new organism spring balance a device consisting of a spring and a scale, used to measure forces spring tide when there is maximum difference between high and low tides; caused by the combined pull of the Moon and the Sun star a celestial body appearing as a luminous point in the night sky streamlining giving an object a form that presents the least resistance to motion suspension a cloudy liquid containing insoluble particles symbiosis a close physical relationship between two organisms of different species
taxonomist a scientist who classifies living things into groups telescope an optical instrument that uses lenses and mirrors to make distant objects appear closer and larger tensile strength a measure of the flexibility of the bonds between particles in a substance theory an explanation of a small part of the natural world that is supported by a large body of evidence
third-class lever a lever that has its point of effort between the fulcrum and the load third-order (tertiary) consumer a carnivore that eats primary and secondary consumers and is therefore at the top of the food chain thread the spiral ridge of a screw total solar eclipse when the Moon blocks the maximum amount of light from the Sun, as seen from Earth totem a spiritual being, symbol or object that is sacred to a group of people type specimen the specimen used for naming and describing a new species
ultraviolet radiation invisible rays that are part of the energy that comes from the Sun unbalanced forces describes two or more forces that are unequal in size and direction and therefore change an object’s speed, direction or shape unicellular consisting of only one cell; an example is bacteria units standard measurements unlike poles the north and south poles of a magnet urban sprawl the spreading and expansion of cities and houses into undeveloped land
variable something that can affect the outcome or results of an experiment vascular tissue in a plant, tube-like structures that transport water from the roots to the leaves vertebrate an organism that has an endoskeleton
viscosity a measure of how slowly a liquid changes its shape; the thickness of a liquid
weight a measure of the gravitational pull on an object wheel and axle a type of lever that can rotate about its centre, magnifying force or distance No part of this publication may be reproduced, stored in a retrieval system or transmitted in any form or by any means.
Aabiotic factors 150, 151, 158 accuracy 16 agriculture, water use 164–5 aim 28
air resistance 97, 109 airport security 73 algae 146, 148 algal blooms 158, 240 alpine areas 161 aluminium 48, 49, 77 amoeba 125 amphibians 129, 157 analysing the method 26–7 analysing the results 27 Anangu people, classification of their environment 132, 133 anemone fish 146 animal cells 124 animals 124, 132, 148 dissection 229 invertebrates 126–7, 149, 230, 233 vertebrates 126, 128–9, 230 annelids 127 anomalies 27 apparatus 6 Archaea 123 arthropods 127 assumptions 26 astronauts 175 astronomers 182–3, 186 astronomy 182 atmosphere 5 atoms 46, 48–9 attraction force 88 audience, identifying your 55 Australia cane toads 30–1 natural disasters 158–9, 237 Australian National Insect Collection 134 autotrophs 118, 124 axes (graphs) 23, 24 axes (tools) 104 axis (Earth) 172, 179


bacteria 123, 125, 148, 149 bacterial cells 124 balanced forces 86 balanced populations 154 bankcards, black strip on 91 beetles, dichotomous key 121 bike wheel 105 binomial names 123 biodiversity protection by reducing pollution in local waterways (STEAM project) 240–3 biological control 156 biotic factors 150, 151, 158 birds 128, 146 blood separation 69 body temperature 128, 129 boiling point 43, 44, 52 of liquids, for separation 70–1 of water 193, 200

boomerang flight 106–7 botanists 124 brittleness 50 Bunsen burner 17–18


Ccalendars 180–1 calibrated 85 camera traps 152 cane toads in Australia 30–1, 154–5 capture–recapture method 152, 234 carbon dioxide 148 careers 112 carnivores 148 carrying capacity 158 cell wall 124 cells 5, 124 centimetres 14, 15 centrifuging 69, 208 change of state 43–4, 195 changing climate 161 chemical energy 148, 149 chemical properties 44 chemistry 47 chimpanzees 168 chlorine 74 Chordata (phylum) 126, 128 chromatography 72–3, 211–12 circular economy 244 class (taxonomy) 122 Class Amphibia 129 Class Aves 128 Class Mammalia 128 Class Pisces 129 Class Reptilia 128–9 classes (vertebrates) 128–9 classification 116–17 department store 225 of the environment by First Nations peoples 132–3

fossils 138 invertebrates 126–7, 230 living things 124–5, 228 new species 134–5 non-living or dead? 119 plants 130–1, 231 vertebrates 128–9, 230 classification keys 120–1, 131, 226 classification system changes 122–3 early methods 116
Linnaeus’ system 116–17, 122, 123 classify 120 clean water 149 climate changes 161 cnidarians 127 cognitive verbs 34–5 cold substances 52, 53 colloids 62–3, 201 column graphs 22, 23–4 commensalism 146 common names 116 communicating solutions to problems 31 communication, scientific 54–5
No part of this publication may be reproduced, stored in a retrieval system or transmitted in any form or by any means.
community 144 compasses 90
competition 145, 232 compounds 46 compressibility 50–1 compressional strength 50 concentrated solution 64 conclusion 28 condensation 43, 44, 45 conferences 55 conifers 130 consumers 142, 143, 148 contact forces 88, 96–7, 214, 217 contaminant reduction in local waterways (STEAM project) 241–3 continuous data 22 contraction 53 controlled experiment 19–20 controlled variables 20 converting units of length 15–16 cool burning 163–4 coral 127 counting organisms 152–3 crowbars 99 crystallisation 70, 208 cubic centimetres 14 curiosity 4 cycads 33
DDalton, John 44, 47 data anomalies 27 data tables 22 day and night 172–3, 179 decanting 66–7 decomposers 149 deforestation 159 degrees Celsius 14, 15 Democritus 46 density 51, 196–7 department store classification 225 dependent variable 19, 20, 23 design cycle 242–3, 246–7
Dharawal people, classification of mammals 133 dichotomous keys 120, 121, 226 dicotyledons (dicots) 130 diffusion 49, 52, 195 dilute solution 64 discrete data 22, 23 discussion 28 disease 156
dissecting skeletons 229 dissolved oxygen 65 dissolving solutes 204 distance magnifiers 99, 105 distance multipliers 109 distillation 70–1, 80 DNA 123, 125 domains 89 domestic cat 122, 123 doorknob 105
drag 97, 106, 224 drawings of laboratory equipment 7 droughts 159, 164 dugongs 162 dyes 72
dynamic balance (populations) 150–1, 154
e-waste 244
Earth geographic poles 90 and gravity 94–5, 216 magnetic poles 90, 91 night and day 172–3, 179 seasons 178–80, 239 Sun and Moon 172–3 tidal movements 176–7 year 172
echinoderms 127 ecological footprint 161, 238 economic impacts 159 ecosystem balance 150–1, 154 ecosystems 144 disruption of 158–61 energy flows through 142, 148–9, 233 factors affecting populations 150–3 food chains 142, 143, 148 and food production 164 food webs 142–3, 149, 151, 154, 231 historical use 162 human impacts 159–61 human management 162–5 introducing new species effects 154–6 loss of organisms 157 relationships between different species 144–7 ectotherms 128, 129 effort 98, 99, 100, 102, 103, 104, 105 electrostatic charge 93 electrostatic forces 92–3, 215 elements 46 emigration 150, 151 emulsions 63, 201 endoskeleton 126 endotherms 128
energy flows through ecosystems 142, 148–9, 233 energy transfer 148 environment, First Nations peoples classification of their 132–3 environmental health indicators 157 environmental impacts 159–60 environmental scientists 5 equinox 179 equipment, laboratory 6–7, 17–18, 28 erosion 160 errors 16, 26 escalators 104 ethics 77, 109 eucalypt trees, adaptations 163, 238 eucalyptus oil 71 Eukaryota 123 evaporation 43, 44, 70, 208 exchange of gases 119 exoskeleton 126
expansion through heat 52–3 experiments 6, 19–20, 191–239 planning and analysing 26 repeating 20–1, 26 external skeleton 126 extinct species 159
Ffair test 19–20 family (classification) 122 fast fashion 244 Felis catus 123 ferns 130
Ferris wheel 105 filtering 68–9, 80, 149, 207 first-class levers 100, 218 First Nations peoples 32 astronomy 182 boomerang flight 106–7 calendars 180–1 cane toads impact on 155 classification of their environment 132–3 cool burning 163–4 distilling eucalyptus oil 71 Dreaming stories or cultural practices 33 gamba grass impact on 155 land management 162 language groups and Nations in Australia 32 levers 100–1 management of ecosystems 162 movement of the Sun 178, 179 preventing evaporation 44 resource use 164 science skills 32, 33 seasons 179–81 separating mixtures 66, 67 understanding relationship between Moon and tides 176
first order (primary) consumers 142, 148 fish 97, 129, 229 flight, forces in 106–7, 223–4 flocculants 67, 206 floods 158–9 flotation 67, 205 flowering plants 130–1 flowers, importance of 130 fly life cycle 134 fog 42, 62, 63 food chains 142, 143, 148 food production 164 food webs 142–3, 149, 151, 231 cane toads affect on 154 introduction of new species into 154–6, 159, 235 rabbits affect on 157 force diagrams 86, 87 force magnifiers 99, 105, 221–2 forces 84 in action 84, 85 adding together 87 balanced 86 contact 88, 96–7, 214, 217 electrostatic 92–3, 215 in flight 106–7, 223–4
Dr Redback’s family dichotomous key 120 tabular key 121 No part of this publication may be reproduced, stored in a retrieval system or transmitted in any form or by any means.
friction 96–7, 217 gravity 84, 94–5, 216 magnetic 88–91, 214 measuring 84–5, 213 non-contact 88–95, 214–15 push and pull 88–9, 92, 93, 94–5, 214–15 representing 86, 87 in sport 108–9 unbalanced 86 forest ecosystems 149 fossils 138 four-pulley system 103 freezing 44 friction 96–7, 108, 217 frogs 129, 157 fulcrum 98, 100, 101, 105, 109 fungi 124, 125, 146, 149
gamba grass 155
Gariwerd calendar 181 gas chromatography 72–3 gas exchange 119 gas masks 69 gas warfare 58 gas water 43 gases 42, 43, 44, 194 compressibility 51 diffusion 49 heat effects 43, 44, 199 particles in 47, 48, 51, 52, 53 physical properties 50–1 genetic material 123, 124, 125 genus 122, 123 glass recycling 77 global warming 164 glossary 248–53 glucose 148 gold 52 golf, forces in 109 good science experiment 26 Google Earth 122 grams 14, 15 graphing data 22–5 graphs, analysing data in 75 grass trees (Xanthorrhoea) 163, 164 gravity 84, 94–5, 176–7, 216 greenhouse gas emissions 163, 164 growth 118 Gulumoerrgin (Larrakia) calendar 179–80
habitats, Anangu people 132 hardness 50 heat, effect of 52–3, 198–9 heat energy 43, 44, 52–3 heating particles 52, 53 herbivores 148 heterotrophs 118, 124 high tides 176, 177 hookworms 147 horizontal axis (graphs) 23, 24 hot air balloons 59 hot substances 52, 53
hours 15 household recyclables 76 hovercrafts 96 Hubble Space Telescope 182, 183 human activity, impact on ecosystems 159–61 Humanities (subject), in STEAM projects 241, 245 hydrogen 46 hypothesis 20, 21, 27, 28, 46
ice 42, 43, 200 illegal drugs 73 immigration 150, 151 immune 156 improvements (experiments) 27 inclined planes 104, 221 incompressible 51 independent variable 19, 20, 23, 24 indicator species 157 inferences 12, 192 infographics 107 infrared radiation 182 insects 127 insolubility 64 intellectual property 39 internal skeleton 126 interviews, conducting 165 introduced species 154–6, 159 invertebrates 126–7, 149, 230, 233 iron filings 90 irrigation 164, 165
keys (in biology) 120–1, 131 kilograms 14, 15 kilometres 14, 15 Kimberley Toad Busters 31 kinetic energy 48, 52–3 kinetic theory of matter 48–9 Kingdom Animalia 122, 123, 124 Kingdom Archaea 123 Kingdom Fungi 123, 125 Kingdom Monera 123, 125 Kingdom Plantae 123, 124–5 Kingdom Protista 123, 125 kingdoms 122, 123, 124–5
leaf litter 233 leap year 172 leeches 127, 147 length converting between units 15–16 measurements 14, 15 levers 98–9 mechanical advantage 99, 219 types of 100, 109, 218–19 used by First Nations peoples 100–1 lichen 146 lift 106, 223 light energy 124, 143, 148 like poles 88 limited resources (ecosystems) 158 limpets 145 line of best fit 24
Linnaean classification system 116–17, 122, 123 Linnaean taxonomy 122 Linnaeus’s double-name system 122–3 liquid water 42, 43, 196 liquids 42, 43, 44, 194 boiling points for separation 70–1 diffusion 49, 52 heat effects 43, 44, 198–9 as incompressible 51 particles in 47, 48, 51, 52, 53 physical properties 50–1 litres 14, 15 litter 240–1 liverworts 130 living things characteristics 118–19 classification 124–5, 228 lizards 128 load 98, 99, 100, 102–3, 104, 105 loss of organisms (from ecosystems) 157 low tides 176, 177 lubrication and lubricants 97 lunar eclipse 175
laboratories 6 fire in 17 safety rules 9–10, 17, 190 laboratory equipment 6–7, 17–18 laboratory grown meat 168 land clearing 159 land degradation 160 land management by First Nations peoples 162 land managers, use of traditional methods 163 Lantana 145 lead 48, 49
Macquarie Island rabbits 155–6 Maglev trains 89, 96 magnetic domain theory 89 magnetic fields 90–1 magnetic forces 88–91, 214 magnetic poles (Earth) 90, 91 magnetic poles (magnets) 88 magnetic separation 66, 205 magnets 88–9, 89 making a claim 27 mammals 128, 133 marine biologists 5 Mars biosphere 168 Mars mission 183 marsupials 128, 133 mass 48–9, 94, 95, 176 measurements 14, 15, 192 materials 29 materials recovery facility 76–7 Maths (subject), in STEAM projects 241, 245 matter 14, 42 change of state 43–4, 195 No part of this publication may be reproduced, stored in a retrieval system or transmitted in any form or by any means.
chemical properties 44 describing 44
increasing kinetic energy and expansion 52–3 kinetic theory 48–9 particle model 48–51 physical properties 44, 50–1 scientists’ understanding of 46–7 states of matter 42–5, 194, 195 measurements 192 accuracy 16
recording 15 and units 13–14 used in ancient civilisations 13 mechanical advantage 99, 102–3, 104, 105, 219–20
melting point 43, 44, 52, 200 meniscus 14 meteorologists 5 method 26–7, 28 metres 14, 15 metric system 14 metric units of measurement 15 microbiologists 9, 125 milk 63, 69 milligrams 14, 15 millilitres 14, 15 millimetres 14, 15 minutes 15 mistakes 26 mixtures 62–3, 201–2 properties 62 separation 66–77, 205–12 molecules 46 molluscs 127 monocotyledons (monocots) 130 monotremes 128 Moon 94, 174–5, 186 Earth and Sun 172–3 exploration 174, 175, 186 gravity 94, 95, 176–7 lunar eclipse 175 phases 174, 239 reflecting sunlight 174 and tidal movement 176–7 Moon Treaty 183 moonlight 174 mosses 130 movement (living things) 118 movement energy 148 MR N GREWW 118–19 multicellular organisms 124 mushrooms 124, 149 musical instruments 112 mutualism 146 mycologists 125 Myxoma virus 156
nematodes 127 net force 87 new species 117, 134–5, 154–6, 235 newton 85 Newton, Isaac 94 night and day 172–3, 179 non-contact forces 88–95, 214–15 non-living or dead? 119 north magnetic pole 90 North Pole 90 nucleus 124 nutrient flow in ecosystems 142, 149 nutrients 124, 149 nutrition 118
Oobservations 11–12, 192 oil spills 67 omnivores 148 optical telescope 182 orbit 172 order 122 organic matter 149 organisms classification 124–5 counting 152–3 indicator species 157 interdependence 142–3 introduced species 154–6, 159 loss of 157 role in ecosystems 144–7 Outer Space Treaty 183 oxygen 46, 148
Ppalaeontologists 5 paper chromatography 72, 211–12 parachutes 97 parallax error 16 parasitism 146, 147 partial solar eclipse 173 particle energy 48, 52–3 particle model 46–7, 195 explaining matter 48–9 explaining properties of matter 50–1 particles 46, 47 heating effects 52–3, 198–9 peacock spiders 117 Penicillium mould 145 periwinkles 145 permanent magnets 89 pharmacologists 5 phases of the Moon 174, 239 philosophers 4 photosynthesis 148 phylum (phyla) 122 physical properties 44, 50–1
plants 117, 118, 124–5, 132 adaptations 163, 238 classification 120–1, 231 identifying 131 importance of flowers 130 monocots and dicots 10 photosynthesis 148 vascular tissue 130 plastics recycling 77 platyhelminths 127 pollinators and pollination 130, 236 pollution reduction in local waterways (STEAM project) 240–3 population dynamics 151–3, 234 populations 144 abiotic and biotic factors affecting 150, 151, 158–9 balanced 154 carrying capacity 158 dynamic balance 150–1, 154 introduction of new species into 154–6, 235 size of 150–3, 234 poriferans 127 positive charges 92, 93 prawn dissection 229 predator–prey relationship 144–5, 235 predator species 144, 159 prey species 144 primary consumers 142, 148 primary data 135 primary treatment (wastewater) 74 producers 142, 148, 159 properties of mixtures 62 of substances/matter 44, 50–1 protective equipment 11 protists 126 pseudoscience 19 Puli habitat 132, 133 pull force 88, 92, 93, 94–5, 214–15 pulleys 102 mechanical advantage 102–3, 220 types of 102–3 pure substances 62 push force 88, 93, 214–15 Puti habitat 132
quadrats 152, 234 qualitative observations 11 quantitative observations 11
rabbits 155–7 ramps 104 rays 129
Nnaming specimens 134–5 nanotechnologist 5 natural disasters 158–9 natural systems, filtering by 149 neap tides 176, 177 negative charges 92, 93
Pila habitat 132 ping pong ball, horizontal movement 190 placentals 128, 133 planes (aircraft), forces on 106–7 planets 172 plankton 125 plant cells 124
reasonable tests 19 recycling 76, 77 reliable results 20–1 remote sensors 152, 153 repetition of an experiment 20–1, 26 reproduction 118 reptiles 128–9 repulsion force 88, 89
resource management, waste reduction so we don’t exploit resources (STEAM project) 244–7
response to stimuli 118–19 results 6, 28 analysing 27 graphs and tables 22–5 reliable 20–1 rotation (Earth) 172
Ssafety rules (laboratories) 9–10, 17, 190 safety symbols 9 salt dissolved in water 203 salt water 208 saturated solution 65 scalds and burns 17 scales 26 scatter graphs 22, 24–5 science 4–5 impact on space 183 measuring with accuracy 13–16 science communication 54–5, 168, 186 scientific diagrams 7, 8, 191 scientific equipment 6–7 scientific models 54
scientific names 116, 123, 227 scientific papers 54 scientific posters 54 scientific reports 28–9 scientists 4–5
analysing claims and results 26–7 observations and inference 11–12 safety precautions 9–10 specialised equipment use 6–7 understanding of matter 46–7 ways to communicate 54–5 scissors 100 screws 104, 222 sea urchins 127 sea water, purifying water from 209 seasons 158, 178–80, 239 seatbelts 112
second-class levers 100, 219 second-order (secondary) consumers 142, 148 secondary consumers 142, 148 secondary data 135 secondary treatment (wastewater) 74 seconds 14, 15 sediment 62, 201 sedimentation 67, 205 see-saws 99 seeds 130
senses, testing your 12–13 separating mixtures 66–77, 205–12 according to properties 66–7, 205–6 according to size and mass 68–9, 207–8 at materials recovery facilities 76–7 by decanting 66–7 challenge 210
using boiling points of liquids 70–1 using flocculants 67, 206 using magnetic properties 66, 205 using sedimentation and flotation 67, 205
using solubility 72–3, 211–12 wastewater 74–5 sewage 67 sharks 97, 129 sideways ping pong 190 sieving 68 simple machines 98–105, 218–22 simple separation 66 single-pulley system 102 smart suits 108 snails 127 snakes 128, 129 social impacts 159 social media 55 SOFIA telescope 174 soil erosion 160 solar eclipse 173 solar energy 172 solar system 172 solid water 42, 43 solidification 44, 52 solids 42, 43, 44, 194 diffusion 49 heat effects 43, 44, 198 as incompressible 51 particles in 47, 48–9, 51, 52, 53 physical properties 50–1 solstice 178, 179 solubility 64, 72 to separate mixtures 72–3, 211–12 soluble substance 64 solutes 64, 202, 204 solutions 62, 63, 64–5, 201, 202, 203 solvent 64, 65, 70, 72, 203, 204 South Pole 90 space exploration 183 space probes 183 space telescopes 182–3 spear throwers 100–1 species 122, 123 relationship between different 144–7 speed multipliers 109 spiders 127 spores 130 sport ethics in 109 forces in 108–9 spring balances 84, 85 spring tides 176, 177 squid dissection 229 star 172 states of matter 42–5, 194, 195 STEAM projects reducing contaminants in local waterways 241–3 reducing waste so we don’t exploit resources 244–7 streamlining 97 strength 50 substances chemical properties 44l heat effects 198–9 and mixtures 62–3 and particles 47 physical properties 44, 50–1
sugars 148 summer 179 summer solstice 178, 179 Sun 174, 176 Earth and Moon 172–3 and seasons on Earth 178–9, 239 solar eclipse 173 sunlight 124, 143, 148 suspensions 62, 63, 201 sustainability 162 swimming, forces in 108 symbiosis 146
tabular keys 120–1, 126 tagging 152 tapeworms 127 taxonomists 124, 134–5 telescopes 182–3 temperature measurements 14, 15 tennis, forces in 109 tennis racquets 99, 100, 109 tensile strength 50 tertiary consumers 142, 143 tertiary treatment (wastewater) 74–5 theory 46 thermometers 53 third-class levers 100, 109 third-order (tertiary) consumers 142, 143 third person, writing in 28 thread 104 ‘three-domain system’ 123 thrust 106, 224 ticks 146 tides and tidal movement 176–7 tilt (Earth) 179 time measurements 14, 15 tonnes 14, 15 top consumers 148 tortoises 129 total solar eclipse 173 totems 33 turtles 90–1, 129, 162, 163 two-pulley system 102 type specimens 134
ultraviolet radiation 182 unbalanced forces 86, 87 unicellular organisms 124 unique specimens 134 units of measurement 14 unlike poles 88 urban sprawl 160
Van de Graaff generators 92–3 vaporisation 52 variables 19, 20, 23, 39 vascular tissue 130 vertebrates 126, 128–9, 230 vertical axis (graphs) 23, 24 viscosity 50
No part of this publication may be reproduced, stored in a retrieval system or transmitted in any form or by any means.
volume measurements 14, 15, 192 vulcanologists 9
Wwaste reduction so we don’t exploit resources (STEAM project) 244–7 wastes, from living things 119 wastewater treatment process 74–5 water
boiling point 193, 200 change of state 43–4, 195 clean 149 in different states of matter 42, 43, 195 heat energy effects 43, 44 for life 119
melting point 200 physical properties 44 purifying from sea water 209 salt dissolved in 203 as a solvent 65 water erosion 160
water quality and contaminants 240 water use, and modern farming 164–5 water vapour 42, 43, 45 waterways, contaminant reduction (STEAM project) 241–3
Wathaurong people, seasons 178, 179 wedges 104, 221 weight 94–5, 106, 216, 223 wetland ecosystems 149 wheelbarrow 100
wheels and axles 105, 222 wind erosion 159, 160 winter 179 winter solstice 178, 179 woomera 100–1 work 98–9 writing scientific reports 28–9
Yyandying 67 Yanyuwa people, classification of organisms 132 year 172 Yirrganydji calendar 180–1
Zzoologists 124
No part of this publication may be reproduced, stored in a retrieval system or transmitted in any form or by any means.
No part of this publication may be reproduced, stored in a retrieval system or transmitted in any form or by any means.
No part of this publication may be reproduced, stored in a retrieval system or transmitted in any form or by any means.
No part of this publication may be reproduced, stored in a retrieval system or transmitted in any form or by any means.
No part of this publication may be reproduced, stored in a retrieval system or transmitted in any form or by any means.
No part of this publication may be reproduced, stored in a retrieval system or transmitted in any form or by any means.
No part of this publication may be reproduced, stored in a retrieval system or transmitted in any form or by any means.
Northern Territory
Adam Jovanou
State Sales Manager WA | SA | NT
E: adam.jovanou@oup.com
M: 0437 997 146
Western Australia
Adam Jovanou
State Sales Manager WA | SA | NT
E: adam.jovanou@oup.com
M: 0437 997 146
South Australia
Renee Kennedy
Secondary Education Consultant
E: renee.kennedy@oup.com
M: 0418 857 546
Victoria
John Purnell
State Sales Manager VIC E: john.purnell@oup.com M: 0403 043 584
Alicia Giaquinta
Secondary Education Consultant
E: alicia.giaquinta@oup.com M: 0411 759 611
David Griffiths
Secondary Education Consultant
E: david.griffiths@oup.com M: 0427 225 891
Caitlin Hansford
Secondary Education Consultant
E: caitlin.hansford@oup.com M: 0411 759 659
Paul McCallum
Secondary Education Consultant
E: paul.mccallum@oup.com M: 0423 241 455
Tasmania
David Griffiths
Secondary Education Consultant
E: david.griffiths@oup.com
M: 0427 225 891
Our Privacy Policy sets out how Oxford University Press handles your personal information, and your rights to object to your personal information being used for marketing to you or being processed as part of our business activities.
oup.com.au @OxfordAustralia facebook.com/oupanz linkedin.com/showcase/oxforduniversity-press-australia-new-zealand
Queensland
John Figliano
State Sales Manager QLD
E: john.figliano@oup.com
M: 0499 114 429
Chris Lowcock
Secondary Education Consultant
E: christopher.lowcock@oup.com
M: 0428 949 935
Melissa Wearne
Secondary Education Consultant
E: melissa.wearne@oup.com
M: 0447 557 931
New South Wales
Catherine Stephenson
State Sales Manager NSW | ACT
E: catherine.stephenson@oup.com M: 0404 021 237
Sue Dowd
Secondary Education Consultant
E: sue.dowd@oup.com M: 0411 759 608
Caly James
Secondary Sales Manager NSW | ACT
E: caly.james@oup.com M: 0413 745 855
Australian Capital Territory
Caly James
Secondary Sales Manager NSW | ACT
E: caly.james@oup.com
M: 0413 745 855