DRAFTONLY-NOTFORSALE

No part of this publication may be reproduced, stored in a retrieval system or transmitted in any form or by any means.

No part of this publication may be reproduced, stored in a retrieval system or transmitted in any form or by any means.
No part of this publication may be reproduced, stored in a retrieval system or transmitted in any form or by any means.

Geography is the study of the places that make up the world around us. Geographers are interested in how human activities and natural processes change the Earth’s places, and in the links between these places. More than ever before, geographers help other people understand how change affects people and places, and how this change can be managed.
Geographers have a sense of wonder and curiosity about the world, and this leads them to ask questions about what they see and experience.
Geographers use a range of key concepts and skills to answer such questions. Each of these concepts and skills is a tool that you can use to better understand your world. As you master each of these concepts and skills you will gradually fill your toolkit with a range of useful geographical tools. These will help you better understand this amazing planet.
Concepts and skills

1A
What are the geographical concepts?
1B
What are the geographical skills?
Geographers use seven key concepts to help investigate and understand the world. These concepts provide a framework to thinking geographically and will help guide you through every geographical inquiry. At times you will use several of these concepts at once, while at other times you may focus on just one.
The seven key concepts in geography are: •place •space •environment •interconnection •sustainability •scale •change.
A place is a part of the Earth’s surface that is identified and given meaning by people. Places can be very large, like a whole continent; or they can be small, like a corner of a library. Places can be natural (that is, shaped by the environment and largely unchanged by humans), or built (that is, constructed by humans). Each place is unique, with its own set of characteristics.
Places determine our relationships with one another. Our closest relationships are likely to be with people in places that are physically close. In addition, the environmental and social qualities of a place all influence the way we live. Climate, landscapes, types of
plants and resources, transport networks, entertainment venues and workplaces all have a major impact on our daily lives.
Geographers use the concept of place when conducting any geographical inquiry. For example, a geographer visiting Namche Bazaar at the base of Mount Everest would use the concept of place to help understand why people choose to live in this challenging environment and how they overcome these challenges. They would also investigate the ways people have altered this environment, and assess the environmental and social impacts of these changes.

Source 1 A geographer visiting Kosciuszko National Park would be interested in the forces that have shaped these mountains. They would look for clues and begin to ask questions, such as ‘Why are the highest mountain peaks in a line?’ and ‘Why is there snow at the top of the mountain?’
1A What are the geographical
Geographers use the key concept of space when investigating the way that things are arranged on the Earth’s surface. They also investigate the ways people use and change the spaces in which they live. Geographers look for patterns in the way features and structures are arranged, and the concept of space helps them to do this. It has three main elements:
• location – where things are located on the Earth’s surface
• spatial distribution – the shapes and patterns in which things are arranged on the Earth’s surface
• organisation – how and why things are arranged and managed on the Earth’s surface by people.
Understanding the location, patterns and planning
of spaces helps geographers to make sense of our world. Geographers also investigate the ways that people use and change the space in which they live. They recognise that different groups of people use space in different ways and that this changes over time. By examining, researching and describing how spaces are used, geographers can further our understanding of the world and help manage it into the future.
It is easy to confuse the concepts of place and space. It may help you to remember that places can be divided and organised into spaces. Spaces also are assigned different purposes. For example, a place like your school is organised into different spaces, each with its own purpose (for learning, for sports, for eating).

Source 2 Geographers might look at this photo of Manhattan, New York, and ask the following questions to investigate the space:
• How big is the park located at the centre of the city?
• How many buildings are distributed per square metre?
• Are the tall buildings in the city organised by residential or business use?
The key concept of environment relates to the living and non-living elements that make up an area, and the ways they are organised into a system. The world in which we live is made up of many different environments. Some of these – such as deserts, mountains, coral reefs and ice caps – are natural. For an environment to be considered natural, its soils, rocks, climate, plants and animals must remain largely untouched by humans. Natural processes such as tectonic plate movement, erosion and weathering have formed these environments over millions of years.
By contrast, built (or human) environments include large cities, towns, suburbs and areas of farmland. These environments have been so changed by humans – largely for settlement and economic activity – that very few natural features remain.
Geographers are interested in investigating and describing the relationships between people and the environment, including:
• the ways in which different groups of people perceive and use the natural environment and why these perceptions differ
• the ways in which people change the environment and how these changes can be managed
• the impact of environmental hazards on people and how the impacts of these hazards can be reduced.
All environments and every living and non-living thing are connected. These connections can be on a local level, a national level or a global level. Geographers use this concept of interconnection to better understand the links between places and people, and how these links affect the environment and the way we live. Some examples of interconnection include:
• the water cycle – this cycle links the water in the oceans with the land. When it brings rain to inland areas, water flows across the land and into rivers and streams. Farmers rely on this natural link to provide the water they need to grow food.

The study of different environments helps geographers analyse the changes that humans make to natural environments and understand their impact, so that they can be managed more wisely.

• the internet – with online access available through our mobile phones, tablets, computers and televisions, we are connected to different people all over the world through the content we consume online.
• the global marketplace – being consumers in a global marketplace means we are connected to many places via international trade. More than
The concept of sustainability relates to the ongoing capacity of the Earth to maintain all life. This means developing ways to ensure that the Earth’s resources be used and managed responsibly, so they can be maintained for future generations.
Sustainability encourages us to think more carefully about these different types of resources, including the ways in which they are formed and the speed at which they are being used. Non-renewable resources (such as oil, coal and natural gas) will one day run out if we continue to use them. Other resources (such as wind, forests, solar and water) are renewable. This means that they replace themselves naturally, or can be replaced to meet the needs of society.
1A What are the geographical concepts?
3000 ships carrying 2 million containers pass through the Port of Melbourne (see Source 4) each year. These ships and the goods they carry link dozens of countries around the world.
Sustainable patterns of living meet the needs of the current generations without compromising the ability of future generations to meet their own needs. They also encourage us to look more closely at renewable options and take greater care of the Earth. Actions to improve sustainability can operate at the local, national or international scale.
Geographers use the concept of sustainability to investigate how natural and human systems work, and to understand how resources can be managed in such a way that they will be sustained into the future.

climate change a change in global or regional climate patterns; in particular, a change apparent from the mid to late twentieth century onwards and attributed largely to the increased levels of atmospheric carbon dioxide produced by the use of fossil fuels
Geographers study things that take place on many different spatial levels – from small areas (such as a local park) to very large areas (such as the use of oil and gas all over the world). They use the concept of scale to look for explanations and outcomes at different levels. For example, a geographical inquiry on climate change may be carried out at a range of scales (from smallest to largest):
• local – such as an inquiry into increased electricity use for air conditioning in your neighbourhood due to higher-than-average temperatures. Increased energy consumption may result in power outages.
• regional – such as an inquiry into coral bleaching on the Great Barrier Reef. Warming ocean temperatures can trigger coral bleaching, often resulting in coral death.
• national – such as an inquiry into changing weather patterns and increased frequency of extreme weather events in Australia, such as bushfires. These affect government allocation of resources, including in relation to water security, agriculture and emergency services.
• international – such as an inquiry into drought in Africa. Rains have become less reliable in many places as the climate has changed and many African nations have been hit by a series of devastating droughts that have brought widespread hunger and starvation.
• global – such as an inquiry into the reduction in Arctic sea ice due to global warming. This reduction in white ice means that less of the sun’s energy is reflected back into space and more is absorbed into the Earth, resulting in further increases in temperatures globally.


Source 6 Geographical inquiries can be carried out on a number of different scale
1A What are the geographical concepts?
The concept of change helps us to understand what is happening around us and to see the world as a dynamic place. Change in both time and space allows geographers to examine how environments develop, transform or disappear.
Change can be the result of natural forces (for example, climate, earthquakes or volcanoes) or the result of human activity (for example, the building of a new bridge or the clearing of forest for farmland). Some changes can be positive (such as the regeneration of vegetation), while other changes can have negative consequences (such as the pollution of waterways from industry).
Changes take place on different scales, from local through to global. Local changes that happen quickly, such as storm damage in your street, are easy to observe and explain. Regional or national changes resulting from a bushfire or an earthquake can also happen quickly and their effects can be widespread, with devastating impacts on places and people. Changes that take place on a global scale can take much longer. Global warming, for example, is a long-term change that happens slowly. It has widespread and long-term effects that are not easily explained.
Observing and understanding natural or human-made changes is an important part of any geographical inquiry. Geographers need to look at different types of changes, why they have occurred, over what time period they have occurred, and what further changes may take place as a result. Geographers also play an important role in ensuring that change is managed sustainably.


Check your learning Log onto your obook pro to complete the questions for topic 1.1.
Source 7 In preparation for the 2012 Olympic Games, Newham in East London was transformed from a suburb of derelict buildings and polluted rivers (top) into a vast sporting complex (bottom). The project adopted the London 2012: Zero Waste Games Vision, which aimed to make the games truly sustainable. For example, the velodrome shown on the right-hand side of the bottom photograph was built using 100 per cent sustainably sourced timber.
geographical inquiry a process that geographers use to guide their investigations, beginning with asking questions and using geographical skills
Geographers are investigators. They explore the world around them by asking questions about what they see. These questions begin an investigation that requires them to collect and analyse information, and to communicate what they have discovered. To complete an investigation they need a set of skills such as drawing maps and cross-sections, surveying, sketching and presenting information. Seven categories of skills are used to complete a full geographical investigation, known as a geographical inquiry. These are listed in Source 1.
To become a better geographer you need to learn new skills as you continue to practise, use and develop the skills you have already learnt. It might help you to think of each of these skills as individual tools in your toolkit. For some geographical inquiries, you may only need to use one tool; for others, you may need to use many. As you develop each new skill you will have gained another important tool in explaining the natural processes and human activities that shape our amazing planet.
1 The seven categories of skills used in a geographical inquiry
Asking questions and conducting research
Conducting fieldwork
Interpreting geographical images
Analysing maps
Identifying patterns and relationships
• Develop geographically significant questions and plan an inquiry that identifies and applies appropriate geographical methodologies and concepts.
• Conduct fieldwork, map and interpret data and spatial distributions, and use spatial technologies.
• Evaluate multi-variable data and other geographical information using qualitative and quantitative methods, and digital and spatial technologies as appropriate, to make generalisations and inferences, propose explanations for patterns, trends, relationships and anomalies, and predict outcomes.
• Apply geographical concepts to synthesise information from various sources and draw conclusions based on the analysis of data and information, taking into account alternative points of view.
• Identify how geographical information systems (GIS) might be used to analyse geographical data and make predictions.
Collecting and representing data
Communicating and reflecting
• Collect, select, record and organise relevant geographical data and information, using ethical protocols, from a range of appropriate primary and secondary sources.
• Evaluate sources for their reliability, bias and usefulness, and represent multi-variable data in a range of appropriate forms, for example, scatter plots, tables, field sketches and annotated diagrams, with and without the use of digital and spatial technologies.
• Represent the spatial distribution of geographical phenomena by constructing special-purpose maps that conform to cartographic conventions, using spatial technologies as appropriate.
• Present findings, arguments and explanations in a range of appropriate communication forms, selected for their effectiveness and to suit audience and purpose, using relevant geographical terminology, and digital technologies as appropriate.
• Reflect on and evaluate the findings of the inquiry to propose individual and collective action in response to a contemporary geographical challenge, taking account of environmental, economic and social considerations, and explain the predicted outcomes and consequences of their proposal.
Geographers look at people, land, air, water, plants and animals, and the connections between them to understand what is happening. They also seek to investigate where, why and how natural, managed and constructed environments are formed and changed. These observations often include identifying any problems or issues that need to be investigated and resolved.
Geographers look at the world around them and ask questions about what they see, experience or have thought about. You may, for example, see a news item about a volcanic eruption. Or you may visit the centre of a large city on a field trip, or a national park on holiday. As you begin to think like a geographer, you will begin to ask questions about these events and places, and these questions may be the starting point for a geographical inquiry.
Asking questions & conducting research
You can learn to develop geographical questions that will help you begin an inquiry about a particular topic or place. Start your questions with the words ‘what’, ‘where’, ‘how’, ‘why’, ‘what impact’ or ‘what should’. Your questions should examine ideas such as:
• Where is it?
• How big is it?
• How does it interact with other things in this place?
• How is it changing? How should people best manage this change?
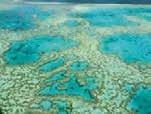
The very best geographical questions open up an exciting area for you to explore. For example, examine Source 2 on the next page. A visitor to the Great Barrier Reef might ask a simple question, such as: ‘What is the total area of the reef?’ This is a question with a relatively straightforward answer. A better geographical question
would be to ask: ‘How has the total area of the reef changed over time?’ This question opens up a whole new area to explore, because the answer to that question will lead on to further questions and greater depth of understanding. Some other sample questions are:
• Why are some patches of the sea dark green and others light green?
• How does marine life use the reef?
• Where is the reef located and how does this impact it?
1 Explain why ‘How has the total area of the reef changed over time?’ a better geographical question than ‘What is the total area of the reef?’
2 Examine Source 3 on page 8, which shows tourists on the Galapagos Islands. Work with a partner to develop a set of geographical questions about this place. Where could you begin to find the answers to your questions?

Source 2 Asking questions is an important skill for geographers. This geographer is examining the Great Barrier Reef from above in a helicopter.
Asking geographical questions is a good way to develop a range of possibilities for further research and investigation. It is usually best to narrow your investigation by selecting one question. You should select a question in which you are interested and that helps you to better understand the environment you are investigating.
Let us assume you have chosen to investigate the key geographical question: ‘How is the Great Barrier Reef impacted by the climate?’ Consider what information you need to answer this question and where you are going to locate this information. A good way to do this is to use a planning table, like the one in Source 3.
Source 3 Planning is a key stage in conducting a geographical inquiry.
Key inquiry question: How is the Great Barrier Reef impacted by the climate?
Information needed
Climate data, particularly temperature and rainfall for places at various distances from the Great Barrier Reef
Check your learning Log onto your obook pro to complete the questions for topic 1.3.
Observation of photographs and satellite images of the region
An understanding of the impact of landforms on temperature and rainfall
Possible sources of this information
• Atlas map to locate towns and cities at various distances from the Great Barrier Reef
• Encyclopaedia entry for the climate of Queensland
• Online search for climate data for selected towns and cities
• Photographs and satellite images of the Great Barrier Reef from this chapter
• Satellite images from Google Earth, including historic imagery
• Printed resources such as geography textbooks, encyclopaedias and Bureau of Meteorology (BOM) books and leaflets
• BOM website
Source 4 You never know where fieldwork will take you!
For geographers, the field is an essential primary source of data. Books, websites and maps can give you some information about a particular place, but they are usually secondary sources of information. To really understand a landscape or issue, you need to go and see it for yourself.
The aim of all fieldwork is to enable you to develop the skills of observation, information gathering, analysis and interpretation of different forms of data, and communication of your results. The types of fieldwork you conduct will differ according to your chosen topic and the fieldwork site. You will be:
• identifying different types of environments and the features within them
•recording data from different sources
•sampling things such as water quality or wind speed
•comparing different features to see if there is a pattern
•calculating amounts, such as water flow, numbers of different species of plants and animals, or visitor numbers
•communicating your findings.
Check your learning Log onto your obook pro to complete the questions for topic 1.4.
Fieldwork can take place in many locations and for a wide variety of purposes. Rivers and coasts are popular fieldwork locations because the constant movement of water in these places changes the natural environment. Shopping centres, parks and city streets are also popular because the constant movement of people creates patterns, flows and changes.
Source 5 provides some examples of fieldwork locations, as well as inquiry questions that can be the beginning of an investigation there.
Source 5 Examples of fieldwork locations and inquiry questions for different units of study in Year 10 geography Unit of study Fieldwork locationInquiry questions
Environmental change and management River or stream• What natural processes are shaping this riverine or coastal environment?
• How do these natural processes impact on human activities?
• What human activities have changed the natural processes and environment in this place?
• How have these environmental changes been managed?
• How effective has this management been?
• What further management strategies could be used to better manage change in this place? Coast
Geographies of human wellbeing Two contrasting suburbs
Program to improve wellbeing
• What are living conditions like in these two suburbs?
• What are the similarities and differences?
• How can these differences be mapped?
• Why do these differences occur?
• How can wellbeing be improved in these suburbs?
• What are the aims of this program?
• Why does it exist?
• How successful is it in reducing inequalities in wellbeing?
• How could it become more successful?
• How could it be applied in other regions and places?
Check your learning Log onto your obook pro to complete the questions for topic 1.5.
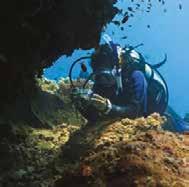
Geographical images are taken to depict and present a place or particular feature of the landscape for the purpose of demonstrating an aspect that is being studied. This is quite different from taking photos of you and your friends for fun, or even from taking an attractive picture of a landscape. Whether you take a geographical image during a fieldwork study, or collect them from researching online, you need to develop the skill of interpreting them.
Landscapes can be photographed from several different angles, depending on the position of the camera at the time the photograph was taken. Each angle makes some features of the landscape easier to see and interpret than other features, so you need to carefully consider the angle at which the photograph has been taken (see Source 6).
The camera is held by someone at the same level as the landscape being photographed. This angle allows you to clearly see the height of any object and the detail in vertical surfaces. However, objects in the picture can hide the landscape behind them. Ground level is not the most effective method when investigating something like the Great Barrier Reef, as it is underwater.
The camera is positioned above the landscape and angled towards the scene being photographed. This angle allows you to see both the foreground and the background of the scene. You can also see both the height of an object and its width or area. However, objects in the background seem much smaller than those in the foreground.
The camera is positioned directly above the landscape. This vertical (or plan) view allows you to see the extent of any feature. However, it is difficult to judge the height of a landscape. In this image, for example, it is difficult to judge the depth of the water.
Source 6 Different types of geographical images


1B What are the geographical skills?
A satellite image is taken from space. It allows us to see large areas of the Earth’s surface. These images are often used to investigate patterns, such as the shape of the reef, its position relative to land, and the distribution of small reef shapes. It is difficult, however, to see smaller features of the environment.

You may have heard the terms ‘ image’ or ‘false colour map’ before. The term ‘false colour’ does not mean the colours used are incorrect; rather, it means that different colours have been used to make the image or map easier to interpret.
The colours used in a false colour image can look quite unnatural (see Source 8). This is because the colours of the natural features are too similar to demonstrate a particular point or aspect. If, for example, you are trying to show where a muddy brown river meets a brown-coloured riverbank – which has brown rocks and some brownish shrubs – you might decide to use false colour to clearly show where the different elements are. You may make the shrub areas bright green, the river neon yellow and the rocks bright red, leaving just the riverbank brown.
satellite image an image of a place taken from satellites orbiting above the Earth’s surface
false colour image an image that depicts an object or area in colours that differ from those seen in nature; false colour images use colours that are different or more exaggerated than those shown in standard photographs, in order to make the thing being shown easier to interpret

If you are looking at a false colour map, you should examine the accompanying legend to interpret the colours used.

map
a simplified plan of an area shown from directly above plan view
a way of showing something as if the viewer is looking down on it from above; a bird’s-eye view
One of the most useful tools that geographers use to process information is a map. Maps are drawn in the plan view because this ensures the scale will be the same across the entire area. If maps were drawn from an angle, some parts of the mapped area would look distorted and so it would not be an accurate representation of the area. When properly used, maps can reveal a great deal about our planet and the ways in which we use it.
A piece of paper only shows two dimensions: width and length. The Earth’s surface, however, has a third dimension: height. Cartographers (map makers) use a variety of methods to show this third dimension, including topographic maps, cross-sections and digital maps.
There are a range of different maps and graphic representations you will analyse and create throughout the study of geography. A short explanation of some complex maps and graphic representations is provided in this topic.
topographic map
a type of map that shows the shape of the land, its relief and landforms
contour lines
lines drawn on a map that connect points of the same height to show the height and steepness of land
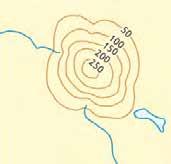
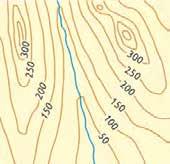
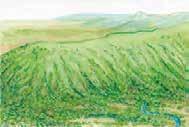
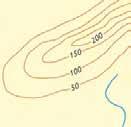
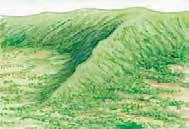
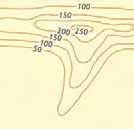
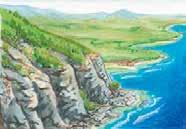
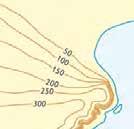
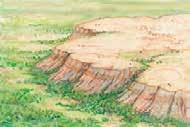
Topographic maps are one of a geographer’s most useful tools. They show the shape of the land (such as the shapes formed by hills, valleys and ridges) through the use of contour lines, which join together all places of an equal height above sea level. By learning to interpret
Source 9 Common contour patterns R o UND hill o R V ol C a N o


the contour patterns made by these lines, you can work out the shape and height of the land that has been mapped (see Source 9). Also, because most topographic maps are drawn of a small region, they can show that region in great detail – right down to individual buildings and rocks.

1B What are the geographical skills?
Unlike a map, which shows a landscape in plan view, a cross-section provides a profile (side) view of a landscape. This allows geographers to see the relief of the land from side-on. Interpreting cross-sections can help further our understanding of how
the relief of the land influences the way in which it is used (for example, where people choose to live or where food is grown). Cross-sections are made using contour lines. (see the key skill box on the next page).

Source 10 This cross-section of Antarctica helps geographers understand the size of the ice sheets and the size of the bedrock underneath them, and also to see the different areas where ice is thinning.
relief the variations in elevation (height) of areas on the Earth’s surface
Collecting & representing data

Key skill worksheet
Collecting & representing data: Drawing a crosssection using contour lines
To create a cross-section from a topographic map, follow these steps:
Step 1 Identify the cross-section by finding two points on the map to form the outer edges.
Step 2 Line up the straight edge of a plain piece of paper across the map so that it covers the two points you identified in step 1. Mark these two points as A and B.
Step 3 Make small marks on your paper where each contour line meets it and write the height of the contour.
Step 4 On another piece of paper, draw a set of axes for your cross-section. The
horizontal axis should be the same width as the distance between points A and B on the map. The vertical scale should begin below the lowest point on your cross-section and extend above the highest point.
Step 5 Lie the edge of your first piece of paper along the newly created horizontal axis. For each contour height shown, add a dot onto your cross-section at the correct height according to the vertical scale. Join these dots in a smooth line.
Step 6 Lightly shade the area below the line to show that it is solid land. Label both axes and give your cross-section a title.
To practise this skill, log onto your obook pro and complete the key skill worksheet: Drawing a cross-section using contour lines.
1B What are the geographical skills?


Source 11 Creating a cross-section from a topographic map of Hawaii
There are about 6000 human-made satellites orbiting the Earth. Many of these collect digital data about the shape and height of the land and transmit it back to computers on the ground. This data

cartogram
a type of map that is distorted to show a representation of statistical data (e.g. access to water, rates of obesity, etc.), rather than land area
Cartographers can use computer programs to add colours to these digital maps, to highlight certain aspects of the environment. In Source 12, for example, the land has been shaded according to its height. The data can also be manipulated in other ways. In Source 13 it has been used to create a side view of the landform being mapped. This type of illustration is known levation model (DEM).
Source 12 In this digital map of the Mount Kilimanjaro region, land has been shaded according to its height above sea level. Shadows have also been added to help map users understand the shape and height of the land.

You will have already seen cartograms in the course of your geography studies. These maps look distorted and have areas that appear thinner or more enlarged than they would normally be, depending on what they are showing. Cartograms are sometimes called ‘value by area’ maps, which means the spaces on the maps are altered to show a representation of a value rather than land area.
There are various software programs available that can generate cartograms.

Source 14 This cartogram shows the Earth’s fresh water resources. The distortion shows that South America has large supplies of fresh water, while Africa has very little.
An important skill that you need to develop in the study of geography is that of identifying patterns and relationships in data. Geographers look for order, diversity, trends, patterns, anomalies and relationships in their information. It often helps to classify information by sorting it into groups.
There are a number of methods and models that geographers use to help identify trends, patterns and relationships in data. These include:
•the SHEEPT method
•the PQE method.
The SHEEPT method
SHEEPT is a tool used by geographers to help them consider six factors that may contribute to the patterns identified in their data (see Source 15). When you are examining issues related to your inquiry, it is useful to think about them in terms of these factors and rank them in order of importance. This will help you reach your conclusions.
Social – factors relating to culture and people
Historical – factors relating to past events
Environmental – factors relating to the natural environment (including climate, landforms and vegetation)
Economic – factors relating to the earning or spending of money (including income earned from industry and tourism and the cost of building a dam or highway)
Political – factors relating to governments (including laws, regulations and policies)
Technological – factors relating to the availability and use of different types of technology (including the development of greener technologies, alternative energy sources and GIS)
Source 15 The SHEEPT method


Source
PQE is a tool used by geographers to describe the data they have gathered (particularly on maps) and to look for patterns in this data. The letters ‘PQE’ stand for ‘pattern’, ‘quantify’ and ‘exceptions’.
Source 17 on the next page is a sample of writing that uses the PQE method to describe the distribution of climate zones in Australia (as shown below in Source 16). Read the highlighted sections closely. These are sentence starters that can be used to structure your response whenever you are using the PQE method.
Source: Oxford University Press

If you can identify the type of map that you are looking at, make sure you name it.
1B What are the geographical skills?
The uneven pattern of this choropleth map shows that Australia is dominated by a dry climate in the central area, with desert and semi-desert climate zones.
The evidence that quanti es this pattern is the far-reaching location of semi-desert and desert climate zones, which spans most of the central continent and impacts on Western Australia, the Northern Territory, South Australia, Queensland, New South Wales and northern Victoria. In other words, this pattern impacts on every state and territory in Australia except Tasmania and the Australian Capital Territory.
The exception to this pattern is the diverse climate zones around Australia’s coast. For example, the south-eastern areas of Tasmania, Victoria and New South Wales experience maritime climates, whereas parts of the Western Australian coast experience a Mediterranean climate. Far-north Western Australia and Northern Territory are different again, with tropical wet and dry climates. Queensland, where the Great Barrier Reef is located, experiences its own range of climates in just one state.
Source 17 PQE example
Pattern – in this step, you need to give a general overview of any patterns you may identify.
Quantify – in this step, you need to add specific and accurate information to define and explain the patterns.
Exception – in this step, you need to identify anything that does not fit your patterns.
Primary and secondary data provide either qualitative data or quantitative data (see Source 18).
Good geographical inquiries will always be based on a combination of primary and secondary data that is both quantitative and qualitative. Even though qualitative data is an important part of any geographical inquiry, quantitative data is considered to be more valuable because it is less open to personal interpretations and can be more accurately represented in graphs and charts.
Source 18
The PQE method uses mainly qualitative data.
Examples of qualitative data
• climate and temperature statistics
• tourist numbers
• population figures
• types and amounts of food grown
• forest clearance rates
• numbers of people killed in natural disasters
The SHEEPT method uses mainly quantitative data.
Examples of quantitative data
• opinions
• points of view
• personal stories
• likes and dislikes
• feelings
qualitative data information that focuses on quality rather than quantity; as such, it is usually someone’s opinion and may differ from person to person
quantitative data any information that can be recorded as numbers (e.g. ‘the literacy rate is India is 74 per cent’)

Check your learning Log onto your obook pro to complete the questions for topic 1.7.
primary data data for a geographical inquiry that was collected in the field by the geographer conducting the inquiry (e.g. survey data, hand-drawn maps or photographs)
secondary data data used for a geographical inquiry that was not collected by the geographer conducting the inquiry (e.g. textbooks, atlases or websites)
Geographers find answers to their questions in many places. They may collect information themselves by interviewing people, taking photographs, making sketches out in the field, or conducting surveys and questionnaires. This kind of information will generally only be relevant to a particular inquiry and is called primary data
Often, a geographer collects information that supports their inquiry but has not been specifically collected or designed by the geographer for that inquiry. This type of information is called secondary data. Secondary data sources include maps, graphs, statistics and websites that someone else has developed. Some of the best secondary sources of information may be photographs from newspapers and magazines, or satellite images from Google Earth.
Regardless of whether you are using primary or secondary data, your investigation or inquiry into any geographical topic should follow these steps:
1 Collect and record the information you think you will need to answer your key inquiry question.
2 Evaluate this information and data to determine that they are accurate and relevant.
3 Represent your findings in an interesting and appropriate way, such as tables, graphs, maps and sketches (see page 18 for more information on these).
Geographers need to evaluate the sources they use for reliability and potential bias, as well as usefulness.
In the case of collecting data from primary sources – such as interviewing subjects directly on a topic – the information gathered will be reliable because it is gathered firsthand; but the geographer should keep in mind any potential bias that may be influencing an interview subject’s response. An interview that a geographer is conducting on the potential effects of turning local parkland into an industrial park, for instance, would have very different responses from a representative of the industrial developer than from a member of a local wildlife conservation group. It is important for a geographer to evaluate this kind of bias, and remember to ask questions about the motivation behind it.
It is important to evaluate any secondary data for reliability, as well as bias. This is particularly true for information obtained through the internet. Unlike a printed source, such as a book or atlas, it can be very difficult to establish who has written and published information online. Ask yourself:
• Is the secondary data from a recognised source; for example, a government body, such as the Bureau of Meteorology, or a research agency, such as CSIRO?
• Is the data provided without bias? Or is it presented on a website for a company that might have a vested interest in influencing public opinion?
Before you move to the next stage of your inquiry, it is important to check that you have recorded all your data without errors, and that it is balanced, fair and does not reflect your personal opinions.
1B What are the geographical skills?
There is an enormous amount of material available online, but it is important to keep in mind that not all websites provide reliable information. You must be careful to not automatically accept that all information published online is from a reliable source. Websites should be critically evaluated for reliability by following these steps:
Step 1 Find out how old the information is. When was it first published? This will help you decide whether it is useful for your inquiry or not.
Step 2 Find out who published the information. Is it possible they have a bias? You can often find out more about the organisation publishing information by going to their ‘home page’ or reading the ‘about us’ section.
Step 3 Look at the domain suffix at the end of the URL, as this will give you an important clue about the origin of the information. For example:
• ‘.com’ is used by commercial organisations, such as online stores
• ‘.org’ is used by non-commercial organisations, such as nongovernment organisations and welfare groups
• ‘.gov’ is used by government departments
• ‘.edu’ is used by schools and universities
• ‘.net’ is used by commercial organisations
• ‘.mil’ is used by military groups.
Step 4 If you cannot find out when the information was published or who published it, it is probably too unreliable to use in a geographical inquiry. Look for a more reliable source of information.
1 Common websites used for reference information include the CIA World Factbook, the Australian Bureau of Statistics, National Geographic and the United Nations Development Programme. Using the steps listed above, assess the reliability of the data found on these websites.


When conducting research and obtaining data for an inquiry, it is important for a geographer to be mindful of issues that are likely to raise ethical concerns. This may include being aware of privacy concerns, ensuring anonymity if required, and obtaining informed consent from research participants. Geographers may also need to outline where and how the information obtained will be used or published; and to give special attention to relational data, where geographical references or coordinates might disclose a participant’s location or identity. If a geographer undertakes an inquiry that involves consulting with Aboriginal and Torres Strait Islander communities, they should be aware that there are guidelines and protocols that should be followed. While these are not necessarily rules, it is important to know that Aboriginal and Torres Strait Islander peoples have distinctive regional and cultural identities that require respectful consideration for meaningful consultation. This may involve preferred terminology, cues for cultural communication, and other means for making consultation harmonious and productive. If you are conducting such an inquiry, it is advisable to read some relevant material first, such as the Aboriginal and Torres Strait Islander Peoples Engagement Toolkit, which you can find via your obook pro.
In Years 7 and 8 you will have learnt how to create and interpret simple graphs, such as line graphs, bar graphs, column graphs and pie charts. In Years 9 and 10 you will be working with more complex graphs. Sometimes you will create such graphs yourself, and sometimes you will interpret them to make sense of the information they provide. Regardless, understanding how information is represented in graphs is an important skill to add to your toolkit. Some of these styles of complex graphs are described below.

climate graph
a combination bar and line graph that shows the rainfall and temperature of a given place; also known as a climograph
Climate graphs show the general climate of a place – what the weather is like overall in a certain location – graphing the average monthly temperature and rainfall over the course of year or other set period of time (see Source 20). Climate graphs combine line and column graphs. Temperature is recorded as a line graph and rainfall is recorded as a bar graph.
Source 20 A climate graph showing the average monthly temperature and rainfall in Perth
A compound column graph, sometimes called a stacked column graph or stacked bar graph, is used by geographers to compare parts of something to the whole. They are a more complex type of column graph in which each column is split into sections. The results are then stacked on top of each other, in different colours or different shades of a colour, so that they can be easily compared (see Source 21).
Each column in a compound column graph represents a total, and each different-coloured segment represents a part that makes up that total. The graph in Source 21, for example, shows the total increase in world population – from 1950, projected up to 2050. Of the total increase in population, it is immediately clear that Asia, coloured green, has experienced and will continue to experience the greatest growth. It is also immediately clear that Oceania, coloured dark pink, has experienced very small population growth in comparison. Presenting the information in this way means we can quickly see and compare a number of figures that contribute to a total.
Population pyramids are horizontal bar graphs that show the proportion of males and females in different age groups in a population. Most commonly, they are used to compare the population structures and growth rates of different countries. A pyramid-shaped graph shows a population with a high birth rate – that is, the population in that country is growing –while a graph that tapers off (is narrower) at the younger ages indicates a population that is contracting or declining (see Source 22).
Population pyramids can also help geographers to identify the ways in which the population in a single country is changing over time.
Source 22 Population
Source 21 A compound column graph showing the increase in world population by region, from 1950, projected up to 2050
compound column graph a type of column graph that features two or more sets of related data at the same time so that they can be compared; information provided in each column is subdivided for further comparison
population pyramid a type of graph that displays the percentage of males and females in a region or population grouped by age
Maps can be useful for showing a pattern, but they do not really explain that pattern. A special type of graph, called a scatterplot is a better way of doing this. A scatterplot compares two sets of data in a visual way so that connections between them can be easily seen.
The scatterplot in Source 23 compares the amount of original rainforest remaining in selected Asia–Pacific countries with their population growth rates. It is essentially testing the theory that rainforests are less endangered in countries where the population is growing rapidly.
Source 23 A scatterplot comparing the amount of original rainforest remaining in selected Asia–Pacific countries with their population growth rates
In this graph, because most of the countries lie close to the trend line, it is possible to say that there is a relationship between the amount of rainforest in a country and the rate at which its population is growing. Countries with the fastest growing populations have the most rainforest remaining. Those countries that lie apart from the general trend, such as Bangladesh, are called outliers. A geographer studying this graph might use it as the beginning of a geographical inquiry into deforestation in Bangladesh.
scatterplot
a type of graph that uses two sets of data by plotting points along two axes, the pattern of which shows their correlation; also called a scattergraph or scattergram
In addition to maps and graphs, geographers use a range of other visual representations to communicate information they have collected. These include geographical diagrams, sketches, tables, geographical images and geographical information systems. These ways of presenting information allow geographers to communicate their findings in the most clear and appropriate manner.
Tables
Tables allow geographers to present and compare data by organising it under different headings. Tables can be
useful for presenting information over a range of time periods or locations.
Source 24 This table, based on data gathered by geographers in 2006, shows the change in area of seven glaciers (A–G) on Mount Kilimanjaro, 1912–2003 (in thousands of square metres).
1B What are the geographical skills?
Geographical diagrams are simplified drawings of the real world. They allow geographers to show the features or characteristics of places or things much more directly than describing them in words. Certain interesting or complex processes can also be easily explained and demonstrated in a diagram, and communicated quickly and effectively by simple visual representation.
Source 25 This geographical diagram and graph show the dramatic rate at which snow has melted on Mount Kilimanjaro.
geographical sketch a sketch focusing on those parts of the environment relevant to the current geographical inquiry
A geographical sketch can be an extremely useful way of collecting information and presenting it in a straightforward and immediate way. Such sketches are often completed in the field (where they are known as field sketches), but may also be created from photographs. A geographer studying the role of waves in the erosion
of a coastline would sketch the rocks and landforms at a beach, while another geographer studying tourism at the same beach would sketch the buildings and roads. Sketches allow the geographer to simplify information to make it easier to understand.

geographical information system (GIS) a software application designed to capture, store, manipulate, analyse, manage and present all kinds of geographical information
Check your learning Log onto your obook pro to complete the questions for topic 1.8.
A geographical information system (GIS) encompasses collecting geospatial data –such as the real-world distance between landmarks, water depth, the height and width of buildings, and the layout of streets and suburbs – and presenting it through digital means. Smartphone apps such as Google Maps and Google Earth allow geographers to navigate through the real world, using GIS data. GISs have many different applications, and are used for planning, telecommunications, transport and logistics, to name just a few.

Source 27 GISs gather and present real-world geographical data using computer technology. Today, a GIS can be found on almost every smartphone, in the form of apps such as Google Maps and Google Earth.
A key skill in the study of geography is the ability to communicate your findings clearly and effectively. There are several ways of doing this, and you should select the method that best suits your audience and purpose:
• written methods, such as essays, reports or other text-based presentations
• oral methods, such as oral reports, presentations, discussions and debates
• graphic methods, such as maps, graphs, and diagrams
• visual methods, such as annotated visual displays (AVDs), photographs, sketches and posters
• digital methods, such as Wikis, GISs, databases, 3D models and simulations, and multimedia presentations.

Using PowerPoint is a good way of organising and presenting your findings. You may have found doing oral presentations a little daunting in the past, but following these steps will prepare you to give a PowerPoint presentation with confidence.
PowerPoint allows you to embed images, and provides a structure for outlining your key points in a clear and concise way. You can then talk through your presentation using the slides to both prompt and support you. Using visual aids captures your audience’s attention and makes your presentation a lot more informative, too.
Follow these simple steps and tips when planning, creating and delivering the findings of a geographical inquiry.

Step 1 Gather the findings of the research you have carried out as part of your geographical inquiry, including the sources you have used, the results of any surveys or interviews, and any relevant images, graphs, maps or photographs.
Step 2 Plan your presentation carefully so it has a clear beginning, middle and end.
Step 3 Know the requirements of your presentation. Your teacher will tell you how long your presentation is expected to be and what key points need to be covered. It is important that you plan your presentation in line with these requirements. For example, if you are required to talk for 10 minutes, you might like to present 10 PowerPoint slides and talk about each one for around a minute.
• Present the content in clear, concise bullet-point form, not huge slabs of information in paragraph form. You do not need to put all your findings up on the screen.
• Only include visuals that relate to the content on that particular slide.
Check your learning Log onto your obook pro to complete the questions for topic 1.9.
Step 4 It is time to create your slides. Here are some tips to help you create a clear and visually engaging PowerPoint presentation:
• Use a design that ensures your audience can clearly see and read the slides. Think about colours, font size and readability.
Step 5 Carefully plan what you are going to talk about during each slide, and then record this plan on cue cards that you can refer to throughout your presentation.
Step 6 Practise your presentation. You can do this on your own, or in front of a friend or family member.
Step 7 Prior to class, check that everything is working as it should and that the screen you are projecting onto is ready and clearly visible to the audience. If you are using any videos, check that the speakers are working.
Step 8 Deliver your presentation by speaking clearly and making eye contact with your audience.
Step 9 Invite the audience to ask questions. If you do not know the answer, or you are unsure, do not just make something up on the spot. You are better off being honest and offering to answer the question at a later stage, once you have researched the answer.
1 Plan, create and deliver a PowerPoint presentation on a geographical issue that you find interesting. Ensure that you include some interesting visual elements, such as photographs or graphs, as well as your key points.
1B What are the geographical skills?
Reflecting involves looking at what you have learnt, thinking about how it was learnt, and asking critical questions about the way your geographical inquiry was conducted. Reflecting is an essential skill, as it allows you to learn important lessons from any mistakes that you have made, and apply these lessons in your next geographical inquiry.
There are several ways to reflect on your work. One of the best methods to help you reflect is to complete a self-evaluation checklist (see Source 29). You will find a printable copy of this on your obook pro as well.
As well as reflecting on the ways in which you conducted your inquiry, you also need to respond to what you found out. You may even decide that you need to recommend some action based on what you found.
Geographers often use the information gathered and analysed in their inquiry for a specific purpose. This could be to report on an issue and educate people, to raise awareness of a potential problem, or to lobby local, state or federal government about a particular concern. This can be done in various ways – from presenting official reports or studies, to using social media and starting an online petition. The work you do as a geographer can contribute to your environment, and responding and acting is an important part of this work.
If the results of your investigation lead you to recommend a plan of action, be sure to evaluate your own work. Ask the tough questions that another person might ask when looking at your plan. For example:
•Is the plan of action environmentally sustainable? Does it impact in a negative way on the natural environment and natural processes?
The title of my geographical inquiry is: The geographical inquiry I set out to investigate: GENERAL POINTS My rating
I was able to complete all stages of my geographical inquiry.
I was able to answer all my key inquiry questions.
I was able to plan my inquiry effectively. My maps, graphs, tables and diagrams were clear and accurate.
I was able to analyse my data and reach a conclusion.
I was able to communicate my findings in an interesting and appropriate way.
My areas of strength are:
I'm getting much better at: AREAS NEEDING IMPROVEMENT
The part I found most difficult was: I need the most help with: IMPORTANT ISSUES HIGHLIGHTED BY MY INQUIRY
The most important thing I learnt from my inquiry was:
This issue is important to me because:
This issue is important to my community/ country/world because:
Source 29 A self-evaluation checklist is a very useful way of reflecting on the findings of your geographical inquiry.
•Does the plan bring more economic benefits than it costs? Is it affordable in both the short term and the long term?
•Does everyone affected by the plan benefit from its outcomes, or just a few people?
Source 30 Remember to evaluate any strategy you recommend by weighing up its strengths and weaknesses.
Document Self-evaluation checklist

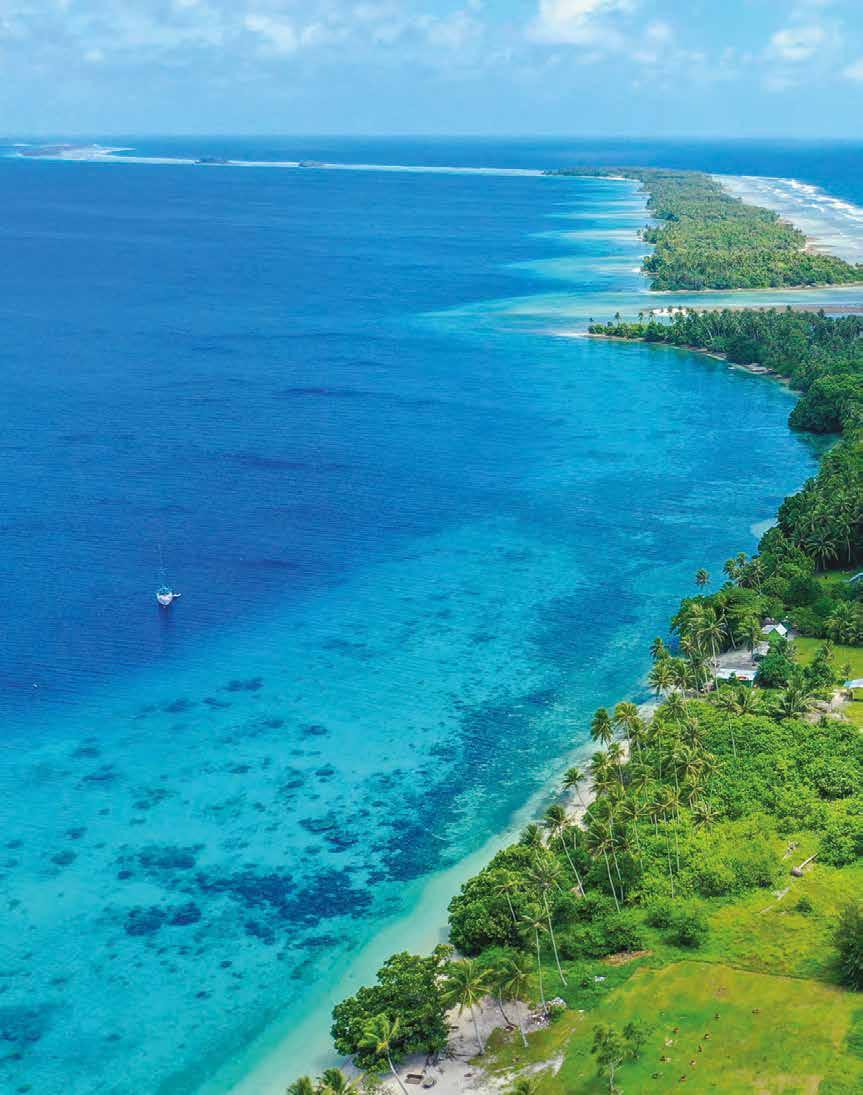
The Earth supports 7.8 billion people every day, supplying us with the water, air and food we need to survive. However, many human activities are threatening the planet’s ability to support life. Forests are disappearing, deserts are growing, water is being polluted, sea levels are rising, and the climate is getting warmer, bringing more frequent and larger disasters such as bushfires and cyclones. Individuals, communities and countries are being affected by these changes. Many people are working to reduce their impact – in many places environmental damage is being addressed and, in some cases, even reversed.
Source 1 The tiny island nation of the Marshall Islands in the Pacific Ocean is at risk of being one of the first countries to disappear beneath the world’s rising oceans. With an average height of only 2 metres above sea level, any change in sea level has disastrous consequences.
Environmental change and management

2A
What is environmental change?
2B
What factors influence environmental change?
2C
How are we responding to environmental changes?
In this topic, you will:
» outline the causes and impacts of changes to the land, atmosphere and water.
ecosystem a complex community made up of living organisms that interact with each other and with their environment; an abbreviation of ‘ecological system’ pollution any substance released into the environment that causes damage climate change a change in global or regional climate patterns; in particular, a change apparent from the mid to late twentieth century onwards and attributed largely to the increased levels of atmospheric carbon dioxide produced by the use of fossil fuels erosion the wearing away of the Earth’s surface by water, wind and ice
Key skill worksheet
Asking questions & conducting research: Conducting research in Geography
We live in a changed world. Today, less than a quarter of the Earth’s land surface can still be considered wild. The rest has been transformed in a variety of ways by human activities, including:
•removing natural tree cover to use the land for farming and cities
•damming and diverting rivers to produce electricity and more reliable sources of water
•digging for minerals and energy sources beneath the surface
•polluting the land, air and water with waste materials.
These changes have had dire consequences for many ecosystems and species of plants and animals that we share the planet with. Tens of thousands of species are becoming extinct each year – largely as a result of the loss of natural habitat, but also due to pollution and the changes brought about by climate change. There are three main categories of environmental change: changes to the land, changes to the atmosphere and changes to water.
As the human population has increased over the past two centuries, cities, towns and farms have spread rapidly across the Earth’s surface. This process has greatly altered the soils and plants. Perhaps the greatest changes have been to the world’s forests. Vast areas have been cleared to make way for farms and cities, and the forests’ resources (such as wood from trees) have been used for energy and building materials. Less than one-quarter of the world’s original forest cover remains intact today, and the small amount that remains is under increasing pressure from expanding populations in Africa, Asia and South America. Fertile soil, too, is a declining resource, as overuse has led to a loss of fertility, soil erosion and increased salt in many regions.
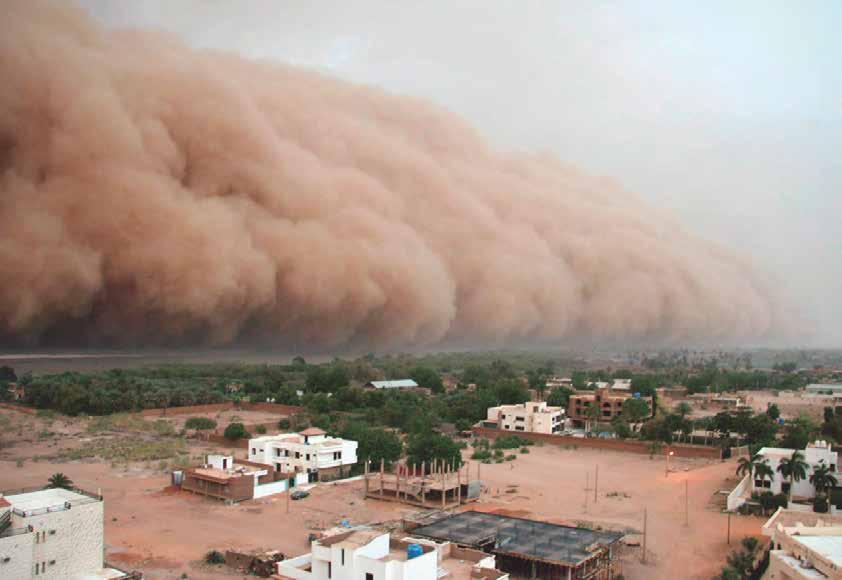
Source 1 A gigantic dust storm approaches Khartoum, the capital city of Sudan. Dust storms such as these are becoming more frequent. They are the result of changes made to the land, including over-farming and the removal of natural land cover (such as trees and other vegetation.
The Earth is surrounded by a combination of different gases known as the atmosphere. These gases provide many of the requirements for life on Earth as we know it, including oxygen and fresh water. The atmosphere also protects the Earth (and everything on it) from the freezing cold conditions and dangerous ultraviolet rays of space. Despite the importance of the atmosphere to sustaining life on Earth, it has been used as a dumping ground for many gases and chemicals produced by human activities. The burning of fossil fuels – such as coal for transport, electricity generation and industry – has changed the natural levels of certain gases in the atmosphere. In addition to this, many airborne chemicals have been released through the production of goods and services that we use every day, such as steel and oil. In some cases, the chemicals released into the atmosphere have brought about a partial breakdown in the layer of gases – known as the ozone layer – that shields us from ultraviolet light. They are also responsible for an increase in the acidity of rain, and a warming of the atmosphere leading to global changes in our climate.
Fresh water is vital to the survival of all life on Earth. Water is used by humans in countless ways. We use it for drinking, washing, transport, firefighting, producing electricity, mining, fishing and recreation, as well as a host of other things. Above all, however, we rely on fresh water for producing the food we eat. About 70 per cent of the total water taken from rivers, streams and underground water sources is used to irrigate (water) crops and provide water for farm animals. The diversion and damming of rivers to provide a reliable supply of water for farmers and for city-dwellers causes water shortages in other places around the world. Changes made by humans to the natural water supply are having serious impacts on the natural environment. Some freshwater supplies are now becoming so polluted that they are undrinkable, leading to problems for the animals, birds, fish and plants that also rely on the water to survive.
Review and understand
1 Outline how human activities have impacted on the land.
2 Explain why human changes to the environment have increased over the past 200 years. Apply and analyse
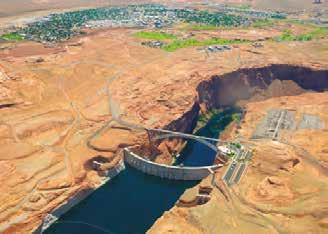
3 Examine the image of the Glen Canyon Dam in Source 2. List all of the human impacts on this environment that you can see.
atmosphere all of the gases that surround the Earth fossil fuel a fuel made from the decomposed (fossilised) remains of plants and animals that lived millions of years ago (e.g. coal, oil, gas)
ozone layer a layer of gases, with a large proportion of ozone, high in the atmosphere that protects the Earth from harmful amounts of the sun’s rays
the natural environment.
create
5 List all of the environmental changes mentioned on these pages.
a Rank them from the one you know the most about to the one you know the least about.
4 Sources 1 and 2 show the effects of environmental changes in desert areas. What factors do you think make these areas particularly vulnerable to the effects of human activities? Justify (give reasons for) your answer.
b For the three at the bottom of your list (which you know least about), create one inquiry question you would like answered before you have finished this unit.
c Share your three questions with the class.
6 Advances in technology and engineering have enabled larger communities to live in desert areas. Discuss the arguments for and against this development, and give your opinion.
2.2
In this topic, you will:
» identify the ways in which humans cause land degradation
» examine the impact of desertification
» examine maps that show measures of environmental change using spatial technology.
land degradation the loss of productivity and the decline in the fertility of land-based environments as a result of human activities
rainforest
a dense forest area found in tropical regions, with warm temperatures and heavy rainfall
salinity
a measure of the amount of salt present in the soil
The loss of productivity and the decline in the fertility of land-based environments as a result of human activities is referred to as land degradation. Land degradation currently affects about one-quarter of the world’s total land area and about 38 per cent of the world’s farmed areas. Up to 3 billion people, including many Australians, are directly affected by land degradation. It is also contributing to climate change – as cleared, degraded land stores much less carbon than natural land cover, such as rainforest. The three main types of land degradation are soil degradation, soil erosion and ecosystem decline.
Soil degradation refers to the loss of fertility of soil, often due to a chemical change. Soil can degrade in a few ways: by becoming compacted by large machinery and hard-hooved animals, by becoming acidic due to a build-up of fertiliser, or from a loss of soil nutrients caused by farming the land too intensively. Soil degradation is a global problem that affects every permanently inhabited continent (see Source 3). One of the greatest problems for Australia is the build-up of salt – called salinity – in the topsoil.
WO r L d : SOIL degra da TIO n
025005000
Source 3
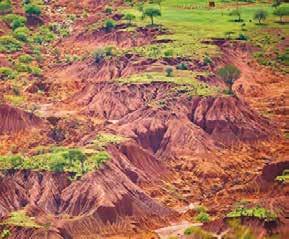
Soil erosion is when soil is gradually worn away by natural phenomena such as rivers, rain, waves, glaciers and the wind. Human activities – particularly clearing trees for farming –accelerate erosion in many places. Cleared land is more vulnerable to wind erosion, gully erosion (water scouring away the land) and sheet erosion (the loss of topsoil over a large area).
4 shows the impact on soil of introduced animals, such as goats.
This landscape in Tanzania has become heavily eroded due to overgrazing by goats, which has ed the fragile soils to heavy rain.
As well as soils, the natural ecosystems of an area, such as forests and streams, can become degraded. This may be through a loss of vegetation, the invasion of alien plant and animal pests, or a decline in the quality of streams and rivers. When coupled with a decline in soil quality, a degradation of ecosystems can lead to desertification – particularly in areas close to existing deserts.
Source 5 shows an area of Mongolia that is becoming desertified due to changes in rainfall patterns and farming practices. These images were obtained from remote sensors on satellites that measure the health of vegetation. Remote sensing is an important spatial technology used by geographers to assess change.
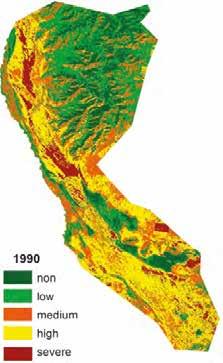
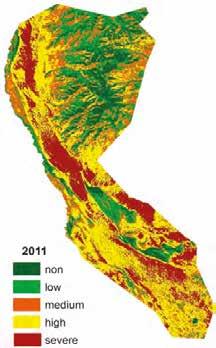
Source 5 These remote sensing images of Hogno Khaan Nature Reserve, Mongolia, in 1990 and 2011 show the areas of desertification, ranging from dark green ‘non’ areas, where no desertification has occurred, through to the red areas of severe desertification.
Review and understand
1 In your own words, define ‘land degradation’.
2 Explain why land degradation is a concern for many people around the world.
Apply and analyse
3 Examine Source 3.
a Identify the regions of the world that experience extreme soil degradation.
b Use the SHEEPT model (see page 23 of ‘The geography toolkit’) to explain why these areas experience extreme soil degradation.
Evaluate and create
desertification the transformation of fertile land into relatively dry desert
4 In small groups, discuss some steps that could be taken to restore the land in Source 4. Use these steps to develop and present an action plan. This could include an annotated copy or field sketch of Source 4. You can find a larger version of Source 4 on your obook pro.
5 Trace an outline map of the area shown in Source 5 by following these steps:
a Shade in brown the area suffering from severe or high desertification in 1990.
b Shade in red the area suffering from severe or high desertification in 2011.
c Add these to a legend and finish your map with BOLTSS.
c Use the PQE method (see page 24 of ‘The geography toolkit’) to describe the distribution of the levels of soil degradation in Australia.
d Compare this with the levels of soil degradation in Tanzania and Mongolia.
e What do you notice about the level of soil degradation in areas next to existing deserts?
d Using your completed map, describe the trend of desertification in this region.
6 Satellite images are another spatial technology. You can access these on Google Earth. Search for ‘Elsen Tasarkhai (Sand Dune Mini Gobi), Mongolia’ to locate the same region as the remote sensing images in Source 5. Describe this landscape as it can be seen in the satellite images.
In this topic, you will:
» identify the ways in which humans cause atmospheric degradation.
The layer of gases that surrounds the Earth – known as the atmosphere – is being degraded in many ways. Pollutants such as carbon dioxide, nitrogen and sulphur released into the atmosphere from factories, power stations and transport are disturbing its natural balance of gases. This change in the composition of the atmosphere, together with a reduction in forest cover, is responsible for an increase in global temperatures and changes in our climate.
Air pollution is one of the world’s worst environmental health risks. It leads to increased rates of asthma, lung disease and heart disease. It is estimated that more than 4.1 million people around the world die each year from outdoor air pollution (see Source 6). This is largely the result of breathing air with high concentrations of fine particles from traffic exhaust, factory and power plant emissions, and fires. Another 2.6 million deaths each year are the result of indoor air pollution. These are mainly due to fuels such as coal and dried animal waste that are burned indoors for heating and cooking (mainly in developing countries).
As tougher laws and restrictions governing emissions from factories and vehicles are introduced in countries across the developed world, outdoor air quality is slowly improving. However, in many countries across the developing world, air quality is actually becoming worse. This is particularly true of some countries in Asia and Africa, where the number of deaths each year from air pollution is increasing. This is due mainly to the rapid growth and expansion of cities. As cities grow, the demand for cheap energy increases. Currently, the cheapest and most reliable source of energy in these countries comes from burning fossil fuels, such as coal and oil. Measurements of air quality show that 98 per cent of cities in the developing world have rates of air pollution that exceed safe guidelines.
025005000
Source 6 Source : Oxford University Press
India has some of the highest levels of air pollution on the planet. A report published by the World Health Organization (WHO) found that 23 of the world’s 30 most polluted cities were in India. It is estimated that almost a million Indians die prematurely from the effects of air pollution each year.
Much of this pollution comes from a rapid increase in the number of vehicles clogging India’s congested roads. In addition to this, there has been a rapid growth in industry across the country. More and more, these factories demand cheap energy, and much of this energy comes from coalfired power plants. In fact, around 70 per cent of India’s electricity is generated from burning coal, much of which is imported from overseas. Australia exports about 50 million tonnes of coal to India each year – a figure that is expected to grow in the future as the population grows and demand increases still further.
Source 7 The world’s 10 most polluted cities – seven of which are in India (shaded in darker green) – as measured by their pollution scores.
Source: Greenpeace/AirVisual
Around 10 kilometres above the surface of the Earth sits a concentration of ozone – molecules that contain three atoms of oxygen. This region of the atmosphere is known as the ozone layer. The ozone layer shields the Earth and its inhabitants from much of the sun’s ultraviolet radiation. Exposure to this radiation is linked to increased rates of cancer (especially skin cancer), as well as lower productivity of plants.
The number of ozone molecules in the ozone layer is constantly changing, but in the 1970s scientists recorded a steady decline of ozone (particularly in an area above Antarctica). Known as the ‘ozone hole’, this reduction of molecules was linked to the release of chemicals into the atmosphere from aerosol cans and refrigerators. In 1987, an international agreement – the Montreal Protocol – banned the use of these chemicals in an attempt to stop the ozone hole from increasing in size.
In recent years, there have been signs that the ozone layer is beginning to recover. It is now expected that it will return to 1980 levels by 2070. The Secretary-General of the United Nations referred to the Montreal Protocol as ‘perhaps the single most successful international agreement to date’.
Review and understand
1 In your own words, define ‘ozone layer’.
2 Explain why the air quality is so poor in India. Apply and analyse
3 Use the geographical concept of interconnection to describe Australia’s role in air pollution in India.
4 Air pollution has been described as a ‘transnational’ problem, meaning that it crosses international borders. Explain why this makes it a difficult problem to solve.
5 Examine Source 6.
a Identify the regions that have the highest death rates due to air pollution.
b In which regions do you predict the rates to grow? Justify (give reasons for) your answer.
Evaluate and create
6 Access the real-time air quality map through your obook pro. This shows the current pollutant levels for hundreds of cities around the world.
a Scroll down for the legend. Describe the distribution of the cities that have levels currently greater than 150 AQI (air quality index).
b Outline the precautions suggested for people who live in these cities.
c Describe the AQI in Australian cities.
In this topic, you will:
» identify the ways in which humans cause water degradation
» describe and analyse access to safe water on a global scale
» examine the level of water pollution in Chad.
irrigating watering otherwise dry land by artificial means (e.g. pipes, ditches, sprinkler systems) to help with the growing of crops
aquifer an underground water supply consisting of a layer of rock or other permeable materials that hold water ecosystem services a term used to describe a range of important resources, processes and benefits that healthy ecosystems provide to humans landfill a method used to dispose of rubbish by burying it; also used to describe the place where rubbish is buried
Inland waters such as rivers, lakes and wetlands are some of the world’s most degraded environments. Human activities have reduced the quality and quantity of clean fresh water in many of these places. Extracting water from rivers to use in homes, factories and farms – and damming rivers for water supply, flood control and hydroelectricity – have all affected the health of inland waters. Pollution from farms and industry sources entering these waters has also caused damage.
People extract large amounts of fresh water from various natural sources. The highest demand for fresh water is for irrigating farms to grow food. In Australia, for example, 70 per cent of the water extracted from rivers and aquifers is used in farming. As the world’s population and its demand for food and water grow, many of the world’s water resources are becoming degraded by having too much water extracted. This has led to shrinking lakes in some regions and increased salinity in the water in others.
Of the world’s 292 large river systems, two-thirds have been changed by dams and reservoirs. Dams disrupt the flow of water – flooding some areas and stopping water reaching others. Damming also disrupts ecosystem services, such as the provision of fresh water, fertile soil and food production. The natural interaction between rivers and coastal ecosystems is degraded, as fewer nutrients and less water and sediment reach the river mouth and sea.
Water pollution is the contamination of our rivers, lakes, wetlands, estuaries, seas and oceans. This pollution can be the result of human activities on or near the water – such as shipping, fishing and oil drilling – or human activities conducted on land, a long way from the waterways. Land activities such as the use of fertilisers and pesticides in farming, littering, clearing land, creating tips and landfill, processing sewage and industrial activities can all cause pollution of the waterways. In many places, people take their water from untreated sources such as rivers and lakes, where there may be dangerous levels of pollutants. This water is used for domestic purposes such as drinking, cooking and cleaning.
Key skill worksheet
Identifying patterns & relationships:
Describing, explaining & comparing data on maps
Source 8
Source: Oxford University Press
2A What is environmental change?
Chad is a landlocked country of 16 million people in north Central Africa. The northern half of the country is part of the Sahara Desert, making water a scarce, precious resource. Less than half of Chad’s population has access to a safe drinking source, with most people collecting water from rivers, lakes and wells. About 7 in every 10 people in Chad do not use a toilet, and instead practise
Review and understand
1 List the human activities that contribute to water degradation.
2 Summarise the circumstances that have led to water degradation in Chad.
Apply and analyse
3 Examine Source 8. Use the PQE method (see page 24 of ‘The geography toolkit’) to describe the distribution of countries where less than 50 per cent of the population have access to safe drinking water.
4 Use the SHEEPT method (see page 23 of ‘The geography toolkit’) to classify the factors responsible for the degradation of freshwater resources around the world.
5 Compare Source 8 with the map of air pollution (Source 6) on page 42.
a Does there appear to be a strong, medium, weak or no association between these two maps?
b Explain why you think this is the case.
6 An additional case study on water pollution in Hanoi is available on your obook pro. Read the case study and answer the following questions:
open (outdoor) defecation. This pollutes the water supply, leading to diseases such as diarrhoea and malnutrition. The United Nations agency UNICEF is working to provide sanitation facilities, such as pit toilets, and to educate people about the importance of washing their hands after using the toilet. At present, only 1 in 17 children use soap and water to clean their hands.
a Compare water pollution in Hanoi with water pollution in Chad. What are some of the similarities and differences?
b What do you think are some of the barriers to improving water quality in these places?
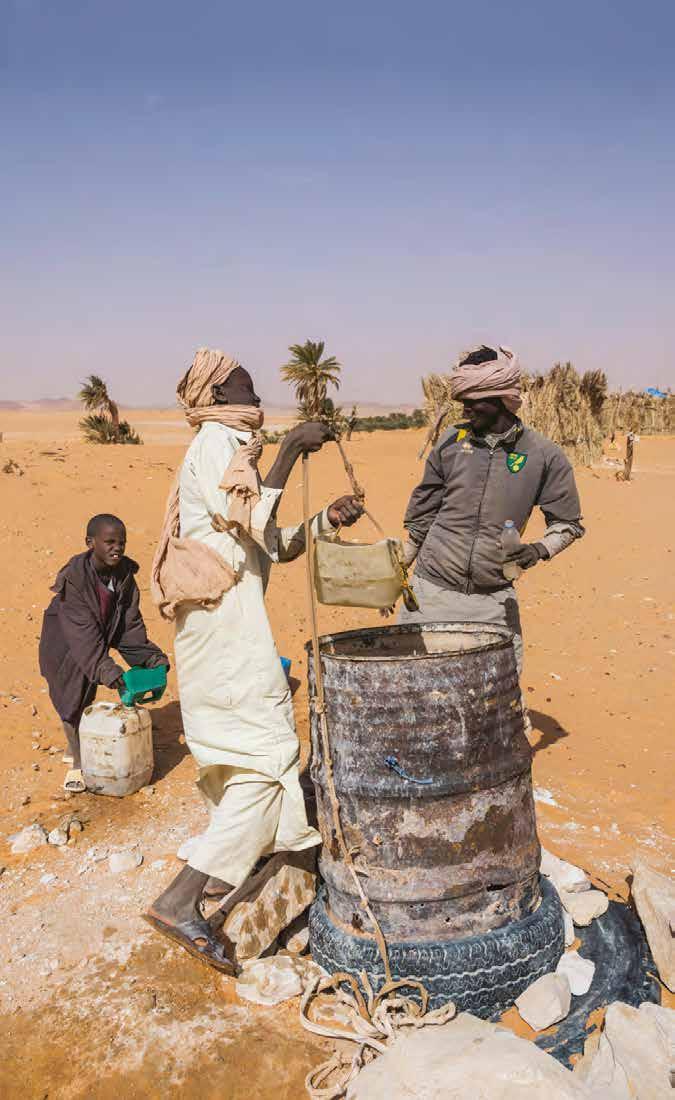
Revise the key terms you have learnt so far.
The region at the confluence of the Tigris and Euphrates Rivers in Iraq (that is, where the rivers meet) once supported one of the world’s great wetlands: the Mesopotamian Marshes.
Between the 1970s and 2002, however, the area of the wetlands shrunk by more than 90 per cent, and the only major marshes that survived were the Al Hawizeh Marshes, sitting on the border between Iraq and Iran. The shrinkage was a result of new irrigation dams that drew water from the rivers upstream to support agriculture. Much of the wetlands became dry and the ecosystems collapsed. The numbers of migratory birds declined dramatically, and the local people were forced to move to the cities.
An overlay map is a type of map that uses information on a piece of transparent paper or plastic (known as an overlay) placed over a base map. Overlay maps allow geographers to show a place at two different times, so that they can instantly identify changes. To construct an overlay map from two satellite images, follow these steps:
Source 10 The Mesopotamian Marshes provide habitat for a variety of wildlife, including the common kingfisher.
Since 2003 many of the drainage structures have been dismantled and the marshes allowed to reflood. By the end of 2006, more than half of the region had been reflooded and much of the original vegetation had recovered. Farmers are also returning to the area.
1 Construct an overlay map of the Mesopotamian Marshes using the satellite images in Source 11.
2 Describe the changes to the rivers and marshes of this region from 2000 to 2010, as shown in your overlay map.
3 Describe the scale of this series of environmental changes. Is this change at the local, regional, national, international or global scale? Explain why.
Step 1 Construct a base map of the region, tracing the earlier satellite image. Add key natural and human features, such as rivers, canals, towns and lakes.
Step 2 Add labels to rivers and towns. Add BOLTSS, and the date of the image.
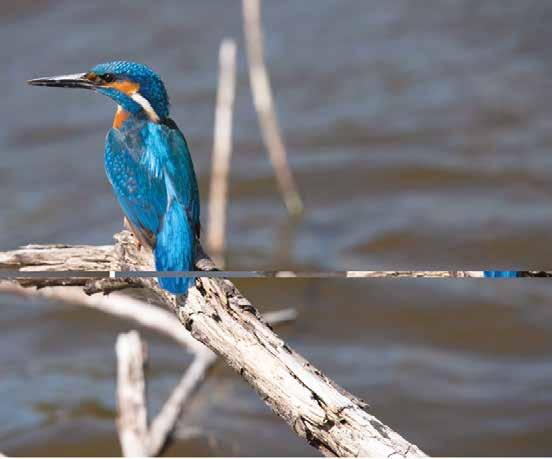
Step 3 On a plastic sheet or piece of tracing paper, construct a map of the same region from a later satellite image. Ensure that the two satellite images show the same region at the same scale. This map will sit on top of your base map, so line up features such as rivers that have stayed the same.
Step 4 Place the overlay map on top of the base map and use a piece of tape like a hinge along the top to stick them together.
Step 5 Add a title to the overlay map that does not cover the base map title. For more information on this key skill, refer to page 26 of ‘The geography toolkit’.
2A What is environmental change?
1 The decline of the Mesopotamian Marshes is an example of the pressure faced by many of the world’s freshwater resources, but their rebirth is a beacon of hope, as it shows that areas can be restored.
Select one of these other examples of water resources under pressure: Aral Sea, tributaries of the Dead Sea, Kara-Bogaz-Gol lagoon, Everglades wetlands, Lake Chad, Lake Balkash, Lake Chapala, Lake Nakuru or the Coorong. Work in groups to complete the following tasks.


a Research the changes that have occurred over time.
b Identify and describe the causes of these changes.
c Describe any attempts that have been made to restore the natural environment and comment on their effectiveness.
d Present your findings as an annotated visual display (AVD). Use images such as satellite images, maps and aerial photographs in your display.
e Compare your example to those researched by other groups in your class. What are the similarities between them? What is unique about the one you researched?


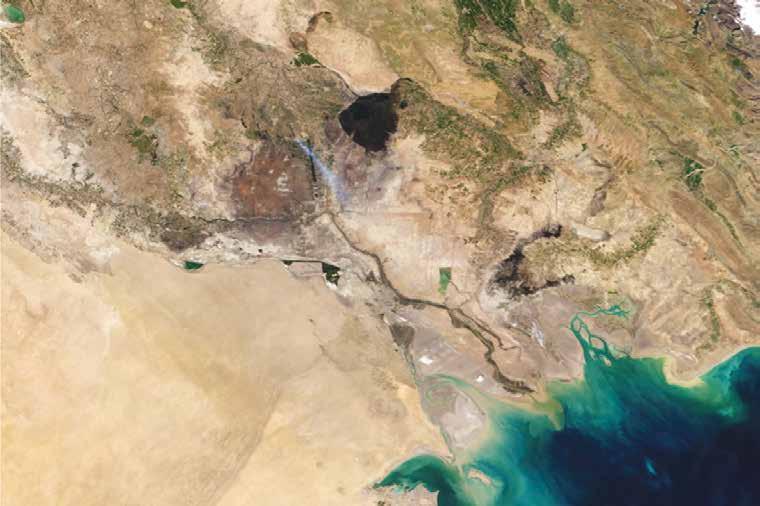
Source 11 Satellite images of the Mesopotamian Marshes from 2000 (top) and 2010 (bottom); the green areas show the extent of the marshes.
In this topic, you will:
» define the four S’s of ecosystem services
» evaluate the importance of these services in sustaining biodiversity.
services processes that take place in the environment that support life sinks processes that take place in the natural environment that absorb waste sources natural products that can be used or converted by humans for use
spirituality a sense of wellbeing and spiritual connection offered by the environment
Planet Earth provides organisms such as plants and animals with everything they need to survive: food, light, water and air. Humans, of course, are one of these organisms, and our survival on Earth is largely due to the services provided by the natural environment around us (see Source 1).
The way in which we think about our environment has changed dramatically over the past few decades. Once seen as a bottomless pit of resources providing everything we need, it is now viewed as a fragile system becoming degraded by human actions.
Ecosystem services can be classified according to the products they provide and the functions they perform. There are four main classifications: sources, sinks, services and spirituality
Sources (also called provisioning services) are those natural products that can be used or converted by humans for our use. These include mineral deposits, such as the coal that we turn into fuel; iron ore that we use in manufacturing; timber from natural forests; and food sources – from plant crops to deep sea fish.
Sinks (also called regulating services) are those processes in the natural environment that absorb our waste. For example, micro-organisms in oceans break down oil spills and, in a similar way, bacteria in the soil break down human waste.
Services (also called supporting services) are processes taking place in the natural environment that support life, but do not produce consumable resources. For example, wetlands filter water and slow floodwaters; while forests absorb carbon dioxide and produce oxygen.
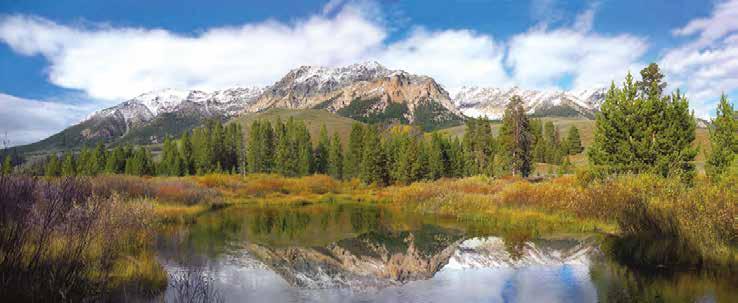
2B What factors influence environmental change?
Spirituality (also called cultural services) refers to the personal relationships that human beings have with the environment. For some, this is a deep connection to the land formed over many generations (such as the connection that Aboriginal and Torres Strait Islander peoples have with their ancestral lands). For others, it is the experience of spending time in the natural environment and the sense of wellbeing that this brings. For example, people taking part in activities such as surfing and bushwalking often feel a deep connection with the environment.
Complex ecosystems have developed over millions of years, where the health of the ecosystem as a whole is connected strongly to the health of every organism within it. If one organism –such as a particular species of plant or animal – dies out, other organisms are impacted. As humans have increased their use of ecosystem services across the planet, they have caused great change to ecosystems. Desertification, soil erosion, and air and water pollution are all examples of human impacts on ecosystems, and are just some of the forces that have led to great changes in the natural world. In many places around the Earth, ecosystems have been changed to such an extent that the ecosystem services on which we rely are threatened. In Australia, our ecosystems are some of the most threatened, with many in danger of collapse.
Review and understand
1 Identify the four types of ecosystem services and write a definition for each in your own words.
2 Identify two examples of human impacts on ecosystem services.
Apply and analyse
3 a Classify each of the ecosystem services shown in Source 1 as source, sink, service or spirituality.
b Provide one more example of each.
4 Examine the image of the Australian Alps in Source 2.
Quiz me!
A quick quiz on ecosystem services
a Give examples of three ecosystem services of this environment.
b How might each of the functions you listed in question 4a be impacted if another bushfire burns this area?
Evaluate and create
5 Which of the ecosystem services shown in Source 1 do you consider to be the most valuable to humans? Justify (give reasons for) your choice.
6 Which ecosystem service do you think is most threatened by human activities? Predict what would change if this service could no longer be provided by the environment.
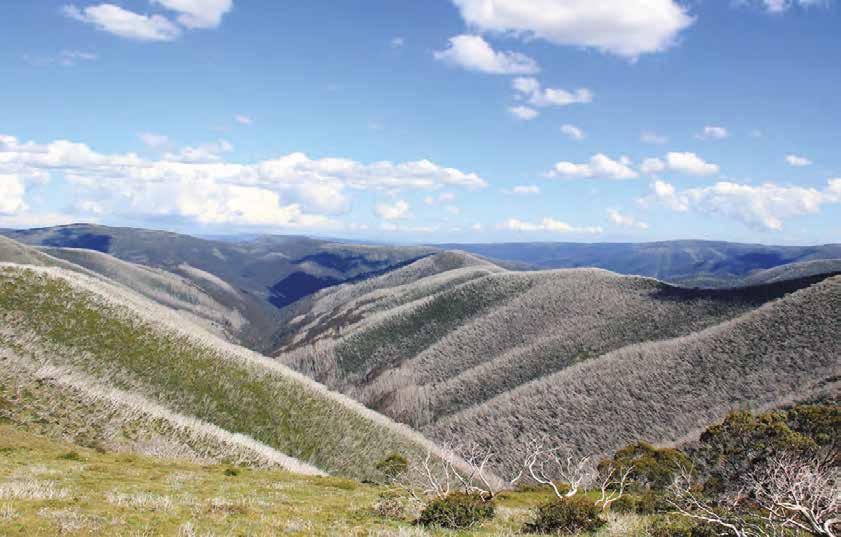
Source 2 Australia’s sub-alpine forest ecosystems are in danger of collapse. More frequent bushfires – such as those that burned this region in Victoria’s Alps – are driving environmental change in this ecosystem.
In this topic, you will:
» identify human-induced environmental changes
» evaluate the challenges they pose for the sustainability of ecosystem services.
In a 2021 study, scientists identified 17 of Australia’s ecosystems that have collapsed or are in the process of collapsing. An ecosystem collapses when:
•it loses its key features
•it shrinks in size
•it loses its plant and animal species, and
•it loses vital services and functions.
In Australia, these ecosystem collapses are largely the result of global climate change. Climate change is causing changes in rainfall patterns and quantities, increased temperatures and rising sea levels. As a result, there are more frequent and larger weather-related disasters, such as heatwaves, floods, storms and bushfires. For example, in the summer of 2019–20, every single state and territory in Australia experienced widespread bushfires.
Australia’s ecosystems are also facing regional and local impacts. The drivers of ecosystem change in Australia are either ‘presses’ or ‘pulses’. Presses are long-term, large-scale changes such as those relating to temperature or salinity, whereas pulses are short-term regional events such as flood or fire. Pressures from human activities – such as farming, water extraction and pollution –have also degraded our ecosystems.
Australia’s natural environment is among the most degraded in the world. In the past 200 years, 34 native mammals have gone extinct. This is the same as the total number of extinct mammals in the rest of the world combined, over the same period.
Of our 17 collapsing ecosystems, seven of them are forests. One is Tasmania’s Gondwanan conifer forests, which contain ancient tree species that have remained unchanged for millions of years. These forests of pencil pines and King Billy pines support ancient invertebrate animals that exist nowhere else. The forests cannot, however, survive fire, and are therefore limited
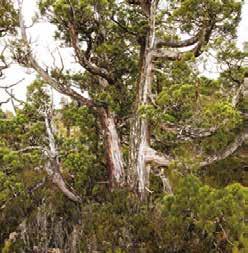
Review and understand
1 Outline how scientists define an ecosystem collapse.
2 a Explain the differences between a press and a pulse.
b Is a bushfire – such as the one that burned the forest in Source 5 – a press or a pulse? Explain your answer.
Apply and analyse
3 Describe some of the ecosystem services (see page 48) that are lost when a healthy ecosystem – such as the one in Source 4 –collapses.
to fire-free areas. Changing rainfall patterns and higher temperatures have resulted in more fires. In the past 200 years, around 30 per cent of the forests’ range has been lost. The insects, birds and animals that have evolved to live in these ancient forests are now endangered by the loss of habitat and the collapse of their ecosystem.
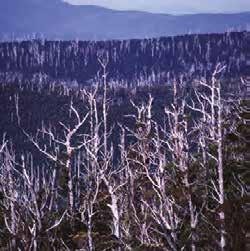
Evaluate and create
4 To what extent should we be concerned about the collapse of Australia's
ecosystems? A lot (strongly), a little bit (somewhat) or not at all? Write a paragraph to explain your position.
5 Select one of the 16 other ecosystems from Source 3 Research the presses and pulses impacting this ecosystem, and present your findings as a written report that includes a map and several properly acknowledged images.
6 Select one environmental change: water and atmospheric pollution, loss of biodiversity, or degradation of land, inland and coastal aquatic environments. Evaluate the challenges this change creates for the sustainability of ecosystem services.
See, think, wonder Look at Sources 4 and 5.
• What do you see?
• What do you think?
• What do they make you wonder?
In this topic, you will:
» identify the way in which humans have caused environmental change.
biodiversity the variety of living organisms (e.g. plants, animals, bacteria and fungi) found in an environment
biome a large area of the Earth that is home to similar plant and animal communities that have adapted to a particular environment over time (e.g. desert, forest, grassland)
‘Invasive species’ is a term used by geographers and scientists to describe groups of organisms (for example, plants, animals, insects, bacteria or fungi) found in an area to which they are not native. In many cases, invasive species upset the biological diversity of areas they spread to, and can have other negative effects.
Many ecosystems around the world are threatened by invasive species. Sometimes, invasive species are brought to a new place deliberately. For example, goats and rabbits were brought to Australia on the First Fleet to provide a source of food for European colonists. Other species may be brought to a new place accidentally. For example, rats often hide aboard ships that are going to new places. Other marine pests have been brought to Australian seas unintentionally in ballast water, which is used to stabilise container ships.
However they move from one place to another, invasive species have the potential to degrade the land and disrupt the natural balance of the ecosystem. They often compete with native species for food, land or water, leading to a loss of biodiversity. Source 6 shows the numbers of invasive species in countries around the world. The map also shows the location of some of the world’s most successful invasive organisms: the castor oil plant, chytrid frog fungus, domestic cat, black rat, American mink and water hyacinth. The information boxes on the following page provide details about these species, including their preferred biomes Australia has 362 invasive species, the second highest number in the world.
What factors influence environmental change?
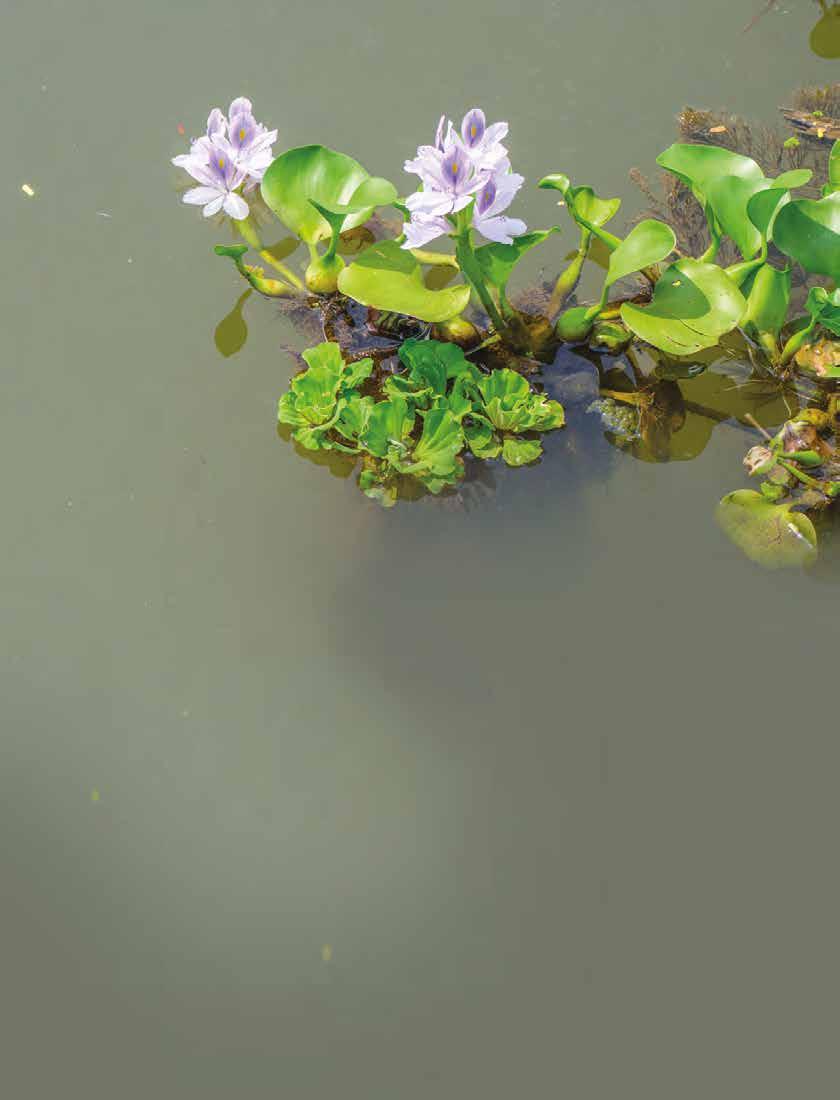
1
Castor oil plant (Ricinus communis)
Native to: North-east Africa and the Middle East
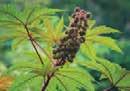
Invaded: Common on every continent except Antarctica
Method of invasion: Carried as an ornamental plant and cash crop in the production of castor oil; seeds dispersed by rodents and birds
Preferred biomes: Grassland, temperate forest
Impacts: Displaces native plant species; poisonous to many animal species including humans
2
Chytrid frog fungus (Batrachochytrium dendrobatidis)
Native to: Africa
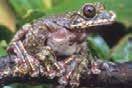
Invaded: All six continents; has infected 93 frog species, more than half of which are Australian
Method of invasion: Frogs carrying the fungus introduced as a food source and for scientific purposes
Preferred biomes: Rainforests, freshwater sources
Impacts: Has infected about one-third of all amphibian species, causing a decline of frog species worldwide
3
Domestic cat (Felis catus)
Native to: Unknown (first domesticated in ancient Egypt)
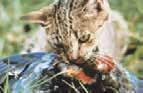
Invaded: Virtually every country, listed as a harmful species in more than 60 countries
Method of invasion: Carried as pets or to restrict rat numbers and then are released or escape into the wild
Preferred biomes: Grasslands, forests and tundra close to water
Impacts: Caused or contributed to the extinction of birds and small mammals around the world, particularly on islands
Review and understand
1 Outline three ways invasive species move between countries.
4
Black rat (Rattus rattus)
Native to: South-East Asia, north-east China and India
Invaded: Widespread around the world
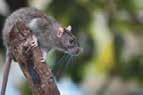
Method of invasion: Deliberately introduced as a food source or accidently introduced as a stowaway on ships
Preferred biomes: Grassland, temperate forest, tropical forest
Impacts: Preys on native birds (especially flightless species and the eggs of seabirds), reptiles and insects; eats native plants and seeds; is a major agricultural pest; has caused or contributed to the extinction of birds, mammals, reptiles and plants
5
American mink (Neovison vison)
Native to: North America
Invaded: Widespread throughout Europe
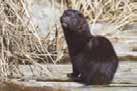
Method of invasion: Bred in mink farms for their fur and then escape or are released by animal activists
Preferred biomes: Forests near wetlands and rivers
Impacts: Kills large numbers of native species such as voles and salmon; can drive native mink from their habitats
6
Water hyacinth (Eichhornia crassipes)
Native to: South America
Invaded: Widespread in streams and rivers around the world particularly in North America and Europe
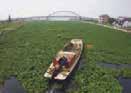
Method of invasion: Carried as an ornamental plant Preferred biomes: Freshwater sources including rivers, lakes and streams
Impacts: Grows as a thick mat clogging rivers and streams, inhibiting plants and some fish species, and providing a habitat for other pests including malarial mosquitoes
2 Explain how an animal that is not a pest in one country can become a major pest when introduced to a new country. Apply and analyse
3 Explain how rats cause land degradation.
4 Compare the six examples of invasive organisms shown. What are some of the similarities? How is each unique? Which do you consider has had the greatest impact? Why?
5 Examine Source 6.
a List the countries with the highest numbers of invasive species.
b Compare these countries. What features do they share that might help to explain the high numbers?
c Suggest one reason why Africa and the Middle East have such low numbers of invasive species.
Evaluate and create
6 Some researchers consider humans to be an invasive species. Create an information box – like those on this page – for the human species, describing their method of invasion, preferred biomes and impacts.
7 Australia is one of the most invaded countries, but it is also the origin of many plants and animals that are considered invasive species in other countries. These include the golden wattle, Queensland fruit fly, Australian magpie, spotted jellyfish and brushtail possum. Research one of these invading Australians. Describe how and where it has spread, and its impact on native plants and animals in other countries.
In this topic, you will:
» identify the ways in which humans have caused environmental change.
‘Biodiversity’ refers to the variety of living organisms on the planet. It is measured by the number of species present in a particular ecosystem or region. The Earth’s biodiversity is currently under threat, decreasing at a rate that rivals the mass extinction of the dinosaurs. It is difficult to give an exact figure on the number of species reaching extinction each year, but it has been estimated at between 17 000 and 100 000 species annually. The world’s most famous fossil hunter, Dr Richard Leakey, believes that this represents ‘a rate comparable with the impact of a giant asteroid slamming into the planet’.
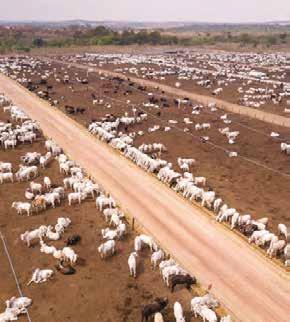
Source 7 Much of the world’s land surface is no longer in its natural state, with farmland and cities replacing areas that were once covered by forests and grasslands. Farming tends to replace hundreds of species with just one – as shown in this image of a beef cattle farm in Brazil. This greatly reduces biodiversity.
deforestation the removal of trees and other plant life from a forested area, either by cutting down or by burning; usually carried out to clear the land for farming
This loss of biodiversity not only impacts the natural environment, but also has serious consequences for all human beings on Earth. Ecosystem services such as food, fibre and fresh water supplies, crop pollination by insects and birds, and protection against natural disasters are in decline.
This loss of biodiversity is due almost entirely to the impact of just one species – humans. Our use of the Earth’s resources and the changes this use brings to the natural environment are pushing many species to extinction. The five main causes of the loss of biodiversity are:
•habitat change, such as deforestation
•over-exploitation of resources, such as fresh water
•pollution of land, water and air
•spread of invasive species
•climate change brought about by human activity.
The International Union for the Conservation of Nature (IUCN) is an organisation that assesses the likelihood that species will become extinct. Of the almost 128 000 species they have studied, 27 per cent can be considered threatened with extinction. Conifers and amphibians (such as frogs) are particularly under threat (see Source 9).
The number of frog species in the world is in dramatic decline and many researchers are linking this to climate change. The skin of frogs is particularly thin and permeable, meaning that moisture passes through it easily. With the drier, warmer climate, many frogs are losing more water through their skin than they are taking in. Frogs are also losing their breeding grounds, as small ponds and water collected in the hollows of trees are drying up and disappearing.
Source 8 The golden toad was last seen in 1989 and, like 33 other amphibian species since then, it is now considered extinct.
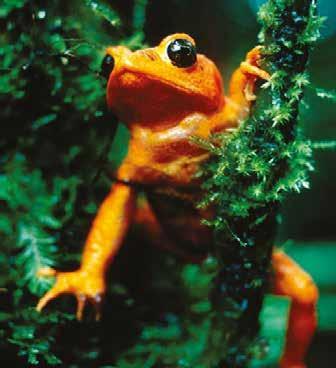
2B What factors influence environmental change?
Estimate of percentage threatened
Bony

Birds
Dragonflies
Reptiles

Mammals
Crustaceans

Conifers Corals
Amphibians
Cycads
0102030405060708090100
Percentage of species in each category
Source 9 IUCN data on the levels of threat faced by the major life groups (known as taxonomic groups)
The greatest threat, however, is from disease. A parasitic fungus from Africa, known as amphibian chytrid, has spread across the planet in the last few decades. Warmer temperatures associated with climate change have created favourable conditions for the spread of this parasite, which was previously held back by cooler night-time temperatures.
After studying the spread of this disease in Central America, a leading researcher in this field stated that ‘disease is the bullet killing frogs, but climate change is pulling the trigger’. He found that two-thirds of all of the region’s species of harlequin frogs were already extinct from this combination of factors. He and other scientists believe that frogs may be the planet’s early warning system on climate change.
Review and understand
1 In your own words, define ‘biodiversity’.

2 Identify the five main causes of loss of biodiversity. Apply and analyse
3 Explain how biodiversity and ecosystem services are linked.
4 Examine Source 9.
a Identify the taxonomic group that has suffered the most extinctions.
b Which of the five main causes of biodiversity loss do you think is most responsible for this?
c Describe the levels of threat faced by amphibians.
5 Describe the change in biodiversity shown in Source 7. Which of the five main causes of biodiversity loss does this illustrate?
Evaluate and create
6 What is the level of threat facing the world’s corals? Research what ecosystem services would be threatened by a loss of coral species.
7 Search for the ‘IUCN Red List’ on the internet. Use this list to research Australia’s southern corroboree frog. How many of these frogs remain in the wild, and what dangers do they face?
8 Choose another species that interests you and research whether or not it is under threat. If it is, what dangers does it face? If it isn't currently under threat, predict the circumstances that might cause it to be so.
In this topic, you will:
» identify the ways in which humans have caused environmental change. When exploring the ways in which the environment is changing, it is important to look at both the causes and effects of these changes. There are usually a range of factors working together that bring about environmental change. For example, the decline in frog species you read about on page 54 cannot be explained by just one cause. Climate change, loss of habitat and human population growth are all factors driving this change.
Geographers use the term ‘drivers of change’ to talk about these factors. They investigate these drivers at two levels, and understanding them both is crucial to understanding why so many natural environments are under threat:
• Direct drivers of change are factors that are undeniably responsible for change. These can occur naturally or may be caused by human activities. Examples of direct drivers of ecosystem and biodiversity decline include habitat change, climate change, invasive species and pollution.
• Indirect drivers of change are sometimes called ‘underlying causes’, because they put pressure on the direct drivers of change. Examples of indirect drivers of ecosystem and biodiversity decline include the growth of the world’s population, changes in wealth and consumption patterns, and changes to technology and government policies. For example, one of the main indirect factors driving loss of biodiversity in certain areas is the increased demand for battery-powered electronic consumer goods, such as mobile phones and laptop computers. The increased mining activity (direct driver) causes a loss of biodiversity, but the mining itself is driven by the demand for these goods.
Demographic and socio-cultural factors, e.g. growth in the world's population The indirect drivers put pressure on the direct drivers of change, which include:
Economic and technological factors, e.g. increased demand for battery-powered electronic consumer goods
Institutions and governance, e.g. changes in laws or governments
Conflicts and epidemics,
e.g. the COVID-19 pandemic
Indirect drivers of change
Land/sea use change
Direct exploitation
Climate change
Pollution
Invasive animal species
Others
Source 10 The links between indirect and direct drivers of environmental change 2040
Percentage of change
Direct drivers of change
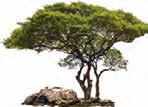
Change on land
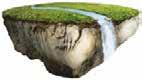
Change in freshwater

Change in oceans
2B What factors influence environmental change?
If you have a portable electronic device, such as a mobile phone, tablet or laptop, it is almost certainly powered by a lithium-ion battery. They are also used to power a wide range of other everyday items, including power tools, wheelchairs, toys, buses and e-bikes. The growth in the demand for these batteries is driven by changes in consumer behaviour, as nowadays almost everyone owns a portable electronic device. Increasing wealth in highly populated countries such as China and India also drives the demand for these batteries.
Source 11 Dark clouds blanket the sky near a graphite mine in northeastern China. People who live near graphite mines complain of contaminated air and water affecting their crops and health.
Lithium-ion batteries contain three key minerals: cobalt, graphite and lithium.
Over 60 per cent of the world’s cobalt is mined in one of the world’s poorest countries, the Democratic Republic of Congo (DRC). To access the cobalt in the DRC, miners have stripped away large areas of rainforest, where locals have always hunted wild animals for food. Once protected by dense rainforest, the western lowland gorilla is now a critically
endangered animal and has all but vanished from the DRC rainforests. Not only has their habitat been destroyed, but without any protection from the rainforest these gorillas have become easy to hunt.
The cobalt mines also contain sulphur which, when exposed to air and water, can produce sulphuric acid. This drains into nearby rivers and streams, causing irreversible damage to the ecosystems downriver. The impact of this sulphuric acid will likely last for centuries.
Two-thirds of the world’s mined graphite comes from China. Explosives are often used to reach natural graphite deposits. This process releases fine particles of graphite into the air, which can be carried through the atmosphere for hundreds of kilometres. The graphite pollutes the soils and waterways of the area, and causes respiratory diseases for those who breathe it. It also enters the food chain, as particles land on crops.
continued on next page
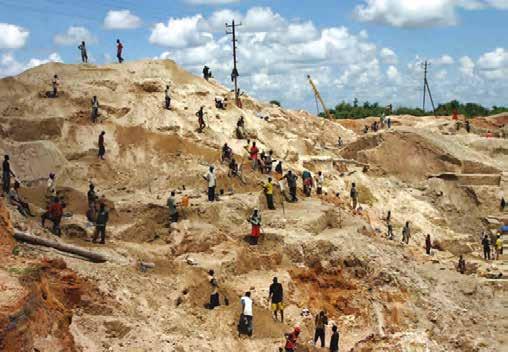
Source 12 A cobalt mine in the DRC – such mines cause environmental change, and there is also evidence that profits from cobalt mining are being used by armies in the region to fund long-running and bloody conflicts.
See, think, wonder Look at Source 14.
• What do you see?
• What do you think?
• What do you wonder?
continued from previous page
Half of the world’s lithium is located beneath an area of salt flats that spans the countries of Argentina, Bolivia and Chile. This area is known as the ‘Lithium Triangle’. To extract the lithium, miners drill into the salt flats and pump the salty water containing the lithium and other minerals to the surface, into an ‘evaporation pond’. After several months, the water evaporates and the minerals are filtered. They are then put into another
evaporation pond and the evaporation process begins again.
This process uses an enormous amount of water: about 1.8 million litres is needed to produce 1 tonne of lithium. The water pollutes nearby streams that are used by farmers to irrigate their crops. Piles of discarded salt and canals filled with polluted water are particularly harmful to the landscape in Chile.
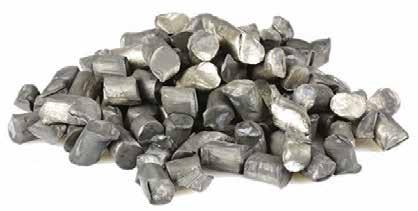
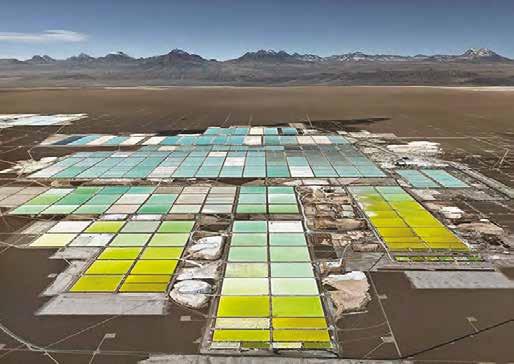
There are a number of tools in Google Earth that you can use to better understand your world and to present information in an interesting way. One of these allows you to create a tour that visits different places. Follow these steps to create a tour that visits three of the countries mentioned in the case study:
Step 1 Open Google Earth and use the search tool to find Mutanda Mine, a cobalt mine in the DRC.
Step 2 Add a placemark at this location using the ‘pin’ icon in the toolbar. Give your placemark the name ‘Mutanda Mine’. As you do this, you will notice that the place name is added to the list of ‘places’ in the menu on the left-hand side of the Google Earth screen.
Step 3 Repeat these steps to add a placemark for Liumao, a site of graphite mines in China.
Step 4 Add a placemark for the evaporation ponds in Chile. These are located
Review and understand
1 Define the term ‘indirect drivers of change’.
2 Identify the causes of an increase in demand for lithium-ion batteries.
3 Examine Source 10 on page 56.
a Identify the two direct drivers that cause the most change on land, and in freshwater and oceans.
b Which direct driver causes the least amount of change? Suggest what might be included in this category.
Apply and analyse
200 kilometres east of the city of Antofagasta.
Step 5 You have now set the three stops on your Google Earth tour. Start the tour at your home by finding this location. Click the ‘Record a Tour’ icon, and this will open a small menu at the bottom of the screen. Once you click the red button in this menu, the program will record all the movements made on the screen.
Step 6 Click the red button and then the ‘Mutanda Mine’ label in the ‘places’ menu. Once this has been reached, click the ‘Liumao’ label in the same way and then the label for the evaporation ponds in Chile. When all three sites have been visited on the tour, stop recording by clicking the red button again.
Step 7 You have now created a tour. You can save this and replay it. You can also add it to PowerPoint presentations. By using other tools, you can add photographs and a commentary. For more information on this key skill, refer to page 26 of ‘The geography toolkit’.
4 Distinguish between direct drivers and indirect drivers of environmental change.
5 Describe the changes that occur to the rainforests of the DRC when cobalt is
mined. Use Source 12 on page 57 to help you in your description.
Evaluate and create
6 Many people buy electric cars, as they believe they are a more ‘environmentally friendly’ option than cars powered by petrol or diesel. Explain why this choice may not be as friendly to the environment as people think, using evidence to support your answer.
7 a Research to find out which devices that you use are powered by lithium-ion batteries.
b Use the geographical concept of interconnection to explain how these batteries link you to natural environments in China, Chile and the DRC.
Quiz me! A quick quiz on drivers of biodiversity loss and ecosystem change
In this topic, you will:
» identify the ways in which humans have caused environmental change through the pollution of land, air and water.
Pollution is any substance released into the environment that has harmful or poisonous effects. Polluting substances reduce the ability of the natural environment to provide ecosystem services.
Pollution is often a side-effect of a process intended to benefit human beings. Pesticides, for example, are designed to kill harmful insects that damage crops, but they can also pollute our water and kill beneficial organisms, such as bees. The loss of bees then reduces the amount of pollination that occurs, setting off a chain of negative effects in the environment.
Here, we look at some common forms of air, water and land pollution.
Air pollution is the contamination of the atmosphere through the release of harmful gases and small particles. This can happen on a variety of scales.
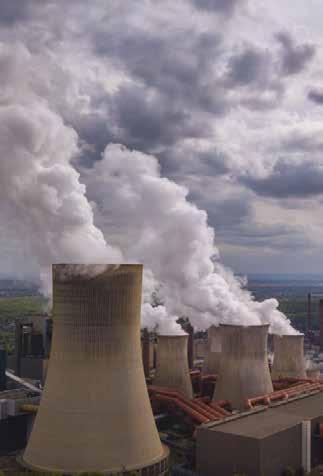
Source 15 In industrial areas – such as Dusseldorf in Germany – factories add to the air pollution created by power plants and transport.
•Sometimes it is local; for example, when a factory releases smoke and gases through a smokestack (chimney), which affects the surrounding area.
•In some industrial urban environments, however, factories, vehicles, houses and other sources of pollution combine to produce large-scale pollution, which affects the air quality right across the city (see Source 15).
•When this large-scale pollution causes changes to the atmosphere – such as when carbon dioxide and methane trap the sun’s heat in the atmosphere and cause climate change – pollution occurs on a global scale
Water pollution is the contamination of rivers, lakes, wetlands, estuaries, seas and oceans through the release of harmful substances. Water pollution can be caused by human activities on or near the water, such as shipping and deep-sea oil drilling. Ships, for example, release waste-water and oil into the sea, causing pollution. Land activities –sometimes a long way from water – can also lead to pollution entering our waterways. These land activities include farming (especially when using fertilisers and pesticides), littering, land clearing, creating tips and landfill, processing sewage and industrial activities. Industrial or farming waste released into a river can travel the length of that river and enter waterways, causing water pollution over a widespread area. Likewise, litter washed down stormwater drains during a storm can end up polluting the ocean. We will explore water pollution further on page 62.

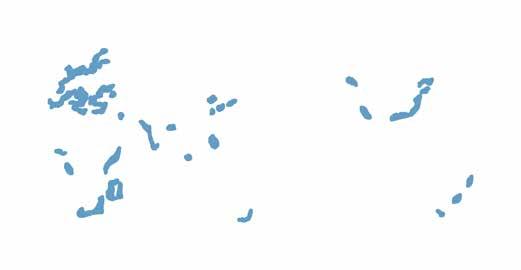
10 contaminated sites
ULAB (used lead acid battery) sales & servicing shops, Narayanganj, Bangladesh
Pesticide storage near l’Aéroport de Ziguinchor, Senegal
Kizel Coal Basin, West Urals, Russia
Doyaganj ULAB market, Dhaka, Bangladesh
Rostom and Moktar ULAB recycling, Bogra, Bangladesh
Sirsiya River, Birgunj, Nepal
INB Caetité (uranium mine) Bahia, Brazil
PCB (polychlorinated biphenyl) pollution at Ijora Power Generation Station, Lagos, Nigeria
Lead pollution at Bugolobi Sewerage Sludge Disposal Site and sewage treatment plant in Bugolobi Kampala, Uganda
10
Hai Bei Chemical Factory, Qing Hai province, China
Source 16
Note: This map includes the annual median concentration of particulate matter (PM) in the air; the WHO considers levels above 12 to be unsafe.
Source: Oxford University Press
Land pollution is the contamination of areas of land through the release of harmful substances. Soil contamination is often localised, such as at the sites of old petrol stations, battery-recycling plants, mines, sewage treatment facilities or landfill. Soil contamination can also occur on a much larger scale. One example is the increasing salinity in the soil resulting from rising water tables in Australia’s Murray–Darling Basin. Land pollution can cause the contamination of groundwater, which is often an important source of drinking water.
Review and understand
1 a Identify the three main forms of pollution.
b In your own words, define each of the forms you named in question 1a.
Apply and analyse
2 Examine Source 16.
a Use the PQE method (see page 24 of ‘The geography toolkit’) to describe the distribution of severe air pollution.
b What link might exist between polluted rivers and polluted oceans? Can you identify any examples of this link in Source 16?
Worksheet
Managing pollution
water table the highest underground level at which the rocks and soil in a particular area are completely wet with groundwater
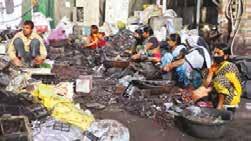
Source 17 Some of the most contaminated places in the world are informal markets and factories in India and Bangladesh, where car batteries are dismantled to extract the lead.
c Identify the countries that experience more than one type of pollution. Use the world map at the back of this book to help.
3 Explain the personal and environmental impacts of dismantling car batteries (see Source 17).
Evaluate and create
4 Which type of pollution has the greatest impact on ecosystem services? Justify (give reasons for) your answer.
In this topic, you will:
» describe the three main types of water pollutants.
About 670 million people around the world today lack access to safe drinking water. This is due to many factors, one of which is the contamination of sources of fresh water – such as rivers, streams and groundwater – with harmful substances. As well as making water unsafe to drink, pollutants reduce the ability of the environment to provide other ecosystem services, such as food supply, pest control and recreation.
Pollutants that enter our waters can be classified as either physical, chemical or biological.
Physical pollutants include particles of soil eroded from the landscape and washed into the waterways, and any litter such as plastic bags, cigarette butts, shopping trolleys and tyres. It is estimated, for example, that more than 7 billion cigarette butts are thrown away carelessly in Australia each year. Many of these end up washed into drains and carried to streams and coasts where they release chemicals and present a danger to marine life and seabirds.
Soil washing into the waterways is a major source of pollution. These particles of soil can make water cloudy and prevent sunlight entering the water, affecting the plants and animals. When the sediment settles, it can smother small animals and plants living in the water. These sediment particles may also have other substances bound to them such as chemicals and bacteria that can cause pollution.
increased stream erosion due to land clearing changes in water temperature due to water capture and timed release from dams
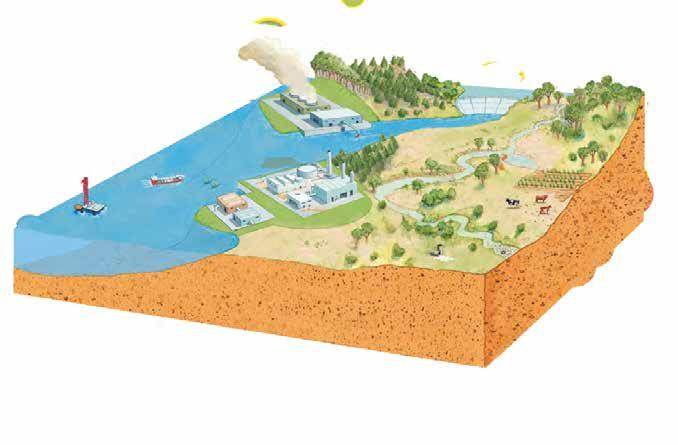
littering in streams and waterways and
Chemical pollutants include heavy metals, oils, pesticides, industrial chemicals and salts. When the concentration of chemicals in waterways reaches levels that are above natural levels, it causes pollution. For example, too much of a naturally occurring plant nutrient changes the chemical balance of water, causing excessive plant and algae growth.
Biological pollutants include bacteria, parasites, and invasive plants and animals. Biological pollutants come from a range of sources, including sewage treatment plants, farms, factories and storm water. They can cause harm to other plants and animals in the water, or cause harm to people who drink the water. Bacterial and parasitical water pollution – such as giardia – is usually spread by human and animal waste entering waterways, causing illness.
One of the world’s most polluted rivers is the Ganges River of India. An estimated 2900 million litres of sewage is emptied into it every day, creating a toxic river. In addition, the river is used to dispose of medical waste, dead bodies and waste from tanneries (where leather is made from animal skins) and other factories. A count of harmful bacteria in the river found levels 100 times higher than those considered safe for human use. Millions of people rely on the water of the Ganges for drinking, bathing and cleaning, as well as for its spiritual significance in the Hindu religion
For more information on this key concept, refer to page 6 of ‘The geography toolkit’.
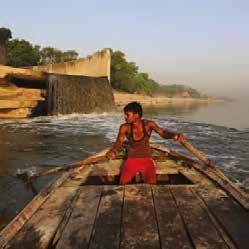
Review and understand
1 Identify the three main types of water pollution.
2 Identify which of these is the main source of pollutants in the Ganges River.
Apply and analyse
3 Classify each of the sources of water pollution in Source 18 as physical, chemical or biological.
Evaluate and create
4 There have been several government attempts to reduce pollution in the Ganges River, but these have been largely ineffective. Discuss some possible reasons for this with a partner and then with your class.
5 The United Nations considers these 10 rivers to be the most ‘at risk’:
• Salween-Nu
• Danube
• La Plata
• Rio Grande
• Ganges
• Indus
• Nile
• Murray–Darling
• Mekong
• Yangtze.
a Locate and label each of these rivers on a world map and describe their distribution.
b Research the problems faced by one of the rivers listed.
c Present your findings to the class.
In this topic, you will:
» identify the way in which humans have contributed to climate change
» evaluate the challenges these changes create for a sustainable future.
greenhouse gas a gas, such as carbon dioxide, that absorbs radiation from the sun’s rays, trapping heat in the Earth’s atmosphere
Although the world’s climate has been naturally changing for millions of years, in more recent times there has been an increase in the concentration of certain gases in the atmosphere. Many of these gases – known as greenhouse gases – are found naturally in the environment, but human activities have increased their levels to a point where they are influencing the global climate. The four main greenhouse gases, and what human activities produce them, are:
•carbon dioxide – from burning fossil fuels, such as coal
•methane – from the large-scale farming of livestock
•nitrous oxide – from the use of fertilisers
•fluorinated gases – from refrigerators and solvents.
As these gases increase in the atmosphere, they trap more and more of the sun’s heat. Over time, this causes the overall temperature of the atmosphere to increase. Average temperatures are now 1.1°C warmer than they were 200 years ago, and are increasing at a rate of 0.2°C every 10 years. This might not sound like much, but it is enough to cause dramatic changes in the world’s ecosystems, including:
•changing rainfall patterns all over the world
•ice melting in polar regions
•less snow falling in mountainous regions
•rising sea levels (these have already risen by about 30 centimetres since 1900, and are predicted to rise a further 30 centimetres by 2050)
•more frequent and severe climate-related disasters, such as droughts, floods, cyclones and bushfires.
Sun
The sun’s rays enter the Earth’s atmosphere. Atmosphere Some emitted heat passes through the atmosphere into space.
Some heat is absorbed by carbon dioxide, a greenhouse gas. Heat is re-emitted in all directions, and some becomes trapped within the Earth’s atmosphere. The Earth becomes hotter due to this process.
Ecosystems develop and flourish under specific environmental conditions. As climate change alters these conditions, the plants and animals within the ecosystems respond in one of four ways:
• They change their basic biology – certain animals may reproduce less often or lay smaller eggs.
• They change the timing of certain events, such as flowering – certain plants may flower earlier or later depending on the conditions. This can impact on creatures that rely on these plants for food.
Energy is absorbed by the Earth’s surface and re-emitted at longer wavelengths, such as infrared radiation (heat).
Source 20 How an increase in greenhouse gases can cause the Earth to become hotter
• They die out – when a species dies out it can have serious impacts on the entire ecosystem.
• They move – in general, many plants and animals are moving towards the poles and into higher altitudes, as temperatures in these places are similar to those in their previous habitats. This affects plants and animals already living in these places.
2B What factors influence environmental change?
Meteorologists (scientists who study the weather) and fire experts have observed that bushfires in Australia are becoming larger, more frequent and more unpredictable. They have also observed that fire season in much of southern Australia is beginning earlier and finishing later than in the past. There are now up to 25 more dangerous fire weather days per year than was the case between 1950 and 1980 (see Source 21).
Extreme bushfires produce their own weather systems and thunderstorms, creating lightning – which, in turn, starts more fires. These are the types of conditions that occurred in the devastating 2009 Black Saturday bushfires in Victoria, and in the much
larger bushfires that occurred all over Australia during the summer of 2019–20.
The scale of the 2019–20 fires was described by the President of the Australian Academy of Science as ‘unprecedented anywhere in the world’. In saying this, he was referring not only to their size, but also to the impact they had on Australia’s ecosystems and biodiversity. It is estimated that over a billion birds, mammals and reptiles were killed in the fires, as well as millions of other animals such as bats, frogs and fish. At least 50 species were pushed closer to the brink of extinction, including marsupials and birds that have existed in this country for millions of years.
C hange I n T he n UMB er OF danger OUS FI re W ea T her da YS W hen COMP ar I ng 1950–80 TO 1980–2020
Quiz me! A quick quiz on climate change
Source 21
Extent of 2019 –20 bushfires
Source: Oxford University Press/Bureau of Meterology
Review and understand
1 Identify three of the main causes of climate change.
2 Describe two ways that the environment responds to climate change. Apply and analyse
3 Explain the work done by meteorologists that helps us to better understand changes in fire seasons in Australia.
4 Examine Source 3 on page 50, which gives details of Australian ecosystems showing evidence of collapse. In which of these ecosystems is bushfire a factor?
5 Use Source 21 to describe the pattern of changes in dangerous fire weather days.
6 Explain how changes in climate impact on bushfires in Australia.
Evaluate and create
7 Discuss with a partner how climate change affects ecosystem services (see page 48). Share these ideas with the rest of the class.
The Earth’s average temperature is rising. As a result, sea levels are rising around the world. This is because water expands in volume when it heats up. The warmer atmosphere also causes ice to melt, and as the ice in glaciers and ice sheets melts, it creates meltwater. This meltwater flows in rivers to the sea, also contributing to sea level rise.
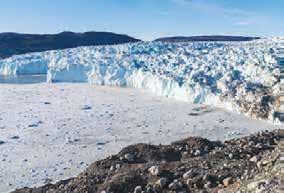
The Greenland Ice Sheet is the second largest body of ice on Earth, with the Antarctic Ice Sheet being number one. In the past 30 years, the Greenland Ice Sheet has lost about 3900 billion tonnes of ice –contributing about 11 millimetres of the total sea level rise of 50 millimetres that occurred in the same period. The Greenland Ice Sheet feeds many large glaciers that carry ice and water to the Arctic and Atlantic Oceans. One of these is the Jakobshavn Glacier.
Like virtually all the world’s 198 000 glaciers, the Jakobshavn Glacier is losing ice. As it enters the Arctic Ocean at its terminus (the end of the glacier), the ice melts and breaks into icebergs, which are carried by ocean currents until they melt (see Source 22). The icebergs and melted ice – like a giant slushy – can be clearly seen in the water in Source 23. Also marked on this satellite image are lines that show the terminus of the glacier in selected years. As you can see, the glacier’s terminus is retreating backwards towards the ice sheet.
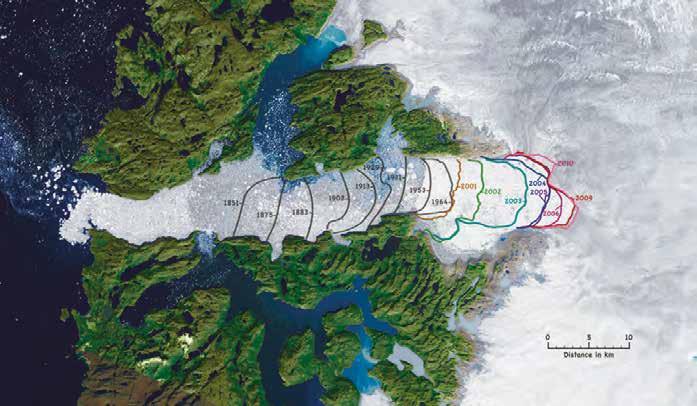
Satellite images can provide an image of a large area of the Earth’s surface. Therefore they have become one of the geographer’s most useful tools when investigating the causes and impacts of environmental change. Satellites have been used to photograph the Earth’s surface for over 60 years, allowing us to see how the surface has changed in that time. By using the line scale on the satellite image of Jakobshavn Glacier in Source 23, you will be able to investigate how this glacier has changed since 1851. Follow these steps to begin your investigation:
Step 1 Look carefully at the image so that you have a good general understanding of what is being shown. Pay
1 Follow the steps above to estimate the total distance the Jakobshavn Glacier has retreated, as shown in Source 24.
2 Use Source 23 to estimate the annual rate of glacier retreat. This needs to be done carefully, as the dates shown on the image are not evenly spaced.
To calculate the annual rate of retreat, divide the distance of retreat by the number of years. In the first example this is 14 ÷ 51 = 0.274 kilometres per year. Convert this to metres by multiplying it by 1000: 0.274 x 1000 = 274 metres per year. Use a table like this one to record your findings.
particular attention to the title (in the caption), the labels on the image and the scale.
Step 2 Locate the landscape being photographed in an atlas so that you can place it within its geographical context.
Step 3 Use the line scale to estimate the distance the terminus has retreated between 1851 and 2010. As each of the lines curve, you should use an imaginary line drawn in the centre of the glacier as your point of reference.
For more information on this key skill, refer to page 16 of ‘The geography toolkit’.
1 Use the historic imagery tool in Google Earth to explore satellite images of the Jakobshavn Glacier and the Greenland Ice Sheet. Describe the other environmental
3 Determine whether the glacier’s retreat is speeding up, slowing down or remaining about the same. Use data from your table to support your answer.
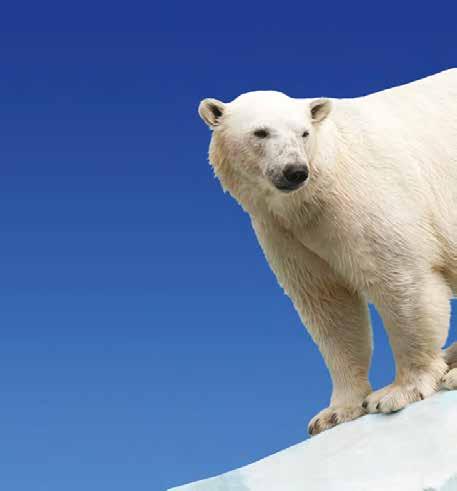
In this topic, you will:
» describe the role of people’s environmental world views
» compare the differences in people’s views about the causes of environmental issues, including individuals such as greta Thunberg and Jair Bolsonaro.
Key skill worksheet
Conducting fieldwork: Gathering data on different world views
On 20 August 2018, 15-year-old Swedish schoolgirl Greta Thunberg unknowingly started a movement that would spread globally. On that day, instead of going to school, she decided that she would begin to protest outside the Swedish Parliament. Carrying a sign that translated to ‘School Strike for Climate’ (see Source 1) she demanded that the Swedish Government reduce the nation’s greenhouse gas emissions. Posting on Instagram and Twitter, she invited others to join her.
By December 2018, more than 20 000 students had held strikes in many countries, including Australia. Greta Thunberg began appearing in newspaper and television reports, becoming a worldwide sensation. She met with the United Nations SecretaryGeneral and spoke at the United Nations Climate Action Summit in New York. She was named Time Magazine’s Person of the Year in 2019 and she has been nominated three times for the Nobel Peace Prize.
While Greta Thunberg has many supporters around the world, she also has many critics. Presidents, prime ministers, newspaper columnists and internet trolls have all condemned her, labelling her a ‘joke’.
The President of Brazil, Jair Bolsonaro, called her a ‘little brat’ when she publicly condemned the killing of two indigenous men involved in a protest over the destruction of the Amazon rainforest. Under Bolsonaro’s presidency, deforestation of the Amazon rainforest has significantly increased.

Source 2 A masked protester in Brazil holds the Brazilian Constitution. The sign on his forehead reads: ‘Bolsonaro out and all scammers.’
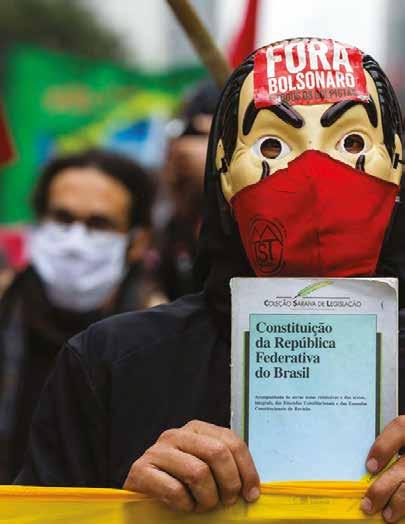
Bolsonaro has consistently denied and rebuffed claims about this. When leaders of other nations objected to the land clearing, he told them: ‘The Amazon is ours, not yours.’ When presented with satellite images clearly showing the destruction of the landscape, he called them ‘lies’.
Why is it that some people become so passionate about preserving the natural environment while others do not? For example, when faced with the reality of climate change, one person demands that changes are made, while others see only the economic cost of making these changes. We can see these differences all over the world, wherever the natural environment is changing.
Studies show that different people view the environment in different ways because of the fundamental beliefs they hold about human beings and our place in the natural world. The reasons for holding these beliefs are very complex, but it appears that where we live, our standard of living, our education and our religion all play important roles. Although each person’s view of the world is unique, researchers classify world views into four major groups (see Source 3). It is important to understand that one view is not necessarily ‘better’ or ‘worse’ than another; it is simply different.

Review and understand
1 Outline how Greta Thunberg’s School Strike for Climate transformed into a global movement.
Apply and analyse
2 Use Source 3 to classify Greta Thunberg’s and Jair Bolsonaro’s world views.
3 Distinguish between human-centred and Earth-centred world views.
4 Examine Source 3.
a Explain which of these four world view statements best reflects your own world view.
b Find a classmate with a similar world view to yours, and discuss what they think about Greta Thunberg’s protest.
c Find a classmate with a very different world view to yours, and discuss what
2C How are we responding to environmental changes?
Human-centred
Egocentric
I am the most important creature on Earth. Everything and everyone else is important to the extent that they support me and my lifestyle.
Anthropocentric
Humans are the most important species. We are in charge of the Earth and the natural world. We can use nature to support us and our lifestyle.
Earth-centred
Ecocentric
We should do whatever we can to minimise our impact and preserve the Earth’s biodiversity. We are no more important than any other organism.
Biocentric
We have a responsibility to use the Earth’s resources in a sustainable way. Other species may be useful to us but they also have as much right to exist as we do.
Source 3 World views about the environment
they think about Greta Thunberg’s protest.
Evaluate and create
5 Differing world views may be the underlying cause of many conflicts and disagreements about the use of the natural environment. Create a scenario where a disagreement arises over the use of a natural environment you know well. Present your scenario as a newspaper article.
6 Research an individual interested in the natural environment, such as David Attenborough, David Suzuki, Rachel Carson, Wangari Maathai, Bob Brown or Amelia Telford. Investigate their contribution to our understanding of the natural world and their area of interest. How would you characterise their world view?
I used to think, now I think
Reflect on your learning about how people think about the world and complete the following sentences.
• I used to think ...
• Now I think ... What has changed in your understanding?
Quiz me!
A quick quiz on different world views
In this topic, you will:
» explain a boriginal and Torres Strait Islander models of sustainability that contribute to broader conservation practices
» explain why land management agencies are working with Traditional Owners to manage environmental change and challenges.
Key skill worksheet
Asking questions & conducting research: Conducting research ethically
Aboriginal and Torres Strait Islander peoples have been part of the Australian landscape for at least 65 000 years. Over that time, they have developed relationships with the land and the water that have helped them to survive and thrive in some of the harshest environments on Earth. As non-Indigenous Australians struggle with issues such as water scarcity and land degradation, some are learning that the principles followed by Aboriginal and Torres Strait Islander peoples provide a model that can help them to view and use environmental resources more sustainably.
Source 4 According to the traditional beliefs of the Gagudju people of Kakadu, a creator-being, known as Almudj, created the waterholes of the region. Almudj brings the wet season every year, may appear as a rainbow, can punish people by drowning them and lives in a pool beneath a waterfall.
KEY CONCEPT Interconnection
Aboriginal and Torres Strait Islander peoples believe that all features of a landscape – land, water, animals, plants and people – are inextricably linked to form one interconnected whole; and that change in one part of the landscape will bring change to the others. This traditional view, which dates back tens of thousands of years, is now accepted as scientific fact by many researchers and scientists, who refer to it as interconnection. It is a key component of Aboriginal and Torres Strait Islander views of Creation, as well as their management of land and water.
This holistic view of landscapes links indigenous peoples with the natural world.
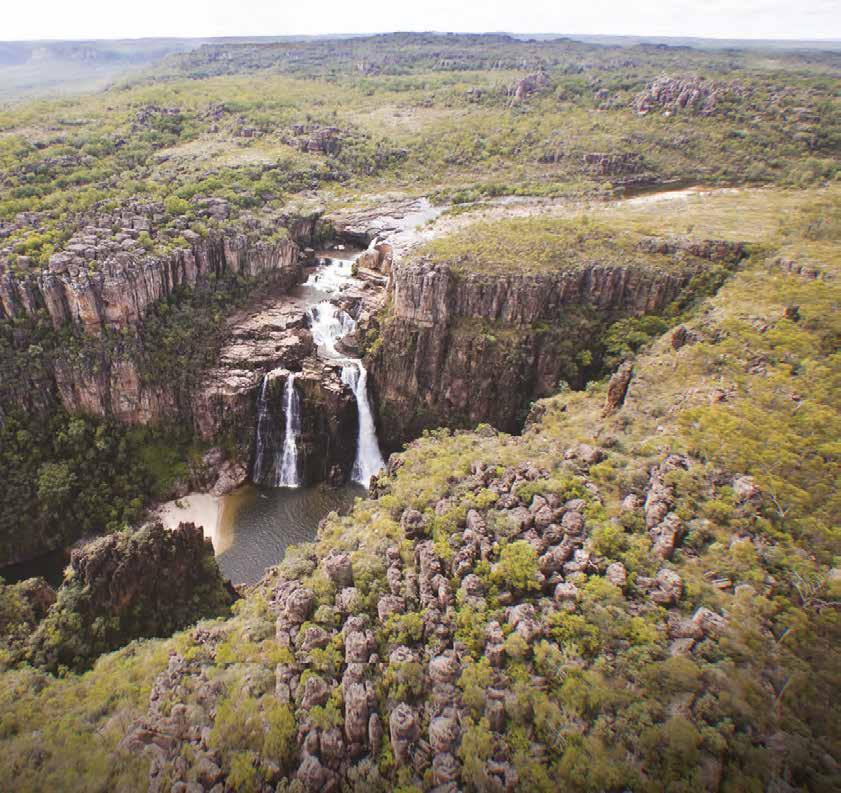
Aboriginal and Torres Strait Islander peoples believe that they have custodial responsibility for the land and water in the country in which they live, and that this responsibility is passed to them by their ancestors and from them to their descendants. Water and land resources –such as rivers, lakes, billabongs and mountains – are protected by a complex series of laws, customs and beliefs. The Nyungar people of south-western Western Australia, for example, throw a handful of sand into streams and lakes as they approach, in order to warn the spirit of the water of their approach.
For more information on this key concept, refer to page 8 of ‘The geography toolkit’.
The Martu peoples have been living in the central deserts of Western Australia for at least 40 000 years. To put that number in perspective, when Egyptians laid the foundations for the pyramids in Cairo, the Martu peoples had already been in the desert for 35 000 years. In that time, they have developed a deep understanding of and relationship with the natural environment. The Martu peoples were granted native title of the Birriliburu Indigenous Protected Area (IPA) in 2002 and have custodial responsibility for the region. At 6.6 million hectares, the IPA contains amazing dune systems, salt lakes, clay pans and mountain ranges.
The Martu developed a network of Aborginal rangers, whose role is to preserve and protect the unique features of this Western Desert landscape. Their work includes monitoring threatened species, removing invasive species and reintroducing the traditional fire regime.
The Birriliburu Rangers work in close partnership with other organisations, including the non-profit group Bush Heritage. The rangers share their knowledge of the landscape, including the importance of particular sources of food and water. In this way, the Martu peoples continue their ancient connection with this land, and the natural environment is better protected from both direct and indirect drivers of change.
This partnership with Bush Heritage involves sharing knowledge both ways in order to manage environmental change and challenges. Bush Heritage provides resources to the rangers, including specialist equipment, remote sensing cameras, satellite images and funds to pay wages. They help to maintain a complex database recording the names of plant and animal species in the area, and help record the impact of controlled burning on the landscape (see Source 5).
Remember and understand
1 In your own words, define the term ‘custodial responsibility’.
Apply and analyse
2 What world view do you think might be held by somebody who is a Birriliburu ranger? Explain why you think this.
2C How are we responding to environmental changes?
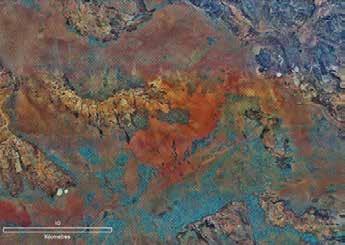
5 Modern scientific techniques – such as this satellite image –can be combined with ancient wisdom to better understand and protect the Western Desert. This colour-enhanced image is used to investigate the impact of controlled burning on the spinifex trees and mulga trees of the region.
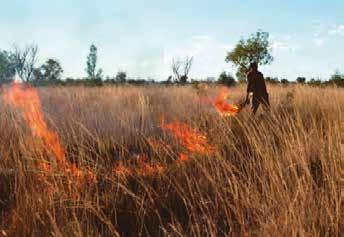
understood the importance of fire in the Australian landscape.
3 Explain how Aboriginal and Torres Strait Islander concepts of interconnection help manage scarce water resources in arid regions of Australia.
4 Explain why land management agencies such as Bush Herritage work with Aboriginal peoples to manage environmental change and challenges.
Evaluate and create
5 What are your beliefs about the natural environment? Where do these beliefs come from?
6 In groups, discuss the importance of non-Indigenous groups working with Aboriginal and Torres Strait Islander peoples to manage Australia’s land and waters. Share your discussion with the rest of the class.
» investigate geographical management strategies for salinity. 2.15
In this topic, you will:
» explain people’s choices of methods for managing or responding to salinity
Salt is a natural part of the Australian environment. Deposited by salt-laden winds from the sea and from the weathering of rocks, it is a component of most soils. It has been estimated, for example, that in parts of Western Australia the soil typically contains between 170 and 950 tonnes of salt per hectare. Because this salt has accumulated slowly over millions of years, Australia’s native vegetation has adapted to the salty soils. The native deep-rooted trees and shrubs soak up much of the rainwater entering the soil. This keeps the water table low in the ground, and means that the salt stays deep in the soil and away from plant roots.
However, changes in the Australian landscape since the arrival of Europeans have significantly altered this system. Large areas of native vegetation have been cleared and replaced by shallow-rooted crops and grasses. This means that much more water is held in the soil and so the water table rises, bringing with it the salt that has accumulated over millions of years. It collects in low-lying areas, killing the introduced plants. As the water evaporates, salt is left at or near the surface, creating large salt pans where nothing can grow (see Sources 7 and 9). The salt also moves across the landscape, turning freshwater streams into salty drains.
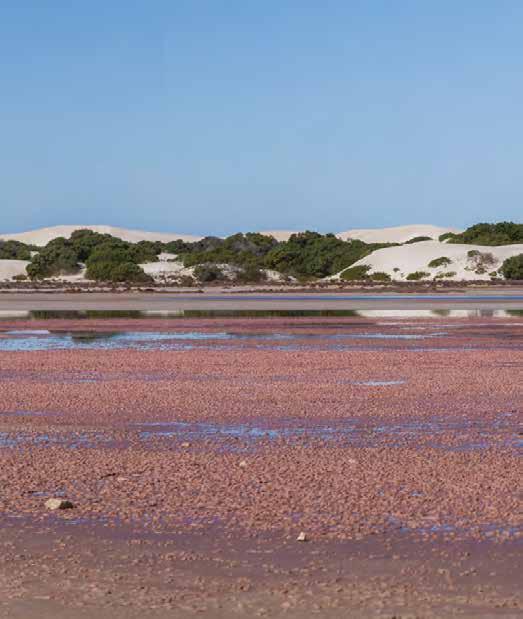
Document Salt pans in Australia
Interpreting geographical images
In some places, irrigation increases the amount of water in the soil. This also has the effect of raising the water table and bringing salt to the surface. Salinity is Australia’s most serious and widespread land degradation issue, currently affecting 2.5 million hectares of farmland.
The most common type of geographical photograph is taken at ground level. These are very useful in geography as they can show a small area in more detail than an aerial photograph or a satellite image. For example, the aerial photograph in Source 11 on page 75 shows the extent of salinity over a large area, but it is difficult to see the effects of this salinity on the landscape. In the photographs on these two pages, however, the effects are much more obvious.
Follow these steps to annotate a copy of either Source 7 or Source 9 (you will find these images on your obook pro).
Step 1 Decide on the focus of your investigation, in this case the impacts of salinity.
Step 2 Add labels such as text boxes and arrows to show key features linked to the focus of your investigation. Source 11 on page 75 is an example of an annotated photograph. Aim for about six labels, each drawing attention to something different.
Step 3 Add a title that includes the focus of your investigation and name of the place in the photograph.
For more information on this key skill, refer to page 26 of ‘The geography toolkit’.
Source 7 A pink salt pan lake in South Australia
2C How are we responding to environmental changes?
Many Australian farmers, particularly in Western Australia, have responded to the threat of soil salinity by changing the ways in which they farm the land. Some of these changes have been more successful than others, but all are designed to use the soil in a more sustainable
way. Source 8 shows some of the strategies used by farmers to combat soil salinity. The most successful strategy used so far appears to be lowering the level of the water table, which keeps salt in the water away from plants.
For more information on this key concept, refer to page 9 of ‘The geography toolkit’.
Construction of levees and banks channel water flow, directing salty water away from plants.
Planting of native trees helps prevent erosion.
Planting of crops such as lucerne, saltbush and wheatgrass help lower the water table.
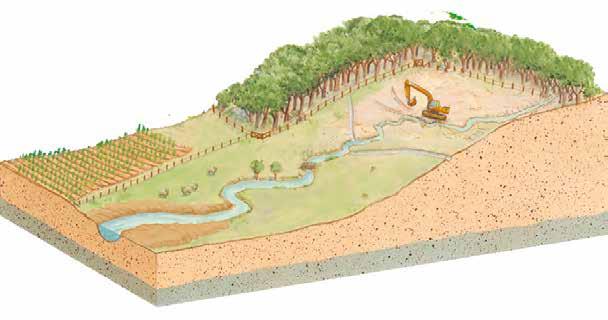
Levees and banks build up barriers to stop salty water flowing into the soil.
Fencing areas of native vegetation away from grazing animals helps prevent erosion and keeps soil healthy.

Water table is kept low so that the roots of plants are not exposed to salt in the water.
Source 8 A range of responses and strategies can be used to tackle salinity.
Some salts will still remain dispersed in the soil.
Drains funnel salty water away from plants.
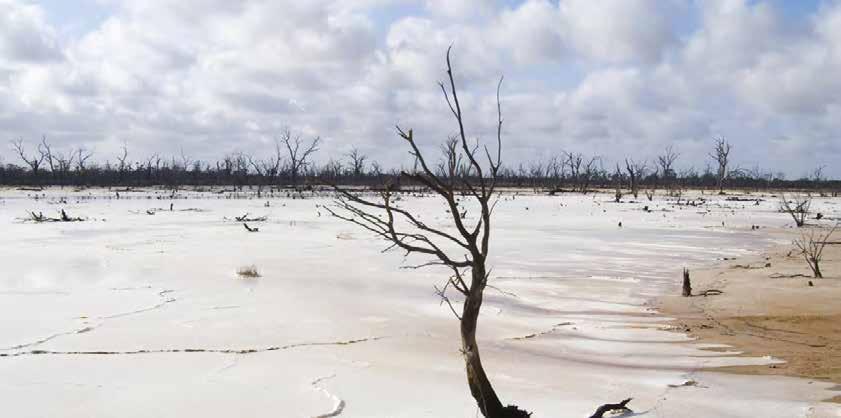
Source 9 Salt rising to the surface in the southwestern corner of Western Australia – a region known as the ‘wheat belt’
Toolibin Lake, in the Western Australian wheat belt, is a small ephemeral wetland (meaning it only fills with water occasionally, depending on rainfall).
As one of the last remaining freshwater wetlands in the region, it contains important habitats for a number of plant and animal species, many of which are endangered. In the 1970s, the lake bed began to show signs of increasing salinity, and a large number of trees died. Source 10 shows the distribution of salinity in the area. A geographical investigation found that this was due to the flow of salty water into the lake from surrounding farmland, together with a rising water table.
In the 1990s, a number of measures were put in place to lower the water table and reduce the salinity (Source 11). These measures included measuring the salt levels in the stream that flows into the lake and diverting excessively salty water to a nearby lake. Pumps on the lake bed were installed to lower the water table and to remove salty water from the soil. Around the lake, belts of trees were planted to intercept water as it flowed towards the lake and also to help in lowering the water table.
A review of these measures in 2010 showed that the water table had been held below the target of 1.5 metres across most of the lake. However, an analysis of satellite imagery from 1990 to 2009 showed that in some areas of the lake, trees had flourished; but in others, they had continued to decline.
Researchers then examined the ways in which the two dominant tree species, sheoak and paperbark, had responded to changing water and salt levels. They found that the trees had responded in very different ways. New sheoak seedlings were found on the floor of the lake, but the paperbark trees had continued to decline in health and numbers. This information has been used to develop new management plans for the lake, working with the local Landcare group. Landcare is a national network of thousands of locally based community groups, whose members care for the natural resources of Australia. With regard to Toolibin Lake, much of the work has focused on increasing the number of trees planted on surrounding farms. The farms in the area tend to grow cereal crops, such as wheat. Getting the farmers to plant trees will further reduce salinity across the region.
Salinity a ected area
Catchment area Road Railway
Source 10
Source: Oxford University Press
Diversion gates measure the salinity of water flowing into the lake. Salty water is diverted; fresh water flows into the lake.
2C How are we responding to environmental changes?
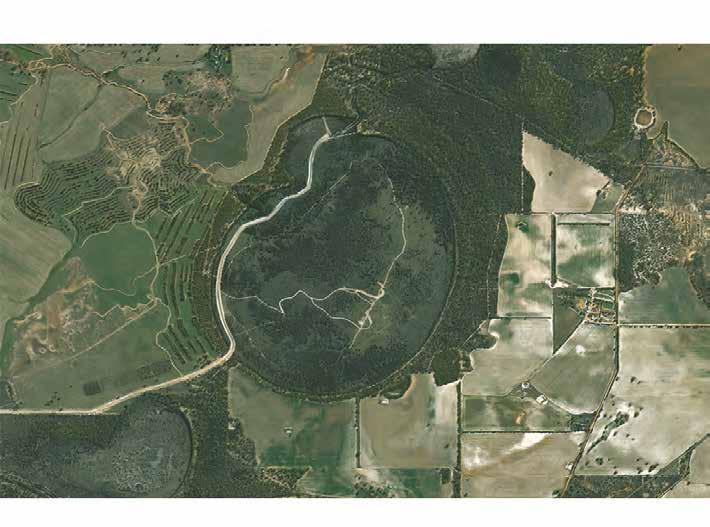
Review and understand
1 Identify where salt in the soil comes from naturally.
2 Outline how the arrival of European colonisers in Australia affected soil salinity.
3 Explain why the water in Toolibin Lake became saltier.
Apply and analyse
4 Classify the causes of salinity at Toolibin Lake using the SHEEPT method (see page 23 of ‘The geography toolkit’).
5 Examine Source 10
a Identify the type of scale used in this map.
b Using the PQE method (see page 24 of ‘The geography toolkit’), describe
A buffer zone of vegetation is protected and replanted around the lake shore.
Eleven large pumps on the lake bed pump salty water from the ground to lower the water table.
the distribution of salinity around Toolibin Lake.
c With reference to Source 11, explain how salinity is being managed at Toolibin Lake.
Evaluate and create
6 Research ways in which farmers throughout the wheat belt may be able to lower the water table and reduce salinity.
7 In small groups, discuss why repairing land degradation in the Toolibin Lake area has been so difficult. What do you think this means for repairing the damage of a much larger area, such as the entire Western Australian wheat belt?
In this topic, you will:
» explain people’s choices of methods for managing or responding to deforestation
» investigate geographical management strategies for deforestation.
One of the leading causes of land degradation on a global scale is deforestation. Forests have been cleared by humans for thousands of years. Traditionally, this has been done for farming, to clear the way for human settlements and to provide building materials. Today, two key economic realities continue to drive deforestation:
1 Trees grow slowly and other crops, such as soya beans, grow quickly. As populations continue to grow and expand, and people tend to their current needs rather than the needs of future generations, forests continue to be cleared and replaced by farms to provide people with income and food.
2 Many ecosystem services provided by forests – such as absorbing and storing carbon and filtering water – do not have a monetary value and cannot be bought and sold. Produce from farms and timber from forests are easily bought and sold, and so are seen as more valuable to local populations than intact forests.
The Amazon, the world’s largest tropical rainforest, provides an example of the changes that are sweeping across many forest biomes today. It is a vast biome, covering an area of more than 5 million square kilometres – roughly the size of Australia. While most of the Amazon rainforest lies in Brazil, it also stretches into seven neighbouring countries, including Peru.
Well known as a biodiversity hotspot due to its large numbers of plant and animal species,
the Amazon is now considered to be an environmental hotspot too. Since the 1970s, an area the size of New South Wales has been cleared for other uses, and in recent years, clearing has accelerated (see Source 12). Some climate scientists believe that unless the remaining rainforest is protected, a combination of climate change, droughts, fires and deforestation will gradually turn the rainforest into savanna and grasslands.
Source 12 Annual deforestation of the Amazon rainforest in Brazil
2C How are we responding to environmental changes?
Satellite images are a useful tool for observing change over a large region of the Earth’s surface. By examining them closely, you can describe changes that have occurred over time and suggest explanations for these changes.
Step 1 Examine two satellite images taken at the same location at different points in time.
Step 2 Using an atlas, locate the area on the Earth’s surface that the satellite images show.
Step 3 Look closely at the image that was taken at the earlier point in time. Describe the natural and human features that you can see.
Step 4 Look closely at the second image. Describe the differences between the first image and the second one.
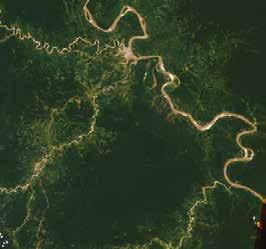
Step 5 Try to quantify the changes. For example, if there has been deforestation, calculate the area of cleared land shown in each of the images. The difference will give you the area that has changed over time.
Step 6 Suggest an explanation for these changes, based on your observations.
For more information on this key skill, refer to page 16 of ‘The geography toolkit’.
1 The satellite images in Source 13 show a section of the Amazon rainforest surrounding the town of Yurimaguas in north-western Peru in 2001 and 2019. Follow the steps above to describe the satellite images shown, and explain the changes that have taken place in this section of the rainforest over the 18-year period.
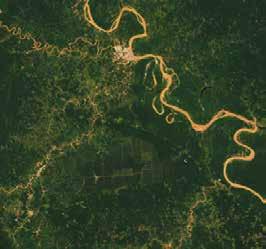
Source 13 Two satellite images of a section of the Amazon rainforest surrounding the town of Yurimaguas in north-western Peru – the image on the left was taken in 2001 and the image on the right was taken in 2019. Rivers can be seen as brown ribbons. Light green shading represents farmland and dark green shading shows the rainforest areas.

Many of the world’s forested areas have been altered by human activities. It has been estimated that of the 60 million square kilometres of forest that once covered the Earth, only about twothirds still remain. Each year the world loses about 230 000 square kilometres of forest – most of it converted to farmland to grow food to support growing populations. For reference, the entire state of Victoria is around 227 000 square kilometres in size. While deforestation may seem to be an unstoppable process, there are encouraging signs of change in some regions of the world, including the Amazon rainforest.
By studying satellite images (such as those shown in Source 13), scientists have been able to estimate that 18 per cent of the Amazon rainforest has been lost since 1970. The vast size of the forest, and the types of changes that are taking place there, make it a very difficult environment in which to manage change. There are indications, however, that international cooperation and modern spatial technologies may be helping to slow the rate of deforestation in the Amazon.
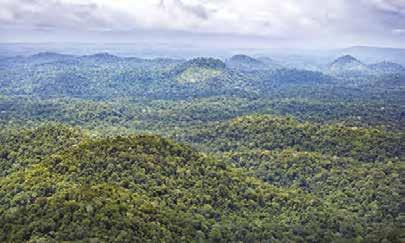
The Amazon Region Protected Areas (ARPA) program is the largest tropical forest conservation effort in the world. Led by the Brazilian Ministry for the Environment and funded by a number of organisations – such as the World Bank, the German Government and the World Wildlife Fund – it aims to protect 600 000 square kilometres of rainforest. Areas suitable for conservation are identified in the forest and then protected from deforestation by Brazilian law. Some of the identified areas have been partially deforested in the past and are now managed by local communities in order to rehabilitate them. This allows the forest to recover.
By 2020, 582 000 square kilometres of the Amazon were protected by law. This figure meant that the Brazilian Government was on target to achieve its goal of tripling the area of the rainforest under protection, compared to levels in 2000.
The Amazon rainforest is home to hundreds of indigenous tribes who have been greatly affected by deforestation. Because no official records are kept, it can be difficult for indigenous tribes to prove ownership of the land on which they have lived for thousands of years. This situation can make them – and their tribal lands – vulnerable to the influences of outsiders who have an established record of moving in, claiming the land and clearing it for use as farms, mines and dams.
2C How are we responding to environmental changes?
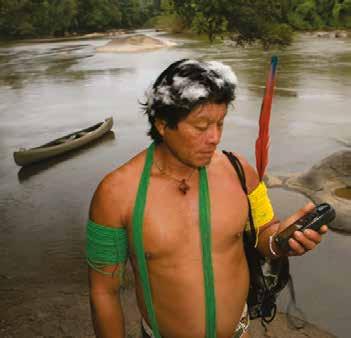
Modern spatial technologies such as global positioning systems (GPS) and Google Earth are beginning to change this situation. Some tribes, such as the Trio people of Suriname, have been provided with handheld GPS devices and training that allows them to map the area of the forest in which they live. The Suriname Government has begun to recognise these digital maps as official documents that can provide the tribespeople with proof of ownership of the forest.
In Brazil, some tribes are investigating possible threats to their homeland by using the satellite and aerial images on Google Earth. By looking closely at the images they can see changes over time, investigate these and pass on information to government officials. These changes may include expanding soya bean farms, or runoff from a mine changing water quality in streams and rivers.
Review and understand
1 Explain why forests are cleared.
2 Outline the predictions climate scientists have made for the Amazon rainforest in the future.
3 Describe the ARPA program. What are its aims? Apply and analyse
4 Explain how modern spatial technologies have helped to protect forest areas in the Amazon rainforest.
5 Examine Source 12.
a Describe the trend in Amazon rainforest loss in Brazil since 1990.
b Roughly calculate the average amount of rainforest lost each year.
6 a Suggest what the environmental world view might be of the Trio tribesman in Source 16 and the owner of the soy plantation in Source 14.
b Compare these world views and why you think each of these people might hold them.
Evaluate and create
7 The image in Source 16 was taken near the village of Kwamalasamutu in Suriname. Use Google Earth to locate this village, and then zoom out to investigate changes such as deforestation nearby.
8 Imagine that the Brazilian Government decided to ban forest clearing and instead encouraged people to replant the forest.
a Suggest how this decision would affect ecosystem services and the Brazilian economy.
b Is this likely to happen? Justify (give reasons for) your answer.
In this topic, you will:
» discuss the extent to which environmental change is a problem that should be managed by humans.
sustainability the ongoing capacity of Earth to maintain all life
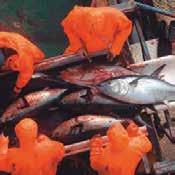
Source 17 These Bluefin tuna are caught in the Mediterranean Sea and then fattened in cages, before being shot, frozen and shipped to Japan to become sushi. Remaining stocks of wild tuna are listed as endangered species, but little is being done to protect them.
Virtually all human activities impact on the natural environment in some way, but humans can reduce these impacts by using the Earth’s resources sustainably. The concept of sustainability relates to the ongoing capacity of the environment to support all living things into the future. The sustainable use of resources such as fossil fuels, forests and oceans is about carefully managing these resources so that they meet the needs of today without compromising the ability of future generations to do the same – put simply, it is about using the Earth’s resources at levels that allow the planet to replace or replenish them naturally. This is a particularly important concept when we consider our use of natural resources that supply us with food and water, such as forests, rivers, the oceans and farmland. If resources are used sustainably, the quality of the environment is maintained and the resources will continue to provide for future generations.
Fish are a vital food resource, providing over 15 per cent of the animal protein eaten each day by 3 billion people. Currently, about 600 million people are employed in the fishing (fish catching) or aquaculture (fish farming) industries.
Many of the world’s fish species, however, have been fished beyond sustainable levels and their numbers are now in serious decline (see Source 18). More than one-quarter of the species investigated by the United Nations are described as being ‘overfished’ and have no potential for increased production in the future. Most fish species are described as being ‘maximally sustainably fished’. This
means that they are currently being fished at the limit of their sustainable level.
Unsustainable levels of fishing are being driven by the food demands of an increasing world population and by modern fishing techniques. These techniques include using spotter planes and GPS to locate large schools of fish, fishing in deeper waters and dragging huge nets along the ocean floor. Fewer and fewer fish are now surviving to adulthood, because they are being caught and eaten as juveniles, before they have had a chance to breed and produce more fish. This means that the fish being caught are not being replaced.
Source
Source: Food and Agriculture Organization of the United Nations
The people of the north-western United States and Canada have fished the coastal waters of the Atlantic Ocean for hundreds of years. The most prized fish of their catch is the Atlantic cod, which once existed in vast numbers. Up until the mid-1950s, around 300 000 tonnes of Atlantic cod were caught each year in the region’s waters. By the middle of the 1960s, large-scale fishing trawlers, using vast nets and mechanical winches, were catching 100 tonnes of Atlantic cod an hour. By 1968, the amount caught peaked at more than 800 000 tonnes, before the Atlantic cod population collapsed. Despite attempts to protect the remaining cod in the past few decades, the population has never recovered (see Source 19).
Source 19 The amount of Atlantic cod fished off the east coast of Newfoundland, Canada, 1850–2000
In more recent times, countries such as Australia, New Zealand and the United States have put in place fisheries management plans to make their fishing industries sustainable and to ensure good numbers of fish in the ocean in the future. These plans monitor fish populations and place quotas on the fishing industry, limiting the numbers of fish that can be caught. The plans have proven very effective at increasing and maintaining fish numbers.
Consumers can also play a part in ensuring the sustainability of fish supplies by choosing to only eat fish that have been farmed or caught in sustainable ways. Organisations such as the Australian Marine Conservation Society provide lists of fish that are safe to eat and fish that you should avoid because they are endangered.
Review and understand
1 In your own words, define ‘sustainability’.
2 Explain why the history of Atlantic cod fishing is an example of unsustainable resource use.
Apply and analyse
3 Annotate a copy of Source 19 to describe the important trends and changes in the numbers of Atlantic cod caught off the east coast of Newfoundland, 1850–2000.
Evaluate and create
4 Aquaculture is seen by many as the best way of providing fish for human consumption in the future. Research this booming industry. Do you see this as a sustainable alternative to traditional fishing?
5 Construct your own line graph to explore global trends in fish supplies into the future.
a Draw up a set of axes: the vertical axis ( y-axis) should show the percentage of fish species from 0 to 100 per cent. The horizontal axis (x-axis) should show the year from 1974 to 2050.
b Copy the line showing fish species that are ‘overfished’ from Source 18 onto your graph.
c Based on the trend from 1974 to 2017, continue this line in a different colour to show the likely trend until 2050.
d Describe the trend shown on your completed graph. If your prediction turns out to be true, what will this mean for the fishing industry and consumers around the world?
One of the largest indigenous groups in the Arctic region is the Saami peoples of northern Scandinavia. Numbering around 70 000 people and living in one of the world’s harshest environments, many Saami groups rely on traditional reindeer herding for their livelihood. They migrate north in spring and summer, and south in winter to find sufficient food, such as grass and small shrubs, for their herds. A typical herd is made up of several thousand reindeer. Typically, Saami herders will travel hundreds of kilometres a year with their herds.
20

21 A
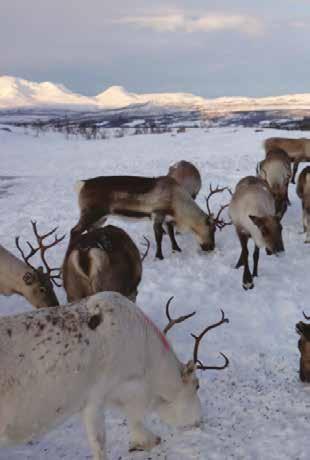
As the temperature warms, this traditional way of life is under threat. While it might seem that warmer temperatures would bring better grazing conditions to the frozen Saami lands, the opposite is true.
Warmer winter temperatures melt the snow, turning it to water. It then refreezes as a layer of ice, which the reindeer cannot penetrate to reach the lichen (their food source) below. This ice is known as cuokke to the Saami peoples and can result in their herds starving to death.
One method used by the Saami peoples to combat this has been to keep herds in pens, and feed them hay and straw. However, this food is expensive and difficult to find.
These changing conditions may bring an end to the Saami’s nomadic way of life which has existed for thousands of years.
2C How are we responding to environmental changes?
Follow these steps when proposing a strategy to respond to environmental change:
Step 1 Research the environmental change. This may take the form of a primary investigation such as fieldwork, or a secondary investigation such as researching journals, newspapers, websites and books. As with all secondary sources, make sure that the sources you use are reliable, and use a variety of sources to help combat bias. It is a good idea to take notes from your sources in a research table, like the one below
Step 2 Investigate the ways in which communities have responded to similar changes in other places.
Step 3 In groups, brainstorm a wide range of possible strategies to respond to the environmental change. The aim here is not to decide which would work and which would not, but to unlock as many possible responses as you can.
Step 4 Sort your proposed strategies into those that respond to the causes of the change and those that
1 Follow the steps above to suggest a management strategy to respond to the problems faced by the Saami peoples.
respond to the effects. Rank the two lists in order, according to how well you feel they respond to the environmental change.
Step 5 Select the strategy that you believe best responds to the environmental change. Write a proposal recommending the adoption of this strategy, including:
• a background to the environmental change, including a location map of the place you have investigated
• an outline of your proposed strategy; you may like to use diagrams, sketches and photographs to support your proposal
• a discussion of why you believe this is the best response, using TEEL paragraphs; here, include evidence from your research in steps 1 and 2 to support your proposal
• a brief outline of the possible barriers to implementing this strategy; you may also like to include suggestions for overcoming these barriers
• a bibliography of your source material.
For more information on this key skill, refer to page 13 of ‘The geography toolkit’.
1 Select one of the other environmental changes described in this chapter, such as:
• soil erosion
• desertification
• salinity
• air, land or water pollution
• ecosystem collapse
• loss of biodiversity
• overfishing.
Complete the steps in the key skill to research the change and suggest a management strategy.
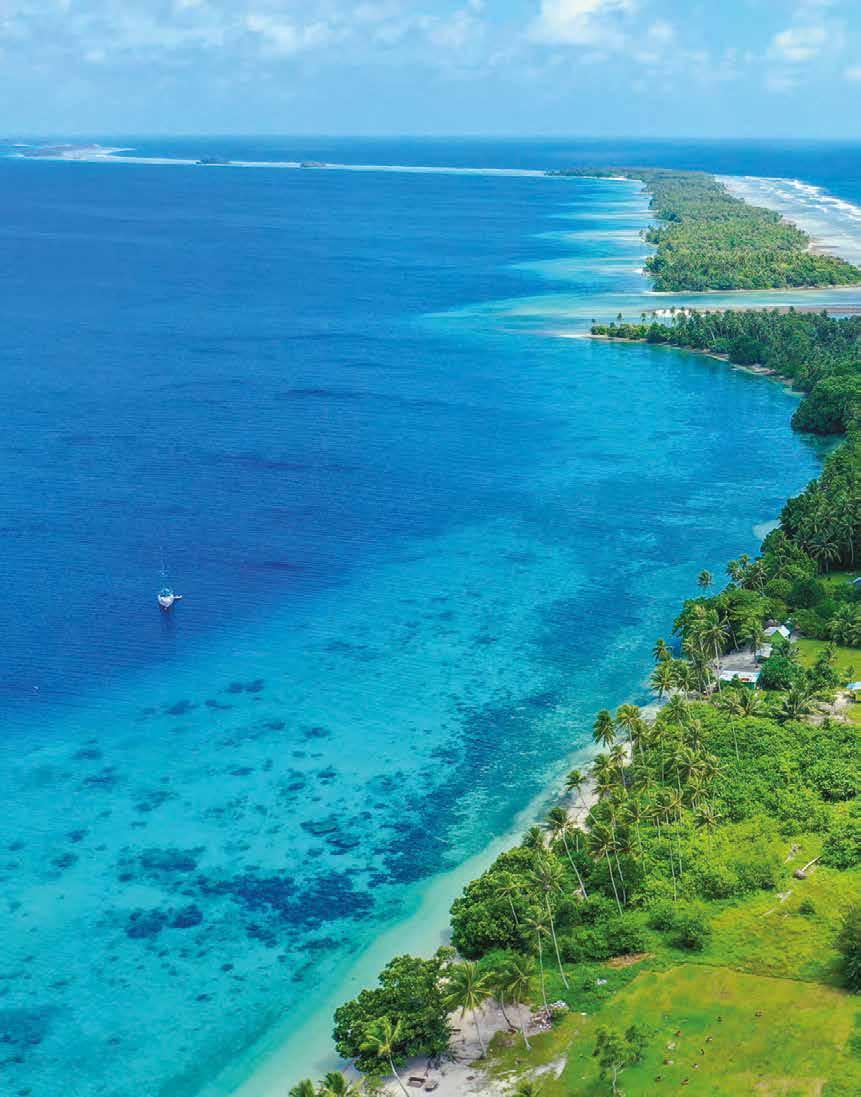
1 Explain how human activities such as farming are changing the world’s soils. (3 marks)
2 Using one specific example, describe how fresh water supplies are being degraded in the world today. (2 marks)
3 Compare water degradation, soil degradation and air degradation. Include two features they all share and two features that are unique to each. (5 marks)
(Total: 10 marks)
1 Outline why ecosystem services are important to humans. (2 marks)
2 Summarise the changes that have occurred to biodiversity in the past 200 years. In your summary, identify some of the causes of these changes. (2 marks)
3 Identify three direct and three indirect drivers of climate change. Explain how changes to the climate are impacting ecosystem services. (6 marks)
(Total: 10 marks)
1 Outline two of the different world views that people have about the natural environment. (2 marks)
2 With reference to one specific example, explain how traditional indigenous views of the natural environment are helping land and water managers respond to environmental change. (3 marks)
3 The Amazon rainforest has experienced a great volume of deforestation. Identify and analyse the responses to deforestation in this region. (5 marks)
(Total: 10 marks)
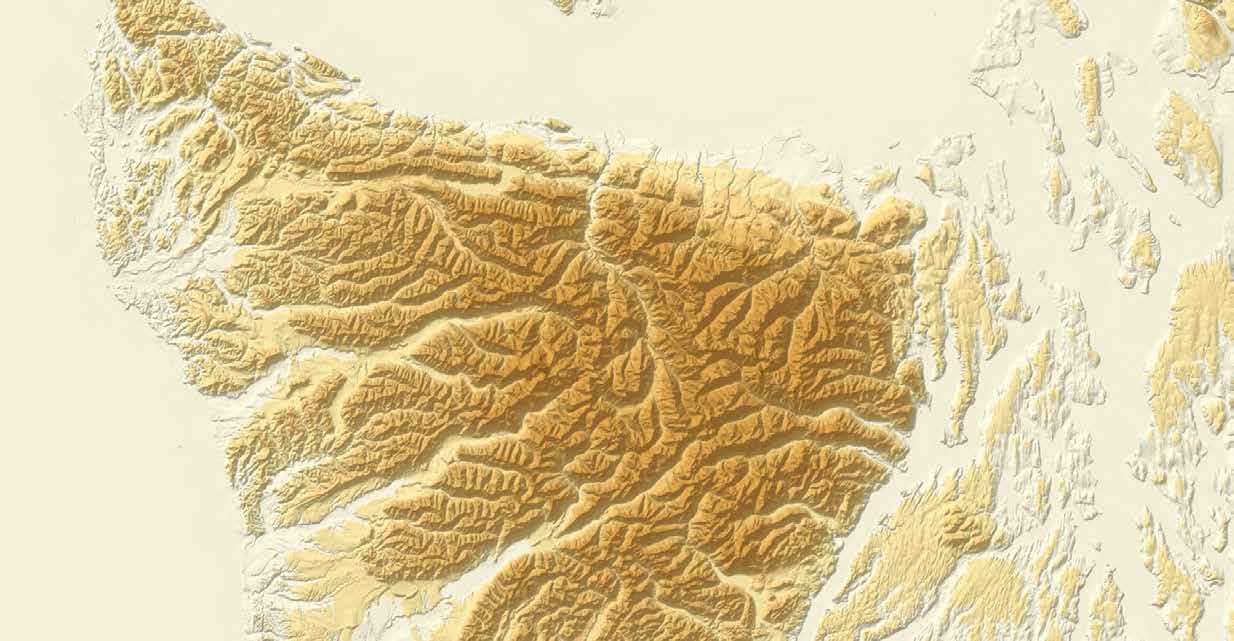
d Use the contour lines on the map and Source 23 to describe the topography (shape of the land) in this region. (2 marks)
4 In a carefully worded paragraph, analyse how the removal of these dams is an example of the geographical concept of sustainability. (6 marks)
(Total: 20 marks)
Check your Student obook pro for these digital resources and more:
Student book questions Chapter 2
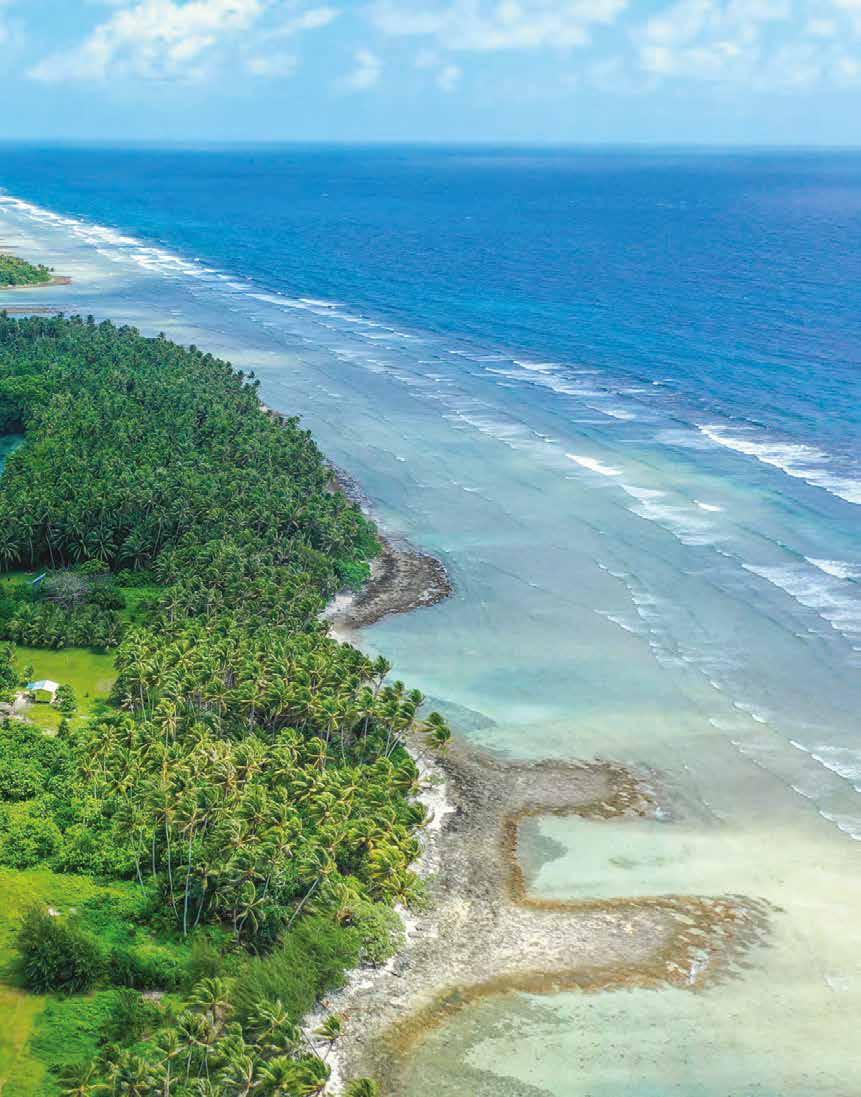
Key skill worksheet
Communicating & reflecting: Chapter 2

Play a game of Quizlet on Changing and managing the environment.
Chapter review quiz
Chapter 2

Coasts are areas where the land meets the sea. Home to more than one billion people around the world, coastal areas are some of the most visited and heavily populated areas on the planet. Human activities in coastal areas have affected many of the natural environmental processes there. This has led to a wide range of issues including a loss of biodiversity, high levels of pollution, erosion, and rising sea levels due to climate change. In fact, coasts are one of the Earth’s most threatened environments.
Coasts are critically important – not only to the people who live along them, but also to the health of the planet. Around the world, geographers are playing a vital role in developing strategies to manage these problems and protect coasts for future generations.
Source 1 The Cinque Terre coast in Italy faces a range of management issues. The most pressing of these is the impact of the 2.5 million tourists who visit the area’s five villages each year.
Environmental

3A
How is the coastal environment changing?
3B
How can coastal changes be managed?
3C
How can geographers help to manage coastal changes?
In this topic, you will:
» identify and describe the changing features of coastal environments. 3.1
Coasts are very dynamic places – they are constantly changing. Crashing waves, strong currents, tidal waters and hazards (such as storms and tsunamis) all transform coastal environments. People also bring about many changes to these environments. From simple activities, such as walking between villages on the Cinque Terre coast (see Source 1 on the previous page), to complex activities, such as the construction of shipping ports and sea walls, humans have serious effects on coastal areas. In many cases, these activities are responsible for coastal degradation sea wall a solid wall built along the coast to protect the land from erosion by the sea coastal degradation the deterioration of a coastline due to human effects such as pollution, population change and tourism
Declining freshwater flows in rivers, due to water extraction for farming and by urban users, impact on coastal lagoons and estuaries.

Coastal visitors may impact on the coast, with activities such as snorkelling and scuba diving.
Source 1 Some common examples of coastal degradation
Flat, fertile land near the coast is often intensively farmed.
Increasing populations, particularly in coastal areas, bring widespread and significant change to the coastal environment. Examples include building marinas, harbours, ports and breakwaters.
Sea levels are rising as a result of climate change. This increases coastal erosion particularly during storms, and reduces habitat for coastal plants and animals.
3A How is the coastal environment changing?
Coastal degradation can be observed on many scales. It may be local, such as when litter is dropped on a popular holiday beach, or regional, such as when an oil spill washes ashore along hundreds of kilometres of coastline. The effects of coastal degradation are varied and can include the loss of plant and animal species, or the arrival of an invasive species that permanently affects biodiversity in the area. Examples of coastal degradation can include sand dunes being washed into the sea and changing the coastline, or blooms of toxic algae damaging the marine environment. Source 1 provides an overview of some common forms of coastal degradation.
Over the course of this chapter, we will be exploring some of the changes that are having the greatest impact on coastal environments. These include climate change, population growth in coastal areas, and the loss of coastal biodiversity.
invasive species a plant, animal or other organism that is not native to an area and whose introduction has negative effects on its new environment
biodiversity the variety of living organisms (e.g. plants, animals, bacteria and fungi) found in an environment
Pollution from inland sources such as farms, cities and industries is carried to coastal estuaries and river mouths by rivers.
Desalination plants change the salinity of water in the local area.
Land is often reclaimed from the sea in areas where flat land is in short supply.
Review and understand
1 Identify two of the changes currently affecting coastal environments.
2 Are coastal environments close to cities more at risk from degradation than those in remote areas? Explain your answer.
Apply and analyse
Overfishing of certain species by commercial trawlers destroys natural ecosystems.
Invasive species from both the land and the sea impact on coastal ecosystems. Ballast water carried in ships can transport invasive species around the world.
Warmer waters means that fish that thrive in cooler waters move away from their usual habitats. This can cause the starvation of other animals and birds and the death of coral.
Harbours are dredged to allow larger ships to reach ports.
3 The three main indirect drivers of environmental degradation at the coast are climate change, population growth and economic growth. Look closely at Source 1.
a Classify each of the examples of coastal degradation shown according to one of these three drivers.
b Are there any changes to the environment in Source 1 that could not be classified in this way? Explain your answer.
c Identify the type of driver that appears to be responsible for most of the changes shown.
d Classify each of the changes shown according to whether they are taking place on a local, regional, national, international or global scale.
4 Apply the geographical concept of interconnection and describe the links between changes on the land and changes at the coast.
Evaluate and create
5 a Select one of the causes of coastal degradation shown in Source 1. Suggest one strategy to solve the problems this creates.
b Evaluate the strengths and weaknesses of the strategy that you proposed in question 5a.
In this topic, you will:
» develop your understanding of the natural processes that shape and change coastal environments
» evaluate the effects of environmental change on these natural processes. 3.2
While this chapter focuses primarily on the ways in which human activities bring about changes to coastal environments, it is important to remember that natural processes are also constantly shaping and changing the coast. Rocks are eroded and material such as sand is transported by the energy of waves, tides and currents, creating a dynamic landscape that is constantly evolving. All this change means that coasts are very complex environments to study and understand.
Geographers often use models – such as the systems model – to understand environments, study the relationships between environments, and learn more about the intricate forces that cause changes.

To apply a systems model to a coastline, each individual landform is considered to be a separate compartment. Energy (such as wind and waves) and matter (such as water and sand) are studied as they arrive at and leave each compartment. Arriving energy and matter are referred to as inputs, and leaving energy and matter are outputs.
If the inputs of matter are greater than the outputs, then landforms –such as dunes and spits – increase in size and the coast grows outwards. If the outputs are greater than the inputs, then landforms decrease in size and the coast retreats (see Source 3).
Source 2 Cape Byron, the easternmost point on the Australian mainland, is a dynamic coast. On the eastern side of the cape, large waves are eroding the coast, while on the more sheltered western side, smaller waves are depositing sand on a series on beaches.
bring silt, mud and sand, especially during floods sand is deposited into bays and estuaries longshore drift transports sand onto beach from another part of the coast
replenish the beach

mining removes sand from the beach
longshore drift transports sand away from the beach sand is lost through rips, especially during storms
3A How is the coastal environment changing?
Energy inputs on the coast – the waves and wind – often erode and transport matter, particularly sand. When matter is transported, the shape of the beach changes. When inputs and outputs are in balance, the shapes of landforms remain unchanged. This is known as dynamic equilibrium. When dynamic equilibrium does not exist, inputs and outputs do not remain in balance, and the landscape changes.
During a storm, energy inputs increase and so erosion occurs. Matter – such as sand and rock – is eroded and transported offshore, and the shape of the beach changes. Once the storm ends and the energy inputs return to ‘normal’ again, dynamic equilibrium returns. The beach will remain unchanged for as long as the energy inputs remain constant.
For more information on this key concept, refer to page 11 of ‘The geography toolkit’.

Review and understand
1 Identify the main energy and matter inputs in coastal environments. Apply and analyse
2 Apply a systems model to describe the changes that are taking place in Source 2.
3 Look at Source 4.
a Identify and describe the evidence present for the movement of sand.
b Explain how this movement has changed the shape and location of the coastline.
Source 4 In July 2020, a series of storms hit the east coast of Australia, eroding large areas of coastline. In the town of Wamberal, New South Wales, several homes had their foundations washed away and became uninhabitable. These storms are an example of how the dynamic equilibrium in this environment was disrupted by an increase in energy.
landform a natural geographical feature or shape on the Earth’s surface (e.g. a dune, hill, valley, beach or cave)
spit
a narrow, low-lying tongue of sand or other eroded material attached to the coastline at one end erosion the wearing away of the Earth’s surface by water, wind and ice
Key skill worksheet Conducting fieldwork: Measuring longshore drift
c Describe evidence in this photo that shows people have tried to control the movement of sand.
4 Select a coast that you know well (or one that you have visited on a field trip).
Describe the energy and matter inputs
and outputs in this environment and explain how these have shaped the coastline. (For example, a series of sand dunes may have been formed by low-energy waves bringing sand from a river mouth.)
Evaluate and create
5 While many coastlines were heavily eroded by the east coast storms in 2020, others hardly changed.
a Brainstorm some reasons why variations exist in the way coasts change.
b Rank your reasons from the one most likely to explain these variations to the one least likely. Justify (give reasons for) your rankings.
6 Create a field sketch of Source 2. On your sketch, label the individual compartments that geographers would study.
In this topic, you will:
» describe the causes and consequences of climate change on coastal environments. 3.3
climate change a change in global or regional climate patterns; in particular, a change apparent from the mid to late twentieth century onwards and attributed largely to the increased levels of atmospheric carbon dioxide produced by the use of fossil fuels
The world’s climate is changing. Human activities such as land clearing and fossil fuel burning have increased the amounts of carbon dioxide in the atmosphere. This is leading to a global increase in the temperature of both the atmosphere and ocean.
Coastal systems are undergoing greater change than virtually any other environment. As the interface between the land and the sea, coasts face pressures from changes in both of these places. Source 5 summarises the effects of climate change on coastal areas.
One of the greatest concerns for Australian coastal areas is the rising of sea levels.
More carbon dioxide absorbed in the oceans
Habitat loss or altered distribution
Saltwater intrusion changes ecosystems (e.g. wetlands become salt marshes) Increased coastal erosion
Algal blooms
Ocean acidification
Coral reefs are bleaching & reef-building animals are dying
It can be difficult to convince people that sea levels are rising. This is because ocean and coastal waters are constantly changing, as waves, tides and currents keep them in movement. Also, sea levels are rising very slowly.
This does not mean that they are not rising. In fact, sea levels have been rising for at least a century. Scientists use a combination of tide gauges and new technologies such as satellite altimeters (instruments used to measure altitude) to monitor and measure sea level changes. These measures show that sea levels have risen by about 30 centimetres since 1900, with about one-third of that rise occurring since the year 2000.
An Australian Government report in 2011 stated:
Sea levels are rising around Australia. A sea-level rise of a metre or more during this century is plausible. It could be less or much more. Between 16 000 and 250 000 individual homes are potentially at risk of inundation from a 1.1 metre rise in sea level.
As well as the risk to homes situated on the coastline, rising sea levels are causing:
•an increase in the erosion of beaches, with some beaches at risk of disappearing completely
•an increase in the incidence of flooding in low-lying coastal areas
•salt water to enter coastal aquifers, destroying freshwater sources
• an increase in the severity of extreme weather events such as cyclones, bringing with them increased incidences of serious storm damage.
As sea levels rise, important coastal ecosystems such as mangroves and salt marshes respond by retreating inland. However, in many places, sea walls and other coastal structures mean they cannot move and are therefore trapped in a narrowing strip of land. This process is known as coastal squeeze. It has led to healthy salt marshes and mangrove forests – which are highly effective natural barriers to erosion – being killed off by built structures that, in many cases, are much less effective at controlling erosion.
Review and understand
1 In your own words, define coastal squeeze. What causes this problem?
2 Explain why coastal erosion is expected to increase as sea levels continue to rise. Apply and analyse
3 Look closely at Source 6. Describe the regions of Australia that experienced the greatest rises in sea levels from 1993 to 2019.
ecosystem a complex community made up of living organisms that interact with each other and with their environment
4 Create four further annotations for Source 5. They should provide additional examples of the impacts that rising sea levels and sea surface temperatures will have on natural and human environments.
5 Visit the Coastal Risk Australia website (a link can be accessed via your obook pro) and use its maps to:
a identify the predicted sea level rise in a capital city or region of your choice
b describe what impacts the predicted sea level rise by 2100 would have.
In this topic, you will:
» examine the impact of climate change on a ustralia’s great Barrier Reef. 3.4
ocean acidification
the ongoing decease in the pH level (a measure of acidity and alkalinity) of the Earth’s oceans, caused by the uptake of carbon dioxide from the atmosphere by the water
Key skill worksheet
Analysing maps: Analysing change over time
Queensland’s Great Barrier Reef (GBR) is not only one of the world’s most beautiful natural treasures, but also one of its most important. Extending over 2300 kilometres and 14 degrees of latitude, the reef contains over 2900 separate coral reefs and some of the world’s most extensive mangrove and seagrass ecosystems. But the combined effects of a changing climate –rising sea temperatures, rising sea levels, ocean acidification and extreme weather events – are causing problems for this remarkable natural environment.
The GBR lies in the Coral Sea off the Queensland coast. Studies show that the current temperatures of this sea are warmer now than at any time over the past 300 years. On average, temperatures are 1.0°C warmer than they were in the late 1800s. As average temperatures rise, warm weather events heat the sea surface to a temperature that coral polyps (the tiny organisms that construct the coral reef) cannot tolerate. The coral polyps feed on algae, but the warmer water temperature causes a build-up of poisons in the algae. To survive, the polyps expel the algae on which they feed, as well as some of their own tissue. This process turns the coral white and is known as coral bleaching.
Source
In 2016, a mass bleaching event associated with a marine heatwave killed over a quarter of the GBR’s coral. A similar heat wave occurred in 2020 (see Source 7). As bleaching events become more frequent, the corals will not have time to recover and whole reef ecosystems will collapse (see page 50 for more information on Australia’s collapsing ecosystems).
As the climate warms, land ice is melting. The water from this melting ice ends up in our oceans. Rising sea temperatures are also causing the ocean to expand because of the warmer water.
3A How is the coastal environment changing?

In the Coral Sea, sea levels are rising by about 3 millimetres per year. This is expected to have little impact on the coral reefs as they can grow upwards by about 6 millimetres per year. Surrounding ecosystems, however, are likely to be severely affected. As salt water intrudes further inland, environments such as mangroves and freshwater lakes are expected to change significantly. Low-lying islands are also expected to disappear beneath the rising seas, changing the distribution of nesting birds and turtles, and hastening the extinction of mammals and reptiles. The Bramble Cay melomys became the first mammal made extinct by climate change when its tiny island in the GBR was inundated with sea water.
Ocean acidification can have dire consequences for a coral reef. As carbon dioxide is absorbed into the ocean, it reduces the amount of carbonate (a kind of salt) in the water. Marine animals need this carbonate to make their shells and skeletons. Reef-building animals such as coral polyps then use these shells and skeletons to create a reef. With fewer shells and skeletons available, construction of the reef is seriously limited. Over the long term, ocean acidification is expected to be the greatest challenge facing the GBR.
Increases in the severity and frequency of flooding and tropical cyclones also pose serious threats to the reef. Flooding brings increased sediment to the GBR, and this sediment smothers plants. Pesticides and other chemicals are also carried by floodwaters, adding to the levels of pollution in the water around the reef.
Cyclones generate large and powerful waves that damage corals and the reef structure. Reefs are able to recover from these natural events, but they need time to do so. As extreme weather events become more frequent, reefs have less recovery time.
Review and understand
1 Identify four effects of climate change.
2 Describe the impact of climate change on the following:
a nesting birds
b reef-building animals
c coral polyps.
Apply and analyse
3 Examine Source 7.
a Describe the distribution of most severe bleaching in 2016.
b Compare this to the 2020 mass bleaching event.
c Brainstorm possible reasons why the distribution of the areas most severely bleached in 2016 and 2020 differs.
4 Rank the four impacts of climate change described in this topic from the one likely to have the greatest impact on the GBR to the one likely to have the least impact. Write a paragraph justifying your ranking.
5 Imagine that the GBR disappeared due to the combined effects of climate change. How would this affect the Queensland coast and the Queensland economy? Justify your answer.
In this topic, you will:
» examine the impact of population growth on coastal landscapes.
megacity
a city with a population of more than 10 million people
groyne
a human-made barrier that juts out from the beach into the water, built to prevent erosion of the beach from the power of destructive waves and longshore drift breakwater a wall built out into the sea to help prevent large waves from reaching the coastline and causing erosion deposition the laying down of solid material that has been eroded and transported from another part of the Earth’s surface
Over one-third of the world’s population – that is, nearly 2.4 billion people – live within 100 kilometres of the coast. Most of the world’s megacities in both the developed and developing world are located on the coast, and many of them are growing rapidly. In China, for example, 1000 people per day move to coastal cities from the country’s interior.
The impact of billions of people in millions of coastal cities, towns, villages and farms has caused one United Nations expert to state that ‘humankind is in the process of annihilating coastal and ocean ecosystems.’
The coast has always been an attractive place for human settlement. Coastal regions provide access to food and water, and people have long used ocean-going boats and ships for transportation. But the growing number of people along the coast – together with increasing levels of trade and movement between settlements – have had many detrimental effects on coastal ecosystems:
•Engineering structures such as sea walls, groynes, breakwaters, training walls and marinas have hardened the coast and changed natural cycles of erosion and deposition
•Changing the natural flow of water by deepening channels, diverting rivers and building dams has altered the amount of fresh water and sediment arriving at the coast, impacting on natural ecosystems and landforms.
•The discharge of sewage into the ocean, the run-off of fertilisers from farms, and other contaminants entering coastal waters have caused pollution in the oceans.
•Increased numbers of people in coastal areas have led to over-fishing of fish and shellfish. In some places, coastal fish stocks have fallen by 90 per cent in the past 30 years.
•Ports are often an entry point for invasive species that bring dramatic changes to coastal ecosystems.
•The presence of large numbers of people on beaches has an impact: people leave litter on beaches, they walk over native plants and impose walkways, they can destroy breeding areas of sea birds and bring predators such as dogs into the environment.
estuary
a wide tidal mouth of a river
land reclamation the process of creating new land from oceans, bays, harbours and estuaries by dumping rocks, silt from the sea bed or other materials into the water
Source 9 Mangroves once covered most of Singapore’s coast; now only 5 per cent remains.
Many coasts have been converted from natural ecosystems to human landscapes. Cities need space to grow and harbours for trade and transport. Mangroves, marshes and estuaries have been drained and filled in, sand dunes flattened and built over, and communities of coastal plants cleared. In some places, land for expansion has been so scarce that new land has been built in bays and estuaries from rocks, rubbish and silt from the sea bed. This is known as land reclamation

In the past 50 years, one of the world’s smallest countries has grown in size by almost a quarter. In the island nation of Singapore, 85 square kilometres of land has been reclaimed from the sea.
In the beginning, walls were built from rocks in the shallow bays and estuaries surrounding the island, enclosing areas that were then filled with sand. However, Singapore soon ran out of sand for this project and began importing it from neighbouring countries, such as Indonesia, Malaysia and Cambodia. It imported millions of tonnes of sand from these countries over a period of several decades. Concerned with the environmental impacts of dredging sand from rivers and beaches, the exporting countries banned the practice.
As a result, Singapore changed its method of reclaiming land. Now, huge
Source 10
Review and understand
1 In your own words, define land reclamation and explain why it is used.
2 Describe the changes to coastal ecosystems as a result of coastal city growth.
Apply and analyse
3 Use an atlas to locate the world’s megacities and identify the following: a megacities located on the coast b megacities located on river mouths or estuaries.
4 Suggest two reasons why the impacts described in this topic would be particularly serious for small island communities.
concrete walls are built in the sea and enclose the area to be reclaimed. The sea water is then pumped out, and a smaller amount of sand and other materials is used to bring the new land above sea level.
Singapore plans to reclaim another 60 square kilometres of land by 2030.
Evaluate and create
5 Would the population impact on coasts be greatest in developing or developed countries? Discuss this with a partner and then with the class.
6 Create an overlay map of Singapore, using Source 10. On the base map, show the natural outline of the island. On the overlay, show the total area of reclaimed land. Describe the spatial change over time shown on your map.
7 Use Google Earth to explore the coastline of Singapore (a link can be accessed via your obook pro). Estimate the percentage of the coastline that is:
a heavily modified (for example, reclaimed land)
b lightly modified (for example, where sea walls or groynes have been constructed)
c not modified.
Source: Oxford University Press
In this topic, you will:
» examine the loss of coastal biodiversity as a result of coastal change.
The number of plant and animal species on a global scale is in decline because of human activities. Recent studies of three key coastal ecosystems – explored in detail below – reveal that all are declining in size and biodiversity.
ecosystem services a term used to describe a range of important resources, processes and benefits that healthy ecosystems provide to humans
Coral reefs are home to one-quarter of the world’s fish species. Up to a billion people rely on the ecosystem services provided by coral reefs, including food, protection from waves and storms, and income from reef-based tourism. Despite their importance, the coral reefs are under threat. One-fifth of all the world’s coral has died since 2015.
As well as the threats from warmer sea temperatures causing coral bleaching, coral reefs are in danger from human activities (such as land-based industries that increase the levels of sediment and pesticides in the ocean) and invasive species (such as the crown-of-thorns starfish). Coastal development for tourism and cities, including land reclamation (see page 96), are also impacting on this vital ecosystem.
Source:
3A How is the coastal environment changing?
Geographers estimate that the world will lose 70 per cent of its living coral by 2030 unless there are significant changes to human activities.
Mangroves provide a wide range of crucial ecosystem services in many tropical areas, including supplying wood, protecting communities from the effects of offshore storms and providing a breeding ground for fish and crustaceans. Despite their importance, at least onefifth of the world’s mangroves have been lost since 1980 – an estimated area of 36 000 square kilometres. Countries such as Kenya, Liberia and Puerto Rico have already lost over 70 per cent of their mangrove forests. Mangroves have been cleared to make way for agricultural land (including palm oil plantations), harbours, housing and fish farms.
Mangroves provide natural protection from wave erosion. Geographers have voiced concerns that clearing them makes communities more vulnerable to the impacts of rising sea levels.
Seagrass beds are an important ecosystem for dugongs and manatees (both large sea mammals) and the leafy seadragon (see Source 13), as well as providing food for hundreds of other species. Seagrass beds are also important for stabilising sediments in the water, absorbing carbon dioxide and protecting against erosion. Over the past 200 years, about 30 per cent of the world’s seagrass beds have disappeared, many of them within the past few decades.

The main threats to seagrass beds and the biodiversity they support are the dredging of the sea bed, the development of tourist marinas, and water pollution from rivers and streams.
Review and understand
1 Describe the important role of mangroves in coastal landscapes. Apply and analyse
2 What ecosystem services are provided by the three coastal habitats discussed? Classify these as sinks, sources, services or spiritual functions (see page 48).
3 Examine Source 11.
Source 12 Mangrove forests in Indonesia have been substantially cleared to make way for rice fields and shrimp farms.
4 Refer to Source 10 on page 56. Identify the key drivers of biodiversity loss in coastal environments.
Evaluate and create
5 Research the threats faced by one coastal species in Australia such as the dugong, orange-bellied parrot, coastal emu, grey nurse shark, marine turtle or sea snake, and present your findings to the class.
a Describe the distribution of the world’s coral reefs using the PQE method (see page 24 of ‘The geography toolkit’).
b Identify the reefs that are projected to be most at risk by 2030.
c Identify the reefs that are projected to be most at risk by 2050.
Source 13 The amazing leafy seadragon is threatened by a loss of seagrass near Australia’s southern cities.

Revise the key terms you have learnt so far.
Source 14 The last of Dunwich’s old churches – photographed in 1908, shortly before it collapsed into the sea
Dunwich is a small coastal village located in south-eastern England. In the thirteenth century, it was one of England’s largest towns. Merchants traded wool, grain, fish, wine and furs across the North Sea to Iceland, the Netherlands and France. Dunwich had eight churches, three chapels and two hospitals.
Large storms in 1286 and 1328 swept large areas of the town into the sea. Because so much material was deposited in the sea, the harbour was blocked by the growth of a large spit. Trade and fishing were ruined and the population declined. By 1347, a quarter of the town had been lost, and the remainder of Dunwich collapsed into the sea over the next few hundred years. Most of the original buildings have gone, including all eight churches. The last one disappeared early in the twentieth century (see Source 14).
The coastline at Dunwich has receded, on average, 1 metre per year. Buildings that sit on top of the present-day cliffs above the eroding waves were once 2 kilometres inland. Storms, tides and longshore drift have all combined to make Dunwich a very different place today.
Creating overlay maps is a useful technique for showing and measuring environmental change. To complete a multiple overlay map, follow these steps:
Step 1 Construct a base map of the region using the current topographic map. This should be traced rather than drawn freehand, to make it as accurate as possible. Include key natural and human features, such as the coastline, towns, roads and the extent of marshes.
Step 2 Add labels such as the names of rivers and towns. Add a north arrow, legend, title, scale and source.
Step 3 On a plastic sheet or piece of tracing paper, construct a map of the same region from the earliest map you
have at the same scale. Remember that this map will sit on top of your base map, so features such as rivers that have remained the same should line up.
Step 4 Place the overlay map carefully on top of the base map and use a piece of tape like a hinge along one side to anchor the overlay in place.

Step 5 Add a title to the overlay map that does not cover the one on the base map. A north arrow, legend, scale and source should not be needed as these are the same as for the base map.
Step 6 Repeat steps 3–5 to complete an overlay from another map of the same region from another time. Hinge this at the opposite side of the base map with a piece of sticky tape. For more information on this key skill, refer to page 26 of ‘The geography toolkit’.
3A How is the coastal environment changing?
1 Construct a multiple overlay map using the current topographic map in Source 16 as the base map. For the first overlay, use the map from the year 200 ce in Source 15. For the second overlay, use the map from 1587 (also in Source 15). Larger versions of these maps are available on your obook pro.
2 Describe the changes that occurred to this coastline between 200 ce and 1587. Was the dominant process during this time erosion or deposition?
3 Identify other features on the 200 ce map that might help to explain the dominant process that occurred between 200 ce and 1587.
4 Describe the changes that have occurred to this coastline since 1587. Is the dominant process erosion or deposition?
5 Estimate the area of lost land since 1587. Do this by multiplying the length of this strip of land by its average width.
Source 15 These maps show the coastline in the region of Dunwich in 200 ce , 1250 and 1587. Source:
1 Some ways to manage coastal change include building sea walls, groynes and breakwaters (see page 102). Which of these measures would you recommend the local authorities adopt to manage erosion on this coastline? Justify your answer.
2 Some Dunwich residents have voiced their support for a managed retreat to protect the coast. Research what a managed retreat is and decide if you agree with the residents that this is a solution. Use evidence from your research to support your decision
In this topic, you will:
» apply environmental, economic and social criteria to evaluate management responses to coastal change.
Many attempts have been made by people in the past to try to control the natural coastal processes of erosion, transportation and deposition. Unfortunately, due to a poor understanding of these processes, attempts have often made problems worse or simply moved them to another part of the coast. In addition, issues were often managed on a local scale without regard for the broader environments that influence the coast, such as river catchments and marine ecosystems.
More recently, a greater understanding of natural processes, as well as a recognition of the widespread impacts of coastal management, has led to new approaches. These include soft engineering (using natural processes), Integrated Coastal Zone Management (ICZM; see page 110) and the protection of coastal ecosystems with special marine reserves (see page 104).


Many people in coastal areas like these hard options, as the results are obvious and immediate. The structures tend to be expensive, however, and tend to have a high impact on natural environments. In many cases, they create other problems – or just move the problem further along the coast.
By comparison, ‘soft engineering’ coastal management techniques use the natural processes of the coast. They are often less expensive than hard engineering options and are considered to be more sustainable as they have less impact on the natural environment. There are two main types of soft engineering – beach nourishment and managed retreat.
• Beach nourishment replaces beach material such as sand that has been removed by erosion or longshore drift (see Source 2). Beaches are a natural defence against erosion and coastal flooding, and are a desirable feature of the landscape for residents and tourists alike. The natural process that eroded the beach in the first place will continue, however, so the beach needs to be nourished again and again.
• Managed retreat involves the relocation of human settlements and hard engineering defences, such as sea walls and groynes, so that the natural processes of erosion and deposition can take place. In many cases, low-lying areas flood, allowing salt marshes, wetlands and mudflats to re-establish themselves in these areas (see Source 3). Over time, these habitats provide a natural defence against further erosion. Unlike many hard engineering techniques, managed retreat can be relatively inexpensive. However, people living in these regions can be unwilling to relocate and need to be compensated for the loss of their properties.
Review and understand
1 Explain why many people in coastal areas like hard engineering techniques.
2 Describe the process that is occurring at Abbotts Hall Farm (see Source 3). Apply and analyse
3B How can coastal changes be managed?

and currents are redistributing this peninsula along the shore, where it is expected to nourish the beaches and form sand dunes.

3 Distinguish between hard and soft engineering techniques.
4 Outline some of the possible positive and negative environmental impacts of beach nourishment.
Evaluate and create
5 Examine Source 4 on page 91
a Which management strategy would you recommend in response to erosion of this coast? Explain your answer.
b Evaluate the strengths and weaknesses of your strategy. What other information would you need to be able to make a more informed recommendation?
In this topic, you will:
» examine the impact of legal protections on coastal environments. 3.8
national park
an area of natural beauty that is protected by law for the use of the general public and the protection of the natural environment
An effective way to manage and protect natural environments such as coasts is to give them legal protection. This helps ensure that harmful activities are banned or limited. In Australia, this is achieved mainly through a system of national parks (on land) and marine reserves (in the surrounding seas and oceans).
Each state and territory of Australia has a large number of special places, both coastal and inland, that the government has decided to protect. These might be as small as a single historic house or beach, or as large as a wilderness. Despite the name, virtually all of Australia’s more than 550 national parks are the responsibility of the individual state and territory governments.

Although management strategies differ between states and territories, the common ideals are that the land, plants and animals within the parks should have protection from activities that threaten their existence, and that people should be able to visit these special places. This can lead to problems, as visitors who come to see these areas in all their natural beauty may threaten the very environment they are visiting. The managers of the national parks have the task of controlling what visitors do in each one by limiting or restricting certain activities in sensitive areas.
While national parks protect special places on land, Australia’s diverse marine environments also need to be protected. In 2012, the Australian Government announced the creation of one of the world’s largest marine reserve networks. Around 3.1 million square kilometres of our oceans are now managed mainly for the purposes of biodiversity conservation. This is an area roughly equivalent to the land area of Queensland and the Northern Territory combined.
Managing a marine reserve is particularly challenging because, unlike national parks on land, fences and signs are not easily erected to limit access to particularly sensitive areas. Instead, marine reserves are divided into zones, and certain activities are allowed, banned or limited in each zone. It is the responsibility of anyone who enters a marine reserve to be aware of the activities permitted within each zone.
Every marine reserve in Australia – except for the Great Barrier Reef, which is recognised as a special case – has been assigned a particular management category (see Source 5). These are the same as those adopted in other countries, and have been developed by the International Union for the Conservation of Nature (IUCN).
Source
The IUCN management categories for the conservation of marine reserves IUCN number Name of reserve type Purpose of the reserve
Ia Strict nature reserve
Managed primarily for scientific research or environmental monitoring
II National park Protected and managed to preserve its natural condition
IV Habitat/species management area
VI Managed resource protected area
Managed primarily to ensure the maintenance of habitats or to meet the requirements of specific species
Managed to ensure long-term protection and maintenance of biological diversity, with a sustainable flow of natural products and services to meet community needs
Santuary and marine national park zone (IUCN Ia and ll)
Recreational use zone (IUCN II and IV)
Habitat protection and conservation park zone (IUCN IV)
Habitat protection zone (Coral Sea IUCN IV)
Special purpose zone (IUCN VI)
Special purpose zone (oil and gas exclusion) (IUCN VI)
Source 6
use zone (IUCN VI)
park General use zone (IUCN VI)
3B How can coastal changes be managed?
Source: Oxford University Press
Review and understand
1 Outline how natural environments are protected in Australia.
2 Describe the ideals that are behind the management strategies implemented in national parks.
Apply and analyse
3 Examine Source 6.
a Where are Australia’s largest marine reserves located?
b Describe the location of marine reserves in the state in which you live.
4 Source 7 is a photo taken by a hiker in a protected coastal area.
a Describe how the hiker may impact on the natural environment.
b Propose two ways park managers in this area could limit these impacts.
Evaluate and create
5 There were many objections to the Australian Government announcement in 2012 that millions of square kilometres of ocean were to become marine reserves. In small groups, consider which Australian groups would be likely to support this announcement and which would be likely to oppose it. Brainstorm the arguments that each of these groups would use to support their points of view.

6 Source 6 shows the extent of Australia’s Exclusive Economic Zone (EEZ). Research this area and find out the benefits for Australia in having such a large EEZ. You may also like to find out about the Timor Gap EEZ and how this was created.
Source 7 Freycine t Marine Reserve on Tasmania’s east coast includes large areas designated as ‘strict nature reserves’ due to the biodiversity of the coast’s offshore seamounts (undersea mountains) and bird populations.
In this topic, you will:
» explain traditional methods of managing coastal landscapes.
Prior to European colonisation in 1788, the coastal areas of Australia supported large numbers of Aboriginal and Torres Strait Islander peoples. The coasts provided a reliable source of food both from the sea and the surrounding land.
Today, nearly half of all Aboriginal and Torres Strait Islander peoples in Australia live near the coast. Many maintain a close association with the coast through cultural and historic connections, through continued use of coastal resources and by law. In the Northern Territory, for example, Aboriginal communities own and manage approximately 85 per cent of the coastal land.
Coastal places with special significance to Aboriginal and Torres Strait Islander peoples are under the same environmental threats as other coastal places, from:
• population and economic growth
• land use changes
• climate change
• the arrival of invasive species.
Aboriginal and Torres Strait Islander communities are now working with government to restore lands that are important to them. This joint approach means that factors of Aboriginal and Torres Strait Islander heritage are taken into account when decisions are made about the use and restoration of degraded areas.
Source 8
The land and waters is a living body.
We the Ngarrindjeri people are a part of its existence. The land and waters must be healthy for the Ngarrindjeri people to be healthy. We are hurting for our Country. The Land is dying, the River is dying, the Kurangk (Coorong) is dying and the Murray Mouth is closing. What does the future hold for us?

Tom Trevorrow, Ngarrindjeri Elder, Camp Coorong, 2002
Source 9 An oblique aerial photograph of the Coorong, Lower Lakes (including Lake Alexandrina and Lake Albert) and Murray Mouth region of South Australia
The region known as the Coorong, where the Murray River reaches the sea, covers an area of 14 000 square kilometres. The Coorong was recognised as a ‘Wetland of International Importance’ and as a breeding ground for many bird and fish species by the Ramsar Convention on Wetlands in 1985. Due to a combination of factors – including water extraction in the Murray–Darling Basin, drought, and barrages (dams) built across the Murray to hold back sea water – the region has become severely degraded. In particular, the waters of the Coorong Lagoon and lakes have become saltier than the sea, wetlands have dried out and acidic soils have become exposed. Another cause of this degradation has been the building of dams that collect water during wet seasons and then release this water during dry seasons. This has disrupted the natural cycle of the Murray River of floods and droughts, and has had a dramatic effect on the natural
ecosystems of the river, particularly at its mouth. In some years, so little water flows through the mouth that it closes, cutting off the lakes of the region from the sea.
The traditional owners of the region, the Ngarrindjeri people, maintain a strong connection with the lands and water of the Coorong. The Ngarrindjeri people believe that the health of their nation is closely linked to the environmental health of the region, and that a freshwater flow that allows plants and animals to thrive must be maintained.
The Ngarrindjeri community, through the Ngarrindjeri Regional Authority (NRA), has formed a close relationship with the South Australian Department of Environment, Water and Natural Resources (DEWNR) to deal with short-term crises in the region and to plan for a sustainable future. This has resulted in the adoption of a long-term plan that aims to secure a future for the region as a ‘healthy, productive and resilient wetland system that maintains its international importance’. The plan includes a number of specific goals:
• to protect and restore natural habitats
• to restore viable populations of native bird, fish and other animal species; restoring the natural flow of fresh water to the Coorong and Lower Lakes are seen as a key component of this goal
• to improve water quality and increase flows through the wetlands; it is proposed, for example, that very salty water be pumped out of the lagoon to the sea
Review and understand
1 Identify why many Aboriginal and Torres Strait Islander peoples lived near the coast in the past.
2 Suggest reasons why Ngarrindjeri people are particularly concerned about the health of the Coorong ecosystems. Apply and analyse
3 Use Source 9 to describe the natural environment of the Coorong and Lower Lakes. Include the water and land features that you can identify.
3B How can coastal changes be managed?
4 Examine Source 10.
a Describe and account for the location of Aboriginal lands.
Source: Oxford University Press
• to recognise the Ngarrindjeri community’s association with the area.
Large areas of dunes, wetlands and farmland have already been replanted using native plant species as the first step in this plan to restore the Coorong area.
b Describe the locations of the barrages. Why have the barrages been built in these places? How would they change the natural environment of Lake Alexandrina and the Coorong?
5 Based on Tom Trevorrow’s statement (Source 8), how would you classify his environmental world view? Justify your answer.
Evaluate and create
6 Research the Ramsar Convention on Wetlands and its goals. Identify which other wetlands in Australia are listed in the Ramsar Convention.
In this topic, you will:
» evaluate an example of a coastal change management response from a ustralia. 3.10
blowout dune a dune that is moving inland as onshore winds carry grains of sand away from
Rainbow Beach is a small community located on a massive dune system that runs along the Queensland coast on the mainland, near the southern tip of Fraser Island. Formed over 2 million years, the dunes are part of one of the world’s greatest sand dune complexes, which includes Fraser Island – the world’s largest sand island. In places, the dune system is 200-metres high and is held in place by large areas of scrub, forest and grasses.
While Aboriginal ownership of the region dates back thousands of years, European occupation began with a sand-mining operation north of the town in the mid-1960s.
A road built to reach the sand mine was soon used by tourists to access Fraser Island and the new town of Rainbow Beach (see Source 11). The sand-mining operation finished in 1976, but the population of the small town continued to grow slowly. Now home to about 1200 fulltime residents, visitor numbers swell in summer holiday periods as people arrive to use the camping ground, as well as several motels and resorts.


The key management issue faced by the region is the erosion of the sand dunes, particularly during storms. This is an example of a potential conflict between natural processes and human activities. Sand dunes naturally change in response to long-term and short-term changes in wind patterns, sand supply and sea levels. The erosion of the foredune (a dune ridge running parallel to the ocean) at Rainbow Beach is a natural event. However, as the erosion is now putting buildings at risk and making the beach unsuitable for recreation activities, some local residents and the Gympie Regional Council are proposing to try to control the erosion.
A study of the region found that the risk of severe dune erosion at Rainbow Beach is very low, but some people are still concerned that during a severe storm important buildings could be lost. The council plans to install 260 metres of large sandbags at the base of the dunes in front of the surf lifesaving tower, to slow erosion and protect a new amenity block that has been built on top of the dunes.
Source 12 A 2009 storm severely eroded the Rainbow Beach foredune, placing the surf lifesaving tower at risk of collapse.
3B How can coastal changes be managed?
There are 2000 Coastcare groups in Australia. Each group is made up of volunteers who work together with local governments to identify problems and then solve them. At Rainbow Beach, the local group has identified the key issues in the area as: loss of native vegetation, the trampling of dune vegetation by visitors

Source 13 Rainbow Beach has a very active Coastcare group.
Review and understand
accessing the beach, sand skiing on the sand blows, coastal erosion, environmental weeds, beach parking and rising sea levels due to climate change.
Some of the projects the Coastcare group at Rainbow Beach has undertaken include restoring native plants and removing weeds, protecting the dunes, monitoring bird populations and improving wetland areas.

Source 14 A range of management strategies are in place at the main beach in Rainbow Beach. The fencing and walkway direct people to enter the beach on this path, protecting surrounding dunes.
Explore it!
A virtual field trip to Rainbow Beach
1 Describe the natural environment of Rainbow Beach.
2 Describe the human activities bringing about change to this place.
3 Explain the purpose of Coastcare. Apply and analyse
4 Is the plan to place sandbags at the base of the dunes an example of hard or soft engineering? Justify your answer.
5 Examine Sources 13 and 14.
6 Compare the changes at Rainbow Beach and the changes at Abbotts Hall Farm in Essex (see Source 3 on page 103). What are the similarities and differences?
Evaluate and create
7 The Little Sand Blow (see Source 11) is increasing in size as it moves westward. Create a flow diagram or field sketch that shows:
• the natural processes responsible for this movement
• the human activities that may be contributing to the movement
a What management strategies can you identify in these sources?
b What is each strategy designed to achieve? Explain how effective you think each will be in achieving its aims.
• the impacts of this movement on the environment
• the possible responses by the local government and Coastcare group.
3.11
In this topic, you will:
» describe the process of Integrated Coastal Zone management
» evaluate an example of a coastal change management response from Bangladesh.
In response to the serious issues facing coastal and marine ecosystems, a major United Nations conference held in 1992, called the Earth Summit, proposed a new system for managing coastal environments. Known as Integrated Coastal Zone Management (ICZM), it is now a widespread practice in many coastal nations, such as New Zealand, India, Canada, Bangladesh and the Netherlands.
Involve all relevant governments
Take a long-term view
Use a holistic approach
Consider local conditions
Work with natural processes
Get people involved
Use a range of approaches
Be prepared to change strategy
The United Nations recognises that one of the common issues associated with coastal management is that government departments and interest groups often propose very different solutions to issues depending on their own needs and interests. In many cases, these solutions ignore the needs of other coastal users. Coastal interest groups include those relating to residents, the tourism industry, fisheries, farmers, forestry, manufacturing, mining, waste disposal, marine transportation and real estate developers.
The key to ICZM is that it seeks to pull together the many groups and individuals with an interest in the coast in an integrated way when devising a management plan (see Source 15). The success of ICZM is dependent on funding, consistent government priorities and the expertise available to organise and manage large projects.

3B How can coastal changes be managed?
Each ICZM plan is designed to best address the issues of the country for which it has been developed. In Bangladesh, for example, the key issues are rising sea levels that bring saltwater floods to low-lying communities, and the impacts of cyclones and storm surges. It is estimated that a 1-metre rise in sea level would leave 17 000 square kilometres of land in Bangladesh submerged and 30 million people without a home (see Source 18). It would affect 1 million hectares of farmland and threaten the freshwater supplies of three major cities.
In response to these threats the Bangladeshi Government, with the assistance of the World Bank and expertise from the Netherlands, has developed an ICZM strategy that focuses on disaster mitigation. To date,

Review and understand
1 In your own words, define ICZM.
150 000 hectares of mangroves have been replanted and more than 2500 cyclone shelters constructed.
2 Explain how and why ICZM has been implemented in Bangladesh.
Apply and analyse
3 Source 1 on page 88 illustrates a range of significant problems that occur in coastal areas. Work with a partner to:
• select one of the examples of coastal degradation shown in this source
• using the eight key principles of ICZM, suggest how people could manage this issue
• present your ideas as a set of written proposals.
4 Compare the management strategies at Rainbow Beach (on page 108) and Bangladesh. What lesson could each community teach the other about dealing with coastal issues?
Evaluate and create
5 Evaluate the implementation of ICZM principles in Bangladesh. Write your evaluation in the form of a short report, addressing the following:
• What do you see as some of the barriers to ICZM being adopted in Bangladesh?
• What do you see as some of the advantages in managing coastal changes using this approach?
• What is your overall impression of ICZM being adopted in Bangladesh?
In this topic, you will:
» evaluate an example of a coastal change management response from the netherlands.
levee
a long wall or embankment built to prevent flooding from the sea
The province of Zeeland in the Netherlands is a large agricultural area that is home to more than 380 000 people. Much of the region lies below sea level. The land has been drained and reclaimed, creating new islands that are linked by bridges and tunnels. The area has an intricate series of levees (known as dykes) and dams that hold back the waters of the North Sea and regulate the flow of the rivers into the sea. The province also supports a large fishing industry, and is home to the largest national park in the Netherlands.
In Zeeland, ICZM is used to reduce flooding from storm surges. The largest of the flood protection dams, the 9-kilometre-long Oosterscheldekering, links two of the largest islands in Zeeland. The 62 steel doors that make up the barrier can be lowered or raised in response to tides, storms and other sea level changes (see Source 19). For most of the year, sea water can flow freely beneath the dam, so that marine ecosystems in the bays and estuaries of the delta can be maintained.

19 The Oosterscheldekering
Source 20 An aerial photograph of Zeeland showing a number of dams and storm surge barriers (including Oosterscheldekering)
The dam, which was opened in 1986, has been declared one of the Seven Wonders of the Modern World and bears a plaque with the words: ‘Here the tide is ruled by the wind, the moon and us [the Dutch].’ However, long-term changes in sea level due to climate change place great pressure on this region and on these amazing engineering works.
The series of dams, storm surge barriers and bridges have provided many benefits for the people of the Zeeland region. As well as protecting them from storm surges and flooding, large areas of former saltwater estuaries have been converted into freshwater lakes, creating a reliable supply of water. The dams and bridges also link together island communities that had been isolated for hundreds of years, and the calmer waters of the river mouths and estuaries are safe for shipping and

Oosterscheldekering
Review and understand
1 Explain why Oosterscheldekering was constructed.
2 Use an atlas to locate the province of Zeeland. Describe its location.
Apply and analyse
3 Use the eight key principles of ICZM (see Source 15 on page 110) to explain the flood protection provided by Oosterscheldekering. For example, how does this barrier take local conditions into account?
4 Examine Sources 20 and 21.
a What factors do you think may be responsible for the large sandbanks forming in the Oosterschelde?
b Identify the different land uses on the island of Schouwen-Duiveland.
c Describe the relief of Schouwen-Duiveland using the contour lines on the map.
d Describe the southern shore of Schouwen-Duiveland.
Evaluate and create
5 Create a sketch map of the vertical aerial photograph in Source 20. On your map, label the key natural and human features of the landscape.
6 Oosterscheldekering is only one part of a much larger flood protection scheme. Use Google Earth to examine the region and find other examples of flood protection.
Revise the key terms you have learnt so far.
On the north-west tip of Western Australia is one of the world’s most spectacular coastal environments: the Ningaloo Coast. Long white beaches run along the shore, and visitors can swim out from the beach to Australia’s longest fringing reef (a reef that lies extremely close to shore). The region is also home to dugongs and visited by humpback whales and greenback turtles.
Much of the region is under some form of legal protection as part of the Ningaloo Marine Reserve and Cape Range National Park. It was also added to the UNESCO World Heritage List in 2011. However, the Ningaloo Coast faces a number of potential environmental threats. These include:
• oil and gas exploration off the coast
• damage to coral reefs from boat owners anchoring in the fragile reef areas
• illegal fishing
• plastic bags killing turtles and whales by intestinal blockage
• vegetation damage from off-road driving
• waste disposal and pollution
• increasing level of water consumption
• potential for bushfires
• invasive species (foxes, goats, cats) destroying or attacking native plants and animals.

Source 22 A newborn green sea turtle makes its way across the sand to the ocean for the first time. Climate change has caused frequent flooding of sea turtle nests.
Complex maps contain more than one set of information. Geographers use complex maps to analyse different features, reveal patterns and explain links between features in a given area. You can analyse a complex map by following these steps:
Step 1 Look carefully at the map and read its title to make sure you understand what is being shown.
Step 2 Examine the map’s legend. Complex maps can have more than one part to a legend, which will be represented on the map in different ways. For example, in Source 23, areas of colour are used to show recreational use zones and state marine reserves. Different symbols are also used –to show roads and coastal water boundaries.
Step 3 Train your eyes to look for one set of information at a time. For example, look at solid blocks of colour on the map and work out what they tell you.
Step 4 Move to a different set of information by selecting another symbol or block of colour from the legend. Examine the map to identify this symbol or colour.
Step 5 Look for concentrations of the same symbol in areas, to see if patterns exist.
Step 6 Note any patterns you can find on the map between different features and locations.
Step 7 Describe the degree to which patterns are connected.
Step 8 Try to suggest reasons for the connection between the two patterns. For more information on this key skill, refer to page 18 of ‘The geography toolkit’.
Look at the map of Ningaloo marine reserve areas (Source 23).
1 Identify the symbol for ‘multiple use marine zones’ in the legend, and then locate these areas on the map.
2 Describe the concentration of multiple use marine zones
3 Describe the relationship between the multiple use marine zones and the location of recreational use marine zones.
4 Describe the location of the Ningaloo World Heritage area.
Do some further reading on the internet to complete the following tasks.
1 Research Ningaloo’s World Heritage listing.
a What doe s ‘World Heritage’ mean?
b Why are sites placed on the World Heritage List?
c Why was the Ningaloo Coast added to the list?
2 In the early 2000s, a large resort and marina called Coral Coast Resort was planned for the coastal area to the north of Coral Bay known as Maud’s Landing. Write a 250-word report that explains why this resort was not built.
3 ‘It is impossible to preserve a natural coastal environment while tourists continue to visit it.’ To what extent do you agree with this statement: A lot (strongly), a little bit (somewhat) or not at all? Write a short paragraph explaining your position.
In this topic, you will:
» explain how geographers can manage environmental change. 3.13
Geographers have an important role to play in the management of environmental change. Because they draw on knowledge and skills from the natural sciences (such as geology, biology, chemistry and physics), the social sciences (such as psychology, history and economics) and humanities (such as philosophy) they are uniquely placed to see the ‘whole picture’ when examining environmental change. Geographers can, for example, consider the reasons why people act in a certain way, and consider the impacts of these actions on the environment. They can also help to explain why people respond to change in different ways and, most importantly, recommend a course of action that is beneficial to both the natural environment and people.
fieldwork geographical study that takes place outside the classroom, at the site of inquiry
Key skill worksheet
Conducting successful fieldwork
When examining environmental change such as coastal erosion, geographers often begin by developing a set of geographical questions. They then set out to answer these questions using a range of geographic tools. One of the most useful tools is fieldwork – visiting the environment being studied and observing it first-hand.
When exploring changes at the coast, geographers use a range of specific techniques. These include constructing cross-sections of dunes, cliffs and other landforms, photographing evidence of change and measuring longshore drift. By visiting the same site at regular intervals (for example, once a year) geographers can also observe changes that have occurred between their visits. It may also be important to visit the site at different times of the year to observe seasonal changes, such as the effects of storm waves during winter or the impacts of holidaymakers during summer.
The following case study is an example of the sort of environmental issues that might be explored by a geographer completing fieldwork.
Hampton Beach lies on Port Phillip Bay, about 15 kilometres south-east of the Melbourne CBD (see Source 1). Over the past century, human interference in the natural processes of erosion, transportation and deposition have brought about dramatic changes in the amount of sand on the beach. To protect roads and homes from coastal erosion, a sea wall was built along the coast in the 1930s. Later, in the 1950s, a breakwater was built at Sandringham Harbour to protect boats from storm waves. The adoption of these management strategies stole the supply of sand to the beach. The sea wall meant that sand from
the dunes no longer fell to the beach, and the breakwater trapped sand moving along the coast under the power of longshore drift.
The local council has responded to the concerns of residents about their disappearing beach by building a series of groynes to trap sand, and by dredging sand from the sea floor and pumping it onto the beach (see Source 2). This top-up of sand needs to be carried out regularly and is an expensive solution to the problem of erosion. Studies show that rising sea levels are adding to the threat of erosion at Australian sandy beaches such as Hampton Beach.
3C How can geographers help to manage coastal changes?


Review and understand
1 Explain why fieldwork is an essential tool for geographers.
2 Explain why geographers are uniquely placed to help describe and manage environmental change. Apply and analyse
3 Determine how successful the groynes at Hampton Beach have been. (You may need to refer to the information about groynes on page 96.)
4 Examine the photographs in Sources 1 to 3. What evidence can you find in these sources that the Sandringham breakwater interrupts the natural process of longshore drift?
5 Look carefully at the photographs on this page Create a series of geographical questions that could be used as the basis of a field trip to Hampton Beach. You may like to begin your questions with the words ‘what’, ‘where’, ‘how’, ‘why’, ‘what impact’ and ‘what should’. Share your questions with a partner and then with the class.
6 Use the guide to conducting successful fieldwork (available on your obook pro) to design a fieldwork investigation at Hampton Beach. Be sure to investigate:
a the causes of coastal erosion
b the effects of coastal erosion
c the responses to coastal erosion.
In this topic, you will:
» identify the tools geographers to investigate and predict environmental change. 3.14
global positioning system (GPS)
a device that uses satellites to accurately pinpoint the location of an object on the Earth’s surface (e.g. a car, a mobile phone) and provide data and directions to help with navigation
geographic information system (GIS)
a software application designed to capture, store, manipulate, analyse, manage and present all kinds of geographical information
digital elevation model (DEM)
a topographic illustration (or digital model) that uses a range of data to generate a 3D representation of the Earth’s surface
Key skill worksheet
Identifying patterns & relationships:
Comparing spatial patterns
Geographers use a range of tools to describe and predict environmental change. These tools may be as simple as direct observation, or measuring and recording the changing width of a beach with a tape measure. Increasingly, however, digital tools are being used to measure change and to help manage dynamic environments such as coasts, forests and farms (see Source 5). These tools rely on the collection of data from sources such as global positioning systems (GPSs), aerial photographs, ships and tide meters. The data collected is then analysed by computer programs and made available for use by geographic information systems (GISs) and digital elevation models (DEMs), as well as other applications.
Global Positioning System (GPS) satellites provide location information anywhere on Earth
Airborne laser scanners produce a digital image of the land while in flight

Ground-based GPS reference stations measure satellite signals
Research vessel

Sampling Echosounders measure the ground underwater
Side scan sonars create images of the sea floor
Seismic reflection systems bounce waves off the sea floor, providing information about the surface
Source 5 Geographers use a range of digital data collection methods.

As more and more coastal communities become concerned about the impacts of rising sea levels due to climate change, there is a greater demand for more advanced methods of monitoring the coastline. This is driving a boom in coastline monitoring through spatial technologies, and is making more data and information about coastal changes available to geographers than ever before.
A DEM shows the relief (or shape) of the land in three dimensions (see Source 6). Much of the data needed to create a DEM is collected from special sensors on satellites or in planes. This data is represented as a raster (grid of squares) and manipulated by technicians to form a model of the Earth’s surface. These models can help geographers ‘see through’ features of the environment, such as coastal waters and forests, to examine the terrain below. They can also be used to predict areas at risk from erosion and other hazards, such as coastal flooding. This information can then be used to help manage the environment and limit the effects of these potential hazards and disasters.
3C How can geographers help to manage coastal changes?
A GIS uses digital data to create a series of maps of a particular landscape. Each map focuses on a different aspect of the environment, such as the ocean depth, salinity, roads, settlements and relief. Using a GIS program, the maps are presented as a series of layers that can be switched on and off. This enables geographers to compare different aspects of the environment and look for interconnections between them.
A GIS is particularly useful in examining and managing change in coastal environments. It allows geographers to isolate different and competing land uses, to see beyond political and physical boundaries, and to measure change over time.
In the Netherlands, the entire 350-kilometre-long Dutch coastline is digitally mapped and measured each year using methods similar to those shown in Source 5. The maps and crosssections produced in this annual survey are compared to the first survey of this kind, which was undertaken in 1990. Areas of coastal erosion and accretion (growth) are clearly displayed on GIS maps, and are used by coastal managers to make changes in coastal defence strategies, such as beach nourishment and sea walls.


Review and understand
1 Identify three reasons why geographers use digital tools.
2 Outline the process by which data is collected to create GISs and DEMs. Apply and analyse
3 Examine Source 6 and answer the following questions.
a What evidence is there that Cairns is under threat of flooding due to a rise in sea levels?
b How could this DEM be useful to city planners?
c Who else would find this model useful?

4 Examine the images of Hampton Beach on page 117 before completing the following tasks.
a Imagine that the local council at Hampton Beach has asked you to suggest a range of digital data collection methods to create a GIS that will assist the council with its management of sand movement and loss at the beach. Describe the most relevant data collection methods to use.
b Sketch the map layers that you think the council would most like to see included in the program.
In this topic, you will:
» use the four spheres model to describe the a ustralian coastal environment
» describe the natural and human factors that impact the coast. 3.15
spatial variations
a term used to describe the way built and natural features (e.g. towns, cities, rivers, mountain ranges, farming regions) are arranged on the Earth’s surface
Each place on the Earth’s surface is unique. In the same way that no two people are exactly alike, natural environments such as forests, glaciers and coasts all differ. The reasons for these spatial variations may be complex, but recognising them is a critical part of understanding why different places have different problems. Geographers examine these differences and use what they find to propose solutions and responses to environmental change and/or issues. These solutions and responses need to be site-specific. They may work in one place but not work in another. Some environments are also more resilient to change than others.
The factors that need to be looked at when considering spatial variations in environments can be divided into two groups – natural factors and human factors.
Geographers often use models to help them understand processes in the natural world. The four spheres model is particularly useful when investigating the natural factors that influence spatial variations. The four spheres that interact to form unique landscapes are:
1 the atmosphere – all the gases that surround the Earth
2 the biosphere – all living things on the Earth (that is, plants, animals, humans and other organisms) and the features they create
3 the hydrosphere – all the water on the Earth (in solid, liquid and gaseous forms)
4 the lithosphere – the outer rocky layer of the Earth (the crust).

Wind moves soft materials, such as sand
Marine organisms such as coral polyps shape the coast
Currents, tides and storms shape the coast
Temperature influences plant and animal growth
Coastal vegetation supports biodiversity, filters sediments and stabilises loose sediments such as sand
Waves are responsible for most of the natural shaping of the coast
The shape of the ocean floor, such as the location of the continental shelf or coral reefs, influences the environment
Ocean bottom type: this may be hard and rocky or soft, sandy and muddy
Source 8 An analysis of an Australian coastal environment using the four spheres model
Rivers carry water and sediments to the coast; the volume of the sediment load is determined by factors such as rainfall, the size of the river basin and its rock type
Up to 80% of the world’s coasts are rocky and steep; the remainder are made up of loose materials, such as sand, mud or gravel
People have always been drawn to the coast. Coastal environments provide us with many services that we need to live and thrive, such as food, shelter, transport, recreation and flat land for building. Areas near the mouths of rivers also provide fresh water and fertile soil. Human influence tends to be concentrated in certain places on the coast where these services are most available. In these places, the coastlines are now so altered by human activities that some geographers refer to them as anthropogenic coasts (see Source 10), meaning humans have become the dominant force in these environments.

Review and understand
1 Identify the four interconnected spheres that make up the Earth. Apply and analyse
2 Identify four ecosystem services that the coast provides us with.
3 Would rocky coasts be more resilient to change than sandy coasts? Explain your answer.
4 Choose a section of coastline you have visited or know well. Describe the natural and human processes that have shaped it.
Evaluate and create
5 In the same way that natural factors can be classified, so too can human factors. One method to classify them is the SHEEPT method. Use this method to classify the human factors listed in Source 10. For more information
Features of an anthropogenic coast
Coastal protection constructions, such as sea walls
Cleared vegetation
Dredged shipping channels
Mining operations including sand mining and oil drilling
Fishing and aquaculture
Coastal agriculture
Forestry
Shipbuilding and other industries
Shipping and port facilities
Dammed rivers for hydroelectric power generation
Naval and other defence operations
Tourism and recreation
Roads
Drained coastal wetlands and salt marshes
Land reclamation
Cities
Source 10 Features of an anthropogenic coast
on the SHEEPT method, refer to page 23 of ‘The geography toolkit’.
6 Select two of the coasts shown in the images in this chapter, for example:
• the Cinque Terre coast (Source 1 on page 86)
• Wamberal (Source 4 on page 91)
• the Coorong (Source 9 on page 106)
• Rainbow Beach (Source 12 on page 108)
• Hampton Beach (Source 1 on page 117).
Write a short report that explains:
• how these two coastal landscapes differ
• why these two coastal landscapes differ.
In your report, be sure to consider the natural and human factors that account for the differences between these two places.
In this topic, you will:
» explain how geographers assess environmental impact in a ustralia.
In Australia, and in many other countries, building projects that are likely to impact on the natural environment must go through a process of environmental assessment. This involves a study of the likely impacts of the proposed project on the environment. The resulting document is called an Environmental Impact Statement (EIS) and is generally prepared by a geographer with specialised training.
When completed, the EIS is submitted to the relevant authority; for example, the state planning ministry. This body then has the authority to stop the project if it believes it will have too great an impact on the environment. Alternatively, the body may request changes to aspects of the project in order to minimise the environmental impacts.
The Ichthys Project (named after the classical Greek word for ‘fish’) is the largest oil and gas mining project in the Northern Territory and one of the largest in the world. It was built by INPEX (a worldwide gas exploration company) and its partners, and includes construction in the Timor Sea and Darwin. Natural gas, an extremely valuable energy
source, is extracted from beneath the Timor Sea and then transported to Darwin through a pipeline laid on the seabed.
The massive project delivers significant social and economic benefits to Australia, bringing jobs, training, business opportunities and advancement for the energy industry.

The three stages of the project – the offshore wells, the pipeline and the onshore facilities at Darwin – were all assessed for their environmental impacts before the project was allowed to proceed.
The onshore processing plant was constructed on Middle Arm Peninsula – to the south of Darwin and close to an existing natural gas plant. The following factors were studied as part of the threeyear environmental assessment of the project:
• the impact of dredging parts of the harbour and the disposal of the dredged material on corals, sea grass and marine animals such as dolphins, dugongs and turtles; this dredging involves the removal of a large rock shoal by methods such as using explosives (three explosions per day for 57 weeks) or specialised dredging machinery
• an increase in underwater noise and the impact of this on dolphins, which use sound to navigate
• impacts on shore birds and wading birds, particularly from the loss of mudflat habitat and the potential for oil spills
• impacts on fish species, including the commercially important barramundi, and on crustaceans, especially mud crabs
• the removal of areas of mangrove forest, including plants listed as vulnerable to extinction, and the possible impacts of increased sedimentation on other areas of mangrove
• disposal of waste water, including sewage from the plant and the village built to house up to 3500 construction workers
• air and noise pollution, and the effects of these on Darwin residents
• greenhouse gas emissions – the project, when completed, will be the largest emitter of greenhouse gases in the Northern Territory and one of the largest in Australia. Based on its assessment of the impacts and potential benefits of the project, the Northern Territory Government allowed it to go ahead, as long as INPEX made a
Review and understand
1 Explain what an Environmental Impact Statement (EIS) is used for.
2 Identify the potential benefits as well as potential negative impacts of the Ichthys Project.
Apply and analyse
3 Examine Source 11
a Estimate the total length of the pipeline.
b Predict three potential impacts of the pipeline. Explain your answer.
4 Describe the changes to the natural environment caused by the building and operation of the plant pictured in Source 12.
3C How can geographers help to manage coastal changes?
number of changes to reduce the potential environmental impact and agreed to a range of recommendations. These included:
• monitoring and researching the health of Darwin Harbour for 40 years
• long-term research into coastal dolphins to assist with their conservation
• a $3 million donation to Charles Darwin University to assist in oil and gas research
• an extensive mapping project covering the natural habitats of the Darwin region.

5 Explain why INPEX would agree to the range of recommendations put forward by
the Northern Territory government.
6 Explain the importance of each of the Northern Territory Government’s recommendations for the natural environment.
Evaluate and create
7 Brainstorm with your classmates what cultural, economic and environmental factors a government would need to consider when deciding whether or not to approve a project like the Ichthys Project.
8 The Adani-owned coal mine in the Queensland Carmichael coal basin is one of the most controversial mining projects ever proposed in Australia. Research this project to find out what makes it so controversial, with a particular focus on environmental impacts.
In this topic, you will:
» explain how geographers propose responses to environmental change.
Once an environmental issue has been identified and assessed, it is often necessary to come up with a suitable response. The environmental response must be individually designed for that particular environment. Management responses that are effective in one place may be ineffective or even damaging in other places.
When considering a suitable response to environmental issues, important questions to ask include:
•Does the response deal with the causes of the issue as well as its effects?
•Is the response affordable in both the short and long term?
•Is the response beneficial to all natural environments, or does it just move the problem and perhaps result in greater environmental changes in another place?
•Is the response fair to all of the relevant stakeholders?
Sand mining is having a serious environmental impact on the coastal environment in the African nation of Sierra Leone. The capital city, Freetown, is experiencing a population and building boom. The population is growing by about 70 000 people per year and there is a growing demand for new housing, as well as for commercial and industrial buildings. Many of these buildings are made from concrete, which requires vast quantities of cheap, good-quality sand.
Sand-mining operations can involve up to 40 trucks at a time, each with a team of diggers, who shovel sand from a beach. This process is creating changes in both the natural environment (as the sea is able to penetrate further inland) and the human environment. Local residents are being affected as the remaining dunes are eroding rapidly and houses are falling into the sea.

Sierra Leone is trying to build a viable tourism industry to boost the nation’s economy, but tourist resorts are in danger of losing their beaches.
A possible response to this problem would be to declare sand mining illegal and arrest those who continue to take sand from the beaches. Another possible response would be to import sand from other places.
Some of the factors to consider when planning a response to the issue of sand mining in Sierra Leone are:
• Sierra Leone is one of the world’s poorest countries. Sand mining provides a source of income for hundreds of men and their families.
• As Sierra Leone is a developing country, the levels of technology in industries such as transport and mining are low.
• Coastal areas are often heavily used for many purposes: for fishing, residences, tourism and recreation, as well as a source of building materials.
• As dunes disappear, coastal erosion is accelerating and is now up to 6 metres per year in some places.
• Global climate change is expected to raise sea levels on this coast and to increase the number and severity of storms generating large, destructive waves.
• Corrupt local officials accept payments from the construction companies to continue sand mining.
Part of a geographer’s role is to evaluate the strengths and weaknesses of responses to environmental, economic and social issues. When evaluating possible responses to environmental issues such as the one in Sierra Leone, follow these steps:
Step 1 Read the background information carefully and make sure that you understand it. Conduct some additional research on the issue if anything is unclear.
Step 2 In some cases, you may need to suggest your own responses to environmental issues. In other cases, you will evaluate responses suggested by others; for example, in the case of Sierra Leone, consider the following responses:
• Response 1 – Declare sand mining illegal and arrest those who continue to take sand from beaches
• Response 2 – Import sand from other places.
Step 3 Develop a set of criteria to evaluate each of the suggested responses.
Review and understand
1 Explain why beach sand mining is a problem.
2 Explain why the Sierra Leone Government does not simply ban beach sand mining.
Apply and analyse
3 a Identify the effects of sand mining.
These criteria should consider all sides of the issue; for example, economic viability, environmental sustainability and social justice.
Step 4 Create a table to evaluate each response against each criterion. You may like to use symbols, such as:
• ✓ – criterion met
• % – criterion partly met
• × – criterion not met
• ? – unsure.
Step 5 Use the data in your table to select the best response to the issue. You may need to reconsider particular aspects of the response (and make modifications), or combine aspects of more than one response, to come up with the best solution.
Step 6 Based on your evaluation, present your final recommendation. Include maps and diagrams to help describe the proposal and the intended benefits.
1 Follow the steps to develop a sustainable response to beach sand mining in Sierra Leone.
For more information on this key skill, refer to page 33 of ‘The geography toolkit’.
b Rank them from the most to least significant in terms of the severity of environmental impact.
c Using the information in this topic and your own knowledge, analyse one of the highest-ranking effects of sand mining that you identified in question 3a.
Evaluate and create
4 Using Source 10 on page 121, identify the human factors that are shaping the coastline of Sierra Leone.
a Compare these to the human factors shaping the coastline at Hampton Beach (see page 116).
b Propose one strategy to combat the effects of these human factors in both places.
c Evaluate your strategy by listing its strengths and weaknesses before making an overall judgment about how strong it is.
Revise the key terms you have learnt so far.
The Gulf of Mexico lies between the United States, Mexico and Cuba, and contains one of the world’s busiest oilfields. There are almost 3200 active oil wells in the Gulf, along with a further 27 000 abandoned oil wells.
In April 2010, the Deepwater Horizon – an active oil well operated by British Petroleum (BP) –exploded and sank to the sea floor, 1500 metres below the surface. Oil gushed from the well for three months, while BP and American authorities tried desperately to plug the hole. The results were catastrophic. An oil slick covering 1500 square kilometres started moving towards the American coastline. Thousands of sea birds, fish, dolphins and turtles were covered in oil and died. Other animals along the shoreline, such as crabs and molluscs, were also badly affected. Local industries such as fishing and tourism collapsed, and many people lost their livelihoods.
In the case of an environmental accident, the impacts of the accident usually have multiple causes. Geographers try to go beyond the direct cause (the oil well blew up) to explore other indirect factors that influenced the course and extent of the impacts. These are generally a combination of natural processes and human activities.
As we saw in Rich task 3B on page 114, complex maps are maps that contain more than one set of information. Geographers use complex maps to analyse different features, reveal patterns and explain links between features in a given area. You can analyse a complex map by following these steps:
Step 1 Look carefully at the map and read its title to make sure you understand what is being shown.
Step 2 Examine the map’s legend. Complex maps can have more than one part to a legend, and these parts will
be represented on the map in different ways.
Step 3 Train your eyes to look for one set of information at a time. For example, look at solid blocks of colour on the map and work out what they tell you.
Step 4 Move to a different set of information by selecting another symbol or block of colour from the legend. Examine the map to identify this symbol or colour.

Step 5 Look for concentrations of the same symbol in areas, to see if patterns exist.
Step 6 Note any patterns you can find on the map between different features and locations.
Step 7 Describe the degree to which patterns are connected.
Step 8 Try to suggest reasons for the connection between the two patterns. For more information on this key skill, refer to page 18 of ‘The geography toolkit’.
3C How can geographers help to manage coastal changes?
1 Using Source 14, analyse the causes and effects of the Gulf of Mexico oil spill. A larger version is available on your obook pro. Once you have completed your analysis, fill in a table like the one in Source 15 as a way of organising your results. An example has been done for you.
In addition to complex maps, geographers use information from a range of other sources to explain how the impacts of the accident progressed and to look at the longer-term impacts on the environment.
Research the Gulf of Mexico oil spill on the internet before answering the following questions.
1 Can you identify any contributing factors to the accident that are not shown on Source 14 (for example, any economic or technological factors)? What was their role in the accident? Add these factors to a table like the one in Source 16.
2 Since 2000, more oil wells have been drilled in much deeper water than in the past. Some experts believe that this was an important factor in this disaster. Why do you think wells are now being drilled in much deeper water?
Source 15
Physical

14
Features of the seabed
Location of coastal marshes
Natural processes Ocean currents in the Gulf
Demographics
Distribution of towns and cities
Location of oil refineries and oil rigs
Source 16
Economic factors
Level of development of the United States
Importance of oil in the US economy
Importance of tourism and fishing industries
Technological factors Operation of oil refineries and oil rigs
Technical failure of oil rig

1 Identify two natural processes that change the coastal environment. (2 marks)
2 Using specific examples, explain how the reduction of biodiversity in coastal environments occurs. (5 marks)
3 Analyse why coasts are particularly vulnerable to the impacts of climate change. (3 marks)
(Total: 10 marks)
1 Outline why groynes are built in some coastal environments. (2 marks)
2 Summarise the valuable role played by Aboriginal and Torres Strait Islander peoples in the management of coastal environments in Australia. Use one specific example to support your answer. (2 marks)
3 Discuss why Integrated Coastal Zone Management (ICZM) is a better way to manage change at the coast than methods that were used in the past. Use specific examples of management strategies in your answer. (6 marks)
(Total: 10 marks)
1 Outline what GIS mapping is. (2 marks)
2 Explain the ways in which decisions made in the past are impacting the coastal environment of Hampton Beach today. (3 marks)
3 Compare the coastal changes at Hampton Beach in Melbourne and Hamilton Beach in Sierra Leone. What are some of the key similarities and key differences? (5 marks)
(Total: 10 marks)
Examine Source 17 and use your skills in interpreting satellite images to answer the questions below.


1 Locate the Nakdong River in Source 17 Describe the changes that have occurred to the three small islands at the mouth of the river between 1988 and 2017. (2 marks)
2 Identify and describe the natural process that has been responsible for the change in these islands. (3 marks)
3 Locate Gadeok Island in Source 17
Describe the changes that have occurred on the northern tip of this island between 1988 and 2017. (3 marks)
4 Identify and describe the human activity that has been responsible for these changes. (3 marks)
5 Identify and describe three coastal changes that have occured to the coastline at the port of Busan between 1988 and 2017. (3 marks)
6 In a carefully worded paragraph, explain the probable causes of these coastal changes. Include both direct and indirect causes of change. (6 marks)
(Total: 20 marks)
Play a game of Quizlet on Coastal change and management.

Chapter review quiz Chapter 3

In 2019, Time Magazine called South Africa the ‘World’s Most Unequal Country’. Like many places around the world today, there are huge differences between the way people in some parts of the country live compared with others. The access they have to food and fresh water, the types of houses in which they live, their levels of education, access to health care and levels of employment vary enormously across the country.
Geographers are interested in measuring these variations and exploring the reasons why they exist. Studying the links between these factors gives geographers an idea of the level of wellbeing in different populations. Human wellbeing is an overall measure of the ability of human beings to access the things they need to live happy and healthy lives.

4A
How does wellbeing vary around the world?
4B
How does wellbeing vary within countries?
In this topic, you will:
» define the factors that contribute to wellbeing
wellbeing
the ability of human beings to access the things they need in order to live happy and healthy lives (e.g. food, water, education, safety and security)
Geographers define human wellbeing as the ability of people to access the things they need to live happy, healthy and contented lives. Whether a person is born in a refugee camp in Tanzania, a megacity in China, a rural town in France or a coastal city in Australia, their primary requirements for life are the same. These requirements include fresh water, a secure food supply, shelter, clothing and safety. Once these primary needs have been met, secondary needs – such as the ability to make a decent living, good health and access to education –become important in determining an individual’s level of wellbeing.
Our access to the basic necessities of life are determined largely by our degree of wealth and our ability to earn a living. Wealth is generated by producing and selling things, earning wages from work, making investments or owning assets. If we have enough wealth, we can use it to access a wide variety of goods and services. If we do not, we may struggle to buy things such as food, medicine and tools that we could use to generate more wealth (see Source 1). There are huge variations in wealth across the globe. It is estimated, for example, that the wealthiest 1 per cent of adults own 44 per cent of the world’s assets, and that the 26 richest people in the world have a greater combined wealth than the world’s 3.5 billion poorest people combined.

Source 1 The United States is home to more billionaires than any other country. However, as in all countries, wealth is unevenly distributed.
Human health is affected by a wide range of factors. Clean air, clean water and a secure supply of nutritious food are all vital, but other factors are also important. These include the ability of a community to treat and control the spread of diseases, provide health care when individuals are sick or injured, care for the vulnerable such as babies and the aged, and provide emergency services in times of crisis. Access to health care is vital during natural disasters such as a drought or human-made disasters such as war, which can limit supplies of food and water. People living in war-torn countries often struggle to find the basic requirements needed for a healthy life.

Source 2 People in Singapore enjoy one of the world’s best health-care systems. A baby born in Singapore is 50 times more likely to survive their first year of life than a baby born in Pakistan.
4A How does wellbeing vary around the world?
Access to a formal education is viewed by many people as the key to improving wellbeing. Being able to read and write gives people access to a greater number of services, and provides a range of options that can lead to better jobs, higher wages and improved standards of living. Education also increases people’s self-esteem and allows them to have more control over their future.
In many countries, poverty and conflict are the two major reasons why children do not attend school. Further, education can be especially difficult for girls to obtain, because in a great number of cultures, educating boys is seen as more worthwhile. While parents may work hard to send their sons to school, they may prefer to have their daughters helping out at home.
Despite these obstacles, rates of schooling and literacy (the ability to read and write) are increasing around the world. For example, in the countries of Africa that lie south of the Sahara Desert (a region known as Sub-Saharan Africa), the enrolment rates of children in primary school rose from 54 per cent in 1970 to 98 per cent in 2020. In wealthy countries, such as Australia, New Zealand and the United States, primary education is seen as so valuable that it is made compulsory, free and universal.

Source 3 In 2021, about 74 per cent of Indian adults could read and write. This compares with a rate of just 12 per cent in 1947. Despite this dramatic improvement, India is home to the world’s largest number of illiterate people.
Review and understand
1 Define ‘human wellbeing’ in your own words.
2 Explain why access to education is seen by many as the key to improving wellbeing.
Apply and analyse
3 Distinguish between primary requirements and secondary requirements for wellbeing.
4 Describe the contrasts in wealth shown in Source 1.
5 Suggest possible reasons why survival rates of babies born in Singapore are so much better than those in Pakistan.
Evaluate and create
6 Conduct some research to discuss wellbeing in Australia. Use the headings ‘wealth’, ‘health’ and ‘education’ to guide your discussions.
7 Which photograph in this topic best shows what wellbeing means to you? Justify (give reasons for) your answer.
In this topic, you will:
» compare indicators and concepts of human wellbeing.
culture
a term used to describe the shared characteristics (e.g. language, food, religion, beliefs, etc.) of a population or group of people
Gross Domestic Product (GDP)
the total monetary value of all the goods and services produced by a country over a specific time period (usually a year)
literacy rates
statistical measures of the percentage of adults (over the age of 15) in an area or population that can read and write
The way in which we define wellbeing is dependent on many factors. These include our values, beliefs, history, environment, level of education and culture. People from different environments and cultures often view wellbeing in vastly different ways.
Geographers often rely on a range of quantitative data to measure and compare levels of wellbeing around the world. Two of the most common measures used today are Gross Domestic Product (GDP) and literacy rates. These measures are referred to as universal indicators because, while they are not perfect, the data they provide is easily obtained and allows geographers to make basic international comparisons.
GDP provides a measure of the total market value (i.e. the monetary value) of all the goods and services produced in a country in a given year. By dividing the GDP of a country by the total number of people living there, the GDP per capita can be calculated. This gives an approximation of the value of goods and services produced per person in the country each year. This data is then used to assess the average productivity and wealth of individuals. Literacy rates give an indication of the number of people in a population who are able to read and write. Data relating to literacy is often used as a measure of educational results in different countries. In general, low levels of literacy and education can impede the economic development of a country and negatively affect wellbeing.
Many Aboriginal and Torres Strait Islander peoples have a view of wellbeing based on traditional beliefs of interrelationships between individuals, their community and the land. Wellbeing is achieved when the relationships between these factors work together in harmony. This is often described as a holistic view of wellbeing. Importantly, ill-health will arise and persist when the harmony of these relationships is disrupted.

Source 4 For Aboriginal and Torres Strait Islander peoples, wellbeing is partly determined by connection to the land.
It can therefore be difficult to measure the wellbeing of Aboriginal and Torres Strait Islander Australians using only the common universal indicators. The Australian Bureau of Statistics has attempted to develop a model that takes into account Aboriginal and Torres Strait Islander values when considering wellbeing levels. As well as using measures of health, literacy and wealth, this model includes wellbeing measures related to an individual’s connection to their community, ancestry, cultural traditions and identity, land and spirituality.
Source 5
It’s easy to mine the land and fish the seas and get rich. Yet we believe you cannot have a prosperous nation in the long run that does not conserve its natural environment or take care of the wellbeing of its people, which is being borne out by what is happening to the outside world.
Thakur Singh Powdyel, Bhutan’s Minister of Education
Since 1971, the tiny Himalayan country of Bhutan has rejected GDP as the way to measure the wellbeing of its people and instead adopted a measure known as Gross National Happiness (GNH). While this might seem like nothing more than a good idea, in Bhutan it is taken very seriously. A GNH measure is taken every year, as the country’s government attempts to move its citizens towards a happier state.
The four guiding principles of GNH are equitable social development, cultural preservation, conservation of the environment and promotion of good governance. Children are taught these principles at school, along with better environmental practices and basic agriculture. At school, bells have been
Review and understand
1 Outline what GDP measures.
replaced with soothing music and there are daily meditation sessions.
In a study that measured happiness in 178 countries, the Bhutanese ranked as the eighth happiest people on the planet. Bhutan was the only country in the top 20 with a low GDP.

Source 6 Since 1971, GNH has replaced GDP as the measure of wellbeing in Bhutan.
2 Explain how GDP is used as an indicator of wellbeing.
Apply and analyse
3 Apply the geographical concept of place to explain why wellbeing is closely linked to the land for many Aboriginal and Torres Strait Islander Australians.
4 Australia has not adopted GNH as a measure of wellbeing. Suggest one reason why this might be the case.
5 Compare GDP with GNH. What are their similarities? What are their differences?
Evaluate and create
6 What are some important aspects of your own wellbeing? Compare the ways they are similar to or different from the measures of wellbeing in this topic.
7 The New Zealand Government recently began to measure wellbeing using a measure called the Living Standards Framework (LSF). Research the LSF and list two strengths and two weaknesses in how it measures wellbeing.
Map it!
World: Happy planet index
In this topic, you will:
» describe the range o f maps geographers use to explore the spatial patterns of wellbeing.
Human Development Index (HDI)
a tool developed by the United Nations to grade and rank the social and economic development of the world’s countries in order from most to least developed choropleth maps maps that display data or characteristics (e.g. HDI rankings) across an area by using colour or shade to represent the value of the data (e.g. dark green for high rankings and light green for low rankings)
life expectancy
a statistical measure of the average number of years a person in an area of population can expect to live from the year in which they were born
Key skill worksheet
Analysing maps: Mapping wellbeing
cartogram
a type of map that is distorted to show a representation of statistical data, rather than land area
Geographers use a range of maps to explore the spatial patterns in wellbeing within and between countries. Maps can be used to show variations in wellbeing around the world using specific indicators, such as the Human Development Index (HDI), or levels of poverty. By using a range of different mapping techniques, geographers can easily identify if countries with a high proportion of people living in poverty are clustered together or spread across the globe. They can then use this information to make comparisons and draw conclusions about the level of wellbeing in these places.
Choropleth maps give a quick impression of a spatial pattern by using dark and light shades of the same or similar colours. Darker shades usually show ‘the most’ and lighter shades show ‘the least’. In Source 7, for example, countries are shaded according to their HDI rating. This measure, developed by the United Nations, combines several indicators into a single measure. The world’s countries are ranked using indicators of health ( life expectancy), education (literacy) and income (GDP). This ranking is then used to place the world’s countries into four categories, ranging from ‘very high’ HDI to ‘low’ HDI. The United Nations uses the same measure each year in its annual Human Development Report, so that a country’s scores, rankings and categories are regularly updated.
Source 7 Mapping wellbeing using a choropleth map
Source: Oxford University Press
A cartogram is a type of map that displays countries in roughly their correct geographic locations, but the size of countries is determined by the variable being mapped. For example, in Source 8, the size of each country is determined by the proportion of the population that is living in poverty within that country. The larger the country is shown on this map, the greater the proportion of people living in poverty in that country. The colours are added to the map to divide the world into geographic regions so that different cartograms can be easily compared.
4A How does wellbeing vary around the

Source 8 Mapping wellbeing using a cartogram
Geographic information system (GIS) maps display data as a series of layers of digital information. Each layer of the map focuses on a different aspect of the environment, such as poverty, population, roads, settlements or land relief. When using a GIS program, geographers can switch layers on and off, allowing them to compare different aspects of the environment and look for interconnections between them.
International organisations such as the World Bank are increasingly using GIS technology to map their activities and projects.
Review and understand


9 A screenshot of a World Bank GIS map exploring the link between topography and accessibility in Papua
1 Identify what the HDI is and what is it used for.
2 Explain what a cartogram is and why a geographer might use one.
Apply and analyse
3 Do you think cartograms or choropleth maps are more useful for investigating variations in patterns of wellbeing?
Explain your answer.
4 Imagine that you are creating a GIS map to explore the links between wellbeing and natural resources. Determine (decide) which map layers would be useful to you when creating this map. Explain your answer.
Evaluate and create
5 Use the ‘World statistics’ section in your obook pro to complete this task.
a Form groups of three. Have each person conduct some research on a different indicator of wellbeing in South America: GDP, literacy rates or life expectancy.
b With your data, each create a choropleth map for the countries of South America. Use the same colours or shades for all the maps.
c Place the maps on the classroom wall beside each other so that you can easily compare them. What similarities do you notice? What are some of the key differences?
In this topic, you will:
» explore links between wellbeing using scatterplots
» practise constructing a scatterplot using Microsoft e xcel.
scatterplot
a type of graph that uses two sets of data by plotting points along two axes, the pattern of which shows their correlation; also called a scattergraph or scattergram correlation a statistical measure that indicates the extent to which two or more variables are related or linked
Worksheet
Links between wealth and wellbeing
Aspects of wellbeing such as health, wealth and education are usually closely related. A change in one aspect of a person’s wellbeing usually affects other aspects of their wellbeing. For example, children who attend school tend to have better health than those who do not. Links such as these can be seen at the national scale as well as at the local scale. One of the most useful tools when exploring these links is a special type of graph known as a scatterplot.
Scatterplots are similar to line graphs in that they are used to display data plotted against two variables. Scatterplots are used by geographers to show the degree to which one of the variables shown on the graph is related to the other. This relationship is known as the correlation. Commonly, scatterplots show data for a number of countries, each of which is represented by a dot on the graph.
•When the dots come close to forming a straight line, they are closely related and therefore are said to have a ‘high correlation’.
•When the dots do not come close to forming a straight line, they are not closely related and therefore are said to have a ‘low correlation’.
•When the trend is increasing, the correlation is positive.
•When the trend is decreasing, the correlation is negative.
A trend line is often added to a scatterplot to demonstrate the strength of the relationship between the two variables.
Source 11 shows a selection of the most common trends that can are seen on a scatterplot. With the introduction of digital graphing tools, it has been possible to add more data to make scatterplots even more useful. Three variables can now be graphed to create a 3D scatterplot. In Source 10, for example, the size of each dot is determined by the size of the population of the country. By animating graphs, it is also possible to show changes in variables and their correlation over time.

Source 10 This scatterplot taken from the Gapminder website is exploring the correlation between life expectancy and fertility (babies per woman) worldwide.
Source 11 Simple scatterplots showing different types of correlation
You can use a computer program such as Microsoft Excel to construct a scatterplot and show the correlation between two variables. (Note: These instructions may need to be varied a little, depending on the version of the program you are using.)
Step 1 Enter the data into an Excel spreadsheet. The first indicator goes into column A and the second into column B. The data for each country must go into a separate cell (box) on the spreadsheet.
Step 2 Highlight all of the cells containing data.
Step 3 Using the menu at the top of the spreadsheet, select ‘insert’ → ‘scatter’ → ‘the first scatterplot’. This will convert your data into a scatterplot.
Step 4 The vertical axis usually defaults to begin at zero, but the correlation is often easier to see if it begins slightly less than the lowest value being graphed. Look at your graph and decide what you would
Review and understand
1 Explain the purpose of scatterplots.
2 Define the word ‘correlation’. Apply and analyse
like as the lowest value on the vertical axis. Use ‘format’ → ‘chart elements’ → ‘vertical (value) axis’ → ‘format selection’, and enter the value you have decided on in the ‘minimum bounds’ box. You can use this menu to make other changes to the axes as required. Close the menu.
Step 5 Right click on one of the dots on the graph and select ‘add trend line’.
Step 6 Use the chart design dropdown ‘add chart element’ menus to turn off the gridlines and the legend. Add a title and label the axes.
1 Use the ‘World statistics’ section in your obook pro to find the life expectancy and GDP rates for all the countries of Oceania. With this data, construct a scatterplot exploring the links between life expectancy and GDP per person for the countries of Oceania.
For more information on this key skill, refer to page 26 of ‘The geography toolkit’.
Weblink Gapminder
a Identify the number of outliers in Source 10.
b Suggest two reasons why these countries might not conform to the general pattern.
Evaluate and create
3 In your own words, describe the relationship between life expectancy and fertility, as shown in Source 10
4 Scatterplots often contain one or two countries that do not conform to the general pattern and sit apart from most other countries on the graph. These are called outliers.
5 Visit the Gapminder website and scroll down to ‘Animating data’. Click the ‘play’ button to see how countries have changed over time. Explore the graphs on this website by selecting different indicators for each axis and observing the ways in which their correlation changes. Statistics database World Statistics Data
In this topic, you will:
» examine issues affecting the development of the Democratic republic of the Congo.
By any measure, the world’s wealth is unevenly distributed and has been since European nations explored the world 500 years ago, colonising nations in the search for resources that would improve their wellbeing. As we saw in topic 4.2, a country’s wealth is usually measured by evaluating its GDP. This is done by determining the size of its economy – by adding the total value of all goods and services produced during a year. To make meaningful comparisons between countries with different size populations, the total GDP is divided by the size of the population to produce a measure known as ‘GDP per capita’. Source 12 shows the GDP per capita of countries worldwide, together with the location of the world’s 10 richest countries and the world’s 10 poorest countries.

3000 to 6000
Under 3000
No data available
Richest countries
Poorest countries
Source : Oxford University Press
In Sub-Saharan Africa, about 40 per cent of the population lives below the poverty line. The poverty line is the estimated minimum level of income needed to secure the necessities of life, such as food, water and shelter, and is currently estimated at US$1.90 a day.
While this proportion has decreased over the past few decades, it still leaves 430 million people living in absolute poverty. Over 66 million of these live in the largest Sub-Saharan country, the Democratic Republic of the Congo (DRC), which is one of the world’s poorest nations.
The DRC has vast natural resource wealth, including fertile soil, vast hydroelectric power potential, and some of the world’s
largest deposits of precious minerals and metals – including those necessary to produce new technologies, such as lithium and cobalt. It has been estimated that the DRC contains US$24 trillion of untapped mineral wealth. The mining industry, however, is riven by corruption, where individual DRC labourers work in appalling conditions for very low rates of pay. For many people in rural areas, however, it provides one of the only opportunities for ongoing work. Minerals such as gold are seen by many as a road to wealth and worth fighting for. This has resulted in armed conflict in some districts. It is also taking workers away from farming, leaving the country without enough food to feed its people. Some people living in poverty in rural areas have fled to large cities – such as the capital, Kinshasa – in the hope of improving their wellbeing.


Map it!
The Democratic Republic

Review and understand
1 Define the term ‘poverty line’.
2 Using Source 12:
a List the world's 10 poorest countries.
b Identify the region of these 10 countries.
c List the world’s 10 richest countries.
Apply and analyse
3 Examine Source 13.
a Describe the relationship in the DRC between:
i mineral deposits and poverty
ii city living and poverty.
b Summarise the issues affecting the development of the DRC.
c Describe the pattern of poverty within the DRC using the PQE method. Use the names of specific places in your description.
4 Many people in the DRC are moving to Kinshasa.
a Use Source 13 to explain why this may be the case.
b Predict three problems a big influx of migrants might cause for the city and its people.
c Propose (put forward) one possible solution that the city of Kashana could use to help overcome one of the problems you listed in part b.
Evaluate and create
5 Using the internet, research additional information to complete the following task:
• Brainstorm the factors that might help to explain why global wealth is so unevenly distributed, especially between countries labelled green and red in Source 12.
• Try to think of as many reasons as you can and then classify them into groups of factors. Decide on headings for these groups.
4A How does wellbeing vary around the world?
In this topic, you will:
» examine the unequal distribution of health indicators in the world.
infant mortality rates statistical measures of the proportion of children in an area or population under the age of 12 months who die; expressed as number of deaths per 1000 live births
In some countries, people struggle to obtain the most basic health-care services, and doctors work in hospitals that are old and poorly equipped. In other countries, hospitals have state-of-the-art facilities and access to the newest treatments and drugs. While it is easy to see how unevenly distributed health services are across the world, the level of health and its contribution to the wellbeing of a community or country is a complex concept. There are many other variables that can affect the health of people, including diet and other lifestyle factors.

For these reasons, geographers rely on indicators of health – such as life expectancy and infant mortality rates – to measure and compare the health of individuals within countries. Other indicators – such as the number of doctors per 1000 people and access to reliable water – can also be used to examine the reasons why health differs between countries.
developed countries
Source
Life expectancy is the average number of years that a person can expect to live. For people in developing countries, life expectancy is generally shorter than for people in developed countries. A child born in Sub-Saharan Africa in 2018, for example, can expect to live for 61 years, while a child born on the same day in Singapore can expect to live for 86 years –25 years longer. The lower life expectancy in Sub-Saharan Africa is due to a wide range of factors, including the presence of diseases such as malaria and HIV/AIDS, poor water and food security, and poor access to health care.
The DRC has one of the lowest life expectancies in the world, with a baby born today expected to live to the age of 61. For children born in developing countries, the first year of life is often the most difficult. The proportion of children who die in their first year – known as the infant mortality rate – is 62 per 1000 births, whereas in Australia it is 3 per 1000 births, meaning that a Congolese child is 20 times more likely to die in their first year than a child born in Australia.
Studies of infant mortality in developing countries have discovered some specific factors that put children at higher levels of risk. Children and their mothers are much more vulnerable in rural areas than in cities. Women in cities tend to give birth in hospitals and health clinics, while women in rural areas often
give birth at home without a nurse or doctor present. Children born to educated mothers, even those with only a primary school level of education, also have a higher survival rate. In some regions, survival rates can be up to three times greater than for children of uneducated mothers.
Mariam (see Source 16) is five months’ pregnant with her sixth child. She lives in the village of Lukweti, in the east of the DRC. There are no health clinics in the village, so she must walk to a mobile clinic delivered by doctors and nurses from the charity group Doctors Without Borders (Médecins Sans Frontières) for her monthly check-up. The area in which she lives has seen ongoing conflict and violence for several years, and soldiers often loot any medical facilities for medicines and supplies.

Source 17 Indicators of health in the DRC and Australia

4A How does wellbeing vary around the world?
Worksheet Indicators of wellbeing
Infant mortality rate (children who die in their first year)62 per 1000 births3 per 1000 births
Maternal mortality rate (mothers who die as a result of pregnancy or childbirth) 473 per 100 000 births
per 100 000 births Population who drink from an unsafe water source
Review and understand
1 List two variables that affect the health of people.
2 In your own words, explain the links between poverty and indicators of health such as life expectancy and infant mortality.
3 Define the term ‘infant mortality rate’. Apply and analyse
4 Using Source 15, describe the distribution of countries with life expectancies below 65.
5 Compare Source 15 with the map showing GDP per capita in Source 12 of topic 4.5 (page 140). Describe the relationships you see between these two indicators, using evidence from the maps to support your description.
6 a Explain the health risk factors Mariam faces during pregnancy and childbirth.
b Suggest how these risk factors might be different to a woman in Melbourne experiencing pregnancy.
Evaluate and create
7 Use the data in Source 17 to complete the following tasks:
a Write a paragraph comparing levels of health in the DRC and Australia.
b To support your paragraph, create a simple bar graph using data about one health indicator.
8 One well-known organisation addressing inequalities in health is Doctors Without Borders, known more commonly by its French name, Médecins Sans Frontières (MSF). Using the internet, research this organisation to find out where it works and how it improves the health of people in developing countries.
In this topic, you will:
» examine the unequal distribution of education in the world.
Education provides much more than the opportunity to read, write and count. It is seen by many international aid agencies and experts in the field as the key to helping people, communities and nations lift themselves out of poverty. Education provides individuals with opportunities to:
•become more engaged with society
•have a range of skills and tools to better care for themselves and their children
•participate in the workforce and improve their country’s economy
•live healthier lives

•combat poverty
•reduce inequalities in wellbeing.
Literacy rates measure the percentage of adults who can read and write, and are often used as an indicator of education levels within countries. Literacy rates can be difficult to calculate, however, as many countries do not keep accurate data.
It is also important to be aware of potential variations in literacy within countries. For example, in many countries people in rural areas have lower literacy levels than citydwellers. In some countries, girls are not given the same educational opportunities as boys.
Source 18 The United Nations agency UNICEF is working to increase the proportion of en who attend school in the DRC. It estimates that 7 million children are out of school and, in rural areas, less than half of school-aged girls attend school.
to 99.0
to 96.9
to 94.9
No data available
Source 19
Source: Oxford University Press
Access to education varies widely across the globe. In developed countries such as Australia, Britain, Germany and France, about 99 per cent of all school-aged children are enrolled in schools. In developing countries such as the DRC, however, most children attend primary school, but few (43 per cent) attend secondary school and only 6 out of every 100 school leavers continue their study at university.
There are many factors that determine whether or not a child will attend school. These include:
• system barriers – such as a lack of trained teachers, classrooms and educational materials, including books
• attendance barriers – such as school fees, distance to school, poor transport networks and the concern of many parents about the safety of their children; many children also work to help support their families
• social barriers – such as variations in language, religion and conflict within countries.
In the DRC, a series of ongoing conflicts and civil wars are an example of a social barrier. These conflicts have disrupted the education of many children. In 2016–17 a conflict erupted in the centralsouth of the country between a local tribal chief and the government. During the brutal conflict, government institutions – including schools – were deliberately targeted. As many as 5000 people were killed and 1.4 million fled the violence. This included more than 600 000 children, who could not then attend school. Some of the rebel fighters recruited children as soldiers, and in many cases sexual violence against girls was used as a terrorist weapon.
Review and understand
1 Explain what literacy rates are, and why they can be difficult to calculate.
2 Identify three social barriers that may determine whether or not a child attends school.
Apply and analyse
Key skill worksheet Identifying patterns & relationships: Comparing choropleth maps
Statistics database World Statistics Data

and the DRC. Propose three reasons why differences in literacy rates occur between these two countries.
5 Suggest the likely future in education for children in the DRC who were affected by the conflict in 2016–17.
Evaluate and create
3 Compare Source 19 (showing literacy rates) with the map in Source 12 on page 140 (showing GDP per capita). Describe the relationships you see between these two indicators, using evidence from the maps to support your description.
4 Use Source 19 and the World Statistics database on your obook pro to compare the literacy rates for Australia
6 Evaluate the three barriers to education to decide which one would be the most difficult to overcome. Give some reasons for your answer.
7 In small teams, create some strategies to help communities overcome one or more of the barriers to education. Share your strategies with the class.
Chronic food shortages and hunger are among the greatest threats to wellbeing in many developing countries. However, one of the fastestgrowing public health crises in a great number of countries is obesity. Once only a problem in developed countries, obesity has now spread to developing nations, such as Mexico, China, India and Brazil. It is estimated that more than half of the adults in the world are overweight or obese.
Excessive body weight and obesity are linked to health problems such as heart disease, strokes, arthritis, diabetes and some cancers. Obesity is a leading cause of premature death in many countries and a huge burden on public health resources. It has become such a serious issue that many experts now describe it as the global obesity epidemic.
Much of our understanding about events and trends happening around the world comes to us through media reports. These reports can take the form of printed media such as newspapers and magazines, electronic media such as television and radio reports, or new media such as the internet and mobile phones.
By learning a few simple techniques, you can use the news to generate geographical questions to guide your inquiries. Follow these steps:
Step 1 Check the source of the news article for reliability and possible bias. Find out who wrote the article and which news organisation published it. Mainstream media organisations are generally more reliable than smaller ones, but this may not always be the case. If possible, use the news company website to investigate possible bias.
Step 2 Work out what type of report you are watching, reading or hearing. Is the
information presented being reported as fact or is it an opinion piece? Both are valuable, but it is important to know the difference.
Step 3 What is the reporter’s main contention or key point? State in your own words.
Step 4 What information and arguments are used to support the reporter’s contention?

Step 5 What evidence does the reporter use to support these arguments? What is the source of this evidence?
Step 6 Look closely at any images or graphics that are included in the report. How do they help to support the reporter’s contention and arguments?
Step 7 What further questions does this article raise for you? Good geographical questions open up new lines of inquiry for you to explore. Try using question starters such as ‘How many’, ‘Where does’, ‘Why does’, ‘Who is affected’, ‘What changes does’ and ‘How should people’.
For more information on this key skill, refer to page 13 of ‘The geography toolkit’.
4A How does wellbeing vary around the world?
1 Use the steps provided to analyse and develop questions about the article in Source 21.
What ’s driving the worldwide obesity epidemic?
The rise of obesity around the globe has led the World Health Organization (WHO) to urge countries to impose a tax on sugary drinks, which are blamed for the spread of the epidemic.
Countries with such different food cultures as, say, Mexico and Palau are facing the same nutritional risks and following the same obesity trends. Our research aims to understand why, and we have examined the link between various facets of globalisation (trade, for instance, or the spread of technologies, and cultural exchanges) and the worldwide changes in health and dietary patterns.
2 Share your geographical questions with your classmates and build up a class list of questions.

The WHO identifies unhealthy nutrition patterns, along with increasing physical inactivity, as the main drivers of rising body weight around the world. Diets rich in sugar, animal products and fats constitute important risk factors for noncommunicable diseases, such as cardiovascular diseases, diabetes, and different types of cancer.
… [G]lobalisation has led people to consume more meat products. Interestingly, the social dimensions of globalisation (such as the spread of ideas, information, images and people) are responsible for this effect, rather than trade or other economic aspects of globalisation.
…
1 Examine the image in Source 21 showing the Indian snack chain outlet Haldirams. Why did the journalist who wrote the article choose to include this image?
The processed-food impact
… [I]ncreasing consumption of processed foods is often associated with rising weight levels.

After saturating Western markets, supermarkets began to spread to developing countries, which had greater growth prospects. Latin America, central Europe and South Africa saw their grocery stores boom in the 1990s. Retailers later opened in Asia and are now entering markets in African countries.
An interesting, yet little explored, aspect in the discussion of processed foods is the role of multinational companies in offering unhealthy ‘Western diet’, such as fast food and soft drinks. Multinationals are one of the two market leaders in many emerging countries, including Brazil, India, Mexico, and Russia and they are known for substantial food and beverage advertising.
An extract from The Conversation, 14 December 2016
2 Select one of the geographic questions from the class analysis of the article in Source 21. Use this as your key inquiry question to begin an investigation into the global obesity epidemic. Report back to the class on what you find during your research
In this topic, you will:
» identify regions of India wi th different levels of wellbeing
» explain reasons for these different levels of wellbeing.
India is a vast, complex and dynamic nation. Its population currently stands at more than 1.3 billion and is growing by about 14 million people a year. It is estimated that India will overtake China as the world’s most populous nation by 2030 – a position it is unlikely to lose for centuries.
As with all nations, there are tremendous variations in wellbeing within India. At one end of society, there are hundreds of millions of poor, subsistence farmers, who are growing just enough food to feed their families. At the other end, there are around 759 000 Indian millionaires. India also has one of the world’s largest middle classes, estimated to be about 400 million people.

India is divided up into many different states and union territories. Source 2 shows the range of HDI rankings for these states and territories. By looking at two states in particular – Kerala and Bihar, which have India’s highest and lowest rankings in human development respectively – we can see the great contrasts in wellbeing that exist within India.
Source 1 A busy market in Kerala; markets such as this allow people in the city to get fresh food from rural areas quickly and easily.
The south-west state of Kerala is ranked as the having the highest HDI in India. It has the lowest level of poverty, the highest literacy rates, the lowest population growth rates and the fastest economic growth in the country. In many ways, the state compares favourably with wellbeing in many developed countries.
There are several factors responsible for this comparatively high level of wellbeing. About 2 million people from Kerala live and work in the countries of the Persian Gulf, such as Qatar, and each year they send home a combined income of about US$14 billion. This means their families can afford education and health services. The state was also one of the first to change its laws so that individual farmers can own land, increasing their incentives to make a profit. In addition, fertile soils and a favourable climate help to boost agricultural production (see Source 1).
Tourism is one of Kerala’s biggest industries. The COVID-19 pandemic had a devastating effect on tourism in Kerala, but the state’s economy fared better than most in India.
4B How does wellbeing vary within countries?
The north-east state of Bihar is ranked as having the lowest HDI in India. The state is 90 per cent rural, with most of the population living in villages and small towns. The people of Bihar farm the fertile land on either side of the Ganges River, which splits the state in two. One-third of the state’s population – some 42 million people – live below the poverty line, but this figure is as high as 70 per cent in some parts of the state.
The reasons for the low levels of wellbeing in Bihar are complex, and studies have failed to agree on the main causes. Some commentators blame India’s political situation, and point to low levels of investment by the federal government in health and education infrastructure in Bihar, such as hospitals and schools. Furthermore, most rural families do not own their own land, or they own an area so small that it cannot supply the family’s needs.
Often, children and young adults from these families move to the cities in other states seeking a better life. It is estimated that 5 million Biharis are working in other states. During the coronavirus pandemic, however, many lost their jobs and defied lockdown rules to return home. This, in turn, led to a human tragedy, as they walked hundreds of kilometres over a period of weeks. Many did not survive the journey.

4.8 CHECK YOUR LEARNING Review and understand
1 Identify two factors affecting the relatively high level of wellbeing in Kerala
2 Outline why levels of wellbeing are low in Bihar.
3 Using Source 2, describe the pattern of wellbeing in India according to the HDI. Use the names of specific states, as well as compass directions in your description.
infrastructure the facilities and services necessary for any community, city or country to function (e.g. buildings, electricity, roads, airports and water supply)
Source 3 Wellbeing indicators for the states of Kerala and Bihar, and India (total)
4 Explain why there are large variations in wellbeing within India. Use the examples of Kerala and Bihar in your response.
Evaluate and create
5 Using Source 3:
a Construct a multiple bar graph contrasting wellbeing in Kerala, Bihar and India (total).
b Describe the pattern in your completed graph.
In this topic, you will:
» examine wellbeing on a national scale in India.
Watch it!
A short video and quiz on architecture in
About 280 million people in India are living below the poverty line. Hundreds of millions of others live just above it. This poverty, however, is unevenly spread across the country, with significant inequalities in wellbeing between rural and urban areas. People in rural areas are almost twice as likely to be living below the poverty line than people in urban areas.
As India embarks on a path of economic and social change, the gap between rural and urban India is narrowing, but there is still some way to go before equality is achieved. Source 5 shows some of the key indicators of the rural–urban divide, or what some researchers have called ‘A Tale of Two Indias’.
Source 5 Differences in wellbeing between urban and rural India
Source 6 A young girl collects dried cow dung to be used as cooking fuel in a rural village in the state of Uttar Pradesh.

India is largely a nation of farmers and rural villagers; well over half of the population lives in settlements of no more than 5000 people. For many of these people, life is hard and standards of living are low when compared to people living in urban areas.
Indian rural poverty is the result of a range of factors that differ from place to place. These include low food production levels leading to malnutrition; poor infrastructure such as roads, electricity and communication networks; ineffective safety-net programs such as job schemes; and poor access to financial resources such as bank loans and credit. Farmers are also at the mercy of nature. Droughts, floods and widespread landscape degradation have all contributed to rural poverty.
Poverty is greatest among minority ethnic groups (particularly in degraded forest areas) and marginalised classes of people, such as Dalits (also known as ‘untouchables’) who make up the lowest class in Indian society according to the Hindu caste . In communities where coastal fishing is the main source of food, poverty is increasing because overfishing and marine degradation have greatly reduced fish stocks.
Many people in India respond to the inequalities in wellbeing between rural and urban areas by moving from the countryside to the city. Millions of Indians from rural areas have poured into the country’s booming cities, hoping to leave poverty behind as they seek a better life in the city. The reality for many, however, is that they exchange rural poverty for urban poverty (see page 152).
For geographers, this relates to the concept of place, as these people establish new homes in new areas. The new arrivals from the countryside tend to take up residence in slum areas on land that is considered unsuitable for ordinary housing, often because it is swampy or prone to landslides. Indian cities now contain some of the world’s largest slums. Residents build their own homes out of discarded materials and live with the constant fear of eviction as they have no legal right to be there.
Many Indian cities are struggling to provide their citizens with the infrastructure needed for wellbeing, such as fresh water, sanitation, reliable access to electricity, schools, roads and hospitals. But it is not all bad news. Packed with people determined to improve their lives and their communities, many slums have become so well established that their infrastructure is often close to the standard in other parts of the city, and usually better than in rural areas.
The biggest struggle for many slum areas, however, is the provision of adequate sanitation. Many homes in the slums do not have a toilet, and the toilets that do exist are often open pits shared by hundreds of people. While many amenities are often organised and run by the slum-dwellers themselves, they rely on city authorities to provide proper sewage disposal. Because the slums are considered to be illegal settlements, however, authorities are reluctant to invest in sanitation for them.
How does wellbeing vary within countries? caste system a social system in which people are born into a social group (called a caste); the caste system is generally associated with the Hindu religion in India and is still used today
For more information on this key concept, refer to page 6 of ‘The geography toolkit’.
Source 7 Access to amenities in slum and non-slum urban households across a selection of Indian cities (percentage of households)
Source: censusindia.gov.in

Source 8 New apartments rise above an urban slum in Mumbai, one of India’s largest cities.
megacities cities with a population of more than 10 million people

Source 9 Residents of Mumbai are supported by public transport infrastructure. This train station is located right outside Saifee Hospital (right). Transport and health care are two factors that contribute to wellbeing in urban India.
India is home to some of the world’s largest and fastest-growing cities. The country has 41 cities of more than 1 million people, and two of the world’s megacities (Mumbai and Delhi). These cities are home to much of the nation’s wealth, as new opportunities in service industries such as banking and information technology have emerged. These opportunities have led to a growing middle class which has in turn led to improved infrastructure in the cities.
Those living in urban areas have greater access to health care, which has meant fewer infant deaths and better health in early childhood. On average, children in urban areas also spend more time at school and achieve a higher level of education.
Review and understand
1 Describe the differences in wellbeing between urban and rural areas in India.
Apply and analyse
2 Examine Source 7. Do the levels of access to amenities available in the slum and non-slum areas of these Indian cities surprise you? What health or safety issues might be a concern for residents with limited access to some of these amenities?
3 Propose which Indian city in Source 7 has residents of slums with the lowest level of wellbeing. Use data from the source to support your answer.
4 Examine Source 5.
a Which key wellbeing indicator do you think best shows the rural–urban divide in India? Justify your answer.
b Using the wellbeing indicator you chose in question 4a, create a simple bar graph representing this data.
5 Conduct further research on the internet and use the data on these pages to compare the inequalities in wellbeing between urban non-slum India, urban slum India and rural India. Write a short report on your findings, using images where appropriate.
6 Create an annotated sketch of Source 8. On your sketch, label any inequalities in wellbeing that you can identify.
4B How does wellbeing vary within countries?
In this topic, you will:
» explain the spatial pattern of human wellbeing in Australia.
census a ‘head count’ or audit of the number of people living in a particular place at a particular time; information collected during a census often includes age, occupation, income, etc.
Each year, the United Nations releases the HDI (see topic 4.3 on page 136), which ranks countries around the world in terms of their development. In 2019, Australia was ranked eighth out of 189 countries on the HDI. However, despite the high levels of wealth and wellbeing in Australia nationally, there are still many variations between specific regions, cities, towns and suburbs across our country. Some places may have excellent access to hospitals, schools and recreation facilities, together with low levels of crime and poverty. Other places may have poor access to these services, as well as higher levels of crime and poverty. Variations in these types of things can be difficult to measure at a local or regional scale because indicators such as life expectancy and literacy rates are almost always measured at the national scale.
There are other sources of information, however, that can help geographers measure wellbeing at the regional and local scale. One of these sources is the census. In Australia, a census is carried out every five years. Each Australian citizen is asked to provide answers to a series of questions on a whole range of topics. The census gives us a great deal of information about life across Australia, such as the areas of advantage and disadvantage. The Australian Bureau of Statistics (ABS) collects the census data and combines a number of indicators to give each region a score. This is based on each region’s relative advantage or disadvantage ‘in terms of people’s access to material and social resources, and their ability to participate in society’ (see Source 10).
Notes: A quintile is one-fifth of the population. At the time of writing the latest data available was from the 2016 census. New census data will be made available for Australia during 2022.
Source 10
Source: ABS, 2018

In 2020, the Australian Council of Social Service (ACOSS) published a study in partnership with the University of New South Wales. Titled Poverty in Australia 2020, the study used census data and other research to examine levels of poverty across Australia. In this study, individuals and households that receive less than half the average Australian yearly income are deemed to be living in poverty. It is worth noting that this definition is very different from measurements used in other countries.
Using this definition, the researchers found that 13.6 per cent of Australians – around 3.2 million people – are living in poverty.
The 2016 census data revealed that inner-city suburbs, particularly in Sydney and Perth, have the lowest levels of disadvantage, while rural and remote communities in Queensland and the Northern Territory are most disadvantaged. The most advantaged community in Australia was Ku-ringgai, in northern Sydney (see Source 12). The average weekly income for each household in this region was $2642, and almost half of all adults had a university degree. About two-thirds of Ku-ring-gai residents had at least one of their parents born overseas, and the most common jobs were as managers and professionals.
The most disadvantaged community was Cherbourg, which is located inland from Gympie in south-east Queensland (see Source 11). Households in this region earned an average of $755 a week, and less than 1 per cent had a university degree. Over 90 per cent of Cherbourg residents were Aboriginal or Torres Strait Islanders people, and the most common jobs were community and personal service workers.
Source 11 The 2016 census found that remote communities in the Northern Territory and Queensland, such as Cherbourg, had the highest levels of disadvantage in Australia.
Studies of the spatial distribution of wellbeing in Australia have found that people living in rural areas in Australia have lower levels of wellbeing than people living in urban areas. This pattern is repeated in other developed countries around the world. Studies of health statistics in Australia show that the further away from a major city you live, the less healthy you are likely to be. For example, in rural areas:
•rates of hospitalisation for serious injury or illness are higher
•there are fewer doctors for every 1000 people
•smoking rates and alcohol consumption are higher
•rates of death and serious injury from workplace and road accidents are higher.

4B How does wellbeing vary within countries?

Source 12 The 2016 census found that the inner suburbs of Sydney, such as Ku-ring-gai, had the lowest levels of disadvantage in Australia.
Review and understand
1 Explain why it is more difficult to measure, rank and map variations in wellbeing at the local and regional level.
2 Identify three health concerns that are more serious for Australians living in rural areas than for those living in urban areas.
Apply and analyse
3 Examine Source 10.
a Identify which regions of Australia are most advantaged.
b Identify which regions of Australia are least advantaged.
c In a carefully worded paragraph, describe the distribution of regions in Australia according to their quality of life rankings, using the PQE method (see page 24 of ‘The geography toolkit’). Refer to specific towns, cities, regions and states in your description.
4 What barriers do you think exist that make it difficult to improve wellbeing in rural and regional areas of Australia? Propose one solution to improve wellbeing in these areas.
Evaluate and create
5 Access the GIS map showing the areas of advantage and disadvantage at the website shown in your obook pro.
a Use the search tool to search for your postcode. Identify your suburb’s level of disadvantage. What patterns of disadvantage do you notice in your local area?
b Change the map layer to ‘state suburbs’ and use this to compare two of Australia’s capital cities. Describe the similarities and differences you notice between the patterns of advantage and disadvantage in these two cities.
Weblink GIS map: areas of advantage and disadvantage
In this topic, you will:
» investigate factors that influence wellbeing in Aboriginal and Torres Strait Islander communities. By most measures there are significant differences in wellbeing between Aboriginal and Torres Strait Islander communities and non-Indigenous communities around Australia. Aboriginal and Torres Strait Islander children are twice as likely to be born underweight and twice as likely to die before their fifth birthday than non-Indigenous children. They are also less likely to attend pre-school, and much less likely to reach minimum standards in literacy and numeracy while at school. Although almost nine out of every 10 non-Indigenous young adults complete Year 12, it is closer to seven out of 10 for Aboriginal and Torres Strait Islander young adults. The pattern is similar with employment. Only 49 per cent of Aboriginal and Torres Strait Islander adults are in employment, compared to 75 per cent of their non-Indigenous counterparts.
Perhaps the most alarming statistic is that an Aboriginal and Torres Strait Islander boy born in 2021 can expect to live 8.6 years less than a non-Indigenous boy. For girls, the figure is 7.8 years.
In 2008, the Australian Prime Minister, Kevin Rudd, apologised to Aboriginal and Torres Strait Islander people affected by the official government policies that separated children from their families, a group known as the Stolen Generations. As part of this apology, Rudd gave a promise ‘to close the gap between Indigenous and non-Indigenous Australians on life expectancy, educational achievement and employment opportunities’.
Each year the prime minister must report on the progress that has been made in closing the gap. The 2020 report revealed the following:
Source 13 Progress on ‘closing the gap’ targets, 2020
Target Progress
Halve the gap in death rates for Aboriginal and Torres Strait Islander children under five within a decade (i.e. by 2018)
95 per cent of all Aboriginal and Torres Strait Islander four-yearolds enrolled in early childhood education (by 2025)
Close the gap between Aboriginal and Torres Strait Islander and non-Indigenous school attendance within five years (by 2018)
Halve the gap for Aboriginal and Torres Strait Islander children in reading, writing and numeracy within a decade (by 2018)
Not on track: the gap is widening
Target not met, no improvement
Target not met, but progress made
Halve the gap for Aboriginal and Torres Strait Islander Australians aged 20–24 in Year 12 attainment or equivalent (by 2020) On track
Halve the gap in employment outcomes between Indigenous and non-Indigenous Australians within a decade (by 2018)
Not met, no real change
Close the life expectancy gap within a generation (by 2031)Not on track
Although statistical indicators such as life expectancy and literacy suggest low levels of wellbeing among Aboriginal and Torres Strait Islander Australians, other measures tell a different story. The ABS has begun to ask Aboriginal and Torres Strait Islander Australians to

Source 14 Ntaria School is in Hermannsburg, outside Alice Springs in the Northern Territory. Increased government funding has allowed remote schools such as Ntaria to offer longer pre-school programs. This has resulted in improved literacy and numeracy as well as improved health, as the children are also given healthy lunches.

than for those who rarely or never attend cultural events.
assess their own wellbeing by asking questions about their levels of happiness and satisfaction with life in the National Aboriginal and Torres Strait Islander Social Survey (NATSISS). The data collected reveals some important trends. Torres Strait Islanders, for example, are much more likely to report feeling happy, full of life, calm and peaceful, and having lots of energy than individuals in the broader Australian community.
The NATSISS results also showed that Aboriginal and Torres Strait Islander adults living in remote areas were generally more satisfied with their life than those living in non-remote areas, such as towns and cities. However, in virtually all other measures – such as school attendance, literacy, health, disease and employment – the most disadvantaged Aboriginal and Torres Strait Islander communities were those in remote areas. Access to health care, education and employment opportunities are often more limited in remote areas than they are in regional centres and major cities.
Review and understand
1 Identify the difference in life expectancy rates between Aboriginal and Torres Strait Islander Australians and non-Indigenous Australians.
Apply and analyse
2 The ‘closing the gap’ targets rely on quantitative measures to measure their progress. Explain why these measures are used rather than qualitative measures (such as levels of happiness and satisfaction).
Evaluate and create
3 Examine Source 15, including the caption. Conduct some further reading on the internet and complete these tasks.
Worksheet Indigenous wellbeing framework
Key skill worksheet Identifying patterns & relationships: Distinguishing between qualitative and quantitative data
a Write a reflection on why people are happier if they engage in cultural and community activities.
b Create a survey that questions people about their level of happiness and the factors that affect their happiness. Include questions about their involvement in cultural and community activities. Conduct the survey and write a report on your results, outlining what makes people happy.
4 ‘Efforts to close the wellbeing gap between Aboriginal and Torres Strait Islander Australians and non-Indigenous Australians have been largely successful.’
To what extent do you agree with this? A lot (strongly), a little bit (somewhat) or not at all? Write a short paragraph explaining your position, using evidence from Source 13 to support your answer.
Most studies of wellbeing focus on differences and variations between nations. But there are also variations at the local scale. In this rich task you will learn how to use census data to collect and map information about wellbeing in your local area. Based on your completed research and maps, you will then explore some possible reasons for the variations in wellbeing at the local scale.
A census is held in Australia every five years and the results are processed and published by the ABS. Geographers often use this information to map data and trends across an area. You can collect data about your local area and map it by following these steps:
Step 1 Access the ABS website. Click on the ‘Census’ tab in the menu. Then select ‘Find Census data’, and then ‘QuickStats’.
Step 2 This page allows you to access the census data at a wide range of scales, including at the local level. A useful way of working at the local scale for this study is by using postcodes. To access the data for your suburb, enter your four-digit postcode in the ‘Search QuickStats’ tool. If more than one option is displayed, choose ‘POA’ (postal area). Click ‘Go’.
Step 3 This should open a map of your postcode and provide you with a range of statistics for it, as collected in the most recent census.

Step 4 Scroll down the page to see the data that is available and select a category you would like to map.
Step 5 In a research table, record the data for your postcode for your selected indicator. Access the same data for your neighbouring postcodes by using the QuickStats search tool. You can find out what your neighbouring postcodes are by using the interactive map on the ABS Maps website. Choose a postal area in the drop-down menu and zoom into your postcode (see Source 18). Click on the neighbouring postal areas to find their postcodes, list them in your research table, and then use the QuickStats to access and record data for these postcodes.
Step 6 Once you have collected the data you can map it by constructing a choropleth map. Print out a map of your area. You can use one you already have, or print the one from the ABS website. Trace a copy showing only the postcode boundaries.
Step 7 Use the data collected from the census to construct a choropleth legend for your map. Divide your data into four or five categories. Use darker shades of a colour for higher values and lighter shades for lower values. For example, your suburb might have fewer people per household (if that was what you chose to map) than the neighbouring suburb. So, you

skill
1 Construct a choropleth map of variations in median household income in your local area (include at least six suburbs) by collecting information from the ABS website. Follow the steps to gather your data and map the information.
2 Describe the pattern shown on your completed map.
1 List possible reasons for the variations shown on your map. These will vary from place to place, but here are some possibilities:
• distance from the centre of a large city
• presence of employment opportunities, such as factories and shopping centres
• presence of higher educational opportunities, such as universities
• presence of transport networks, such as railway stations and major roads
• presence of large, shared accommodation areas, such as aged-care facilities or school hostels
4B How does wellbeing vary within countries?
would colour your suburb a lighter shade and your neighbouring suburb a darker shade.
Step 8 Shade your map according to the legend you created in Step 7.
• presence of geographic features, such as a coastline or large park.
Use your knowledge of the local area, together with street directory maps, to evaluate these possible reasons.
Step 9 Complete your map with BOLTSS.
For more information on this key skill, refer to page 26 of ‘The geography toolkit’.


2 Collect information from the ABS site and analyse variations in another indicator of wellbeing. Do this for the same suburbs you investigated earlier. You could, for example, choose to analyse the number of motor vehicles per dwelling, highest year of schooling completed or percentage of people unemployed.
3 You can also use the census data to explore levels of wellbeing in communities that are not located close to each other.
a Follow the steps in the key skill to compare wellbeing in Cherbourg, Ku-ring-gai (see page 156) and the area in which you live.
b Summarise what you have learnt about variations in wellbeing within Australia.
4 Evaluate the use of census data to describe and compare wellbeing by following these steps:
a What are the strengths of census data for this purpose?
b What are the weaknesses of census data for this purpose?
c What is your overall opinion about how useful census data is for this purpose?

4A How does wellbeing vary around
1 Define wellbeing. (1 mark)
2 Explain the difference between quantitative measures of wellbeing and qualitative measures. In your answer, give an example of each. (3 marks)
3 Describe the level of wellbeing in the Democratic Republic of Congo. Use one example from each of these factors to support your answer: • wealth • health • education (6 marks)
(Total: 10 marks)
4B How does wellbeing vary within countries?
1 Summarise the overall level of wellbeing in Australia. (2 marks)
2 Explain the difference in wellbeing between rural India and urban India. (3 marks)
3 Compare the variations in wellbeing within India with the variations in wellbeing within Australia. What are some of the similarities and what are some of the differences? (5 marks)
(Total: 10 marks)

Source 19 Papua New Guinea is Australia’s closest neighbour, but its HDI ranking is the lowest in the Asia–Pacific region.
Papua New Guinea (PNG) is Australia’s closest neighbour, but is worlds apart with regard to levels of wellbeing. Whereas Australia is ranked in the top 10 countries in terms of our HDI, PNG is ranked 155th – the lowest ranking in the Asia–Pacific Region. There are also many variations in wellbeing on a regional scale in PNG.
Analyse the map in Source 20 to explore aspects of wellbeing further, then answer the questions.
1 Using your knowledge, list three indicators of wellbeing. (3 marks)
2 Identify two locations with low infant mortality rates, and two locations with high infant mortality rates. (4 marks)
3 Use the PQE method to describe the distribution of infant mortality rates in PNG. (6 marks)
a Summarise the difference between the infant mortality rates in Sanduan and in the National Capital District. (2 marks)
b Why do dif ferences occur in wellbeing between rural and urban areas? Explain your answer using knowledge from this chapter. (3 marks)
4 Outline one way to improve infant mortality rates in Papua New Guinea. (2 marks)
(Total: 20 marks)
Source : Oxford University Press
Chapter review quiz Chapter 4