Impact of Congestion in the GTHA and Ontario:
Economic and Social Risks

Research Report | December 2024

Research Report | December 2024
The Canadian Centre for Economic Analysis (CANCEA) is a premier socio-economic research and data firm, distinguished for its unwavering commitment to delivering objective, evidence-based analysis. Anchored in a holistic understanding of market shifts, policy implications, and economic behaviors, CANCEA’s research transcends traditional boundaries to offer a panoramic view of the socio-economic landscape.
Driven by modern data science techniques, including the pioneering use of agent-based modelling, CANCEA’s analytical spectrum encompasses a diverse range of services. The cornerstone of CANCEA’s analytical prowess is its state-of-the-art agent-based platform, the largest in North America that is a meticulously crafted data-driven model that encapsulates over 58,000 distinct regions across Canada and over 5,000 topics. This platform facilitates in-depth, multidisciplinary analyses, empowering stakeholders with unparalleled insights into the interplay of various socio-economic parameters.
Embracing a systems-centric approach, CANCEA uniquely adopts a single-model strategy. This integrated approach allows for the seamless fusion of multiple disciplines and stakeholder perspectives, culminating in holistic, collaborative, and quantitative analyses that inform and guide pivotal market, policy, and economic decisions.
Moreover, as champions of data integrity and comprehensiveness, CANCEA offers robust Canadian data services, ensuring that stakeholders are equipped with the most accurate and up-to-date information for informed decision-making.
CANCEA is at the forefront of socio-economic research, transforming complex data into actionable insights for a diverse range of sectors and stakeholders.
Citation:
Impact of Congestion in the GTHA and Ontario: Economic and Social Risks. Canadian Centre for Economic Analysis. December 2024
©2024 Canadian Centre for Economic Analysis
Printed in Canada
All rights reserved
ISBN: 978-1-989077-52-8
CANCEA does not accept any research funding or client engagements that require a pre-determined result or policy stance, or otherwise inhibit its independence.
In keeping with CANCEA’s guidelines for funded research, the design and method of research, as well as the contents of this study, were determined solely by CANCEA. This information is not intended as specific investment, accounting, legal or tax advice.
This report was commissioned by Residential & Civil Construction Alliance of Ontario and the Ontario Road Builders’ Association.
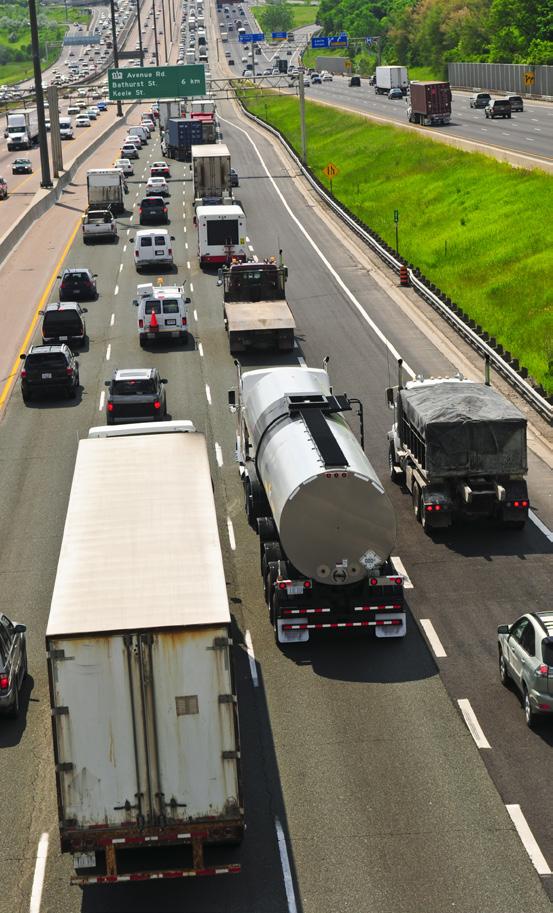
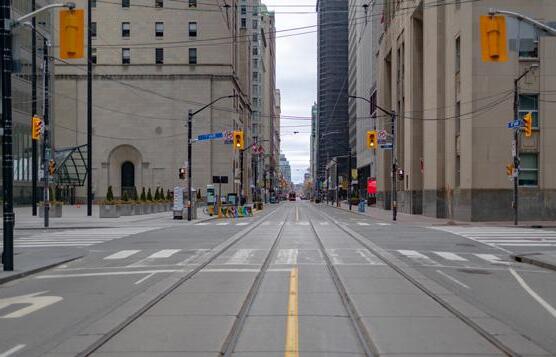
The Greater Toronto and Hamilton Area (GTHA) and the rest of Ontario face mounting challenges from worsening traffic congestion. With the region housing over half of Ontario’s population, the GTHA experiences congestion that significantly increases travel times and diminishes economic productivity. Travel delays due to congestion profoundly affect residents’ quality of life, restrict access to jobs and essential services, and escalate infrastructure costs. As a result, the cumulative effect of congestion undermines the region’s capacity to sustain growth and erodes the prosperity of its communities. With the GTHA standing as one of North America’s fastest-growing regions, understanding the full impact of congestion on residents’ well-being and business productivity is instrumental in elevating the importance of this pressing issue.
Congestion is a core economic and social problem breaking down business productivity and quality of life.
Impact of congestion in Ontario valued at $56.4 Billion annual, including $44.7 Billion within the GTHA.
This study aims to demonstrate that congestion is far more than just a transportation issue; it is a core social challenge for both the GTHA and Ontario as a whole. Congestion substantially reduces life satisfaction for residents and has a significant economic cost, amounting to billions of dollars in lost productivity annually. These losses stem from multiple areas, from the restricted movement of goods and services to individuals’ limited ability to commute, shop, and enjoy recreational activities. Businesses experience reduced revenues, while residents face deteriorating quality of life. Furthermore, long and unpredictable commutes discourage many jobseekers from pursuing opportunities across the region, further limiting both economic mobility and productivity. Indeed, surveys suggest that over half of GTHA residents have considered relocating due to the daily frustrations of gridlock.
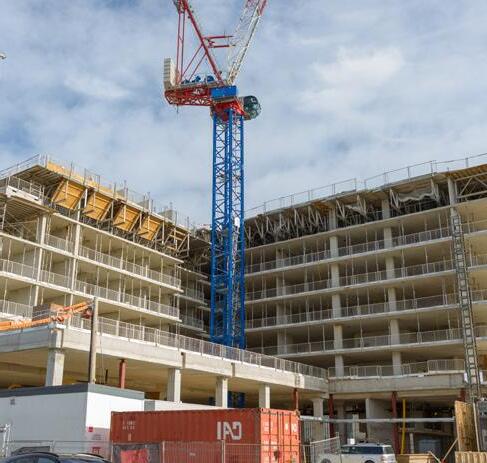
Business leaders, policymakers, and residents widely agree that urgent action is required to expand transit and transportation options and enhance infrastructure project efficiency to alleviate the region’s traffic crisis. Immediate steps to manage congestion effectively are essential to prevent further declines in business productivity and overall quality of life. As this report seeks to illustrate, addressing congestion will unlock Ontario’s economic potential and greatly enhance the well-being of its workforce, especially in the GTHA.
Quality-of-life impacts of congestion are profound at over 3 times that of the economic problem.

The objective of this study is twofold. First, it aims to provide a comprehensive assessment of how congestion has impacted the Greater Toronto and Hamilton Area (GTHA) and the rest of the province over the past decade. This includes examination of:
• The economic opportunities lost due to congestion; and
• The social value impacts of congestion, particularly addressing how congestion affects the satisfaction with life (well-being) of commuters and residents.
Second, this study analyzes the economic and social well-being outcomes of unaddressed congestion in the GTHA and Ontario over the next 20 years under various congestion scenarios, thereby highlighting the risks to the regions’ economic prosperity and overall well-being.
It is important to note that methods for addressing congestion—such as enhanced transit options, improved co-location of employees and employers or suppliers and users to reduce travel, and increased highway efficiency and capacity—are separate issues not examined in this study.
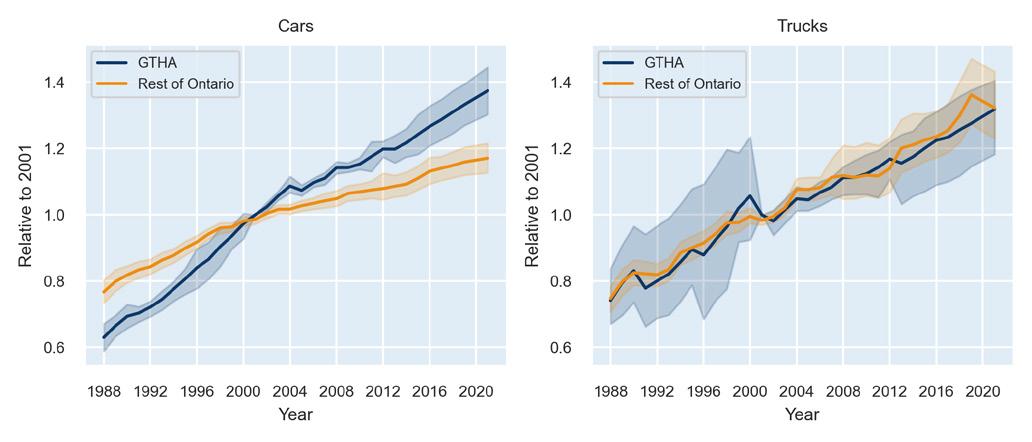
As the population of Ontario has grown, so has the number of vehicles on the road. To contextualize the congestion issue, since 2001, municipalities in the GTHA have experienced a 37% increase in the number of cars on the road, compared to just 17% outside the GTHA. In contrast, average truck volumes have risen more uniformly, with a 32% increase across all municipalities, both within the GTHA and the rest of Ontario.
Figure 1 Historical Trends in Traffic Volumes, GTHA and rest of Ontario

This is unsurprising, given that much of the growth in car traffic has been concentrated in the growing GTHA regions and nearby cities such as Barrie, London, and Kitchener-Waterloo. Truck traffic, however, is more concentrated along key transportation routes and goods movement hubs, including some less traditionally trafficked routes such as Highway 12 and Highway 404 on the east side of Lake Simcoe.

While growth in car traffic across Northern Ontario has been relatively modest, most regions have seen over a 50% increase in truck traffic. In some areas, such as near Thunder Bay, Sudbury, and Parry Sound, truck traffic has more than tripled since 2001. This surge, primarily in commercial vehicles, reflects the growing economic activity in Northern Ontario.
Addressing growing vehicle traffic is only one aspect of the broader transportation challenge. Public transit, by playing a crucial role in meeting mobility needs, particularly in rapidly growing regions, should remain accessible. From 2001 to 2017, GO ridership rose 75%, partly due to significant system expansion, while TTC ridership increased by 25%. Although transit ridership fell during the pandemic, it is now rebounding. Across the GTHA, public transit is accessible to a substantial portion of residents, with at least 80% having access in over one dozen GTHA municipalities.
The total impact of congestion is derived from the sum of its economic impact and social value impact1:
By summing the economic and social value impacts, our methodology provides a comprehensive estimate of the total cost of congestion. This dual approach ensures that both market-based costs and non-market social impacts are accounted for, offering a more holistic perspective on the challenges that congestion presents for the GTHA and Ontario as a whole. In this vein, our methodology captures two primary sources of congestion impact:
1. Economic Costs: Congestion directly impacts business productivity by increasing delays in the transport of goods and services and reducing the efficiency of workers. This is evident in both transportation-related sectors and the broader supply chain, where bottlenecks and inefficiencies propagate across industries.
2. Social Value Costs: Congestion imposes significant costs on commuters by diminishing their satisfaction with life2 This includes increased stress, lower life satisfaction, and reduced well-being, as extended commute times infringe upon time that could otherwise be spent on leisure, family, or personal pursuits.
1 The Green Book in the UK and the Organisation for Economic Co-operation and Development (OECD) have both recognized the importance of measuring social value alongside economic impact to provide a more comprehensive understanding of the total impact of an event or policy.
2 In this report satisfaction with life, quality of life, well-being or happiness are used interchangeably.
Our estimates indicate that the impact of congestion in Ontario is approximately $56.4 billion in 2024, including an average economic impact of $12.8 billion. The remaining $43.6 billion represents the substantial loss in value due to the negative impacts of congestion on commuters’ daily lives and well-being.
Table 1 Total impact of congestion in the GTHA and Ontario, 2024
The GTHA, home to over half of Ontario’s population, bears the brunt of congestion. Here, economic costs hinder sustainable growth, while social impacts diminish residents’ quality of life. In the GTHA, in 2024, 49.2% of commuters experienced heavy congestion (three or more times per week), compared to just 19.8% in the rest of Ontario.
Over the past decade, the economic losses caused by congestion in the GTHA have been substantial, affecting real GDP, private investment, and job opportunities. For Ontario, these economic losses total $35.5 billion, or 2.9% of the province’s 2024 economy, averaging an annual real-term economic loss of $12.8 billion in 2024.
In the GTHA, over the past decade:
• Lost Economic Growth: Had heavy congestion been reduced over the past decade so that no commuters experience more than 2 days of congestion per week, real GDP in the GTHA could be $27.9 billion higher today, representing a 4.9% increase over the GTHA 2024 economy, corresponding to an additional $3,400 in economic activity per person. Furthermore, congestion has resulted in a $5.0 billion reduction in private capital investment, including losses of $570 million in manufacturing, $180 million in construction, and $100 million in professional services.
• Job Opportunities: Approximately 88,000 more jobs could have been supported in the GTHA if heavy congestion had been mitigated.
On average, over the last decade, congestion has cost the GTHA economy $10.1 billion annually, with an additional $2.7 billion impact on the rest of the province.
Economic cost of congestion in Ontario $12.8 Billion annually, with 112,000 fewer jobs by 2024
Economic cost of congestion in GTHA is $10.1 Billion annually, with 88,000 fewer jobs by 2024

Congestion has a profound impact on the satisfaction with life and well-being of Ontarians, particularly those residing in the GTHA. Numerous reports highlight residents’ frustration with gridlock and heavy congestion, and the impact of congestion on well-being is well-documented in the satisfaction with life surveys conducted by Statistics Canada over the years.
Essentially, people generally feel more satisfied with life when they earn more. There is a predictable relationship between income and life satisfaction. When something lowers a person’s satisfaction with life, we can think of it as similar to losing income: just as a pay cut would reduce happiness, a drop in life satisfaction can be seen as a loss of financial value. To make up for that loss, one would need to provide additional income to restore their satisfaction to its previous level.
This logic underpins our social value methodology and aligns with the Green Book (UK) and OECD guidelines for estimating social value. It allows us to quantify the impact of factors that reduce happiness, such as traffic congestion, by determining the amount of compensation needed to maintain an individual’s satisfaction at pre-issue levels.
Quality of life of commuting Ontarians in congestion reduced by 6%.
$43.6 Billion impact in Ontario, equivalent 4% of its economy.
$34.6 Billion in the GTHA, equivalent to 6% of its economy.

We estimate that, on average, congestion reduces a commuters’ satisfaction with life by up to 6%. To understand the significance of this decline in well-being, we convert it into income equivalents, as described above. The results entail the estimated social value costs, and they are substantial.
In 2024, the social value impact of congestion in the GTHA is estimated at $34.6 billion, representing 77% of the region’s total congestion costs. The average social cost per commuter in the GTHA is $5,900, which is 3.5 times higher than in the rest of Ontario. Notably, in the welfare economics literature, these estimates fall at the lowest end of the range of the estimated welfare impacts of congestion (Kahneman & Krueger, 2006; Frey & Stutzer, 2004; Di Tella, MacCulloch, & Oswald, 2003).
In terms of well-being, the most affected groups are:
• Mid-age earners (25-54 years), bearing the highest social value costs compared to other age groups.
• Lower-income groups (earning below $80,000 annually) are disproportionately impacted by the stress and time loss caused by congestion.
• Workers in industries such as manufacturing, construction, and healthcare face the highest social value impacts as their jobs often require daily commuting with limited flexibility.
Expectedly, the least affected group comprises people aged 65 and older, given their low exposure to heavy congestion.
Over the next 20 years, the population of Ontario is expected to grow by 4.2 million people, reaching 20.4 million. Within Ontario, the GTHA is expected to accommodate half of that growth, with its population increasing by 2.1 million people (or 25.9%). As a result, the labour force in the GTHA would increase by 1.1 million (a 22.9% increase relative to current levels), with Toronto experiencing the largest increase in absolute terms. In percentage terms, the highest labour force growth would be experienced in Halton and Peel.
As the labour force and number of businesses grow, there will be an increased demand for transportation and transit services in the region, thereby requiring improved infrastructure. Figure 2 shows the expected growth in the numbers of total commuters and those experiencing heavy congestion over the next 20 years.
Number of people experience frequent congestion expected to rise by 33% to 59% in the GTHA.
Economic cost expected to rise by 3 and 5 times in the GTHA with foregone jobs opportunities of up to 412,000 by 2044.
2 Total number of commuters (left), and those experiencing high levels of congestion (right)
Across the province, the expected growth in the number of total commuters is 1.9 million (a 35% increase), including an additional 1.1 million within the GTHA (a 33% increase).
The second plot in Figure 2 displays forecasted impacts under alternative future scenarios. We estimate that if congestion remains the same, there will be an additional 510,000 GTHA commuters experiencing heavy congestion, a 33% increase relative to current levels, and affecting a total of 2.1 million commuters by 2044 in the region. In the rest of Ontario, unchanged congestion will generate an additional 186,000 commuters experiencing heavy congestion, a 35% increase relative to current levels, affecting a total of 727,000 non-GTHA commuters by 2044.
Alternatively, if congestion worsens, up to 3.7 million commuters could be experiencing heavy congestion by 2044, which is a 76% increase relative to today, consisting of a 59% increase within the GTHA and a 127% increase in the rest of Ontario. In contrast, if congestion were to improve, our estimates indicate that the increase in the number of commuters experiencing heavy congestion would be limited to just 128,000 province-wide (a 6.1% increase).
Commuter volumes and congestion are expected to grow at different rates across GTHA regions. Figure 3 illustrates the projected increase in the number of commuters for each GTHA municipality by 2044.
Figure 3 Regional growth in commuters
Growth in Commuters
Looking ahead, if congestion levels remain unchanged, the annual cost of congestion could rise to $108 billion by 2044, equivalent to 6.2% of Ontario’s potential economic output and representing a 95% increase over today’s congestion costs. Of this total cost, almost 80% ($85.5 billion) would be incurred within the GTHA, with $42.5 billion (50%) representing social value costs due to the impact on resident’s well-being.
Table 3 Total costs of congestion by 2044 and the increase from today
In a worsening congestion scenario, congestion costs could reach $145 billion, severely impacting economic growth and quality of life across Ontario. This is more than 2.5 times the current annual cost of congestion in the province. While most of this additional cost would arise within the GTHA, worsening congestion would increasingly affect areas outside the GTHA, where costs are projected to rise by 205% outside the GTHA, compared to 144% within the GTHA.
3 Note that a 100% increase means that the value has doubled.
The results of our study are consistent with findings from the broader literature on the economic and welfare impacts of congestion. The economic cost of $12.8 billion for Ontario (1.1% of GDP) and $10.1 billion for the GTHA (1.8% of GDP) aligns with previous studies that have quantified the economic burden of congestion (Weisbrod, Vary, & Treyz, 2003; Hymel, 2009; Weisbrod & Fitzroy, 2011; Allen & Arkolakis, 2022). Additionally, our calculation of the social value impact—$43.6 billion for Ontario (4% of GDP) and $34.6 billion for the GTHA (6% of GDP)—is at the lowest range suggested by studies on the well-being costs of congestion (Kahneman & Krueger, 2006; Stutzer & Frey, 2008; Di Tella, MacCulloch, & Oswald, 2003). These figures represent 9.4% of the wages of those heavily affected, highlighting the substantial social costs of congestion.
Congestion in the GTHA is not merely a transportation issue— it is a fundamental economic and social challenge that undermines both business productivity and quality of life. The GTHA accounts for a significant portion of the congestion problem in Ontario, and without effective and immediate intervention, the situation is expected to deteriorate further. Tackling congestion is essential to unlocking Ontario’s economic potential and significantly improving the well-being of commuters, especially in the GTHA.
The report underscores the urgent need for targeted transportation infrastructure investments, improved public transit, and effective and innovative congestion management strategies to mitigate both the economic and social impacts of congestion. Immediate action is crucial to prevent further economic losses and to secure a higher quality of life for all Ontarians.
The Greater Toronto and Hamilton Area (GTHA) faces significant challenges with worsening traffic congestion. Home to over half of Ontario’s population, congestion in the GTHA not only increases travel times and reduces economic productivity but also severely impacts residents’ quality of life, limits access to jobs and services and raises infrastructure costs. This combination undermines the region’s capacity for sustainable growth and reduces the prosperity of its communities. With the GTHA being one of North America’s fastest-growing regions, with over 150,000 new residents annually, a comprehensive understanding of the impact of congestion on residents’ well-being and business productivity is a critical first step toward addressing this pressing issue.
As this study will demonstrate, congestion is not just a transportation issue but a core social problem for the GTHA and Ontario, significantly impacting residents’ life satisfaction. Additionally, congestion has a major economic cost, amounting to billions annually in lost productivity for Ontario and the GTHA. The travel delays and lost productivity due to congestion hinder the movement of goods and services and restrict people’s ability to commute to work, shop, and enjoy recreational activities, leading to declines in business revenues and overall quality of life. Furthermore, long commutes and unpredictable journey times discourage jobseekers from seeking employment in the region, further limiting economic mobility and productivity. Indeed, surveys indicate that over half of GTHA residents have even considered relocating due to daily frustrations with gridlock (Toronto Region Board of Trade, 2024).
Business leaders, policymakers, and residents agree on the urgent need for more efficient transportation infrastructure projects and expanded transit options to alleviate the traffic crisis and enable the GTHA to achieve its full social and economic potential. Immediate action is essential to reduce congestion and prevent further deterioration in business efficiency and quality of life. As this report seeks to illustrate, effective and innovative congestion management, by reducing congestion, can unlock Ontario’s economic potential and vastly improve well-being, especially for the GTHA’s workforce.

The objective of this study is twofold. First, it aims to provide a comprehensive assessment of the impact of congestion in the GTHA and the rest of the province over the past decade. This includes examination of:
• The lost economic opportunities due to congestion; and
• The social value impacts of congestion, addressing how congestion affects the well-being of commuters and residents.
Second, the report seeks to understand the risks that congestion imposes on the GTHA’s and Ontario’s economic prosperity and social well-being over the next 20 years under various congestion scenarios. In particular, the projected social and economic costs to the GTHA and Ontario are examined under the following scenarios:
• Congestion levels remain the same;
• Congestion improves, with the average number of days a person experiences congestion decreasing by 1 day per week (for those who experience congestion at least once per week); and
• Congestion worsens, with the average number of days a person experiences congestion increasing by 1 day per week (for those who do not already experience congestion everyday).
The GTHA, which houses over 50% of Ontario’s population and accounting for most of the congestion in the province, is a focal point for analysis, with results for that region being compared to results for the rest of Ontario throughout the report.
It is important to note that methods for addressing congestion—such as enhanced transit options, better employee/employer or supplier/user co-location to minimize travel, and increased highway efficiency and capacity—are separate issues not examined in this study.

As the population of Ontario has grown, so has the number of vehicles on the road. The Ontario Ministry of Transportation (MTO) reports traffic volumes at over 2,600 locations across the province, enabling the identification of key trends in both car and truck traffic volumes the GTHA and throughout Ontario. These trends are presented in this section.
Overall, traffic has increased across all municipalities in Ontario. However, the rate of growth varies by region and vehicle type. Using MTO AADT (average annual daily traffic) and Truck AADT from 2,600 locations across the province, the disparity between the GTHA and the rest of the province becomes evident, as Figure 4 shows. Since 2001, municipalities in the GTHA have seen a 37% increase in car traffic, compared to a more modest 17% growth outside the GTHA. In contrast, truck volumes have risen more uniformly, with an average increase of 32% across municipalities both within and outside the GTHA.
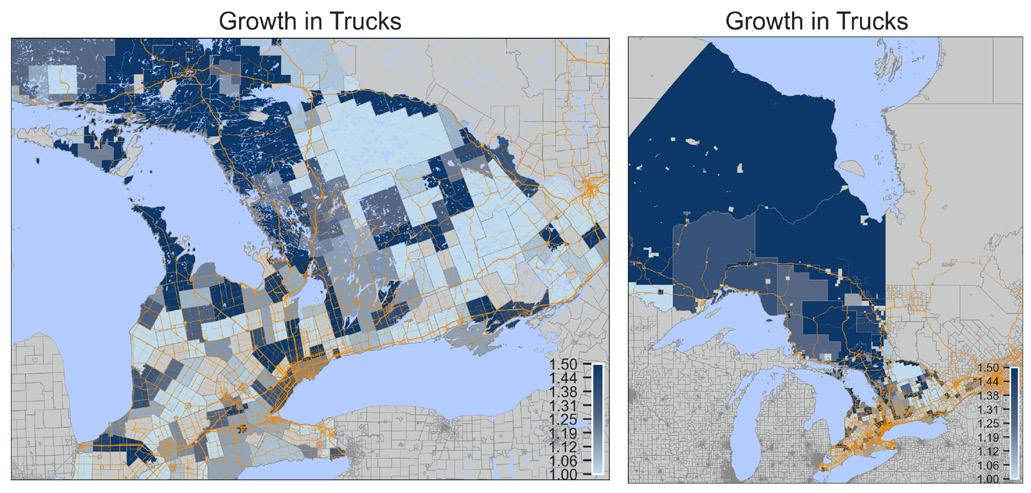
However, a closer look across municipalities, as shown in Figure 5, reveals that the averages mask significant differences between municipalities. Unsurprisingly, much of the growth in car traffic has been concentrated in expanding GTHA regions and nearby cities such as Barrie, London, and Kitchener-Waterloo. Truck traffic, however, is much more concentrated along key transportation routes and goods movement hubs, including some traditionally less-traveled routes such as Highway 12 and Highway 404 on the east side of Lake Simcoe.
5 Car and Truck traffic growth in the GTHA and surrounding regions
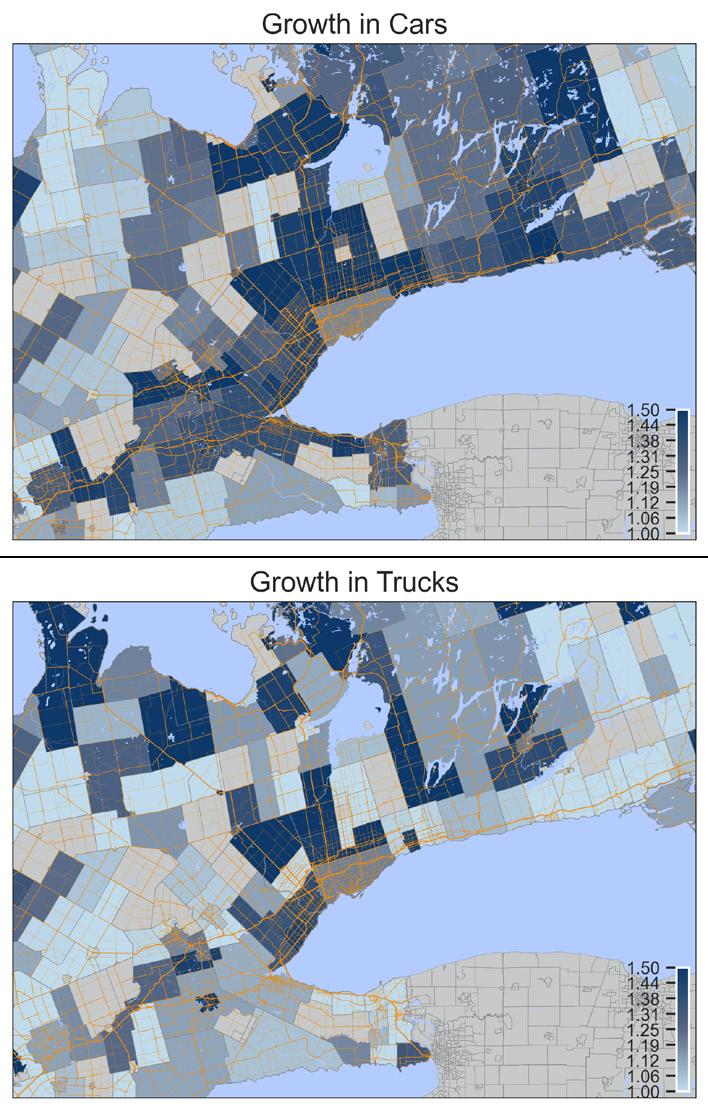
The City of Toronto itself, with greater transit availability and slower rate of population growth, has experienced relatively modest increases in car and truck traffic volumes compared to many nearby regions. Meanwhile, car traffic growth across Northern Ontario has been relatively light, but most areas have seen truck traffic increase by more than 50%, as shown in Figure 6. In some locations, such as near Thunder Bay, Sudbury, and Parry Sound, truck traffic has more than tripled since 2001.
This growth in truck traffic, driven primarily by increases in commercial vehicles, reflects the growing economic activity in Northern Ontario. Ensuring that goods can efficiently reach markets and required inputs can arrive at production sites is essential to sustaining the region’s long-term growth and prosperity.
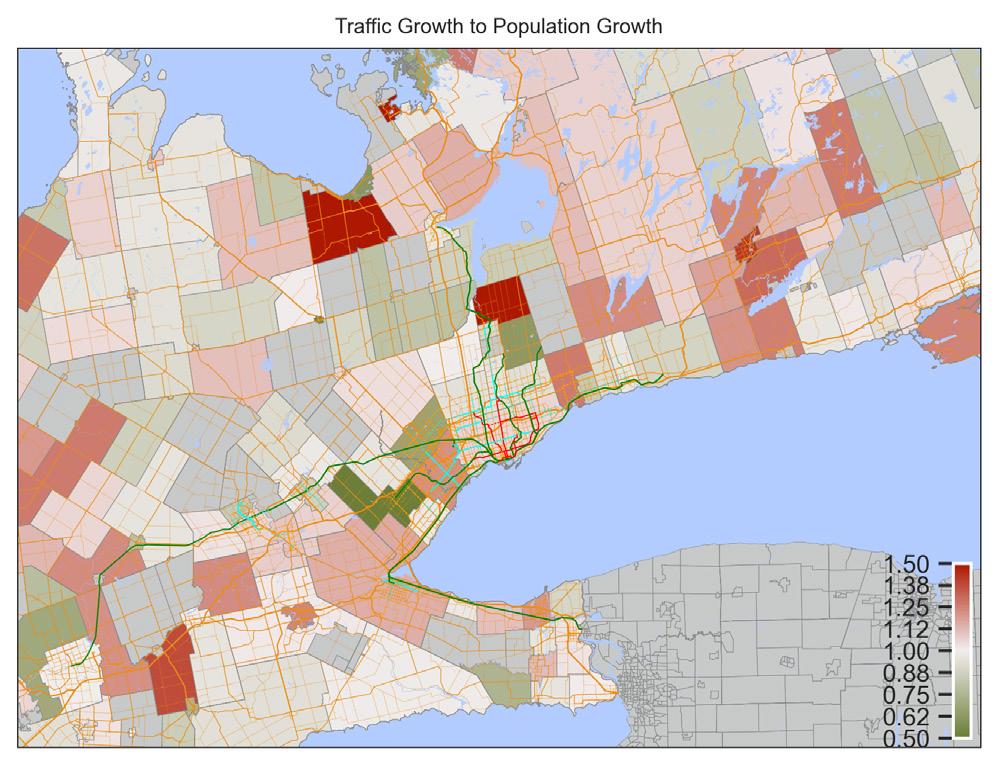
The growth of traffic relative to population highlights the changing dynamics within the region. As shown in Figure 7, traffic growth relative to population growth has varied across areas. Red regions indicate traffic growth outpacing population growth, while green regions show population growing faster than traffic. Key areas where traffic has grown more rapidly than population include the east of Lake Simcoe, as well as areas surrounding Peterborough and Hamilton. In these regions, more residents and businesses are moving in and commuting back toward Toronto, resulting in higher traffic-to-population growth ratio. Conversely, regions such as parts of York and the outskirts of the GTHA have more population growth than traffic growth. These regions have seen considerable new development, where not all residents are commuting as frequently.
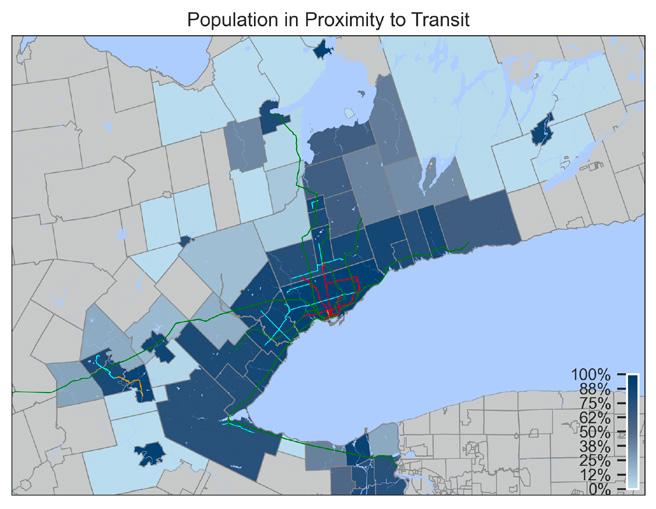
Addressing growing vehicle traffic is only one facet of the broader transportation challenge. Accessibility of public transit plays an equally important role in meeting the mobility needs of the population, especially in growing regions. From 2001 to 2017, GO ridership rose 75% (partly due to significant system expansion) while TTC ridership increased 25%. While transit ridership fell during the pandemic, it is now rebounding. Across the GTHA, a significant portion of the population are considered to have access4 to public transit, as shown in Figure 8. Transit access is the highest in the City of Toronto, where over 93% of residents have access. However, outside major population centres, access drops sharply, with fewer than 20% of the population of Halton Hills, Caledon, and King Townships having access to transit.
4
Population in Proximity to Transit
Mississauga (Peel)
Richmond Hill (York)
Pickering (Durham)
Brampton (Peel)
Newmarket (York)
Markham (York)
Oshawa (Durham)
Oakville (Halton)
Ajax (Durham)
Aurora (York)
Milton (Halton)
Burlington (Halton)
Vaughan (York)
Whitby (Durham)
Hamilton (Hamilton)
Clarington (Durham)
Whitchurch-Stouffville (York)
Georgina (York)
East Gwillimbury (York)
Brock (Durham)
Uxbridge (Durham)
Scugog (Durham)
Halton Hills (Halton)
Caledon (Peel)
King (York)
Access to Transit
Toronto (Toronto) % of Population
These points indicate that as these regions continue to grow, expanding access to the public transit network will also be key in addressing the widespread congestion challenge.
While traffic volumes alone do not necessarily indicate congestion, in Ontario—and particularly in the GTHA— growing traffic volumes have led to significantly more congestion. In Ontario, since 2010, the number of commuters experiencing heavy5 congestion has been increasing steadily, according to Statistics Canada’s General Social Surveys conducted between 2010 and 2024. From 2010 to 2015, there was a 33% increase in the number of people who experience heavy congestion, and by 2024, this figure has risen by another 31%. To fully understand the social and economic impacts of this congestion, it is essential to have a detailed picture of the characteristics and circumstances of those affected. This section explores these details.
As shown in Figure 9, congestion affects people across all ages, sexes, and household types, though to varying extents. Larger households, which face limited options for minimizing commutes while meeting the needs of multiple income earners, tend to experience congestion slightly more frequently. Younger individuals also tend to experience more congestion, partly due to less flexibility to relocate because of lower incomes and a greater willingness to tolerate congestion.
5 High or heavy congestion is defined as three or more days per week.
Figure 9 Age and household profile of those experiencing frequent congestion
People Experience High Congestion
15 to 24 years
25 to 34 years
35 to 44 years
45 to 54 years
55 to 64 years
65 years and over
People Experience High Congestion
As showcased in later sections, exposure to congestion has a considerable impact on people’s satisfaction with life, which contributes to the overall cost of congestion through a social value metric.


People working in different industries and occupations are also impacted to varying degrees. Across industries, as shown in Figure 10, employees in the health and manufacturing sectors are among those most frequently exposed to heavy congestion. This is because both of these sectors’ reliance on large fixed-asset locations, such as hospitals and manufacturing plants, which require frequent employee commutes. Still, fewer than 40% of all workers in those sectors face high congestion. In contrast, over half of employees in utilities, wholesale, and arts and recreation face heavy congestion, despite these sectors employing fewer people overall. These industries generally require travel to specific sites and offer fewer employment opportunities, leading to greater exposure to congestion.
Figure 10 Employees by Industry Sector experiencing high congestion
High Congestion High Congestion
Wholesale trade Utilities
Arts, entertainment and recreation
Finance and insurance
Professional, scientific and technical services
Construction
Transportation and warehousing
Other services (except public administration)
Information and cultural industries
Administrative and support, waste management
Public administration
Health care and social assistance
Real estate and rental and leasing
Manufacturing
Educational services
Retail trade
Accommodation and food services
Mining, quarrying and oil and gas extraction
% of Workers
Industries with a lower skill base and diverse distribution of businesses, such as retail and food services, enable people to find employment opportunities that minimize their exposure to congestion.
From an occupational perspective, roles requiring specialized skills, such as management, and occupations with variable work locations, such as trades, have higher exposure to congestion—both in terms of the percentage of workers and the total number of employees. Additionally, the generally higher incomes associated with management roles, and their housing preferences, help compensate for the well-being impacts of commuting. These findings are presented in Figure 11.
Figure 11 Employees by Occupation experiencing high congestion
Congestion
Congestion
Management occupations
Natural and applied sciences and related
Occupations in art, culture, recreation and sport
Trades, transport and equipment operators
Business, finance, and administrationoccupations
Occupations in education, law and social,community service
Health occupations
Sales and service occupations
Occupations in manufacturing and utilities
Natural resources, agriculture and related
% of Workers
These points indicate how exposure to and tolerance for congestion vary by industry sectors and occupations.

Congestion is a significant factor that affects the operational efficiency of businesses across Ontario, particularly by increasing transportation costs and lowering productivity. According to the Canadian Survey on Business Conditions (Statistics Canada, 2024), over 22% of all businesses in Ontario report that transportation costs are a key obstacle for their operations. Additionally, 16% of businesses highlight supply-chain issues as a general challenge. These results are detailed in Figure 12.
Supply-chain and transportation challenges are the most pronounced in goods-heavy sectors. For example, in the retail trade sector, 45% of businesses cite transportation costs as a major issue. Similarly, 43% of manufacturers indicate they face supply-chain challenges, many of which are exacerbated by congestion. It is important to keep in mind that unlike some international factors affecting supply chains, congestion is a challenge that provincial and local governments can influence through policy and infrastructure decisions.
12 Transportation and supply-chain challenges faces by Ontario businesses
Challenges
Transportation and warehousing Wholesale trade
Accommodation and food services Construction
Agriculture, forestry, fishing and hunting Manufacturing
Administrative and support, waste management
Mining, quarrying, and oil and gas extraction
Real estate and rental and leasing
Other services (except public administration)
Professional, scientific and technical services
Information and cultural industries
Arts, entertainment and recreation
Finance and insurance
Health care and social assistance
trade % Of Businesses
challenges
The impact of congestion extends beyond just the transportation of goods. It also affects the ability of businesses to attract and retain employees. Congestion increases the difficulty of commuting, which can deter potential employees from seeking employment in highly congested areas or prompt current workers to seek alternative work that is closer to home or in less congested areas. Indeed, as shown in Figure 13, across Ontario, 29% of businesses report difficulties in attracting employees, while 20% struggle to retain skilled employees. It is believed that congestion is a key contributor to these challenges. Such issues are even more severe in the manufacturing sector, where 47% of businesses face challenges in attracting workers and 33% report difficulty retaining them.
Figure 13 Recruitment and retention challenges faced by Ontario businesses
Accommodation and food services
Manufacturing
Retail trade
Mining, quarrying, and oil and gas extraction
Health care and social assistance
Other services (except public administration)
Administrative and support, waste management
Construction
Finance and insurance
Wholesale trade
Arts, entertainment and recreation
Professional, scientific and technical services
Real estate and rental and leasing
Agriculture, forestry, fishing and hunting
Information and cultural industries
Transportation and warehousing
For many employees, the personal toll of commuting through congested areas can outweigh the benefits of a job, prompting them to seek alternative employment. In this way, congestion becomes a key factor affecting not only business logistics but also workforce stability and productivity in Ontario’s key sectors.
Across Ontario, investment in transportation networks reached $13 billion in 2023, having almost tripled over the last 20 years in constant dollar terms (2.68 times greater), as shown in Figure 14.
Figure 14 Infrastructure Investments in Transit and Transportation
Transit and Transportation Investment
$14,000
$12,000
$10,000
$8,000
$6,000
$4,000
While the increase in public investment has been significant, it’s important to investigate whether it is keeping pace with Ontario’s growing population and economy. Investment per capita provides a useful, though imperfect, measure to gauge investment relative to population size. In reality, investment in new infrastructure should align with population growth rather than just population size. For example, if a region’s population remains stable and is adequately served by existing transportation networks, investment beyond maintenance and renewal would be unnecessary, regardless of the region’s total population. However, if that region begins to grow, the new transportation infrastructure investment would need to scale with the increase in population. Supporting a population growth of 1,000,000 people, for instance, would require approximately ten times the investment for a population growth of 100,000 people.
Figure 15 Investment per capita (left) and investment per net additional person in the population (right). 5-year rolling average, 2024 constant dollars $400
and Transportation Investment
As shown in Figure 15, while investment per capita steadily increased between the mid-2000s and 2018, it recently plateaued at around $750 per capita. In contrast, relative to 2015, investment relative to population growth has fallen by 49%. This is a strong indicator that investment is not keeping pace with the growing demand.
While much of the discussion on housing affordability and its impact on well-being has focused on the direct shelter expenses (Canadian Centre for Economic Analysis, 2024), consideration of affordable transportation costs is also important. As shown in Figure 16, transportation is the second largest expense category for all income quintiles, except for the lowest quintile, where it is just slightly lower than food expenditures. On average, transportation costs for Ontario households are 23% higher than food expenditures.
As incomes rise, the percentage of income allocated to shelter decreases, and households tend to spend more on transportation than on food. This is partly due to higher-income individuals opting for larger commutes to access lower density areas and larger homes. While some studies have suggested that greater commuting distances are linked to higher incomes (C.D. Howe Institute, 2013), it is more likely that higher incomes enable longer commutes, allowing individuals to afford larger homes farther than work.
While congestion can cause delays and supply chain inefficiencies, the impact on final consumer prices and the cost of living is difficult to quantify. Though transportation and transportation-dependent businesses may incur additional costs due to congestion, such as fuel expenses or the need for extra inventory, the impact on prices is not straightforward to identify. In competitive markets, businesses have various options: they may absorb these costs, partly pass them on to consumers or, restructure operations to mitigate the impact. Given these complex dynamics and the diverse responses of shippers to congestion, it is difficult to disentangle the effects of congestion on businesses from those on consumers.
In addition, while congestion may raise costs to certain sectors, other sectors such as fuel retailers or mechanics may benefit, potentially reducing price pressures. These challenges likely explain the absence of economic studies that have quantitatively linked congestion to inflation.
Adding to the complexity, Duranton and Puga (2015) investigated how congestion affects urban land use, often making less congested areas more desirable and driving up housing prices in those regions. This increase, coupled with potentially higher commuting costs, contributes to an increased cost of living for those seeking to avoid congested zones. Conversely, congestion can also elevate housing prices in congested areas, as some households choose to relocate closer to work to reduce travel. For these households, the reduction in commuting expenses may offset higher housing prices, potentially leading to a net decrease in overall expenses if travel savings are substantial.
However, literature indicates that congestion’s primary impact on households is its deterrent effect on business investment and its role in slowing employment growth (Hymel, 2009). This dynamic negatively influences the cost of living by reducing productivity and limiting employment opportunities—factors captured in our economic analysis.

The framework used in this study to measure the impact of congestion draws from well-established methodologies from both the UK’s Green Book and the OECD. These frameworks emphasize the importance of evaluating not only the economic impact of an event but also its social value impact to provide a more comprehensive understanding of the total effect (U.K. Government, 2020; U.K. Government, 2020; OECD, 2013; OECD, 2017; OECD, 2020). This approach is particularly relevant for assessing the multifaceted effects of congestion, as it impacts both economic productivity and the well-being of individuals and communities.
The Green Book, published by the UK Treasury, is a central reference for evaluating public policies and projects, advocating a broad, inclusive approach to impact assessment (U.K. Government, 2020; U.K. Government, 2020). It promotes the measurement of social value alongside traditional economic costs and benefits. In recent years, the Green Book has expanded its guidance to include non-market outcomes, which are particularly useful in understanding the full range of impacts caused by congestion.
The Green Book’s approach to cost-benefit analysis (CBA) and social cost-benefit analysis (SCBA) encourages the inclusion of factors such as well-being, social cohesion, and environmental sustainability in the study of the socioeconomic impacts of events (U.K. Government, 2020). When applied to congestion, this means accounting for both the economic costs—like reduced productivity from delayed commutes—and the social costs, such as diminished quality of life for commuters due to stress and lost time. That is, the Green Book framework asserts that the total impact of an event or policy should include both economic impacts (e.g., changes in GDP, employment, and business investment) and social value impacts (e.g., changes in well-being, community impacts, and environmental consequences).
By applying this comprehensive framework to analyze the impacts of congestion, we gain a deeper understanding of its true costs, which extend beyond the economy to affect the social fabric of communities. Thus, the Green Book approach supports a more nuanced and complete evaluation of the total impact of congestion.
Similarly, the OECD has increasingly integrated the concept of social value into its frameworks for evaluating public policies, particularly in its work on well-being and inclusive growth. In its various guidelines, such as the Guidelines on Measuring Subjective Well-being (OECD, 2013), the OECD emphasizes the importance of considering subjective well-being and non-market social outcomes alongside economic performance when assessing the impact of policies.

The OECD’s approach is particularly relevant for assessing congestion, as it explicitly acknowledges that the impact of an event extends beyond just measurable economic factors like productivity and output. For instance, the OECD’s “Better Life Index” and “How’s Life?” reports encourage policymakers to account for how factors like commute times and transportation infrastructure affect individuals’ life satisfaction, mental health, and personal well-being (OECD, 2017; OECD, 2020).
By embracing this broader view, the OECD advocates that the total impact of congestion includes not only economic impacts—such as the effects on business efficiency and workforce productivity—but also the social value impacts, such as the psychological toll on commuters and the strain on family and personal life caused by long, unpredictable journeys.
Both the Green Book and the OECD frameworks support the idea that a comprehensive evaluation of congestion’s impact must encompass both its economic and social dimensions. For example, while congestion might reduce business productivity by delaying goods and workers, it also erodes social well-being by increasing stress and reducing the quality of life for commuters. These social impacts, which may be harder to quantify, are nevertheless crucial for understanding the full cost of congestion.
This approach is reflected in our study’s measurement framework, where we assess the total impact of congestion as the sum of its economic impact and its social value impact. This allows for a holistic evaluation, ensuring that policymakers can fully appreciate how congestion not only hampers economic growth but also undermines societal welfare.
The Green Book and OECD frameworks justify this dual approach. Both sources recognize that focusing solely on economic returns, such as changes in GDP or employment, may overlook significant social costs that can affect long-term prosperity and the well-being of individuals. For instance, reducing congestion could lead to better productivity, but its social benefits, like improved mental health and increased life satisfaction, provide equally important value.
Our methodology for assessing the impact of congestion leverages CANCEA’s socio-economic agent-based model of Canada, which includes detailed data from over 29,000 locations across Ontario. This model is designed to capture both microeconomic and social dynamics, following a rigorous approach to quantifying congestion’s total impact on the GTHA and Ontario as a whole.
The total impact of congestion is derived from the sum of its economic impact and social value impact:
By summing the economic and social value impacts, our methodology provides a comprehensive estimate of the total cost of congestion. This dual approach ensures that both market-based costs and non-market social impacts are accounted for, offering a more holistic perspective on the challenges that congestion presents for the GTHA and Ontario as a whole. Our methodology captures two primary sources of congestion impacts:
1. Economic Costs: Congestion directly impacts business productivity by increasing delays in the transport of goods and services and reducing the efficiency of workers. This is evident in both transportation-related sectors and the broader supply chain, where bottlenecks and inefficiencies propagate across industries. For example, delays in goods movement can cause disruptions in production schedules, leading to increased costs and reduced competitiveness.
2. Social Value Cost: Congestion imposes significant costs on commuters by diminishing their quality of life. This includes increased stress, lower life satisfaction, and reduced well-being, as extended commute times infringe upon
time that could otherwise be spent on leisure, family, or personal pursuits. These non-market costs are converted into monetary units using income equivalence approaches, which estimate the financial compensation needed to offset these intangible losses (Frey, Luechinger, & Stutzer, 2004). This approach is increasingly used in transport and infrastructure studies to provide a more accurate reflection of the total societal burden of congestion.
The economic impact of congestion is calculated by assessing its broader effects on business productivity, labour demand, and the costs associated with logistics and transportation. Our methodology uses CANCEA’s agent-based model to apply microeconomic principles across all businesses, industries, and occupations to estimate the reduction in GDP. This model allows us to simulate how congestion disrupts the efficient functioning of businesses and the economy at large, incorporating sector-specific dynamics and labour market behaviours. Specifically, we quantify the costs borne by businesses due to delays in goods movement, reductions in worker productivity, and increased operational expenses. These effects are most severe in transportation-dependent industries, but they also cascade through the broader supply chain, affecting a wide array of sectors.
Using our agent-based model, we can parameterize the broader economic impacts of congestion on business productivity and operational efficiency. We aim to capture the fact that congestion significantly raises transportation costs for businesses, leading to higher fuel consumption, longer delivery times, and the need for additional resources, such as vehicles or shifts. This directly increases operating costs for businesses, particularly in urban areas. For instance, Weisbrod et al. (2003) found that in cities like Chicago, alleviating congestion could save businesses between $252 million and $272 million annually, primarily through reductions in transportation-related costs. Similarly, Allen & Arkolakis (2022) reported that a 10% increase in traffic flows in the U.S. highway network leads to a 7.4% increase in travel time, which raises transportation costs by 0.9%.
By simulating these dynamics within the agent-based model, we capture both direct transportation costs and their ripple effects throughout the supply chain. For example, the increased costs of goods movement lead to higher input prices, low-
er profit margins, and greater uncertainty in production schedules. These supply chain effects often result in inefficiencies that affect a wide range of industries, from manufacturing to retail.
Congestion has a complex relationship with labour demand and productivity, which is captured in our agent-based simulation. The model parameterizes how congestion limits workers’ access to jobs, reducing labour market efficiency and productivity across industries. This is particularly problematic in sectors where mobility and proximity to job opportunities are crucial. According to Hymel (2009), reducing congestion could significantly boost employment growth, with an elasticity of -0.02 between employment growth and per capita travel delay. Our simulation mirrors these findings, illustrating how alleviating congestion expands the labour market by increasing accessibility, thereby boosting employment and productivity.
Congestion’s effect on productivity is also tied to agglomeration economies—businesses’ ability to benefit from being close to specialized workers and suppliers. Weisbrod et al. (2003) demonstrated that congestion reduces these economies of scale, with a 6% reduction in delivery delays leading up to a 0.88% increase in business productivity. By integrating such empirical parameters into our agent-based model, we simulate how variations in congestion levels impact overall labour market dynamics, including job creation and business efficiency.
Our model allows for a detailed simulation of the costs of congestion to logistics and transportation, applying microeconomic analysis to industries that are heavily reliant on efficient goods movement. Congestion increases transportation costs by lengthening delivery times and increasing fuel consumption, which in turn forces businesses to adjust their operations. Weisbrod & Fitzroy (2011) noted that congestion forces businesses to alter delivery schedules, hold more inventory, and increase their fleet size, all of which shrink market areas and reduce competitiveness.
Using our agent-based model, we simulate these logistical adjustments across various industries, quantifying the impact of increased operating costs and supply chain disruptions. The model also accounts for the indirect effects of congestion on businesses, such as higher wages required to compensate workers for longer commutes and the reduced ability of businesses to attract talent in congested regions.

The use of CANCEA’s agent-based model allows us to parameterize and simulate both the direct and indirect costs of congestion on the economy. This approach goes beyond static analyses by capturing the dynamic interactions between businesses, workers, and industries across the province. By incorporating microeconomic principles into a spatially detailed model, we estimate the reduction in GDP caused by congestion in a way that reflects both the immediate costs to businesses and the broader economic repercussions. This simulation-based methodology ensures that we not only quantify the explicit costs of congestion—such as higher transportation expenses—but also capture the subtler, yet substantial, effects on labour markets, business productivity, and regional economic growth.
Based on the aforementioned economic studies, the model incorporates improved agglomeration effects due to reduced congestion, which imply a 1.2% increase in overall productivity for every 10% reduction in congestion. Additionally, we incorporate a 10-fold increase in business relocation odds in regions with high congestion for businesses in the professional and financial services sectors. The benefits of greater productivity and business formation compound over time, with increasingly more business growth, higher wages, and investments.
Importantly, we also incorporate the converse of the relationships detailed above, so that increases in congestion lead to productivity losses.
The social value impact, as measured in our analysis, represents the cost to commuters beyond their direct work activities, focusing on how congestion affects their overall well-being. To model these effects, we use CANCEA’s agent-based model, which simulates the changes in well-being associated with exposure to congestion. This model combines microeconomic principles with agent-specific dynamics, supported by detailed statistical data from well-being surveys. Through this, we capture the multifaceted effects of congestion on individual quality of life, including aspects such as life satisfaction and stress.
In our analysis, each agent’s well-being function is informed by data from successive cycles of Statistics Canada’s General Social Survey (GSS) and the Canadian Community Health Survey (CCHS). These datasets reveal strong correlations between individual characteristics and well-being levels, which are reflected in our model through linear regressions adjusted for interactions between independent variables and non-linear relationships between well-being and certain characteristics. This approach is supported by extensive research on the links between a person’s well-being and the community and environmental circumstances they face (Lu, Schellenberg, Hou, & Helliwell, 2015; Helliwell & Wang, 2011; Helliwell, Huang, & Wang, 2015; Kytta, Broberg, Haybatollahi, & Schmidt-Thome, 2016; Layard, Mayraz, & Nickell, The marginal utility of income, 2008).
To quantify the non-economic impacts of congestion, we use income equivalence approaches, which estimate the additional income required to offset reductions in well-being due to longer commute times and increased stress. This method, advocated by Frey et al. (2004), allows us to express the social value cost in monetary terms comparable to traditional economic costs. Such an approach aligns with OECD recommendations, which emphasize the importance of incorporating social value metrics when evaluating infrastructure projects (OECD, 2013). It also reflects a growing body of research advocating for the inclusion of well-being and life satisfaction measures in cost-benefit analyses (Frey & Stutzer, 2010; Stiglitz, Sen, & Fitoussi, 2009; Layard, 2010).
For example, Kahneman and Krueger (2006) found that commuting, particularly in congested conditions, significantly reduces well-being. The psychological toll of commuting was estimated using experience sampling and life satisfaction data, suggesting that individuals would need a substantial income increase—up to 20-30% of their salary—to maintain life satisfaction in the face of daily, congested commutes. Similarly, Stutzer and Frey (2008) demonstrated that commuters experiencing congested traffic would need a 40% salary increase to maintain their well-being when the commute exceeds 20 minutes.
The OECD (2019) also emphasizes the relationship between transportation infrastructure and subjective well-being, noting that factors like commuting time can be translated into income equivalents to reflect the broader costs of congestion on quality of life. Frey and Stutzer (2004) further demonstrated that individuals often misjudge the long-term negative impact of commuting on their well-being, with compensation levels in their study reaching 30-50% of annual income.

Incorporating these well-being dynamics into CANCEA’s agent-based model allows us to simulate how individual agents, representing people with unique characteristics, experience and respond to congestion over time. The model applies microeconomic principles along with agent-specific dynamics to assess the longitudinal impacts of congestion on agents’ well-being, while also accounting for cross-sectional differences across various demographic groups. This approach allows for a granular understanding of how congestion affects well-being differently for individuals based on factors such as commute duration, income level, and sensitivity to stress.
For instance, our simulation accounts for how individuals with higher incomes might be more willing to endure longer commutes, while those in lower-income brackets may experience a disproportionate impact on their quality of life due to congestion. These nuances are essential in providing an accurate assessment of social value losses.
By accounting for social value impacts—such as increased commuting times and diminished life satisfaction—our methodology provides a more comprehensive understanding of how congestion not only impairs economic output but also erodes social welfare, especially in highly congested regions like the GTHA. The inclusion of social value in this analysis ensures that both tangible economic costs and intangible social costs are considered, offering a holistic view of the total impact of congestion.
In this study, the estimated income compensation required to offset the negative effects of traffic congestion on well-being is reported in the next section and falls within the ranges established by the literature. The results provide critical insights for policymakers when evaluating infrastructure investments and their broader societal impacts.
This section presents our results regarding the economic and well-being impacts of congestion in 2024. Overall, we estimate that, in 2024, congestion will cost Ontario a total of $56.4 billion dollars, of which 77% arises from the social value cost of congestion. Within the GTHA, the total cost of congestion is estimated at $44.7 billion, of which $34.6 billion (77% of the total) stem from social value costs. The remaining balance of $10.1 billion corresponds to lost economic growth. To understand the source of these costs in more detail, the following subsections detail the baseline and counterfactual scenarios, from which we derive the economic and social value costs of congestion.
To calculate the total impact of congestion in 2024, two key measures—economic impact and social value impact—must be determined. Both rely on comparing a baseline scenario (the historical experience of congestion) with a counterfactual scenario where the level of congestion is significantly reduced. The difference between these two scenarios allows us to estimate the total impact of congestion on both the economy and social well-being.
1. Baseline: The baseline scenario represents the historical experience with congestion. This reflects the current level of congestion that Ontarians have faced over the past years, specifically the frequency and intensity of their exposure to traffic congestion.
2. Counterfactual Scenario: The counterfactual scenario used in this study assumes a reduction in congestion. Specifically, those currently experiencing frequent congestion (i.e., every day or three to four days per week) would experience only one or two days of congestion per week. Those already experiencing less frequent congestion (one or two days per week or none) would see no change. This reduced-congestion scenario is used as the point of comparison to evaluate the potential benefits of reduced traffic congestion.
The general formula to evaluate congestion in this study can be expressed as the difference between the historical experience, and the counterfactual where no is exposed to more than two days of congestion per week. Our choice of a more conservative counterfactual—reducing congestion to a maximum of two days per week—reflects a more realistic and moderate approach. We do not assume the total eradication of congestion, but rather a practical reduction. This is consistent with the literature (Litman, 2011; Metrolinx, 2008). Furthermore, we wanted to choose a reduction scenario that was meaningful to commuters, rather than the excess above an economic optimal. In the 2008 Metrolinx report, the excess congestion is estimated to represent approximately 14-15% of total traffic during the AM peak period across different regions within the (GTHA). Our congestion counterfactual to a maximum of two days per week represents approximately a 10% decrease in overall congestion.
Several academic studies suggest that the complete elimination of congestion may be an unreasonable policy objective (Litman, 2011), and some level of congestion can be beneficial for several reasons. First, congestion is often a sign of economic vitality in urban areas, as it indicates that businesses and services are attracting people (Sweet, 2014). It has also been observed that moderate levels of congestion can stimulate job growth by encouraging businesses to locate in areas with dense consumer and labour markets, as noted by Hymel. Congestion can foster agglomeration economies, where businesses benefit from being close to one another, increasing productivity and innovation (Weisbrod, Vary, & Treyz, 2003).
Moreover, eliminating congestion entirely may lead to an overinvestment in infrastructure, resulting in diminishing returns where the economic and social costs of maintaining uncongested roads outweigh the benefits (Downs, 1962). A balanced approach, which reduces but does not eliminate congestion, is thus considered more feasible and sustainable according to these studies.
From an economic perspective, congestion directly impacts productivity by reducing the efficiency of goods movement, worker availability, and overall business operations. Since productivity losses accumulate over time, the economic impact of congestion compounds. To capture this compounding effect, we use a 10-year period (from 2014 to 2024) as the window for measuring how congestion has affected the economy. This period allows us to examine how the economy could have grown with reduced congestion and how it actually grew under the historical experience of congestion.
The economic impact for 2024 is calculated by comparing the growth of the economy over the past decade with lower congestion (the counterfactual scenario) against the growth of the economy with the historical level of congestion. The economic impact for 2024 thus represents the difference in productivity between these two scenarios, accumulated over the past 10 years.
This approach provides a cumulative measure of how much congestion has slowed economic growth in Ontario by hindering recent productivity. By comparing these two scenarios, one can calculate the difference in GDP, private investment, and employment from 2014 to 2024. These differences represent the total accumulated economic losses caused by congestion over the decade. To present these results in 2024 dollars, we adjusted for inflation and averaged the cumulative losses over the 10-year period to yield an annualized estimate of the impact of reducing congestion. This process provides a clearer picture of the annual economic impact of congestion in 2024, making it easier to apply to the current economic analysis.
The social value impact of congestion refers to the effect that congestion has on the well-being and life satisfaction of individuals. For this measure, the baseline scenario is the current self-reported satisfaction with life (well-being) of Ontarians under the historical experience of congestion. The counterfactual scenario assumes a reduction in congestion, with individuals who experience frequent congestion facing fewer days of it per week. The well-being of Ontarians is expected to improve under this reduced-congestion scenario.
The social value impact is calculated by comparing the well-being levels in these two scenarios. The difference in life satisfaction, measured as self-reported well-being in surveys, provides the basis for quantifying the social value impact of congestion. This approach follows income equivalence methods, where the decrease in well-being caused by congestion is expressed in terms of how much additional income would be required to offset the loss in life satisfaction.
Finally, the total impact of congestion for 2024 is calculated by summing the economic impact and the social value impact. This comprehensive approach ensures that both the tangible economic losses and the intangible social costs of congestion are considered in our analysis.
This framework allows us to quantify the overall burden of congestion in Ontario, accounting for both its effect on economic productivity and its impact on the well-being of individuals. By comparing the historical experience of congestion to a scenario where congestion is reduced, we can better understand the full cost of congestion to society.
The total social value impact of congestion on the GTHA for 2024 is estimated at $44.7 billion, with $10.1 billion (12%) attributed to economic impacts and $34.6 billion (77%) attributed to the impact upon the GTHA residents’ well-being. The total impact for the GTHA of $44.7 billion represents 79% of the entire $56.4 billion impact for Ontario.
Table 4 Total impact of congestion in 2024
The economic impact of congestion refers to the influence that traffic delays and inefficiencies have on the overall economy, encompassing key elements such as GDP, employment, business investment, and productivity. Essentially, economic impact analysis seeks to capture the shifts in economic performance resulting from specific conditions or policies.
When evaluating economic impact, it is important to examine the broader economy, rather than just individual sectors. This includes both direct and indirect effects. For example, while the direct impact of building infrastructure might include jobs created during construction, the indirect effects take into account how the new infrastructure improves transportation efficiency and boosts long-term business productivity.
In the case of congestion, it’s essential to measure the system-wide costs instead of focusing solely on specific transactions. For instance, higher fuel and vehicle maintenance expenses due to traffic delays may seem like a loss to drivers, but those costs translate into revenue for fuel retailers and mechanics, leaving no net impact on GDP from a macroeconomic perspective. Similarly, while increased wages for drivers may raise costs for companies, the net effect on GDP remains minimal as these costs are simply redistributed. Even if congestion leads to rising prices, it contributes to nominal GDP but not real GDP, as it only reflects inflation without improving productivity.
The economic literature discussed in Section 2.0 identified that the most significant economic impacts of congestion stem from its effect on productivity, which has a far-reaching and long-lasting impact on the economy. The disruptions caused by congestion, especially in relation to workforce efficiency and business operations, compound year after year. Key productivity-related impacts include:
• Improved Skills Matching: Reduced congestion makes it easier for employees to commute to jobs that match their skill sets, enhancing productivity for both workers and businesses.
• Business Expansion: With fewer delays, businesses operate more efficiently, spurring growth and creating additional job opportunities.
• Access to Larger Markets: When congestion is minimized, businesses can reach larger markets and manage their supply chains more efficiently, contributing to regional economic growth.
Over time, the economic losses from congestion accumulate, as missed opportunities and inefficiencies in one year reduce the potential for future growth. Each year of high congestion limits business investment, hinders skills alignment, and worsens the overall economic environment.
To quantify the annual economic impact of high congestion, we first simulate the cumulative economic losses from congestion, which was performed by incorporating the results of the economic literature cited in section 2.0 into CANCEA’s agent-based socio-economic model, spanning the 2014-2024 period.
3.3.1
We estimate that by the end of 2024, the cumulative economic losses from congestion in Ontario will be significant. From 2014 to 2024, if congestion in Ontario were reduced to at most 2 days per week, then for Ontario, in 2024:
• Real GDP in the Ontario would have been $35.5 billion larger (2.9% of the Ontario’s 2024 economy, slightly larger than Ontario’s entire Energy sector)
• Real GDP per capita would have been $2,200 greater (2.9% of current Ontario real GDP per capita)
• The economy would have generated $6.6 billion more real private capital investment into businesses, including $750 million more in manufacturing, $250 million more in construction, and $120 million more in professional and technical services.
• The economy would have generated 112,500 more job opportunities with better alignment between skills and employment due to easier commuting and economic growth.
Within the GTHA, in 2024:
• Real GDP in the GTHA would have been $27.9 billion larger (4.9% of the GTHA’s 2024 economy, equivalent to Ontario’s entire Retail Trade industry)
• Real GDP per capita would have been $3,400 greater (4.9% of current GTHA real GDP per capita)
• The economy would have generated $5.0 billion more real private capital investment into businesses, including $570 million more in manufacturing, $180 million more in construction, and $100 million more in professional and technical services.
• The economy would have generated 88,000 more job opportunities with better alignment between skills and employment due to easier commuting and economic growth.
Table 5 Cumulative economic costs of congestion from
Table 6 displays the averaged cumulative costs of congestion for 2024. We find that the annual economic impacts for 2024 for Ontario are:
• On average, real GDP in the Ontario could have been $12.8 billion larger (1.1% of Ontario’s 2024 economy);
• On average, with lowered congestion, the economy would have generated an extra $2.4 billion real private capital investment annually into businesses over the past 10 years; and
• On average, the economy would have generated an extra 40,500 job-years of employment
Within the GTHA:
• On average, real GDP in the GTHA could have been $10.1 billion larger (1.8% of the GTHA’s 2024 economy)
• On average, an additional $1.8 billion in annual real private capital investment into businesses would have been generated over the past 10 years
• On average, an additional 31,700 job-years of employment would have been generated
6
Average economic costs of congestion over the last decade
The analysis of congestion’s economic impact reveals the substantial, long-term consequences that traffic delays and transportation inefficiencies impose on Ontario’s economy. As demonstrated, the most significant impacts arise from congestion’s effect on productivity, which compounds over time, hindering economic growth across multiple sectors. While indirect costs, such as fuel and maintenance, might appear significant on an individual basis, they do not represent true system-wide losses. Instead, the real economic burden stems from productivity-related issues, such as misalignment of skills, inefficient business operations, and reduced regional market access.
Table 7 Summary of economic impact of congestion
By modeling both the baseline (historical congestion) and counterfactual (reduced congestion) scenarios, the analysis provides a clear picture of how alleviating congestion could have benefited Ontario and the GTHA over the past decade. The results are striking: billions of dollars in unrealized GDP, missed private capital investments, and tens of thousands of job opportunities lost due to congestion. From an industry perspective, industries which rely most on transportation and goods movement, such as transportation and manufacturing, are most significantly impacted by congestion. The annualized impact figures for 2024 offer a useful annual reference point for policymakers to grasp the potential economic benefits of reducing congestion and the urgent need to address these transportation challenges.
Manufacturing
Transportation and warehousing
Finance and insurance
Professional, scientific, and technical services
Wholesale trade
Retail trade Construction
Information and cultural industries
Educational services
Administration and support, and waste management
Real estate and rental and leasing
Health care and social assistance
Public administration
Other services (except public administration)
Accommodation and food services
Arts, entertainment and recreation Utilities
Management of companies and enterprises
Mining, quarrying, and oil and gas extraction
Agriculture, forestry, fishing and hunting
Average Annual GDP Impact by Industry
Average Annual Job Impact by Industry
Ultimately, the findings reinforce that congestion reduction is not only a matter of improving daily commute times but a critical driver of broader economic health, influencing growth, business investment, and employment opportunities. Proactive strategies to mitigate congestion will be vital to unlocking Ontario’s economic potential in the years ahead.
Social value is the well-being pillar of ESG mandates. Measuring the social value impacts of traffic congestion involves capturing the broader, less tangible effects that congestion has on people’s well-being. Instead of focusing solely on economic losses like wasted time or fuel costs, social value impact measurement evaluates how traffic congestion affects individuals’ quality of life. To do this, researchers often rely on life satisfaction data, which reflects individuals’ overall happiness or satisfaction with life, and translate changes in well-being into monetary terms using income equivalents. This approach provides a more holistic view of congestion’s impact on society.
Life satisfaction surveys are central to this methodology, as they gather subjective data on how people feel about their daily experiences, including commuting in traffic. Research consistently shows that commuting in congested conditions lowers life satisfaction. For example, Stutzer and Frey (2008) found that individuals commuting through heavy traffic experience significant decreases in life satisfaction, even when they are compensated with higher wages. Similarly, Kahneman

3.4.1
and Krueger (2006) revealed that commuting is one of the least enjoyable activities for most people, directly linking traffic congestion to reduced well-being.
The income equivalent approach is used to translate the decline in life satisfaction into a monetary value. This approach asks how much additional income would be required to restore an individual’s well-being to the level it was at before experiencing the negative effects of congestion. Studies like Di Tella et al. (2003) and Stutzer and Frey (2008) estimate that individuals would need between 30-40% of their income to compensate for the well-being loss caused by commuting in congested conditions. This calculation helps policymakers quantify the broader costs of congestion in a way that includes both economic and social dimensions. Ultimately, the social value impact of traffic congestion is driven by multiple factors, including time loss, stress, health impacts, social isolation, and job dissatisfaction. These factors cumulatively reduce life satisfaction, and the income equivalent provides a comprehensive way to assess the monetary value needed to compensate for these losses. By focusing on both economic and social value costs, this approach offers a deeper understanding of the true burden of traffic congestion on individuals and society.
The social value cost of congestion depends on the well-being of the population and how commuting impacts it. A person’s well-being depends on a wide variety of factors, which are explored in the following sections.
3.4.1.1
To establish a well-being baseline, we are required to measure the current self-reported satisfaction with life (well-being) of Ontarians under the current experience of congestion. Based on successive cycles of the Canadian General Social Surveys, for Ontario residents, we can conclude that congestion has a significant impact on the well-being of individuals.
The satisfaction with life scale is a Likert Scale of between 0 and 10 where respondents rate their satisfaction with life from 0 (very dissatisfied) to 10 (very satisfied). Most Ontarians report satisfaction with life scores between 6 and 9, with the Ontario average being 7.51. As Figure 18 shows, those Ontarians with no exposure to congestion have substantially higher satisfaction with life (on average) compared to those who experience congestion everyday. Namely, Ontarians with no exposure to congestion have an average satisfaction of life of 7.56, while those with daily exposure having a lower average satisfaction of life of 7.13. This is a significant deterioration in the quality of life of those exposed to daily congestion. Across the province, 36.5% of the population experienced heavy congestion (more than 3 days a week), with most of these individuals located within the GTHA. While the difference in average life satisfaction between those who experience daily congestion and those who never encounter it is just 6%, this figure somewhat obscures the broader impact. As shown in Figure 19, the modest shift in the average reflects a significant change in the overall well-being of the population.
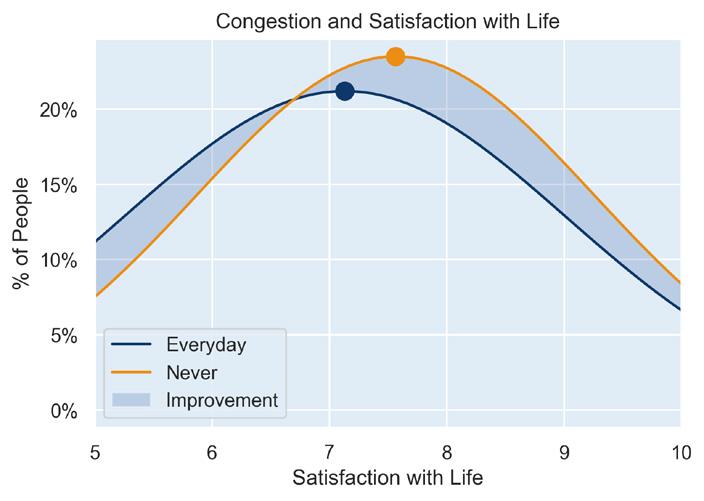
From an age group perspective, well-being sensitivity to heavy congestion affects all ages, as illustrated in Figure 20. The majority of those exposed to heavy congestion are between 25 and 54 years old. Notably, relatively few individuals aged 65 and older experience heavy congestion; when they do, it is predominantly due to work commitments.
Figure 20 Satisfaction with life impact of traffic congestion by age group (left) and number of people exposed (right)
Impact of Traffic Congestion by Age: Ontario
Exposure to Congestion by Age: Ontario
15 to 24 years 25 to 34 years 35 to 44 years
45 to 54 years 55 to 64 years 65 to 74 years 15 to 24 years 25 to 34 years 35 to 44 years 45 to 54 years 55 to 64 years 65 to 74 years
3.4.1.2 GTHA and Rest of Ontario
While only 36.5% of the Ontario population experienced heavy congestion (more than 3 days a week), within the GTHA, 49.2% of commuters experienced heavy congestion (more than 3 days a week). Outside the GTHA, 19.8% of commuters experienced heavy congestion.
Figure 21 Satisfaction with Life of Ontarians and congestion exposure in the GTHA and rest of Ontario
Impact of Traffic Congestion
or two days Three or four days
As shown in Figure 21, the well-being profiles of GTHA commuters and those in the rest of Ontario are similar, highlighting the persistent impact of congestion on well-being across regions. While the well-being profiles of commuters from the GTHA and the rest of Ontario are comparable, the exposure of the population to congestion differs significantly. Similar to the broader Ontario population, most GTHA residents have well-being scores between 6 and 9, with an average score of 7.45 in the GTHA.
The well-being response to congestion varies by age group, with lower well-being values typically observed among those aged 35 to 64 within the GTHA, largely reflecting the active workforce. Conversely, very few individuals aged 65 and older are exposed to heavy congestion.
Figure 22 Impact of Traffic Congestion by Age. GTHA and the rest of Ontario.
Impact of Traffic Congestion by Age: Rest of Ontario
Exposure to Traffic Congestion by Age: Rest of Ontario
If congestion in Ontario were limited to two or fewer days per week, the well-being of Ontario commuters could improve by up to 6%. This improvement can be converted into an income equivalent for each individual affected, based on each individual’s unique situation, and then aggregated into a social value measure.
The income equivalent approach is used to translate the change in life satisfaction into monetary terms. In the case of congestion, this approach assesses how much additional income would be required to restore an individual’s well-being to its level prior to experiencing the negative effects of congestion. Studies like Di Tella et al. (2003) and Stutzer and Frey (2008) estimate that individuals would need between 10-40% of their income to compensate for the well-being loss caused by commuting in congested conditions. This calculation provides policymakers with a way to quantify the broader costs of congestion, encompassing both economic and social dimensions.
The social value impact of traffic congestion is shaped by multiple factors, including lost time, stress, health impacts, social isolation, and job dissatisfaction. Together, these factors diminish life satisfaction, and the income equivalent provides a comprehensive measure of the monetary compensation needed to offset these losses. By considering both economic and social value costs, this approach offers a deeper understanding of the true burden of traffic congestion on individuals and society.
The income equivalents of well-being improvements for Ontario commuters aggregately reflect a social value of $43.6 billion, with 77% ($34.6 billion) of the social value cost located in the GTHA. On average, these results reflect approximately 9.4% of the annual income of those affected by congestion. Note that the result is not a willingness to pay to avoid congestion, but rather what people would generally require to improve their satisfaction with life to the equivalent level of the reduced level of congestion.
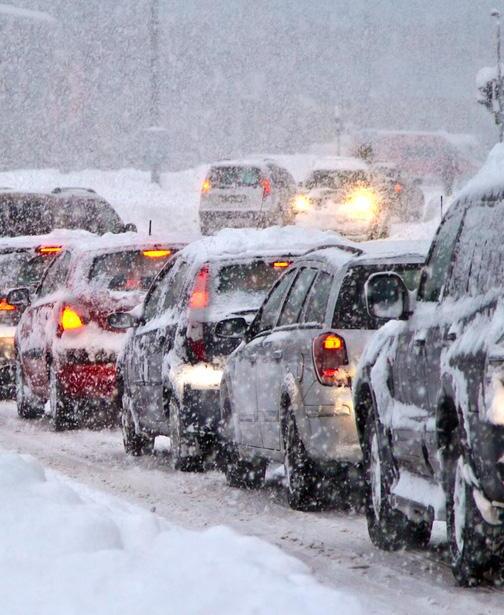
The total social value impact of congestion is presented in the following table, with breakdowns across the GTHA, rest of Ontario and the congestion impact for all of Ontario.
The average social value cost of congestion is $5,900 per commuter in the GTHA, compared to $1,700 per commuter outside the GTHA—over three times higher in the GTHA than in the rest of Ontario. This disparity is largely due to the great severity of congestion in the GTHA and the higher incomes of GTHA commuters.
Given that the GTHA accounts for 77% of Ontario’s social value cost of congestion and has a per-commuter cost three times higher than the rest of the province, the following breakdowns focus on those most affected by the well-being impacts of congestion within the GTHA.
On a per-person basis, the social value cost of congestion is primarily driven by:
• Mid-age groups: Individuals aged 25 to 34 in the GTHA account for 38% of the provincial social value cost. Details are given in Figure 23.
• Men in the GTHA: Representing 60% of the total social value cost. Details are given in Figure 24.
23 Social value cost by age group
24 Social value cost by sex
Social value costs by income group are given in Figure 25. Individuals earning less than $80,000 annually in the GTHA account for 69% of Ontario’s total social value cost of congestion, with those earning between $40,000 and $59,000 annually bearing the largest share of this cost.
By industry, employees in manufacturing, construction, and healthcare experience the highest social value cost of congestion. By occupation type, those in business/finance, trades, transport and equipment operation bear the social value cost of congestion. Figure 26 and Figure 27 present detailed breakdowns.
26 Social value cost by occupation
Utilities
Arts, entertainment and recreation
Construction
Other services (except public administration)
Information and cultural industries
Finance and insurance
Administrative and support, waste management
Real estate and rental and leasing
Transportation and warehousing
Professional, scientific and technical services
Public administration
Wholesale trade
Health care and social assistance
Manufacturing
Accommodation and food services
Retail trade
Educational services

Industries and occupations related to retail and food services tend to have a lower social value cost due to the broad distribution of businesses, allowing workers to find employment closer to home, and the predominance of lower wages, which limits commuting expenditures. In contrast, industries such as utilities and arts/entertainment exhibit a high average social value cost per worker, there are relatively few workers in these sectors. As a result, the total social value impacts in such sectors are relatively small.
To assess the potential future risk of congestion to Ontario’s population and economy, the same methodology used to calculate the current cost of congestion can be applied to project future impacts. By simulating forward from the current state in 2024 over the next 20 years, we can investigate how congestion may influence Ontario’s development, including within the GTHA.
To assess the sensitivity of social and economic congestion costs to varying levels of transit and transportation investment, three congestion scenarios are analyzed:
• Congestion Improves: Over the next twenty years, investments in transit and transportation reduce congestion by an average of one day per week for those currently experiencing high congestion.
• Congestion levels remain the same: Over the next twenty years, the proportion of people experiencing heavy congestion remains constant. It’s important to note that this is not a “do nothing” scenario; transit and transportation investments must keep pace with population and economic growth to prevent worsening congestion.
• Congestion Worsens: Over the next twenty years, people experience an additional day of congestion each week. Those who already experience daily congestion see no future increase.
To quantify the social and economic impacts, we adopt a reference scenario similar to the historical analysis, where congestion is reduced so that individuals experience no more than two days of congestion per week.
To estimate the investments required for each scenario, we identify two investment ranges based on historical data. Figure 28 shows the approximate investment per population growth (net additional person in the population per year) needed to maintain the status quo (preventing congestion from worsening). While certain investment levels over the past decade may support the status quo, recent trends against the backdrop of a growing population suggest levels close to those required for the worsening scenario. Estimating the investment needed to improve congestion is challenging without detailed analysis of specific transportation and transit networks.
Over the next 20 years, Ontario’s population is projected to grow by 4.2 million, reaching 20.4 million. The GTHA is expected to accommodate half of this growth, adding 2.1 million people (a 25.9% increase). The GTHA labour force is anticipated to expand by 1.1 million (a 22.9% increase), with Toronto seeing the largest absolute increase, while the highest percentage growth is expected in Halton and Peel, as shown in Figure 29.
Figure 29 Population growth in the GTHA
Population Growth: 2024 to 2044
Population Growth: 2024 to 2044
As the labour force and number of businesses expand, demand for the region’s transportation and transit infrastructure will increase. Figure 30 illustrates the projected growth in the number of commuters and those experiencing heavy congestion over the next 20 years.
4.2.2 Growth in Commuters
Figure 30 Total number of commuters (left), and those experiencing high levels of congestion (right)
Heavy Congestion Commuters
Congestion Worsens Remains the Same Congestion Improves GTHA Rest of Ontario
Province-wide, the number of commuters is expected to grow by 1.9 million (a 35% increase), including an additional 1.1 million within the GTHA (a 33% increase).
If congestion levels remain unchanged, 510,000 more GTHA commuters will experience heavy congestion over the next two decades—a 33% increase over current levels— resulting in a total of 2.1 million GTHA commuters affected by 2044. Outside the GTHA, an additional 186,000 commuters (a 35% increase) will experience heavy congestion, totaling 727,000 non-GTHA commuters by 2044.
In the scenario where congestion worsens, as many as 3.7 million commuters could be experiencing heavy congestion by 2044—representing a 76% increase from today. This includes a 59% increase within the GTHA and a 127% increase outside. Conversely, if congestion were to improve, the increase in heavy congestion could be limited to 128,000 province-wide (a 6.1% increase).
Different regions within the GTHA will also experience varying growth rates in commuter volumes and congestion. Figure 31 shows the projected increase in the number of commuters in each GTHA municipality by 2044.
Figure 31 Regional growth in commuters
Table 9 summarizes the total cost of congestion under each of the three scenarios. If congestion levels remain unchanged over the next 20 years, by 2044, congestion could cost the Ontario society $108 billion (in 2024 dollars), equivalent to 6.2% Ontario’s potential economic output–representing a 92% increase over today’s congestion costs. Nearly 80% of this cost ($85.5 billion) would be incurred within the GTHA, with $42 billion (49%) attributed to social value costs, reflecting the impacts on people’s well-being.
In contrast, if congestion improves even moderately, it could reduce the total impact by $45 billion relative to the status quo. Conversely, if congestion worsens, the total cost could reach $145 billion by 2044—more than 1.5 times the current annual cost of congestion in Ontario. While the bulk of this additional cost would be within the GTHA, worsening congestion would increasingly impact areas outside the GTHA, where costs could rise by 205%, compared to a 144% increase within the GTHA.
Table 9 Future costs of congestion over the next 20 years
The potential economic impact of congestion is evaluated using the same procedure as the historical analysis. A reference scenario—where congestion is limited to a maximum of two days per week—is used to gauge the impact of alternative scenarios.
By 2044, if the status quo level of congestion is maintained, the Ontario economy could be $139 billion below its potential, with 363,000 fewer job opportunities and a reduction in real GDP per capita of $6,800. Of the economic impact, 79% would be concentrated in the GTHA, underscoring significant risks to Canada’s main economic hub. If congestion worsens, the economic impact nearly doubles to $214 billion by 2044, with over 25% of the economic losses occurring outside the GTHA. Conversely, if congestion is reduced by one day per week, the economic impact is $144 billion less than in the worsening scenario, driven by 380,000 additional jobs in the province and a $7,100 increase in GDP per capita. Table 10 summarizes the key economic impacts for each scenario in 2024.
It is important to note that all scenarios, including worsening congestion, assume ongoing investment into transit and transportation investments to accommodate population and economic growth, limiting congestion to the scenario levels.
Examining the average economic costs from 2024 to 2044, maintaining the current level of congestion would cost Ontario $54.5 billion annually, with nearly 80% of the impact occurring within the GTHA. Within the GTHA, an average of 111,300 job-years of employment would be at risk due to reduced economic growth and productivity. If congestion worsens, this risk increases to an annual average of 163,000 within the GTHA and an additional 56,000 job-years outside the GTHA. Conversely, if congestion is reduced, the economic cost to the province would drop to $26.5 billion annually, with $22
billion of this occurring within the GTHA—representing a reduction of 67% compared to the worsening scenario. Table 11 summarizes the key average annual economic costs for the GTHA and Ontario under each scenario.
Table 11 Average annual economic impact of congestion over the next 20 years
Under status quo congestion levels, the social value impact would reach $53.8 billion by 2044, with 79% ($42.5 billion) arising within the GTHA—a 23% increase from current social value costs. However, if congestion improves by even one day per week as assumed in the scenario, the social value cost of congestion could be reduced by 15% across Ontario and by 16% within the GTHA by 2044. This underscores how even moderate improvements in congestion can positively impact well-being. Nonetheless, it is important to note that congestion would still cost Ontario $42.5 billion in social value costs.
The cost of congestion to the GTHA and broader Ontario population and economy is substantial, and managing it effectively is critical for the well-being of residents and the success of Ontario businesses. After costing Ontario $56.4 billion in social and economic costs annually over the last decade, congestion is projected to impose another $108 billion annually in social and economic costs over the next 20 years if left unaddressed. A significant portion of this cost stems from the negative impact of congestion on well-being, as commuters who experience daily congestion report a 6% lower satisfaction with life than those who do not. Over the past decade, this has resulted in a $43.6 billion social value loss for the province, with $34.6 billion occurring in the GTHA. Over the next 20 years, if congestion levels remain unchanged, social value costs could grow to $54 billion across the province.
In the GTHA, over the past decade:
• Lost Economic Growth: Had heavy congestion been reduced over the past decade so that no commuters experience more than 2 days of congestion per week, real GDP in the GTHA could be $27.9 billion higher today, representing a 4.9% increase over the GTHA 2024 economy, corresponding to an additional $3,400 in economic activity per person. Furthermore, congestion has resulted in a $5.0 billion reduction in private capital investment, including losses of $570 million in manufacturing, $180 million in construction, and $100 million in professional services.
• Job Opportunities: Approximately 88,000 more jobs could have been supported in the GTHA if heavy congestion had been mitigated.
Looking ahead, if congestion levels remain unchanged, the annual cost of congestion could rise to $108 billion by 2044, equivalent to 6.2% of Ontario’s potential economic output and representing a 95% increase over today’s congestion costs. Of this total cost, almost 80% ($85.5 billion) would be incurred within the GTHA, with $42.5 billion (50%) representing social value costs due to the impact on resident’s well-being.
In addition to the employment and social impact, both the provincial and federal governments face a considerable tax burden due to lost potential revenue because of congestion and the resulting lower income, corporate, and consumption tax revenues. Conversely, improvement in congestion would substantially benefit both levels of government. From an equity perspective, both the provincial and federal governments should be contributing to resolve congestion challenges in the GTHA. This disparity between the risks and rewards of infrastructure investment has been previously highlighted (Canadian Centre for Economic Analysis, 2016).
To meet future commuter demand and reduce congestion, the capacity of both the road and public transit networks must expand. The extent of growth for each network will depend on the anticipated travel modes in the future. As shown in Figure 32, if the current travel mode share in the GTHA—approximately 75% by car and 25% by transit—remains unchanged both road and transit network capacities would need to increase by about 25%. However, if there is a shift towards greater public transit use, as expected with continued growth in population centres, the capacity of the transit system would need to expand significantly faster than that of the road network.
Figure 32 Growth of transportation and transit infrastructure
Future Growth of Transportation Capacity
Transportation Mode of New Commuters
This underscores the importance of an integrated, multi-modal transportation system across the GTHA that can adapt as regional needs evolve. To meet future travel demand, infrastructure investments would need to align with the peak historical ratio of investment to population growth (see Figure 15) requiring an average of $18 billion annually (in 2024 dollars) over the next 20 years—a 40% increase over recent investment levels. Even if the 10-year average investment level is used instead of the peak, it would still require $14 billion annually. For context, the announced investments in GO transit, municipal transit, and provincial highway expansions collectively represent only about one-third of this total over the next 10 years. This projection also assumes no decline in the productivity of transit and transportation infrastructure.
In conclusion, according to our estimations, congestion in the GTHA is not merely a transportation issue; it is a fundamental economic and social challenge that undermines both business productivity and quality of life. The GTHA accounts for a significant portion of Ontario’s congestion problem, and without immediate intervention, the situation will likely worsen significantly. Addressing congestion is essential for unlocking Ontario’s economic potential and enhancing commuter well-being, especially within the GTHA.
The report highlights the need for targeted infrastructure investments, expanded public transit, and effective congestion management strategies to reduce economic and social costs. Immediate action is crucial to prevent further economic losses and to ensure a higher quality of life for all Ontarians.
Allen, T., & Arkolakis, C. (2022). The welfare effects of transportation infrastructure improvements. The Review of Economic Studies, 2911-2957.
C.D. Howe Institute. (2013). Cars, Congestion and Costs: A New Approach to Evaluating Government Infrastructure Investment. C.D. Howe Institute.
Canadian Centre for Economic Analysis. (2016). Ontario Infrastructure Investment: Federal and Provincial Risks and Rewards. Toronto: Canadian Centre for Economic Analysis.
Canadian Centre for Economic Analysis. (2024). Locked Out: Social Value Cost of GTA’s Housing Crisis. Toronto: Canadian Centre for Economic Analysis.
Di Tella, R., MacCulloch, R., & Oswald, A. (2003). The macroeconomics of happiness. Review of Economics and Statistics, 809-827.
Downs, A. (1962). The law of peak-hour expressway congestion. Traffic Quarterly.
Duranton, G., & Puga, D. (2015). Urban Land Use. Handbook of Regional and Urban Economics, 467-560.
Feor, L., Clarke, A., & Dougherty, I. (2023). Social Impact Measurement: A Systematic Literature Review and Future Research Directions. World, 816-837.
Frey, B., & Stutzer, A. (2004). Economic Consequences of Mispredicting Utility: Evidence from Commuting and Congestion.
Frey, B., & Stutzer, A. (2010). Happiness and public choice. Public Choice.
Frey, B., Luechinger, S., & Stutzer. (2004). Valuing public goods: The life satisfaction approach. SSRN
Frey, B., Luechinger, S., & Stutzer, A. (2004). Valuing public goods: The life satisfaction approach.
Helliwell, J., & Wang, S. (2011). Trust and Well-being.
Helliwell, J., Huang, H., & Wang, S. (2015). The geography of world happiness. World happiness report Hymel, K. (2009). Does traffic congestion reduce employment growth? Journal of Urban Economics, 127-135.
Kahneman, D., & Krueger, A. (2006). Developments in the Measurement of Subjective Well-Being.
Kytta, M., Broberg, A., Haybatollahi, M., & Schmidt-Thome, K. (2016). Urban happiness: context-sensitive study of the social sustainability of urban settings. Environment and Planning B: Planning and Design Layard, R. (2010). Measuring subjective well-being. Science.
Layard, R., Mayraz, G., & Nickell, S. (2008). The marginal utility of income. Journal of Public Economics. Litman, T. (2011). Evaluating public transit benefits and costs. Victoria Transport Policy Institute.
Lu, Y., Schellenberg, G., Hou, F., & Helliwell, J. (2015). The Subjective Well-being of Immigrants in Canada. Metrolinx. (2008). Costs of Road Congestion in the GTHA: Impact and Cost Benefit Analysis of the Metrolinx Draft Regional Transportation Plan. Metrolinx.
OECD. (2013). OECD Guidelines on Measuring Subjective Well-being
OECD. (2017). Better Life Index.
OECD. (2019). The economy of well-being: Creating opportunities for people’s well-being and economic growth. OECD. OECD. (2020). How’s Life? Measuring Well-being.
Statistics Canada. (2010). General Social Survey.
Statistics Canada. (2011). General Social Survey.
Statistics Canada. (2012). General Social Survey.
Statistics Canada. (2013). General Social Survey.
Statistics Canada. (2014). General Social Survey.
Statistics Canada. (2015). General Social Survey.
Statistics Canada. (2016). Canadian Community Health Survey.
Statistics Canada. (2016). General Social Survey.
Statistics Canada. (2017). Canadian Community Health Survey.
Statistics Canada. (2017). General Social Survey.
Statistics Canada. (2018). Canadian Community Health Survey.
Statistics Canada. (2018). General Social Survey.
Statistics Canada. (2019). Canadian Community Health Survey.
Statistics Canada. (2019). General Social Survey.
Statistics Canada. (2020). Canadian Community Health Survey.
Statistics Canada. (2020). General Social Survey.
Statistics Canada. (2021). Canadian Community Health Survey.
Statistics Canada. (2021). General Social Survey.
Statistics Canada. (2022). Canadian Community Health Survey.
Statistics Canada. (2022). General Social Survey.
Statistics Canada. (2023). Canadian Community Health Survey.
Statistics Canada. (2023). General Social Survey.
Statistics Canada. (2024). Canadian Survey on Business Conditions, third quarter 2024. Statistics Canada.
Statistics Canada. (2024). General Social Survey.
Stiglitz, J., Sen, A., & Fitoussi, J. (2009). Report by the Commission on the Measurement of Economic Performance and Social Progress.
Stutzer, A., & Frey, B. (2008). Stress that Doesn’t Pay: The Commuting Paradox.
Stutzer, A., & Frey, B. (2010). Recent advances in the economics of individual subjective well-being. Social Research: An International Quarterly, 679-714.
Sweet, M. (2014). Do firms flee traffic congestion? Journal of Transport Geography, 40-49.
Tesileanu, R. (2008). Valuing non-market environmental goods: a critical analysis of various valuation methods. NBER. Toronto Region Board of Trade. (2024, July 16). Media Release: New Toronto Region Board of Trade Congestion Polling Shines Spotlight on Significant Personal and Economic Impacts. Retrieved from Toronto Region Board of Trade: https://bot.com/News/New-Board-of-Trade-Congestion-Polling-Shines-Spotlight-on-Congestion
Turrell, A. (2016). Agent-based models: understanding the economy from the bottom up. Bank’s Advanced Analytics Division, 173-188.
U.K. Government. (2020). The Green Book: Central Government Guidance on Appraisal and Evaluation.
U.K. Government. (2020). The Green Book: Cost-Benefit Analysis and Social Value
Weisbrod, G., & Fitzroy, S. (2011). Traffic congestion effects on supply chains: Accounting for behavioral elements in
planning and economic impact models. Supply Chain Management-New Perspectives
Weisbrod, G., Vary, D., & Treyz, G. (2003). Measuring economic costs of traffic congestion to business. Transportation research record, 98-106.
Yang, L. (2018). Measuring well-being: A multidimensional index integrating subjective well-being and preferences. Journal of Human Development and Capabilities, 456-476.
This section contextualizes the results of our congestion analysis within the broader economic literature and addresses differences between this study and frequently cited reports, particularly the C.D. Howe Report of 2013, which estimated a cost of $11 billion annually for congestion in the Greater Toronto and Hamilton Area (GTHA).
Our study estimates the total impact of congestion in 2024 is $56.4 billion for Ontario and $44.7 billion for the GTHA. This total includes both economic impacts and social value impacts, following approaches outlined in the literature (Feor, Clarke, & Dougherty, 2023). The economic impact we estimated for Ontario is $12.8 billion, or 1.1% of the province’s GDP, and $10.1 billion for the GTHA, representing 1.8% of its GDP. These figures align with studies that have previously quantified the economic costs of congestion (Weisbrod, Vary, & Treyz, 2003; Hymel, 2009; Weisbrod & Fitzroy, 2011; Allen & Arkolakis, 2022).
In addition to economic costs, we calculated the social value impact, which amounts to $43.6 billion for Ontario (3.7% of the province’s GDP) and $34.6 billion for the GTHA (6.1% of its GDP). These figures represent approximately 9.4% of the wages of commuters heavily affected by congestion, a figure consistent with the lower end of the 10-40% range suggested by the literature (Kahneman & Krueger, 2006; Stutzer & Frey, 2008; Di Tella, MacCulloch, & Oswald, 2003). It is important to clarify that the social value impact does not represent what commuters are willing to pay to avoid congestion, but rather how much income they would need to compensate for the loss of well-being caused by prolonged exposure to traffic delays.
A frequently cited figure regarding congestion in the GTHA is the $11 billion annual cost in “lost productivity,” often referenced by the Toronto Region Board of Trade and originating from a C.D. Howe Institute study titled Cars, Congestion and Costs: A New Approach to Evaluating Government Infrastructure Investment (2013). This study, which relied on data from 2006, has been used up until 2024 to illustrate the significant costs associated with congestion in the region.
The $11 billion figure from the C.D. Howe report is an expansion of an earlier estimate by Metrolinx (2008), which put the cost of congestion at approximately $6 billion annually. The C.D. Howe report suggested that, by including additional factors such as unrealized income from agglomeration benefits and induced migration to cities, the total cost should be adjusted upward by $1.5 to $5 billion. This adjustment was primarily driven by the following factors:
• Lost Agglomeration Benefits: Estimated at $0.8 to $2.1 billion annually, these benefits refer to the advantages of urban density, which are lost when congestion prevents people from accessing distant parts of the city.
• Induced Commuting/Migration: Estimated at $0.6 to $2.5 billion annually, this refers to the notion that farther commutes correlate with higher incomes, and thus, farther commutes enabled by less congestion could result in higher earnings.
While the C.D. Howe report remains a popular reference for the cost of congestion, there are key differences between our study and theirs:
1. Timeframe and Economic Context: The $11 billion is based on congestion and income data from 2006. Several refer-
ences have been made to it over the years7,8. If updated to current conditions, the costs estimated by Metrolinx (2008) would be closer to $12 billion, and C.D. Howe’s updated estimate would likely range between $14 billion and $23 billion.
2. System-wide Economic Costs: Both Metrolinx and C.D. Howe include many costs that do not represent system-wide economic losses, but rather specific transactions in the economy. For instance, additional fuel or vehicle maintenance costs due to congestion might be an expense for the vehicle owner, but they also generate revenue for fuel stations and mechanics. From a macroeconomic perspective, there is no significant impact on GDP. Similarly, wage increases for drivers may affect company margins, but they do not reduce overall economic productivity.
Our approach, utilizing CANCEA’s agent-based model, allows for a much broader view, as it quantifies system-wide economic costs, considering interactions across more than 1,000 topics simultaneously. This enables us to capture the actual effects on the overall economy, rather than isolated pieces.
3. Broader Social Value Measurement: While previous studies have attempted to capture the social value impacts of congestion, they have done so narrowly by focusing on time lost and assigning an additional cost per hour, often linked to hourly wages. In contrast, our model evaluates not just the time lost, but also the broader impact on well-being, allowing for a more comprehensive measure of the social value cost of congestion.
4. Questioning the Assumption of Higher Wages from Longer Commutes: The C.D. Howe report suggests that farther commutes lead to higher wages, contributing significantly to their estimated cost of congestion. However:
• Higher wages for farther commutes often represent compensation for inconvenience, rather than an inherent correlation between commute length and earnings.
• The availability of high-paying jobs is determined by skills and qualifications, not the proximity of the worker to the workplace.
• C.D. Howe’s report does not address whether higher wages would reduce employer operating margins, potentially limiting productivity and investment.
While our study and previous reports share some overlap in estimating productivity losses from congestion, our analysis extends beyond the scope of earlier studies by incorporating system-wide effects and providing a more comprehensive measure of social value impacts. This broader perspective allows for a deeper understanding of how congestion affects Ontario’s economy and the quality of life of Ontarians.
7 Toronto Board of Trade Media release, 14 Feb 2024. Businesses Unite to Tackle Toronto’s Congestion Crisis. https://bot.com/News/Businesses-Unite-to-Tackle-Torontos-Congestion-Crisis
8 Report by Eunomia, 2023. Comparison of Highway 413 and Highway 407 for Improving Truck and Freight Mobility in the Greater Toronto Area. https://environmentaldefence.ca/wp-content/uploads/2023/11/Eunomia-Research-The-Freight-Escape.pdf