Quarterly Market Insights
Quarter 2023
June
TABLE OF CONTENTS 1.0 Foreword 04 1.1 National Highlights 08 VICTORIA 2.1 Market Drivers 12 2.2 Land Market 14 2.3 Development Sites 20 QUEENSLAND 3.1 Market Drivers 24 3.2 Land Market 26 SOUTH AUSTRALIA 4.1 Market Drivers 38 4.2 Land Market 40
1.0
Foreword
Market conditions remain challenging but there are signs of green shoots as residential land sale volumes rebound from low levels.
A range of factors underpin this improvement including record population growth (underpinned by overseas migration), growing pent-up demand and housing shortages.
The direction of interest rates remains a key factor likely to affect the residential land market going forward.
Although views differ, many commentators suggest the RBA’s monetary policy tightening is (almost) complete.
Importantly, while builders and developers remain cautious about prices, costs, timing and supply, construction cost pressures overall continue to ease.
The steady improvement in the established property market (and rebound in property prices) has also been a factor improving the outlook for the new residential market.
While second home buyers continue to underpin demand, first home buyers continue to face significant pressure due to serviceability and affordability challenges.
The residential land market activity is expected to steadily improve as underlying demand and housing shortages continue to grow.
While challenges remain in the short-term, the medium to long term outlook for the residential land and broader residential property markets is robust.
An active and dynamic residential greenfield market is key to ensuring we can meet housing requirements, both now and in the future, while also ensuring better affordability and delivering the dwelling types needed given current and emerging demographics.
The latest Quarterly Market Insights (QMI) report examines the key indicators we follow to anticipate market trends and assess the outlook. We analyse what the market has done in the past, what is happening now and where the market is headed.
Importantly, the QMI report presents our own proprietary market intelligence, collected and analysed by our in-house research team. Our proprietary market intelligence and research provides the latest trends to our clients, stakeholders and strategic partners and empowers them to anticipate the future and make strategic decisions.
It’s all part of our commitment to providing leading market insights, forecasts and in-depth analysis of the Australian residential property market.
4 QUARTERLY MARKET INSIGHTS JUNE QUARTER 2023
Julian Coppini Chief Executive Officer - Project Marketing j.coppini@oliverhume.com.au

5 QUARTERLY MARKET INSIGHTS JUNE QUARTER 2023
WESTERN AUSTRALIA NORTHERN TERRITORY SOUTH AUSTRALIA NEW SOUTH WALES QUEENSLAND VICTORIA TASMANIA
1.0
National Highlights

8 QUARTERLY MARKET INSIGHTS JUNE QUARTER 2023 National Highlights 1.1 George Bougias National Head of Research g.bougias@oliverhume.com.au Cash Rate Target 4.1% Economic Growth 2.3% Inflation 7.0% Unemployment Rate 3.6% Employment Growth 3.4% Wage Growth 3.7% Average Weekly Earning $1,378. Household Saving Ratio 3.7% Net foreign liabilities 35.2% 60 % of GDP Conversion Rate A$1 1.9% $0.67 Population Annual Growth 26.3M Employment to Population Ratio 64.5% Average Price of Residential Dwellings $896K Household Wealth as a share of income as a share of income 894% Household debt 188% =US Data in this snapshot are the latest available as at 5 July 2023. Sources: Reserve Bank of Australia (RBA), Australian Bureau of Statistics (ABS).
 Woodsong - New Oliver Hume project in Mickleham, Victoria.
2.0 Victoria
Market Drivers
Economy
The Victorian economy remains resilient despite a range of challenges including higher interest rates and cost of living pressures.

The state’s unemployment rate remains around record lows although the labour market continues to soften given higher interest rates.
The unemployment rate is forecast to increase but is expected to remain low overall.
State Unemployment Rates (%) - Seasonally adjusted
12 QUARTERLY MARKET INSIGHTS JUNE QUARTER 2023
2.1
% 18 12 6 0 Labour Underutilisation Rates - Australia 1995 1981 1967 2023 2009 * Employed people who want, and are available, to work more hours. ** Sum of the unemployment and underemployment rates. Source: RBA, ABS. Underemployment Rate* Unemployment Rate Underutilisation Rate** Source: RBA, ABS. % 8 7 6 5 4 3 2 VIC NSW QLD SA TAS WA 2023 2017 2017 2023 2011 2011
The state’s unemployment rate remains around record lows...
Land Market
Prices
New residential land prices in the metropolitan Melbourne market edged higher in the June quarter 2023. The median (gross) price of metropolitan Melbourne conventional lots increased to $390,000, a record high, in the June quarter 2023.
Most metropolitan Melbourne growth area markets experienced price growth in the June quarter 2023. Price declines, where they occurred, were generally modest.
Metropolitan Melbourne Growth Area Municipalities Median Land Price
14 QUARTERLY MARKET INSIGHTS JUNE QUARTER 2023
2.2 QII. ‘10 QIV. ‘10 QII. ‘11 QIV. ‘11 QII. ‘12 QIV. ‘12 QII. ‘13 QIV. ‘13 QII. ‘14 QIV. ‘14 QII. ‘15 QIV. ‘15 QII. ‘16 QIV. ‘16 QII. ‘17 QIV. ‘17 QII. ‘18 QIV. ‘18 QII.’19 QIV. ‘19 QII. ‘20 QIV. ‘20 QII. ‘21 QIV. ‘21 QII. ‘22 QIV. ‘22 QII. ‘23 Source: Oliver Hume Research. Sold Lots. $450,000 $400,000 $350,000 $300,000 $250,000 $200,000 $150,000
Victorian Growth Area Median Land Prices
15 QUARTERLY MARKET INSIGHTS JUNE QUARTER 2023 $500,000 $450,000 $400,000 $350,000 $300,000 $250,000 $200,000 $150,000 $100,000 $50,000 $0 QII. ‘10 QIII. ‘10 QIV. ‘10 QI. ‘11 QII. ‘11 QIII. ‘11 QIV. ‘11 QI. ‘12 QII. ‘12 QIII. ‘12 QIV. ‘12 QI. ‘13 QII. ‘13 QIII. ‘13 QIV. ‘13 QI. ‘14 QII. ‘14 QIII. ‘14 QIV. ‘14 QI. ‘15 QII. ‘15 QIII. ‘15 QIV. ‘15 QI. ‘16 QII. ‘16 QIII. ‘16 QIV. ‘16 QI. ‘17 QII. ‘17 QIII. ‘17 QIV. ‘17 QI. ‘18 QII. ‘18 QIII. ‘18 QIV. ‘18 QI. ‘19 QII.’19 QIII.’19 QIV. ‘19 QI. ‘20 QII. ‘20 QIII. ‘20 QIV. ‘20 QI. ‘21 QII. ‘21 QIII. ‘21 QIV. ‘21 QI. ‘22 QII. ‘22 QIII. ‘22 QIV.’22 QI. ‘23 QII. ‘23
Cardinia Casey Whittlesea Hume Melton Wyndham Mitchell Geelong Median (all of VIC)
Source: Oliver Hume Research. Sold Lots. Annual moving average.
The Grange Waurn Ponds - New Oliver Hume project in Victoria.
Land Market
Sales Volumes
The volume of lots sold, in both key metropolitan and regional markets, remained stable in the June quarter 2023 (although lot sales showed an improvement in the latter half of the quarter).
A range of factors underpinned this result including record population growth (underpinned by overseas migration), growing pent-up demand, housing shortages and the end of the post COVID-19 moderation in demand (due to the earlier bring forward of sales).
16 QUARTERLY MARKET INSIGHTS JUNE QUARTER 2023
2,500 2,000 1,500 1,000 500 0 Jun-04 Jun-05 Jun-06 Jun-07 Jun-08 Jun-09 Jun-10 Jun-11 Jun-12 Jun-13 Jun-14 Jun-15 Jun-16 Jun-17 Jun-18 Jun-19 Jun-20 Jun-21 Jun-22 Jun-23
Source:
Research.
Metropolitan Melbourne Residential Greenfield Sales - Monthly
Oliver Hume
2.2
Lots across metropolitan Melbourne remained on the market for an average of around 160 days during the June quarter 2023.
Time on market has increased significantly since the first interest rate in May 2022 but is expected to stabilise.
17 QUARTERLY MARKET INSIGHTS JUNE QUARTER 2023 QII. ‘12 QIII. ‘12 QIV. ‘12 QI. ‘13 QII. ‘13 QIII. ‘13 QIV. ‘13 QI. ‘14 QII. ‘14 QIII. ‘14 QIV. ‘14 QI. ‘15 QII. ‘15 QIII. ‘15 QIV. ‘15 QI. ‘16 QII. ‘16 QIII. ‘16 QIV. ‘16 QI. ‘17 QII. ‘17 QIII. ‘17 QIV. ‘17 QI. ‘18 QII. ‘18 QIII. ‘18 QIV. ‘18 QI. ‘19 QII. ‘19 QIII. ‘19 QIV. ‘19 QI. ‘20 QII. ‘20 QIII. ‘20 QIV. ‘20 QI. ‘21 QII. ‘21 QIII. ‘21 QIV. ‘21 QI. ‘22 QII. ‘22 QIII. ‘22 QIV. ‘22 QI. ‘23 QII. ‘23 Source: Oliver Hume Research. Time on Market
500 450 400 350 300 250 200 150 100 50 0 City
New Residential Land - Average Time on Market (Days) - Metropolitan Melbourne Growth Area Municipalities Jun-13 Jun-14 Jun-15 Jun-16 Jun-17 Jun-18 Jun-19 Jun-20 Jun-21 Jun-22 Jun-23 Source: Oliver Hume Research. 200 180 160 140 120 100 80 60 40 20 0
of Greater Geelong Residential Greenfield Sales - Monthly
Commonly Sold Lots 12.5 x 32m 12.5 x 28m 14 x 32m Median Price Median Size Median Value Rate
$392,500* 379sqm $1,070 per sqm
GEELONG WERRIBEE $377,000 $428,000 TARNEIT $424,900 $462,400 FRASER RISE $434,500 $459,500 LARA $389,900 $409,900 MAMBOURIN n/a $426,000 ARMSTRONG CREEK $427,000 $450,000 MELTON SOUTH $399,000 n/a TRUGANINA $446,500 n/a WYNDHAM VALE $381,000 $431,000 Metropolitan Melbourne
VICTORIA Source: Oliver Hume Research. All lots.
June Quarter 2023
MELBOURNE WOLLERT $452,000 $477,000 MICKLEHAM $420,000 $466,000 BEVERIDGE $319,500 $383,000 CLYDE $439,000 $497,000 BERWICK $573,000 $614,500 WALLAN $345,000 $371,000 CRAIGIEBURN $470,000 $504,000 400 sqm Median Price 448 sqm Median Price Source: Oliver Hume Research. Sold.
by Suburb (Gross) 400 sqm and 488 sqm Lots VICTORIA
Median Lot Prices
Development Sites
The Victorian development site market continues to be affected by higher interest rates, a moderation in residential land prices (due mostly to more incentives and rebates), low sales volumes and higher construction costs (although costs are now stabilising).
All these factors have impacted on development site purchaser demand.
The direction of interest rates remains the key factor likely to affect the development site market going forward.
While views differ on the direction of interest rates, many commentators suggest the Reserve Bank of Australia’s monetary tightening is nearing completion (or complete).
Sentiment is slowly improving as robust population growth, underpinned by overseas migration, is leading some potential development site purchasers to restart their search for suitable sites.
Headline development site values remain stable and are likely to remain stable in the foreseeable future.
Planning, engineering, servicing authorities and other delays remain key challenges.
To ensure the industry can deliver new housing projects when required, improvement in several areas including planning and engineering processes must continue.
The Victorian Government is expected to introduce a range of new housing policies in the coming months to alleviate the State’s growing housing shortage and affordability crisis.
The Victorian Government has reconfirmed its commitment to ensuring that the supply of new dwellings follows the 70/30 split (between established suburbs and growth areas respectively) as outlined in the Plan Melbourne metropolitan strategy.
This target ratio has not been achieved for several years and the Victorian Government is expected to take a more interventionist approach to ensure it is achieved in the future.
Peter Vassallo Managing Director | Development Sites p.vassallo@oliverhume.com.au

While details of any future housing policy will be crucial in understanding the implications for the future of the greenfield market, it is clear that the policy will aim to redirect population growth and new development towards Melbourne’s established areas and to medium and high-density dwellings.
A possible implication of this shift is fewer Precinct Structure Plans (PSPs) being approved every year in the greenfields.
Over the last few years around two PSPs have been approved every year.
Another implication of the shift in housing policy is PSPs taking more time to be approved.
To date, it has taken, on average, around five years for a PSP to be approved (from pre-commencement to gazettal).
In response to recent Victorian Government discussions around the direction of housing policy in the future, we have already noted a decrease in demand for PSP land which is not approved and an increase in demand for PSP land which is approved.
Accordingly, it is considered that any land offered to the market which is situated in a PSP which has been approved, or is close to being approved, should sell at a premium.
Finally, the Victorian Planning Authority (VPA) was scheduled to have released its 2023-24 business plan at the time of writing, but this has not yet occurred.
The VPA’s business plan, together with the State Government’s forthcoming housing policy (expected in September or October of this year) will provide much needed detail on the State’s strategy to address housing supply and affordability issues.
2.3
Headline
development site values remain stable and are likely to remain stable in the foreseeable future.
3.0
Queensland
Market Drivers
Sebastian Ozturk Queensland Research Analyst s.ozturk@oliverhume.com.au

The Queensland economy remains resilient despite much higher interest rates. The unemployment rate remains around record lows (below 4%) and employment growth remains steady.
Economic growth has been underpinned by strong population growth.
Queensland’s population increased by over 116,000 people (2.2%) over the year ending 31 December 2022.
Net overseas (up around 58,000 people) and net interstate migration (up around 34,500 people) drove population growth.
Queensland’s diverse economy remains a source of strength with the state’s key industries also including mining and resources (especially coal and natural gas), tourism, healthcare and social assistance, retail trade, education and training and construction.
24 QUARTERLY MARKET INSIGHTS JUNE QUARTER 2023 Economy
3.1 Mar-13 Jun-13 Sep-13 Dec-13 Mar-14 Jun-14 Sep-14 Dec-14 Mar-15 Jun-15 Sep-15 Dec-15 Mar-16 Jun-16 Sep-16 Dec-16 Mar-17 Jun-17 Sep-17 Dec-17 Mar-18 Jun-18 Sep-18 Dec-18 Mar-19 Jun-19 Sep-19 Dec-19 Mar-20 Jun-20 Sep-20 Dec-20 Mar-21 Jun-21 Sep-21 Dec-21 Mar-22 Jun-22 Sep-22 Dec-22 Mar-23 Jun-23
9% 8% 7% 6% 5% 4% 3% Queensland Unemployment Rate Unemployment Rate Long Run Average
Source: Queensland Government Statistician’s Office, ABS.
Net Interstate Migration (Quarterly)
25 QUARTERLY MARKET INSIGHTS JUNE QUARTER 2023
20,000 15,000 10,000 5,000 0 -5,000 -10,000 -15,000 -20,000 Mar-13 Jun-13 Sep-13 Dec-13 Mar-14 Jun-14 Sep-14 Dec-14 Mar-15 Jun-15 Sep-15 Dec-15 Mar-16 Jun-16 Sep-16 Dec-16 Mar-17 Jun-17 Sep-17 Dec-17 Mar-18 Jun-18 Sep-18 Dec-18 Mar-19 Jun-19 Sep-19 Dec-19 Mar-20 Jun-20 Sep-20 Dec-20 Mar-21 Jun-21 Sep-21 Dec-21 Mar-22 Jun-22 Sep-22 Dec-22 Source: ABS. NSW VIC QLD
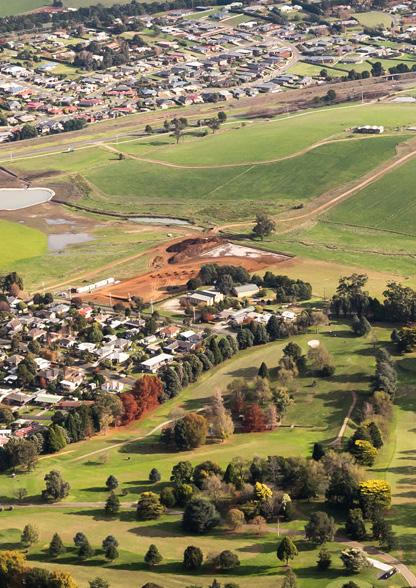
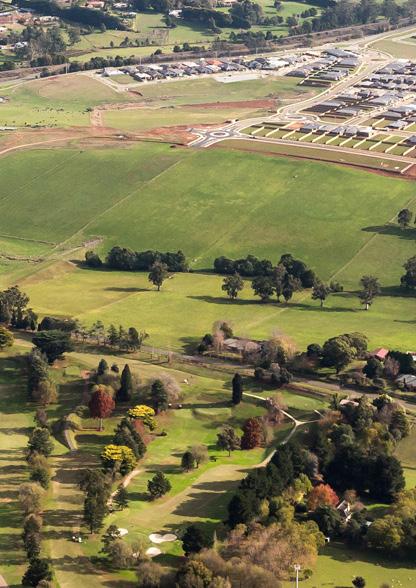
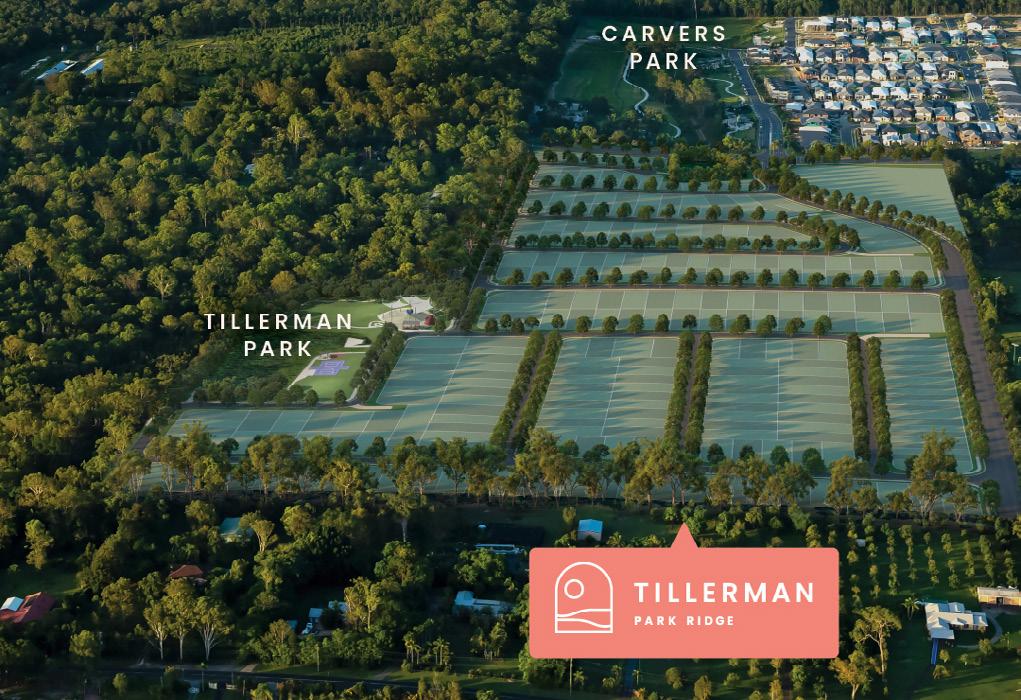
Tillerman - Oliver Hume project in Queensland.
Land Market
Land Market
South-East Queensland land market sale volumes moderated in the June quarter 2023 but remain well recent lows.
While higher interest rates have dampened buyer sentiment and demand, robust population growth, through both strong overseas and interstate migration, has helped to underpin sale volumes.
Lot availability continues to a key driver of sales volumes. Regions with a higher level of stock continue to account for a greater market share.
South East Queensland Project Land Sales
26 QUARTERLY MARKET INSIGHTS JUNE QUARTER 2023
Source: Oliver Hume Research. Sold Lots. 2,500 2,000 1,500 1,000 500 0
Total Quarterly Sales Long Run Average Moving Quarterly Average Jun-13 Sep-13 Dec-13 Mar-14 Jun-14 Sep-14 Dec-14 Mar-15 Jun-15 Sep-15 Dec-15 Mar-16 Jun-16 Sep-16 Dec-16 Mar-17 Jun-17 Sep-17 Dec-17 Mar-18 Jun-18 Sep-18 Dec-18 Mar-19 Jun-19 Sep-19 Dec-19 Mar-20 Jun-20 Sep-20 Dec-20 Mar-21 Jun-21 Sep-21 Dec-21 Mar-22 Jun-22 Sep-22 Dec-22 Mar-23 JUn-23
3.2 1,441
27 QUARTERLY MARKET INSIGHTS JUNE QUARTER 2023
400 350 300 250 200 150 100 50 0
Source: Oliver Hume Research.
Brisbane Gold Coast Ipswich Logan Moreton Bay Jun-22 Jun-23
Available Stock - South East Queensland Growth Corridors
Redland
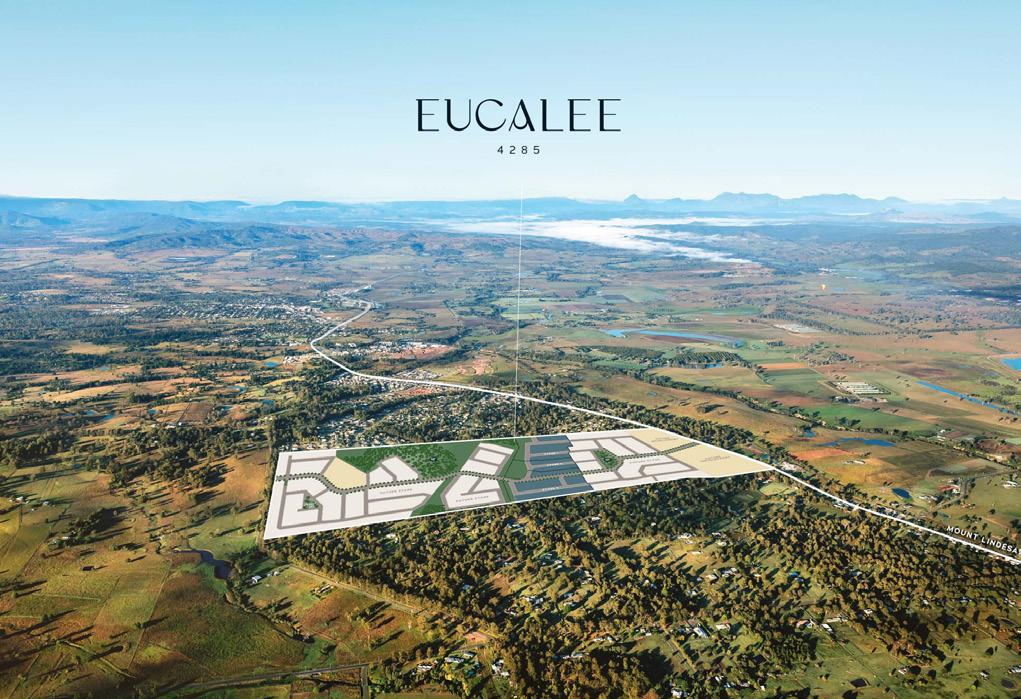
Eucalee - Oliver Hume project in Queensland.
Land Market
Market Share
The Logan region recorded the largest market share for the second consecutive quarter following the addition of many new projects.
Growth Corridor Sales Market Share
South East Queensland Project Land Sales Market Share
28 QUARTERLY MARKET INSIGHTS JUNE QUARTER 2023
Oliver Hume Research. Quarter Brisbane Sales Gold Coast Sales Ipswich Sales Logan Sales Moreton Bay Sales Redland Sales Jun. '23 5.1% 11.1% 26.6% 33.9% 18.9% 4.3% Mar. ‘22 11.8% 10.0% 21.4% 38.8% 16.1% 1.9% Jun. ‘22 8.3% 1.8% 34.7% 17.1% 37.1% 0.9%
Hume
Redland Moreton Bay Logan Ipswich Gold Coast Brisbane
Source:
Source: Oliver
Research.
3.2 4.3% 18.9% 33.9% 26.6% 11.1% 5.1%
Median Prices
Median land prices across South-East Queensland edged higher in the June quarter 2023, up 0.3% from the previous quarter, to reach a new high of $346,000.
Robust price growth was recorded in the Ipswich growth market (up 1.6%).
29 QUARTERLY MARKET INSIGHTS JUNE QUARTER 2023 Source: Oliver Hume Research. Brisbane Gold Coast Ipswich Logan Moreton Bay Redland SEQ QI.’22 QIII.’22 QIV.’22 QI.’22 QII.’23 $1,000,000 $900,000 $800,000 $700,000 $600,000 $500,000 $400,000 $300,000 $200,000 $100,000 $0 South East Queensland Median Lot Prices by Local Government Area Source: Oliver Hume Research. New Residential Land - Median Lot Prices, South East Queensland Municipalities LGA QII. '23 QI. '23 QII. '22 QoQ YoY 5 yr Change Brisbane (C) $584,500 $595,000 $725,000 -1.8% -19.4% 63.8% Gold Coast (C) $637,000 $645,000 $997,500 -1.2% -36.1% 90.5% Ipswich (C) $325,000 $320,000 $324,500 1.6% 0.2% 56.6% Logan (C) $314,050 $315,000 $242,000 -0.3% 29.8% 47.3% Moreton Bay (R) $378,500 $385,000 $394,900 -1.7% -4.2% 45.6% Redland (C) $547,500 $570,000 $468,000 -3.9% 17.0% 83.3% SEQ $346,000 $345,000 $322,000 0.3% 7.5% 44.2%
Land Market
Across South-East Queensland lots sized from 301 sqm – 400 sqm remained the most in demand product size (accounting for 37% of all sales made in the June quarter 2023).
30 QUARTERLY MARKET INSIGHTS JUNE QUARTER 2023
Median Lot Size
3.2 100% 90% 80% 70% 60% 50% 40% 30% 20% 10% 0% Source: Oliver Hume Research. QIII. ‘19 QII. ‘19 QIV. ‘19 QI. ‘20 QII. ‘20 QIII. ‘20 QIV. ‘20 QI. ‘21 QII. ‘21 QIII. ‘21 QIV. ‘21 QI. ‘22 QII. ‘22 QIII. ‘22 QIV. ‘22 QI. ‘23 QII. ‘23 Long-run Average Less than 300 sqm 301-400 sqm 401-500 sqm 501-600 sqm 601-1,000 sqm South East Queensland Project Land Sales (0 - 1,000 sqm) Market Share by Product Type 7% 10% 10% 12% 10% 10% 9% 8% 9% 10% 24% 9% 16% 15% 12% 15% 15% 12% 13% 33% 11% 13% 15% 15% 14% 13% 9% 10% 17% 12% 11% 11% 13% 14% 11% 12% 15% 34% 34% 36% 31% 35% 34% 33% 34% 44% 37% 29% 37% 31% 35% 28% 31% 29% 43% 38% 34% 36% 34% 37% 41% 41% 54% 38% 38% 38% 32% 33% 41% 34% 37% 37% 6% 5% 5% 6% 6% 7% 7% 8% 7% 10% 4% 1% 5% 8% 3% 7% 8% 3% South East Queensland Median Lot Sizes by Local Government Area (sqm) Source: Oliver Hume Research. LGA QII. '23 QI. '23 QII. '22 QoQ YoY 5 yr Change Brisbane (C) 402 400 436 0.5% -7.8% 0.0% Gold Coast (C) 475 395 430 20.3% 10.5% 1.7% Ipswich (C) 406 420 420 -3.3% -3.3% -8.3% Logan (C) 451 455 437 -0.9% 3.2% 12.0% Moreton Bay (R) 407 419 400 -2.9% 1.8% -3.1% Redland (C) 436 452 420 -3.5% 3.8% 9.1% SEQ 425 430 420 -1.2% 1.2% -0.2%
Value Rates
The South-East Queensland median value rate ($/sqm) edged higher in the June quarter 2023.
A decline in the median block size transacted partly drove the result.
The Brisbane and Gold Coast markets continue to have the highest value rates.
South East Queensland Project Land Sales (June Quarter 2023) | Median Value Rate ($ per sqm)
Source: Oliver Hume Research.
South East Queensland Median Value Rates by Local Government Area ($/sqm)
Source: Oliver Hume Research.
31 QUARTERLY MARKET INSIGHTS JUNE QUARTER 2023
$0 $200 $400 $600 $800 $1,000 $1,200 $1,400 $1,600 SOUTH EAST QUEENSLAND REDLAND MORETON BAY LOGAN IPSWICH GOLD COAST BRISBANE
LGA QII. '23 QI. '23 QII. '22 QoQ $ Value Change (QoQ) YoY $ Value Change (YoY) 5 yr Change $ Value Change (5Yr Change) Brisbane (C) $1,454 $1,488 $1,663 -2.3% -$34 -12.6% -$209 63.8% $567 Gold Coast (C) $1,341 $1,633 $2,320 -17.9% -$292 -42.2% -$979 87.4% $626 Ipswich (C) $800 $762 $773 5.1% $39 3.6% $28 70.8% $332 Logan (C) $696 $692 $554 0.6% $4 25.7% $143 31.5% $167 Moreton Bay (R) $930 $919 $987 1.2% $11 -5.8% -$57 50.2% $311 Redland (C) $1,256 $1,261 $1,114 -0.4% -$5 12.7% $141 67.9% $508 SEQ $814 $802 $767 1.5% $12 6.2% $47 44.4% $250 $814 $1,256 $930 $696 $800 $1,341 $1,454
Land Market
Time on Market
Lots across South-East Queensland stayed on the market for an average of around 90 days throughout the June quarter 2023.
The Ipswich and Logan growth area markets, both generally offering more affordable stock, had the lowest time on market.
South East Queensland New Residential Land - Median Time on Market (Days)
South East Queensland New Residential Land - Median Time on Market (Days)
32 QUARTERLY MARKET INSIGHTS JUNE QUARTER 2023
3.2 100 90 80 70 60 50 40 30 20 10 0 BRISBANE GOLD COAST IPSWICH LOGAN MORETON BAY REDLAND SEQ
140 120 100 80 60 40 20 0 QI. ‘17 QII. ‘17 QIII. ‘17 QIV. ‘17 QI. ‘18 QII. ‘18 QIII. ‘18 QIV. ‘18 QI. ‘19 QII.’19 QIII.’19 QIV. ‘19 QI. ‘20 QII. ‘20 QIII. ‘20 QIV. ‘20 QI. ‘21 QII. ‘21 QIII. ‘21 QIV. ‘21 QI. ‘22 QII. ‘22 QIII. ‘22 QIV. ‘22 QI. ‘23 QII. ‘23
Source: Oliver Hume Research.
Source: Oliver Hume Research.

South East
CABOOLTURE $305,900 n/a MORAYFIELD $330,000 $375,000 WALLOON n/a $238,000 REDBANK PLAINS $296,900 n/a SPRING MOUNTAIN $362,500 $413,000 RIPLEY $299,000 $328,900
Queensland June Quarter 2023 QUEENSLAND COLLINGWOOD PARK $294,000 $304,000 DEEBING HEIGHTS $291,000 $296,000 Commonly Sold Lots 12.5 x 30m 14 x 30m 12.5 x 32m Median Price Median Size Median Value Rate $346,000 425sqm $814 per sqm
BRISBANE NERANG $615,000 n/a CHAMBERS FLAT n/a $331,000 375 sqm Median Price 400 sqm Median Price Source: Oliver Hume Research. Sold. Median Lot Prices by Suburb (Gross) 375 sqm and 400 sqm Lots QUEENSLAND GOLD COAST
4.0 South Australia
Market Drivers
Economy
The South Australian economy remains resilient despite higher interest rates, cost of living pressures and other challenges.
The medium to long-term outlook for the State remains robust underpinned by improving population growth and a range of key employment drivers.
South Australia’s population increased by around 28,500 people over the year ended in December 2022 (up 1.6% to over 1.83 million).
George Bougias National Head of Research g.bougias@oliverhume.com.au
Net overseas migration (over 23,850 people) drove the strong population result.
Net interstate migration remained positive over the period (670 people).
4.1

The South Australian economy remains resilient despite higher interest rates...
Land Market
Prices
Greater Adelaide median residential land prices moderated in the June quarter 2023 (down 0.3%) to reach $249,350 (up 25% over the year).
Residential land prices remain around record highs underpinned by the resilience of the Adelaide residential market, housing shortages (including limited rental stock as shown by very low vacancy rates) and historically strong population growth.
Greater Adelaide Median Lot Price (3-month moving average, selected lot types)
40 QUARTERLY MARKET INSIGHTS JUNE QUARTER 2023
$250,000 $200,000 $150,000 $100,000 Source: Oliver Hume Research. 300 sqm 375 sqm 420 sqm
4.2 QI. ‘22 QII. ‘22 QIII. ‘22 QIV. ‘22 QII. ‘23 QI. ‘23
The volume of sales in the Greater Adelaide market edged higher in the June quarter 2023 from the previous quarter (rising from 611 sales to 641 sales).
The result was driven by a range of factors including robust population growth and growing housing shortages.
The median size of lots transacted across the Greater Adelaide market declined in the June quarter 2023.
The size of lots transacted continues to decline due to a combination of factors including growing affordability and serviceability pressures (due to higher land prices, higher interest rates and construction cost increases).
41 QUARTERLY MARKET INSIGHTS JUNE QUARTER 2023
Median Lot Size
Sales Volumes
Adelaide Residential
420 410 400 390 380 370 360
Greater
Land Median Lot Size (sqm) - Quarterly
Source: Oliver Hume Research.
Greater Adelaide Residential Land Sales 1,200 1,000 800 600 400 200 0 QII. ‘22 QIII. ‘22 QIV. ‘22 QI. ‘23 QII. ‘23 QII. ‘22 QIII. ‘22 QIV. ‘22 QI. ‘23 QII. ‘23
Source: Oliver Hume Research.
SOUTH AUSTRALIA
Greater Adelaide*
June Quarter 2023
Commonly Sold Lots 12.5 x 30m 14 x 30m 10 x 30m
Median Price
$245,000 408sqm $579 per sqm
Median Size
Median Value Rate * Metropolitan Adelaide and selected regional municipalities.
300 sqm Median Price 375 sqm Median Price Source: Oliver Hume Research. Sold.
300 sqm and 375 sqm Lots SOUTH AUSTRALIA BUCKLAND PARK n/a $231,700 DAVOREN PARK n/a $155,000 PORT NOARLUNGA SOUTH $314,500 $360,500 ROSEWORTHY n/a $235,000 VIRGINIA $192,500 $238,950 WOODVILLE n/a $340,000 ANGLE VALE $201,000 $239,000 EVANSTON GARDEN $162,500 n/a GAWLER BELT $164,000 $197,000 ADELAIDE GAWLER EAST $174,950 $206,500 ALDINGA n/a $298,300 MUNNO PARA $189,950 n/a MUNNO PARA DOWNS $189,950 $219,950 PARALOWIE $240,000 $300,000 OAKDEN $404,000 $485,000 ANDREWS FARM $178,000 $207,500
Median Lot Prices by Suburb (Gross)


information
this document
information
the information has been prepared in good faith
to the accuracy of the whole
any part of the publication. No liability for negligence or otherwise is assumed for any loss
damage
from their use of this publication. The whole or any part of this publication must not be mirrored, reproduced or copied, without written consent. The document may contain future forecasts of a range of variables, which can be affected by a significant number of unpredictable factors, including social and economic conditions. It only represents the best judgements and estimates, made by Oliver Hume Research. No assurances can be given that the forecasts will be achieved. This document should be read in conjunction with any other documentation prepared by the marketing agent and associated consultants. www.oliverhume.com.au HEAD OFFICE Level 2 4 Riverside Quay Southbank, VIC 3006 P. 03 9669 5999 BRISBANE Shop 9, Gasworks Precinct 26 Reddacliff Street Newstead, QLD 4006 P. 07 3216 1666 SOUTH AUSTRALIA Level 1, 89 Pirie Street Adelaide, SA 5000 P. 08 7201 3999 SYDNEY Level 24, Tower 3 300 Barangaroo Avenue Sydney, NSW 2000 P. 1300 881 780 GOLD COAST Suite 5B, Emerald Lakes Town Centre Commercial 3027 The Blvd, Emerald Lakes Carrara QLD 4211 P. 1300 645 433 DARWIN 129 Asche Street Muirhead, NT 0810 P. 1300 7373 598
Important: The
in
has been prepared a general guide only and does not constitute advice. We have relied upon
from sources generally regarded as authoritative. Whilst
and with due care, no representation is made in relation
or
or
suffered by any party resulting