Quarterly Market Insights
Quarter 2023
March
TABLE OF CONTENTS 1.0 Foreword 04 1.1 National Highlights 08 VICTORIA 2.1 Market Drivers 12 2.2 Land Market 14 2.3 Development Sites 20 QUEENSLAND 3.1 Market Drivers 24 3.2 Land Market 26 SOUTH AUSTRALIA 4.1 Market Drivers 38 4.2 Land Market 40
1.0
Foreword
Market conditions remain challenging with higher interest rates, inflation, cost of living pressures and continuing (and much publicised) building industry issues affecting consumer and buyer sentiment.
Land market trends have remained consistent in recent months.
Sale volumes remain well-below long-term average levels although (gross) prices have largely remained around record highs.
Rebates and incentives are, however, becoming increasingly popular.
Lower sale volumes have been driven by a range of factors including much higher interest rates, cost of living pressures and the post COVID-19 moderation in demand (due to the bring forward of sales).
With the post COVID-19 moderation in demand now largely complete, attention is focussing on interest rates and future moves by the Reserve Bank of Australia (RBA).
Consensus forecasts suggest we are around the peak level of interest rates.
This view is underpinned by signs that Australian inflation might have peaked.
There are also additional headwinds in 2023 which policy makers are considering.
First, it will take some time for all interest rate increases to fully flow through to the economy.
Second, there are many existing fixed-rate loans which are expected to roll over into higher variable rates in 2023.
Third, global economic growth and inflation are expected to decline.
Market activity is expected to remain soft over the coming months.
While much discussion currently centres on the short-term outlook there is increasing recognition of medium to long term outlook opportunities and challenges.
Population growth is expected to remain around record highs at a time of large (and growing) dwelling shortages.
A healthy residential greenfield market across our capital cities and regional markets is critical to meeting housing requirements both now and in the future.
It is also critical to ensuring affordability and that we deliver the dwelling types required given current and emerging demographics.
The latest Quarterly Market Insights (QMI) report examines the key indicators we follow to anticipate market trends and assess the outlook. We analyse what the market has done in the past, what is happening now and where the market is headed.
Importantly, the QMI report presents our own proprietary market intelligence, collected and analysed by our in-house research team. Our proprietary market intelligence and research provides the latest trends to our clients, stakeholders and strategic partners and empowers them to anticipate the future and make strategic decisions.
It’s all part of our commitment to providing leading market insights, forecasts and in-depth analysis of the Australian residential property market.
4 QUARTERLY MARKET INSIGHTS MARCH QUARTER 2023
Julian Coppini Chief Executive Officer - Project Marketing j.coppini@oliverhume.com.au

5 QUARTERLY MARKET INSIGHTS MARCH QUARTER 2023
WESTERN AUSTRALIA NORTHERN TERRITORY SOUTH AUSTRALIA NEW SOUTH WALES QUEENSLAND VICTORIA TASMANIA
1.0
National Highlights

8 QUARTERLY MARKET INSIGHTS MARCH QUARTER 2023 National Highlights 1.1 George Bougias National Head of Research g.bougias@oliverhume.com.au Cash Rate Target 3.6% Economic Growth 2.7% Inflation 7.8% Unemployment Rate 3.5% Employment Growth 3.0% Wage Growth 3.3% Average Weekly Earning $1,378. Household Saving Ratio 4.5% Net foreign liabilities 36.0% 60 % of GDP Conversion Rate A$1 1.6% $0.67 Population Annual Growth 26.1M Employment to Population Ratio 64.3% Average Price of Residential Dwellings $881K Household Wealth as a share of income as a share of income 878% Household debt 188% =US Data in this snapshot are the latest available as at 6 April 2023. Sources: Reserve Bank of Australia (RBA), Australian Bureau of Statistics (ABS).
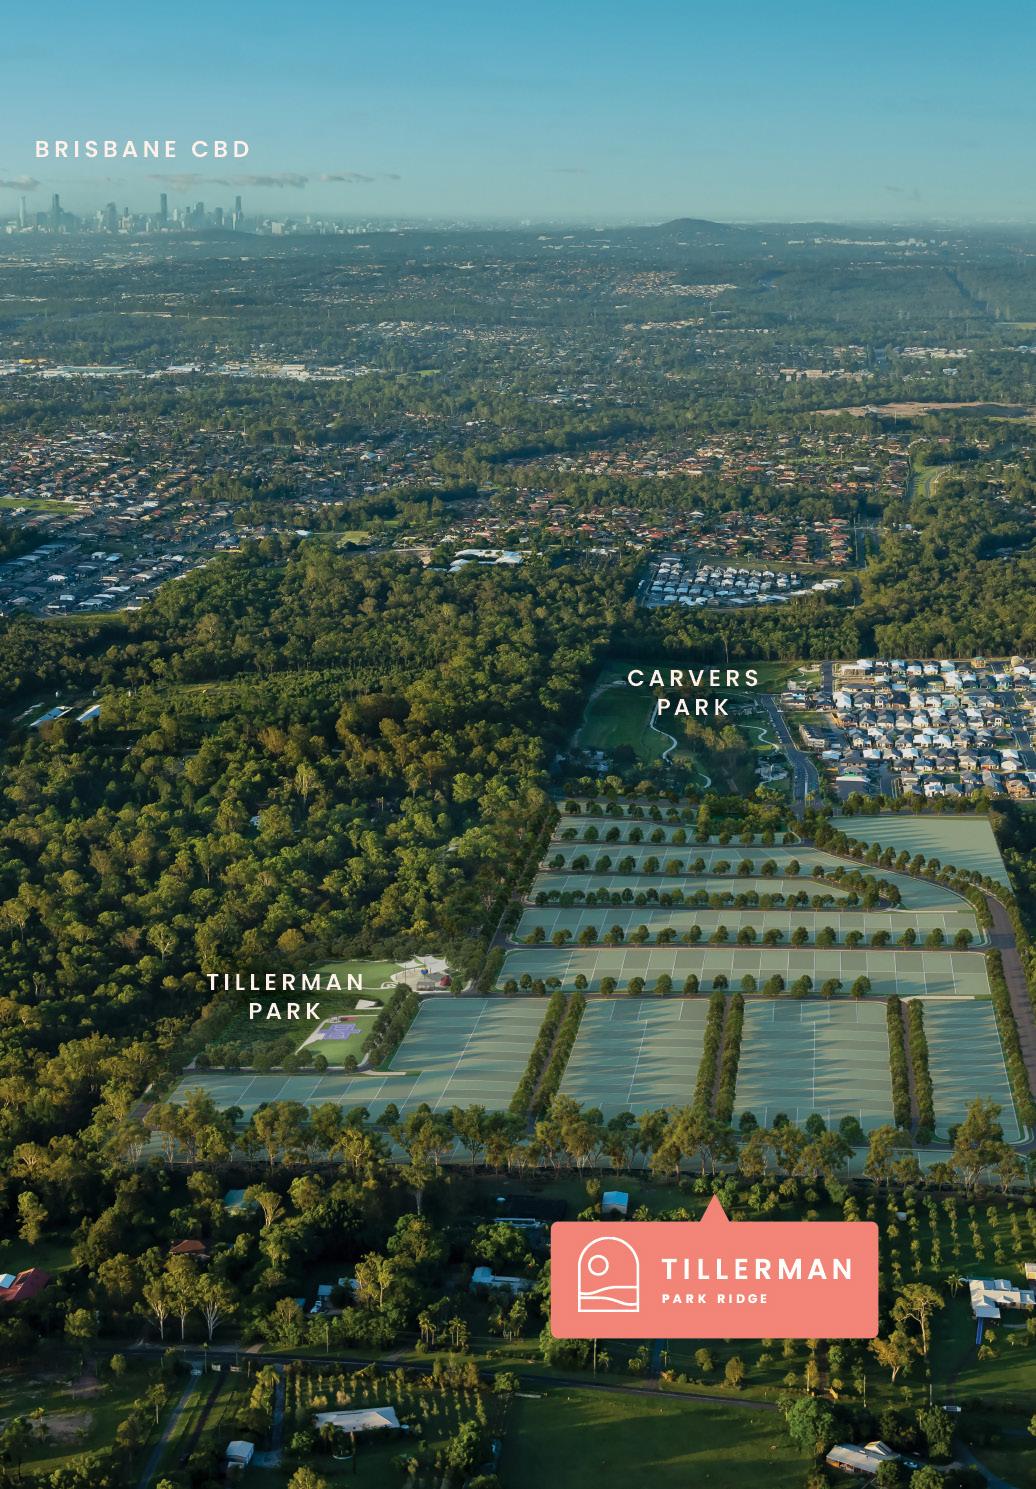 Tillerman - New Oliver Hume project in Queensland.
2.0 Victoria
Market Drivers
Economy
Inflation remains a key challenge for the State’s economy. Higher interest rates are expected to temper Victoria’s economic growth.
The labour market remains resilient although unemployment has drifted slightly higher in recent months, consistent with national trends.
The unemployment rate is expected to remain low over the outlook period, overall, providing support to the residential property market.
State Unemployment Rates (%) - Seasonally adjusted
- Australia
12 QUARTERLY MARKET INSIGHTS MARCH QUARTER 2023
2.1
% 18 12 6 0
Underutilisation
1995 1981 1967 2023 2009 * Employed people who want, and are available, to work more hours. Sum of the unemployment and underemployment rates. Source: RBA, ABS. Underemployment Rate* Unemployment Rate Underutilisation Rate** Source: RBA, ABS. % 8 7 6 5 4 3 2 VIC NSW QLD SA TAS WA 2023 2017 2017 2023 2011 2011
Labour
Rates
The unemployment rate is expected to remain low...
Land Market
Prices
New residential land prices remained largely stable in the March quarter 2023.
The median (gross) price of metropolitan Melbourne conventional lots for the March quarter 2023 remained unchanged at $385,000.
Prices moderated across most metropolitan Melbourne growth area markets but rose in Melbourne’s southeast and Geelong.
Rebates and incentives are increasingly popular.
14 QUARTERLY MARKET INSIGHTS MARCH QUARTER 2023
2.2 QIII. ‘10 QIV. ‘10 QI. ‘11 QII. ‘11 QIII. ‘11 QIV. ‘11 QI. ‘12 QII. ‘12 QIII. ‘12 QIV. ‘12 QI. ‘13 QII. ‘13 QIII. ‘13 QIV. ‘13 QI. ‘14 QII. ‘14 QIII. ‘14 QIV. ‘14 QI. ‘15 QII. ‘15 QIII. ‘15 QIV. ‘15 QI. ‘16 QII. ‘16 QIII. ‘16 QIV. ‘16 QI. ‘17 QII. ‘17 QIII. ‘17 QIV. ‘17 QI. ‘18 QII. ‘18 QIII. ‘18 QIV. ‘18 QI. ‘19 QII.’19 QIII.’19 QIV. ‘19 QI. ‘20 QII. ‘20 QIII. ‘20 QIV. ‘20 QI. ‘21 QII. ‘21 QIII. ‘21 QIV. ‘21 QI. ‘22 QII. ‘22 QIII. ‘22 QIV. ‘22 QI. ‘23 Source: Oliver Hume Research. Sold Lots. $400,000 $350,000 $300,000 $250,000 $200,000 $150,000 Metropolitan
Melbourne Growth Area Municipalities Median Land Price
Victorian Growth Area Median Land Prices
15 QUARTERLY MARKET INSIGHTS MARCH QUARTER 2023 $500,000 $450,000 $400,000 $350,000 $300,000 $250,000 $200,000 $150,000 $100,000 $50,000 $0 QIV. ‘10 QI. ‘11 QII. ‘11 QIII. ‘11 QIV. ‘11 QI. ‘12 QII. ‘12 QIII. ‘12 QIV. ‘12 QI. ‘13 QII. ‘13 QIII. ‘13 QIV. ‘13 QI. ‘14 QII. ‘14 QIII. ‘14 QIV. ‘14 QI. ‘15 QII. ‘15 QIII. ‘15 QIV. ‘15 QI. ‘16 QII. ‘16 QIII. ‘16 QIV. ‘16 QI. ‘17 QII. ‘17 QIII. ‘17 QIV. ‘17 QI. ‘18 QII. ‘18 QIII. ‘18 QIV. ‘18 QI. ‘19 QII.’19 QIII.’19 QIV. ‘19 QI. ‘20 QII. ‘20 QIII. ‘20 QIV. ‘20 QI. ‘21 QII. ‘21 QIII. ‘21 QIV. ‘21 QI. ‘22 QII. ‘22 QIII. ‘22 QIV.’22 QI. ‘23
Cardinia Casey Whittlesea Hume Melton Wyndham Mitchell Geelong Median (all of VIC)
Source: Oliver Hume Research. Sold Lots. Annual moving average.
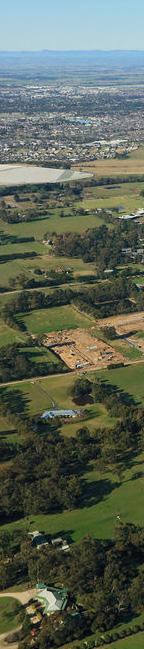
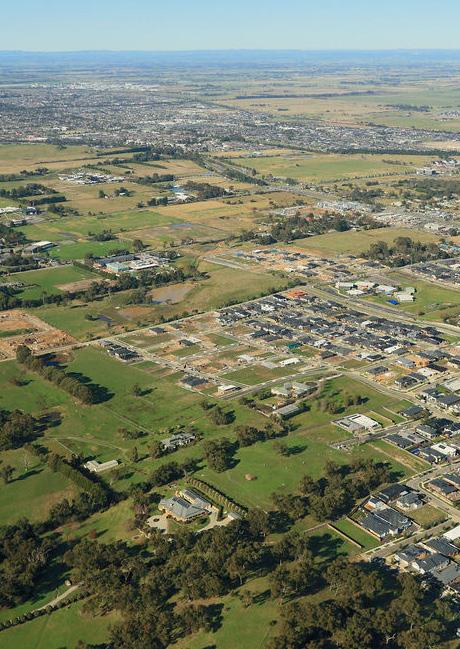
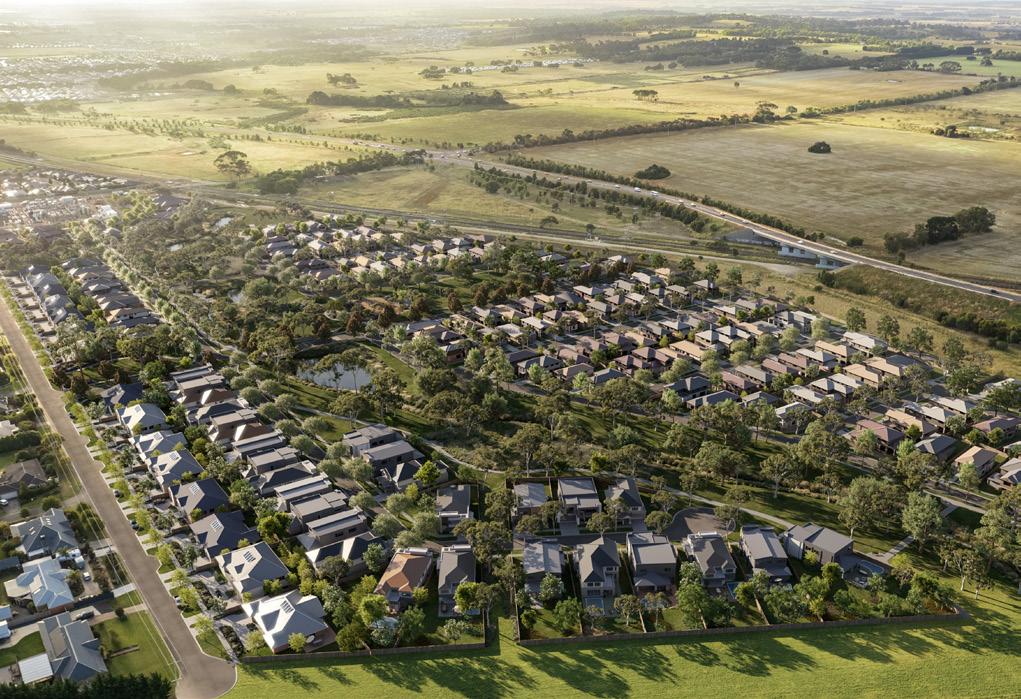
The Grange Waurn Ponds - New Oliver Hume project in Victoria.
Land Market
Sales Volumes
The volume of lots sold, in both metropolitan and key regional markets, continued to moderate in the March quarter 2023.
Drivers of the result included higher interest rates, cost of living pressures and the post COVID-19 moderation in demand (due to the bring forward of sales).
Metropolitan Melbourne Residential Greenfield Sales - Monthly
Source: Oliver Hume Research.
16 QUARTERLY MARKET INSIGHTS MARCH QUARTER 2023
2,500 2,000 1,500 1,000 500 0 Mar-04 Mar-05 Mar-06 Mar-07 Mar-08 Mar-09 Mar-10 Mar-11 Mar-12 Mar-13 Mar-14 Mar-15 Mar-16 Mar-17 Mar-18 Mar-19 Mar-20 Mar-21 Mar-22 Mar-23
2.2
City of Greater Geelong Residential Greenfield Sales - Monthly
Lots across metropolitan Melbourne remained on the market for an average of around 130 days during the March quarter 2023.
Time on market has been increasing since the first interest rate increase in May 2022.
New Residential Land - Average Time on Market (Days) - Metropolitan Melbourne Growth Area Municipalities
17 QUARTERLY MARKET INSIGHTS MARCH QUARTER 2023 QI. ‘12 QII. ‘12 QIII. ‘12 QIV. ‘12 QI. ‘13 QII. ‘13 QIII. ‘13 QIV. ‘13 QI. ‘14 QII. ‘14 QIII. ‘14 QIV. ‘14 QI. ‘15 QII. ‘15 QIII. ‘15 QIV. ‘15 QI. ‘16 QII. ‘16 QIII. ‘16 QIV. ‘16 QI. ‘17 QII. ‘17 QIII. ‘17 QIV. ‘17 QI. ‘18 QII. ‘18 QIII. ‘18 QIV. ‘18 QI. ‘19 QII. ‘19 QIII. ‘19 QIV. ‘19 QI. ‘20 QII. ‘20 QIII. ‘20 QIV. ‘20 QI. ‘21 QII. ‘21 QIII. ‘21 QIV. ‘21 QI. ‘22 QII. ‘22 QIII. ‘22 QIV. ‘22 QI. ‘23 Source: Oliver Hume Research. Time on Market
500 450 400 350 300 250 200 150 100 50 0
Mar-13 Mar-14 Mar-15 Mar-16 Mar-17 Mar-18 Mar-19 Mar-20 Mar-21 Mar-22 Mar-23 Source: Oliver Hume Research. 200 180 160 140 120 100 80 60 40 20 0
March Quarter 2023
Commonly Sold Lots 12.5 x 32m 12.5 x 28m 14 x 32m Median Price
Median Size
Median Value Rate
$386,900* 367sqm $1,062 per sqm
GEELONG WERRIBEE $390,000 $429,000 TARNEIT $427,900 $457,400 FRASER RISE $437,000 n/a LARA $379,900 $412,900 MAMBOURIN $387,500 $420,000 ARMSTRONG CREEK $415,000 $450,000 MELTON SOUTH $399,000 n/a TRUGANINA $470,000 n/a WYNDHAM VALE $376,000 $406,000 Metropolitan
Melbourne
VICTORIA Source: Oliver Hume Research. All lots.
MELBOURNE WOLLERT $464,950 $510,900 MICKLEHAM $427,000 n/a BEVERIDGE $345,000 n/a CLYDE $390,000 $489,000 BERWICK $576,000 $624,000 GREENVALE $510,000 $550,000 WALLAN $345,000 $375,000 CRAIGIEBURN $459,500 $483,500 400 sqm Median Price 448 sqm Median Price Source: Oliver Hume Research. Sold.
Suburb
400 sqm and 488 sqm Lots VICTORIA
Median Lot Prices by
(Gross)
Development Sites
The development site market in Victoria has been affected by higher interest rates, lower residential land prices/volumes as well as construction cost growth, which have all impacted development site purchaser demand.
However, sentiment is slowly changing as robust population growth underpinned by overseas migration is leading some potential development site purchasers to restart their search for suitable sites.
In terms of headline development site values, they remain stable and are likely to remain stable in the foreseeable future.
However, development funding issues are emerging in some instances.
Although non-banks remain popular, some non-bank lenders are now not allocating funds for greenfield residential development.
Additionally, some non-bank lenders are not accepting new clients.
All lenders have increased the time taken to assess and scrutinise deals.
Peter Vassallo Managing Director | Development Sites p.vassallo@oliverhume.com.au

Capital costs remain higher due to higher interest rates.
Projects are experiencing lower sales rates which means capital is not being recycled/redeployed as quickly as before interest rates started to increase.
The marketing timeline of development sites remains longer than usual with the smaller pool of buyers needing more time to do their research and due diligence.
Planning, engineering, servicing authorities and other delays remain key challenges.
Limited development stock for sale is another challenge.
To ensure the industry can deliver new housing projects when required, improvement in several areas including planning and engineering processes must continue.
Despite these challenges, the medium to long term outlook for the Victorian development site market remains robust.
2.3

In terms of headline development site values, they remain stable and are likely to remain stable in the foreseeable future.
3.0
Queensland
Market Drivers
Sebastian Ozturk Queensland Research Analyst s.ozturk@oliverhume.com.au
The Queensland economy and labour market remain resilient despite the impact of higher interest rates. Various economic drivers, including continued robust population growth (especially interstate migration), a stable labour market, strong commodity markets and the steady recovery of tourism, should continue to support growth over the short to medium term.

24 QUARTERLY MARKET INSIGHTS MARCH QUARTER 2023 Economy
3.1 Mar-13 Jul-13 Nov-13 Mar-14 Jul-14 Nov-14 Mar-15 Jul-15 Nov-15 Mar-16 Jul-16 Nov-16 Mar-17 Jul-17 Nov-17 Mar-18 Jul-18 Nov-18 Mar-19 Jul-19 Nov-19 Mar-20 Jul-20 Nov-20 Mar-21 Jul-21 Nov-21 Mar-22 Jul-22 Nov-22 Mar-23
9% 8% 7% 6% 5% 4% 3% Queensland Unemployment Rate Unemployment Rate Long Run Average
Source: Queensland Government Statistician’s Office, ABS.
Net Interstate Migration (Quarterly)

25 QUARTERLY MARKET INSIGHTS MARCH QUARTER 2023
25,000 20,000 15,000 10,000 5,000 0 -5,000 -10,000 -15,000 -20,000 Mar-13 Jun-13 Sep-13 Dec-13 Mar-14 Jun-14 Sep-14 Dec-14 Mar-15 Jun-15 Sep-15 Dec-15 Mar-16 Jun-16 Sep-16 Dec-16 Mar-17 Jun-17 Sep-17 Dec-17 Mar-18 Jun-18 Sep-18 Dec-18 Mar-19 Jun-19 Sep-19 Dec-19 Mar-20 Jun-20 Sep-20 Dec-20 Mar-21 Jun-21 Sep-21 Dec-21 Mar-22 Jun-22 Sep-22 Source: ABS. NSW VIC QLD
Highway interchange and railway yards, Brisbane City, Queensland.
Land Market
Land Market
The South-East Queensland land market continued to experience below long-term average land sales in the first three months of the year.
Higher interest rates and cost of living pressures continue to temper buyer demand despite strong population growth.
However, lot availability has improved significantly over the last year.
South East Queensland Project Land Sales
26 QUARTERLY MARKET INSIGHTS MARCH QUARTER 2023
Source: Oliver Hume Research. Sold Lots. 2,500 2,000 1,500 1,000 500 0
Total Quarterly Sales Long Run Average Moving Quarterly Average Mar-13 Sep-13 Mar-14 Sep-14 Mar-15 Sep-15 Mar-16 Sep-16 Mar-17 Sep-17 Mar-18 Sep-18 Mar-19 Sep-19 Mar-20 Sep-20 Mar-21 Sep-21 Mar-22 Sep-22 Mar-23
3.2 1,441
27 QUARTERLY MARKET INSIGHTS MARCH QUARTER 2023
450 400 350 300 250 200 150 100 50 0
Mar-22 Mar-23
Source: Oliver Hume Research.
Brisbane Gold Coast Ipswich Logan Moreton
Bay
Available Stock - South East Queensland Growth Corridors
Redland
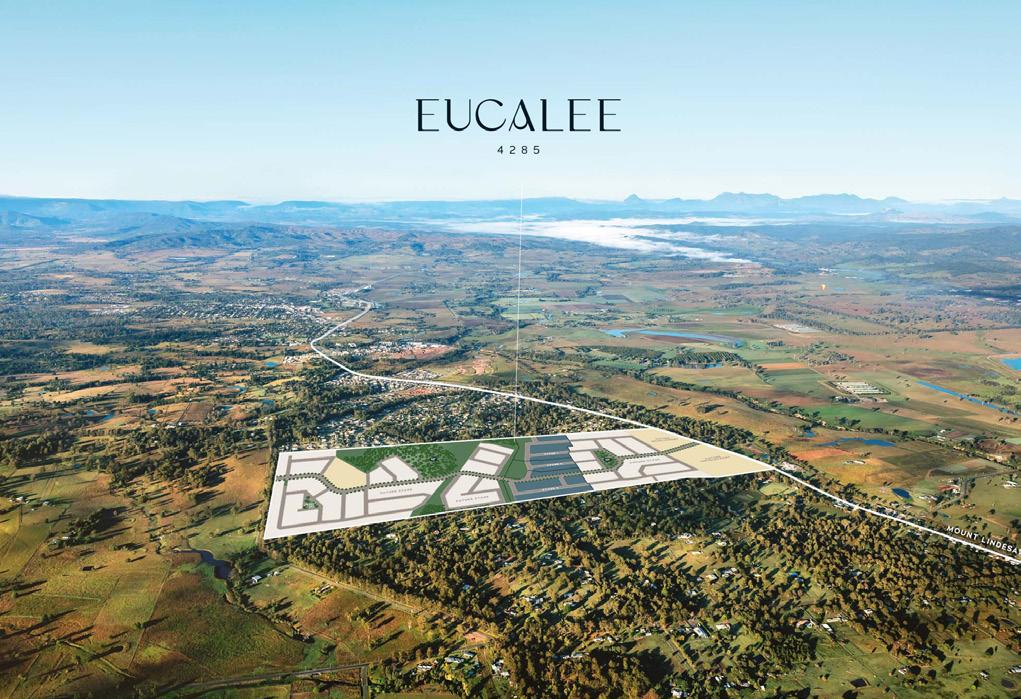
Eucalee - New Oliver Hume project in Queensland.
Land Market
Market Share
The addition of multiple new projects in the Logan region added significant new stock levels and increased that market’s share in the first three months of the year.
Growth Corridor Sales Market Share
South East Queensland Project Land Sales Market Share
28 QUARTERLY MARKET INSIGHTS MARCH QUARTER 2023
Source: Oliver Hume Research. Quarter Brisbane Sales Gold Coast Sales Ipswich Sales Logan Sales Moreton Bay Sales Redland Sales Mar. '23 11.8% 10.0% 21.4% 38.8% 16.1% 1.9% Dec. ‘22 2.5% 9.3% 18.9% 28.0% 35.7% 5.5% Mar. ‘22 2.5% 4.2% 38.4% 35.3% 18.4% 1.1% Source: Oliver Hume Research. Redland Moreton Bay Logan Ipswich Gold Coast Brisbane
3.2 1.9% 16.1% 38.8% 21.4% 10.0% 11.8%
Median Prices
South-East Queensland median land prices rose in the March quarter 2023 (up 1.8%) to reach a new high of $345,000.
All municipalities, except for Redlands, recorded an increase in median land prices.
New Residential Land - Median Lot Prices, South East Queensland Municipalities
South East Queensland Median Lot Prices by Local Government Area
29 QUARTERLY MARKET INSIGHTS MARCH QUARTER 2023 Source:
Hume Research. Brisbane Gold Coast Ipswich Logan Moreton Bay Redland SEQ QI.’22 QII.’22 QIII.’22 QIV.’22 QI.’23 $1,200,000 $1,000,000 $800,000 $600,000 $400,000 $200,000 $0
Oliver
Source:
Oliver Hume Research.
LGA QI. '23 QIV. '22 QI. '22 QoQ YoY 5 yr Change Brisbane (C) $595,000 $539,500 $888,000 10.3% -33.0% 68.9% Gold Coast (C) $645,000 $614,000 $759,900 5.0% -15.1% 102.0% Ipswich (C) $320,000 $300,000 $279,900 6.7% 14.3% 55.5% Logan (C) $315,000 $300,076 $288,450 5.0% 9.2% 47.2% Moreton Bay (R) $385,000 $360,000 $335,000 6.9% 14.9% 48.0% Redland (C) $570,000 $640,000 $540,000 -10.9% 5.6% 88.4% SEQ $345,000 $339,000 $307,700 1.8% 12.1% 45.1%
Land Market
Median Lot Size
Across South-East Queensland lots sized 301 sqm – 400 sqm remained the most in demand product accounting for 34% of all sales made in the March quarter 2023.
30 QUARTERLY MARKET INSIGHTS MARCH QUARTER 2023
3.2 100% 90% 80% 70% 60% 50% 40% 30% 20% 10% 0% Source: Oliver Hume Research. QIII. ‘19 QII. ‘19 QIV. ‘19 QI. ‘20 QII. ‘20 QIII. ‘20 QIV. ‘20 QI. ‘21 QII. ‘21 QIII. ‘21 QIV. ‘21 QI. ‘22 QII. ‘22 QIII. ‘22 QIV. ‘22 QI. ‘23 Long-run Average Less than 300 sqm 301-400 sqm 401-500 sqm 501-600 sqm 601-1,000 sqm
7% 10% 10% 12% 10% 10% 9% 8% 9% 10% 24% 9% 16% 15% 12% 15% 12% 33% 11% 13% 15% 15% 14% 13% 9% 10% 17% 12% 11% 11% 13% 14% 11% 12% 34% 34% 36% 31% 35% 34% 33% 34% 44% 37% 29% 37% 31% 35% 28% 31% 43% 38% 34% 36% 34% 37% 41% 41% 54% 38% 38% 38% 32% 33% 41% 34% 37% 6% 5% 5% 6% 6% 7% 7% 8% 7% 10% 4% 1% 5% 8% 3% 7% 8%
East Queensland Median Lot Sizes by Local Government Area (sqm) Source: Oliver Hume Research. LGA QI. '23 QIV. '22 QI. '22 QoQ YoY 5 yr Change Brisbane (C) 400 401 406 -0.2% -1.4% -1.4% Gold Coast (C) 395 451 476 -12.4% -17.0% -17.0% Ipswich (C) 420 448 446 -6.3% -5.9% -5.9% Logan (C) 455 433 406 5.1% 12.0% 12.0% Moreton Bay (R) 419 384 426 9.1% -1.7% -1.7% Redland (C) 452 410 419 10.2% 7.8% 7.8% SEQ 430 407 430 5.7% -0.1% -0.1%
South East Queensland Project Land Sales (0 - 1,000 sqm) Market Share by Product Type
South
Value Rates
The South-East Queensland median value rate ($/m2) recorded a slight fall for the first quarter of the year.
The decline was due to an increase in the size of blocks which sold across the market.
South
East Queensland Project Land Sales (March Quarter 2023) | Median Value Rate ($ per sqm)
South
East Queensland Median Value Rates by Local Government Area ($/sqm)
Source: Oliver Hume Research.
Source: Oliver Hume Research.
31 QUARTERLY MARKET INSIGHTS MARCH QUARTER 2023
$0 $200 $400 $600 $800 $1,000 $1,200 $1,400 $1,600 $1,800 SOUTH EAST QUEENSLAND REDLAND MORETON BAY LOGAN IPSWICH GOLD COAST BRISBANE
LGA QI. '23 QIV. '22 QI. '22 QoQ $ Value Change (QoQ) YoY $ Value Change (YoY) 5 yr Change $ Value Change (5Yr Change) Brisbane (C) $1,488 $1,345 $2,189 10.6% $142 -32.0% -$701 71.3% $619 Gold Coast (C) $1,633 $1,361 $1,596 19.9% $271 2.3% $36 143.4% $962 Ipswich (C) $762 $670 $627 13.8% $92 21.5% $135 65.2% $301 Logan (C) $692 $693 $710 -0.1% -$1 -2.5% -$18 31.5% $166 Moreton Bay (R) $919 $938 $786 -2.0% -$19 16.9% $133 50.6% $309 Redland (C) $1,261 $1,561 $1,288 -19.2% -$300 -2.1% -$27 74.8% $540 SEQ $802 $833 $715 -3.7% -$31 12.2% $87 45.2% $250 $802 $1,261 $919 $692 $762 $1,633 $1,488
Land Market
Time on Market
Lots stayed on the market for an average of 61 days during the March quarter 2023 (up from 30 days in the previous quarter). Most sub-markets recorded a similar result (except for the Redlands market).
Although much higher interest rates continue to influence the time it takes to sell, with future interest rate uncertainty and serviceability issues being just some of the challenges faced by buyers, the recent result was consistent with long-term trends for the South East Queensland market.
South East Queensland New Residential Land - Median Time on Market (Days)
32 QUARTERLY MARKET INSIGHTS MARCH QUARTER 2023
3.2 100 90 80 70 60 50 40 30 20 10 0 BRISBANE GOLD COAST IPSWICH LOGAN MORETON BAY REDLAND SEQ
East Queensland
Residential Land
Median Time on Market (Days) Source:
140 120 100 80 60 40 20 0 QI. ‘17 QII. ‘17 QIII. ‘17 QIV. ‘17 QI. ‘18 QII. ‘18 QIII. ‘18 QIV. ‘18 QI. ‘19 QII.’19 QIII.’19 QIV. ‘19 QI. ‘20 QII. ‘20 QIII. ‘20 QIV. ‘20 QI. ‘21 QII. ‘21 QIII. ‘21 QIV. ‘21 QI. ‘22 QII. ‘22 QIII. ‘22 QIV. ‘22 QI. ‘23
South
New
-
Oliver Hume Research.
Source: Oliver Hume Research.

South East
CABOOLTURE n/a $339,000 MORAYFIELD $325,000 $395,000 REDBANK PLAINS $210,900 n/a SPRING MOUNTAIN $370,500 $420,000 RIPLEY $296,500 n/a
Queensland March Quarter 2023 QUEENSLAND COLLINGWOOD PARK $281,500 $305,000 DEEBING HEIGHTS $288,000 n/a Commonly Sold Lots 12.5 x 30m 12.5 x 32m 14 x 30m Median Price Median Size Median Value Rate $345,000 430sqm $802 per sqm
GOLD COAST BRISBANE CHAMBERS FLAT n/a $331,500 375 sqm Median Price 400 sqm Median Price Source: Oliver Hume Research. Sold. Median Lot Prices by Suburb (Gross) 375 sqm and 400 sqm Lots QUEENSLAND
4.0 South Australia
Market Drivers
Economy
Despite some short-term challenges to the South Australian economy, due to mainly the impact of higher interest rates, the outlook for the State remains strong.
South Australia’s population increased by more than 25,000 people over the year ended in September 2022 (up 1.4% to 1.83 million).
The population increase was the second largest increase on record and was driven mostly by net overseas migration (over 19,560).
The state’s unemployment rate has edged higher recently but remains relatively low.
George Bougias National Head of Research g.bougias@oliverhume.com.au
4.1
South Australia’s population increased by more than 25,000 people over the year.
Land Market
Prices
Greater Adelaide median residential land prices increased by around 5% in the March quarter 2023 to reach $251,500 (up 29% over the year).
Recent price movements are consistent with broader local property market trends driven by the resilience of the Adelaide residential market, limited rental stock (as shown by very low vacancy rates) and strong population growth.
Greater Adelaide Median Lot Price (3-month moving average, selected lot types)
40 QUARTERLY MARKET INSIGHTS MARCH QUARTER 2023
$250,000 $200,000 $150,000 $100,000 Source: Oliver Hume Research. 300 sqm 375 sqm 420 sqm
4.2 QI. ‘22 QII. ‘22 QIII. ‘22 QIV. ‘22 QI. ‘23
Sales Volumes
The volume of sales in the Greater Adelaide market edged higher in the March quarter 2023 from the previous quarter (from 605 to 611).
The result was driven by a range of factors including robust population growth and significant housing shortages in the broader Adelaide property market.
Oliver Hume Research.
The median size of lots transacted across the Greater Adelaide market remained stable in the March quarter 2023. The size of lots transacted has declined in recent years due to a combination of factors including growing affordability pressures (higher land prices, higher interest rates and construction cost increases).
Greater Adelaide Residential Land Median Lot Size (sqm) - Quarterly
Oliver Hume Research.
41 QUARTERLY MARKET INSIGHTS MARCH QUARTER 2023
Median Lot Size
490 480 470 460 450 440 430 420 410 400 390
Source:
Greater Adelaide Residential Land Sales 1,200 1,000 800 600 400 200 0 QI. ‘22 QII. ‘22 QIII.
QIV. ‘22 QI.
QI.
QII.
QIII.
QIV.
QI.
Source:
‘22
‘23
‘22
‘22
‘22
‘22
‘23
SOUTH AUSTRALIA
Greater Adelaide*
March Quarter 2023
Commonly Sold Lots 12.5 x 30m 10 x 30m 14 x 30m
Median Price
$245,000 420sqm $573 per sqm
Median Size
Median Value Rate * Metropolitan Adelaide and selected regional municipalities.
300 sqm Median Price 375 sqm Median Price Source: Oliver Hume Research. Sold.
Suburb
300 sqm and 375 sqm Lots SOUTH AUSTRALIA BUCKLAND PARK n/a $229,400 DAVOREN PARK n/a $155,000 PORT NOARLUNGA SOUTH $312,000 $355,500 ROSEWORTHY $243,000 n/a VIRGINIA n/a $238,950 WOODVILLE n/a $340,000 ANGLE VALE $199,000 $239,000 ANDREWS FARM $172,000 $195,750 EVANSTON GARDEN $159,000 $199,000 GAWLER BELT $164,000 $197,000 OAKDEN $389,000 $487,000 OLD REYNELLA $282,500 $347,500 ADELAIDE GAWLER EAST n/a $202,400 ALDINGA n/a $299,000 MUNNO PARA DOWNS $189,950 $215,950 SEAFORD HEIGHTS $300,000 $340,000
Median Lot Prices by
(Gross)


information
this document
information
the information has been prepared in good faith
to the accuracy of the whole
any part of the publication. No liability for negligence or otherwise is assumed for any loss
damage
from their use of this publication. The whole or any part of this publication must not be mirrored, reproduced or copied, without written consent. The document may contain future forecasts of a range of variables, which can be affected by a significant number of unpredictable factors, including social and economic conditions. It only represents the best judgements and estimates, made by Oliver Hume Research. No assurances can be given that the forecasts will be achieved. This document should be read in conjunction with any other documentation prepared by the marketing agent and associated consultants. www.oliverhume.com.au HEAD OFFICE Level 2 4 Riverside Quay Southbank, VIC 3006 P. 03 9669 5999 BRISBANE Shop 9, Gasworks Precinct 26 Reddacliff Street Newstead, QLD 4006 P. 07 3216 1666 SOUTH AUSTRALIA Level 1, 89 Pirie Street Adelaide, SA 5000 P. 08 7201 3999 SYDNEY Level 24, Tower 3 300 Barangaroo Avenue Sydney, NSW 2000 P. 1300 881 780 GOLD COAST Suite 5B, Emerald Lakes Town Centre Commercial 3027 The Blvd, Emerald Lakes Carrara QLD 4211 P. 1300 645 433 DARWIN 129 Asche Street Muirhead, NT 0810 P. 1300 7373 598
Important: The
in
has been prepared a general guide only and does not constitute advice. We have relied upon
from sources generally regarded as authoritative. Whilst
and with due care, no representation is made in relation
or
or
suffered by any party resulting