Quarterly Market Insights
2022
December Quarter
TABLE OF CONTENTS 1.0 Foreword 04 1.1 National Highlights 08 VICTORIA 2.1 Market Drivers 12 2.2 Land Market 14 2.3 Development Sites 20 QUEENSLAND 3.1 Market Drivers 24 3.2 Land Market 26 SOUTH AUSTRALIA 4.1 Market Drivers 38 4.2 Land Market 40 FEATURE ARTICLES Why 6,100,000 Is The Most Important Number For Melbourne Property Buyers 46 The Population Boom Underpinning Queensland’s Decade of Opportunity 48
1.0
Foreword
Market conditions remain soft with the combined impacts of higher interest rates, inflation and cost of living pressures driving consumer and buyer sentiment lower.
The most recent interest rate increase, on 7 February 2023, took the cash rate to 3.35% and was the ninth successive increase by the Reserve Bank of Australia (RBA).
There is debate on how many more rate increases will follow with a range of factors at play.
A key factor is the delay in the impact of monetary policy. It takes time for the full impact of higher interest rates to flow through to the economy.
Another factor is the sizeable share of existing fixed-rate loans which are expected to roll over into significantly higher variable rates in 2023.
Some commentators suggest the RBA might pause, at some stage in the coming months, to assess the impact of the interest rate decisions to date.
Overall, however, it appears likely that the RBA will raise interest rates further.
This will result in higher repayments for many households and place further cost of living pressures which will slow demand.
Residential land markets have, so far, adjusted to higher interest rates mostly through sale volumes.
Volumes continue to decline from recent highs and are expected to remain at below-long-term average levels over the immediate and short-term.
Gross land prices have remained relatively resilient to date.
However, rebates and incentives are emerging and we expect will be increasingly used over the short to medium term.
We expect overall market activity to remain soft over the coming months as the impact of higher interest rates flows through.
While the immediate and short-term outlook remains challenging, the medium to long term outlook, for the residential land and broader property markets, remains robust being underpinned by continued improvements in property market fundamentals and steady economic and employment growth.
Population growth is rapidly rebounding driven by the return of overseas migrants.
Overseas migration is now trending around prepandemic levels and permanent arrivals recently reached a new high.
Overseas migration is forecast to increase to a net inflow of 235,000 from 2022–23 and remain at around that level (Source: Centre for Population 2022, 2022 Centre for Population Statement, The Australian Government, Canberra.).
Vacancy rates remain at near record lows with some markets estimated to have reached record lows.
Going forward, various measures of dwelling supply continue to point to major challenges in delivering the required number of dwellings.
Residential building completions and commencements continue to decline.
We consider that housing shortages in key metropolitan and regional markets remain significant and are likely to continue increasing.
Higher interest rates and inflation will challenge the outlook for the Australian and global economies in 2023.
However, to date, Australia’s economy and labour market have remained resilient overall.
The national unemployment rate remains at around half century lows.
Employment growth also remains steady.
The latest Quarterly Market Insights (QMI) report examines the key indicators we follow to anticipate market trends and assess the outlook. We analyse what the market has done in the past, what is happening now and where the market is headed.
Importantly, the QMI report presents our own proprietary market intelligence, collected and analysed by our in-house research team. Our proprietary market intelligence and research provides the latest trends to our clients, stakeholders and strategic partners and empowers them to anticipate the future and make strategic decisions.
It’s all part of our commitment to providing leading market insights, forecasts and in-depth analysis of the Australian residential property market.
4 QUARTERLY MARKET INSIGHTS DECEMBER QUARTER 2022

5 QUARTERLY MARKET INSIGHTS DECEMBER QUARTER 2022
NORTHERN TERRITORY
SOUTH WALES
Julian Coppini Chief Executive Officer - Project Marketing j.coppini@oliverhume.com.au WESTERN
AUSTRALIA
SOUTH AUSTRALIA NEW
QUEENSLAND VICTORIA TASMANIA Perth
Adelaide Canberra
Sydney Brisbane Gold
Melbourne
Darwin
Hobart
Coast
1.0
National Highlights

8 QUARTERLY MARKET INSIGHTS DECEMBER QUARTER 2022 National Highlights 1.1 George Bougias National Head of Research g.bougias@oliverhume.com.au Cash Rate Target 3.35% Economic Growth 5.9% Inflation 7.8% Unemployment Rate 3.5% Employment Growth 3.4% Wage Growth 3.1% Average Weekly Earning $1,344. Household Saving Ratio 6.9% Net foreign liabilities 36.2% 70 % of GDP Conversion Rate A$1 1.1% $0.69 Population Annual Growth 26.0M Employment to Population Ratio 64.3% Average Price of Residential Dwellings $890K Household Wealth as a share of income as a share of income 884% Household debt 188% =US Data in this snapshot are the latest available as at 9 February 2023. Sources: Reserve Bank of Australia (RBA), Australian Bureau of Statistics (ABS).
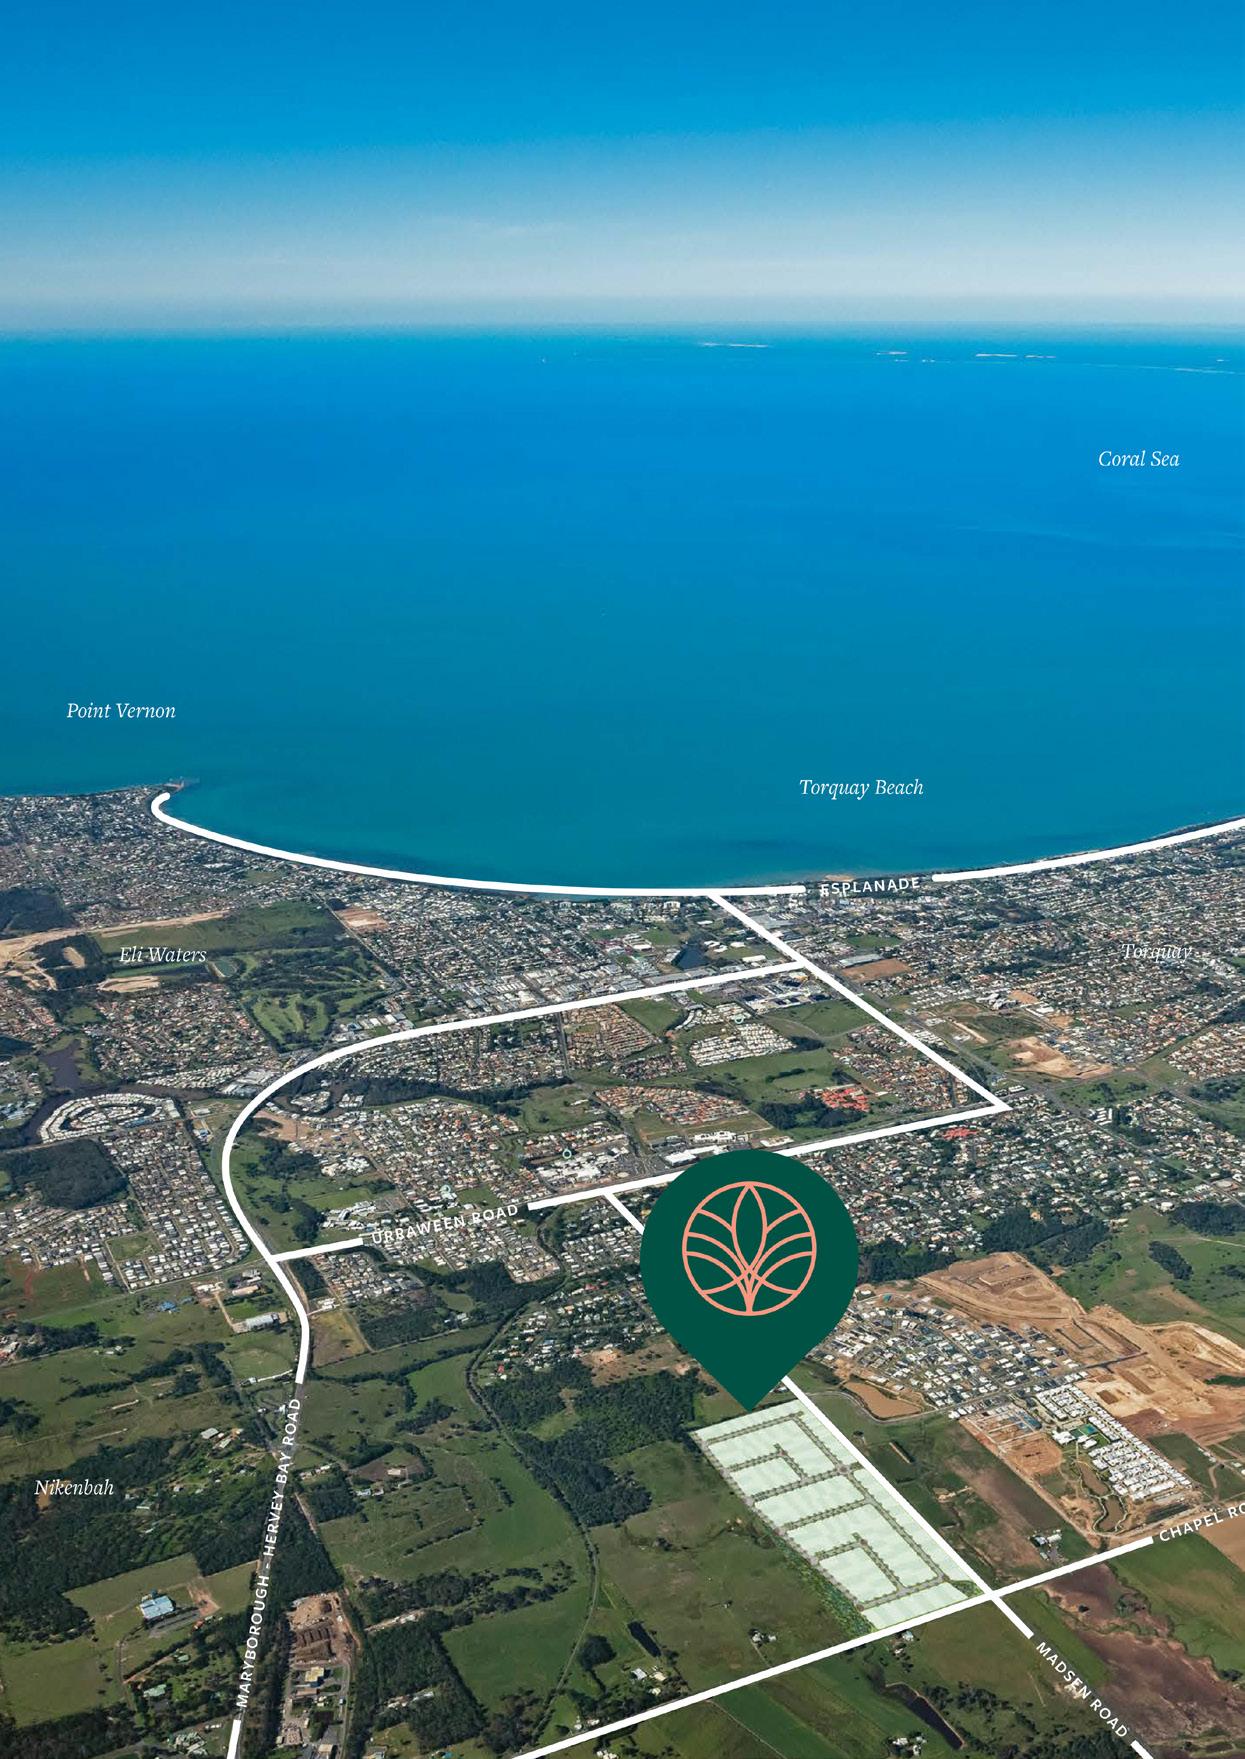
Bloom
- New Oliver Hume project in Queensland.
2.0 Victoria
Market Drivers
The outlook for the Victorian economy remains positive.
Recent economic growth has been greater than the national average while state final demand remains above pre-pandemic levels.
Steady growth in employment is forecast.
The unemployment rate is forecast to remain low albeit increasing over the short to medium term.
12 QUARTERLY MARKET INSIGHTS DECEMBER QUARTER 2022
2.1 Economy
% 18 12 6 0 Labour Underutilisation Rates - Australia 1996 1983 1970 2022 2009 * Employed people who want, and are available, to work more hours. Sum of the unemployment and underemployment rates. Source: RBA, ABS. Underemployment Rate* Unemployment Rate Underutilisation Rate** * The trend series have been suspended from April 2020 until more certainty emerges in the underlying trend in labour market activity over the COVID-19 period. Source: RBA, ABS. % 8 7 6 5 4 3 2 VIC NSW QLD SA TAS WA 2022 2016 2016 2022 2010 2010 State Unemployment Rates* (%) - Seasonally adjusted
The outlook for the Victorian economy remains positive.
Land Market
Prices
New residential land prices increased in the December quarter 2022 to reach a record high. The median (gross) price of metropolitan Melbourne conventional lots for the December quarter 2022 increased to $385,000 (up from $383,450 in the September quarter 2022).
Metropolitan Melbourne Growth Area Municipalities Median Land Price
14 QUARTERLY MARKET INSIGHTS DECEMBER QUARTER 2022
2.2 QIII. ‘10 QIV. ‘10 QI. ‘11 QII. ‘11 QIII. ‘11 QIV. ‘11 QI. ‘12 QII. ‘12 QIII. ‘12 QIV. ‘12 QI. ‘13 QII. ‘13 QIII. ‘13 QIV. ‘13 QI. ‘14 QII. ‘14 QIII. ‘14 QIV. ‘14 QI. ‘15 QII. ‘15 QIII. ‘15 QIV. ‘15 QI. ‘16 QII. ‘16 QIII. ‘16 QIV. ‘16 QI. ‘17 QII. ‘17 QIII. ‘17 QIV. ‘17 QI. ‘18 QII. ‘18 QIII. ‘18 QIV. ‘18 QI. ‘19 QII.’19 QIII.’19 QIV. ‘19 QI. ‘20 QII. ‘20 QIII. ‘20 QIV. ‘20 QI. ‘21 QII. ‘21 QIII. ‘21 QIV. ‘21 QI. ‘22 QII. ‘22 QIII. ‘22 QIV. ‘22 Source: Oliver Hume Research. Sold Lots. $400,000 $350,000 $300,000 $250,000 $200,000 $150,000
Victorian Growth Area Median Land Prices
Source: Oliver Hume Research. Sold Lots. Annual moving average.
Victorian Median Lot Prices
Source: Oliver Hume Research. Sold Lots.
15 QUARTERLY MARKET INSIGHTS DECEMBER QUARTER 2022
Municipality QIV, ‘21 QIII, ‘22 QIV, ‘22 % Change (QoQ) % Change (YoY) $ Change (QoQ) $ Change (YoY) Cardinia $429,900 $380,000 $392,000 3.2% -8.8% $12,000 ($37,900) Casey $418,000 $475,000 $429,000 -9.7% 2.6% ($46,000) $11,000 Geelong $339,900 $379,000 $386,500 2.0% 13.7% $7,500 $46,600 Hume $336,000 $380,000 $398,000 4.7% 18.5% $18,000 $62,000 Melton $347,500 $385,000 $377,580 -1.9% 8.7% ($7,420) $30,080 Mitchell $317,000 $345,000 $354,000 2.6% 11.7% $9,000 $37,000 Whittlesea $344,000 $387,900 $402,000 3.6% 16.9% $14,100 $58,000 Wyndham $321,900 $368,000 $376,000 2.2% 16.8% $8,000 $54,100 Metro Melbourne (All Growth Areas) - Conventional $355,000 $383,450 $385,000 0.4% 8.5% $1,550 $30,000 Metro Melbourne (All Growth Areas) - All Lots $355,000 $382,000 $388,000 1.6% 9.3% $6,000 $33,000 Median (All of Victoria) $345,000 $375,000 $386,000 2.9% 11.9% $11,000 $41,000 $500,000 $450,000 $400,000 $350,000 $300,000 $250,000 $200,000 $150,000 $100,000 $50,000 $0 QIV. ‘10 QI. ‘11 QII. ‘11 QIII. ‘11 QIV. ‘11 QI. ‘12 QII. ‘12 QIII. ‘12 QIV. ‘12 QI. ‘13 QII. ‘13 QIII. ‘13 QIV. ‘13 QI. ‘14 QII. ‘14 QIII. ‘14 QIV. ‘14 QI. ‘15 QII. ‘15 QIII. ‘15 QIV. ‘15 QI. ‘16 QII. ‘16 QIII. ‘16 QIV. ‘16 QI. ‘17 QII. ‘17 QIII. ‘17 QIV. ‘17 QI. ‘18 QII. ‘18 QIII. ‘18 QIV. ‘18 QI. ‘19 QII.’19 QIII.’19 QIV. ‘19 QI. ‘20 QII. ‘20 QIII. ‘20 QIV. ‘20 QI. ‘21 QII. ‘21 QIII. ‘21 QIV. ‘21 QI. ‘22 QII. ‘22 QIII. ‘22 QIV.’22
Cardinia Casey Whittlesea Hume Melton Wyndham Mitchell Geelong Metro Melbourne Median (all of
VIC)
Land Market
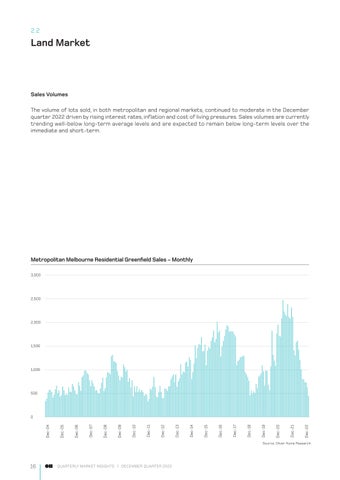
Sales Volumes
The volume of lots sold, in both metropolitan and regional markets, continued to moderate in the December quarter 2022 driven by rising interest rates, inflation and cost of living pressures. Sales volumes are currently trending well-below long-term average levels and are expected to remain below long-term levels over the immediate and short-term.
Metropolitan Melbourne Residential Greenfield Sales - Monthly
16 QUARTERLY MARKET INSIGHTS DECEMBER QUARTER 2022
3,000 2,500 2,000 1,500 1,000 500 0 Dec-04 Dec-05 Dec-06 Dec-07 Dec-08 Dec-09 Dec-10 Dec-11 Dec-12 Dec-13 Dec-14 Dec-15 Dec-16 Dec-17 Dec-18 Dec-19 Dec-20 Dec-21 Dec-22
Source: Oliver Hume Research.
2.2
Lots across metropolitan Melbourne remained on market for an average of 99 days during the December quarter 2022. The time on market has been increasing in recent months following the first interest rate increase in May 2022 and is expected to trend higher.
17 QUARTERLY MARKET INSIGHTS DECEMBER QUARTER 2022 QI. ‘12 QII. ‘12 QIII. ‘12 QIV. ‘12 QI. ‘13 QII. ‘13 QIII. ‘13 QIV. ‘13 QI. ‘14 QII. ‘14 QIII. ‘14 QIV. ‘14 QI. ‘15 QII. ‘15 QIII. ‘15 QIV. ‘15 QI. ‘16 QII. ‘16 QIII. ‘16 QIV. ‘16 QI. ‘17 QII. ‘17 QIII. ‘17 QIV. ‘17 QI. ‘18 QII. ‘18 QIII. ‘18 QIV. ‘18 QI. ‘19 QII. ‘19 QIII. ‘19 QIV. ‘19 QI. ‘20 QII. ‘20 QIII. ‘20 QIV. ‘20 QI. ‘21 QII. ‘21 QIII. ‘21 QIV. ‘21 QI. ‘22 QII. ‘22 QIII. ‘22 QIV. ‘22 Source: Oliver Hume Research. Time on Market
Monthly Sales (No.) 500 450 400 350 300 250 200 150 100 50 0
Residential Land
Time
Market
Dec-12 Dec-13 Dec-14 Dec-15 Dec-16 Dec-17 Dec-18 Dec-19 Dec-20 Dec-21 Dec-22 Source: Oliver Hume Research. 200 180 160 140 120 100 80 60 40 20 0
City of Greater Geelong Residential Greenfield Sales - Monthly New
- Average
on
(Days) - Metropolitan Melbourne Growth Area Municipalities
Commonly Sold Lots 12.5 x 28m 12.5 x 32m 14 x 32m Median Price
Median Size
Median Value Rate
$388,000* 375sqm $1,051 per sqm
GEELONG WERRIBEE $390,500 $424,000 TARNEIT $439,000 $457,900 FRASER RISE $429,000 n/a LARA n/a $379,000 MAMBOURIN $387,500 $420,000 ARMSTRONG CREEK $415,000 $450,000 PLUMPTON $409,500 n/a TRUGANINA $461,800 $524,000 WYNDHAM VALE $376,000 $425,000 Metropolitan Melbourne
VICTORIA Source: Oliver Hume Research. All lots.
December Quarter 2022
MELBOURNE WOLLERT $463,450 $515,900 MICKLEHAM n/a $461,000 BEVERIDGE $354,000 $409,000 CLYDE n/a $489,000 GREENVALE $505,000 $546,000 WALLAN $345,000 $338,000 CRAIGIEBURN $470,000 $504,000 400 sqm Median Price 448 sqm Median Price Source: Oliver Hume Research. Sold.
Suburb
400 sqm and 488 sqm Lots December Quarter 2022 VICTORIA
Median Lot Prices by
(Gross)
Development Sites
Transaction activity in the development site market has slowed due to a range of factors including higher interest rates and softer conditions in the residential land market.
Development site buyer demand has slowed for both metropolitan Melbourne and regional Victorian markets. However, demand for regional Victorian sites has decreased to a greater extent, driven by the view that migration to the regions from Melbourne has slowed.
Development site headline values have remained relatively stable. However, deal structuring continues to evolve with extended settlement periods being generally sought by purchasers.
Marketing campaigns are taking longer, reflecting less urgency amongst buyers due to less competition for development sites. Buyers are also seeking more time for research and due diligence.
Funding conditions remain challenging with lenders taking more time to assess and scrutinise deals. The cost of capital has also increased due to much higher interest rates and the prospect of further rate increases.
Peter Vassallo Managing Director | Development Sites p.vassallo@oliverhume.com.au

Banks continue to assess deals considering their overall exposure to the market including by asset class and by geography.
Non-banks continue to see increased popularity.
While higher inflation and construction costs continue to impact cost escalations, the rate of cost increase appears to be slowing.
Planning, engineering and other delays in progressing sites through the development process remain a major issue. The coordination of servicing authorities continues to be a key problem in particular.
Despite these challenges, the medium to long term outlook remains robust for the greenfield development site market in Victoria.
The outlook is underpinned by a range of factors including strong forecast population growth, a sizeable infrastructure pipeline (which will improve connectivity across the state and provide a range of other benefits) and the ongoing improvement in planning processes which will encourage the development of new housing projects.
2.3
... the medium to long term outlook remains robust for the greenfield development site market in Victoria.
3.0
Queensland
Market Drivers
Economy
Sebastian Ozturk Queensland Research Analyst s.ozturk@oliverhume.com.au

The fundamentals of Queensland’s economy remain strong despite recent headwinds including higher interest rates, higher inflation and floods.
Population growth remains a key driver of economic growth with Queensland continuing to lead the nation in terms of interstate migration.
Queensland’s diversified economy remains a strength and includes energy, mineral resources, tourism, agriculture and manufacturing industries.
Unemployment remains extremely low with steady employment growth forecast.
24 QUARTERLY MARKET INSIGHTS DECEMBER QUARTER 2022
3.1 Apr-11 Aug-11 Dec-11 Apr-12 Aug-12 Dec-12 Apr-13 Aug-13 Dec-13 Apr-14 Aug-14 Dec-14 Apr-15 Aug-15 Dec-15 Apr-16 Aug-16 Dec-16 Apr-17 Aug-17 Dec-17 Apr-18 Aug-18 Dec-18 Apr-19 Aug-19 Dec-19 Apr-20 Aug-20 Dec-20 Apr-21 Aug-21 Dec-21 Apr22 Aug-22 Dec-22
ABS. 9% 8% 7% 6% 5% 4% 3% Queensland
Unemployment Rate Long Run Average
Source: Queensland Government Statistician’s Office,
Unemployment Rate
Queensland Employment Growth
Source: ABS, Queensland Treasury. Change in the number of persons employed on either a full-time (at least 35 hours per week) or part-time (at least one hour per week) basis, in Queensland, during a monthly period.
Net Interstate Migration (Quarterly)
25 QUARTERLY MARKET INSIGHTS DECEMBER QUARTER 2022
350 300 250 200 150 100 50 0 -50 -100 -150 -200 Yearly person change, ‘000, seasonally adjusted Jun-16 Aug-16 Oct-16 Dec-16 Feb-17 Apr-17 Jun-17 Aug-17 Oct-17 Dec-17 Feb-18 Apr-18 Jun-18 Aug-18 Oct-18 Dec-18 Feb-19 Apr-19 Jun-19 Aug-19 Oct-19 Dec-19 Feb-20 Apr-20 Jun-20 Aug-20 Oct-20 Dec-20 Feb-21 Apr-21 Jun-21 Aug-21 Oct-21 Dec-21 Feb-22 Apr-22 Jun-22 Aug-22 Oct-22 Dec-22
Part-time Full-time Total
12,000 10,000 8,000 6,000 4,000 2,000 0 -2,000 -4,000 -6,000 -8,000 Sep-2008 Dec-2008 Mar-2009 Jun-2009 Sep-2009 Dec-2009 Mar-2010 Jun-2010 Sep-2010 Dec-2010 Mar-2011 Jun-2011 Sep-2011 Dec-2011 Mar-2012 Jun-2012 Sep-2012 Dec-2012 Mar-2013 Jun-2013 Sep-2013 Dec-2013 Mar-2014 Jun-2014 Sep-2014 Dec-2014 Mar-2015 Jun-2015 Sep-2015 Dec-2015 Mar-2016 Jun-2016 Sep-2016 Dec-2016 Mar-2017 Jun-2017 Sep-2017 Dec-2017 Mar-2018 Jun-2018 Sep-2018 Dec-2018 Mar-2019 Jun-2019 Sep-2019 Dec-2019 Mar-2020 Jun-2020 Sep-2020 Dec-2020 Mar-2021 Jun-2021 Sep-2021 Dec-2021 Mar-2022 Jun-2022 Source: ABS. NSW VIC QLD
Land Market
Land Market
Conditions in the South-East Queensland land market improved in the December quarter despite higher interest rates.
Buyer and consumer sentiment continues to be affected by higher interest rates.
However, population growth has rebounded being driven by both interstate and overseas migrants. Lot availability continues to be a key driver for sale volumes.
The Moreton Bay market recorded the largest quarterly rise in available stock with several new projects being launched.
For the first time in two years, three of the six South East Queensland growth corridors recorded over 200 available lots for sale.
All regions in the South-East Queensland market recorded an increase in the number of total lots available compared to the same time last year.
South East Queensland Project Land Sales
26 QUARTERLY MARKET INSIGHTS DECEMBER QUARTER 2022
Source: Oliver Hume Research. Sold Lots. 2,500 2,000 1,500 1,000 500 0
Total Quarterly Sales Long Run Average Moving Quarterly Average Sep-12 Dec-12 Sep-13 Dec-13 Mar-14 Jun-14 Sep-14 Dec-14 Mar-15 Jun-15 Sep-15 Dec-15 Mar-16 Jun-16 Sep-16 Dec-16 Mar-17 Jun-17 Sep-17 Dec-17 Mar-18 Jun-18 Sep-18 Dec-18 Mar-19 Jun-19 Sep-19 Dec-19 Mar-20 Jun-20 Sep-20 Dec-20 Mar-21 Jun-21 Sep-21 Dec-21 Mar-22 Jun-22 Sep-22 Dec-22
3.2 1,441

27 QUARTERLY MARKET INSIGHTS DECEMBER QUARTER 2022
350 300 250 200 150 100 50 0
Source: Oliver Hume Research.
Brisbane Gold Coast Ipswich
Logan Moreton Bay
Dec-21 Dec-22
Available Stock - South East Queensland Growth Corridors
Redland
Eucalee - New Oliver Hume project in Queensland.
Land Market
Market Share
The Moreton Bay region recorded the largest market share for the first time on record with the addition of several new projects.
Growth Corridor Sales Market Share
South East Queensland Project Land Sales Market Share
28 QUARTERLY MARKET INSIGHTS DECEMBER QUARTER 2022
Source: Oliver Hume
Quarter Brisbane Sales Gold Coast Sales Ipswich Sales Logan Sales Moreton Bay Sales Redland Sales Dec. '22 2.5% 9.3% 18.9% 28.0% 35.7% 5.5% Sep. ‘22 4.0% 3.1% 34.3% 39.3% 15.3% 4.0% Dec. ‘21 1.3% 13.5% 64.1% 14.3% 4.8% 2.0%
Redland Moreton Bay Logan Ipswich Gold Coast Brisbane
Research.
Source: Oliver Hume Research.
3.2 5.5% 35.7% 28.0% 18.9% 9.3% 2.5%
Median Prices
The South-East Queensland median land price edged higher in the December quarter 2022 reaching $339,000.
The Moreton Bay region was one of three markets to experience a decline in median land prices over the quarter. This was partly due to the addition of new stock.
A significant component of the increase in median land prices, observed over the quarter, was due to an increase in the share of premium stock.
29 QUARTERLY MARKET INSIGHTS DECEMBER QUARTER 2022 Source: Oliver Hume Research. Brisbane Gold Coast Ipswich Logan Moreton Bay Redland SEQ QIV.’21 QI.’22 QII.’22 QIII.’22 QIV.’22 $1,200,000 $1,000,000 $800,000 $600,000 $400,000 $200,000 $0 South East Queensland Median Lot Prices by Local Government Area Source: Oliver Hume Research. New Residential Land - Median Lot Prices, South East Queensland Municipalities LGA QIV. '21 QIII. '22 QIV. '22 QoQ YoY 5 yr Change Brisbane (C) $416,600 $730,000 $539,500 -26.1% 29.5% 42.6% Gold Coast (C) $677,600 $949,900 $614,000 -35.4% -9.4% 95.6% Ipswich (C) $248,950 $298,000 $300,000 0.7% 20.5% 46.5% Logan (C) $233,750 $279,000 $300,076 7.6% 28.4% 40.6% Moreton Bay (R) $414,075 $384,700 $360,000 -6.4% -13.1% 39.9% Redland (C) $443,500 $496,000 $640,000 29.0% 44.3% 109.9% SEQ $248,000 $310,000 $339,000 9.4% 36.7% 44.7%
Land Market
Median Lot Size
Lots sized from 301 sqm to 400 sqm remained the most popular product and accounted for 41% of all sales made in the December quarter 2022.
Demand for smaller blocks continues to increase, partly driven by affordability pressures, and is reflected by the continued decline in the median size of stock being transacted.
30 QUARTERLY MARKET INSIGHTS DECEMBER QUARTER 2022
3.2 100% 90% 80% 70% 60% 50% 40% 30% 20% 10% 0% Source: Oliver Hume Research. QIII. ‘19 QII. ‘19 QIV. ‘19 QI. ‘20 QII. ‘20 QIII. ‘20 QIV. ‘20 QI. ‘21 QII. ‘21 QIII. ‘21 QIV. ‘21 QI. ‘22 QII. ‘22 QIII. ‘22 QIV. ‘22 Long-run Average Less than 300 sqm 301-400 sqm 401-500 sqm 501-600 sqm 601-1,000 sqm South East Queensland Project Land Sales (0 - 1,000 sqm) Market Share by Product Type 7% 10% 10% 12% 10% 10% 9% 8% 9% 10% 24% 9% 16% 15% 12% 12% 11% 13% 15% 15% 14% 13% 9% 10% 17% 12% 11% 11% 13% 14% 11% 13% 34% 34% 36% 31% 35% 34% 33% 34% 44% 37% 29% 37% 31% 35% 28% 33% 43% 38% 34% 36% 34% 37% 41% 41% 54% 38% 38% 38% 32% 33% 41% 38% 5% 5% 6% 6% 7% 7% 8% 7% 10% 4% 1% 5% 8% 3% 7% 6% South East Queensland Median Lot Sizes by Local Government Area (sqm) Source: Oliver Hume Research. LGA QIV. '21 QIII. '22 QIV. '22 QoQ YoY 5 yr Change Brisbane (C) 415 426 401 -5.9% -3.4% -0.7% Gold Coast (C) 615 485 451 -7.0% -26.7% -9.0% Ipswich (C) 424 420 448 6.7% 5.7% 0.3% Logan (C) 401 445 433 -2.7% 8.0% 6.3% Moreton Bay (R) 660 413 384 -7.0% -41.8% -12.6% Redland (C) 601 540 410 -24.1% -31.8% -6.0% SEQ 583 437 407 -6.9% -30.2% -7.1%
Value Rates
The South-East Queensland median value rate rebounded in the December quarter of 2022, increasing by over 17%, being driven by both price increases and a decrease in the median size of lots being transacted.
The Redland Bay region experienced significant value rate increases due to the introduction of new estates offering premium lots.
South East Queensland Project Land Sales (December Quarter 2022) | Median Value Rate ($ per sqm)
Source: Oliver Hume Research.
South East Queensland Median Value Rates by Local Government Area ($/sqm)
Source: Oliver Hume Research.
31 QUARTERLY MARKET INSIGHTS DECEMBER QUARTER 2022
$0 $200 $400 $600 $800 $1,000 $1,200 $1,400 $1,600 $1,800 SOUTH EAST QUEENSLAND REDLAND MORETON BAY LOGAN IPSWICH GOLD COAST BRISBANE $833 $1,561 $938 $693 $670 $1,361 $1,345
LGA QIV. '21 QIII. '22 QIV. '22 QoQ $ Value Change (QoQ) YoY $ Value Change (YoY) 5 yr Change $ Value Change (5Yr Change) Brisbane (C) $1,004 $1,714 $1,345 -21.5% -$368 34.0% $342 43.6% $408 Gold Coast (C) $1,102 $1,959 $1,361 -30.5% -$597 23.6% $260 114.9% $728 Ipswich (C) $587 $710 $670 -5.6% -$40 14.1% $82 46.0% $211 Logan (C) $583 $627 $693 10.5% $66 18.9% $110 32.3% $169 Moreton Bay (R) $627 $931 $938 0.6% $7 49.4% $311 60.2% $352 Redland (C) $738 $919 $1,561 69.9% $642 111.5% $823 123.2% $862 SEQ $425 $709 $833 17.4% $124 95.8% $408 55.8% $298
Land Market
Time on Market
Lots across South-East Queensland remained on the market for an average of 30 days before being sold in the December quarter 2022.
Ipswich was the only market to record an increase in time on market during the quarter (reaching a median time of 121 days).
South East Queensland New Residential Land - Median Time on Market (Days)
South East Queensland New Residential Land - Median Time on Market (Days)
32 QUARTERLY MARKET INSIGHTS DECEMBER QUARTER 2022
3.2 100 90 80 70 60 50 40 30 20 10 0 BRISBANE GOLD COAST IPSWICH LOGAN MORETON BAY REDLAND SEQ
Source: Oliver Hume
140 120 100 80 60 40 20 0 QI. ‘17 QII. ‘17 QIII. ‘17 QIV. ‘17 QI. ‘18 QII. ‘18 QIII. ‘18 QIV. ‘18 QI. ‘19 QII.’19 QIII.’19 QIV. ‘19 QI. ‘20 QII. ‘20 QIII. ‘20 QIV. ‘20 QI. ‘21 QII. ‘21 QIII. ‘21 QIV. ‘21 QI. ‘22 QII. ‘22 QIII. ‘22 QIV. ‘22
Research.
Source: Oliver Hume Research. Median data.

South East
CABOOLTURE $304,900 n/a MORAYFIELD $346,750 $378,500 WALLOON $226,000 $227,500 RIPLEY $296,000 $333,900
Queensland December Quarter 2022 QUEENSLAND COLLINGWOOD PARK $230,000 $227,000 DEEBING HEIGHTS $283,000 n/a Commonly Sold Lots 12.5 x 30m 12.5 x 32m 14 x 30m Median Price Median Size Median Value Rate $339,000
per sqm
407sqm $833
GOLD COAST BRISBANE NEWPORT $780,900 $829,900 VICTORIA POINT n/a $625,000 NERANG $775,000 n/a CHAMBERS FLAT n/a $335,000 375 sqm Median Price 400 sqm Median Price Source: Oliver Hume Research. Sold. Median Lot Prices by Suburb (Gross) 375 sqm and 400 sqm Lots December Quarter 2022 QUEENSLAND
4.0 South Australia
Market Drivers
Economy
The South Australian economy remains resilient. Overseas migration is driving population growth.
Various industries and areas of activities are experiencing above average growth including construction and new plant and equipment investment.
The state’s unemployment rate remains around record lows.
George Bougias National Head of Research g.bougias@oliverhume.com.au
4.1
The South Australian economy remains resilient.
Land Market
Prices
Greater Adelaide median land prices increased by 0.2% in the December quarter to reach $230,000 (up 13% over the year).
Recent trends are consistent with broader property market trends which showed that Adelaide property prices have remained resilient in 2022.
Greater Adelaide Median Lot Price (3-month moving average, selected lot types)
40 QUARTERLY MARKET INSIGHTS DECEMBER QUARTER 2022
$270,000 $250,000 $230,000 $210,000 $190,000 $170,000 $150,000 Source: Oliver Hume Research. 375 sqm 420 sqm 480 sqm
4.2 Mar Qtr-22 June Qtr-22 Sep Qtr-22 Dec Qtr-22
Sales Volumes
The volume of sales in the Greater Adelaide market rose in the December quarter 2022.
The result was driven by a range of factors including rebounding population growth and growing housing shortages in the broader Adelaide property market.
Median Lot Size
The median size of lots transacted across the Greater Adelaide market continues to decline due to a combination of factors including affordability pressures (higher prices and interest rates) and the type/size of stock being made available.
Greater Adelaide Residential Land Median Lot Size (sqm) - Quarterly
41 QUARTERLY MARKET INSIGHTS DECEMBER QUARTER 2022
600 500 400 300 200 100 0
Source: Oliver Hume Research. Mar Qtr-21 Jun Qtr-21 Sep Qtr-21 Dec Qtr-21 Mar Qtr-22 Jun Qtr-22 Sep Qtr-22 Dec Qtr-22 Source: Oliver Hume Research. Greater Adelaide Residential Land Sales 500 450 400 350 300 250 200 150 100 50 0 Mar Qtr-21 Jun Qtr-21 Sep Qtr-21 Dec Qtr-21 Mar Qtr-22 Jun Qtr-22 Sep Qtr-22 Dec Qtr-22
SOUTH AUSTRALIA
Greater Adelaide*
December Quarter 2022
Commonly Sold Lots 12.5 x 30m 10 x 30m 18 x 30m
Median Price
$230,000 400sqm $556 per sqm
Median Size
Median Value Rate * Metropolitan Adelaide and selected regional municipalities.
315 sqm Median Price 375 sqm Median Price Source: Oliver Hume Research. Sold.
by Suburb (Gross) 315 sqm and 375 sqm Lots December Quarter 2022 SOUTH AUSTRALIA SEAFORD HEIGHTS $300,000 n/a BUCKLAND PARK n/a $226,000 ANGLE VALE $199,000 $239,000 TWO WELLS n/a $202,500 ANDREWS FARM $139,000 $194,000 EVANSTON GARDEN $179,000 $215,000 GAWLER BELT n/a $197,000 OAKDEN $387,000 $481,000 OLD REYNELLA $282,500 $345,000 ADELAIDE GAWLER EAST n/a $195,000
Median Lot Prices
Feature Articles
5.0
6,100,000 Is The Most Important Number For Melbourne Property Buyers
Modern property buyers have access to more data than ever before to help them make more informed purchasing decisions. In fact, the success of our business, Oliver Hume, is built on a range of competitive advantages including compiling and analysing proprietary property data to aid those decisions.
One thing we have learnt about data is that, while the volume of data is increasing, it is essential not to be overwhelmed and fall victim to analysis paralysis. In other words, don’t lose sight of the forest for the trees.
While the cash rate target, inflation, economic growth, unemployment rate and wage growth are all valuable pieces of information for understanding the market, some numbers are more important than others.
For Melbourne property buyers, developers, and investors, the most important number to remember is 6,100,000.
According to the latest forecasts, that is the number of people that will call Greater Melbourne home by 2032. With a current population of 5.02 million, an extra 1.08 million people will be born in or move to Melbourne over the next decade. In fact, Melbourne is now forecast to have a larger population than Sydney (6.06 million) by 2031-32, becoming Australia’s largest capital city.
Victoria’s total population is expected to be 7.88 million by June 30 2032 (the population of New South Wales will be 9.1 million).
The growing population is important for the property sector for one simple reason – people need homes. As the population grows, more people need a place to live. This means that, over the long term, population growth drives increased housing demand and an increasingly dynamic property market.
Population growth also affects the property market by stimulating the economy and prompting more demand in a virtuous cycle that has helped Australians become amongst the wealthiest people in the world.
What will drive Melbourne’s population?
Primarily, Greater Melbourne’s population growth is forecast to be driven by high levels of overseas migration. Net overseas migration to Greater Melbourne is forecast to reach around 73,100 in the current 2022-2023 financial year before increasing to 74,500 next year. Greater Melbourne is forecast to receive around 71,800 migrants a year in 2031-2032.
Net internal migration is forecast to be negative over the forecast horizon, partly due to affordability challenges. However, before COVID-19, Victoria experienced robust net interstate migration due, in part, to strong employment growth and growing employment opportunities.
Therefore, it is possible that we could see a return to this previous trend of positive net interstate migration, especially given the return to long-term average economic growth trends.
Compared to Melbourne, regional Victoria is forecast to see only limited population growth, from 1.6 million currently to 1.8 million by 2032. However, affordability challenges, working from home and other factors could see regional Victoria experience population growth greater than that forecast
46 QUARTERLY MARKET INSIGHTS DECEMBER QUARTER 2022
... Melbourne is now forecast to have a larger population than Sydney (6.06 million) by 2031-32, becoming Australia’s largest capital city.
FEATURE ARTICLE
Why
What does it mean for buyers?
The 2021 ABS Census showed the average number of people per household in Greater Melbourne was 2.6. That means that Melbourne, with an additional 1.08 million people, could need around an additional 415,000 dwellings over the next decade.
There are currently around 2.06 million dwellings in Melbourne, so we need to think about how to increase the number of dwellings by around 20% in a decade.
This number of new dwellings required does not factor in the shrinking of households. In 2021, the average number of people who lived in each household across Victoria was 2.5, a decrease from 3.3 people in 1971, reflecting a long-term demographic trend of declining household sizes.
These long-term demographic trends are especially important and can have major impacts.
While various factors, such as COVID-19, can shape household sizes from time to time, we can assume that number of people per household over the next decade is likely to be lower than it is today.
This should increase the demand for dwellings, for a given population, requiring many more dwellings than what might seem the case initially.
In addition to the number of dwellings required, changes in household size, together with other changes, could also shape the types of dwellings we will require.
In 2021 most occupied private dwellings were separate houses (73.4%) rather than semi-detached, row or terrace house, townhouse, flats and apartments.
However in recent decades, we have seen the continued growth in demand for more diverse dwelling options including, especially, townhouses.
This trend has been especially pronounced in Melbourne’s greenfields and outer suburbs where affordability constraints and growing numbers of both new migrants and first home buyers has seen demand for townhouses and other similar products increase strongly.
This suggests that, assuming we require around 415,000+ new dwellings in the next decade, we will also need a diverse range of dwellings, in various locations, including detached houses and townhouses in the growth areas of Melbourne.
Supply is a bit more complex to understand given the abnormalities created over the last three years by COVID, the HomeBuilder program, materials and labour shortages in the building industry, inflation and interest rate increases.
However enduring challenges (such as land supply constraints) and more recent challenges (such as the well-publicised issues in the building and construction industry and growing housing shortages despite an extended pause in Australia’s migration intake) suggests we are likely to continue to face major issues in delivering new dwelling supply.
Hence, at some point we can expect that, as overseas migration continues and population growth returns to trend, the continuing increase in demand could see prices start to stabilise and then to begin increasing.
The market in the not-too-distant future might be very different to what it is today.
So next time you find yourself trying to study and understand the diverse and numerous datasets being released on a daily basis, remember, the housing market is primarily about people and the need for dwellings.
Remember, also, that Melbourne is rapidly approaching a population of 6,100,000 people bringing both new opportunities and challenges.
47 QUARTERLY MARKET INSIGHTS DECEMBER QUARTER 2022
The Population Boom
Underpinning Queensland’s Decade of Opportunity
One of the criticisms of modern society is that we are often too focused, almost exclusively, on the short term at the expense of the long term.
This is especially the case when it comes to the lack of long-term thinking about the future and how we can best capitalise on opportunities while minimising risks and challenges.
At Oliver Hume, our 70 years of experience have taught us many valuable lessons.
One of the most important lessons is that focusing excessively on the immediate and the short-term, at the expense of the long-term and strategic thinking more broadly, is often a key ingredient for regret.
In our field of expertise – residential property and the greenfield land market in particular-- we encourage our stakeholders (including developers, property buyers, consultants and others) to look beyond the ‘right now’ and think about the opportunities ‘over the horizon.’
This simple shift in perspective often helps to distinguish between what is important and what is not. It also provides greater clarity on where (and how) we should be devoting time, energy and effort.
One of the locations we continue to focus on is Queensland – a state which we are increasingly optimistic about and consider will be an increasingly important market.
Queensland’s modern and diverse economy, strong population growth, attractive lifestyle and ongoing infrastructure investment (including for the 2032 Olympics) are but some of the many factors that should continue to drive the Sunshine State over the next decade and beyond.

Population growth forecasts highlight the extent of the opportunity.
Queensland’s population was estimated to be 5.2 million on 30 June 2021 and is projected to reach 6.2 million by 2032–33. That’s 1,000,000 new people who will need a range of goods and services, including a place to call home.
48 QUARTERLY MARKET INSIGHTS DECEMBER QUARTER 2022
FEATURE ARTICLE
One million new people is greater than the combined population of Hobart, Darwin and Canberra (over 850,000 people as of 30 June 2021). It is also equivalent to almost half of Perth’s population (2.2 million people) or a fifth of Melbourne’s population (almost 5 million) as of 30 June 2021.
With Queensland’s average household sizes continuing to decline, we can expect that demand for dwellings will outstrip that of population growth.
Queensland has been the main destination for interstate movers for several decades.
The 2021 Census highlighted that more people moved to Queensland from any other jurisdiction than anywhere else in Australia in the previous five years (a net gain of over 100,000 people). In the year ending 30 June 2022, Queensland recorded the highest level of net interstate migration (over 55,400 people).
Over the subsequent decade, interstate migration will continue to play a leading role in driving Queensland’s population growth.
Queensland’s net interstate migration is projected to return to pre-COVID-19 levels, reaching 21,000 in 2023–24, and remain high for the next decade. The state is expected to continue to have the highest interstate migration of any Australian jurisdiction.

Of course, with so many people planning to call Queensland home, a risk is a worsening housing shortage which further erodes affordability and eventually provides a disincentive for people to move to Queensland.
On this front, the Queensland Government is implementing various policies and strategies to ensure the state can manage the rapidly growing population.
If the State Government can ensure new land and dwelling supply is adequate to meet the growing population, there is no reason Queensland can’t live up to the expectations of the one million new residents who will call the Sunshine State home when the Olympic flame is ignited to start the Brisbane 2032 Summer Olympics.
49 QUARTERLY MARKET INSIGHTS DECEMBER QUARTER 2022
Over the subsequent decade, interstate migration will continue to play a leading role in driving Queensland’s population growth.


The information in this document has been prepared a general guide only and does not constitute advice. We have relied upon information from sources generally regarded as authoritative. Whilst the information has been prepared in good faith and with due care, no representation is made in relation to the accuracy of the whole or any part of the publication. No liability for negligence or otherwise is assumed for any loss or damage suffered by any party resulting from their use of this publication. The whole or any part of this publication must not be mirrored, reproduced or copied, without written consent. The document may contain future forecasts of a range of variables, which can be affected by a significant number of unpredictable factors, including social and economic conditions. It only represents the best judgements and estimates, made by Oliver Hume Research. No assurances can be given that the forecasts will be achieved. This document should be read in conjunction with any other documentation prepared by the marketing agent and associated consultants. www.oliverhume.com.au HEAD OFFICE Level 2 4 Riverside Quay Southbank, VIC 3006 P. 03 9669 5999 BRISBANE Shop 9, Gasworks Precinct 26 Reddacliff Street Newstead, QLD 4006 P. 07 3216 1666 SOUTH AUSTRALIA 89 Pirie Street Adelaide, SA 5000 P. 08 7201 3999 SYDNEY Level 24, Tower 3 300 Barangaroo Avenue Sydney, NSW 2000 P. 1300 881 780 GOLD COAST Suite 5B, Emerald Lakes Town Centre Commercial 3027 The Blvd, Emerald Lakes Carrara QLD 4211 P. 1300 645 433 DARWIN 129 Asche Street Muirhead, NT 0810 P. 1300 7373 598
Important: