Quarterly Market Insights
September Quarter
2022
TABLE OF CONTENTS
1.0 Foreword 04
1.1 National Highlights 08
VICTORIA
2.1 Market Drivers 12
2.2 Land Market 14
2.3 Development Sites 20
QUEENSLAND
3.1 Market Drivers 24
3.2 Land Market 26
SOUTH AUSTRALIA
4.1 Market Drivers 38
4.2 Land Market 40
1.0
Foreword
Higher interest rates, cost of living pressures, weaker consumer and buyer sentiment and well-publicised construction industry challenges continue to drive current property market conditions in the residential greenfield market.
Leading indicators, such as enquiries, suggest that the short-term outlook remains the same with demand expected to remain soft over the coming months.
However, 2023 is expected to be a year of consolidation and gradual recovery.
Underpinning this forecast is the expectation that a range of factors will continue to shape market sentiment and underlying fundamentals and dynamics.
These factors include low unemployment (although increasing), the acceleration of population growth (driven by the return of overseas migrants) and growing housing shortages.
The latest Quarterly Market Insights (QMI) report examines the key indicators we follow to anticipate market trends and assess the outlook. We analyse what the market has done in the past, what is happening now and where the market is headed.
Importantly, the QMI report presents our own proprietary market intelligence, collected and analysed by our in-house research team. Our proprietary market intelligence and research provides the latest trends to our clients, stakeholders and strategic partners and empowers them to anticipate the future and make strategic decisions.
It’s all part of our commitment to providing leading market insights, forecasts and in-depth analysis of the Australian residential property market.
Perth
4 QUARTERLY MARKET INSIGHTS SEPTEMBER QUARTER 2022
WESTERN

5 QUARTERLY MARKET INSIGHTS SEPTEMBER QUARTER 2022
VICTORIA
Adelaide Canberra Hobart Sydney
Melbourne
AUSTRALIA NORTHERN TERRITORY SOUTH AUSTRALIA NEW SOUTH WALES QUEENSLAND
TASMANIA Darwin
Brisbane Gold Coast
Julian Coppini Chief Executive Officer - Project Marketing j.coppini@oliverhume.com.au
1.0 National Highlights

8 QUARTERLY MARKET INSIGHTS SEPTEMBER QUARTER 2022 National Highlights 1.1 George
Research g.bougias@oliverhume.com.au Cash Rate Target 2.85% Economic Growth 3.6% Inflation 7.3% Unemployment Rate 3.5% Employment Growth 5.4% Wage Growth 2.6% Average Weekly Earning $1,344. Household Saving Ratio 8.7% Net foreign liabilities 37.5% 70 % of GDP Conversion Rate A$1 0.9% 6.4% $0.64 Population Annual Growth Owner Occupier Investor 25.9M Employment to Population Ratio 64.2% Average Price of Residential Dwellings $922K Household Wealth as a share of income as a share of income 907% Household debt 188% Australian housing prices 6% Housing credit growth 1.2% Loan repayment deferrals =US 0.3% of small & medium business loans of housing loans 0.5% Data in this snapshot are the latest available as at 2 November 2022. Sources: Reserve Bank of Australia (RBA), Australian Bureau of Statistics (ABS).
Bougias National Head of
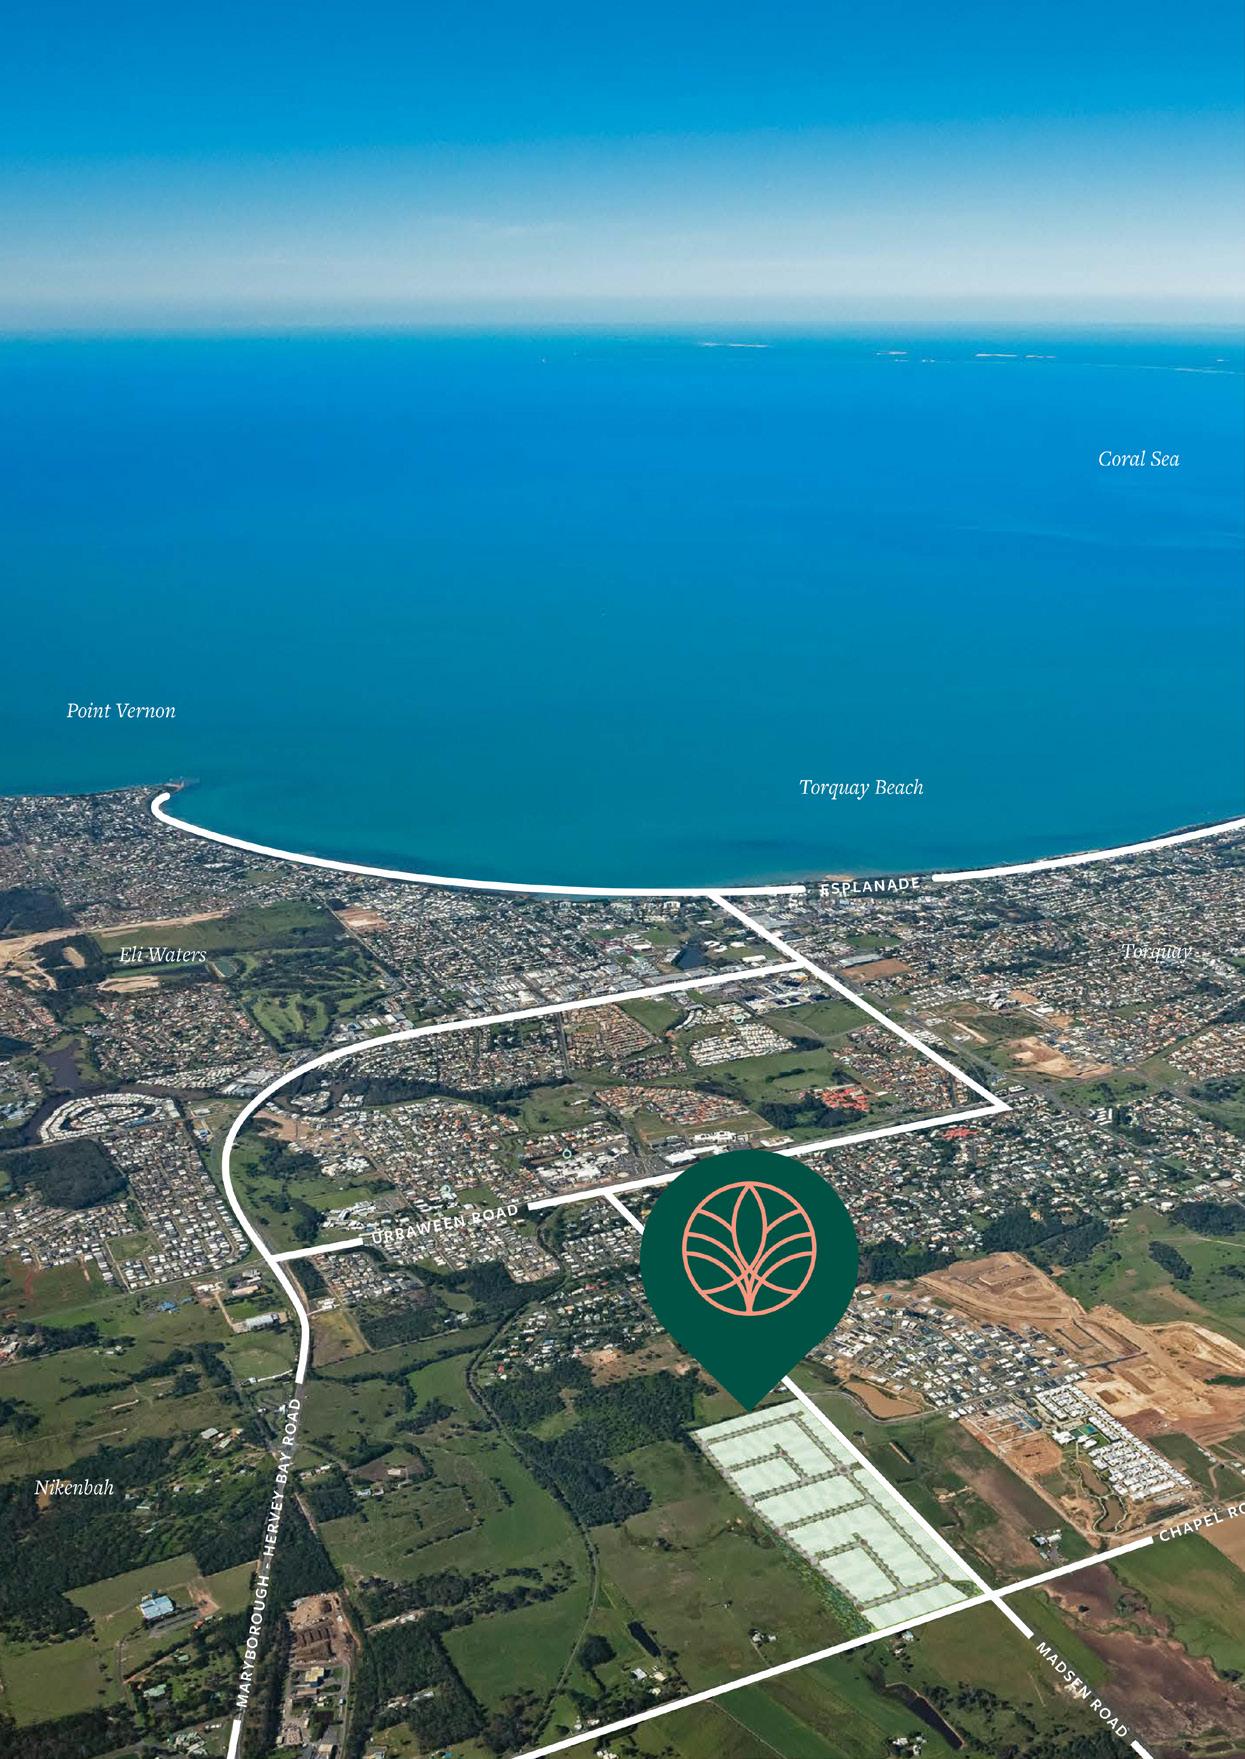 Bloom - New Oliver Hume project in Queensland.
2.0 Victoria
Market Drivers
Economy
The Victorian economy remains resilient with steady employment growth and low unemployment (the unemployment rate was 3.5% in September 2022, equal to the national average (3.5%)).
Unemployment is forecast to increase, consistent with national trends, but is expected to remain relatively low.
State Unemployment Rates* (%) - Seasonally adjusted
The trend series have been suspended from April 2020 until more certainty emerges in the underlying trend in labour market activity over the COVID-19 period. Source: RBA, ABS.
12 QUARTERLY MARKET INSIGHTS SEPTEMBER QUARTER 2022
% 8 7 6 5 4 3 2 VIC
2022 2018
2014 2018
NSW QLD SA TAS WA
2022
2.1
% 12 9 6 3
2007 2002 2022 1997 2017 2012
Labour Underutilisation Rates - Australia
* Full-time workers on reduced hours for economic reasons and part-time workers who would like, and are available, to work more hours Source: RBA, ABS. Underemployment Rate* Unemployment Rate
The Victorian economy remains resilient with steady employment growth and low unemployment.
Prices
New residential land prices increased in the September quarter 2022 reaching a record high.
The median (gross) price of metropolitan Melbourne conventional lots reached $383,450 in the September quarter 2022 (up from $379,000 in the June quarter 2022).
Prices rose in most metropolitan Melbourne growth markets and across the Greater Geelong market.
Overall, prices are forecast to stabilise. However, we could also see prices moderate in some sub-markets due to higher interest rates and cost of living pressures.
Housing shortages will be key drivers of prices beyond the short-term.
$500,000 $450,000 $400,000 $350,000 $300,000 $250,000 $200,000 $150,000 $100,000 $50,000 $0 QIII. ‘10 QIV. ‘10 QI. ‘11 QII. ‘11 QIII. ‘11 QIV. ‘11 QI. ‘12 QII. ‘12 QIII. ‘12 QIV. ‘12 QI. ‘13 QII. ‘13 QIII. ‘13 QIV. ‘13 QI. ‘14 QII. ‘14 QIII. ‘14 QIV. ‘14 QI. ‘15 QII. ‘15 QIII. ‘15 QIV. ‘15 QI. ‘16 QII. ‘16 QIII. ‘16 QIV. ‘16 QI. ‘17 QII. ‘17 QIII. ‘17 QIV. ‘17 QI. ‘18 QII. ‘18 QIII. ‘18 QIV. ‘18 QI. ‘19 QII.’19 QIII.’19 QIV. ‘19 QI. ‘20 QII. ‘20 QIII. ‘20 QIV. ‘20 QI. ‘21 QII. ‘21 QIII. ‘21 QIV. ‘21 QI. ‘22 QII. ‘22 QIII. ‘22
Source: Oliver Hume Research. Sold Lots. Annual moving average.
14 QUARTERLY MARKET INSIGHTS SEPTEMBER QUARTER 2022
Victorian Growth Area Median Land Prices
Cardinia Casey Whittlesea Hume Melton Wyndham Mitchell Geelong Metro Melbourne Median (all of VIC)
Land Market 2.2
$400,000 $350,000 $300,000
$250,000
$200,000
$150,000
QII. ‘10 QIII. ‘10 QIV. ‘10 QI. ‘11 QII. ‘11 QIII. ‘11 QIV. ‘11 QI. ‘12 QII. ‘12 QIII. ‘12 QIV. ‘12 QI. ‘13 QII. ‘13 QIII. ‘13 QIV. ‘13 QI. ‘14 QII. ‘14 QIII. ‘14 QIV. ‘14 QI. ‘15 QII. ‘15 QIII. ‘15 QIV. ‘15 QI. ‘16 QII. ‘16 QIII. ‘16 QIV. ‘16 QI. ‘17 QII. ‘17 QIII. ‘17 QIV. ‘17 QI. ‘18 QII. ‘18 QIII. ‘18 QIV. ‘18 QI. ‘19 QII.’19 QIII.’19 QIV. ‘19 QI. ‘20 QII. ‘20 QIII. ‘20 QIV. ‘20 QI. ‘21 QII. ‘21 QIII. ‘21 QIV. ‘21 QI. ‘22 QII. ‘22 QIII. ‘22
Source: Oliver Hume Research. Sold Lots.
Victorian Median Lot Prices
Municipality
Cardinia
Casey
QIII, ‘21 QII, ‘22 QIII, ‘22 % Change (QoQ) % Change (YoY) $ Change (QoQ) $ Change (YoY)
$365,000 $434,000 $380,000 -12.4% 4.1% ($54,000) ($54,000)
$404,000 $464,000 $475,000 2.4% 17.6% $11,000 $11,000
Geelong $313,750 $382,000 $379,000 -0.8% 20.8% ($3,000) ($3,000)
Hume
Melton
Mitchell
Whittlesea
Wyndham
$326,000 $372,000 $380,000 2.2% 16.6% $8,000 $8,000
$336,000 $389,000 $385,000 -1.0% 14.6% ($4,000) ($4,000)
$280,000 $335,000 $345,000 3.0% 23.2% $10,000 $10,000
$334,000 $360,000 $387,900 7.7% 16.1% $27,900 $27,900
$314,900 $367,500 $368,000 0.1% 16.9% $500 $500
Metro Melbourne (All Growth Areas) - Conventional $334,900 $379,000 $383,450 1.2% 14.5% $4,450 $4,450
Metro Melbourne (All Growth Areas) - All Lots $335,000 $384,850 $382,000 -0.7% 14.0% ($2,850) ($2,850)
Median (All of Victoria) $325,000 $378,000 $375,000 -0.8% 15.4% ($3,000) ($3,000)
15 QUARTERLY MARKET INSIGHTS SEPTEMBER QUARTER 2022
Source: Oliver Hume Research. Sold Lots.
Metropolitan Melbourne Growth Area Municipalities Median Land Price
Land Market
Sales Volumes
The volume of lots sold continued to moderate in the September quarter due to rising interest rates, cost of living pressures and weaker consumer and buyer sentiment.
Lower sale volumes also reflect, in part, the return to long-term sale trends following a record 2021.
We expect that the first half of 2023 will show a similar pattern with sale volumes remaining below trend.
Sale volumes are expected to recover gradually as population growth rebounds and housing shortages increase. 3,000 2,500 2,000 1,500 1,000
16 QUARTERLY MARKET INSIGHTS SEPTEMBER QUARTER 2022
Sep-04 Sep-05 Sep-06 Sep-07 Sep-08 Sep-09 Sep-10 Sep-11 Sep-12 Sep-13 Sep-14 Sep-15 Sep-16 Sep-17 Sep-18 Sep-19 Sep-20 Sep-21 Sep-22
500 0
Source: Oliver Hume Research.
Monthly Land Sales - Metropolitan Melbourne
2.2
Monthly Land Sales - City of Greater Geelong
Monthly Sales (No.)
Sep-10 Sep-11 Sep-12 Sep-13 Sep-14 Sep-15 Sep-16 Sep-17 Sep-18 Sep-19 Sep-20 Sep-21 Sep-22
Time on Market
New Residential Land - Average Time on Market (Days) - Metropolitan Melbourne Growth Area Municipalities
Source: Oliver Hume Research.
17 QUARTERLY MARKET INSIGHTS SEPTEMBER QUARTER 2022 QI. ‘12 QIII. ‘12 QI. ‘13 QIII. ‘13 QI. ‘14 QIII. ‘14 QI. ‘15 QIII. ‘15 QI. ‘16 QIII. ‘16 QI. ‘17 QIII. ‘17 QI.
QIII.
QI.
QIII.’19 QI.
QIII.
QI.
QIII.
QI.
‘18
‘18
‘19
‘20
‘20
‘21
‘21
‘22 QIII. ‘22
Lots across metropolitan Melbourne remained on market an average of 72 days during the September quarter 2022. Market activity has continued to slow due to higher interest rates, lower consumer and buyer confidence and cost of living pressures. 500 450 400 350 300 250 200 150 100 50 0
200 180 160 140 120 100 80 60 40 20 0
Source: Oliver Hume Research.
GEELONG WERRIBEE $380,000 $408,000 TARNEIT $424,900 $452,500 FRASER RISE $439,900 $466,900 LARA $379,900 $392,800 MAMBOURIN $393,000 $418,750 ARMSTRONG CREEK $415,000 $450,000 CHARLEMONT $434,000 n/a MELTON SOUTH n/a $351,000 PLUMPTON $423,000 n/a TRUGANINA $400,000 $495,000 WYNDHAM VALE $376,000 $406,000 Metropolitan Melbourne September Quarter 2022 VICTORIA Source: Oliver Hume Research. All lots. Commonly Sold Lots 12.5 x 28m 12.5 x 32m 14 x 32m Median Price Median Size Median Value Rate $382,000* 364sqm $1,053 per sqm
MELBOURNE WOLLERT $440,000 $480,450 MICKLEHAM $433,250 $467,000 BEVERIDGE n/a $385,500 CLYDE $464,000 $489,000 BERWICK $557,000 $640,000 OFFICER $490,500 $517,000 GREENVALE n/a $560,000 WALLAN $352,500 $373,000 CRAIGIEBURN n/a $504,000 KALKALLO $385,000 $410,000 400 sqm Median Price 448 sqm Median Price Source: Oliver Hume Research. Sold. Median Lot Prices by Suburb (Gross) 400 sqm and 488 sqm Lots September Quarter 2022 VICTORIA
Development Sites
Transactions are continuing in the development sites market, despite significantly higher interest rates and deteriorating conditions in the residential land market more broadly.
After some movement earlier in the year, development site values have remained relatively stable, more recently with limited offerings matching the lower demand for sites overall.
Marketing campaigns are taking longer, reflecting less urgency in the market and buyers seeking more time to undertake their research and due diligence.
Funding is becoming increasingly difficult. Lenders are taking longer to assess deals and with greater scrutiny.

Banks are increasingly assessing deals considering their broader market exposure (by asset, by geography and other variables).
Non-banks continue to gain market share because of various factors, not least of which being the time taken to make a decision.
Increasingly, some buyers are exiting their share of a development site purchase, if part of a syndicate, given the myriad issues in obtaining finance.
Higher inflation and cost increases continue to negatively impact developer cost escalations.
Planning, engineering and other delays in progressing sites through the development process are increasingly a factor.
Accordingly, buyer attention is being focused upon longer-term development opportunities reflecting, in part, the limited supply of suitable development sites.
Many of these longer-term development opportunities are in regional areas, especially, in and around large regional centres.
 Peter Vassallo
Managing Director | Development Sites p.vassallo@oliverhume.com.au
Peter Vassallo
Managing Director | Development Sites p.vassallo@oliverhume.com.au
2.3
Transactions are continuing in the development sites market despite significantly higher interest rates and changed conditions in the residential land market more broadly.
3.0 Queensland
Market Drivers
Ozturk Queensland Research Analyst s.ozturk@oliverhume.com.au

Economy
The Queensland economy remains resilient with robust population growth supporting economic growth. Unemployment remains low and employment growth remains steady.
Although dwelling prices have declined from recent peaks Queensland faces significant housing shortages, like many other markets, with vacancy rates continuing to decline and rents continuing to increase.
Queensland had the highest population growth in the year ending 31 March 2022 (92,100 or 1.8%).
Queensland’s population growth was driven by net interstate migration (over 53,980 people) and net overseas migration (over 11,980).
Queensland Unemployment Rate
Mar-11 Jun-11 Sep-11 Dec-11 Mar-12 Jun-12 Sep-12 Dec-12 Mar-13 Jun-13 Sep-13 Dec-13 Mar-14 Jun-14 Sep-14 Dec-14 Mar-15 Jun-15 Sep-15 Dec-15 Mar-16 Jun-16 Sep-16 Dec-16 Mar-17 Jun-17 Sep-17 Dec-17 Mar-18 Jun-18 Sep-18 Dec-18 Mar-19 Jun-19 Sep-19 Dec-19 Mar-20 Jun-20 Sep-20 Dec-20 Mar-21 Jun-21 Sep-21 Dec-21 Mar-22 Jun-22
24 QUARTERLY MARKET INSIGHTS SEPTEMBER QUARTER 2022
Sebastian
3.1
Source: ABS.
9% 8% 7% 6% 5% 4% 3%
Unemployment Rate Long Run Average
Queensland Employment Growth
Yearly person change, ‘000, seasonally adjusted
350 300 250 200 150 100 50 0 -50 -100 -150 -200
Jun-16 Sep-16 Dec-16 Mar-17 Jun-17 Sep-17 Dec-17 Mar-18 Jun-18 Sep-18 Dec-18 Mar-19 Jun-19 Sep-19 Dec-19 Mar-20 Jun-20 Sep-20 Dec-20 Mar-21 Jun-21 Sep-21 Dec-21 Mar-22
Source: ABS, Queensland Treasury. Change in the number of persons employed on either a full-time (at least 35 hours per week) or part-time (at least one hour per week) basis, in Queensland, during a monthly period. Part-time Full-time Total
Net Interstate Migration (Quarterly) 12,000 10,000 8,000 6,000 4,000 2,000 0 -2,000 -4,000 -6,000 -8,000 Mar-08 Sep-08 Mar-09 Sep-09 Mar-10 Sep-10 Mar-11 Sep-11 Mar-12 Sep-12 Mar-13 Sep-13 Mar-14 Sep-14 Mar-15 Sep-15 Mar-16 Sep-16 Mar-17 Sep-17 Mar-18 Sep-18 Mar-19 Sep-19 Mar-20 Sep-20 Mar-21
Source: ABS. NSW VIC QLD
25 QUARTERLY MARKET INSIGHTS SEPTEMBER QUARTER 2022
Land Market
Land Market
South-East Queensland land market sale volumes declined in the September quarter 2022 driven by higher interest rates and cost of living pressures.
While lot availability remains an issue, supply levels have improved in recent months. For the first time in two years, three of the six South East Queensland growth corridors recorded over 150 available lots.
Sale volumes are expected to remain below the long-run average over the short-term. However, growing housing shortages and robust population growth should see sale volumes gradually increase.
26 QUARTERLY MARKET INSIGHTS SEPTEMBER QUARTER 2022
Sold Lots.
500
Quarterly Sales Long Run Average Moving Quarterly Average Sep-12 Dec-12 Sep-13
Source: Oliver Hume Research.
2,500 2,000 1,500 1,000
0 South East Queensland
Project Land Sales
Total
Dec-13 Mar-14 Jun-14 Sep-14 Dec-14 Mar-15 Jun-15 Sep-15 Dec-15 Mar-16 Jun-16 Sep-16 Dec-16 Mar-17 Jun-17 Sep-17 Dec-17 Mar-18 Jun-18 Sep-18 Dec-18 Mar-19 Jun-19 Sep-19 Dec-19 Mar-20 Jun-20 Sep-20 Dec-20 Mar-21 Jun-21 Sep-21 Dec-21 Mar-22 Jun-22 Sep-22 1,441
3.2
27 QUARTERLY MARKET INSIGHTS SEPTEMBER QUARTER 2022
300 250 200 150 100 50 0 Brisbane Gold Coast Ipswich Logan Moreton Bay Available Stock - South East Queensland
Sep-21 Sep-22 Redland
Source: Oliver Hume Research.
Growth Corridors
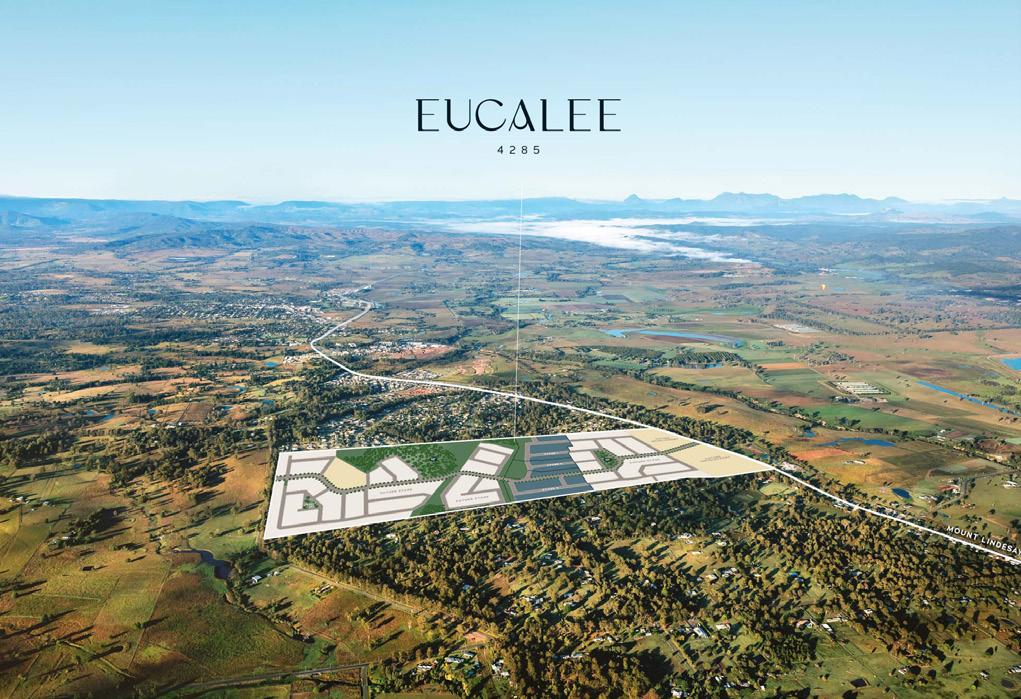
Eucalee - New Oliver Hume project in Queensland.
Market
28 QUARTERLY MARKET INSIGHTS SEPTEMBER QUARTER 2022
share
Corridor Sales Market Share Source:
Quarter Brisbane Sales Gold Coast Sales Ipswich Sales Logan Sales Moreton Bay Sales Redland Sales Sep. '22 4.0% 3.1% 34.3% 39.3% 15.3% 4.0% Jun. ‘22 4.1% 2.5% 38.6% 31.8% 19.3% 3.7% Sep. ‘21 12.7% 10.5% 26.0% 31.2% 15.5% 4.0% Source: Oliver Hume Research. Redland Moreton Bay Logan Ipswich Gold Coast Brisbane 4.0% 15.3% 39.3% $34.3% 3.1% 4.0%
Share For the first time in over two years, the Logan local government area recorded the highest market
over the quarter (accounting for over 39% of all sales in the September quarter 2022). Affordability and stock availability were key drivers. Growth
Oliver Hume Research.
Land Market 3.2
South East Queensland Project Land Sales Market Share
Median Prices
The South-East Queensland median price declined by 3.7% over the September quarter 2022.
Although higher interest rates were a key driver of lower prices, a higher share of sales in more affordable locations (especially across the Logan local government area) drove the result.
It is noted that median prices can differ from quarter to quarter, especially across South-East Queensland, due to the nature of stock sold (for example changes in the size of lots and if luxury projects are included).
Pricing momentum is expected to remain soft in the short-term due to higher interest rates, affordability constraints and cost of living pressures.
However, Queensland’s housing shortages and rapidly growing population are expected to provide support for prices over the medium-long term.
29 QUARTERLY MARKET INSIGHTS SEPTEMBER QUARTER 2022
QIV.’21 QI.’22
Source:
Oliver
Hume
Research.
Brisbane Gold Coast Ipswich Logan Moreton Bay Redland SEQ QIII.’21
QII.’22 QIII.’22 $1,200,000 $1,000,000 $800,000 $600,000 $400,000 $200,000 $0
South East Queensland Median Lot Prices by Local Government Area
30 QUARTERLY MARKET INSIGHTS SEPTEMBER QUARTER 2022
100% 90% 80% 70% 60% 50% 40% 30% 20% 10% 0% Source: Oliver Hume Research. QIII. ‘19 QII. ‘19 QIV. ‘19 QI. ‘20 QII. ‘20 QIII. ‘20 QIV. ‘20 QI. ‘21 QII. ‘21 QIII. ‘21 QIV. ‘21 QI. ‘22 QII. ‘21 Long-run Average Less than 300 sqm 301-400 sqm 401-500 sqm 501-600 sqm 601-1,000 sqm South East Queensland Project Land Sales (0 - 1,000 sqm) Market Share by Product Type 7% 10% 10% 12% 10% 10% 9% 8% 9% 10% 24% 9% 16% 15% 12% 11% 13% 15% 15% 14% 13% 9% 10% 17% 12% 11% 11% 13% 14% 13% 34% 34% 36% 31% 35% 34% 33% 34% 44% 37% 29% 37% 31% 35% 33% 43% 38% 34% 36% 34% 37% 41% 41% 54% 38% 38% 38% 32% 33% 37% 5% 5% 6% 6% 7% 7% 8% 7% 10% 4% 1% 5% 8% 3% 6% Land Market 3.2
Median Lot Size Across South-East Queensland lots sized 301-400 sqm remained the most common sold lot. Over the quarter 35% of sales occurred in this size range.
Time on Market
Lots across South-East Queensland remained on market an average of 61 days during the September quarter, increasing from the previous quarter, although consistent with recent trends. We expect the time taken to sell lots will increase, on average, over the short-term as market momentum and activity slows.
31 QUARTERLY MARKET INSIGHTS SEPTEMBER QUARTER 2022
100 90 80 70 60 50 40 30 20 10 0 BRISBANE GOLD COAST IPSWICH LOGAN MORETON BAY REDLAND SEQ South East Queensland New Residential Land - Median Time on Market (Days) Source: Oliver Hume Research. 140 120 100 80 60 40 20 0 QI. ‘17 QII. ‘17 QIII. ‘17 QIV. ‘17 QI. ‘18 QII. ‘18 QIII. ‘18 QIV. ‘18 QI. ‘19 QII.’19 QIII.’19 QIV. ‘19 QI. ‘20 QII. ‘20 QIII. ‘20 QIV. ‘20 QI. ‘21 QII. ‘21 QIII. ‘21 QIV. ‘21 QI. ‘22 QII. ‘22 QIII ‘22 South East Queensland New Residential Land - Median Time on Market (Days) Source: Oliver Hume Research. Median data.
CABOOLTURE $329,900 $349,000 MORAYFIELD $310,000 $330,000 WALOON n/a $228,000 RIPLEY $293,900 $300,000 South East Queensland September Quarter 2022 QUEENSLAND COLLINGWOOD PARK $275,000 $285,000 DEEBING HEIGHTS $283,000 $270,900 REDBANK PLAINS n/a $295,500 Commonly Sold Lots 12.5 x 30m 14 x 30m 12.5 x 32m Median Price Median Size Median Value Rate $310,000 437sqm $709 per sqm
GOLD COAST BRISBANE NEWPORT n/a $829,900 VICTORIA POINT n/a $625,000 NEERANG $950,000 n/a CHAMBERS FLAT n/a $330,000 375 sqm Median Price 400 sqm Median Price Source: Oliver Hume Research. Sold. Median Lot Prices by Suburb (Gross) 375 sqm and 400 sqm Lots September Quarter 2022 QUEENSLAND
4.0 South Australia
Market Drivers
Economy
The South Australian economy remains resilient.
The state’s unemployment rate remains around record lows reaching 4.3% in the September quarter 2022.
In seasonally adjusted terms, South Australian full-time employment increased by 2,200 (0.4%) in September to be 1.4% higher through the year.
South Australia’s economy increased by 15,400 people (0.9%) in the year ending 31 March 2022.
Population growth was driven by net overseas migration (over 8,160 people). Net interstate migration remained positive (673 people).
 George Bougias
National Head of Research g.bougias@oliverhume.com.au
George Bougias
National Head of Research g.bougias@oliverhume.com.au
4.1
The South Australian economy remains resilient. The state’s unemployment rate remains around record lows...
Land Market
Prices
Greater Adelaide land prices increased by over 8% in the September quarter to reach $230,000 (up 24% over the year).
Recent price growth was consistent with broader property market trends which showed that Adelaide property prices remained resilient in recent months.
Prices for many popular lot sizes continued to increase in the September quarter.
Adelaide’s property market has been a stand-out performer in the current cycle. Affordability has been a key driver with both local and interstate purchasers increasingly attracted to opportunities in Adelaide due, in part, to the city’s relative affordability vis-à-vis the eastern seaboard.
Greater Adelaide Median Lot Price (3-month moving average, selected lot types)
$300,000 $250,000 $200,000 $150,000 $100,000 $50,000 $0
Mar Qtr-21 Jun Qtr-21 Sep Qtr-21 Dec Qtr-21 Mar Qtr-22 Jun Qtr-22 Sep Qtr-22
Source: Oliver Hume Research. 300 sqm 480 sqm
38 QUARTERLY MARKET INSIGHTS SEPTEMBER QUARTER 2022
4.2
Sales Volumes
The volume of sales remains remained resilient in the September quarter 2022 but is expected to slow as the impact of higher interest rates and cost of living pressures takes effect.
Hume Research.
Median Lot Size
The median size of lots transacted across the Greater Adelaide market edged lower due to a combination of factors including, especially, affordability pressures (higher prices and interest rates).
Source: Oliver Hume Research.
39 QUARTERLY MARKET INSIGHTS SEPTEMBER QUARTER 2022
600 500 400 300 200 100 0 500 450 400 350 300 250 200 150 100 50 0 Mar Qtr-21 Jun Qtr-21 Sep Qtr-21 Dec Qtr-21 Mar
Jun
Source: Oliver
Greater Adelaide Residential Land Median Lot Size (sqm) - Quarterly Greater Adelaide Residential Land Sales
Qtr-22
Qtr-22 Sep Qtr-22
Mar Qtr-21 Jun Qtr-21 Sep Qtr-21 Dec Qtr-21 Mar Qtr-22 Jun
Sep
Qtr-22
Qtr-22
Greater Adelaide* September Quarter 2022 SOUTH AUSTRALIA Commonly Sold Lots 12.5 x 30m 10 x 30m 14 x 30m Median Price Median Size Median Value Rate $230,000 475sqm $512 per sqm * Metropolitan Adelaide and selected regional municipalities.
300 sqm Median Price 375 sqm Median Price Source: Oliver Hume Research. Sold. Median Lot Prices by Suburb (Gross) 300 sqm and 375 sqm Lots September Quarter 2022 SOUTH AUSTRALIA SEAFORD HEIGHTS $285,000 $320,000 BUCKLAND PARK n/a $222,700 ANGLE VALE $189,000 $226,500 ANDREWS FARM $165,000 $199,000 GAWLER EAST n/a $176,000 VIRGINIA n/a $259,000 MUNNO PARA DOWNS $152,000 n/a OAKDEN $385,000 $497,000 PORT NOARLUNGA SOUTH $264,500 n/a MOUNT BARKER $189,000 n/a ROSEWORTHY n/a $230,000 MUNNO PARA $174,950 n/a OLD REYNELLA $275,000 $345,000 ADELAIDE


Important: The information in this document has been prepared a general guide only and does not constitute advice. We have relied upon information from sources generally regarded as authoritative. Whilst the information has been prepared in good faith and with due care, no representation is made in relation to the accuracy of the whole or any part of the publication. No liability for negligence or otherwise is assumed for any loss or damage suffered by any party resulting from their use of this publication. The whole or any part of this publication must not be mirrored, reproduced or copied, without written consent. The document may contain future forecasts of a range of variables, which can be affected by a significant number of unpredictable factors, including social and economic conditions. It only represents the best judgements and estimates, made by Oliver Hume Research. No assurances can be given that the forecasts will be achieved. This document should be read in conjunction with any other documentation prepared by the marketing agent and associated consultants. www.oliverhume.com.au HEAD OFFICE Level 2 4 Riverside Quay Southbank, VIC 3006 P. 03 9669 5999 BRISBANE Shop 9, Gasworks Precinct 26 Reddacliff Street Newstead, QLD 4006 P. 07 3216 1666 SOUTH AUSTRALIA 89 Pirie Street Adelaide, SA 5000 P. 08 7201 3999 SYDNEY Level 24, Tower 3 300 Barangaroo Avenue Sydney, NSW 2000 P. 1300 881 780 GOLD COAST Suite 5B, Emerald Lakes Town Centre Commercial 3027 The Blvd, Emerald Lakes Carrara QLD 4211 P. 1300 645 433 DARWIN 129 Asche Street Muirhead, NT 0810 P. 1300 7373 598