JUNE QUARTER 2022
MarketQuarterlyInsights
TABLE OF CONTENTS 1.0 Foreword 04 1.1 National Highlights 08 VICTORIA 2.1 Market Drivers 12 2.2 Land Market 14 2.3 Development Sites 20 QUEENSLAND 3.1 Market Drivers 24 3.2 Land Market 26 SOUTH AUSTRALIA 4.1 Market Drivers 38 4.2 Land Market 40
The next few months should see a continuation of recent trends with the Reserve Bank of Australia (RBA) expected to increase interest rates further as the central bank tries to slow inflation. While significant attention will be given to the impact of interest rates it is important to also keep in mind the broader range of factors which will continue to drive market activity in 2022 and beyond.
The latest Quarterly Market Insights (QMI) report examines the key indicators we follow to anticipate market trends and assess the outlook. We analyse what the market has done in the past, what is happening now and where the market is headed.
Higher1.0 interest rates continue to drive the immediate and short-term outlook for Australia’s greenfield Tomarkets.date,higher interest rates have mostly affected enquiries and sales volumes with residential land prices still generally edging higher in the June quarter.
These factors include near record lows in unemployment, broader residential property market trends (including especially the retreat from recent highs), the return of overseas and interstate migrants (and the resumption of steady population growth), inflation, construction cost / supply chain challenges and growing housing Moreshortages.specific and locational factors will shape the outlook across each market. While we might see a return to pre COVID-19 trends, in some cases, we are now of the view that we could see a range of new patterns emerge (for example in regional markets).
4 QUARTERLY MARKET INSIGHTS JUNE QUARTER 2022 Perth
The pace of change in recent years highlights that understanding current and emerging trends is critical to achieving success in the greenfields market.
Foreword
Importantly, the QMI report presents our own proprietary market intelligence, collected and analysed by our in-house research team. Our proprietary market intelligence and research provides the latest trends to our clients, stakeholders and strategic partners and empowers them to anticipate the future and make strategic decisions. It’s all part of our commitment to providing leading market insights, forecasts and in-depth analysis of the Australian residential property market.
5QUARTERLY MARKET INSIGHTS JUNE QUARTER 2022 AUSTRALIAWESTERN NORTHERNTERRITORYSOUTHAUSTRALIA NEW VICTORIAQUEENSLANDWALESSOUTHTASMANIA Darwin Adelaide HobartCanberra BrisbaneSydneyGoldCoast Melbourne Julian Coppini Chief Executive Officer - Project Marketing j.coppini@oliverhume.com.au

HighlightsNational1.0
8 QUARTERLY MARKET INSIGHTS JUNE QUARTER 2022 National Highlights 1.1 Data in this snapshot are the latest available as at 3 August 2022. Sources: Reserve Bank of Australia (RBA), Australian Bureau of Statistics (ABS). Cash Rate Target 1.85% Unemployment Rate Average Weekly Earnings Conversion Rate Residential Dwellings Loan Repayment Deferrals0.5%$942KA$1$1,3283.5%0.3% RisksCommercialHouseholdEmploymentNetWageInflationGrowthForeignLiabilitiesRatioDebtPropertyElevated 6.0%187%64.4%37.8%2.4%6.1%As a share of Income of Housing Loans of small and medium Business Loans As a share of Income But low share of banks’ assets of GDP =US$0.69 Economic Growth 3.3% Employment Growth Household Saving Ratio HouseholdPopulation Wealth Housing Credit Growth1.2%957%25.8M11.4%3.3%6.4%InvestorOwnerOccupier George Bougias National Head of g.bougias@oliverhume.com.auResearch

Victoria2.0
2.1 Economy
2345678% VIC NSW QLD SA TAS WA 20222018 20222014 2018 State Unemployment Rates* (%) - Seasonally
Market Drivers
Several of the State’s key economic indicators rank relatively highly compared to other jurisdictions. These include unemployment, retail trade, construction work done, housing finance and dwelling starts.
The Victorian economy remains one of the better performing economies in Australia. The labour market remains robust with the unemployment rate declining further in June 2022 (3.2%) and continuing to remain below the national average (3.5%).
12 QUARTERLY MARKET INSIGHTS JUNE QUARTER 2022
Participation rates also remain high (67.1%) suggesting workers are optimistic about finding work.
* The trend series have been suspended from April 2020 until more certainty emerges in the underlying trend in labour market activity over the COVID-19 period. Source: RBA, ABS. adjusted
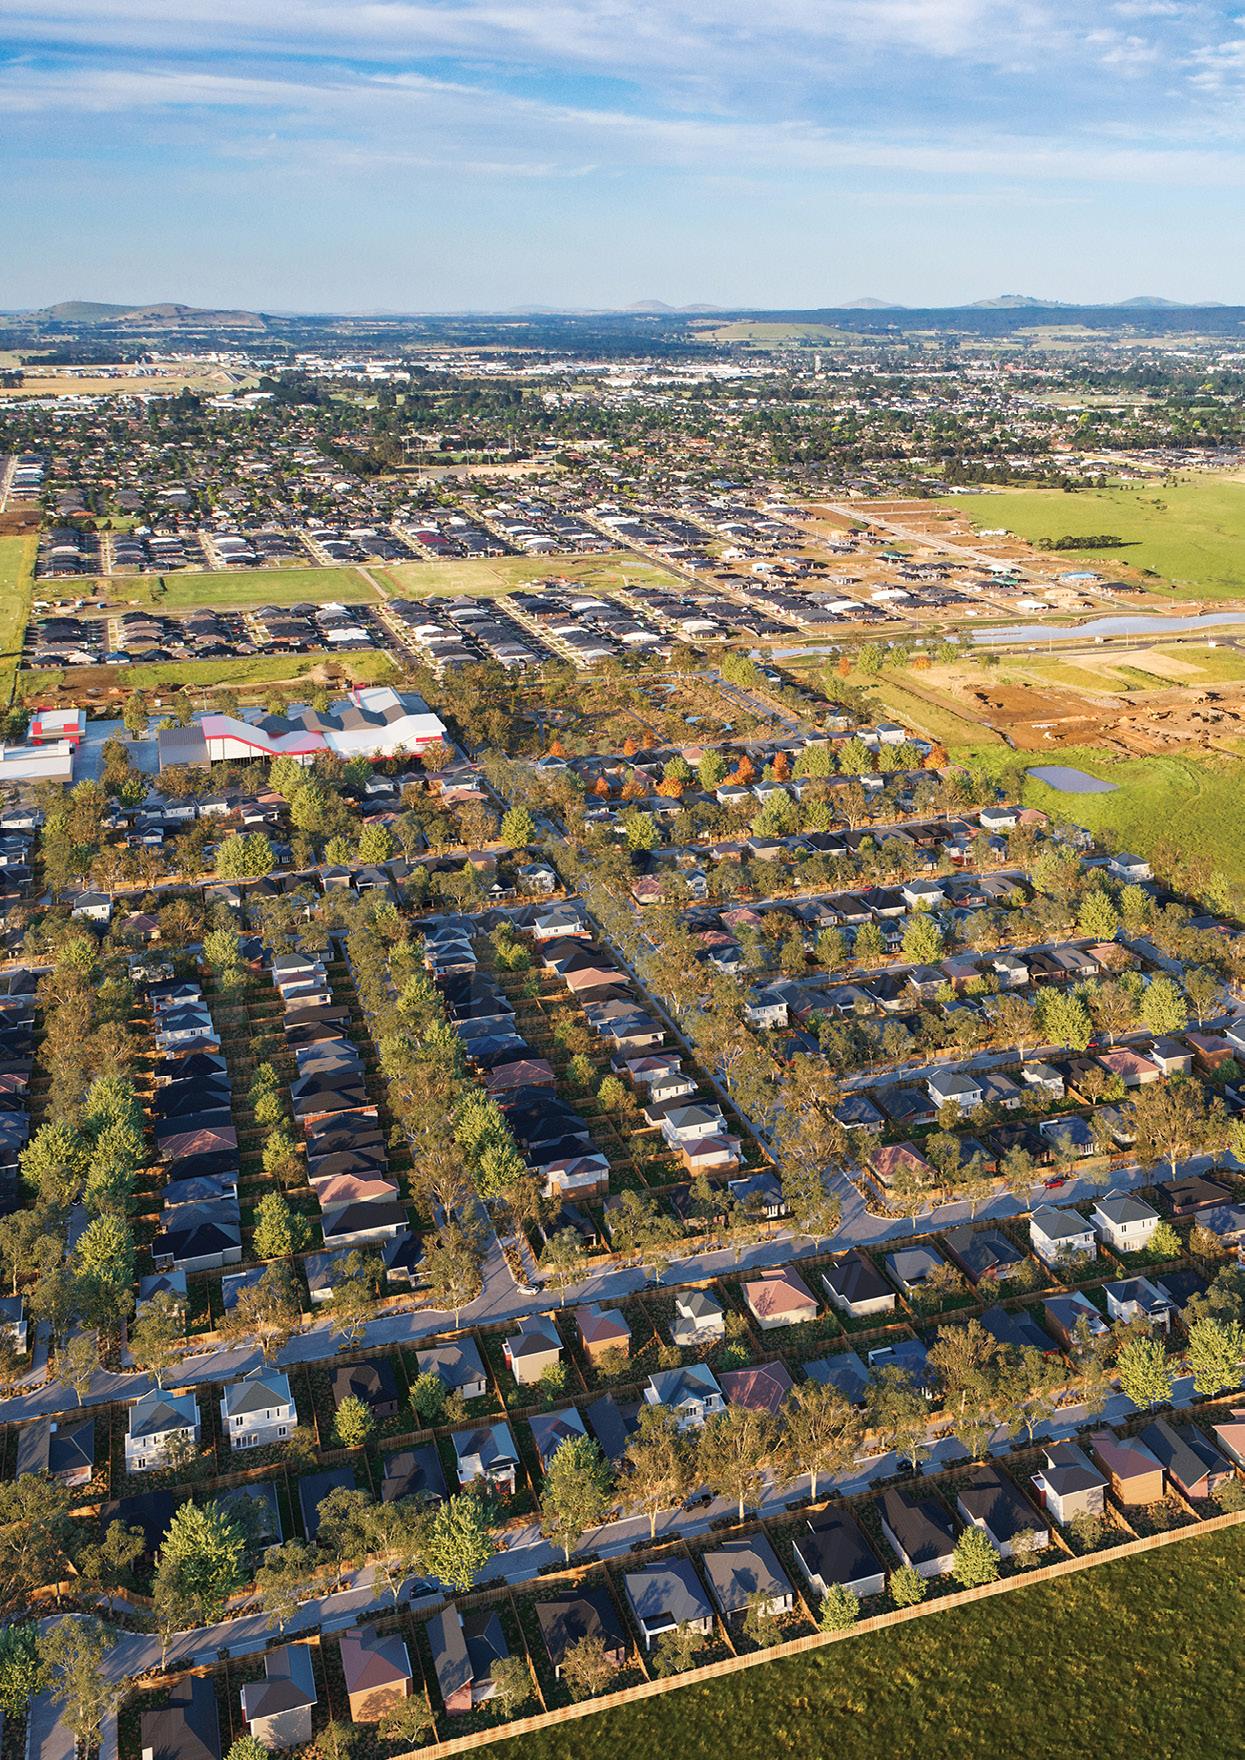
13QUARTERLY MARKET INSIGHTS JUNE QUARTER 2022 Labour Underutilisation Rates - Australia * Full-time workers on reduced hours for economic reasons and part-time workers who would like, and are available, to work more hours Source: RBA, ABS. 36912% Underemployment Rate Unemployment Rate 20072002 20221997 2017Carrington2012 - New Oliver Hume project. Artist impression.
New residential land prices increased in the June quarter 2022 reaching another record high. The median (gross) price of metropolitan Melbourne conventional lots reached $379,000 (3.6% higher over the quarter and 17.0% higher over the year). Prices rose in most metropolitan Melbourne growth markets and in the Greater Geelong market.
$500,000$450,000$400,000$350,000$300,000$250,000$200,000$150,000$100,000$50,000$0 ‘10QI. ‘10QII. ‘10QIII. ‘10QIV. ‘11QI. ‘11QII. ‘11QIII. ‘11QIV. ‘12QI. ‘12QII. ‘12QIII. ‘12QIV. ‘13QI. ‘13QII. ‘13QIII. ‘13QIV. ‘14QI. ‘14QII. ‘14QIII. ‘14QIV. ‘15QI. ‘15QII. ‘15QIII. ‘15QIV. ‘16QI. ‘16QII. ‘16QIII. ‘16QIV. ‘17QI. ‘17QII. ‘17QIII. ‘17QIV. ‘18QI. ‘18QII. ‘18QIII. ‘18QIV. ‘19QI. QII.’19 QIII.’19 ‘19QIV. ‘20QI. ‘20QII. ‘20QIII. ‘20QIV. ‘21QI. ‘21QII. ‘21QIII. ‘21QIV. ‘22QI. ‘22QII. Victorian Growth Area Median Land Prices
Cardinia Casey Whittlesea Hume Melton Wyndham Mitchell Geelong Metro Melbourne Median (all of VIC)
Source: Oliver Hume Research. Sold Lots. Annual moving average.
14 QUARTERLY MARKET INSIGHTS JUNE QUARTER 2022
Land Market 2.2 Prices
15QUARTERLY MARKET INSIGHTS JUNE QUARTER 2022 Victorian Median Lot Prices
Source: Oliver Hume Research. Sold Lots. Municipality QII, ‘21 QI, ‘22 QII, ‘22 % (QoQ)Change % Change(YoY) $ Change(QoQ) $ Change(YoY)
Source: Oliver Hume Research. Sold Lots.
Cardinia $347,500 $464,000 $434,000 -6.5% 24.9% -$30,000 $86,500 Casey $419,833 $460,400 $464,000 0.8% 10.5% $3,600 $44,167 Geelong $288,767 $377,500 $382,000 1.2% 32.3% $4,500 $93,233 Hume $314,800 $372,900 $372,000 -0.2% 18.2% -$900 $57,200 Melton $321,667 $368,050 $389,000 5.7% 20.9% $20,950 $67,333 Mitchell $269,333 $320,000 $335,000 4.7% 24.4% $15,000 $65,667 Whittlesea $331,850 $368,000 $360,000 -2.2% 8.5% -$8,000 $28,150
$150,000$200,000$250,000$300,000$350,000$400,000 Metropolitan Melbourne Growth Area Municipalities Median Land Price
Wyndham $311,250 $342,500 $367,500 7.3% 18.1% $25,000 $56,250 Metro Melbourne (All Growth Areas) - Conventional $324,000 $366,000 $379,000 3.6% 17.0% $13,000 $55,000 Metro Melbourne (All Growth Areas) - All Lots $321,667 $367,500 $380,000 3.4% 18.1% $12,500 $58,333 Median (All of Victoria) $311,000 $365,000 $378,000 3.6% 21.5% $13,000 $67,000 ‘10QII. ‘10QIII. ‘10QIV. ‘11QI. ‘11QII. ‘11QIII. ‘11QIV. ‘12QI. ‘12QII. ‘12QIII. ‘12QIV. ‘13QI. ‘13QII. ‘13QIII. ‘13QIV. ‘14QI. ‘14QII. ‘14QIII. ‘14QIV. ‘15QI. ‘15QII. ‘15QIII. ‘15QIV. ‘16QI. ‘16QII. ‘16QIII. ‘16QIV. ‘17QI. ‘17QII. ‘17QIII. ‘17QIV. ‘18QI. ‘18QII. ‘18QIII. ‘18QIV. ‘19QI. QII.’19 QIII.’19 ‘19QIV. ‘20QI. ‘20QII. ‘20QIII. ‘20QIV. ‘21QI. ‘21QII. ‘21QIII. ‘21QIV. ‘22QI. ‘22QII.
16 QUARTERLY MARKET INSIGHTS JUNE QUARTER 2022
Land Market Sales Volumes
Sales
The volume of lots sold continued to decline in the June quarter as the market responded to higher interest rates. Other contributing factors included the return of sales to long-term average levels (following a record 2021) and affordability constraints (driven by both higher land prices and construction costs). Jun-05 Jun-06 Jun-07 Jun-08 Jun-09 Jun-10 Jun-11 Jun-12 Jun-13 Jun-14 Jun-15 Jun-16 Jun-17 Jun-18 Jun-19 Jun-20 Jun-21 Jun-22 Land - Metropolitan Melbourne
05001,0001,5002,0002,5003,000 Jun-04
2.2
Source: Oliver Hume Research.
Monthly
Source: Oliver Hume Research. Sold Lots. QII, ‘21 QIII, ‘21 QIV, ‘21 QI, ‘22 QII, ‘22 Lot Size Median lots sizes across Victorian markets declined to 375 sqm in the June quarter 2022. The median size of lots sold in the metropolitan Melbourne market declined to 363 sqm in the June quarter. Over the same period the median size of lots sold in the Greater Geelong market declined to 400 sqm. The smallest lots sold were generally in the Hume, Whittlesea and Wyndham municipalities.
Source: Oliver Hume Research. and Greater Residential Land Median Lot Sizes (sqm)
17QUARTERLY MARKET INSIGHTS JUNE QUARTER 2022 (No.)SalesMonthly 050100150200250300350400450500 Monthly Land Sales - City of Greater Geelong Jun-10 Jun-11 Jun-12 Jun-13 Jun-14 Jun-15 Jun-16 Jun-17 Jun-18 Jun-19 Jun-20 Jun-21 Jun-22
Geelong
Municipality
Victoria 396 392 392 392 375 Cardinia 420 400 400 392 395 Casey 400 388 400 400 400 Greater Geelong 392 400 405 417 400 Hume 399 392 389 392 350 Melton 400 387 375 381 392 Mitchell 392 392 446 388 400 Whittlesea 378 354 344 350 350 Wyndham 392 389 350 350 350 Median
Metro Melbourne
GEELONG WERRIBEE $380,000$418,000 TARNEIT $406,500$452,900 FRASER RISE $454,000$421,900 LARA $388,800$364,800 MAMBOURIN $395,000$372,500 ARMSTRONGCREEK $452,000$418,000 MELTONSOUTH $335,000$365,000 PLUMPTON $439,500$478,000 TRUGANINA $444,500$481,200 WYNDHAMVALE $390,000$360,000 MelbourneMetropolitan June Quarter 2022 VICTORIA 12.5m x 28m 12.5m x 32m 14m x 32m COMMONLY SOLD LOTS $380,000 MEDIAN PRICE 363 sqm MEDIAN SIZE $1,037 per sqm MEDIAN VALUE RATE
MELBOURNE WOLLERT $446,900$479,900 MICKLEHAM $430,000$462,222 BEVERIDGE $395,000$342,000 CLYDE $459,000$497,000 BERWICK $588,000$619,000 OFFICER $503,300$529,000 GREENVALE $485,500$560,000 WALLAN $335,000$369,000 CRAIGIEBURN $498,000n/a KALKALLO $409,000$384,000 400 sqm Median Price 448 sqm Median Price Source: Oliver Hume Research. Sold. Median Lot Prices by Suburb (Gross) 400 sqm and 488 sqm Lots June Quarter 2022 VICTORIA
Although there are exceptions, most stock, which is currently being offered, tends to be of lesser quality or allowing a smaller lot yield.
for residential development sites has moderated in the last few months following recent interest rate increases by the Reserve Bank of Australia and the expectation of continued interest rate increases. The broader market outlook has also changed with retail prices expected to stabilise, if not moderate, and sales volumes continuing to decline from record highs.
While alsodemand,marketsmetropolitanaremostinregionalmarketsremainsoughtafter.
Peter Vassallo Managing Director | Development Sites p.vassallo@oliverhume.com.au

The volume of development sites being offered to the market has increased marginally, with current and potential vendors increasingly of the view that the greenfield market has entered a new phase.
Demand2.3
Higher inflation and cost increases continue to place upwards pressure on developer cost escalations.
Local developers remain the key developer site buying cohort, although there is emerging interest from foreign developers.
While lending rates had narrowed between non-bank and banks, making the former increasingly attractive despite the higher cost, higher interest rates are now also feeding into the cost of capital.
While metropolitan markets are most in demand, regional markets also remain sought after. This is especially the case with working from home continuing and affordability remaining a key driver of retail buyer decision making.
As is usually the case in times of market adjustments, there is a growing divergence between buyer and seller expectations. While some vendors have adjusted their price expectations, others are seeking higher prices than what they are likely to get in the current market.
20 QUARTERLY MARKET INSIGHTS JUNE QUARTER 2022 Development Sites
Queensland3.0
The Queensland economy remains resilient. Conditions in the labour market have improved further in recent months with employment growth remaining steady and the state’s unemployment rate declining to 4.0% in June 2022. Queensland’s population growth, driven by high levels of interstate migration, and retail trade remain relatively robust, especially when compared to other Queensland’sjurisdictions. participation rate also remains high (67.4%) and above the national average (66.8%).
Market Drivers 3.1 Economy
24 QUARTERLY MARKET INSIGHTS JUNE QUARTER 2022

Sebastian Ozturk Queensland Research s.ozturk@oliverhume.com.auAnalyst

25QUARTERLY MARKET INSIGHTS JUNE QUARTER 2022 Queensland Employment Growth -200-150-100-50050100150200250300350adjustedseasonally‘000,change,personYearly
Source: ABS.NSW VIC QLD
Source: ABS, Queensland Treasury. Change in the number of persons employed on either a full-time (at least 35 hours per week) or part-time (at least one hour per week) basis, in Queensland, during a monthly period. Part-time Full-time Total Net Interstate Migration (Quarterly) -8,000-6,000-4,000-2,00002,0004,0006,0008,00010,00012,000
Jun-16 Sep-16 Dec-16 Mar-17 Jun-17 Sep-17 Dec-17 Mar-18 Jun-18 Sep-18 Dec-18 Mar-19 Jun-19 Sep-19 Dec-19 Mar-20 Jun-20 Sep-20 Dec-20 Mar-21 Jun-21 Sep-21 Dec-21 Mar-22
Mar-08 Sep-08 Mar-09 Sep-09 Mar-10 Sep-10 Mar-11 Sep-11 Mar-12 Sep-12 Mar-13 Sep-13 Mar-14 Sep-14 Mar-15 Sep-15 Mar-16 Sep-16 Mar-17 Sep-17 Mar-18 Sep-18 Mar-19 Sep-19 Mar-20 Sep-20 Mar-21
The South-East Queensland land market has rebounded with higher sales volumes being driven by local demand and facilitated by more stock coming to the market. Lot availability, however, continues to be a key driver of sales volumes as the regions with the highest levels of stock dominate market share. By the end of June quarter, five of the six South East Queensland growth corridors recorded fewer than 100 available lots. The Logan corridor recorded the largest annual decline with a 56% drop in the number of available lots.
2,0002,5001,5001,0005000
South East Queensland Project Land Sales Total Quarterly Sales Long Run Average Moving Quarterly Average Jun-13 Sep-13 Dec-13 Mar-14 Jun-14 Sep-14 Dec-14 Mar-15 Jun-15 Sep-15 Dec-15 Mar-16 Jun-16 Sep-16 Dec-16 Mar-17 Jun-17 Sep-17 Dec-17 Mar-18 Jun-18 Sep-18 Dec-18 Mar-19 Jun-19 Sep-19 Dec-19 Mar-20 Jun-20 Sep-20 Dec-20 Mar-21 Jun-21 Sep-21 Dec-21 Mar-22 Jun-22
26 QUARTERLY MARKET INSIGHTS JUNE QUARTER 2022
Source: Oliver Hume Research. Sold Lots.
1,441
Land Market 3.2 Land Market
27QUARTERLY MARKET INSIGHTS JUNE QUARTERSource:2022 Oliver Hume Research. 050100150200250300 Brisbane Gold Coast Ipswich Logan Moreton Bay Available Stock - South East Queensland Growth Corridors Jun-21 Jun-22 Redland
28 QUARTERLY MARKET INSIGHTS JUNE QUARTER 2022 Land Market 3.2 Market Share The Ipswich market recorded the highest market share over the June quarter (38.6% of all sales) with stock availability driving sales volumes. Growth Corridor Sales Market Share Source: Oliver Hume Research. Quarter SalesBrisbane Gold SalesCoast SalesIpswich SalesLogan Moreton Bay Sales SalesRedland Jun. '22 4.1% 2.5% 38.6% 31.8% 19.3% 3.7% Mar. ‘21 2.5% 4.2% 38.4% 35.3% 18.4% 1.1% Jun. ‘21 5.8% 11.1% 27.2% 33.0% 19.1% 3.8%
Source: Oliver Hume Research. Brisbane Gold Coast Ipswich Logan Moreton Bay Redland SEQ QII.’21 QIII.’21 QIV.’21 QI.’22 QII.’22 South East Queensland Median Lot Prices by Local Government Area
$1,000,000$1,200,000$800,000$600,000$400,000$200,000$0
Median Prices
New Residential Land - Median Lot Prices, South East Queensland Municipalities LGA QII. '22 QII. '22 QII. '21 QoQ YoY 5 yr Change Brisbane (C) $725,000 $888,000 $349,000 -18.3% 107.7% 88.9% Gold Coast (C) $997,900 $759,900 $812,500 31.3% 22.8% 236.5% Ipswich (C) $324,500 $279,900 $229,950 15.9% 41.1% 60.5% Logan (C) $242,000 $288,450 $219,750 -16.1% 10.1% 17.7% Moreton Bay (R) $394,900 $335,000 $282,000 17.8% 40.0% 54.7% Redland (C) $468,000 $540,000 $338,000 -13.3% 38.4% 45.5% SEQ $322,000 $307,700 $244,000 4.6% 31.9% 38.4%
29QUARTERLY MARKET INSIGHTS JUNE QUARTER 2022
The South-East Queensland median land price rose over the quarter (up 4.6%) to reach a record high. Prices were around 32% higher on an annual basis. However, pricing pressures are expected to ease over the short to medium term driven, primarily, by rising interest rates. For the first time this year, only three of the six municipalities recorded an increase in median prices. Results for the broader market and some markets, for example the Gold Coast especially, were driven by an increase in more premium stock being offered to the market.
Source: Oliver Hume Research.
30 QUARTERLY MARKET INSIGHTS JUNE QUARTER 2022 Land Market 3.2 Median Lot Size Across the broader South-East Queensland market lots in the 301-400 sqm range remained the most commonly sold. Over the quarter 38% of all sales occurred in this size range. Over the year Brisbane and Logan saw the largest change in the median size of lots sold (an increase of 3.3% and 8.8% respectively). Logan’s increase can be attributed to the launch of several projects which generally provided larger sized lots. 100%90%80%70%60%50%40%30%20%10%0% Source: Oliver Hume Research. QIII. ‘19QII. ‘19 QIV. ‘19 QI. ‘20 QII. ‘20 QIII. ‘20 QIV. ‘20 QI. ‘21 QII. ‘21 QIII. ‘21 QIV. ‘21 QI. ‘22 QII. ‘21 Long-runAverage Less than 300 sqm 301-400 sqm 401-500 sqm 501-600 sqm 601-1,000 sqm South East Queensland Project Land Sales (0 - 1,000 sqm) Market Share by Product Type 7% 10% 10% 12% 10% 10% 9% 8% 9% 10% 24% 9% 16% 11% 11% 13% 15% 15% 14% 13% 9% 10% 17% 12% 11% 11% 13% 13% 34% 34% 36% 31% 35% 34% 33% 34% 44% 37% 29% 37% 31% 33% 43% 38% 34% 36% 34% 37% 41% 41% 54% 38% 38% 38%32% 38% 5% 5% 6% 6% 7% 7% 8% 7% 10% 4% 1% 5%8% 6% South East Queensland Median Lot Sizes by Local Government Area (sqm) Source: Oliver Hume Research. LGA QII. '22 QI. '22 QII. '21 QoQ YoY 5 yr Change Brisbane (C) 436 477 422 -8.6% 3.3% 6.3% Gold Coast (C) 430 433 431 -0.7% -0.2% -15.9% Ipswich (C) 420 400 422 5.0% -0.5% -6.5% Logan (C) 437 480 402 -9.0% 8.8% 6.2% Moreton Bay (R) 400 430 413 -7.0% -3.2% -7.3% Redland (C) 420 402 448 4.5% -6.3% -8.1% SEQ 420 443 409 -5.2% 2.7% -5.6%
Source: Oliver Hume Research.
South East Queensland Project Land Sales (March Quarter 2022) | Median Value Rate ($ per sqm)
$0
South East Queensland Median Value Rates by Local Government Area ($/sqm)
The South-East Queensland value rate dropped 8.5% in the first quarter of 2022. This was partly due to the return of larger median sized blocks. However, this was relatively short-lived with value rates increasing by over 10% in the June quarter. A significant factor underpinning this result was the continued growth in prices due to lower stock levels.
Source: Oliver Hume Research. $500 $1,000 $1,500 $2,000 $2,500 SOUTH EAST
31QUARTERLY MARKET INSIGHTS JUNE QUARTER 2022
The Gold Coast saw the largest shift in value rates although this was due to premium lot offerings dominating most recently. This was in contrast to the same time last year when a large portion of affordable stock was available.
LGA QII. '22 QI. ‘22 QII. ‘21 QoQ $ ChangeValue(QoQ) YoY $ ChangeValue(YoY) 5 Changeyr $ (5YrChangeValueChange)
Brisbane (C) $1,663 $1,862 $876 -10.7% $-199 89.9% $787 77.7% $727 Gold Coast (C) $2,320 $1,755 $958 32.2% $565 142.1% $1,362 300.2% $1,740 Ipswich (C) $773 $700 $513 10.4% $73 50.7% $260 71.7% $323 Logan (C) $554 $601 $545 -7.8% -$47 1.6% $9 10.8% $54 Moreton Bay (R) $987 $779 $678 26.7% $208 45.7% $310 67.0% $396 Redland (C) $1,114 $1,343 $750 -17.0% -$229 48.6% $364 58.4% $411 SEQ $767 $695 $609 10.4% $72 25.9% $158 46.7% $244
Value Rates
MORETONQUEENSLANDREDLANDBAYLOGANIPSWICHGOLDCOASTBRISBANE $767 $1,114 $779 $987 $554 $773 $RRQ $2,320 $1,663
32 QUARTERLY MARKET INSIGHTS JUNE QUARTER 2022 Land Market3.21009080706050403020100 BRISBANE GOLD COAST IPSWICH LOGAN MORETON BAY REDLAND SEQ South East Queensland New Residential Land - Median Time on Market (Days) Source: Oliver Hume Research. 100120140806040200 ‘17QI. ‘17QII. ‘17QIII. ‘17QIV. ‘18QI. ‘18QII. ‘18QIII. ‘18QIV. ‘19QI. QII.’19 QIII.’19 ‘19QIV. ‘20QI. ‘20QII. ‘20QIII. ‘20QIV. ‘21QI. ‘21QII. ‘21QIII. ‘21QIV. ‘22QI. ‘22QII. South East Queensland New Residential Land - Median Time on Market (Days) Source: Oliver Hume Research. Median data. Time on Market Lots across South-East Queensland remained on market an average of 31 days in the June quarter, down from the previous quarter.

CABOOLTURE $333,900$329,900 MORAYFIELD $332,500$310,000 WALOON $228,000n/a RIPLEY $285,000$295,000 MOUNTAINSPRING $394,000$334,250 South QueenslandEast June Quarter QUEENSLAND2022 12.5m x 32m 12.5m x 30m 14m x 32m COMMONLY SOLD LOTS $322,000 MEDIAN PRICE 420 sqm MEDIAN SIZE $767 per sqm MEDIAN VALUE RATE
GOLD COAST BRISBANE NEWPORT $829,900n/a VICTORIAPOINT $600,000n/a NEERANG $760,000n/a CHAMBERSFLAT $348,000n/a 375 sqm Median Price 400 sqm Median Price Source: Oliver Hume Research. Sold. Median Lot Prices by Suburb (Gross) 375 sqm and 400 sqm Lots June Quarter QUEENSLAND2022
AustraliaSouth4.0
38 QUARTERLY MARKET INSIGHTS JUNE QUARTER 2022
The South Australian economy continues to rebound. The state’s unemployment rate continues to decline, falling from 4.6% in May to 4.3% in June, and the state is recording steady jobs growth. Through the year employment in the state was 2.4% Southhigher.Australia’s participation rate declined to 63.0% in TheJune.residential construction sector continues to play an important role driving the state’s economy. Relative to other jurisdictions, South Australia’s areas of above average performance include dwelling starts and construction work.

George Bougias National Head of g.bougias@oliverhume.com.auResearch
Market Drivers 4.1 Economy
$300,000$250,000$200,000$150,000$100,000$50,000$0
Oct-21 Nov-21 Dec-21 Jan-22 Feb-22 Mar-22 Apr-22 May-22 Jun-22
40 QUARTERLY MARKET INSIGHTS JUNE QUARTER 2022
Adelaide new land prices rose again in the June quarter to experience steady growth. Greater Adelaide land prices increased by over 5% in the June quarter to reach $205,000 (up 8.5% over the year). Residential land price trends mirrored those in the broader residential property market which showed Adelaide continuing to record price growth in the June quarter and in the month of June. Prices for many popular lot sizes, including 300 sqm and 480 sqm, are generally higher in 2022.
Source: Oliver Hume Research.300 sqm 480 sqm
Greater Adelaide Median Lot Price (3-month moving average, selected lot types)
Land Market 4.2 Prices
affected volumes in the Adelaide
41QUARTERLY MARKET INSIGHTS JUNE QUARTER 2022 Sales MedianVolumesLotSize
The volume of sales remains above long-term market, higher interest rates have mostly market recent months. Nevertheless, sales remain at healthy levels, overall, underpinned by Adelaide’s relative affordability and stock availability.
Greater Adelaide Residential Land Median Lot Size (sqm) - Quarterly Greater Adelaide Residential Land Sales 501001502002503003504000100200300400500600 Mar-21 Jun-22May-22Apr-22Mar-22Feb-22Jan-22Dec-21Nov-21Oct-21 Jun-21 Sep-21 Dec-21 Mar-22 Jun-22 The median size of lots transacted across the Greater Adelaide
and sales have declined in
prices
Source: Oliver Hume Research.
budgets
average Aslevels.inother
Source: Oliver Hume Research. market has steadily declined over the past two years as higher have forced buyers to adjust and
preferences.
AdelaideGreater* June Quarter 2022 SOUTH AUSTRALIA 12.5m x 30m 10m x 30m 12.5m x 32m COMMONLY SOLD LOTS $205,000 MEDIAN PRICE 450 sqm MEDIAN SIZE $465 per sqm MEDIAN VALUE RATE * Metropolitan Adelaide and selected regional municipalities.
300 sqm Median Price 375 sqm Median Price Source: Oliver Hume Research. Sold. Median Lot Prices by Suburb (Gross) 300 sqm and 375 sqm Lots June Quarter 2022 SOUTH AUSTRALIA ADELAIDE SEAFORDHEIGHTS $255,000n/a BARKERMOUNT $205,000$229,000 BUCKLANDPARK $210,900n/a ANGLE VALE $159,950$216,750 ANDREWSFARM $195,000$162,500 GAWLER EAST $190,000n/a DAVORENPARK $155,000$135,000 EVANSTONGARDENS $130,000n/a VIRGINIA $259,000n/a MUNNODOWNSPARA $146,000$164,500 MUNNOWESTPARA $139,500$173,000 MUNNO PARA $194,950$174,950

any other documentation prepared
publication
publication.
a significant
reproduced
the best judgements and estimates, made by Oliver Hume Research. No assurances can be
variables,
copied,
the marketing agent and associated consultants. www.oliverhume.com.au HEAD OFFICE Level 2 4 Riverside Quay Southbank, VIC 3006 P. 03 9669 BRISBANE5999 Shop 9, Gasworks Precinct 26 Reddacliff Street Newstead, QLD 4006 P. 07 3216 1666 SOUTH AUSTRALIA 89 Pirie Adelaide,StreetSA5000 P. 08 7201 3999 SYDNEY Level 24, Tower 3 300 Barangaroo Avenue Sydney, NSW 2000 P. 3 9669 5999 GOLD COAST Suite 5B, Emerald Lakes Town Centre Commercial 3027 The Blvd, Emerald Lakes Carrara QLD 4211 P. 1300 645 433 DARWIN 129 Asche Street Muirhead, NT 0810 P. 1300 7373 598
unpredictable factors, including social and economic conditions.

publication.
that the forecasts will be achieved. This document should be read in conjunction
document
can be affected
Important: The information in this has been prepared a general guide only and does not constitute advice. We have relied upon information from sources generally regarded as authoritative. Whilst the information has been prepared in good faith and with due care, no representation is made in relation to the accuracy of the whole or any part of the No liability for negligence or otherwise is assumed for any loss or damage suffered by any party resulting from their use of this The whole or any part of this must not be mirrored, or without written consent. The document may contain of a range of which by number of It only represents given with by
future forecasts