November 2025 Report with market data through October
Santa Clara Salt Marsh, photo by Deniece Smith, used with permission
As of the end of October, the S&P 500 and Nasdaq had reached new highs; 30-year mortgage rates hit their lowest point in over a year; inflation ticked up slightly to 3%; and the Fed made its second .25% reduction of its benchmark rate in 2025 (while cautioning that another reduction in December was not certain). General consumer confidence remained low, with significant unease regarding personal finances, job security and inflation – though affluent consumers enjoying substantial stock market gains were less worried. The Economic Policy Uncertainty Index continued to decline from its tariff-shock peak in April but remained high by long-term norms. Monthly sales volume in October 2025 was essentially flat year over year and the number of listings going into contract declined, but luxury home sales soared to the best month-of- October count ever. The pending ratio, a standard measure of market heat, rose to its highest point in six months: Santa Clara County has the highest pending ratio in the Bay Area. 56% of home sales sold for over asking price. Price reductions are well down from their peak in early summer, but higher year over year. The details on these and other market indicators follow within this report. The market typically slows substantially from midNovember to mid-January, though listing and sales activity continue in every month of the year, and well-priced, well-prepared and effectively marketed homes will often sell quickly for over asking price. However, this is usually the period when buyers can negotiate most aggressively on unsold homes listed earlier in the year.
Report created in good faith using data from sources deemed reliable but may contain errors and subject to revision. Last period figures are preliminary estimates based on data available early in the following month. All numbers approximate, and may change with late-reported activity.
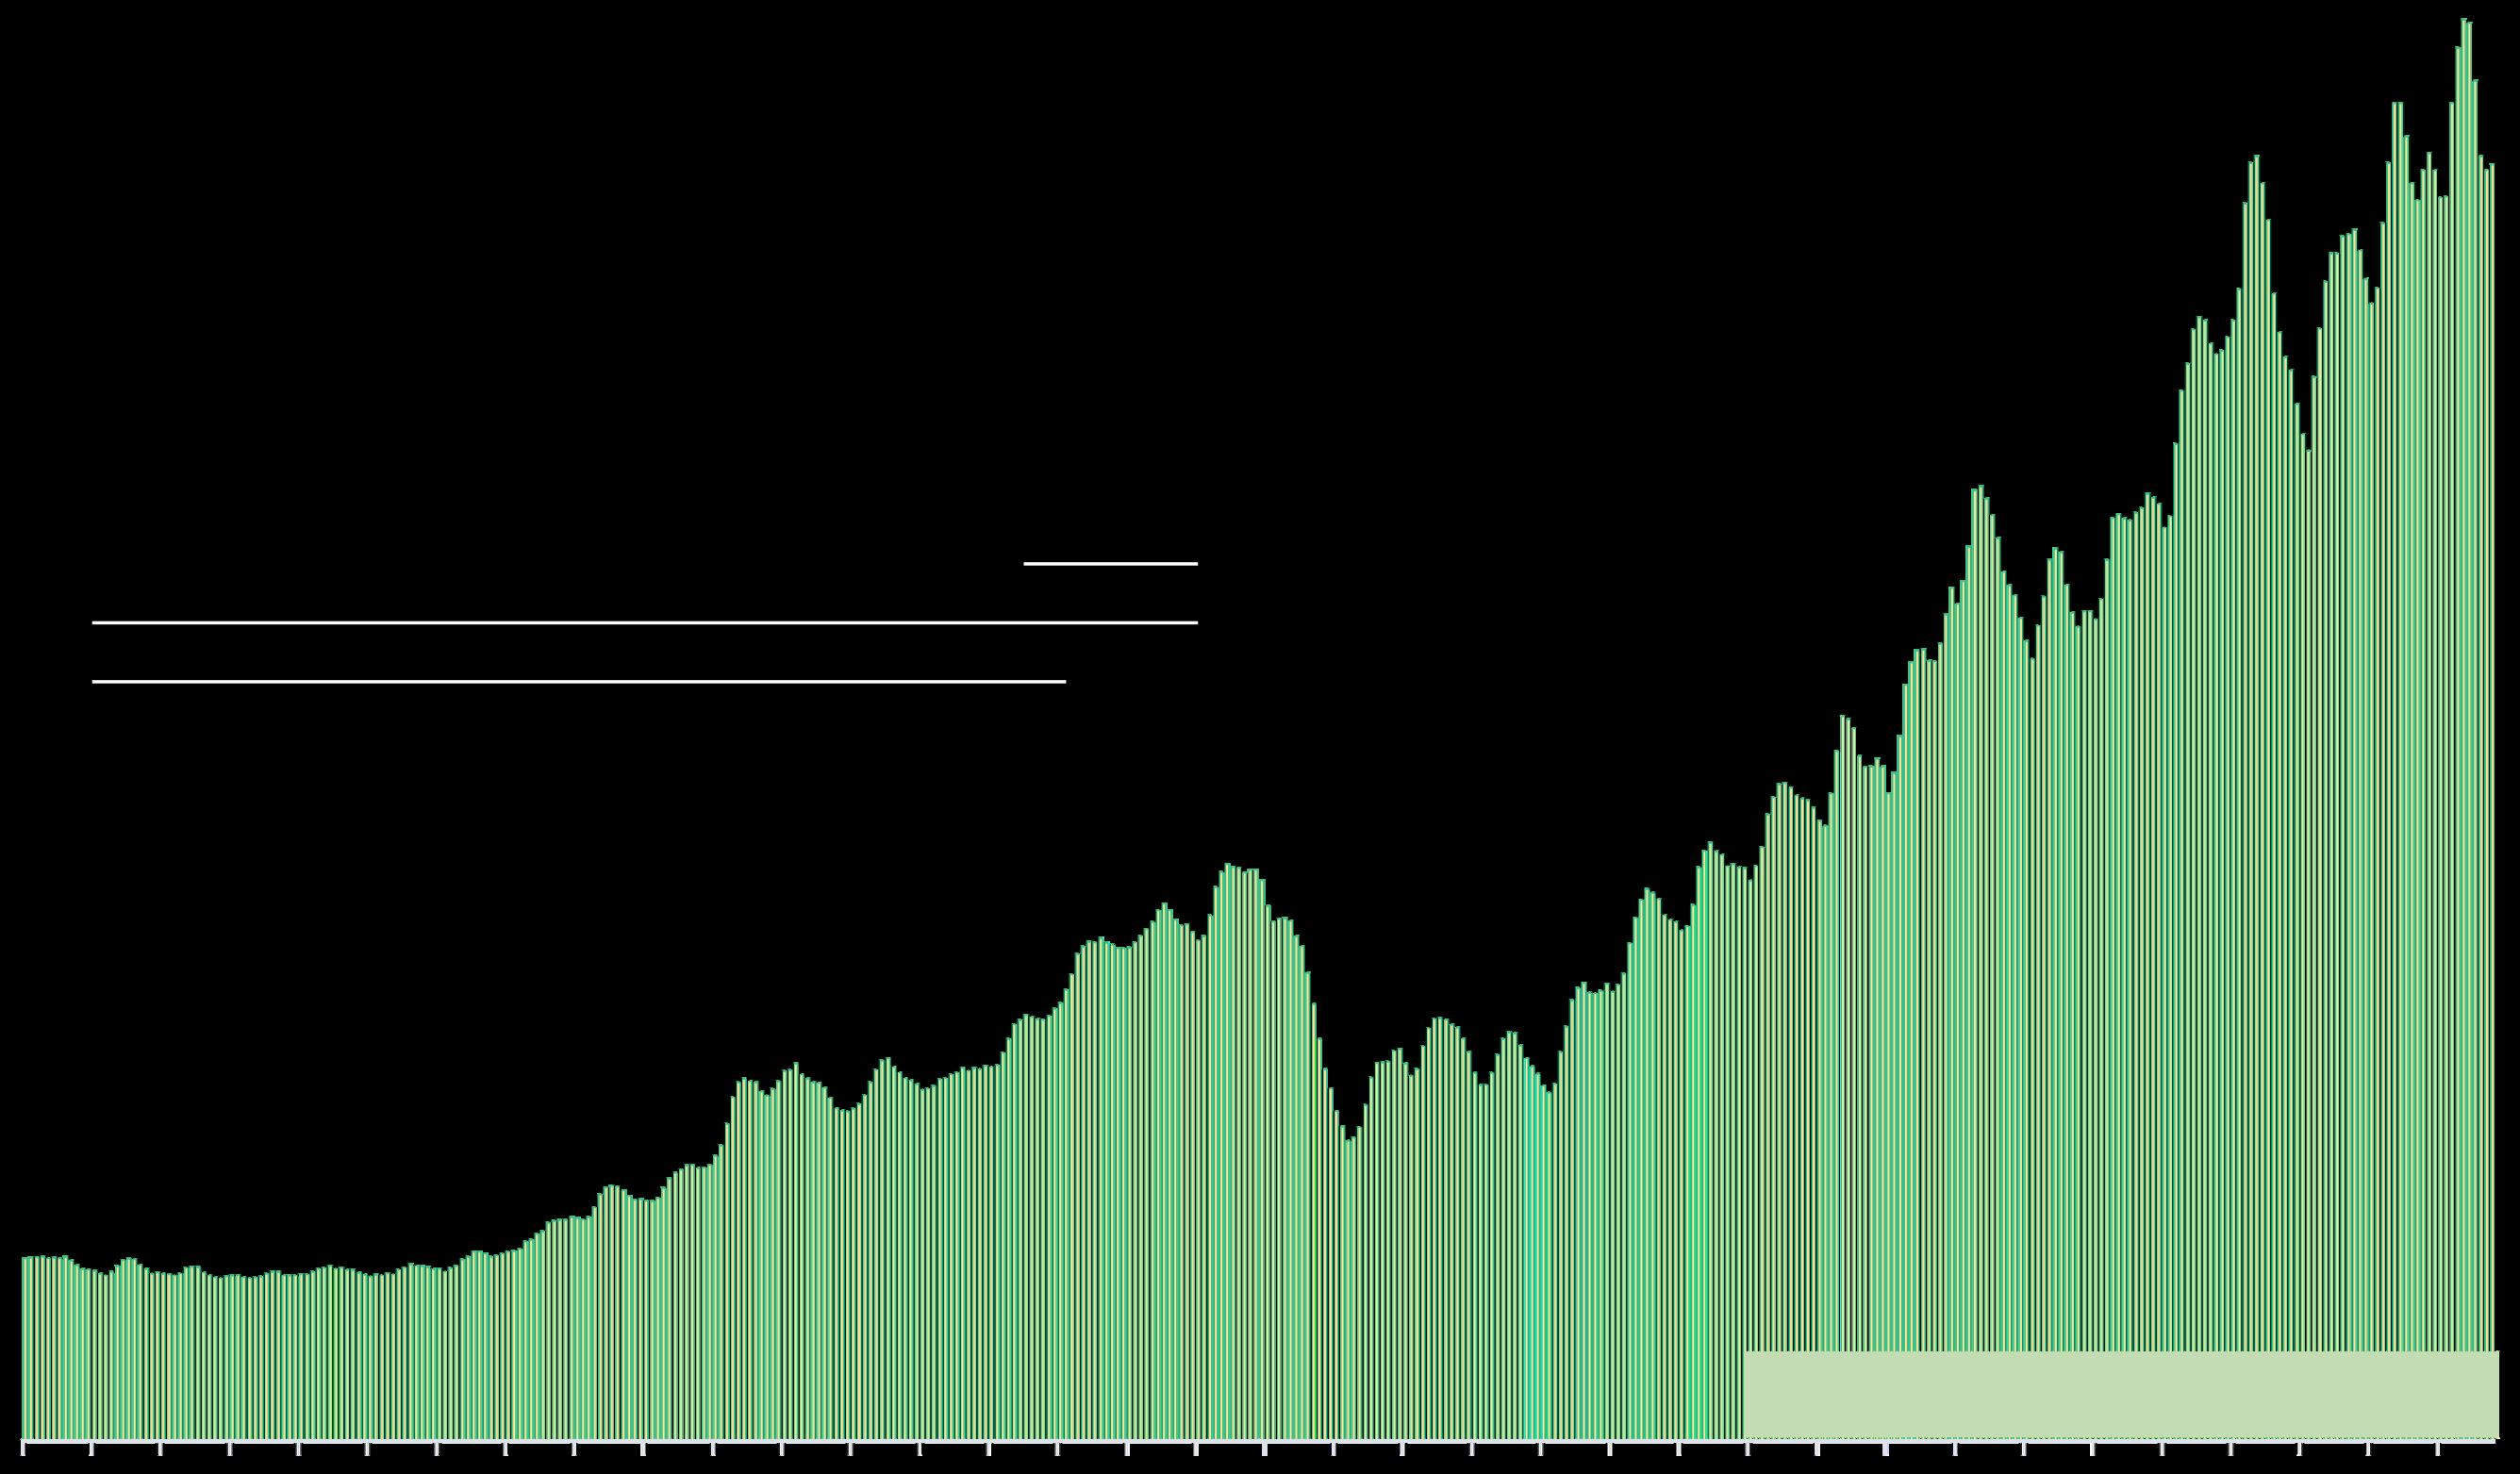
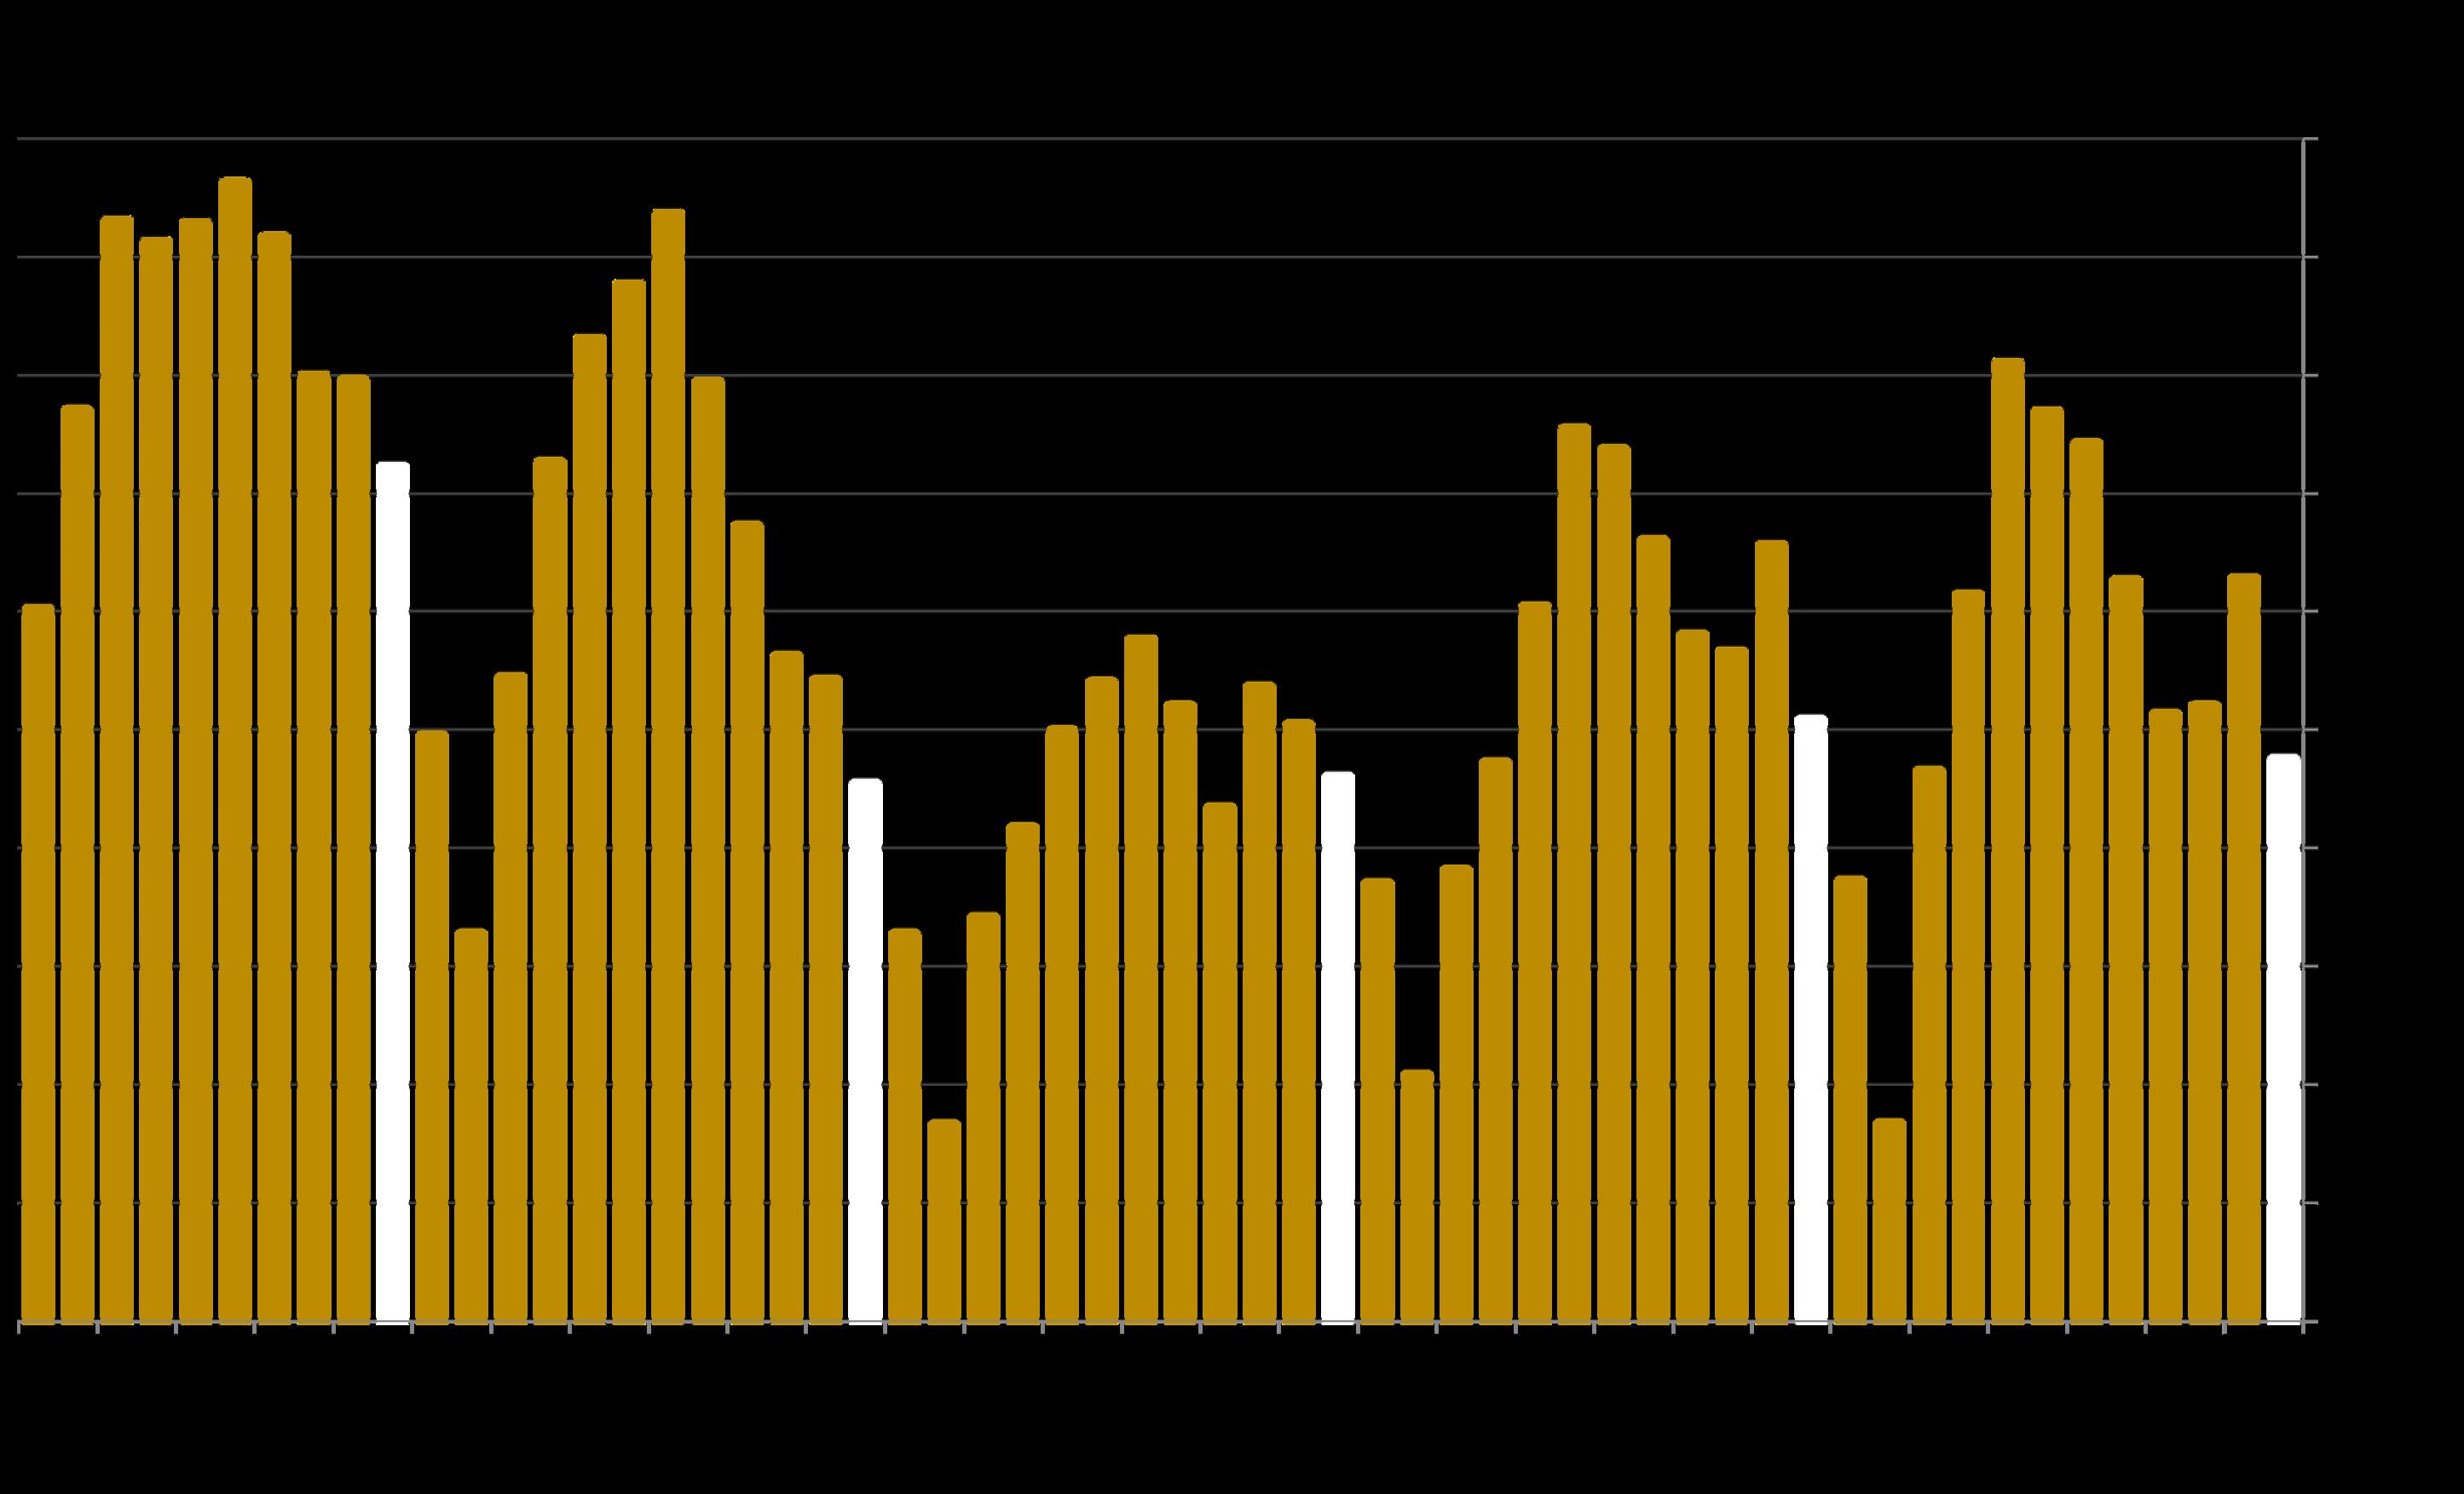
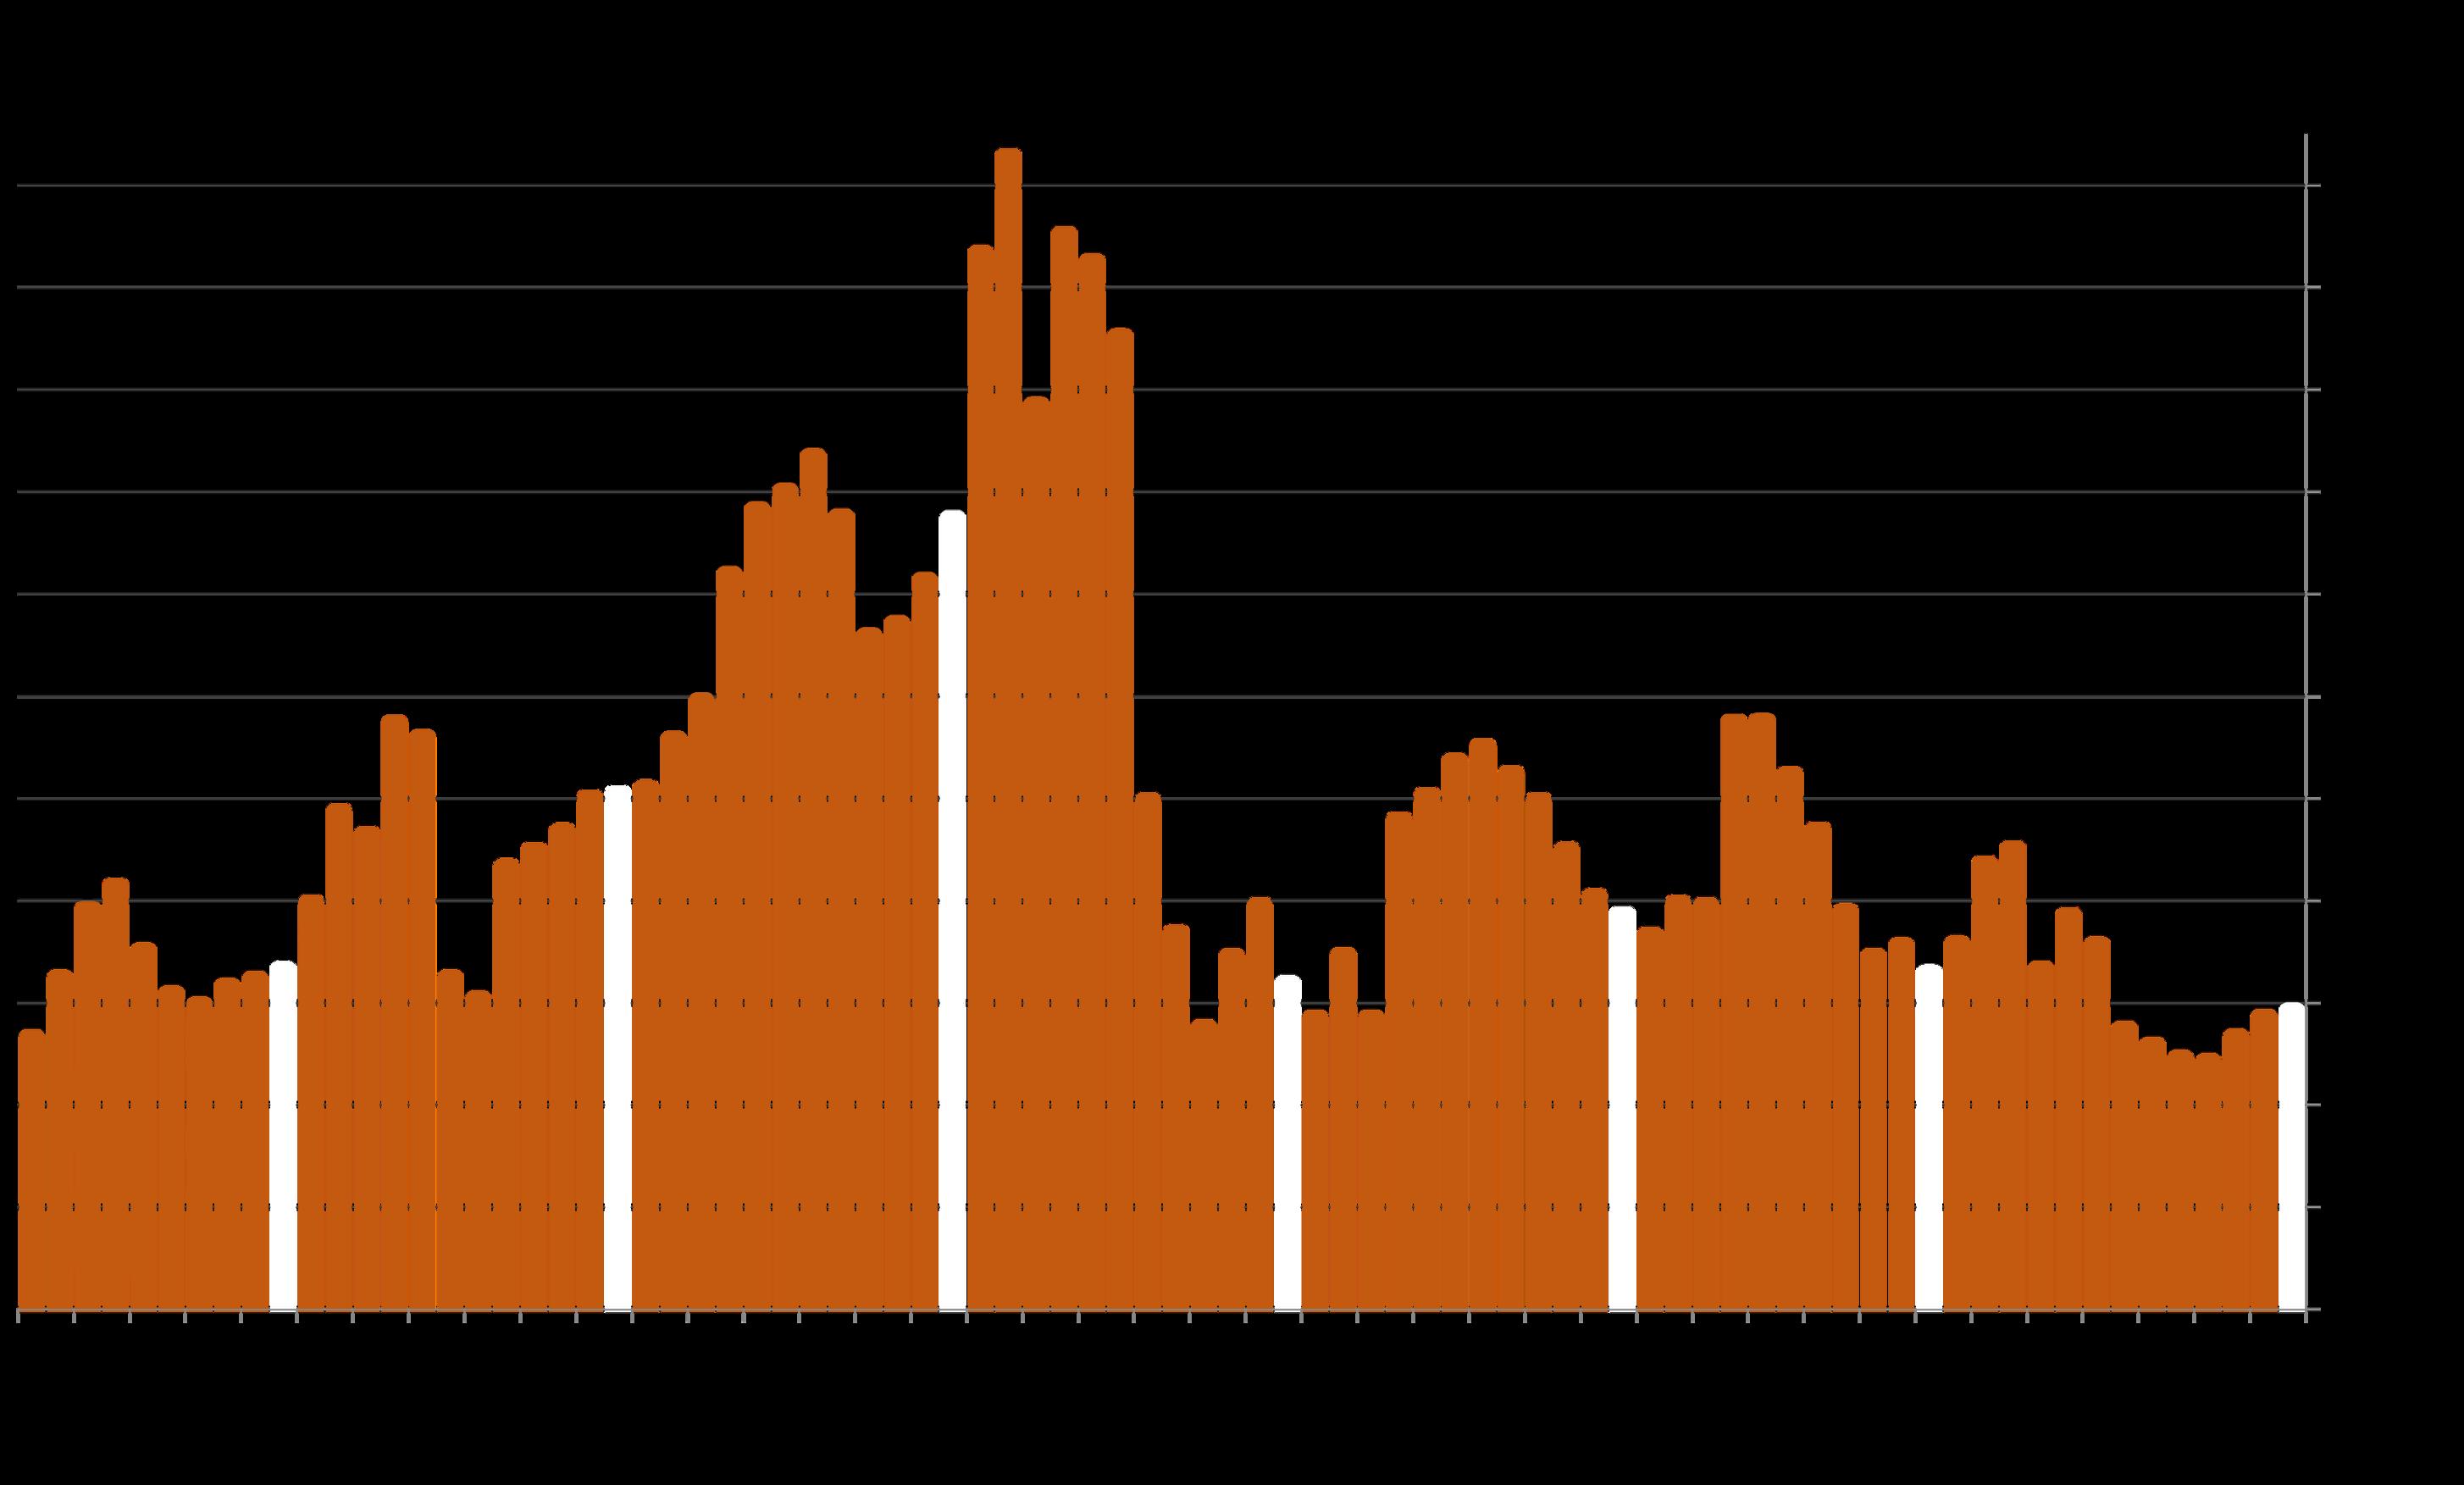
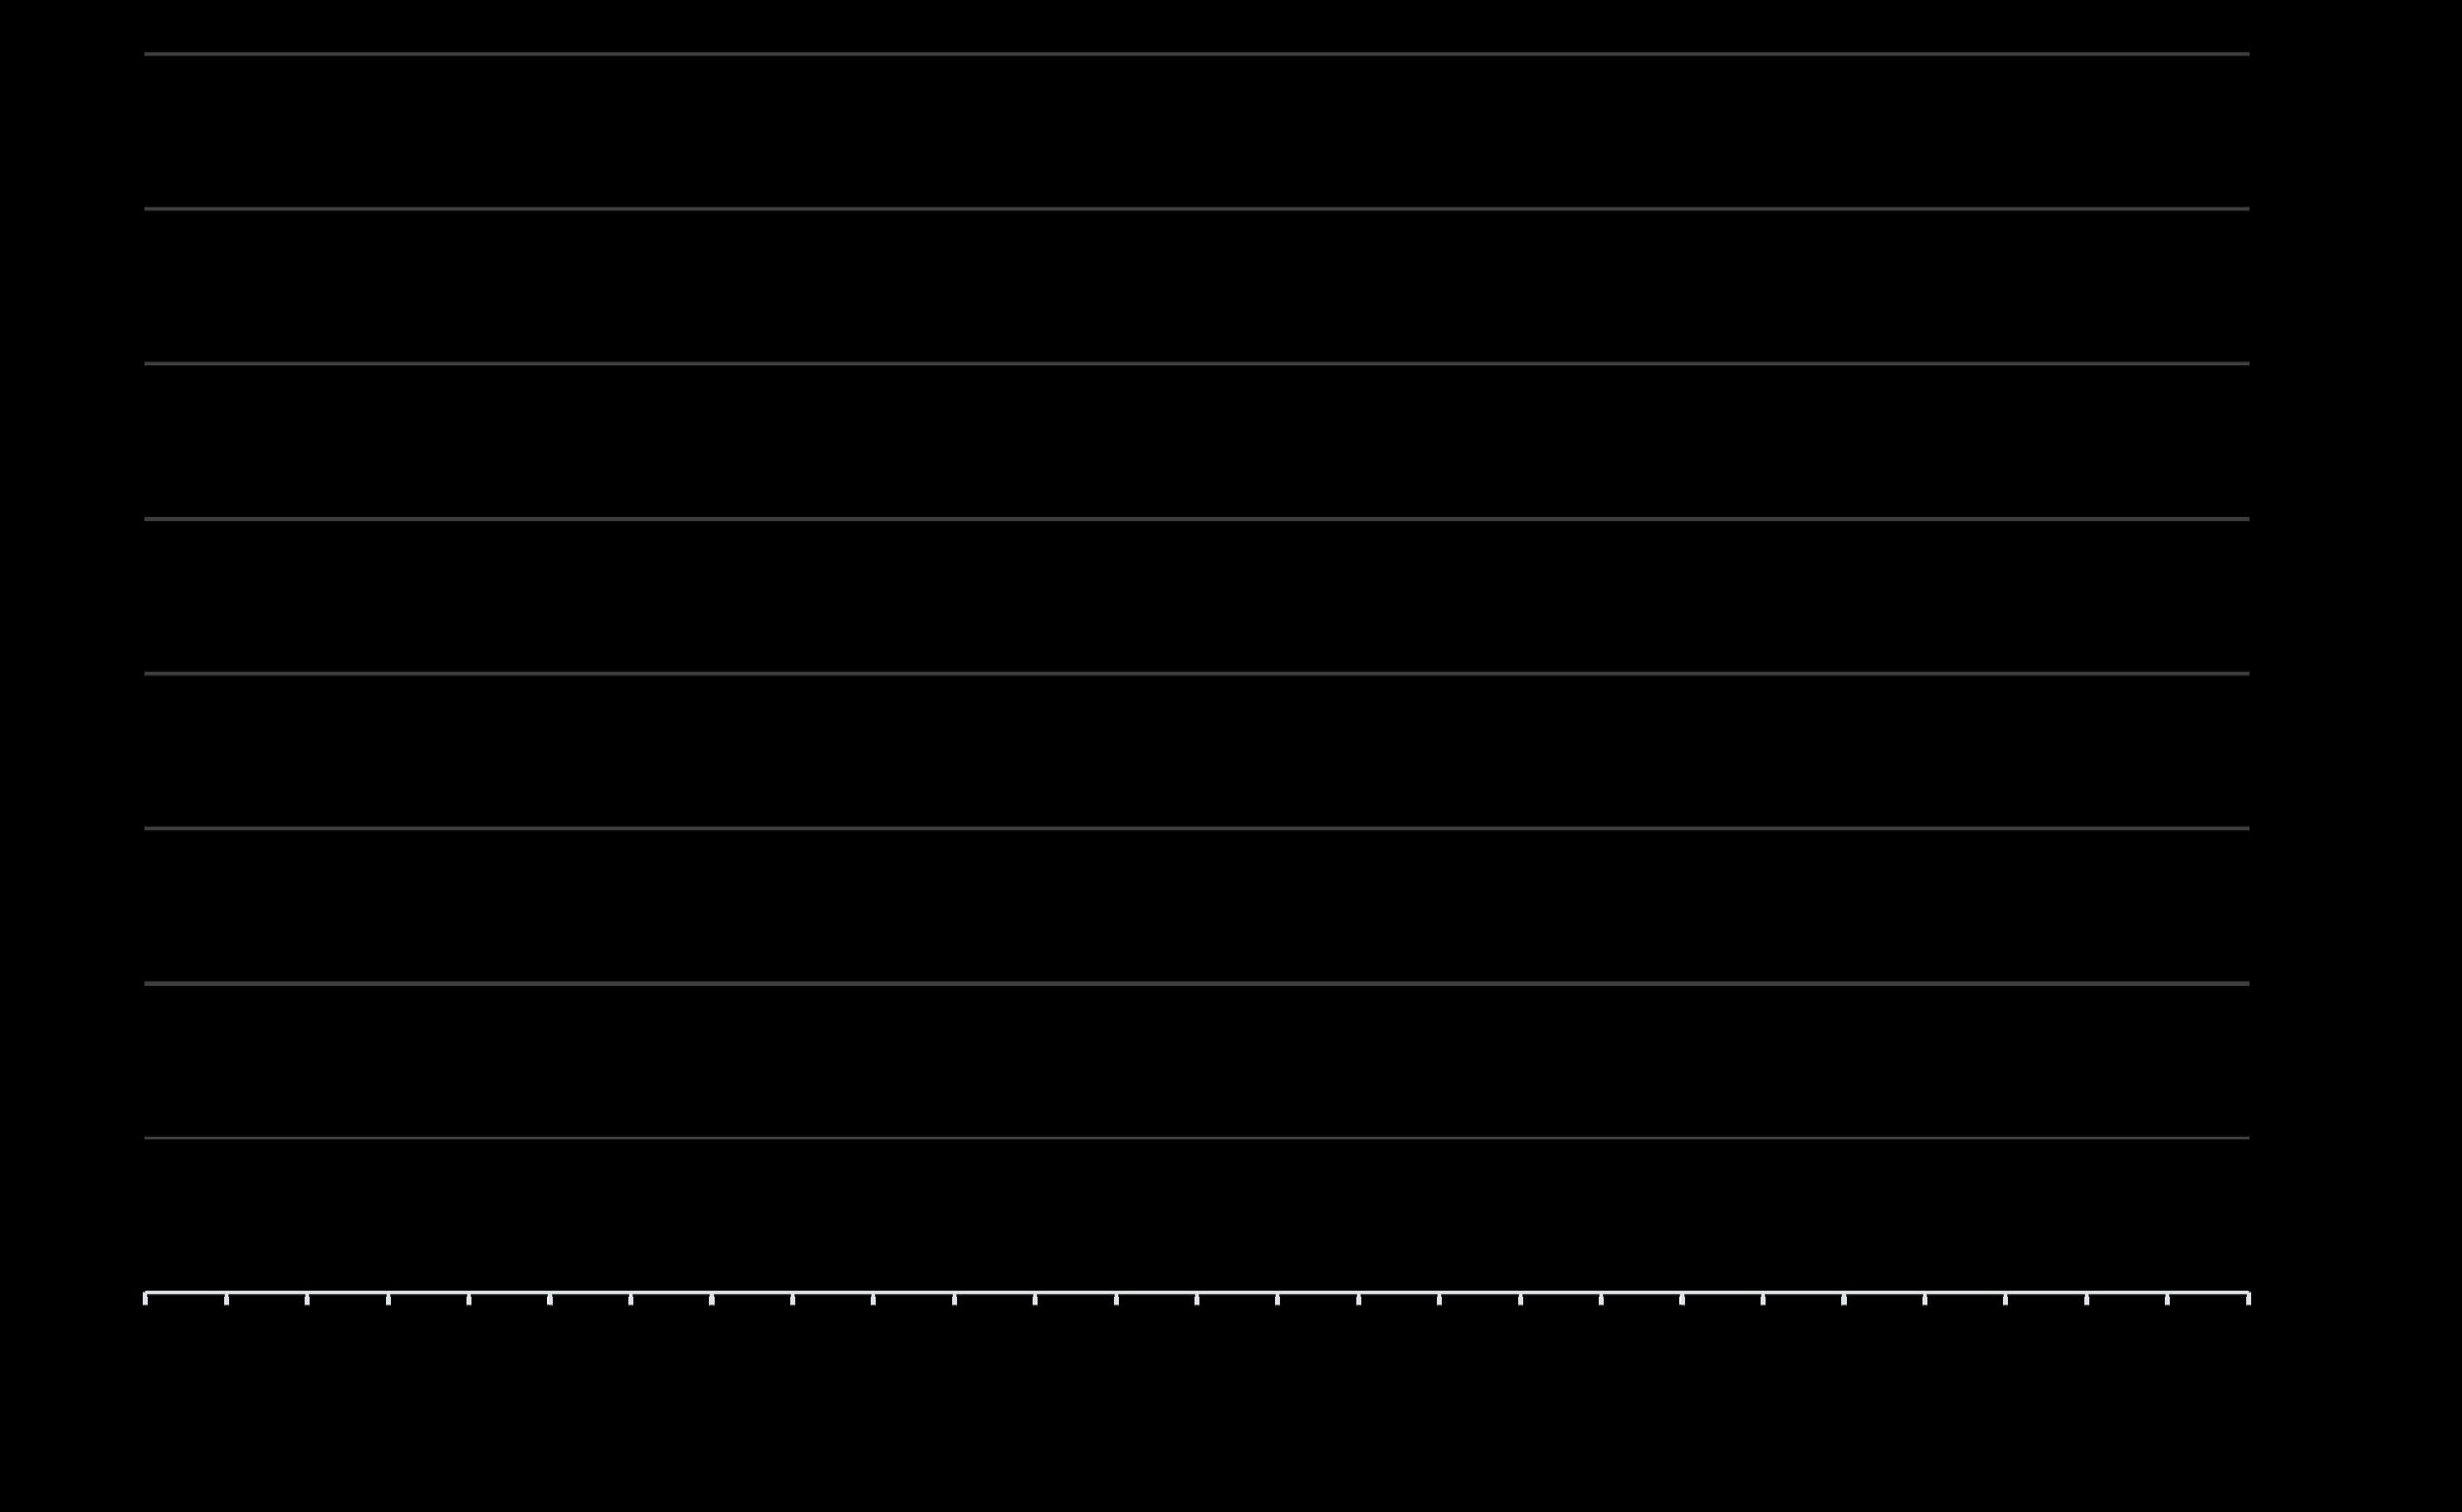
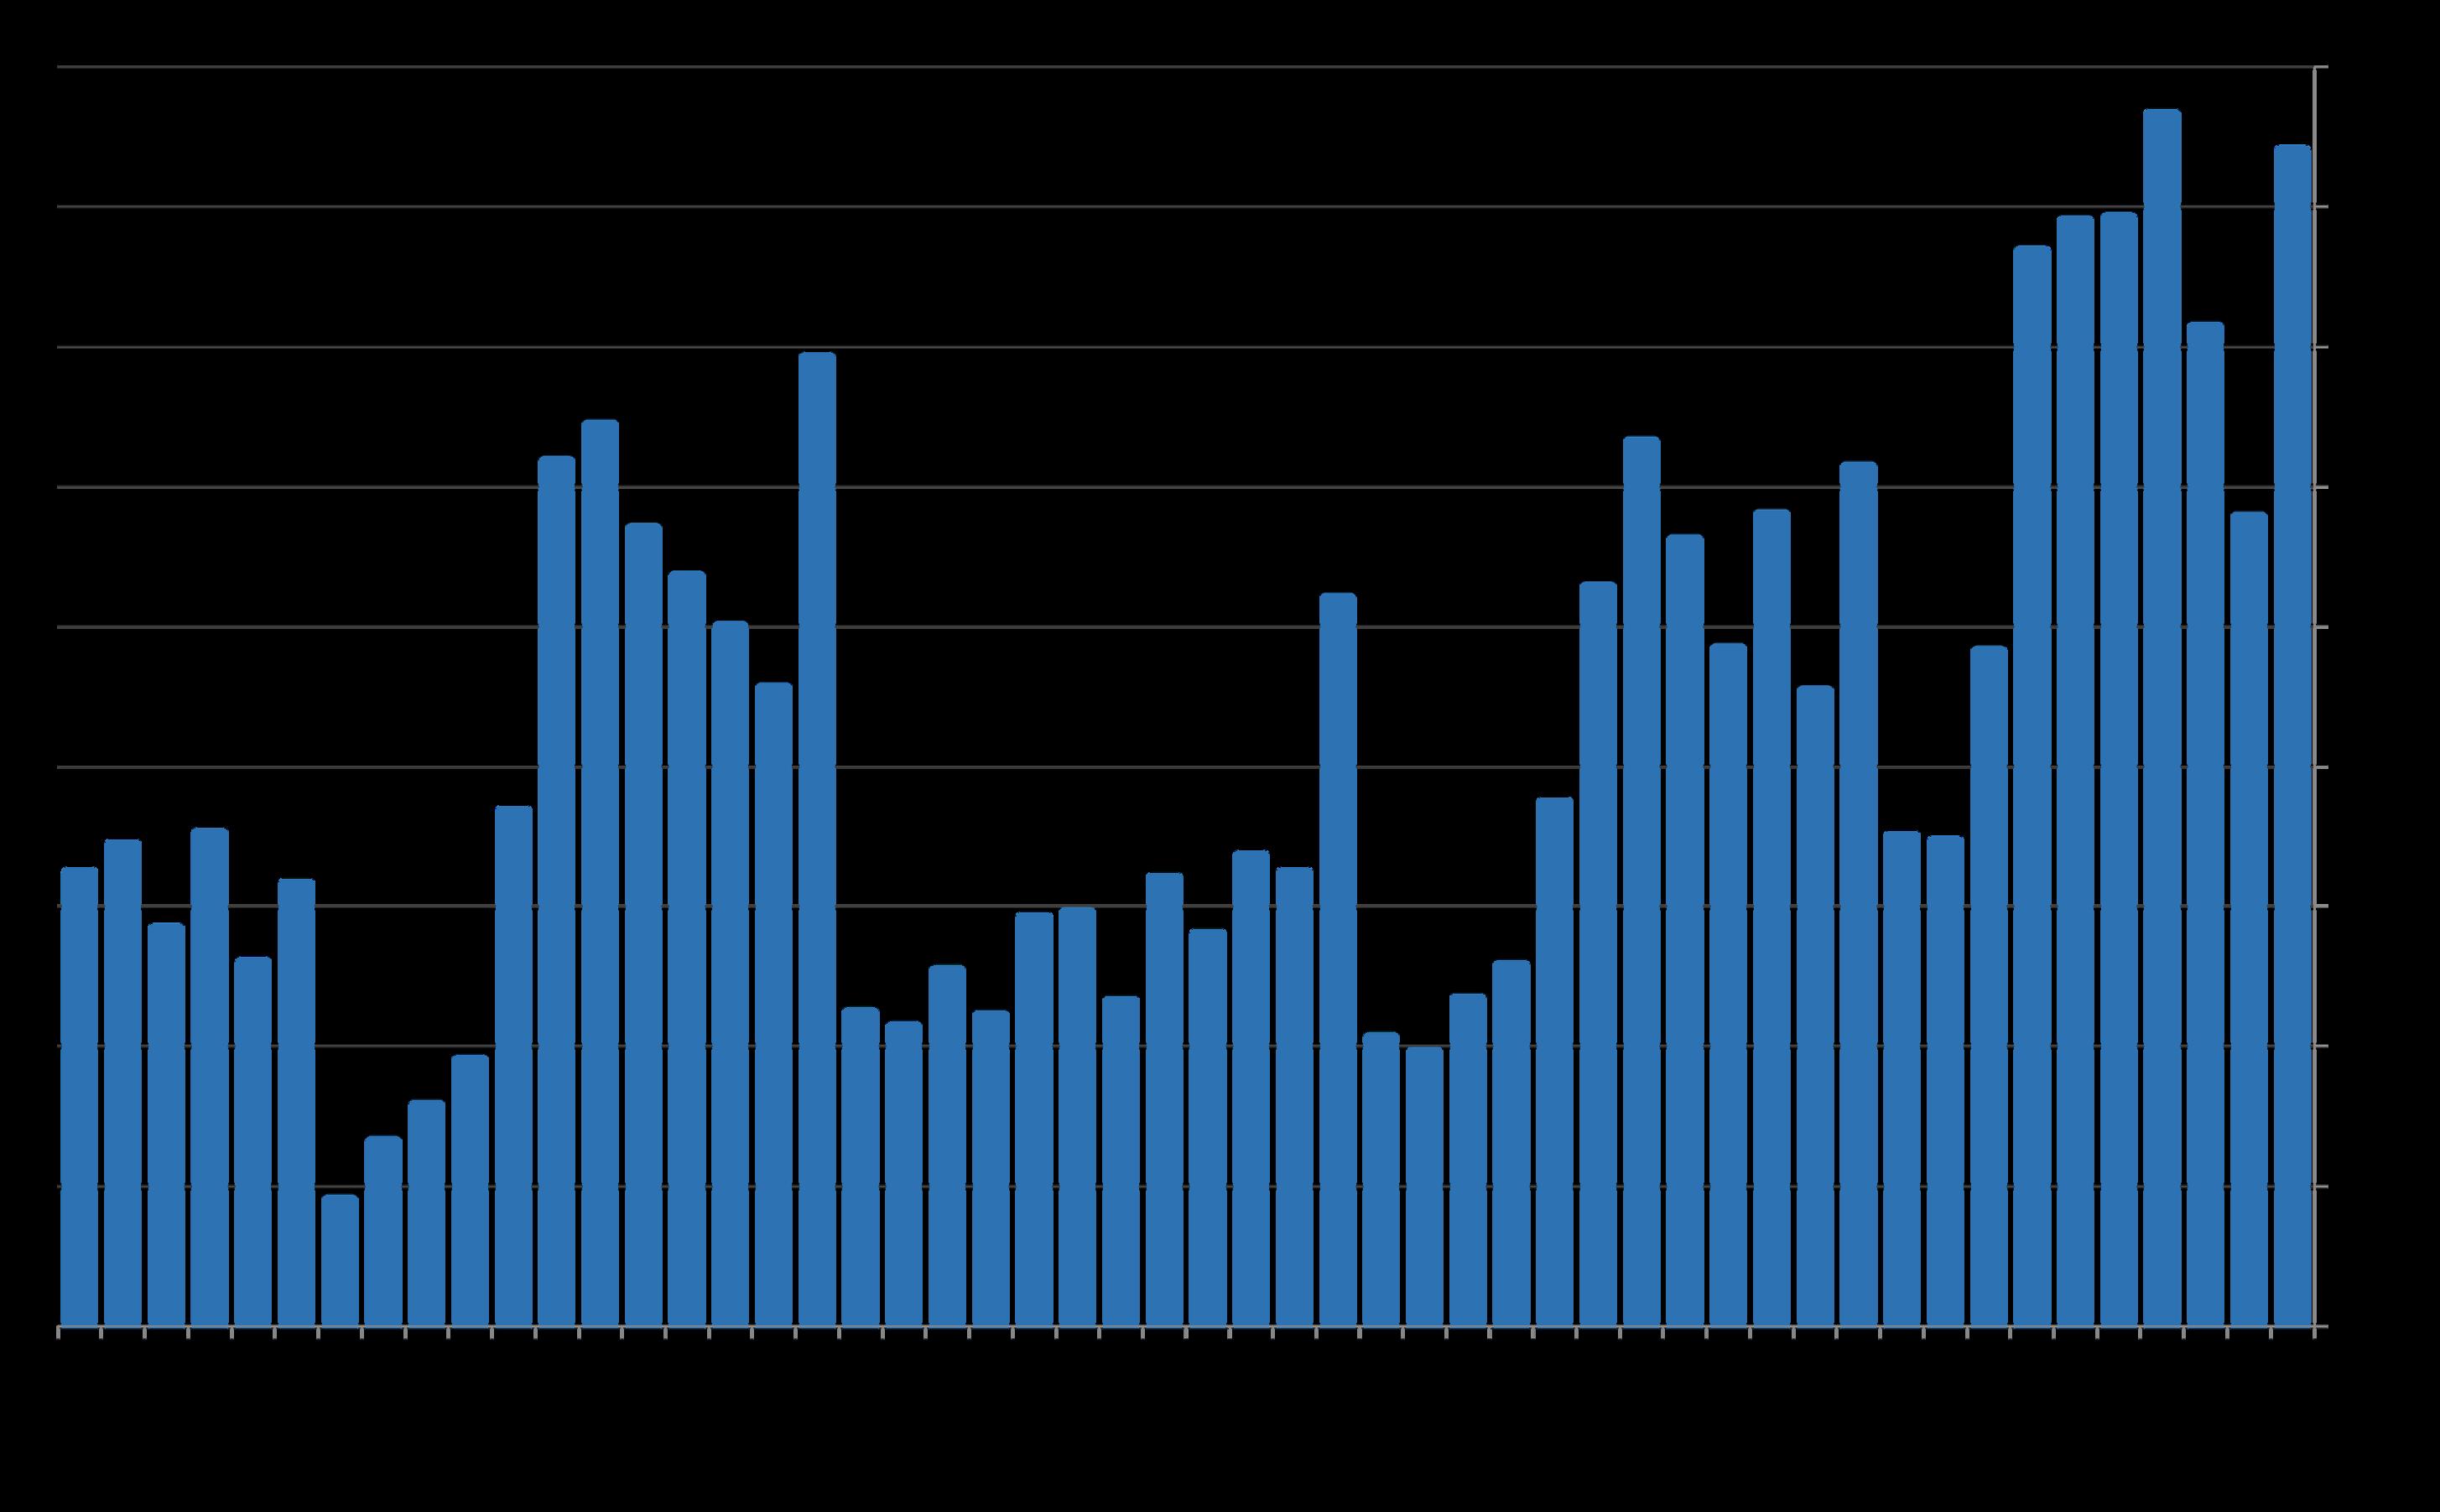
Monthly Median House Sales Prices, 3-Month Rolling*
The 3-month-rolling median house sales price in October 2025 rose very slightly, about .5%, year over year.
Median sales price is that price at which half the sales occurred for more and half for less. It is a very general statistic, disguising an enormous range of sales prices in the underlying sales. It is often affected by other factors besides changes in fair market value. Monthly and seasonal fluctuations are common, which explain many of the regular ups and downs in this chart. Pandemic
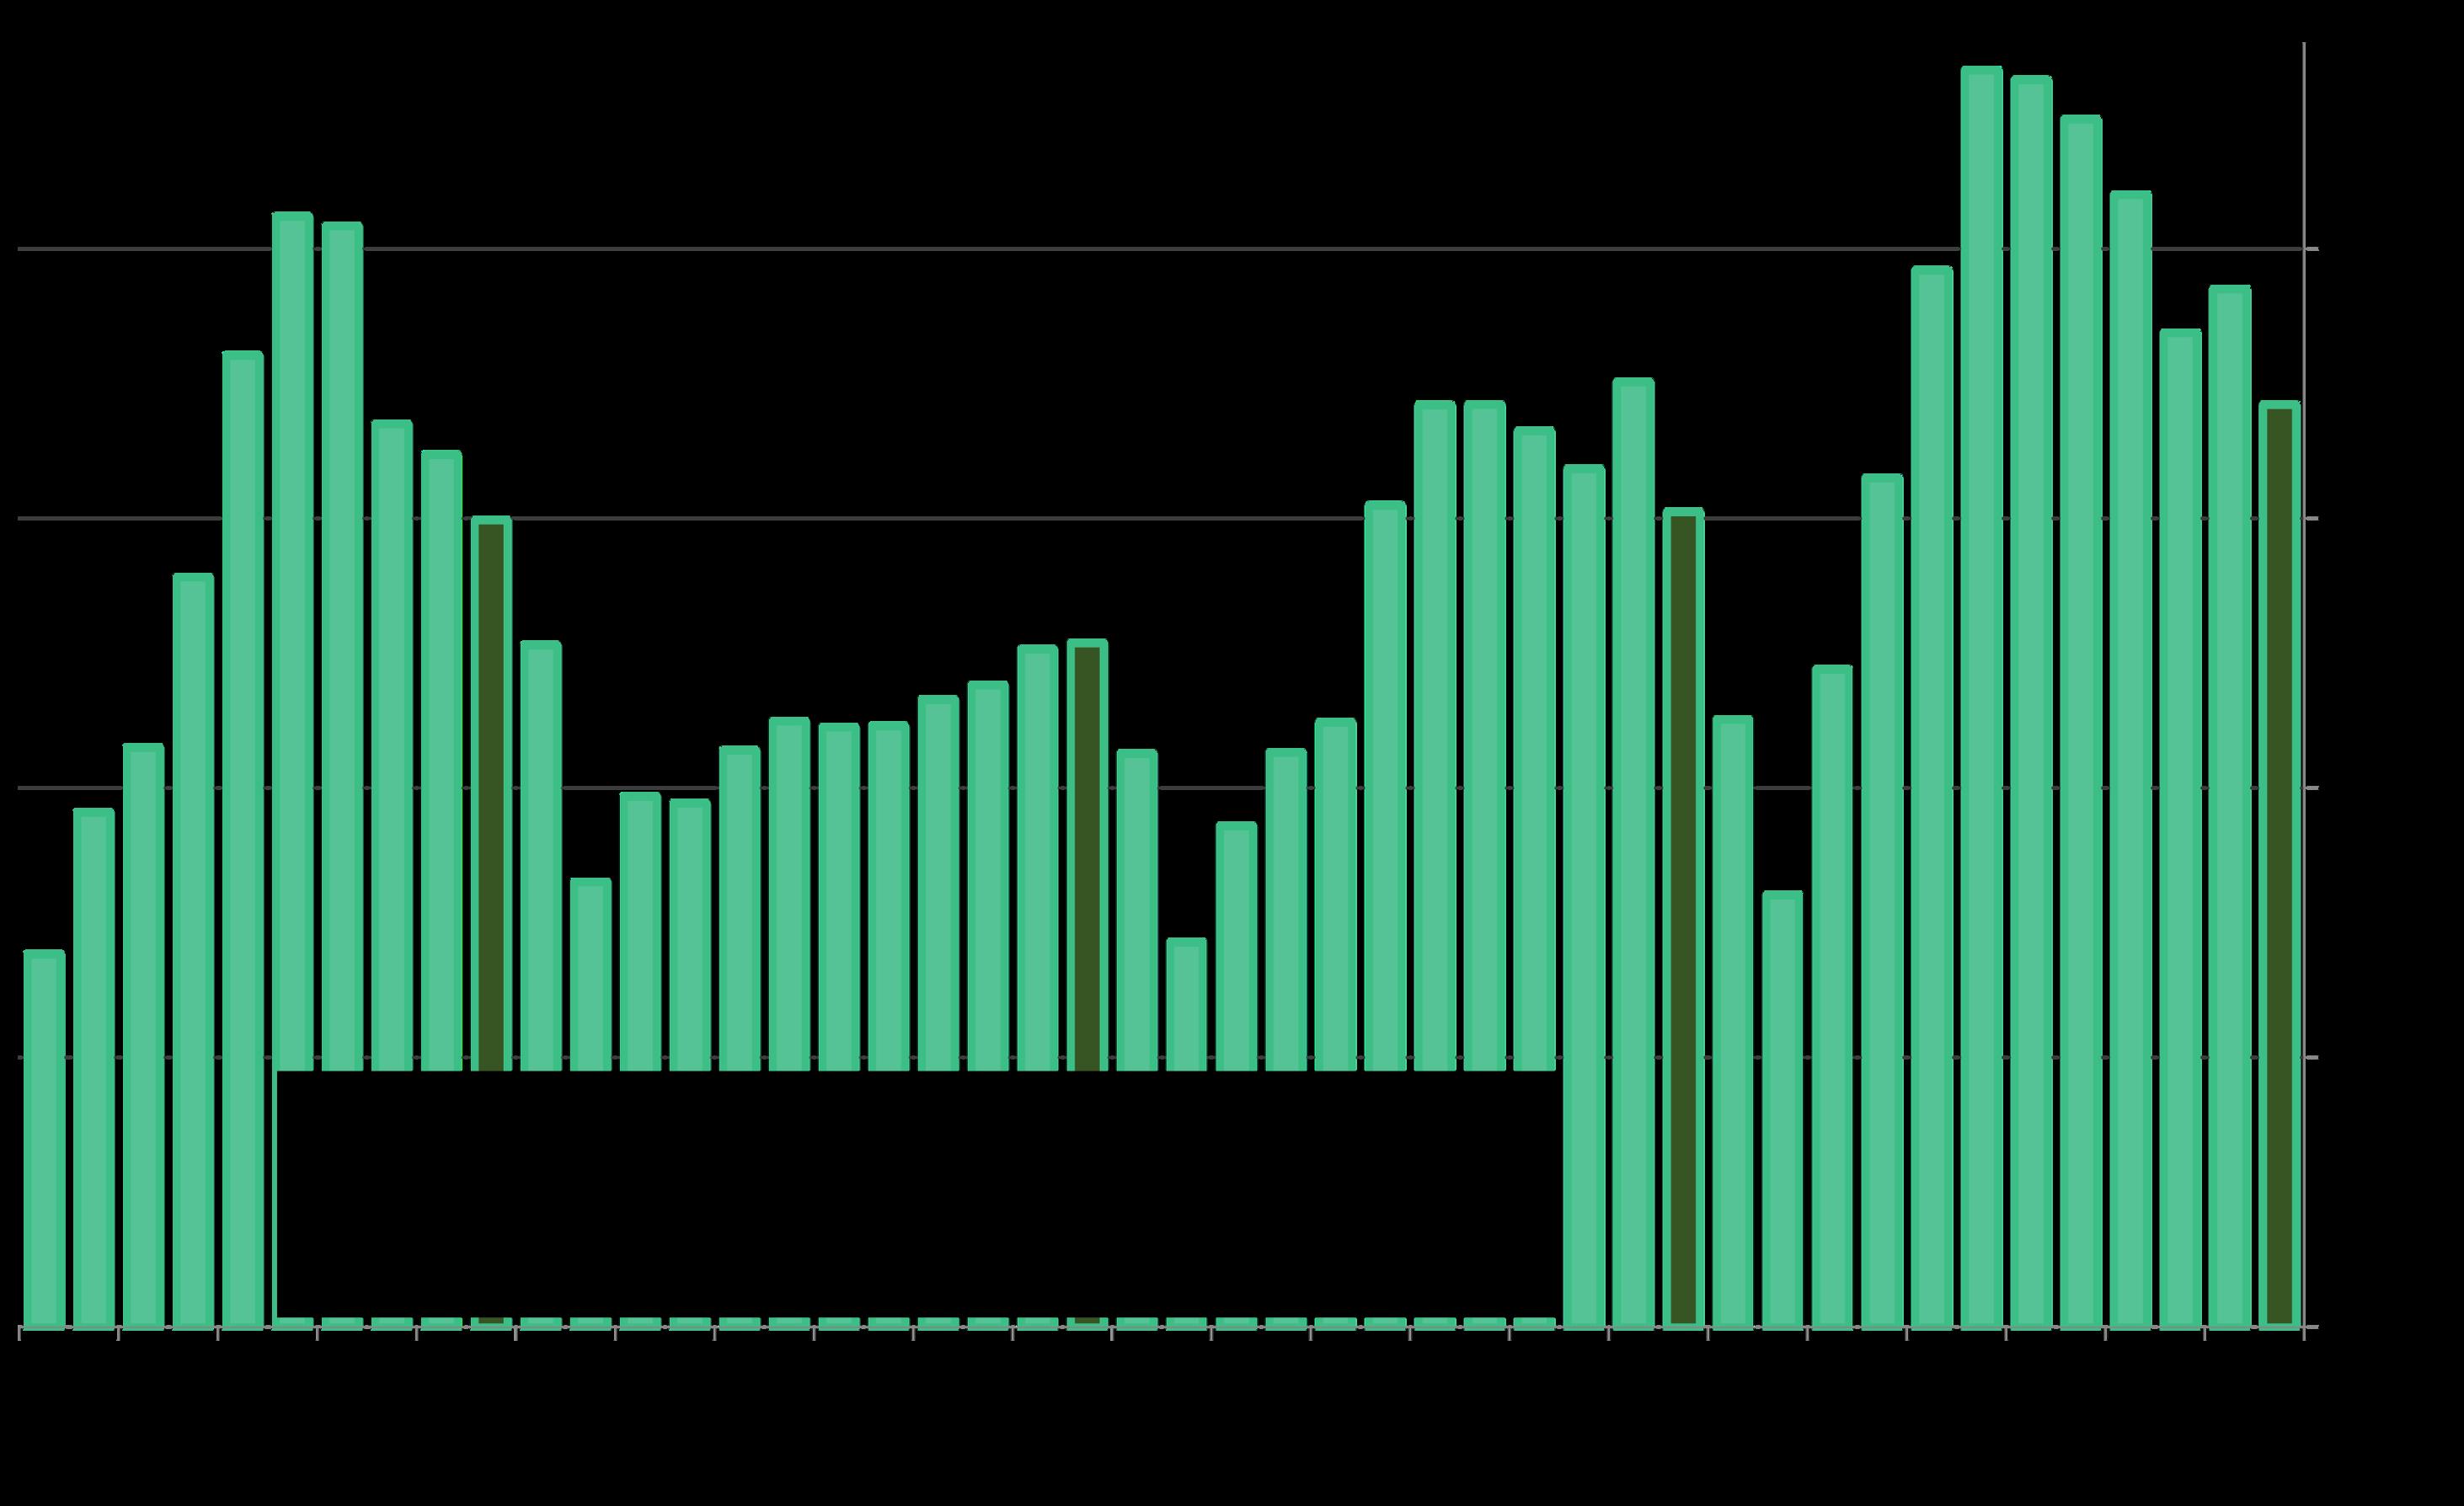
Year over year, the 3-month-rolling median townhouse sales price in October 2025 fell about 4.5%, and the median condo sales price declined about 6.5% year over year.
Median sales price is that price at which half the sales occurred for more and half for less. It is a very general statistic, disguising an enormous range of sales prices in the underlying sales. It is often affected by other factors besides changes in fair market value. Monthly and seasonal fluctuations are common, which explain many of the regular ups and downs in this chart.
*3-month rolling median house sales prices reported to NorCal MLS Alliance, per Infosparks. Analysis may contain errors and subject to revision. All numbers approximate, and may change with late-reported
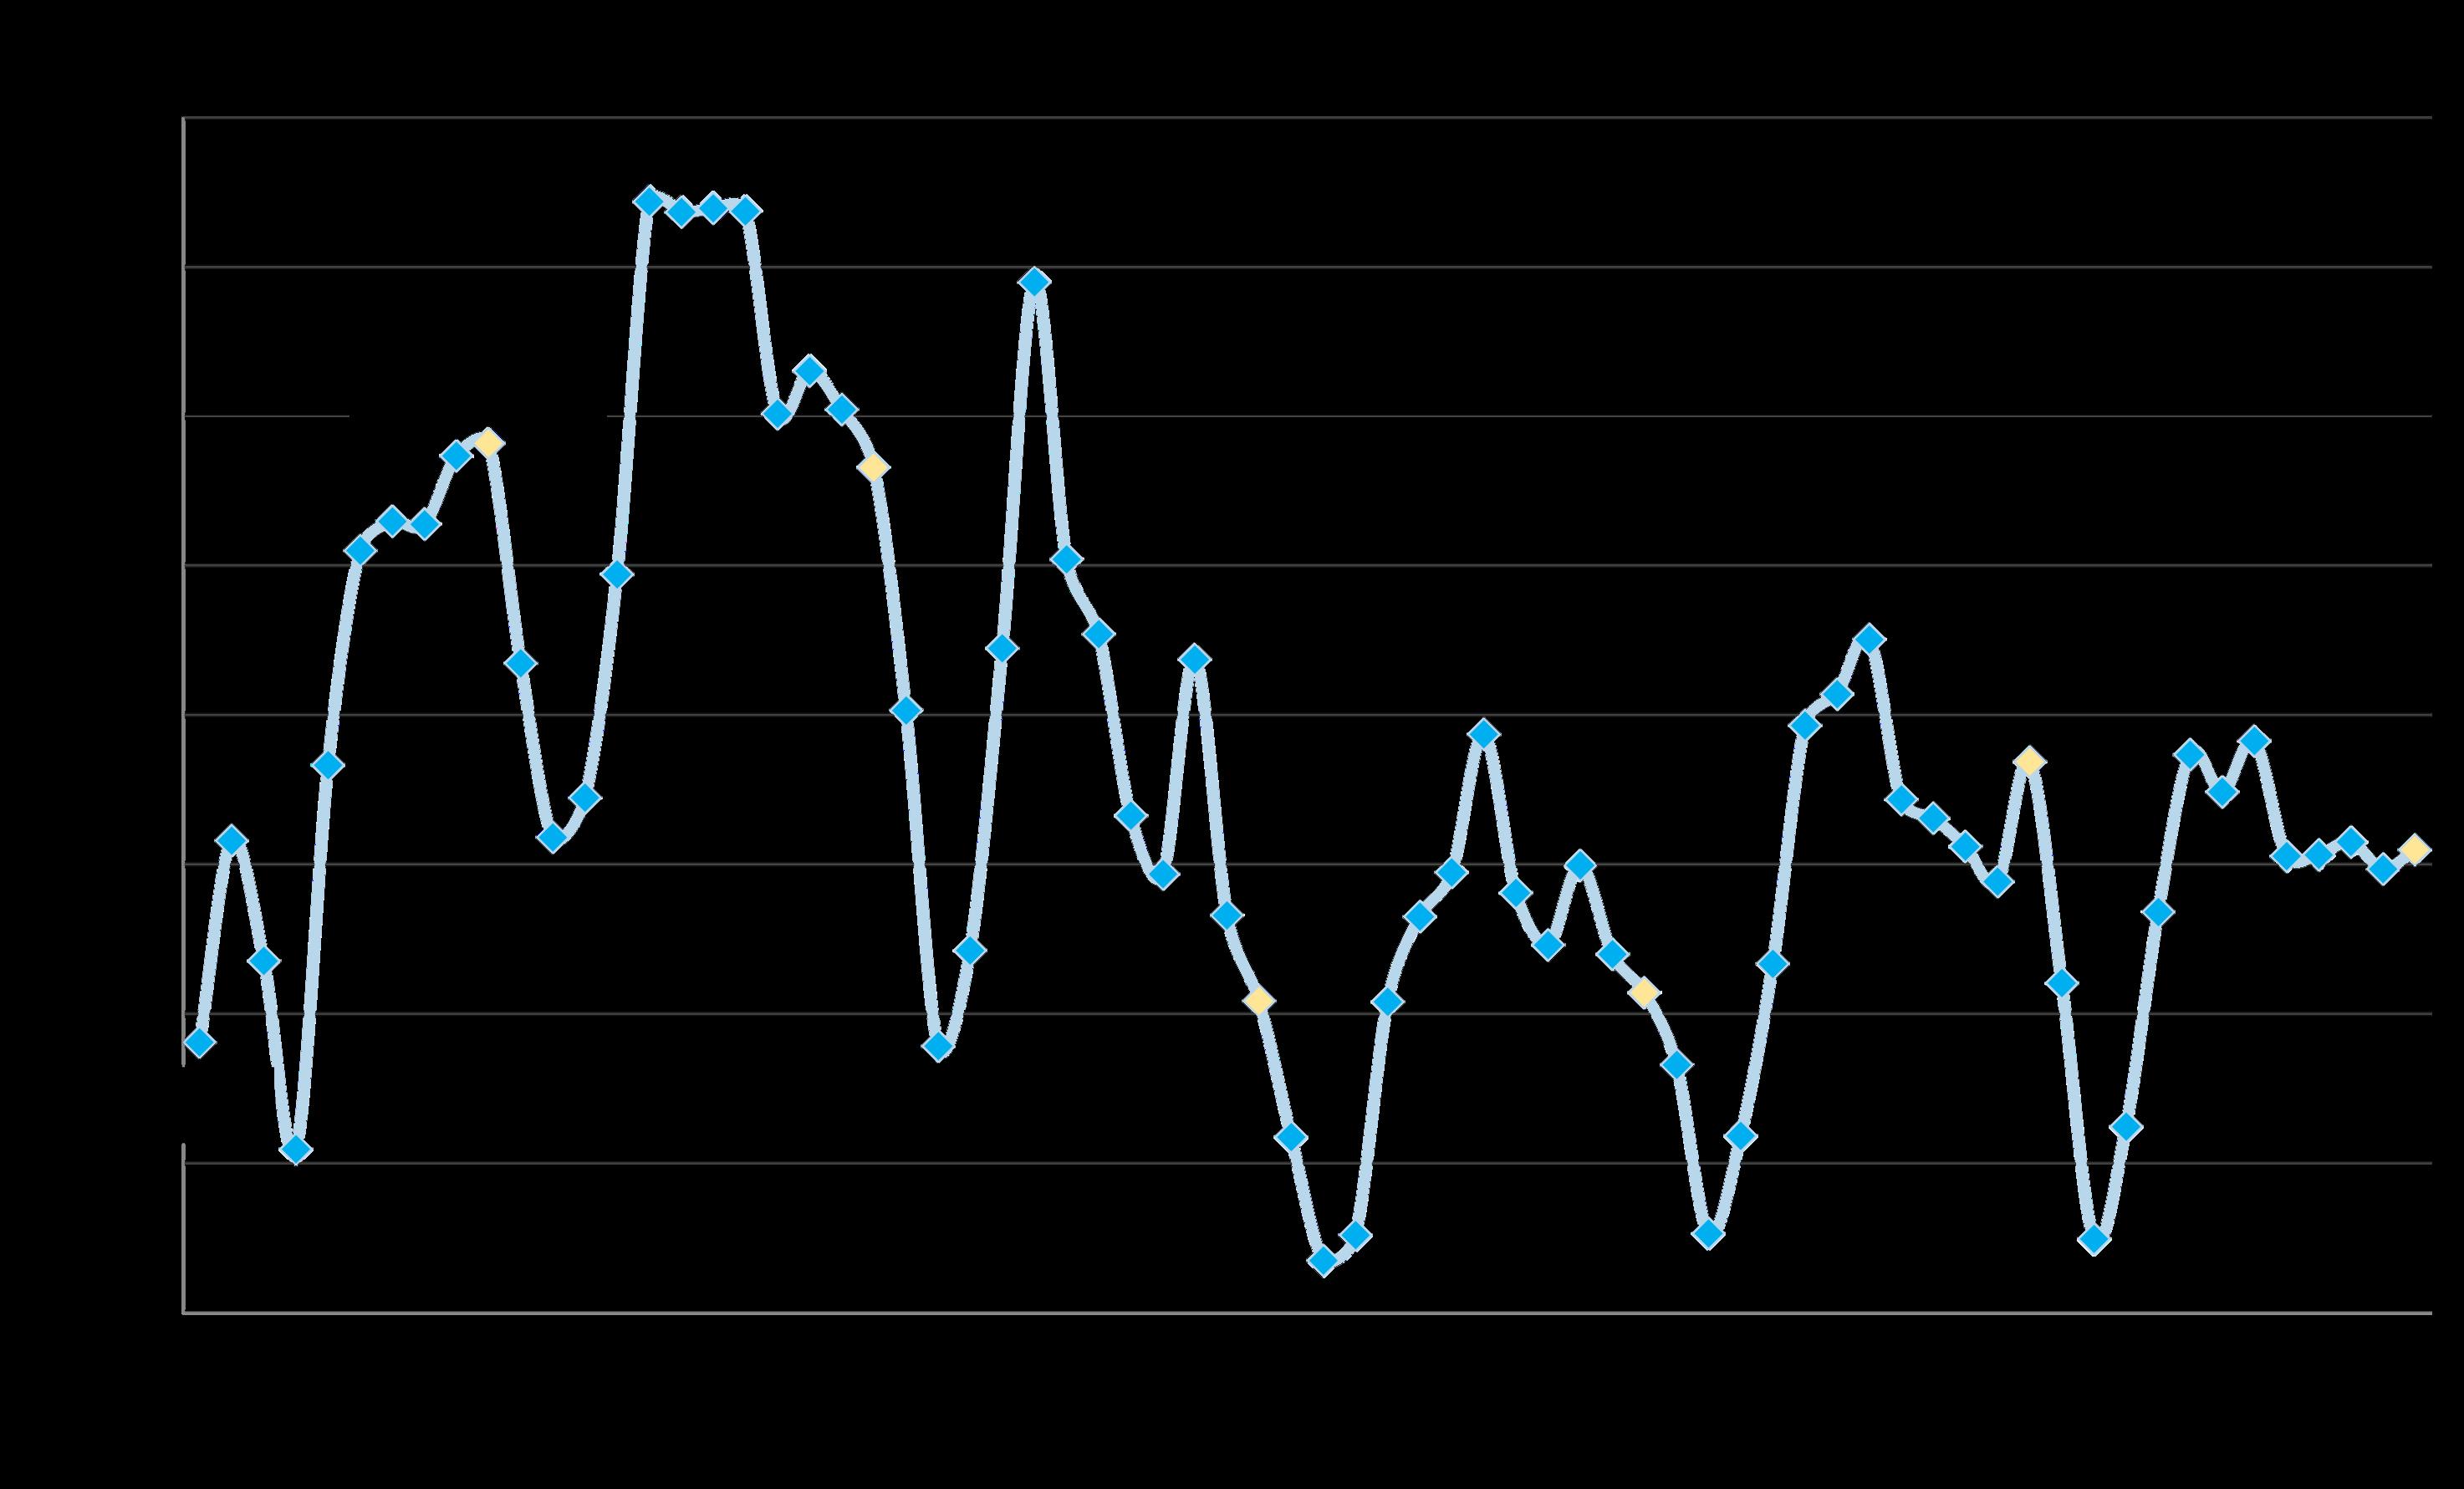
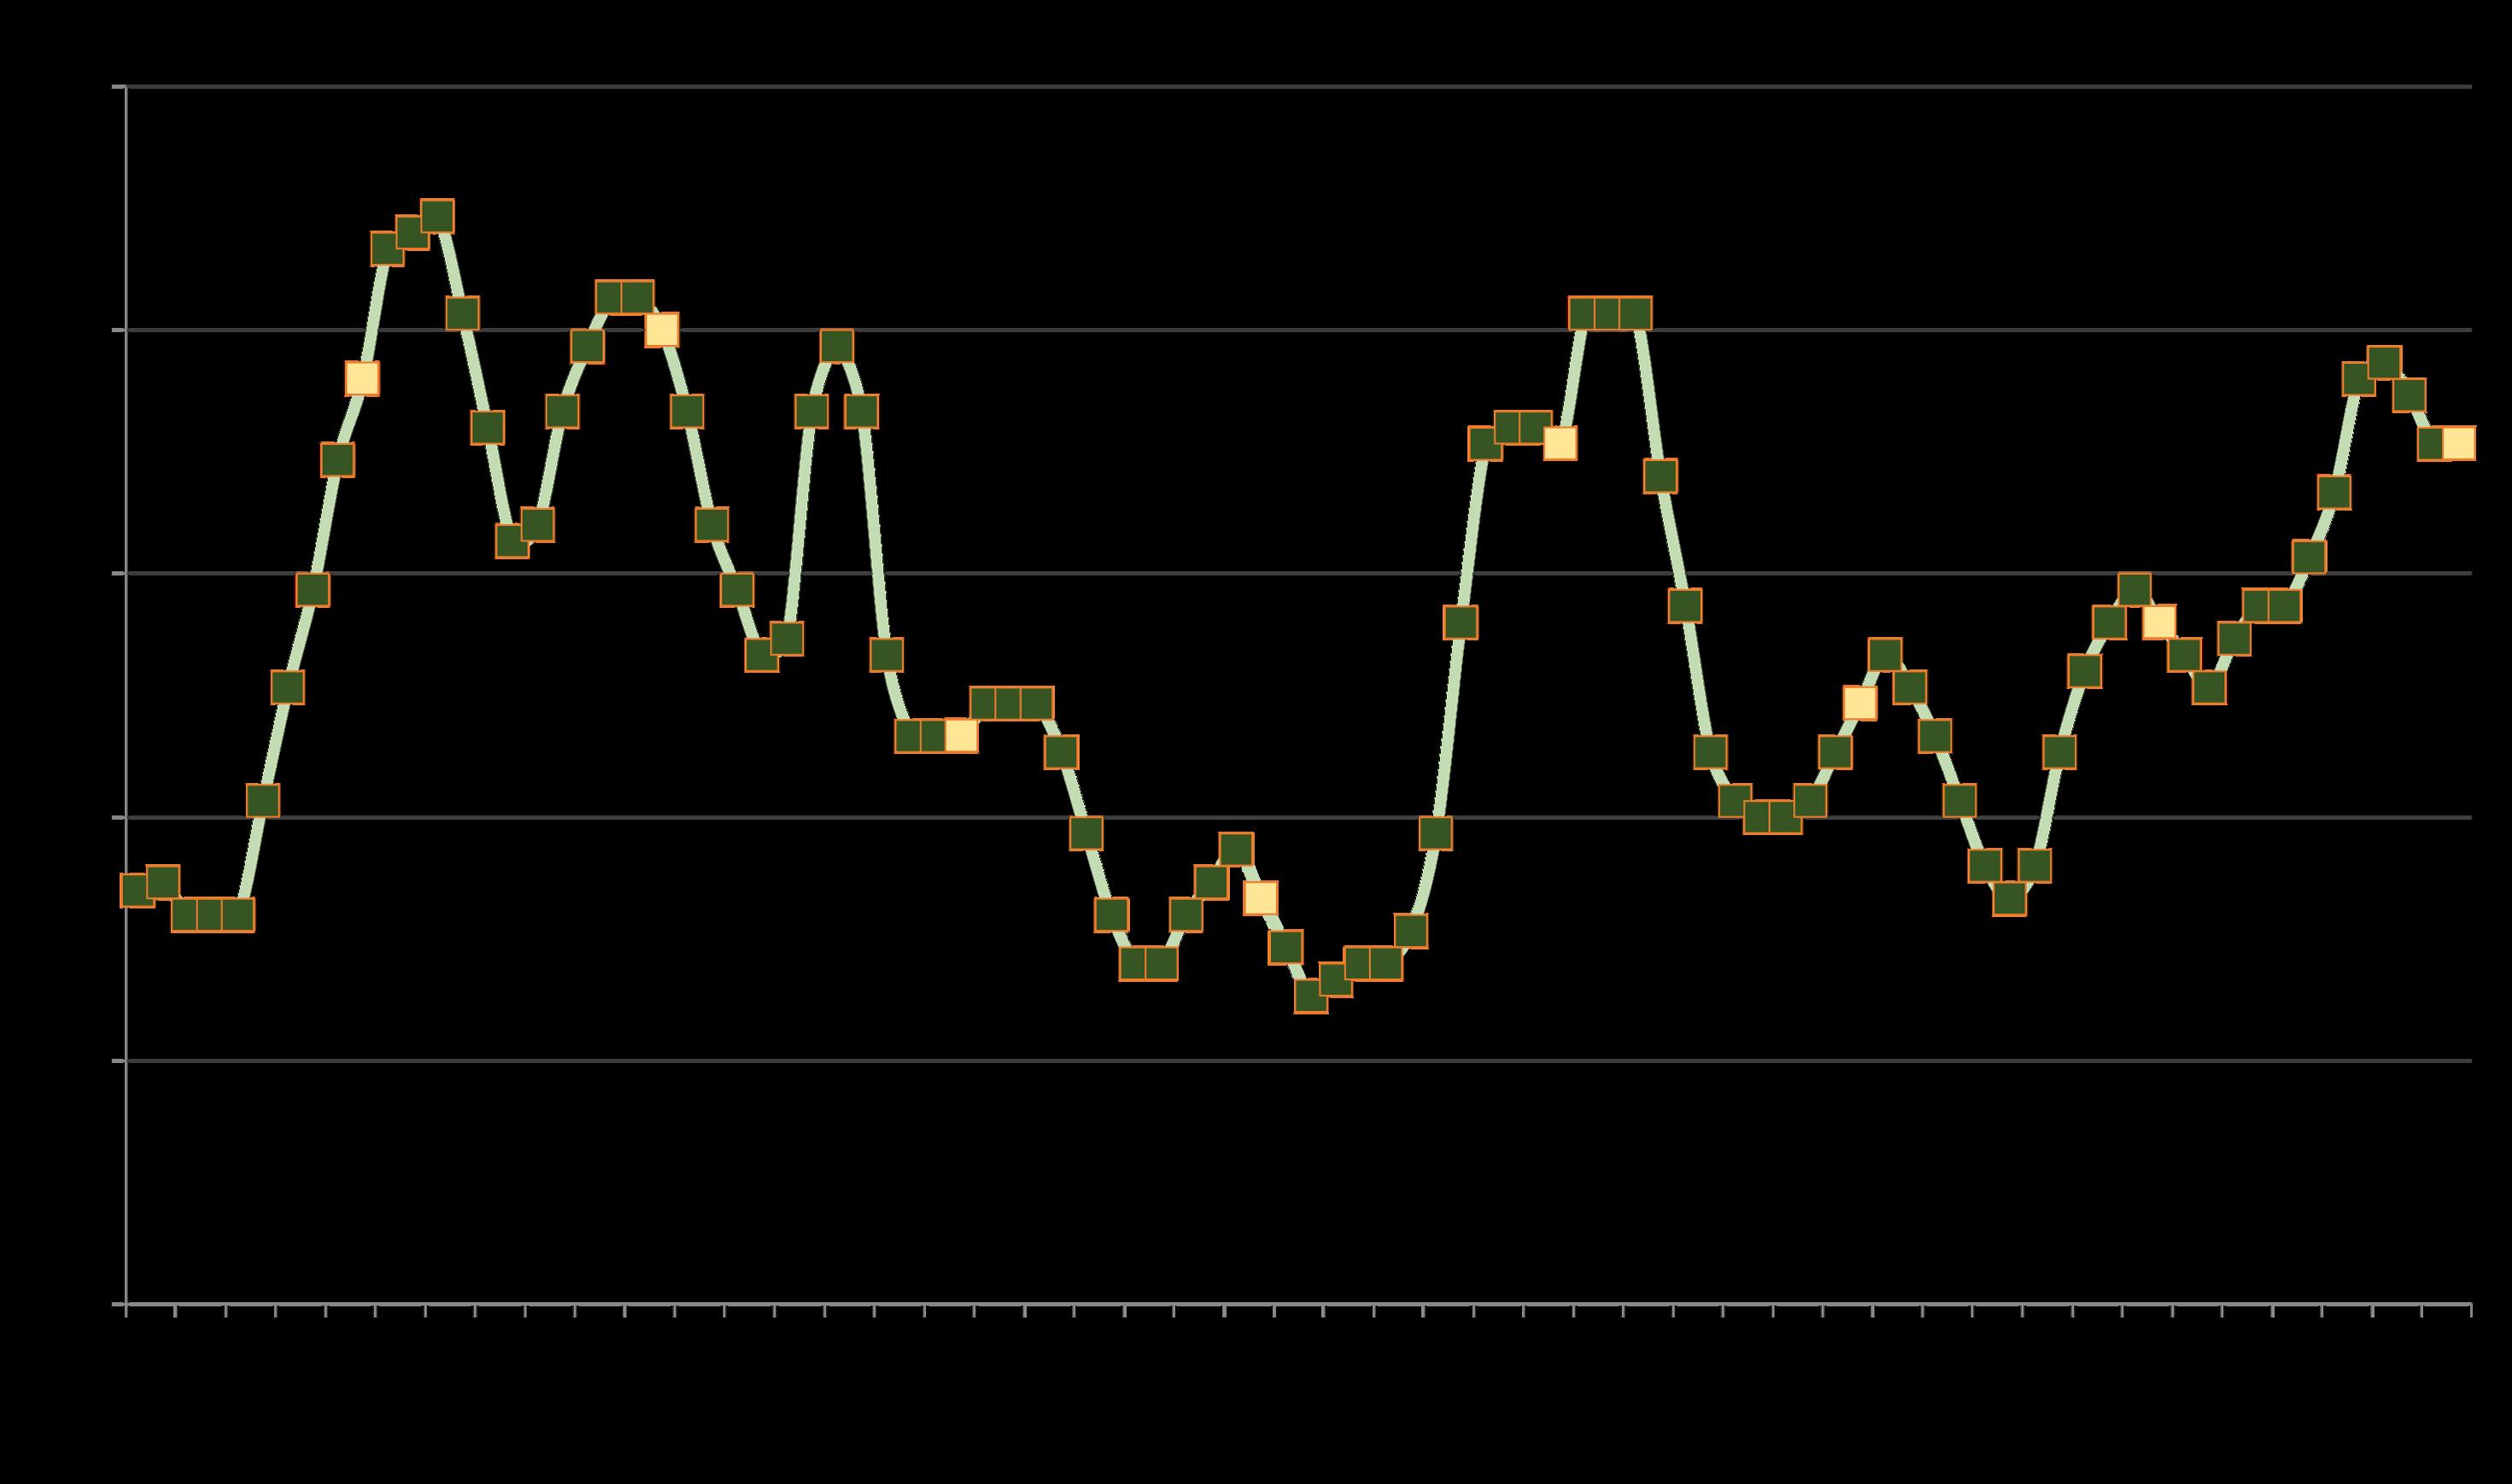
3-MonthRolling,MedianDollarperSquare Foot Values*
Median $/sq.ft. value is a very general statistic, disguising an enormous range of values in the underlying sales. It is often affected by other factors besides changes in fair market value. Monthly and seasonal fluctuations are common, which explain many of the regular ups and downs in this chart. Longer-term trends are much more meaningful than short-term changes.
DOLLAR PER SQUARE FOOT ($/sq.ft.) is based upon interior living space and does not include garages, storage rooms, patios, decks or lot size.
People Moving Within & Into Santa Clara County
Per U.S. Census, 5-Year ACS Data, Single Year Estimates*
Total County Population: 1,899,071
Residents Moving Within County: 166,767
MovingInFromAnotherCACounty: 46,752
Mostly from Bay Area counties or greater Los Angeles region
Moving In From Another State: 30,260
Moving In From Abroad: 27,985
Largest Sources of Out-of-State Migration into County *
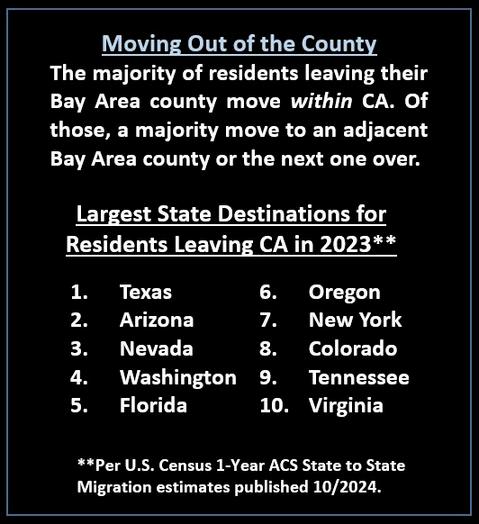
Moving Out of the County
The majorityofresidents leaving their Bay Area county move within CA. Of those, a majority move to an adjacent Bay Area county or the next one over.
Largest State Destinations for Residents Leaving CA in 2022**
**Per U.S. Census 1-Year ACS State to State Migration estimates published 10/19/23.
Significant 2-way traffic between counties and states is common. Movers can be homeowners, tenants, university students, etc.
Census data is published with a 23 year time lag. This is the latest data available as of October 2025.
*Data per U.S. Census, 5-Year American Community Survey 2018-2022 estimates, published 09/2025: “State to County Migration Flows.” All numbers approximate with significant margins of error. Data published with 2-3 year time lag, may contain errors and subject to revision.
Santa Clara County Residential Market
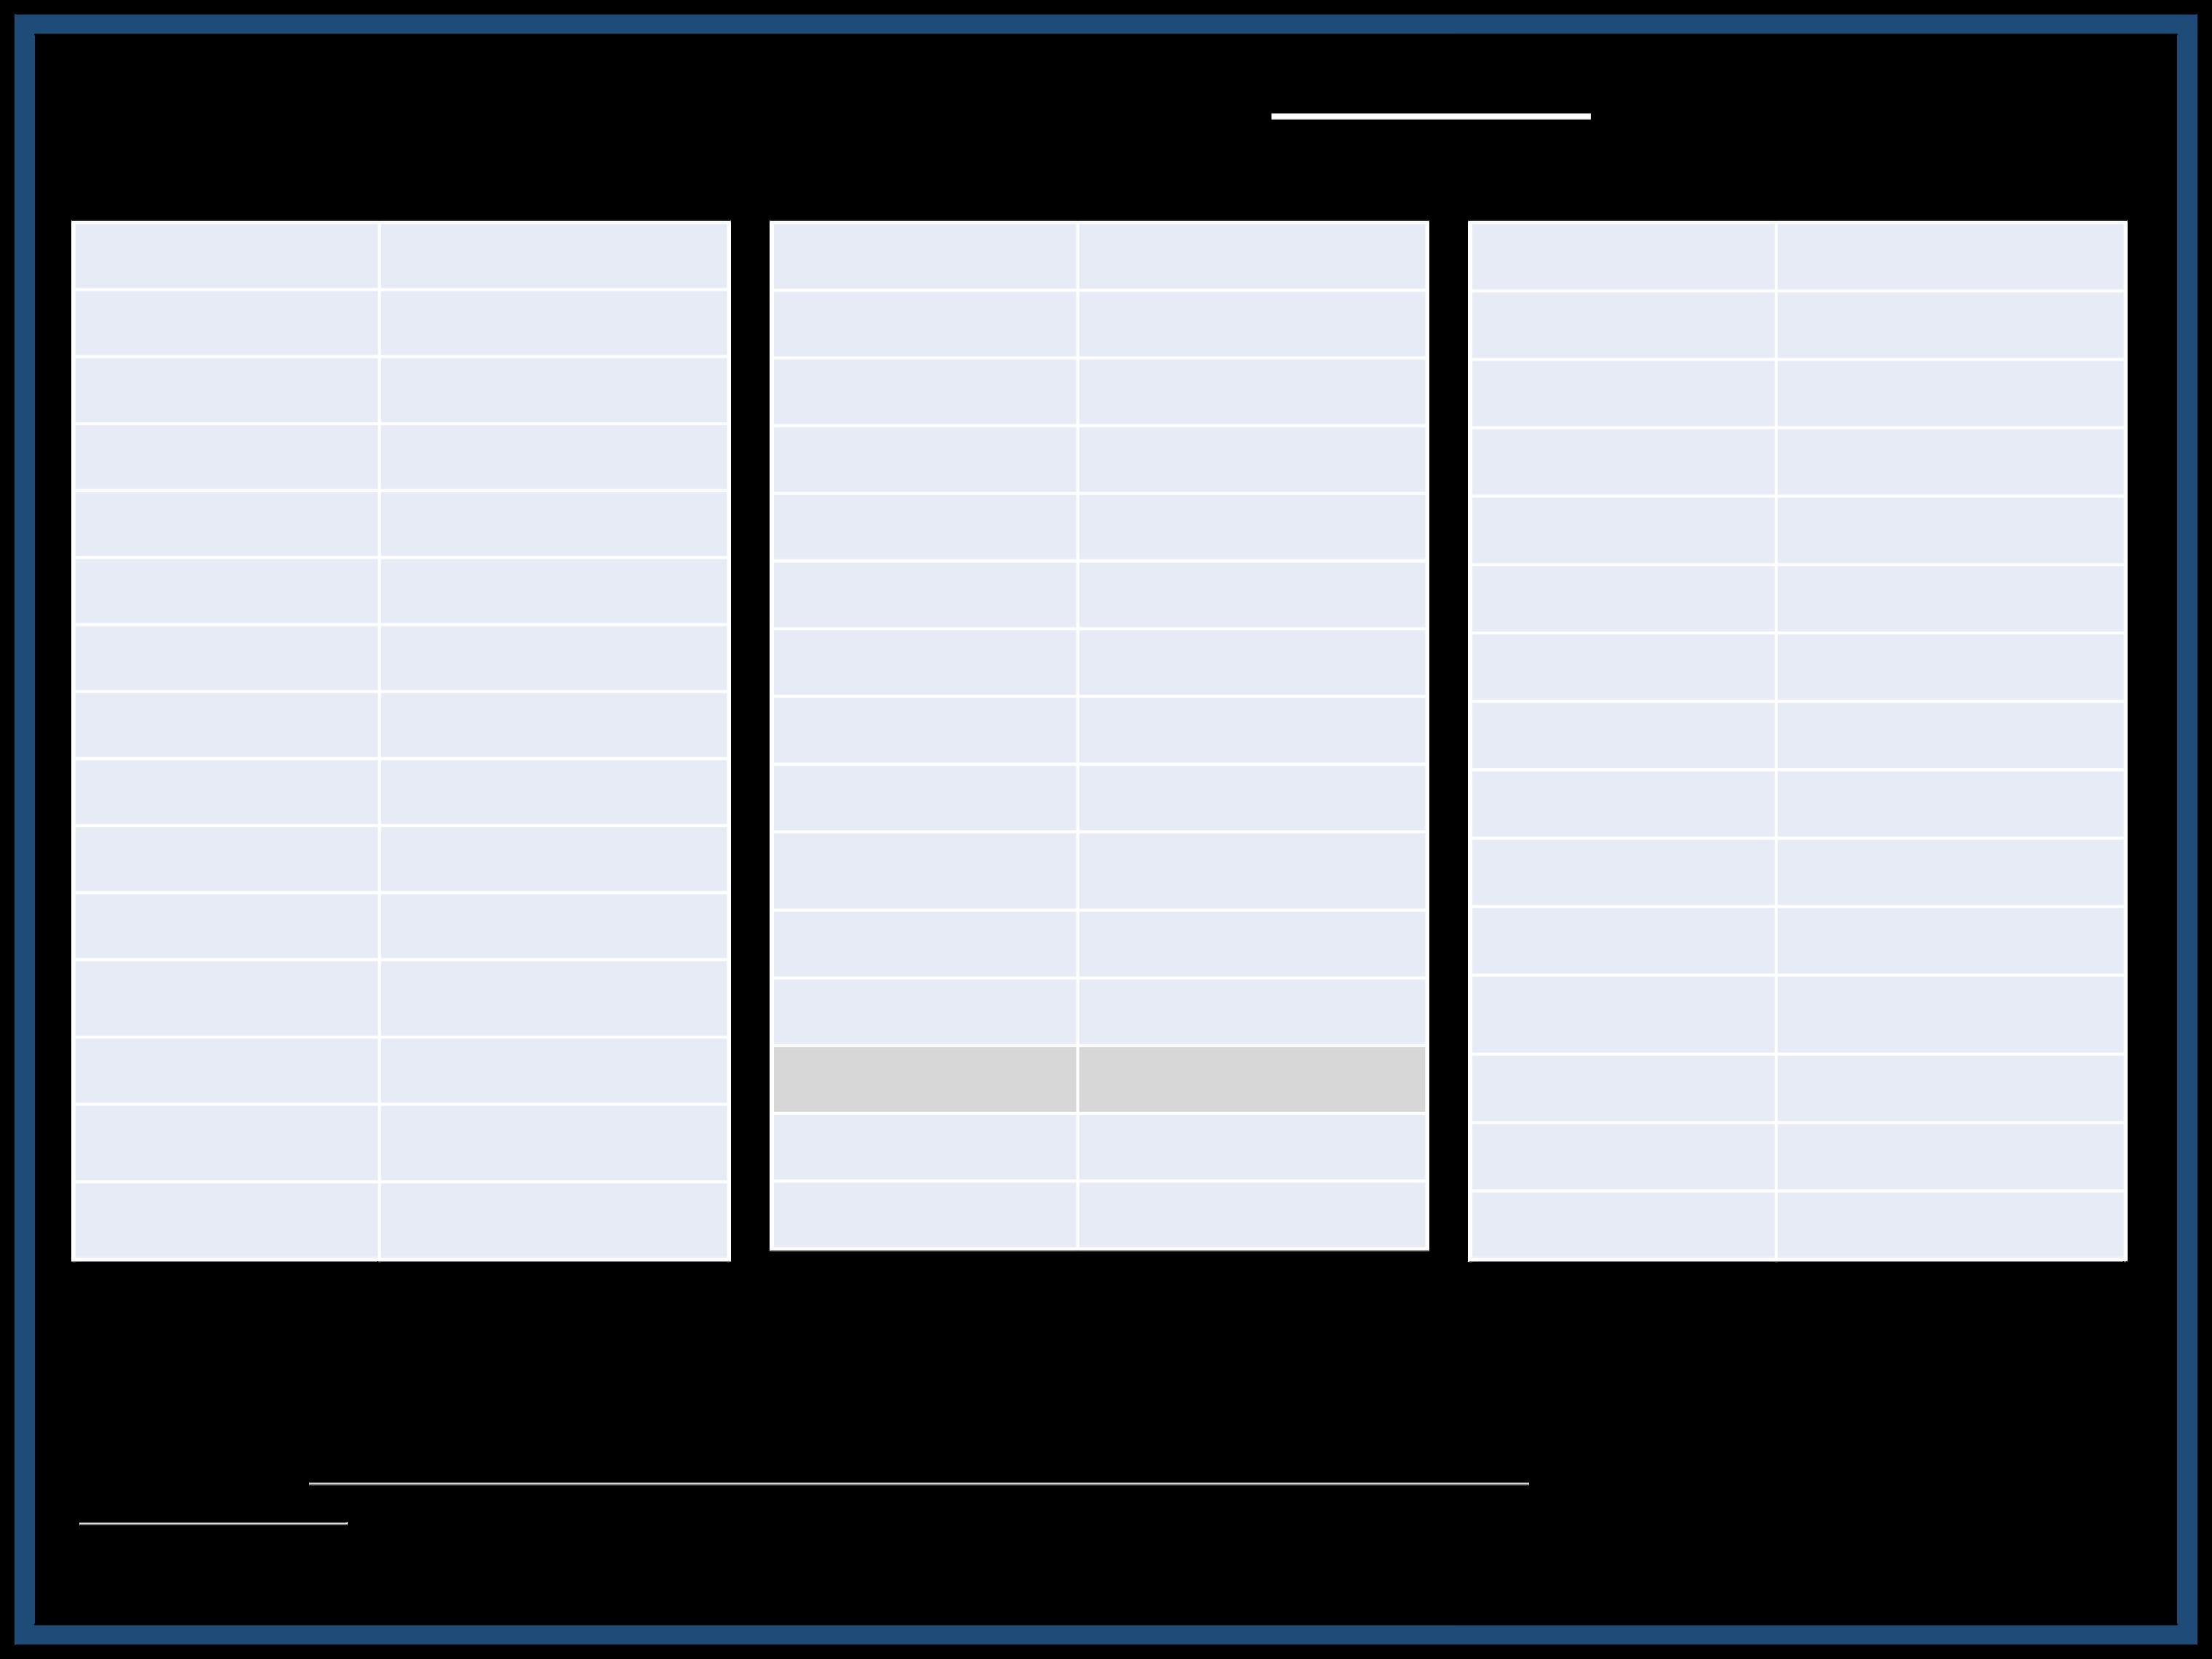
ComparativeMarketDynamicsbyPriceSegment/Property Type
Under
$1,000,000
$1,000,000
$7,500,000$9,999,999
$10 Million+
Market indicators can change dramatically from period to period, due to both economic conditions and seasonal trends.
Houses
Condos
Townhouses
*Active/Coming-Soon Listings & Listings in Contract posted to MLS as of 10/31/25. **Sales statistics per last 12 months of sales, i.e. the annualized rate of activity. ***Months Supply of Inventory measures approx. time required to sell listings for sale at estimated annualized rate of sale: Lower readings signify higher demand compared to supply. Market activity typically ebbs and flows to seasonal trends.
Data reportedto NorCal MLS Allianceand Infosparks,may containerrors andsubject to revision. Notall activityis reported to MLS. All numbers approximate. Statistics based on annualized activity may not apply to current conditions and can be distorted by outlier data (especially in low sales volume segments). Numbers change constantly.
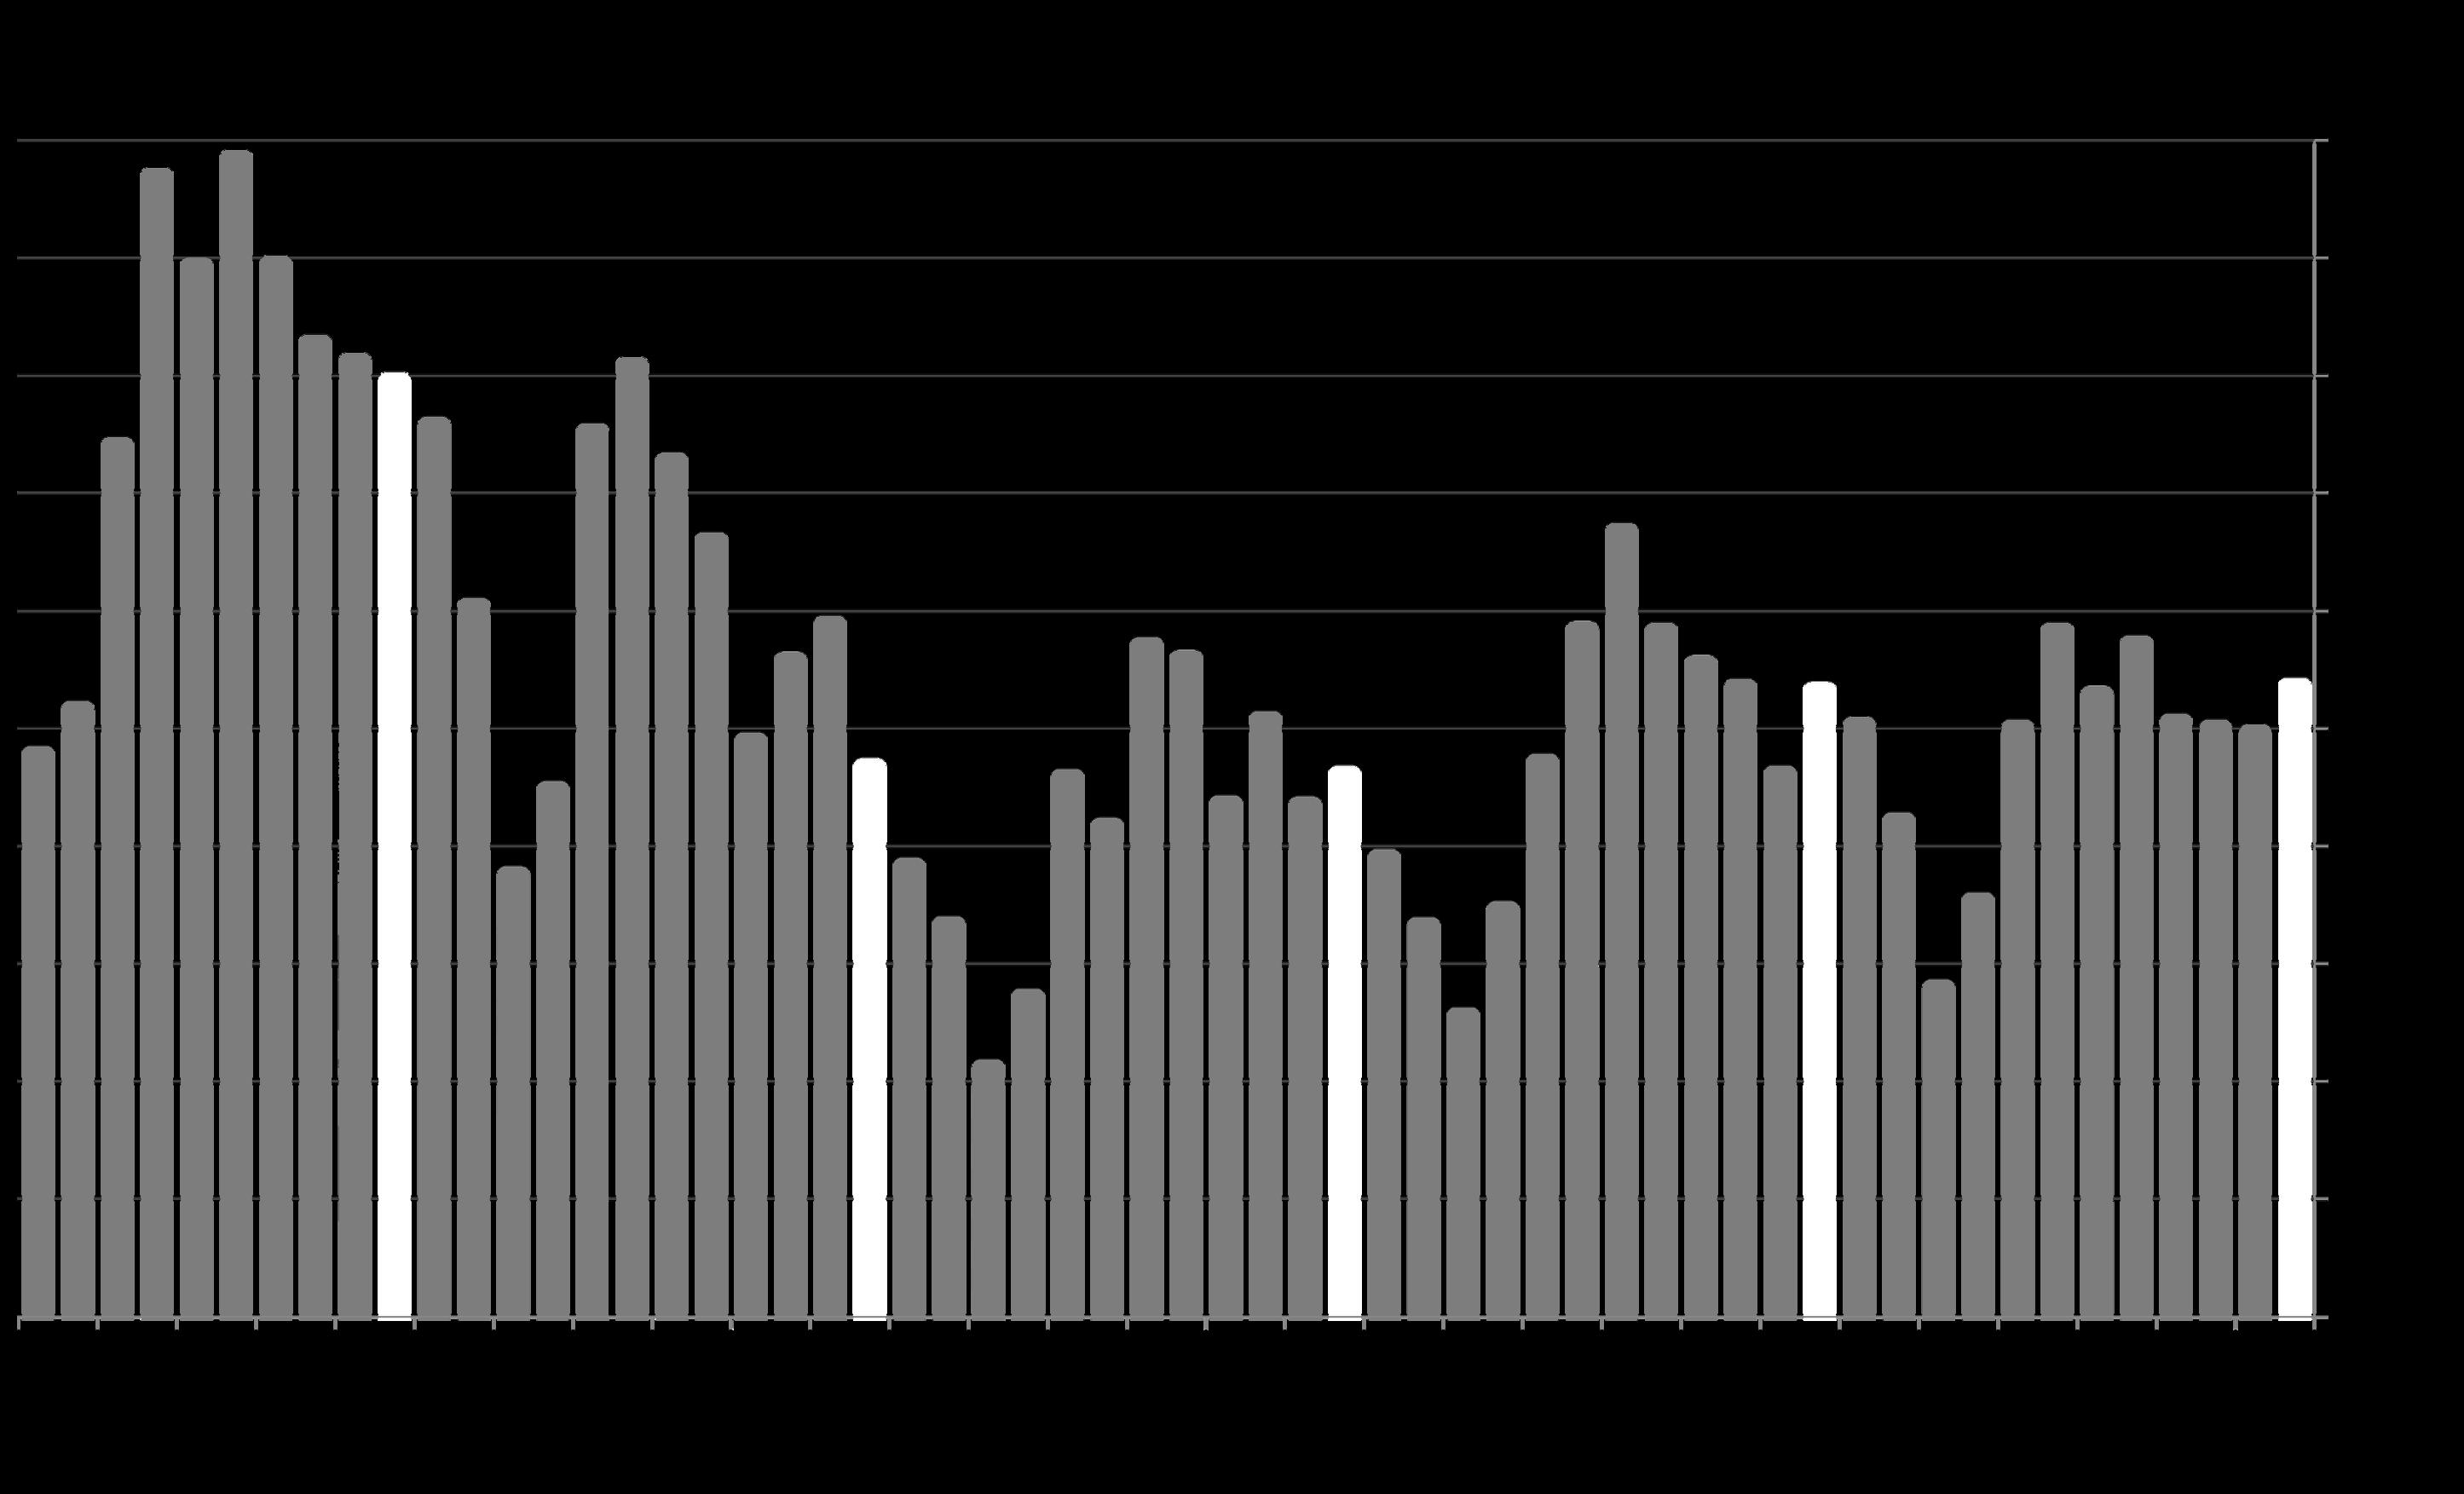
New Listings Coming on Market
Santa Clara County Market Dynamics & Seasonality
The number of new listings coming on market ebbs and flows by seasonal trends, though it can be affected by specific market dynamics.
The number of new listings in October 2025 fell back from September (the usual seasonal trend), but also dropped 6.5% year over year. Per Realtor.com Research: https://www.realtor.com/research/data/, listings posted on site. Data from sources deemed reliable, but may contain errors and subject to revision. May not include “coming-soon” listings. All numbers approximate.
Santa Clara County Homes Market
On 11/1/25, the number of l istings for sale
declined from the previous month but was up 13% year over year. 57% of listings were houses, 29% condos, and 14% townhouses. Inventory can be expected to plummet in coming months.*
The # of active listings on a given day is affected by 1) the # of new listings coming on market, 2) how quickly buyers put them into contract, 3) the sustained heat of the market over time, and 4) sellers pulling their homes off the market without selling.
2/1/23
* Active/Coming-Soon listings posted to NorCal MLS Alliance. Data from sources deemed reliable, but may contain errors and subject to revision. Not all listings are posted to MLS. All numbers approximate. The number of active listings constantly changes.
Pending Ratio
The pending ratio is the ratio of the pending
The pending ratio is a version of absorption rate: The higher the percentage, the greater the demand as compared to the supply of listings available to buy.
The pending ratio in October 2025, 59%, ticked up from September to hit its highest reading in 6 months – but was slightly down year over year. The county had the highest pending ratio in the Bay Area.
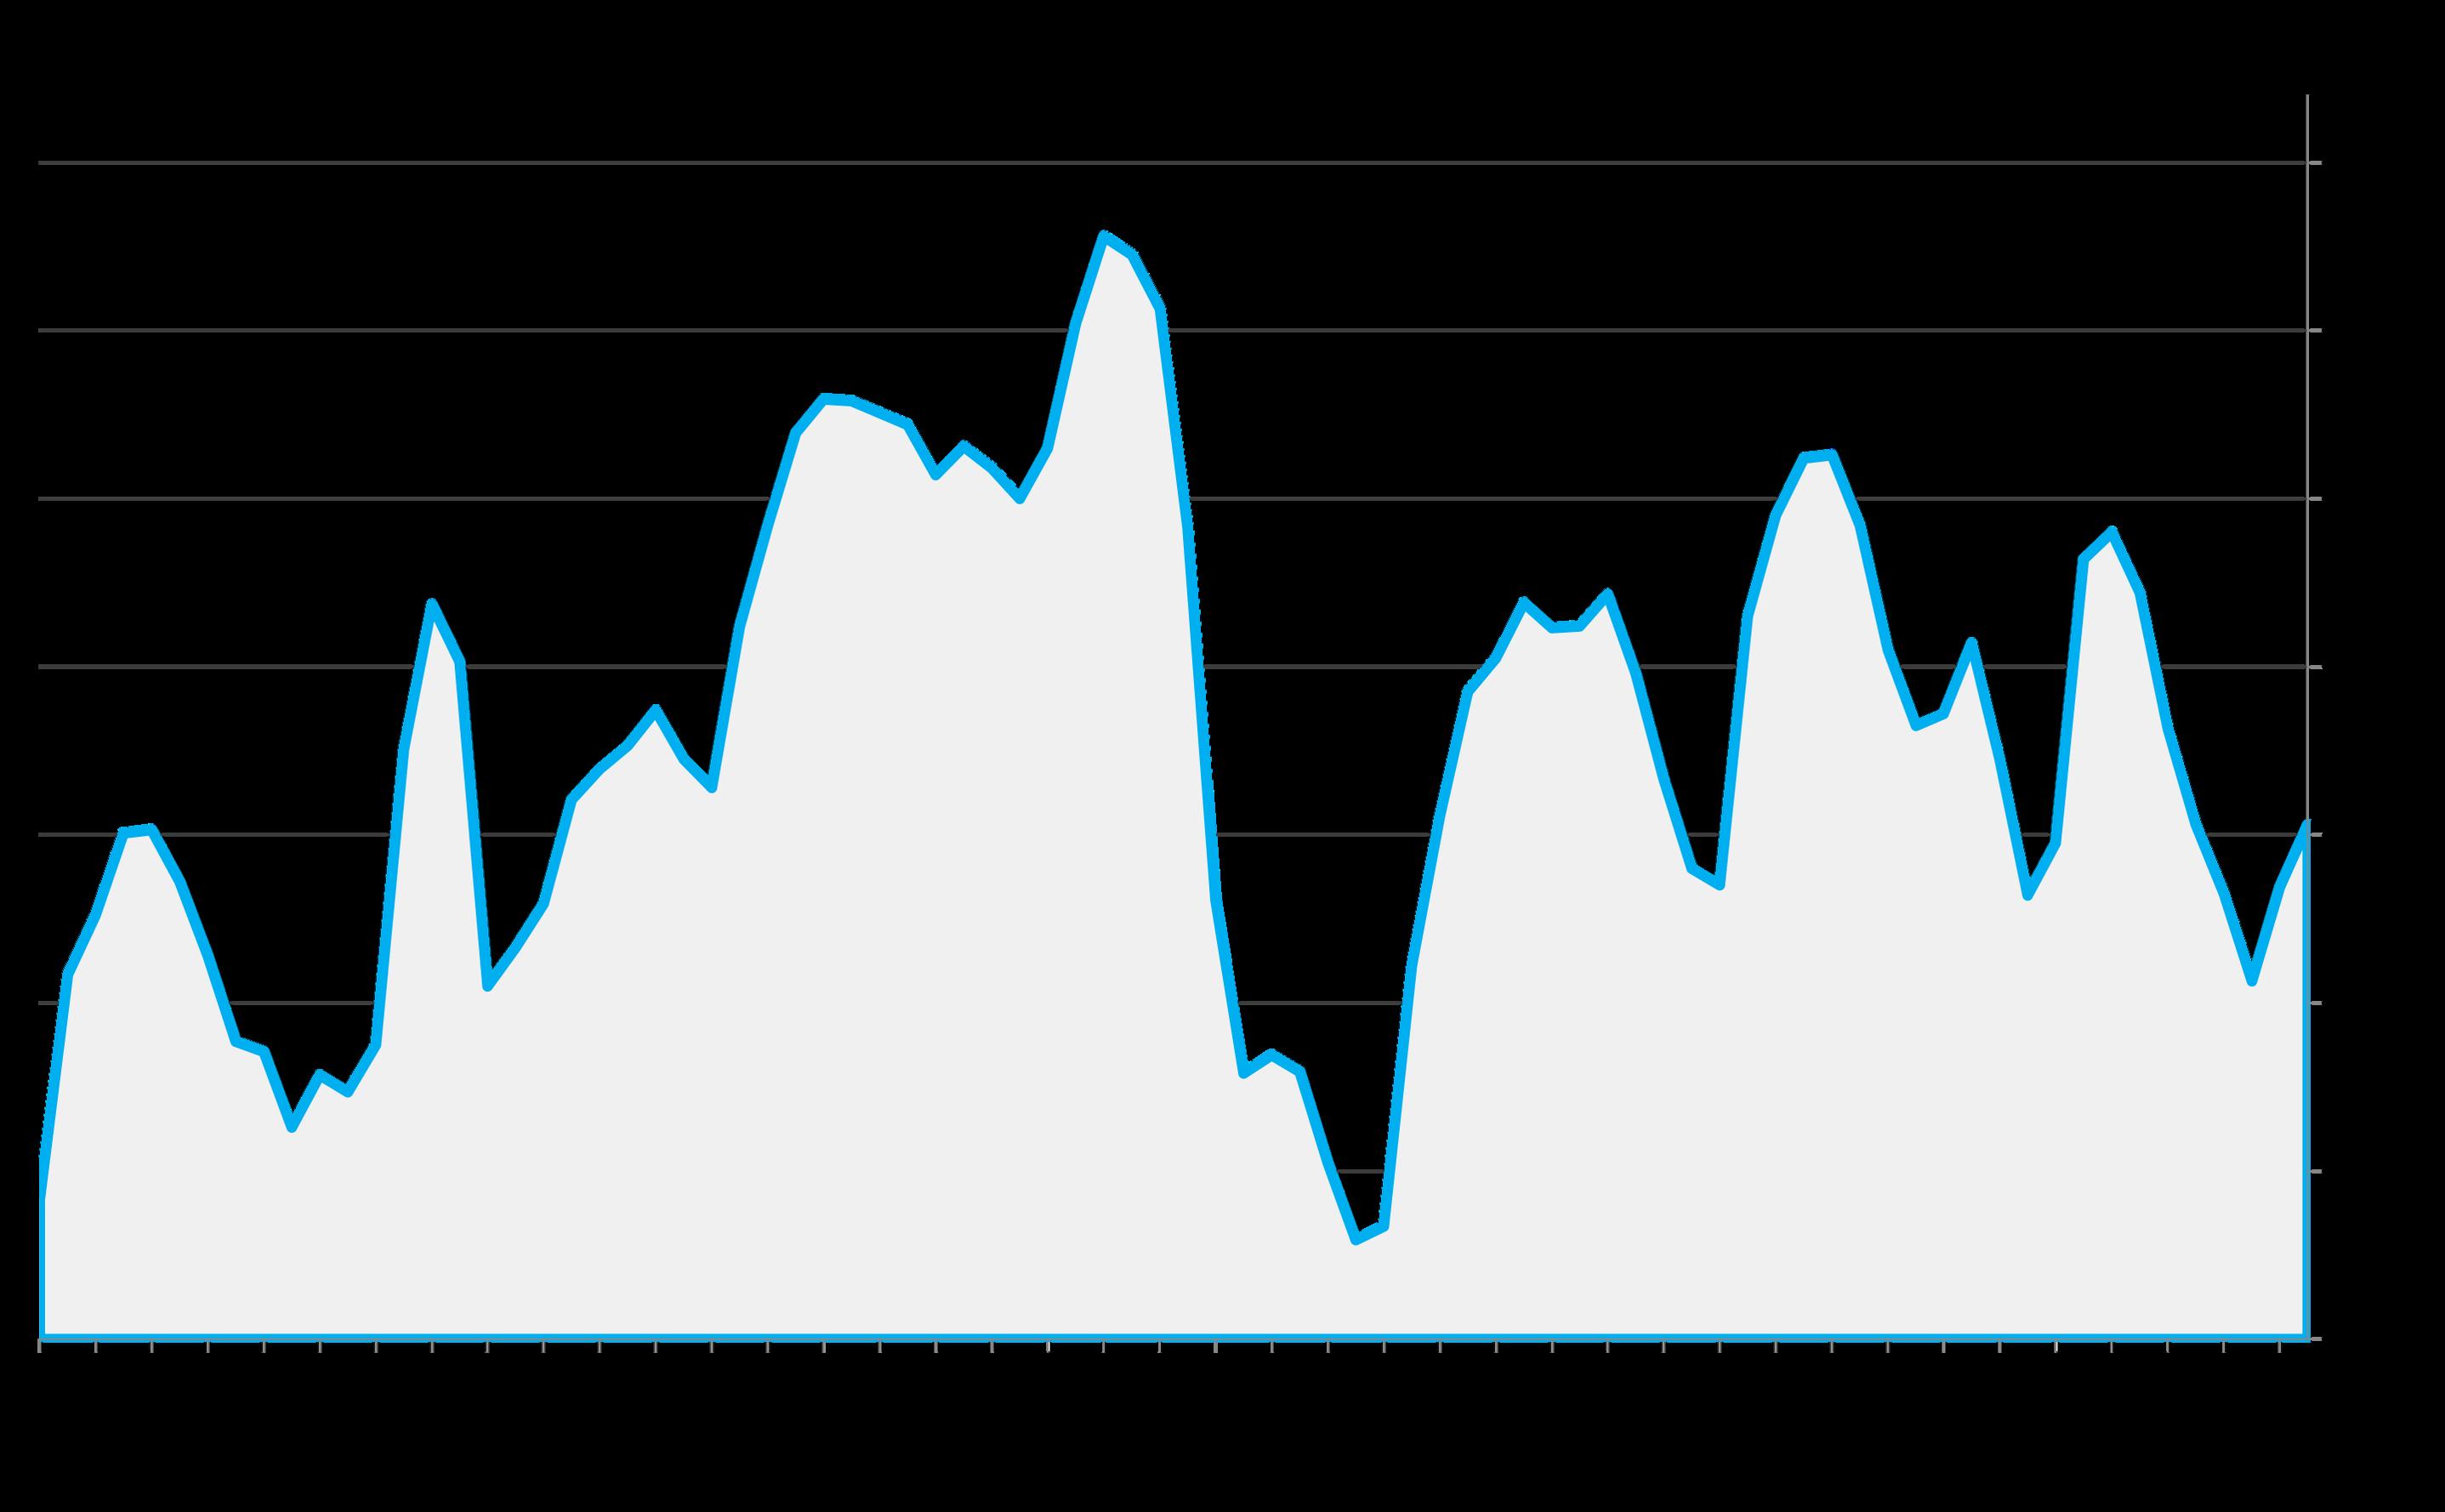
Months Supply of Inventory (MSI) – of Active Listings on Market
Santa Clara County Real Estate Market since 2018, 3-Month Rolling Average
ThelowertheMSI,thestrongerthe buyer demand as compared tothe supplyof listings on the market.Bylongterm, national norms, the current MSI reading indicates a very low supply of active listings, though it is generally running higher than readings in the past 2 years.
3-month rolling average monthly data for residential transactions reported to MLSLISTINGS, perBroker Metrics.Datafromsources deemedreliable, butmaycontainerrorsandsubjectto revision. All numbers approximate, and may change with late-reported activity.
Sales in one month mostly reflect accepted offers in the previous month. The number of sales in October 2025 ticked up from September, but was essentially unchanged from October 2024. Year-to-date sales are down about 2.5% from the same period of 2024.
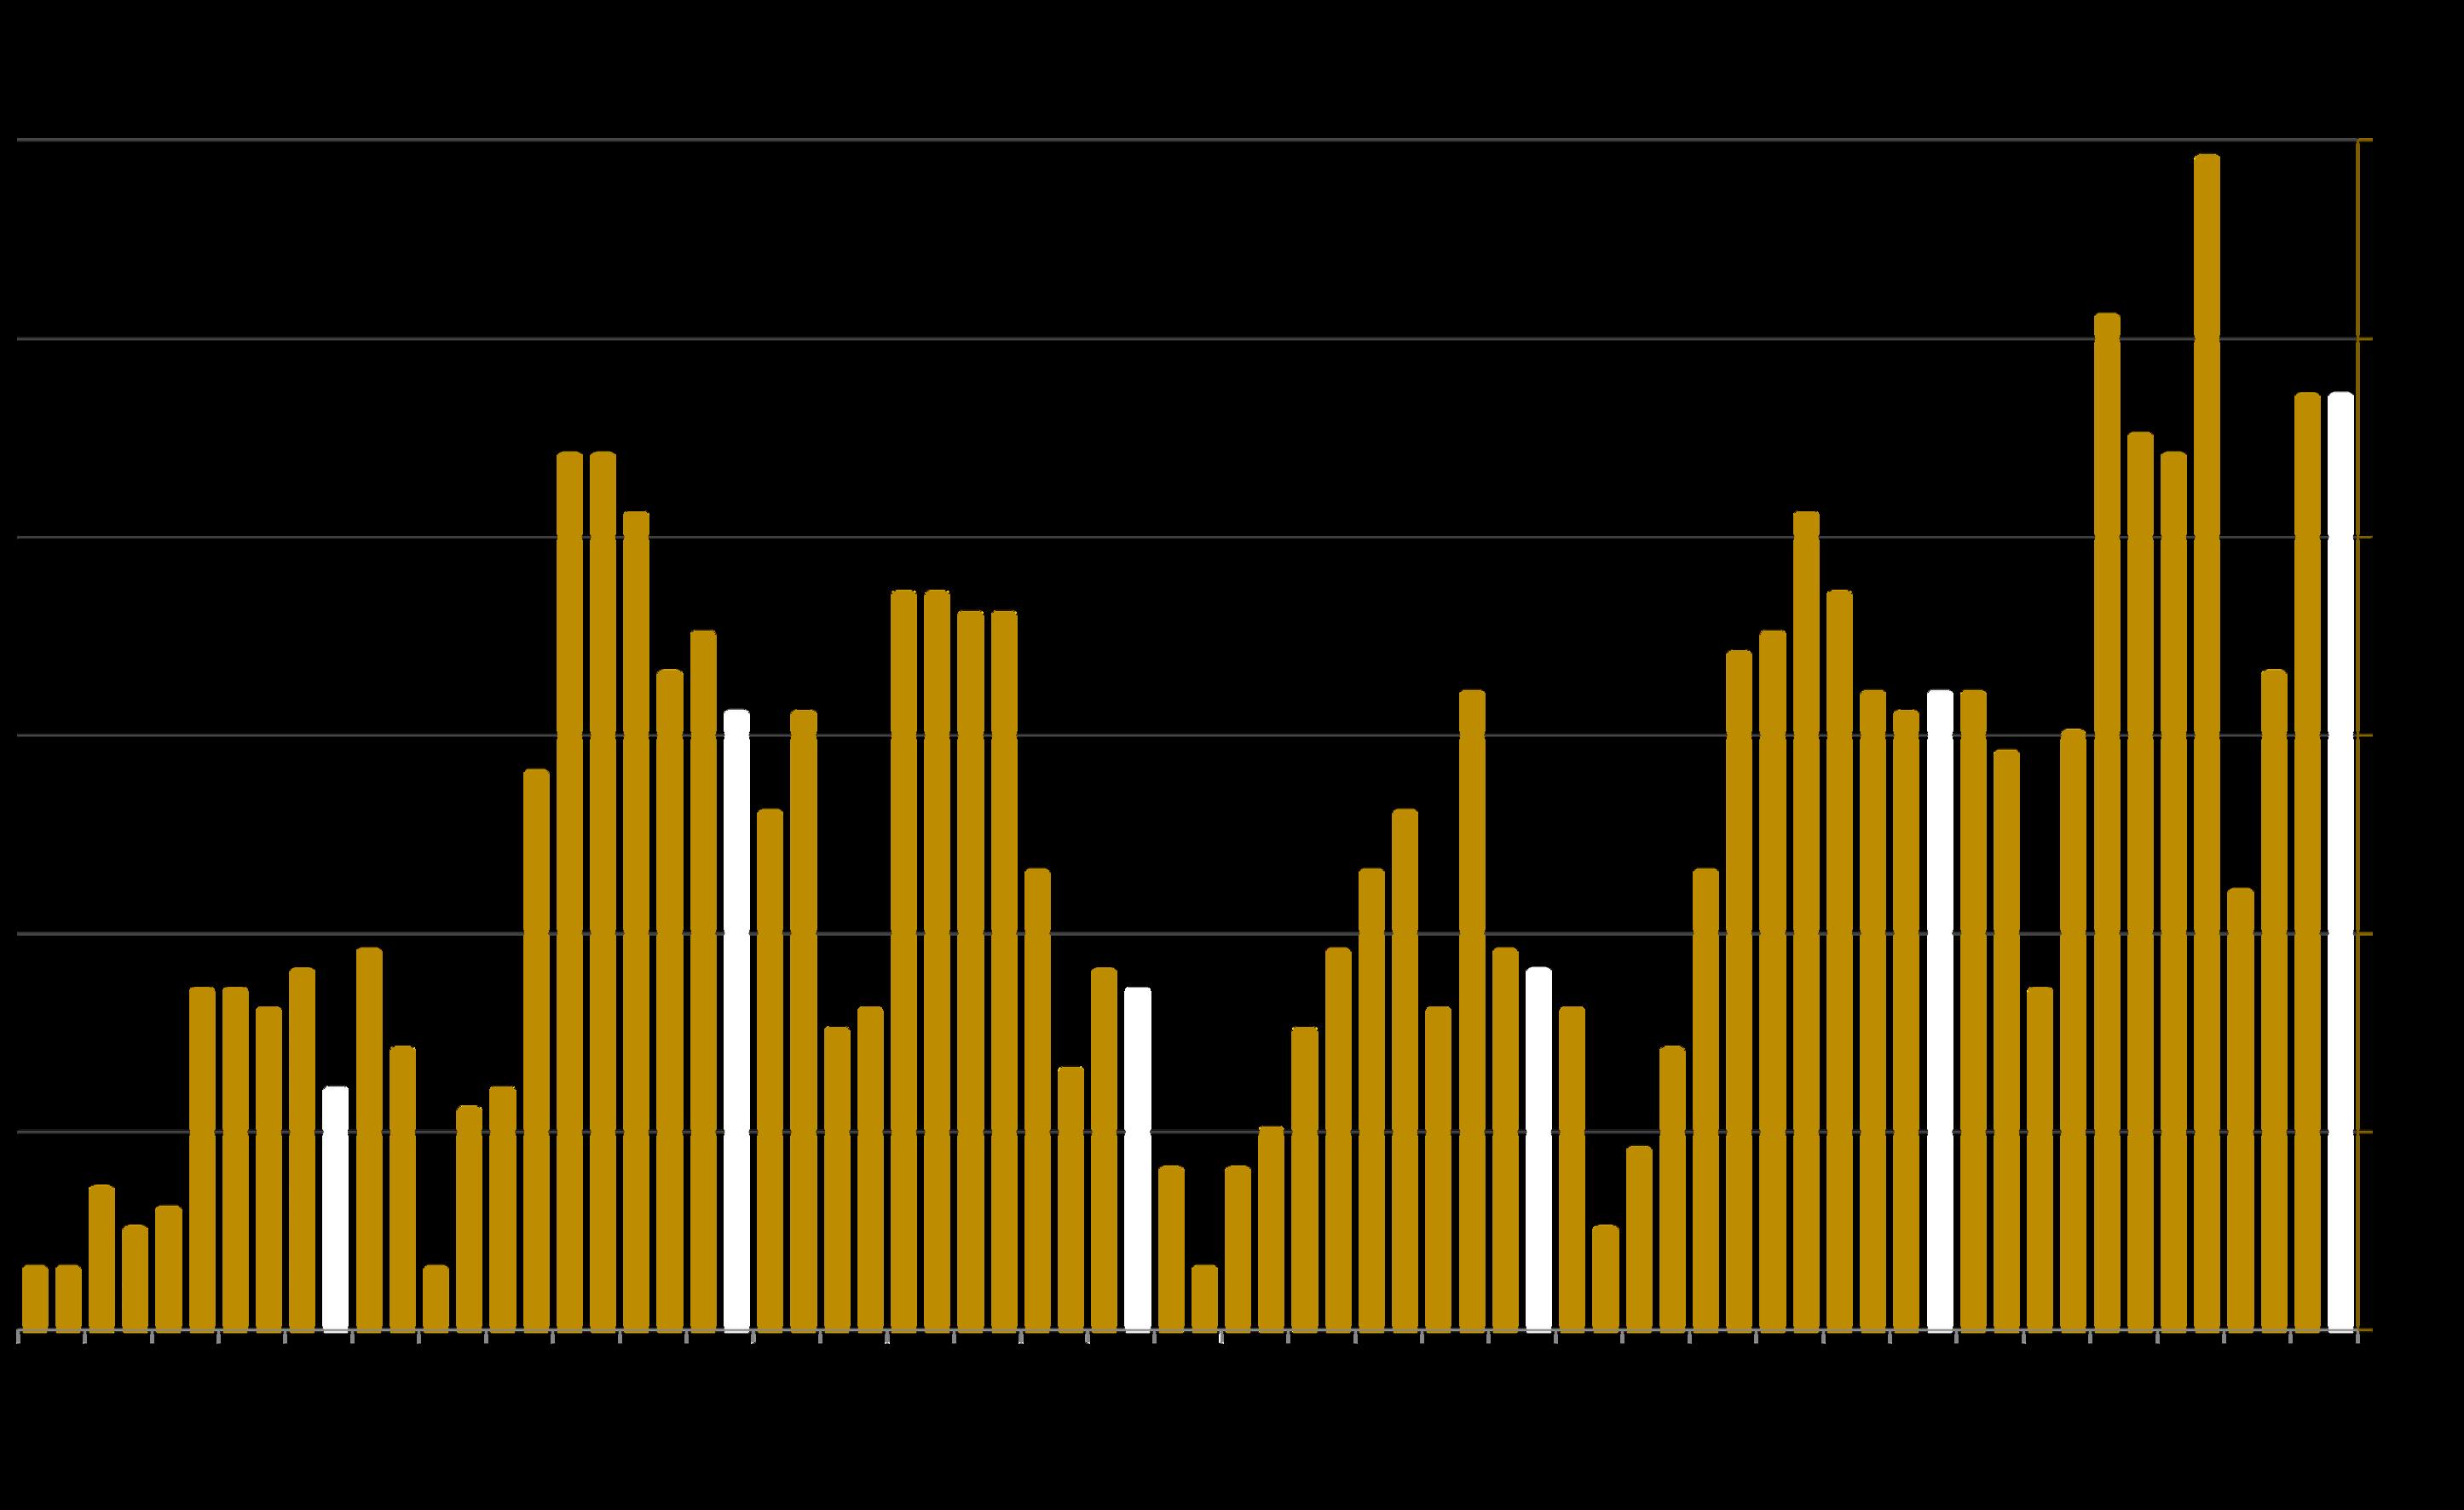
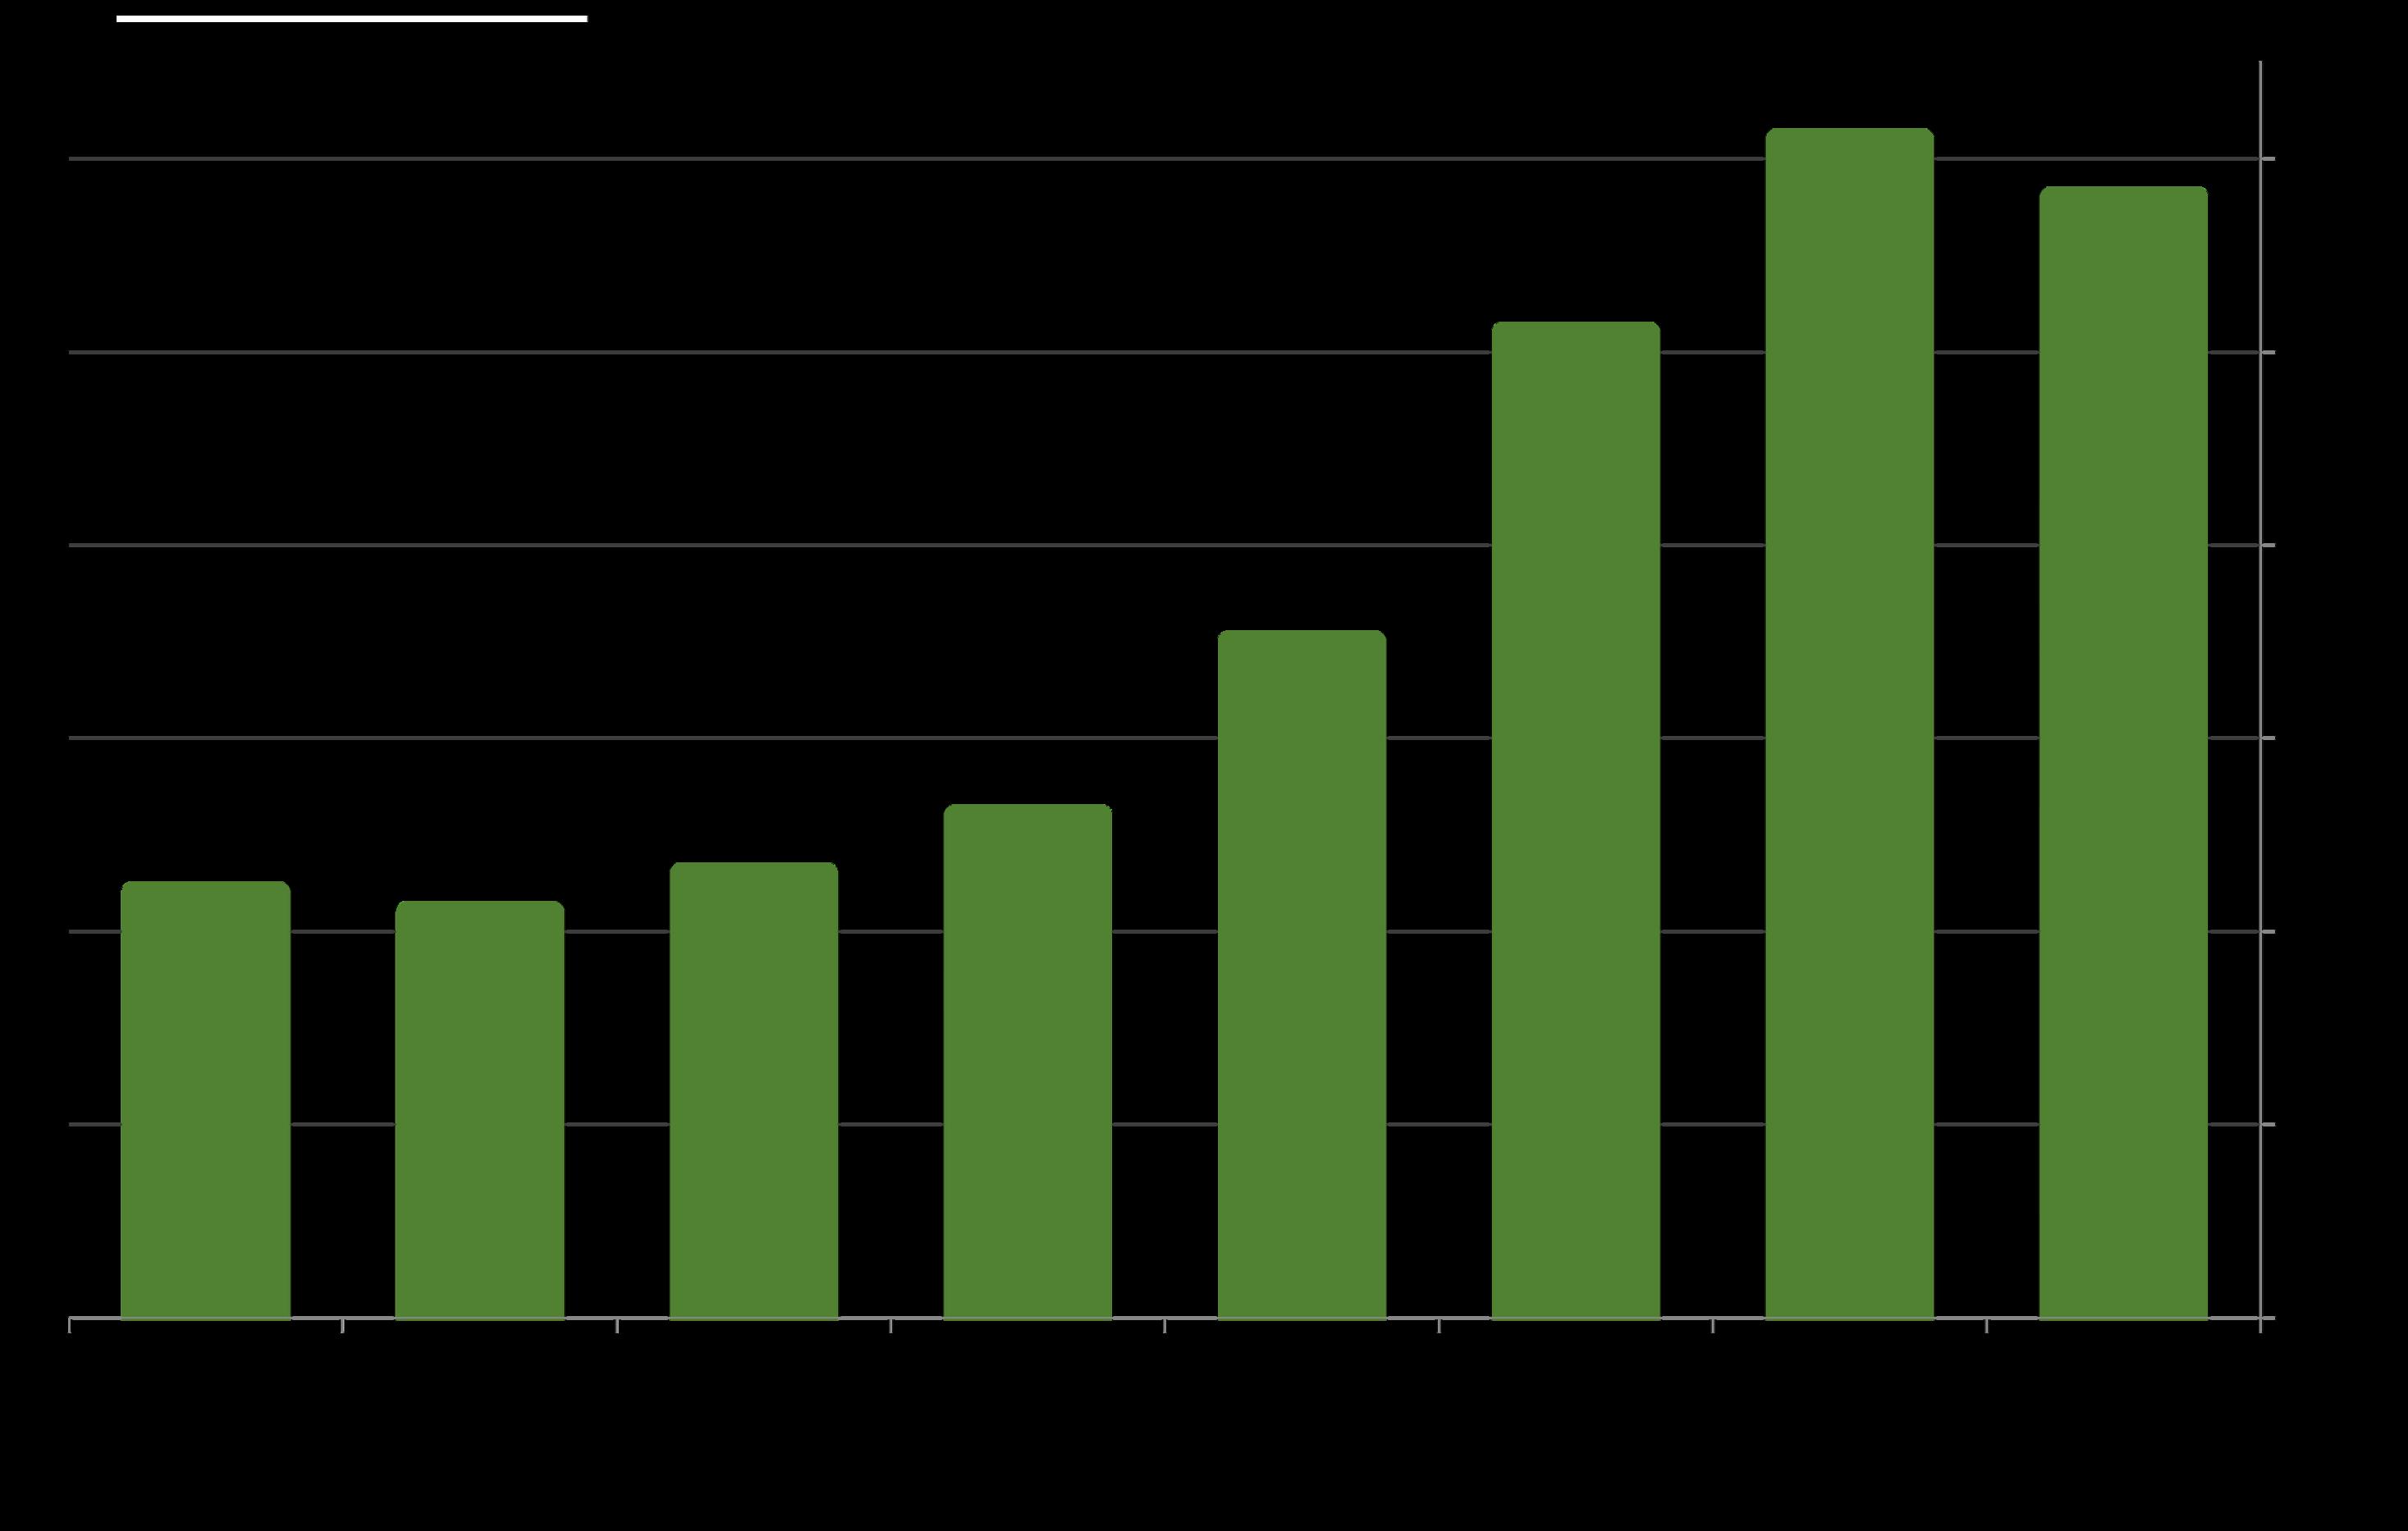
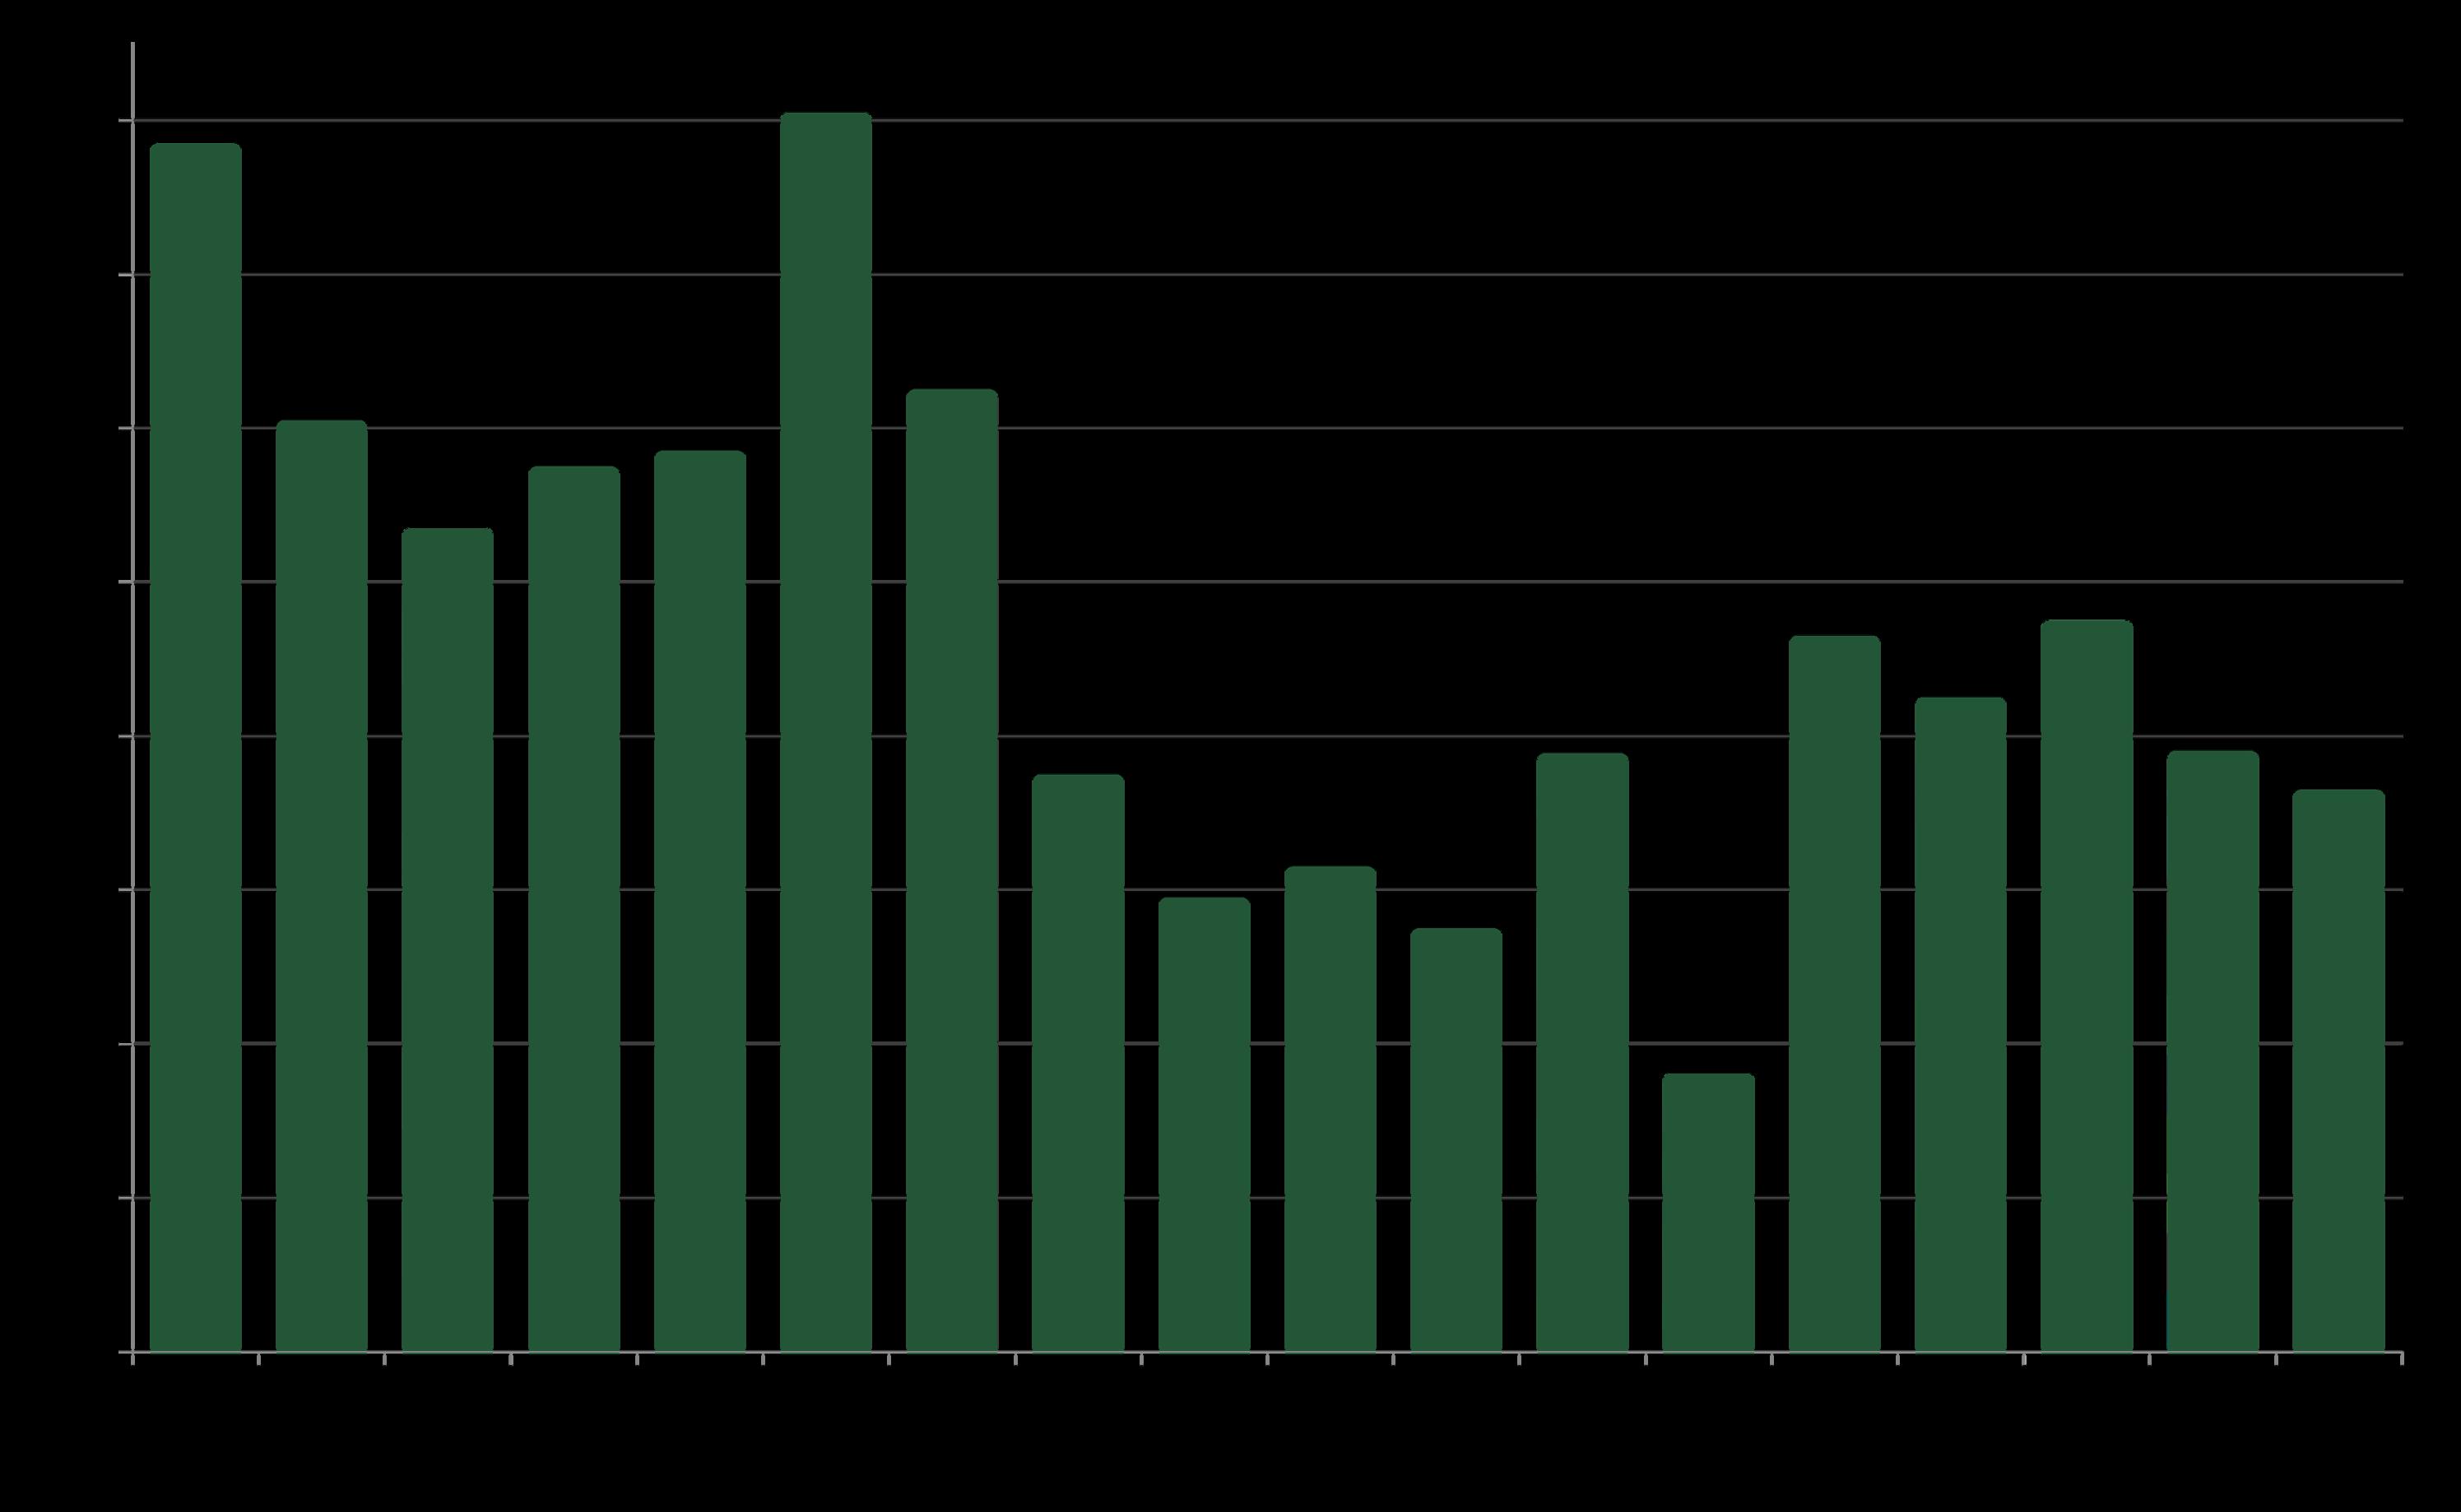
Santa Clara County Luxury Home Sales
Homes Selling for $5 Million+ since 2020
Closed sales mostly reflect acceptedoffer activity in the previous month.
Theluxury home market is usually fiercely seasonal: Peaking in spring, slowing in summer, often rebounding in fall, and finally plunging in mid-winter. Luxury home sales of $5,000,000+ in October 2025 rose 47% year over year to hit its highest month-of-October count ever.
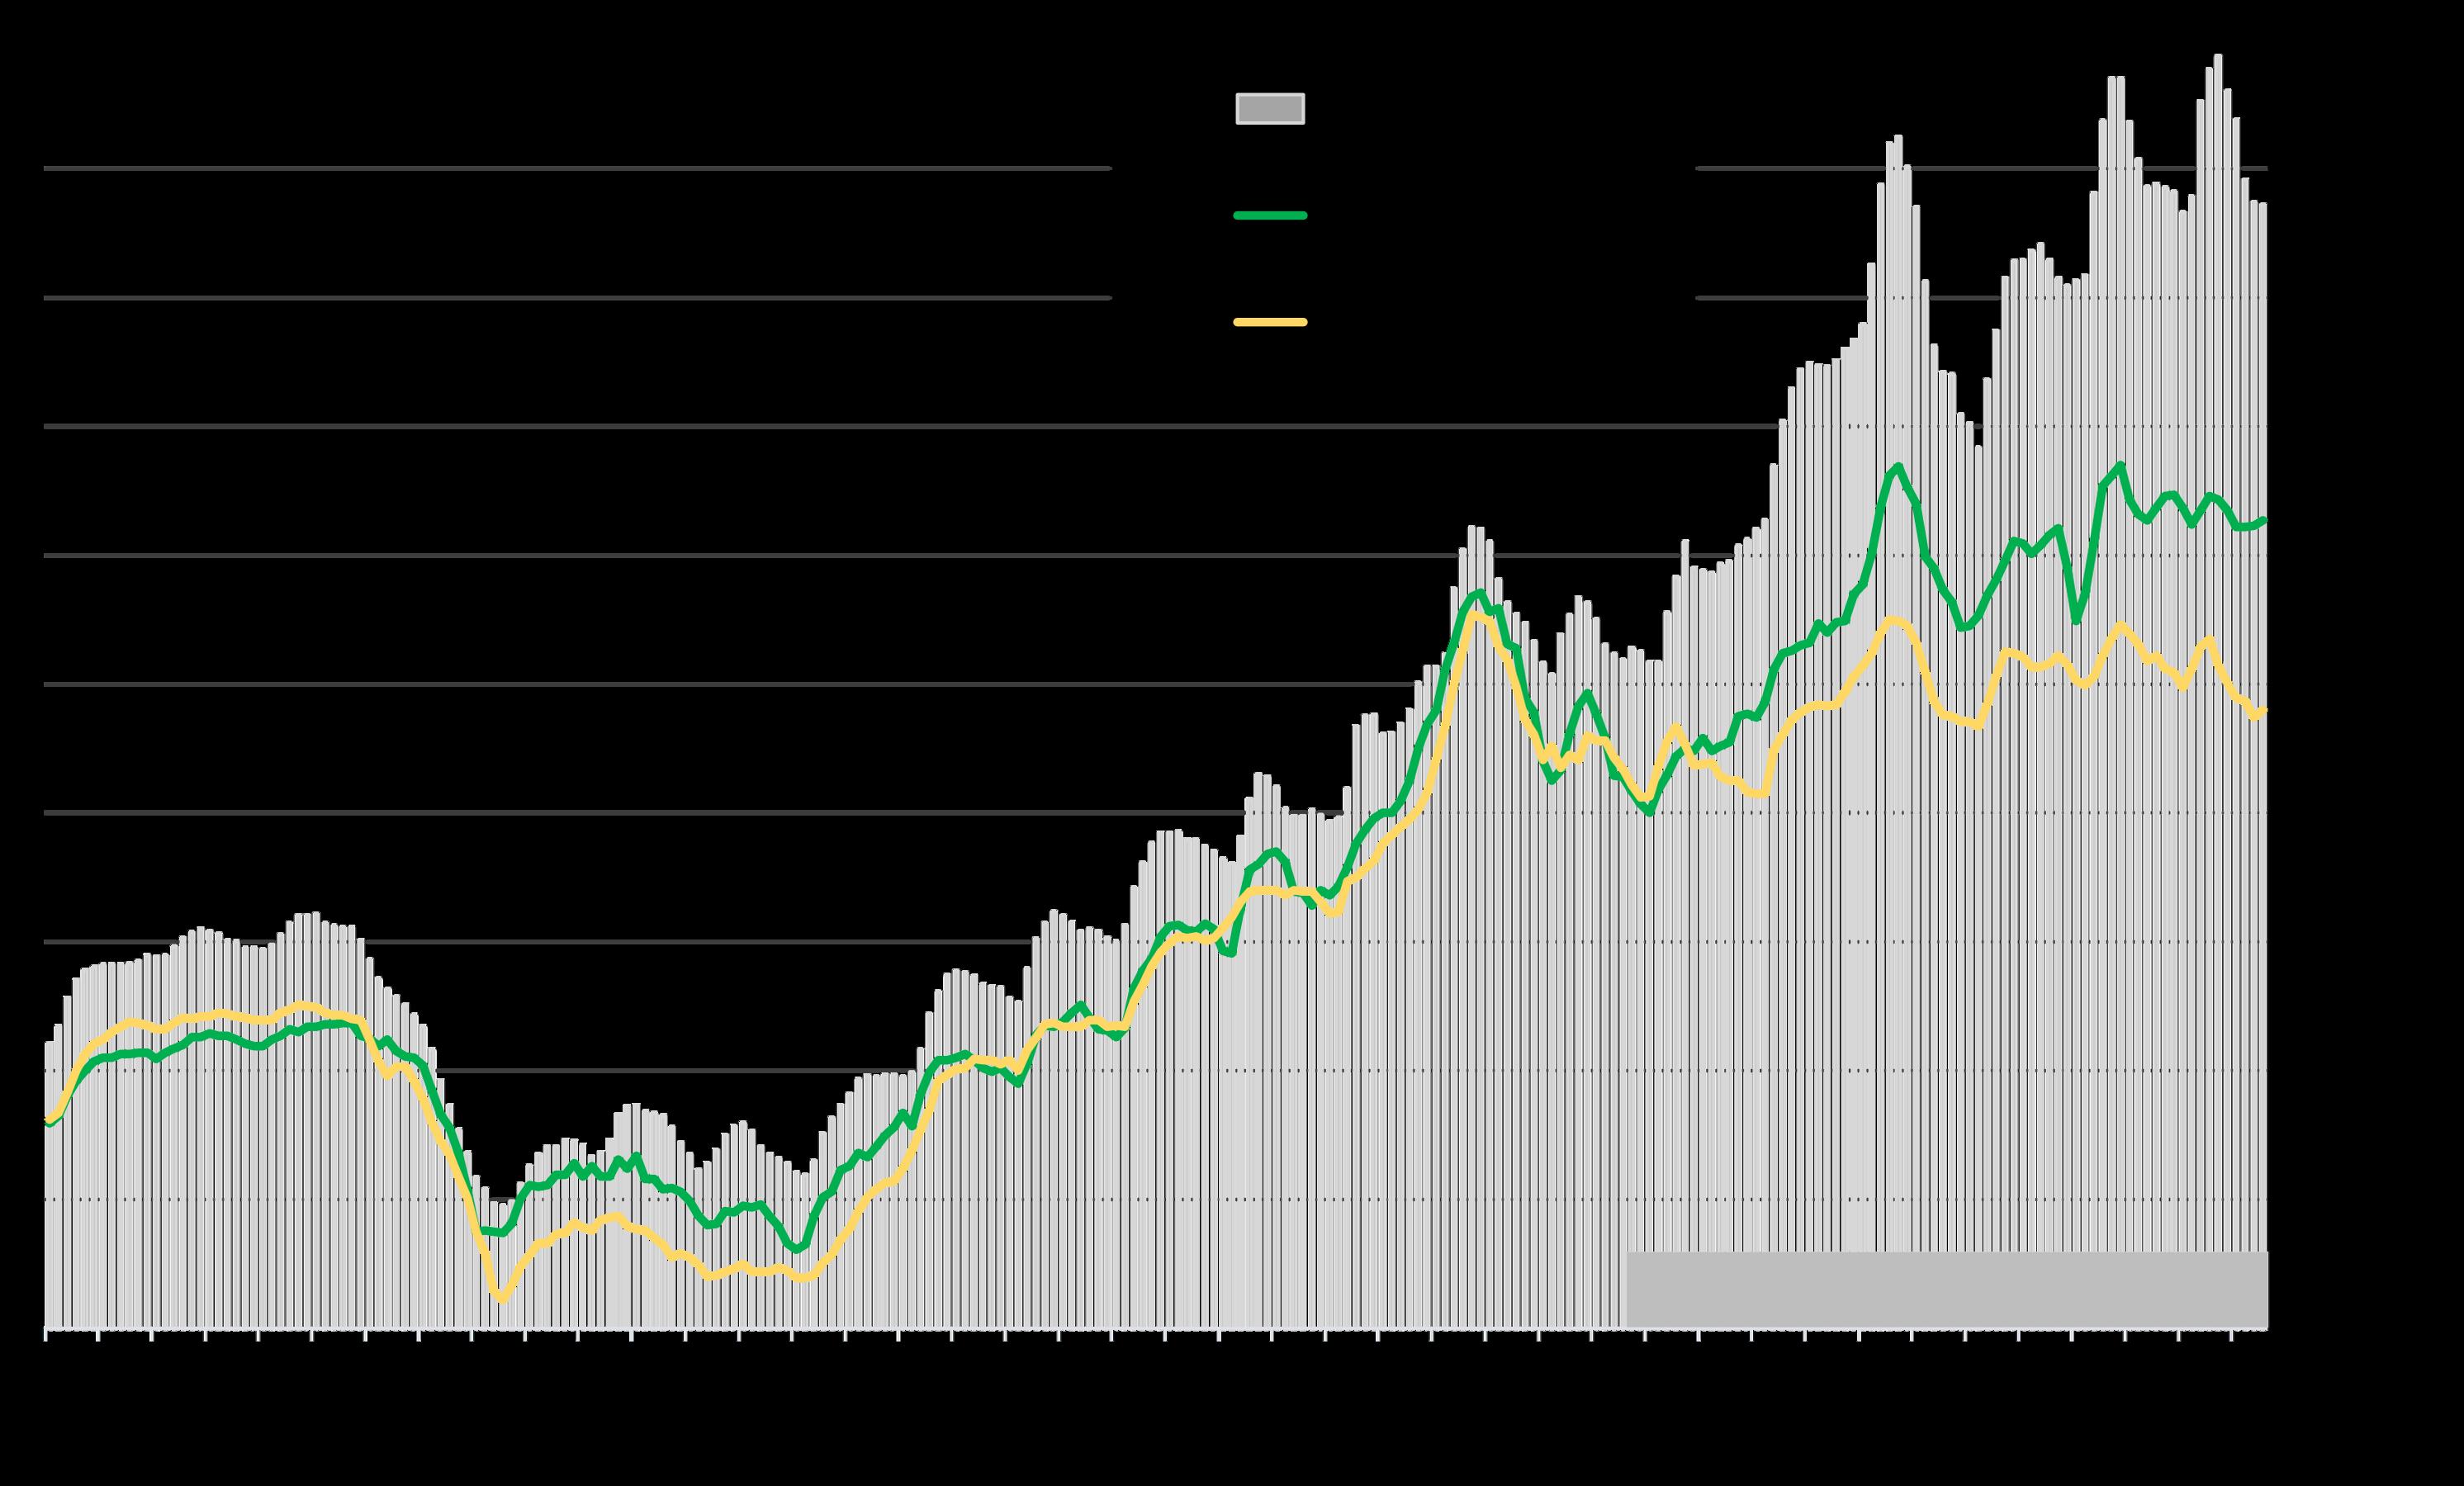
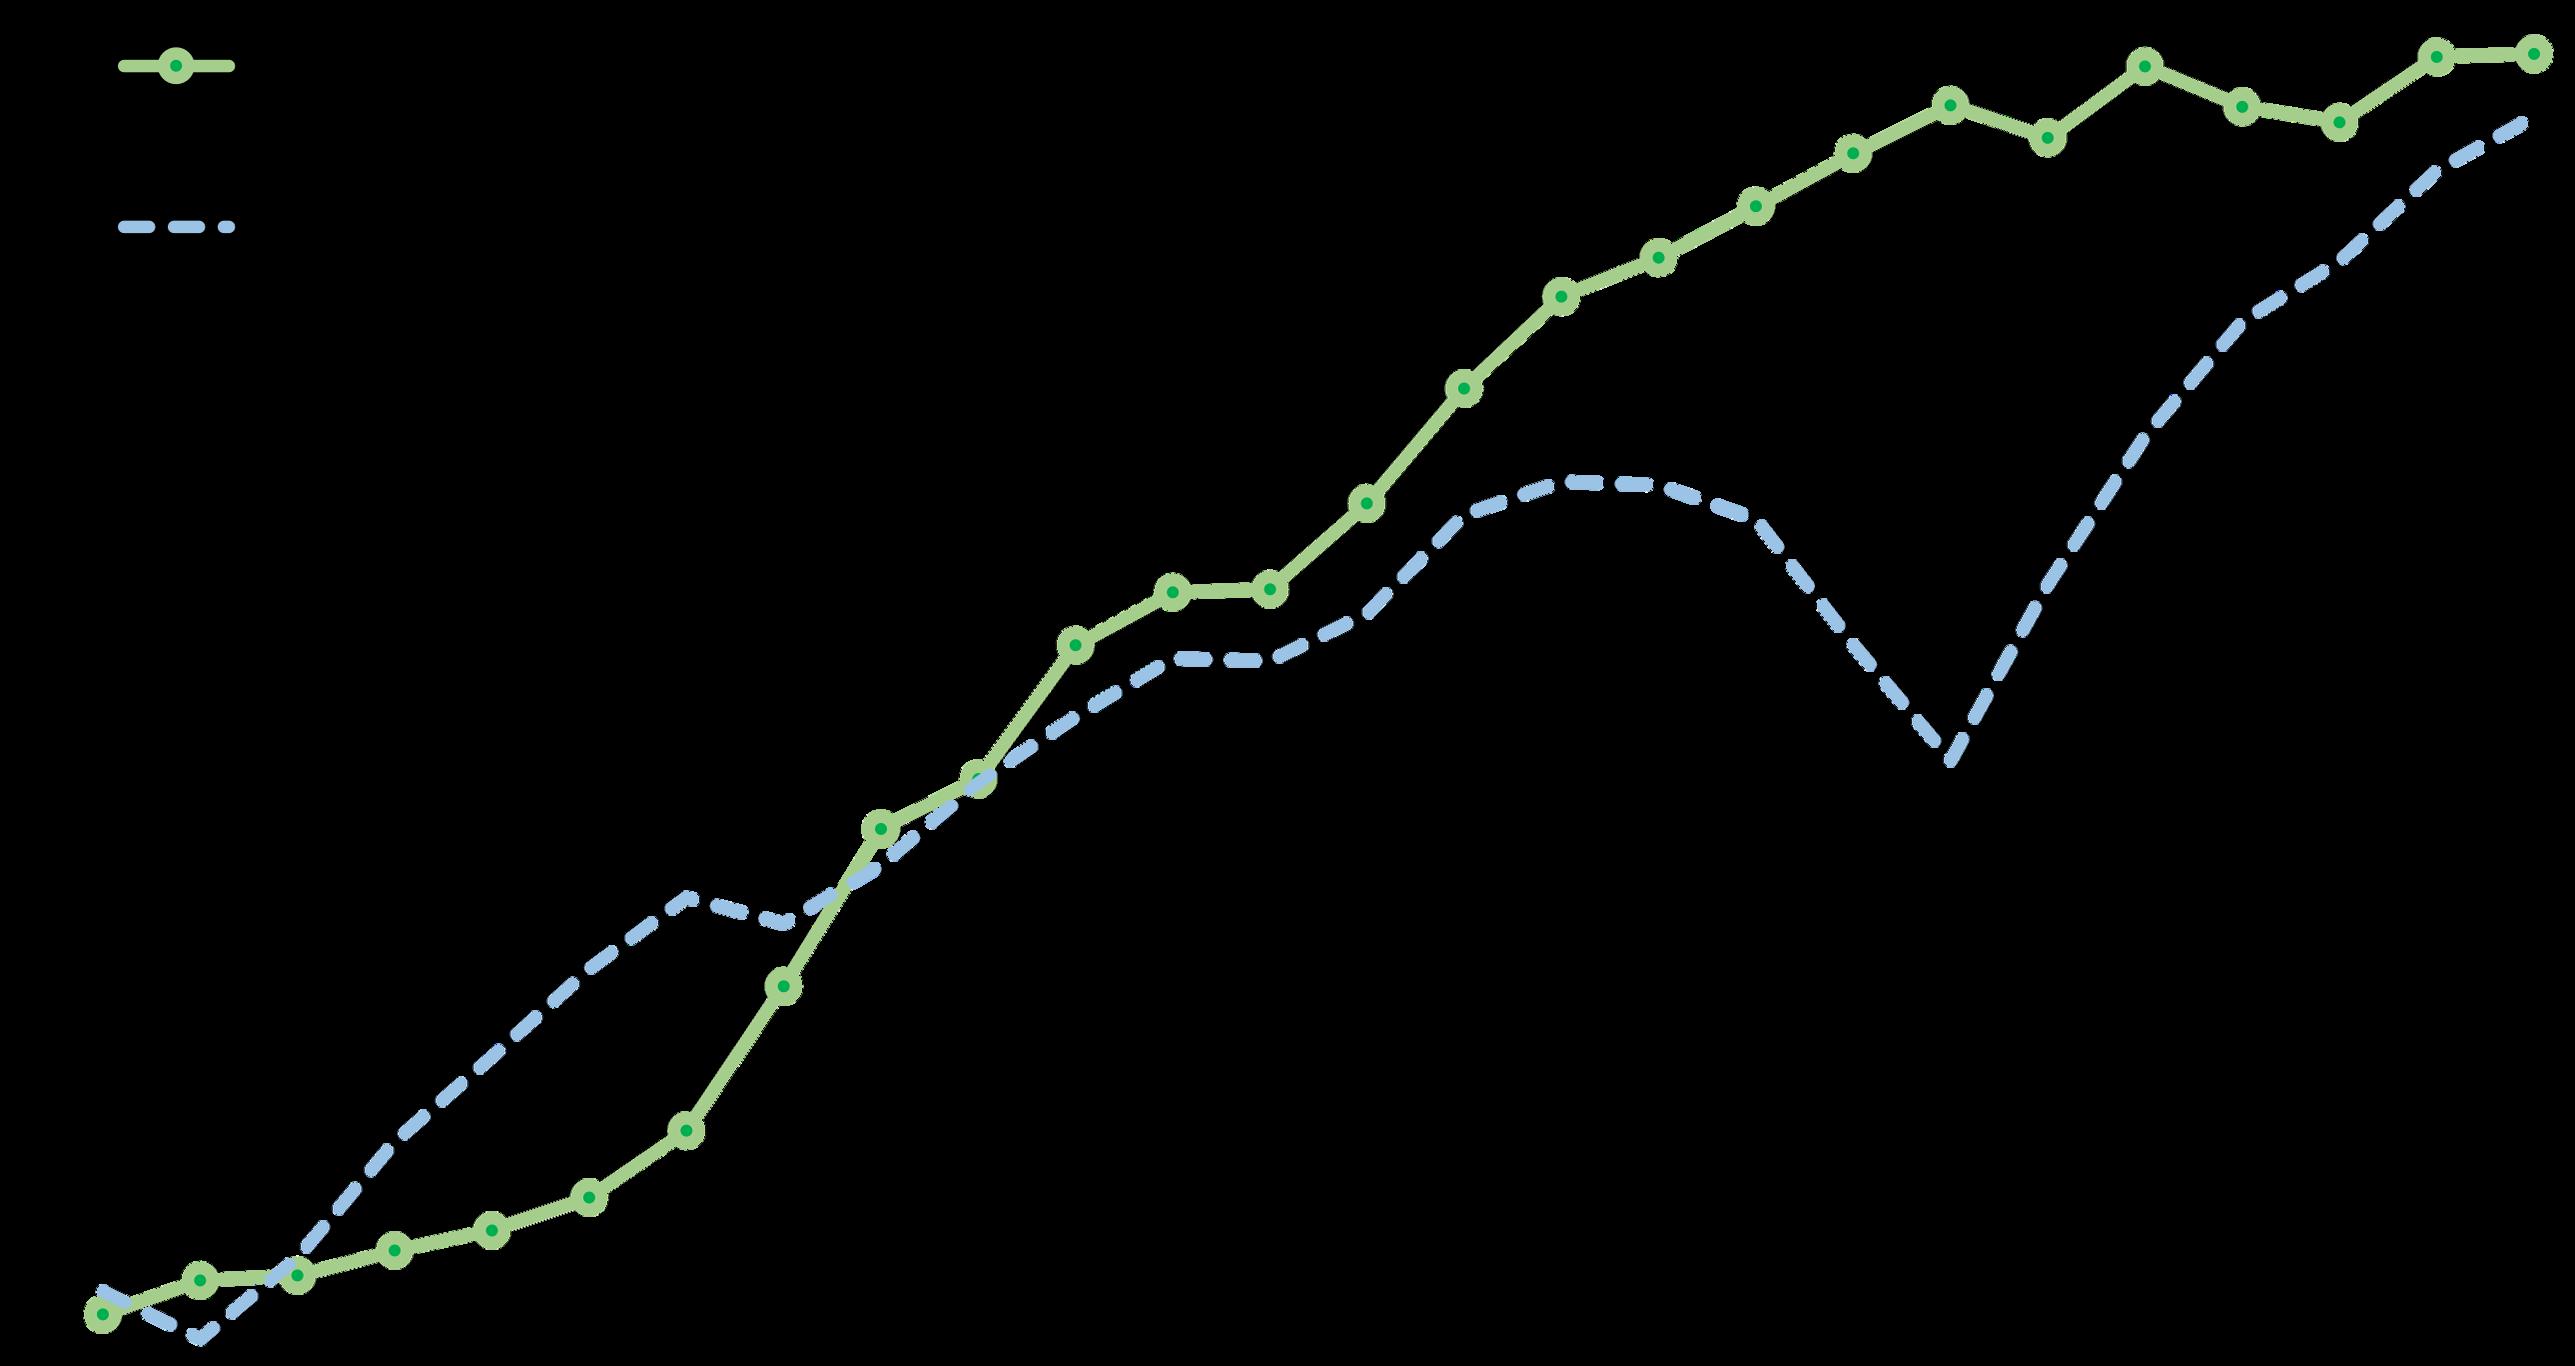
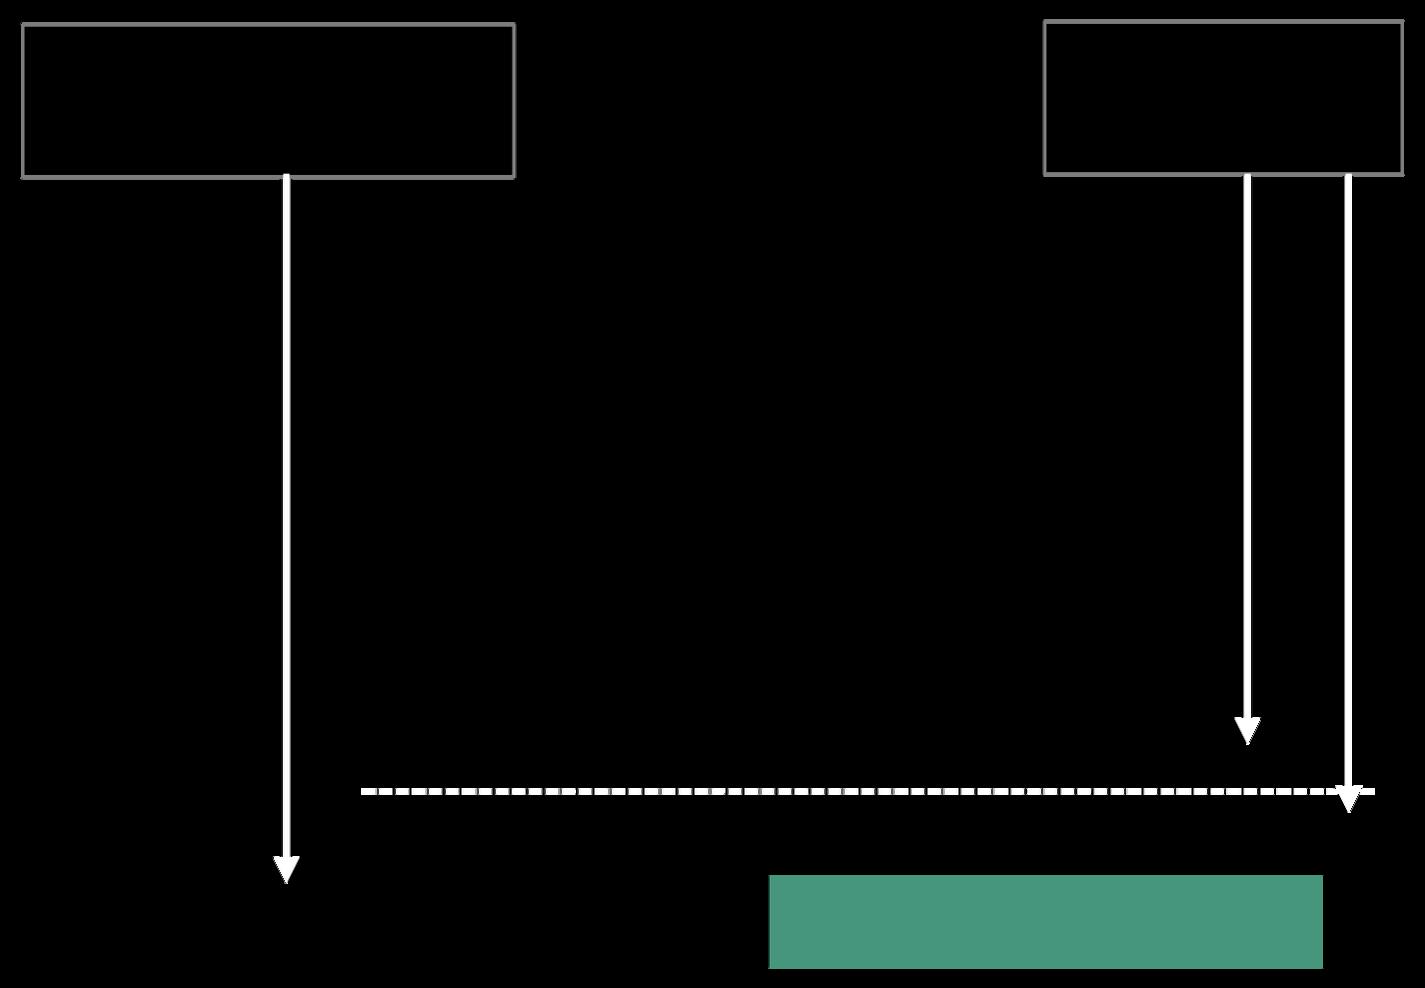
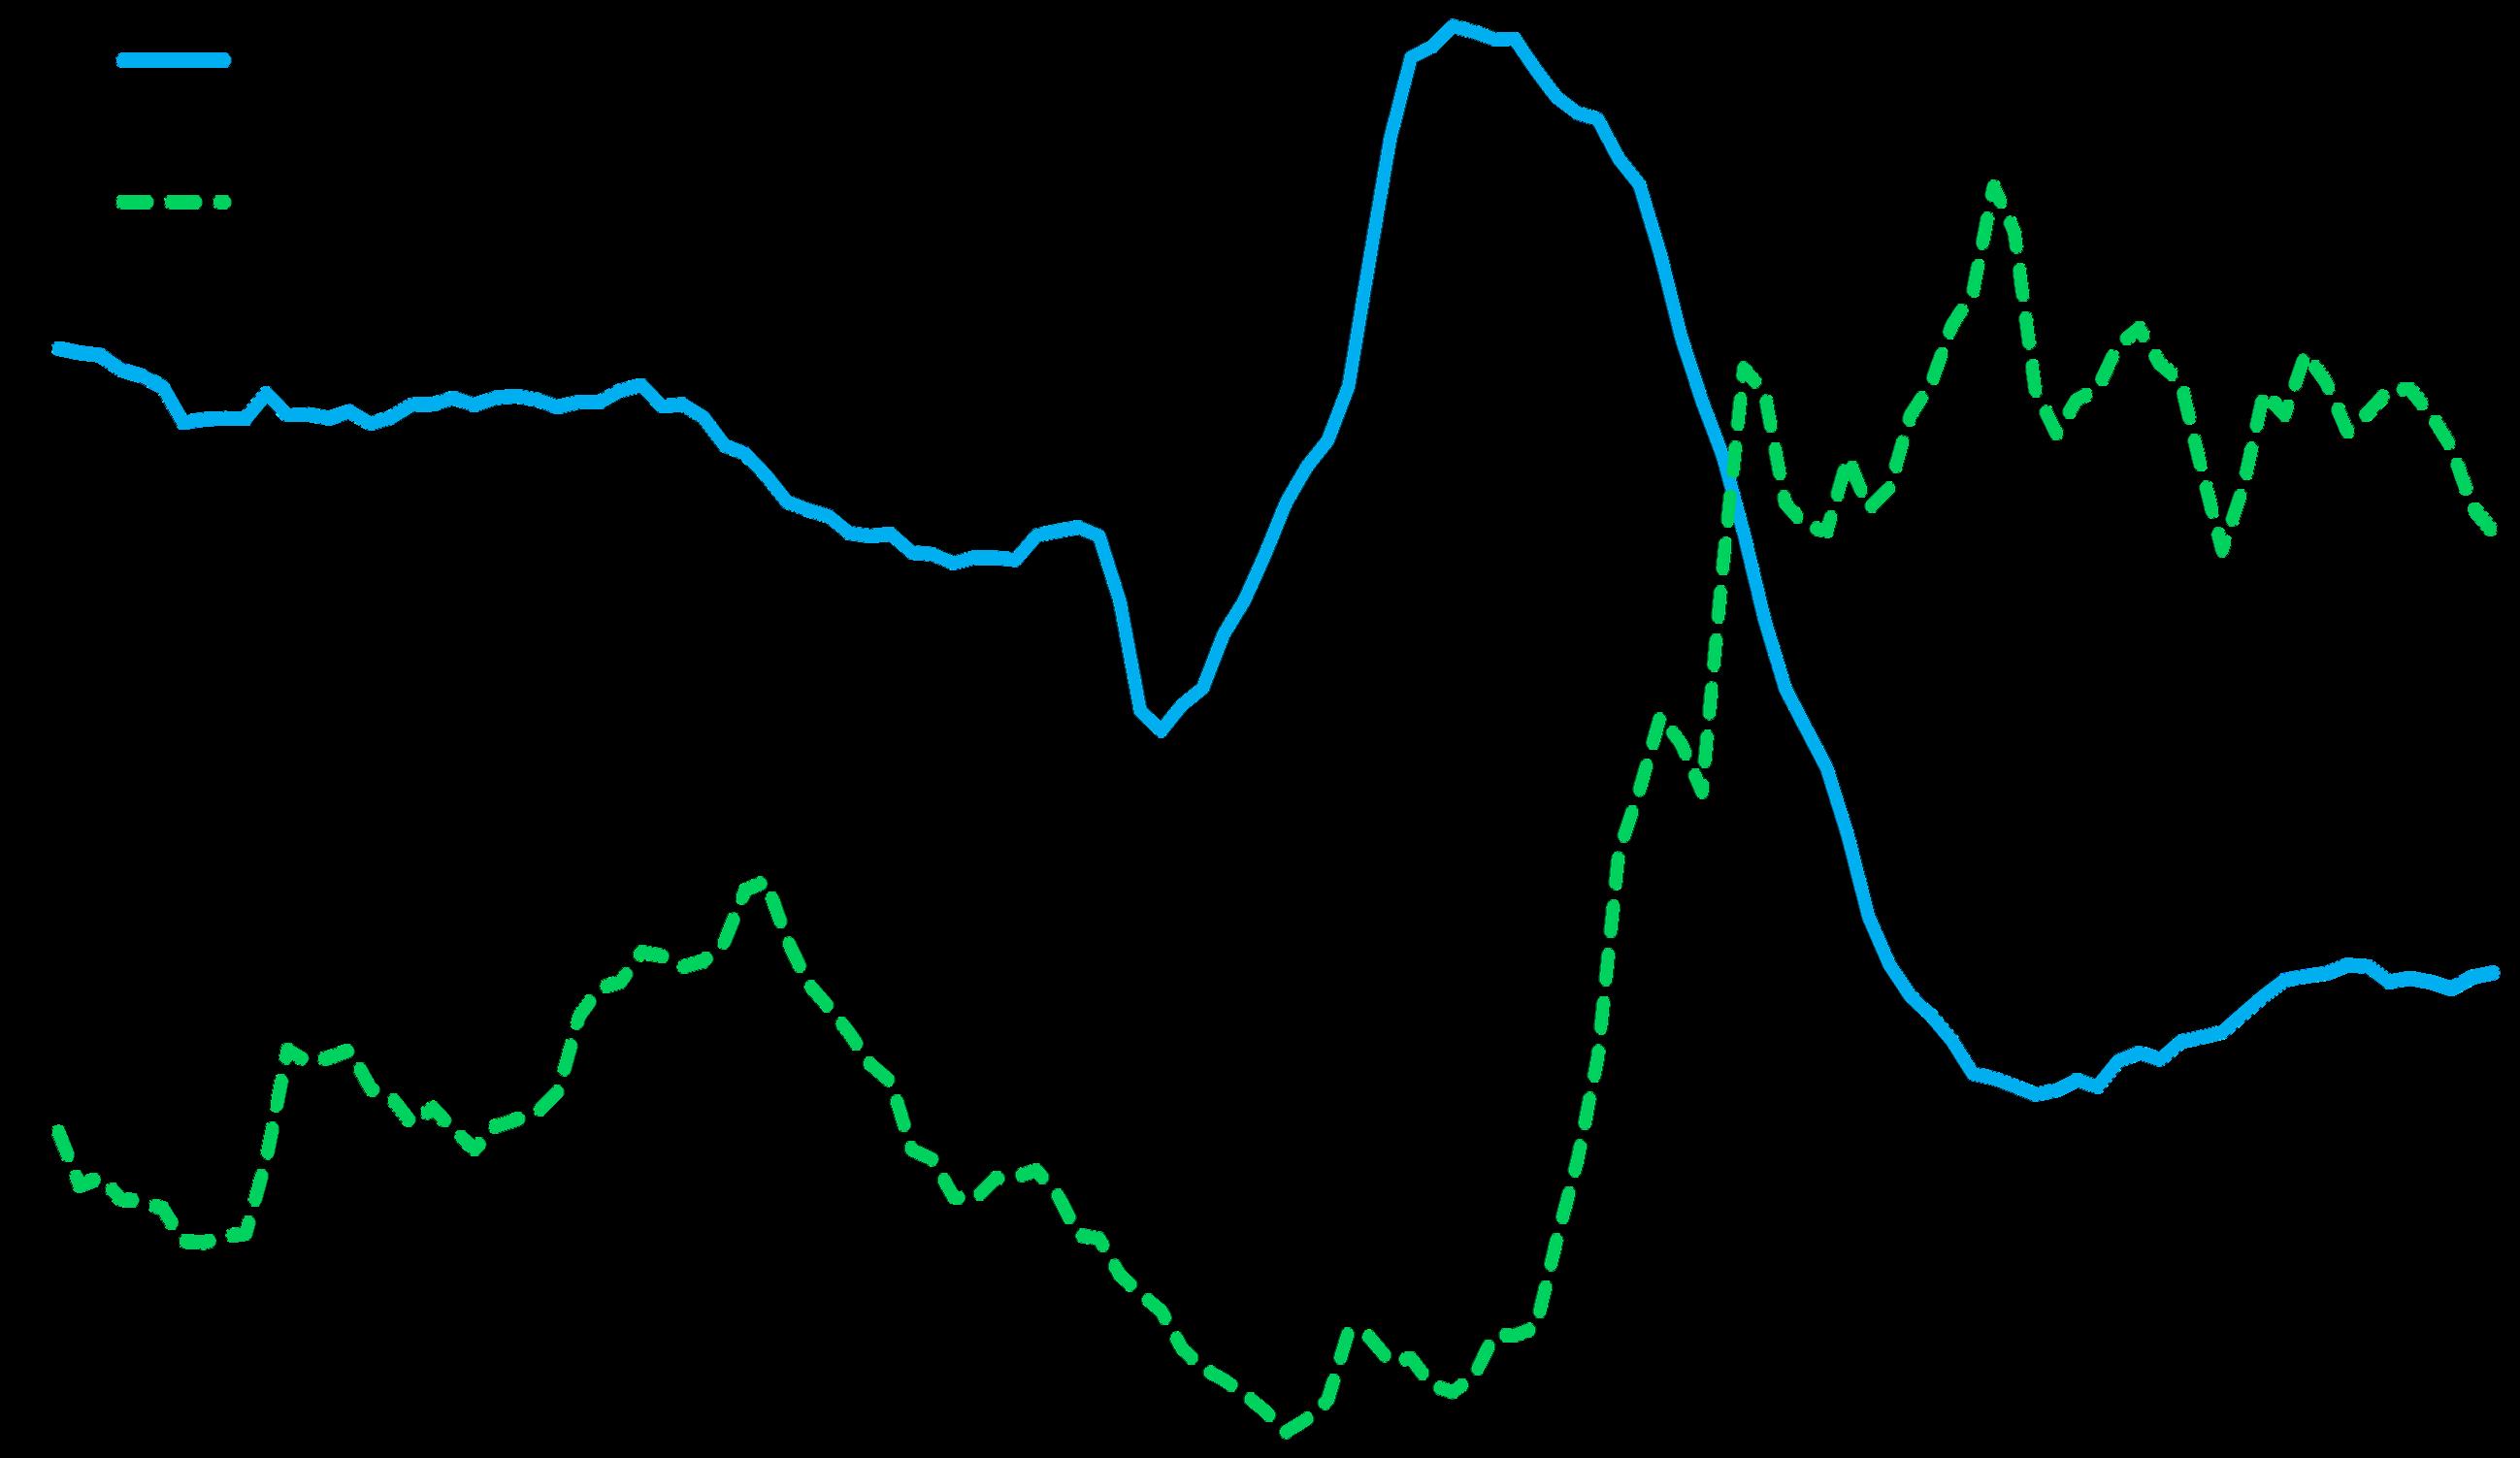
Comparing Santa Clara County $3 million+ home sales volume with changes in the S&P 500* .
Significant changes in economic conditions will typically affect sales volumes in later months.
Tariff-shock impact on stock markets did not last long enough to affect 12-month-rolling luxury home sales numbers.
As stock markets soared, so did higher-price home sales. During the 2+ year period illustrated, average monthly sales volume of Santa Clara County homes under $3 million (not illustrated on this chart) increased by about 7% – following a modest decline in interest rates – while $3 million+ home sales skyrocketed 69% as the S&P 500 rose about 54% (and the Nasdaq even more).*
Stock markets begin sustained rise in values, triggering rebound in luxury home sales
*12-month-rolling average number of monthly $3 million+ home sales as reported to NorCal MLS Alliance, per Infosparks. 12-month-rolling sales data may lag short-term changes. Monthly S&P 500 readings an average of daily readings. Analysis may contain
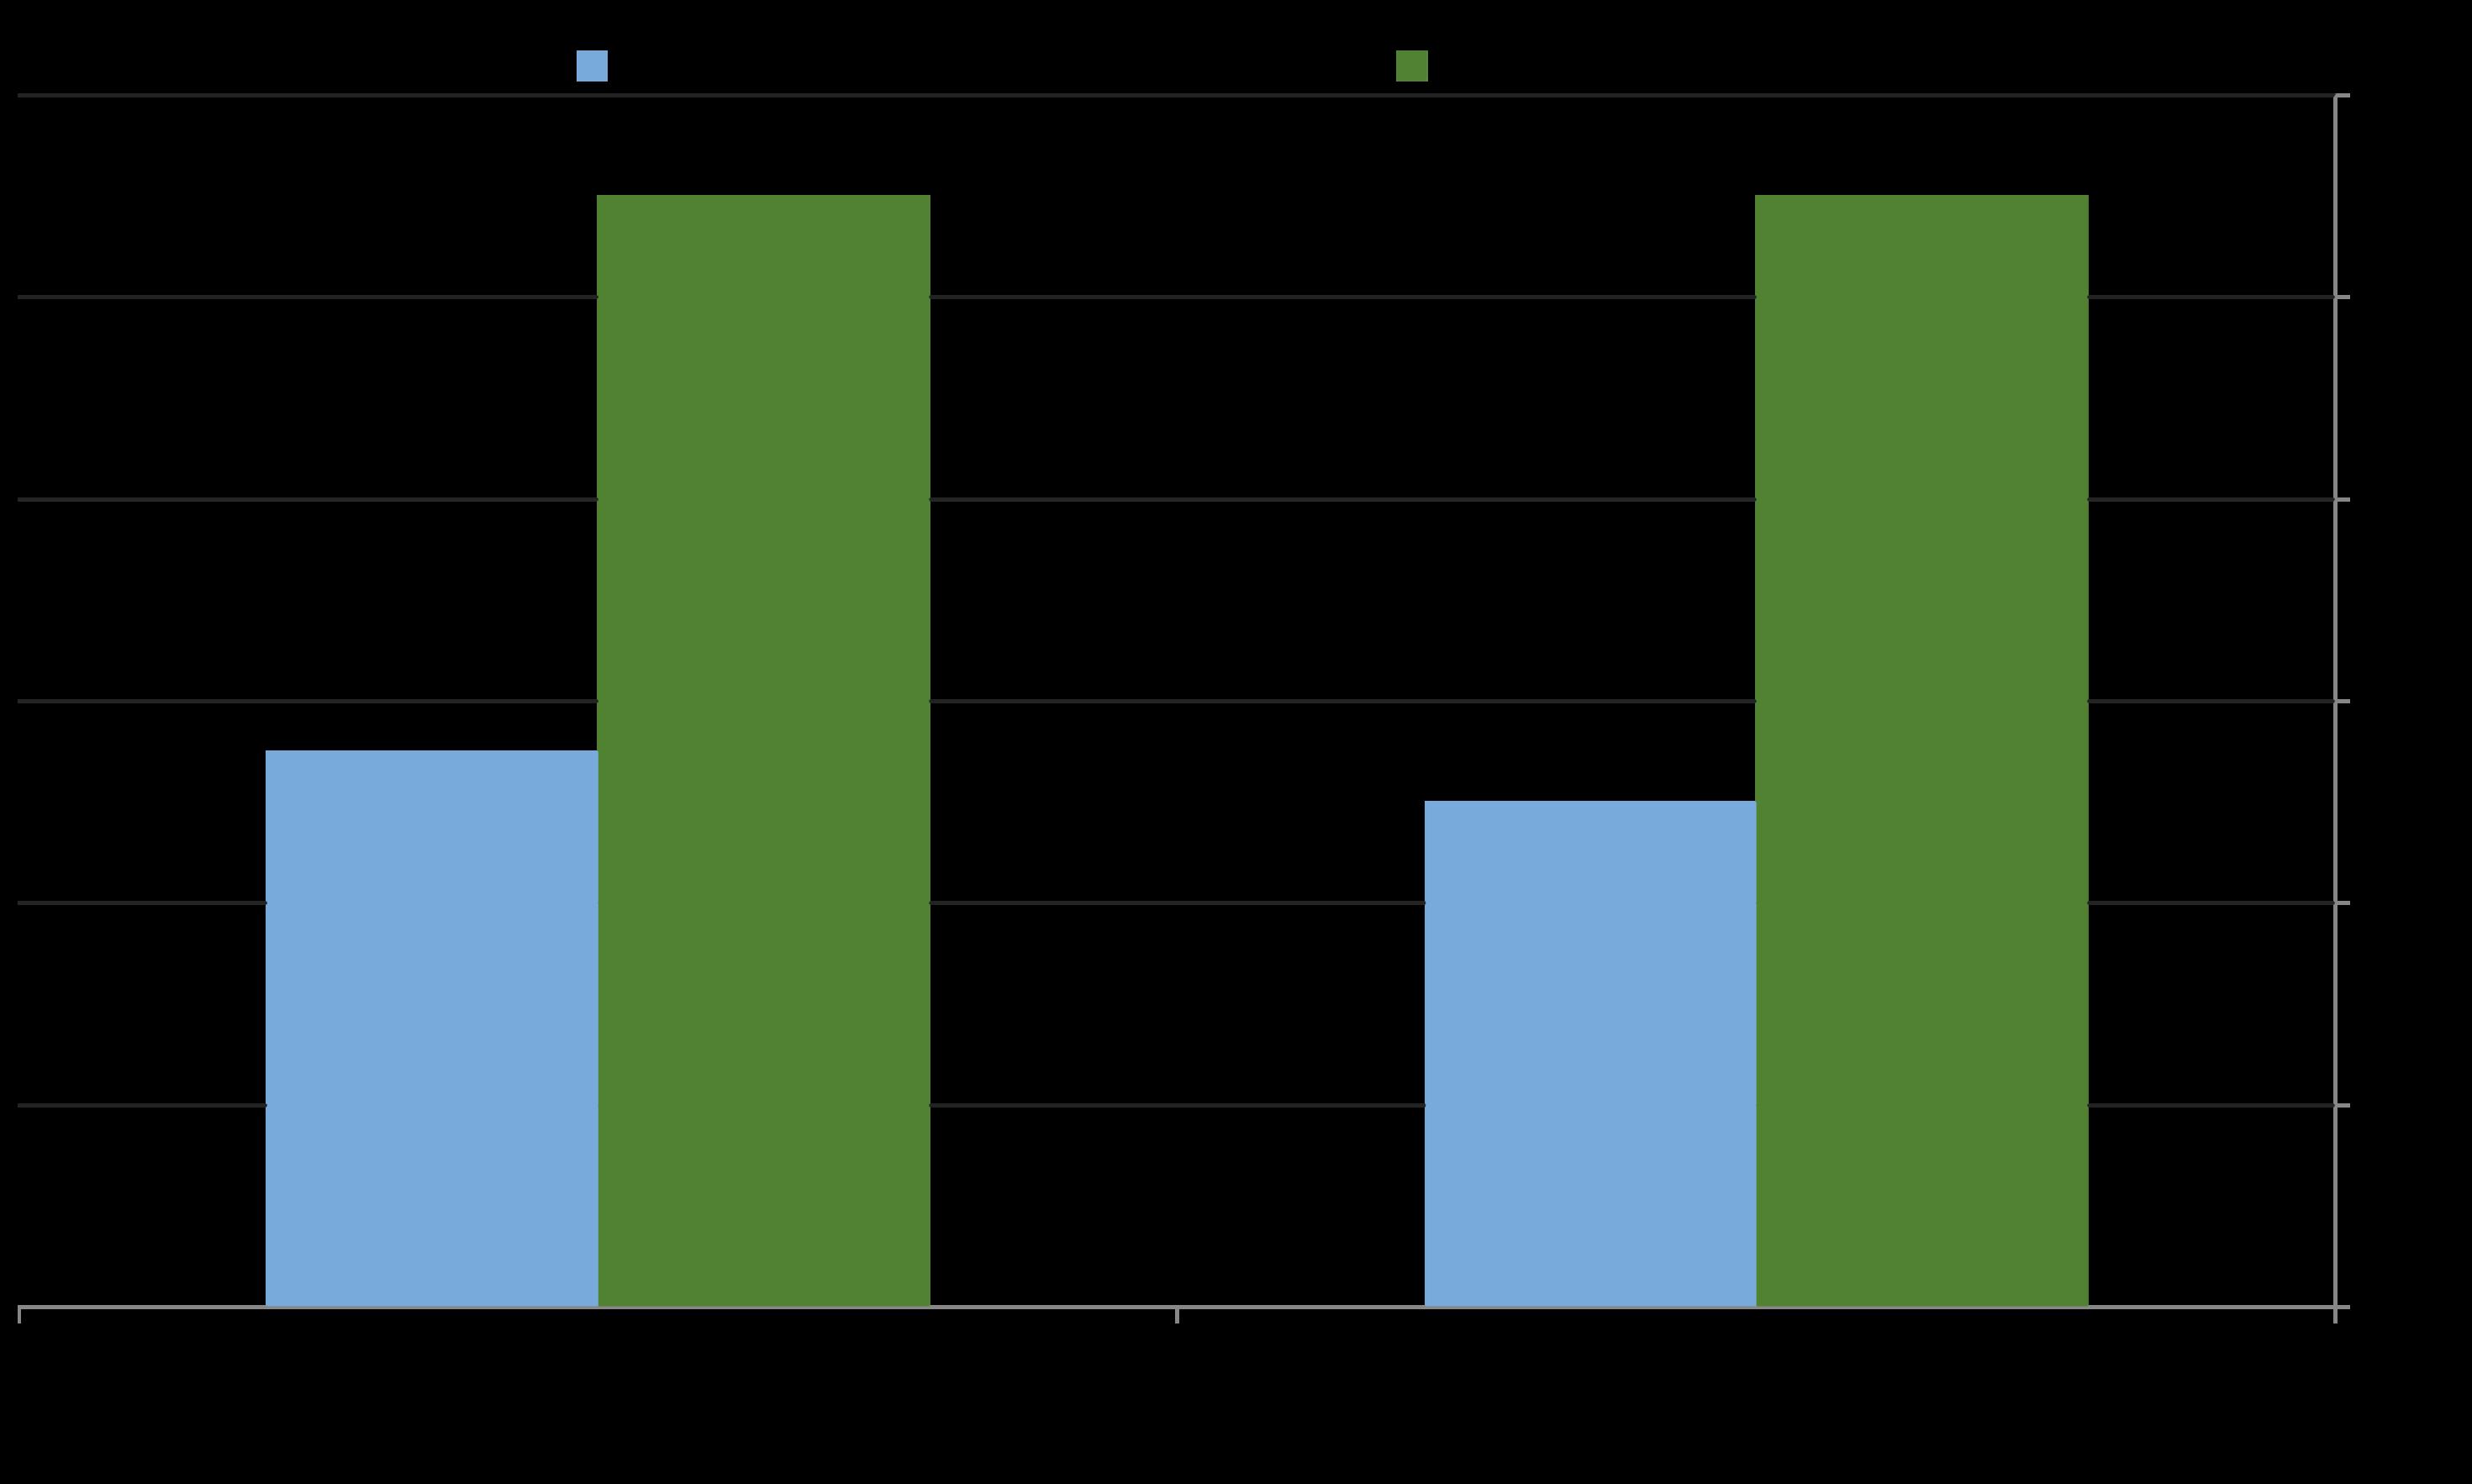
Bay Area House Sales, 2025 vs. 2023
Changes in Median Sales Values by Home Size*
1500 - 2000 Sq.Ft. Houses
4000 - 6000 Sq.Ft. Houses
In the past 2 years, soaring stock markets caused the wealth of more affluent Bay Area households to rapidly climb, accelerating demand for, and appreciation of, large luxury homes. 11%
Comparing changes in values of median-sized houses in the Bay Area to the appreciation of large (luxury) houses since stock markets began their dramatic upswing in late 2023.
Over the period, the appreciation of values for large houses (4000 – 6000 sq.ft.) was approximately double the rate of median-sized houses (1500 – 2000 sq.ft.).*
Percentage Increase in Median Sales Price 2023 to 2025
Percentage Increase in Median $/Sq.Ft. Value 2023 to 2025
*Comparing house sales reported to NorCal MLSAlliance through late October of 2023 and 2025in10 greater
Bay Area Counties. Fixer-uppers excluded. Analysis made in good faith from data from sources deemed reliable, but may contain errors and subject to revision. All numbers should be considered approximate.
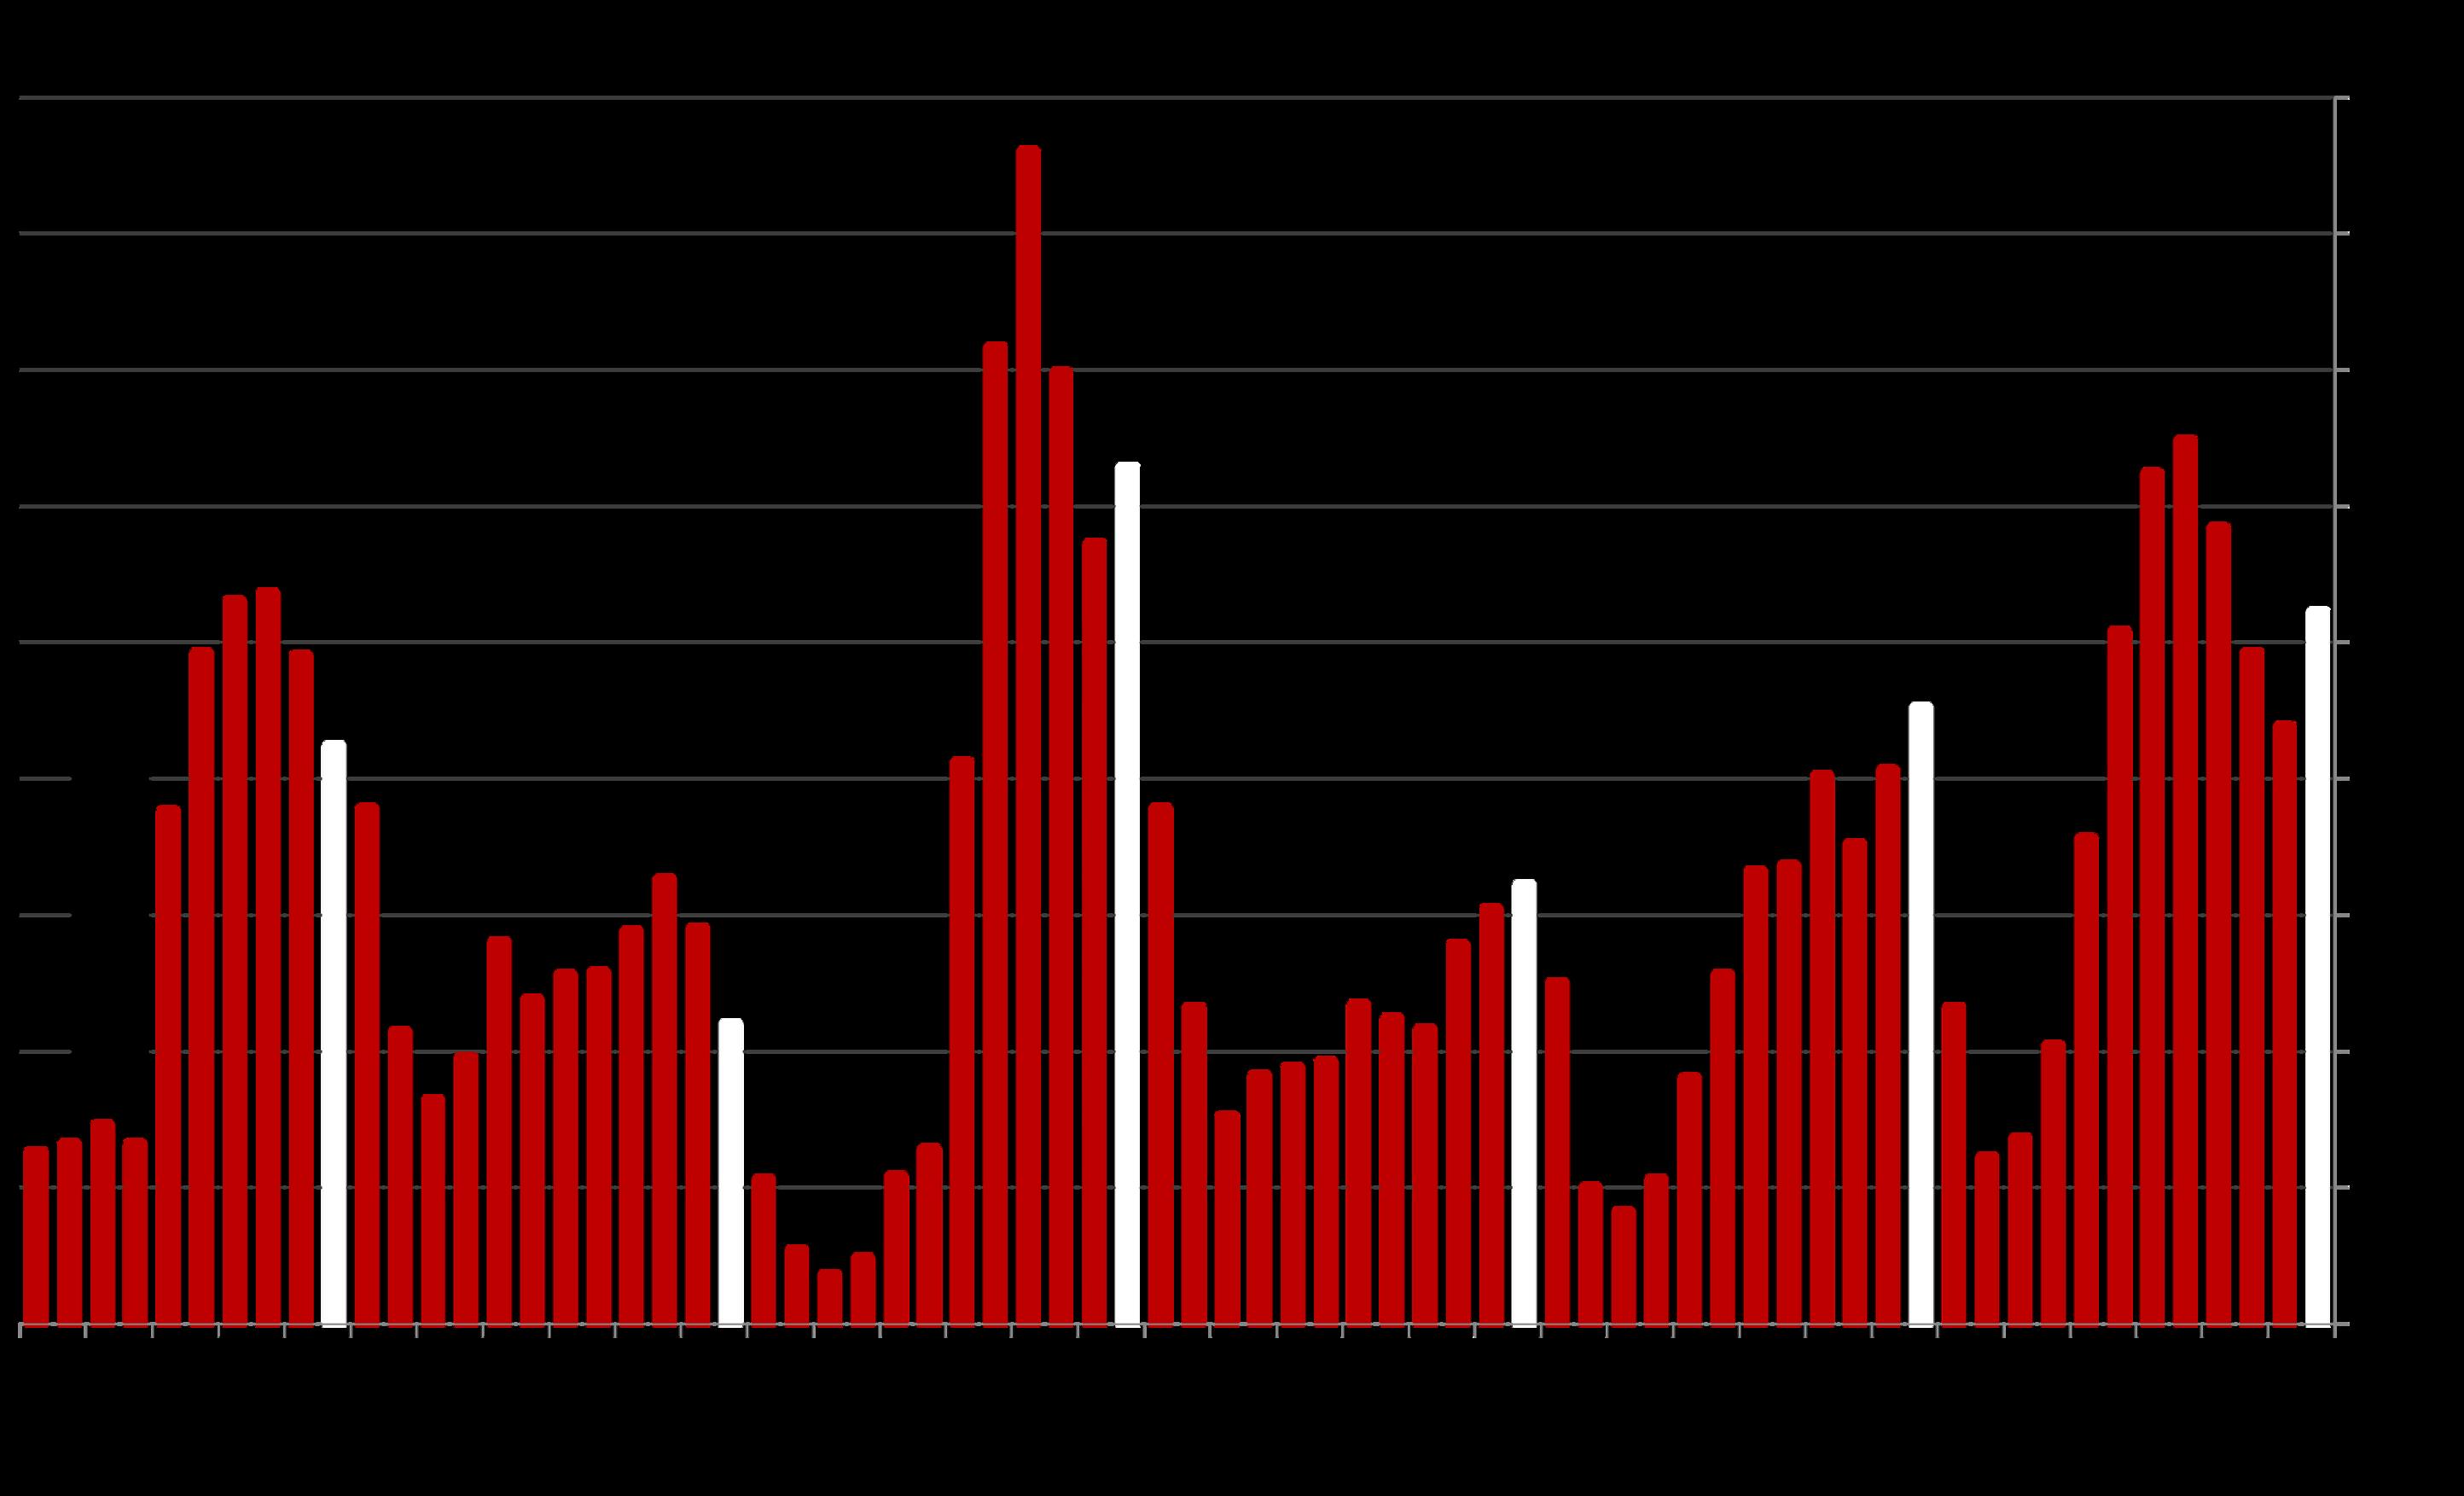
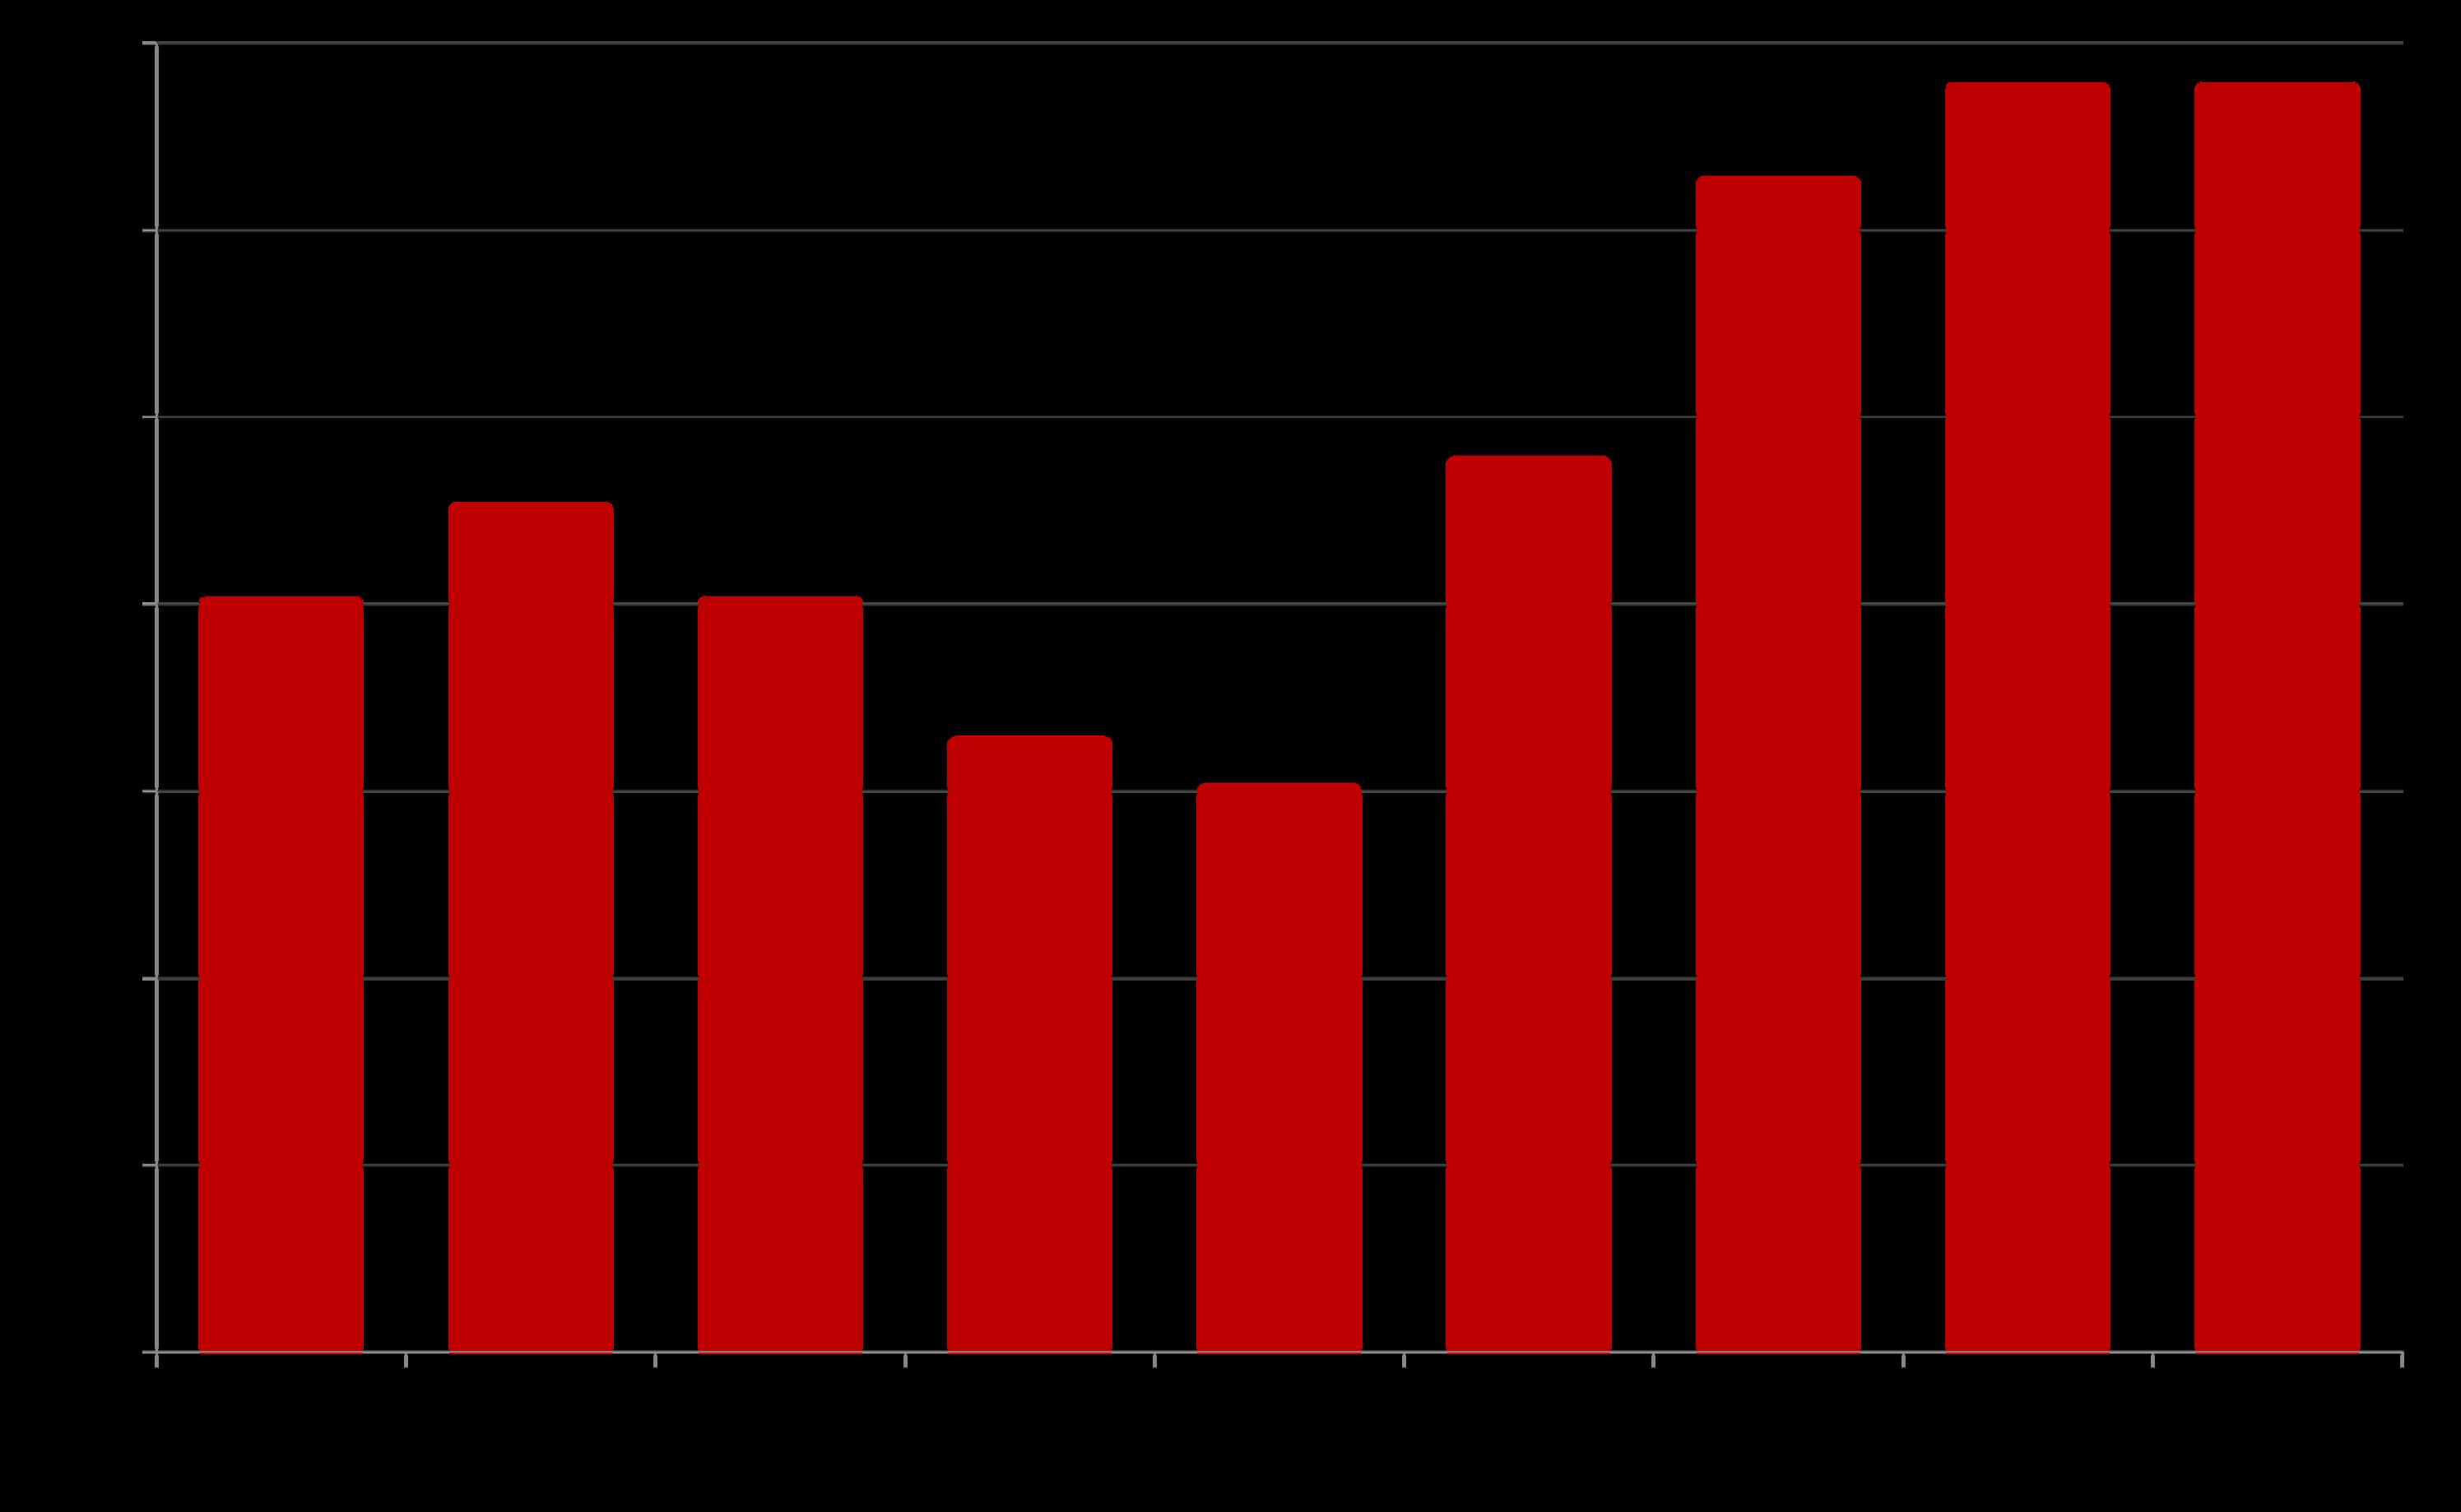
Price Reductions on Active Listings
Santa Clara County Market Dynamics
The number of price reductions typically ebbs and flows by season, but can also be affected by specific events in the economy and the market. It’s not unusual for price reductions to peak in late summer or autumn.
The number of price reductions in October 2025 rose from September, but was well down from the peak in June. It increased 15% year over year.
Listings are usually taken off market without selling because 1) buyers are unwilling to pay seller’s price, and/or 2) to sit out seasonal slowdowns – such as often occur in mid-summer and mid-winter.
*Expired and withdrawn listings, as reported to the MLSLISTINGS for houses, condos and townhouses, per Broker Metrics. Data from sources deemed reliable but may contain errors and subject to revision. All numbers approximate.
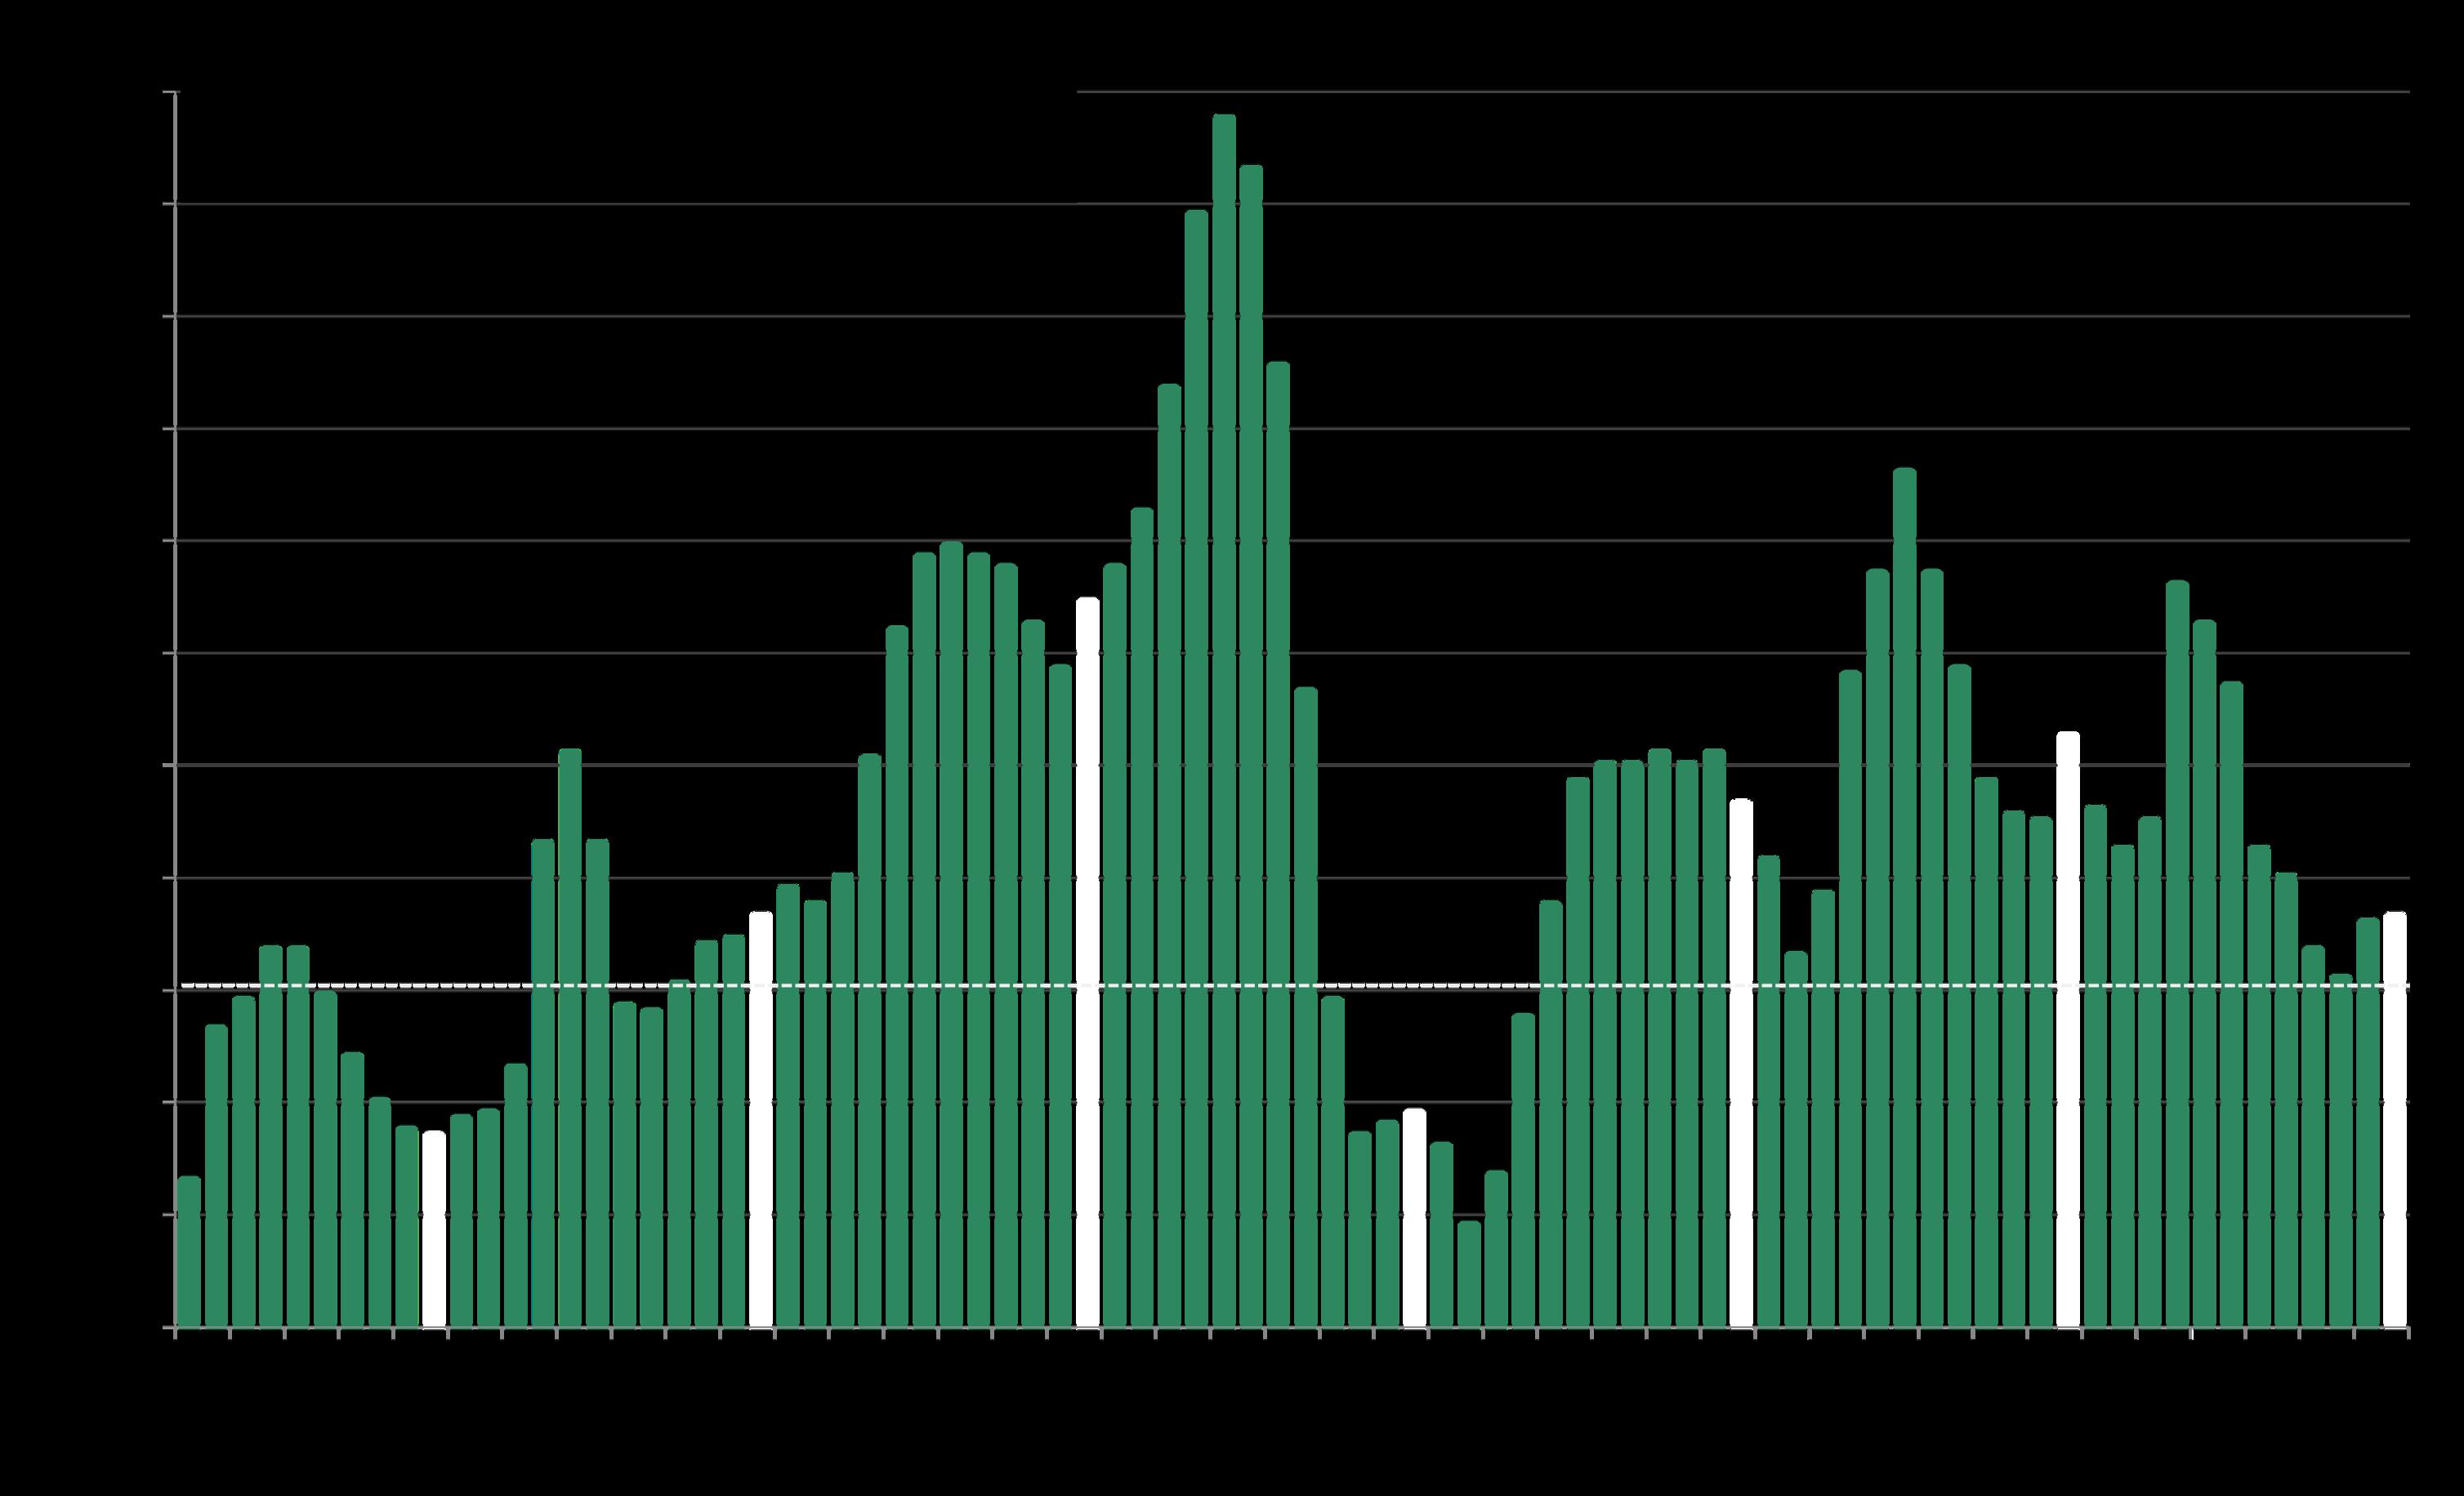
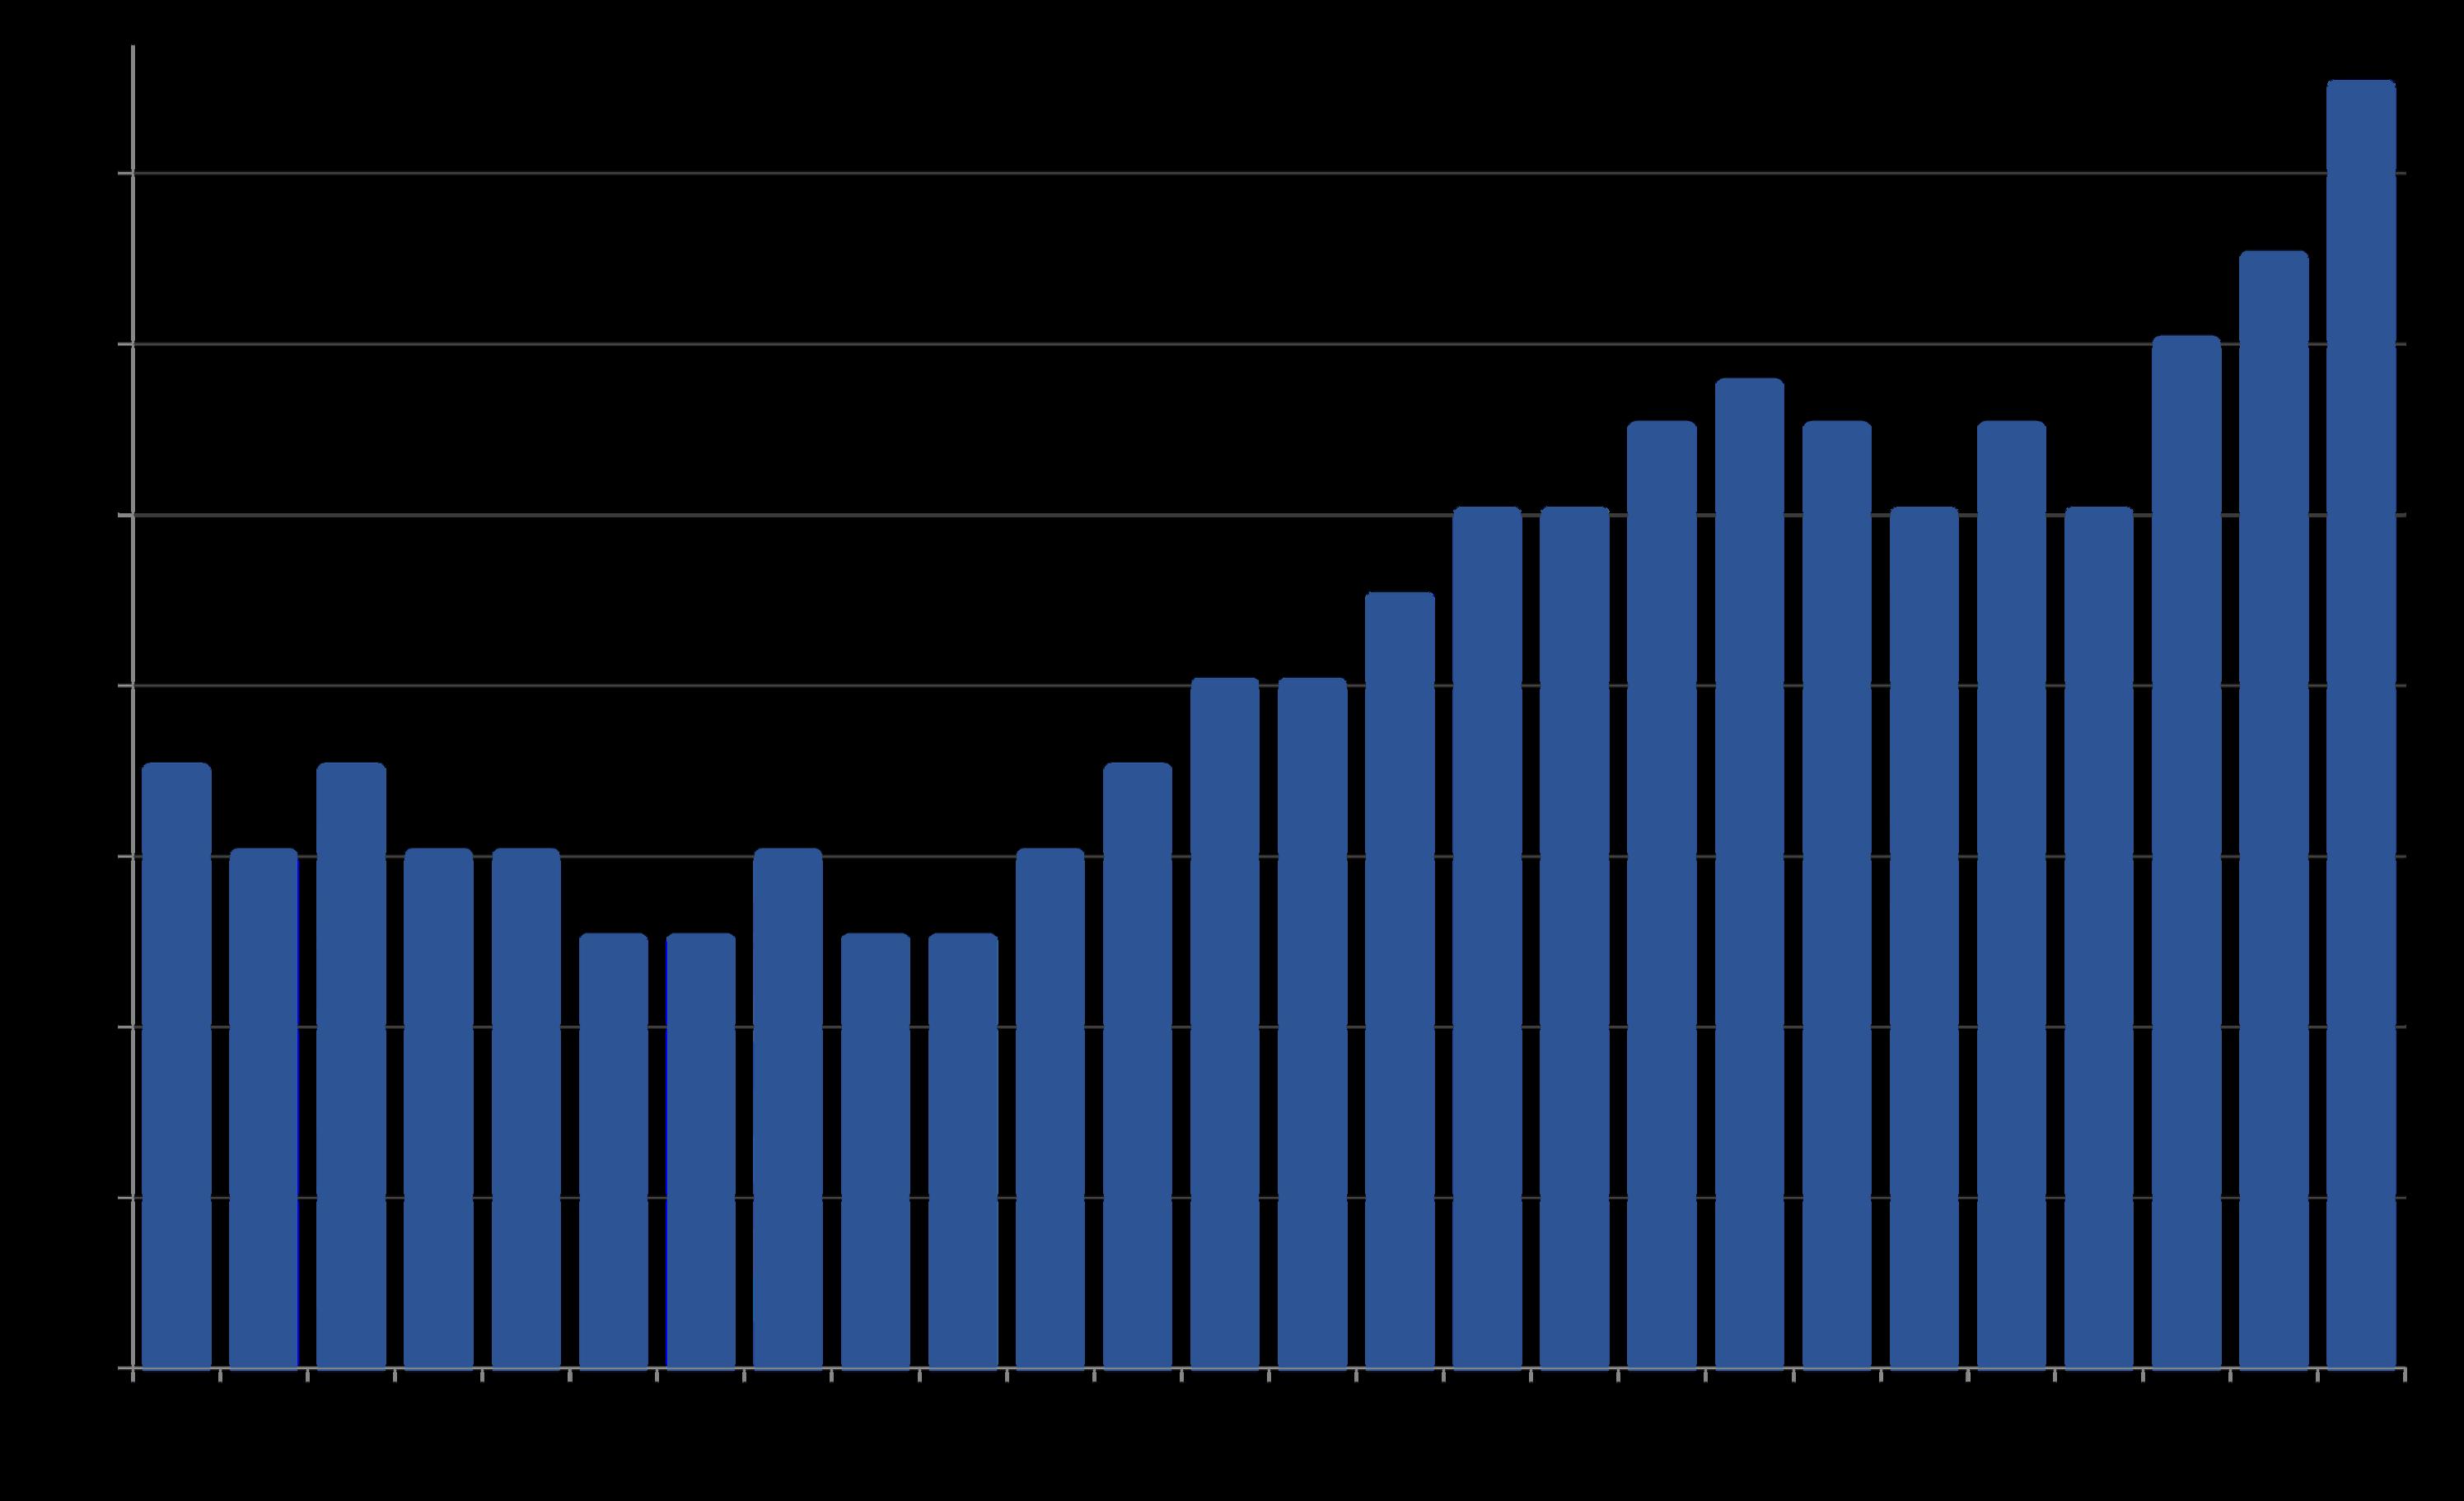
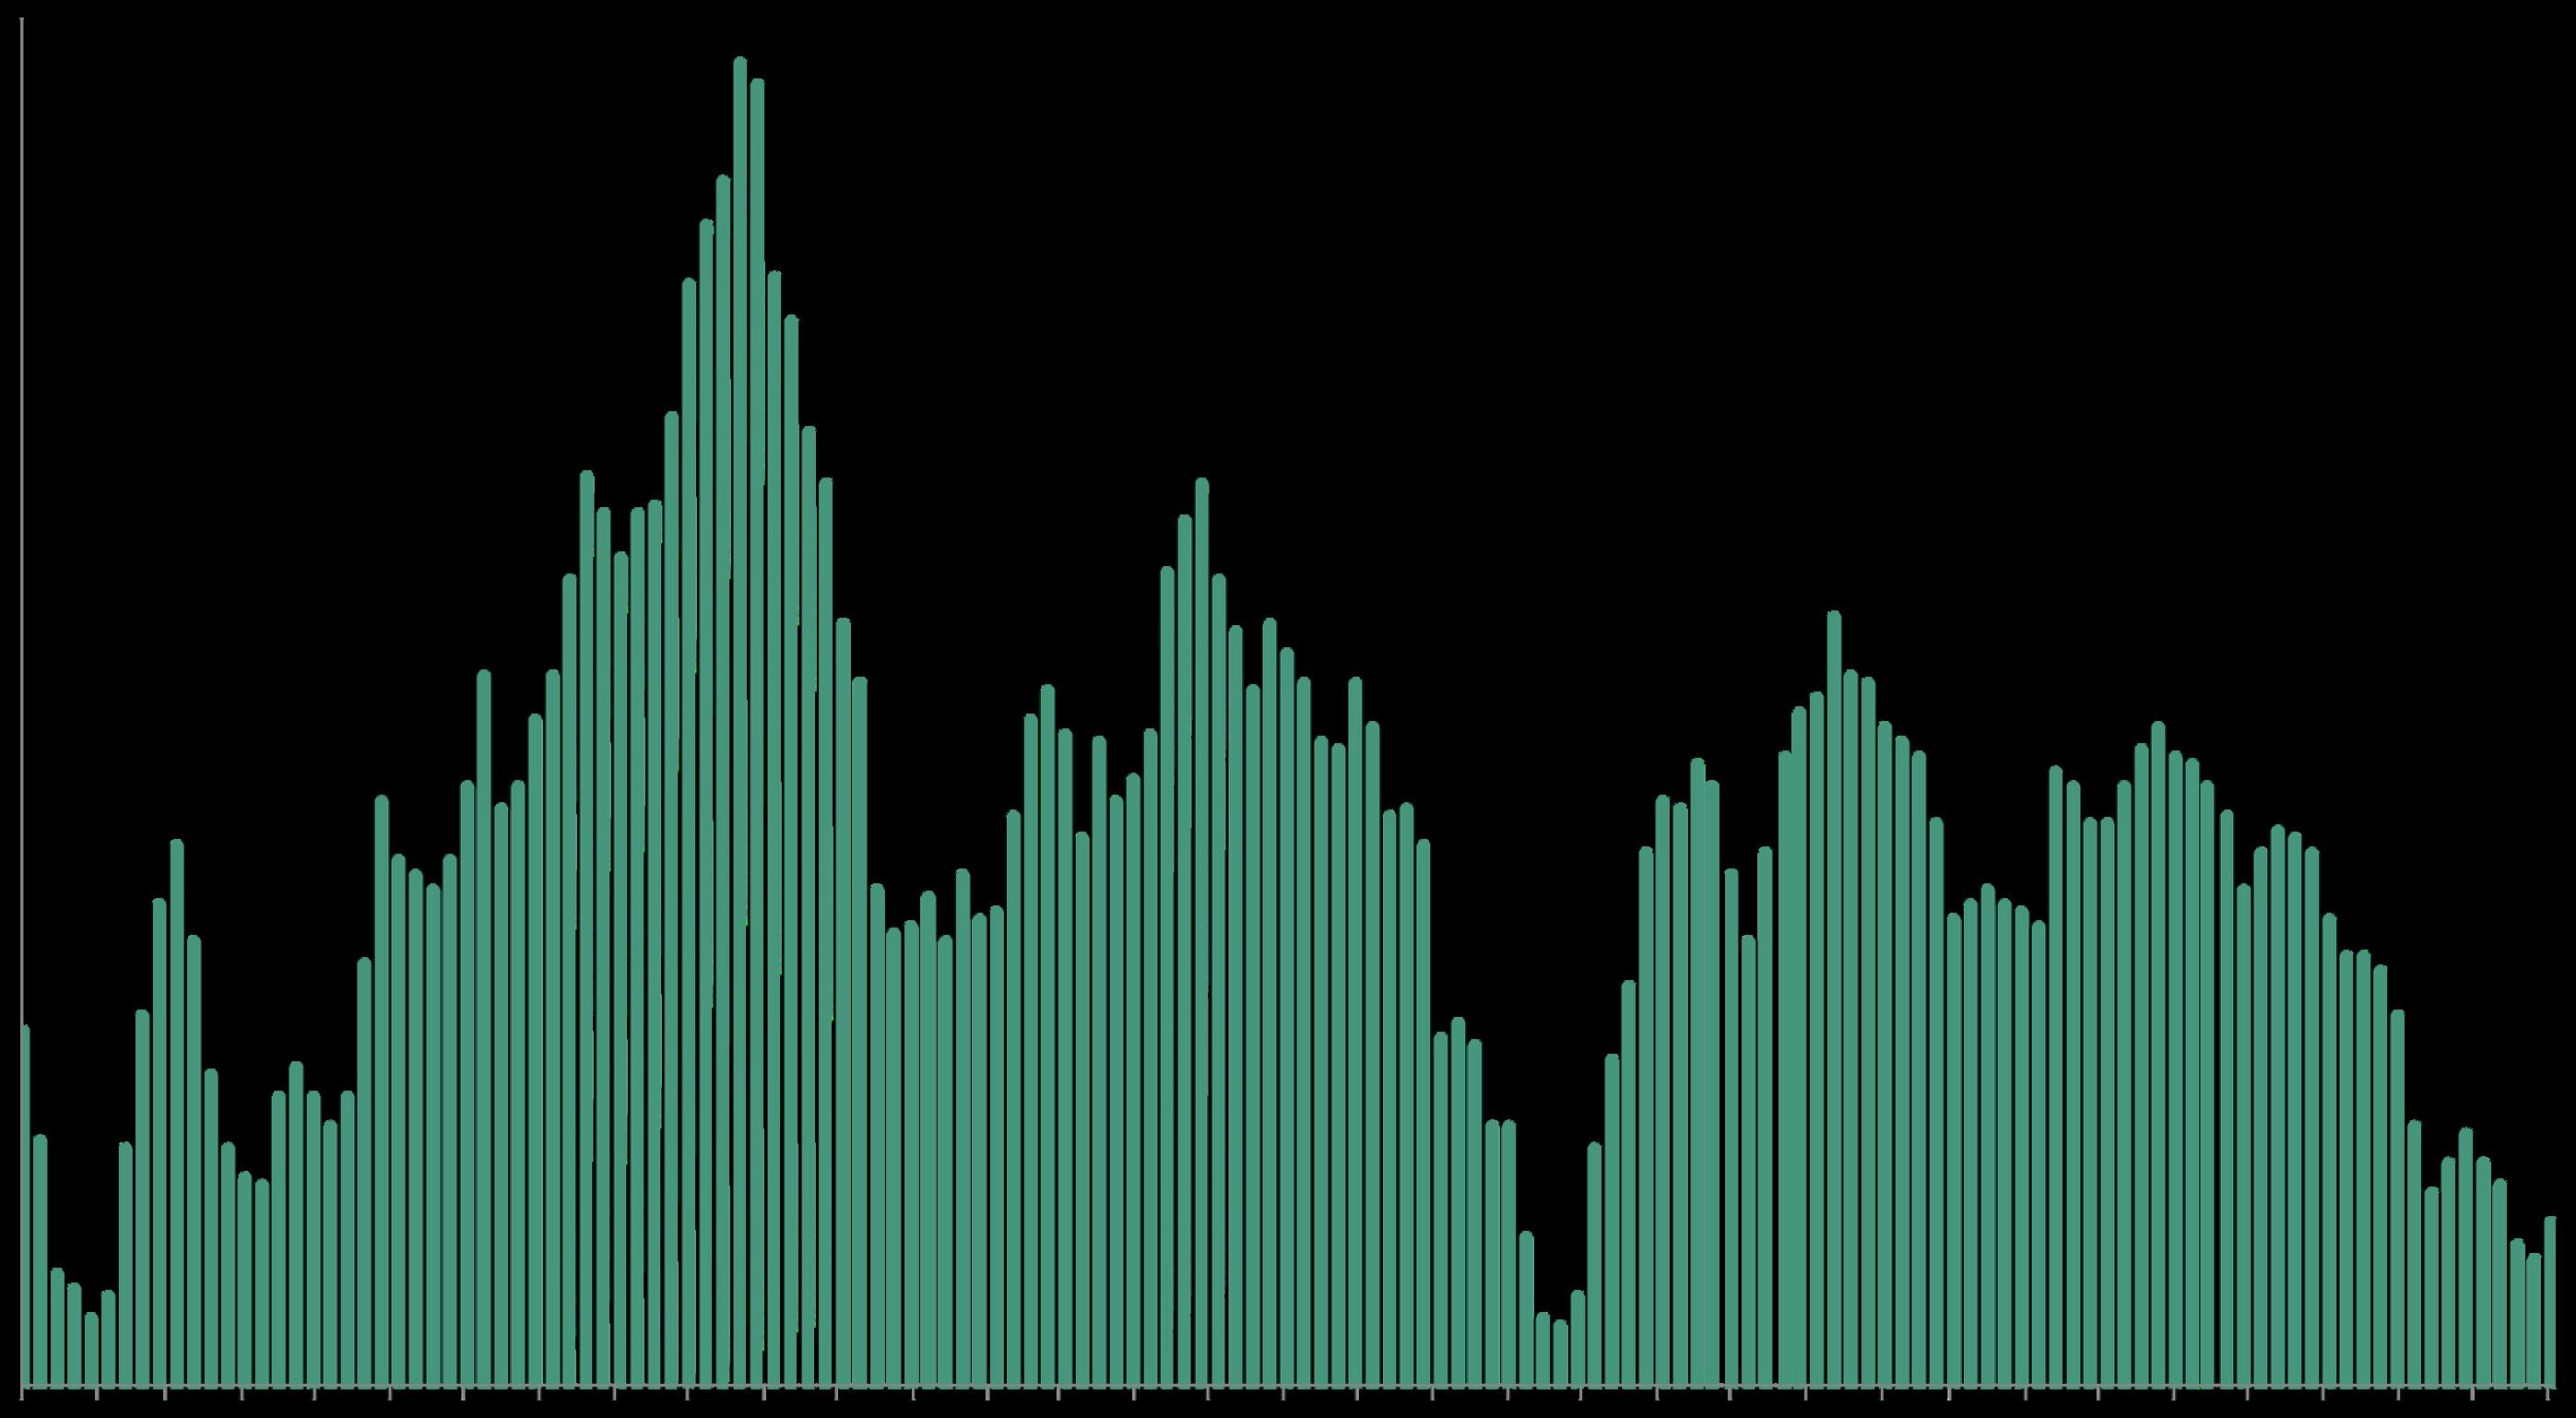
Overbidding List Prices in Santa Clara County
Percentage of Home Sales Closing over List Price, since 2018
Salesin1monthmostlyreflectmarket
More overbidding dynamics in the previous month.
Higher overbidding percentages signify more competition for new listings. 56% of all home sales sold for over list price in October 2025 (down from 66% in October 2024). By property type, 63% of houses, 53% of townhouses, and 23% of condos sold over asking.
Average Sales Price to Original List Price Percentage
Santa Clara County Over/Under Bidding: Market Dynamics & Seasonality
100% = an average sales price at original list price. 110% = an average sales price 10% over asking price; 96% = 4% below asking price.
This statistic fluctuates by season, and is a lagging indicator of market activity 3-6 weeks earlier. Overbidding statistics can be affected by strategic underpricing strategies.
The average home sale sold 1.5% over list price in October 2025, down from +4.5% in October 2024. By property type: Houses sold about 2.5% over LP, townhouses, 1% over LP, and condos, 4% below LP.
Average Days on Market: Speed of Sale
Santa Clara County: Market Dynamics & Seasonality
A measurement of how long it takes the homes that sell to go into contract, this statistic typically ebbs and flows per seasonal demand trends, and is a lagging indicator of market activity 3-6 weeks earlier.
Homes typically sell fastest in spring and slowest in midwinter. In October 2025, the average days-on- market was 28 days (up from 21 days in October 2024). By property type, the count for houses was 24 days, for townhouses, 27 days, and for condos, 52 days.
Sales of houses, condos, townhouses reported to NorCal MLS Alliance, per Infosparks or to MLSLISTINGS perBroker Metrics.Dataderivedfromsources deemedreliable,butmay containerrors and subject to revision. All numbers approximate, and may change with late-reported sales.
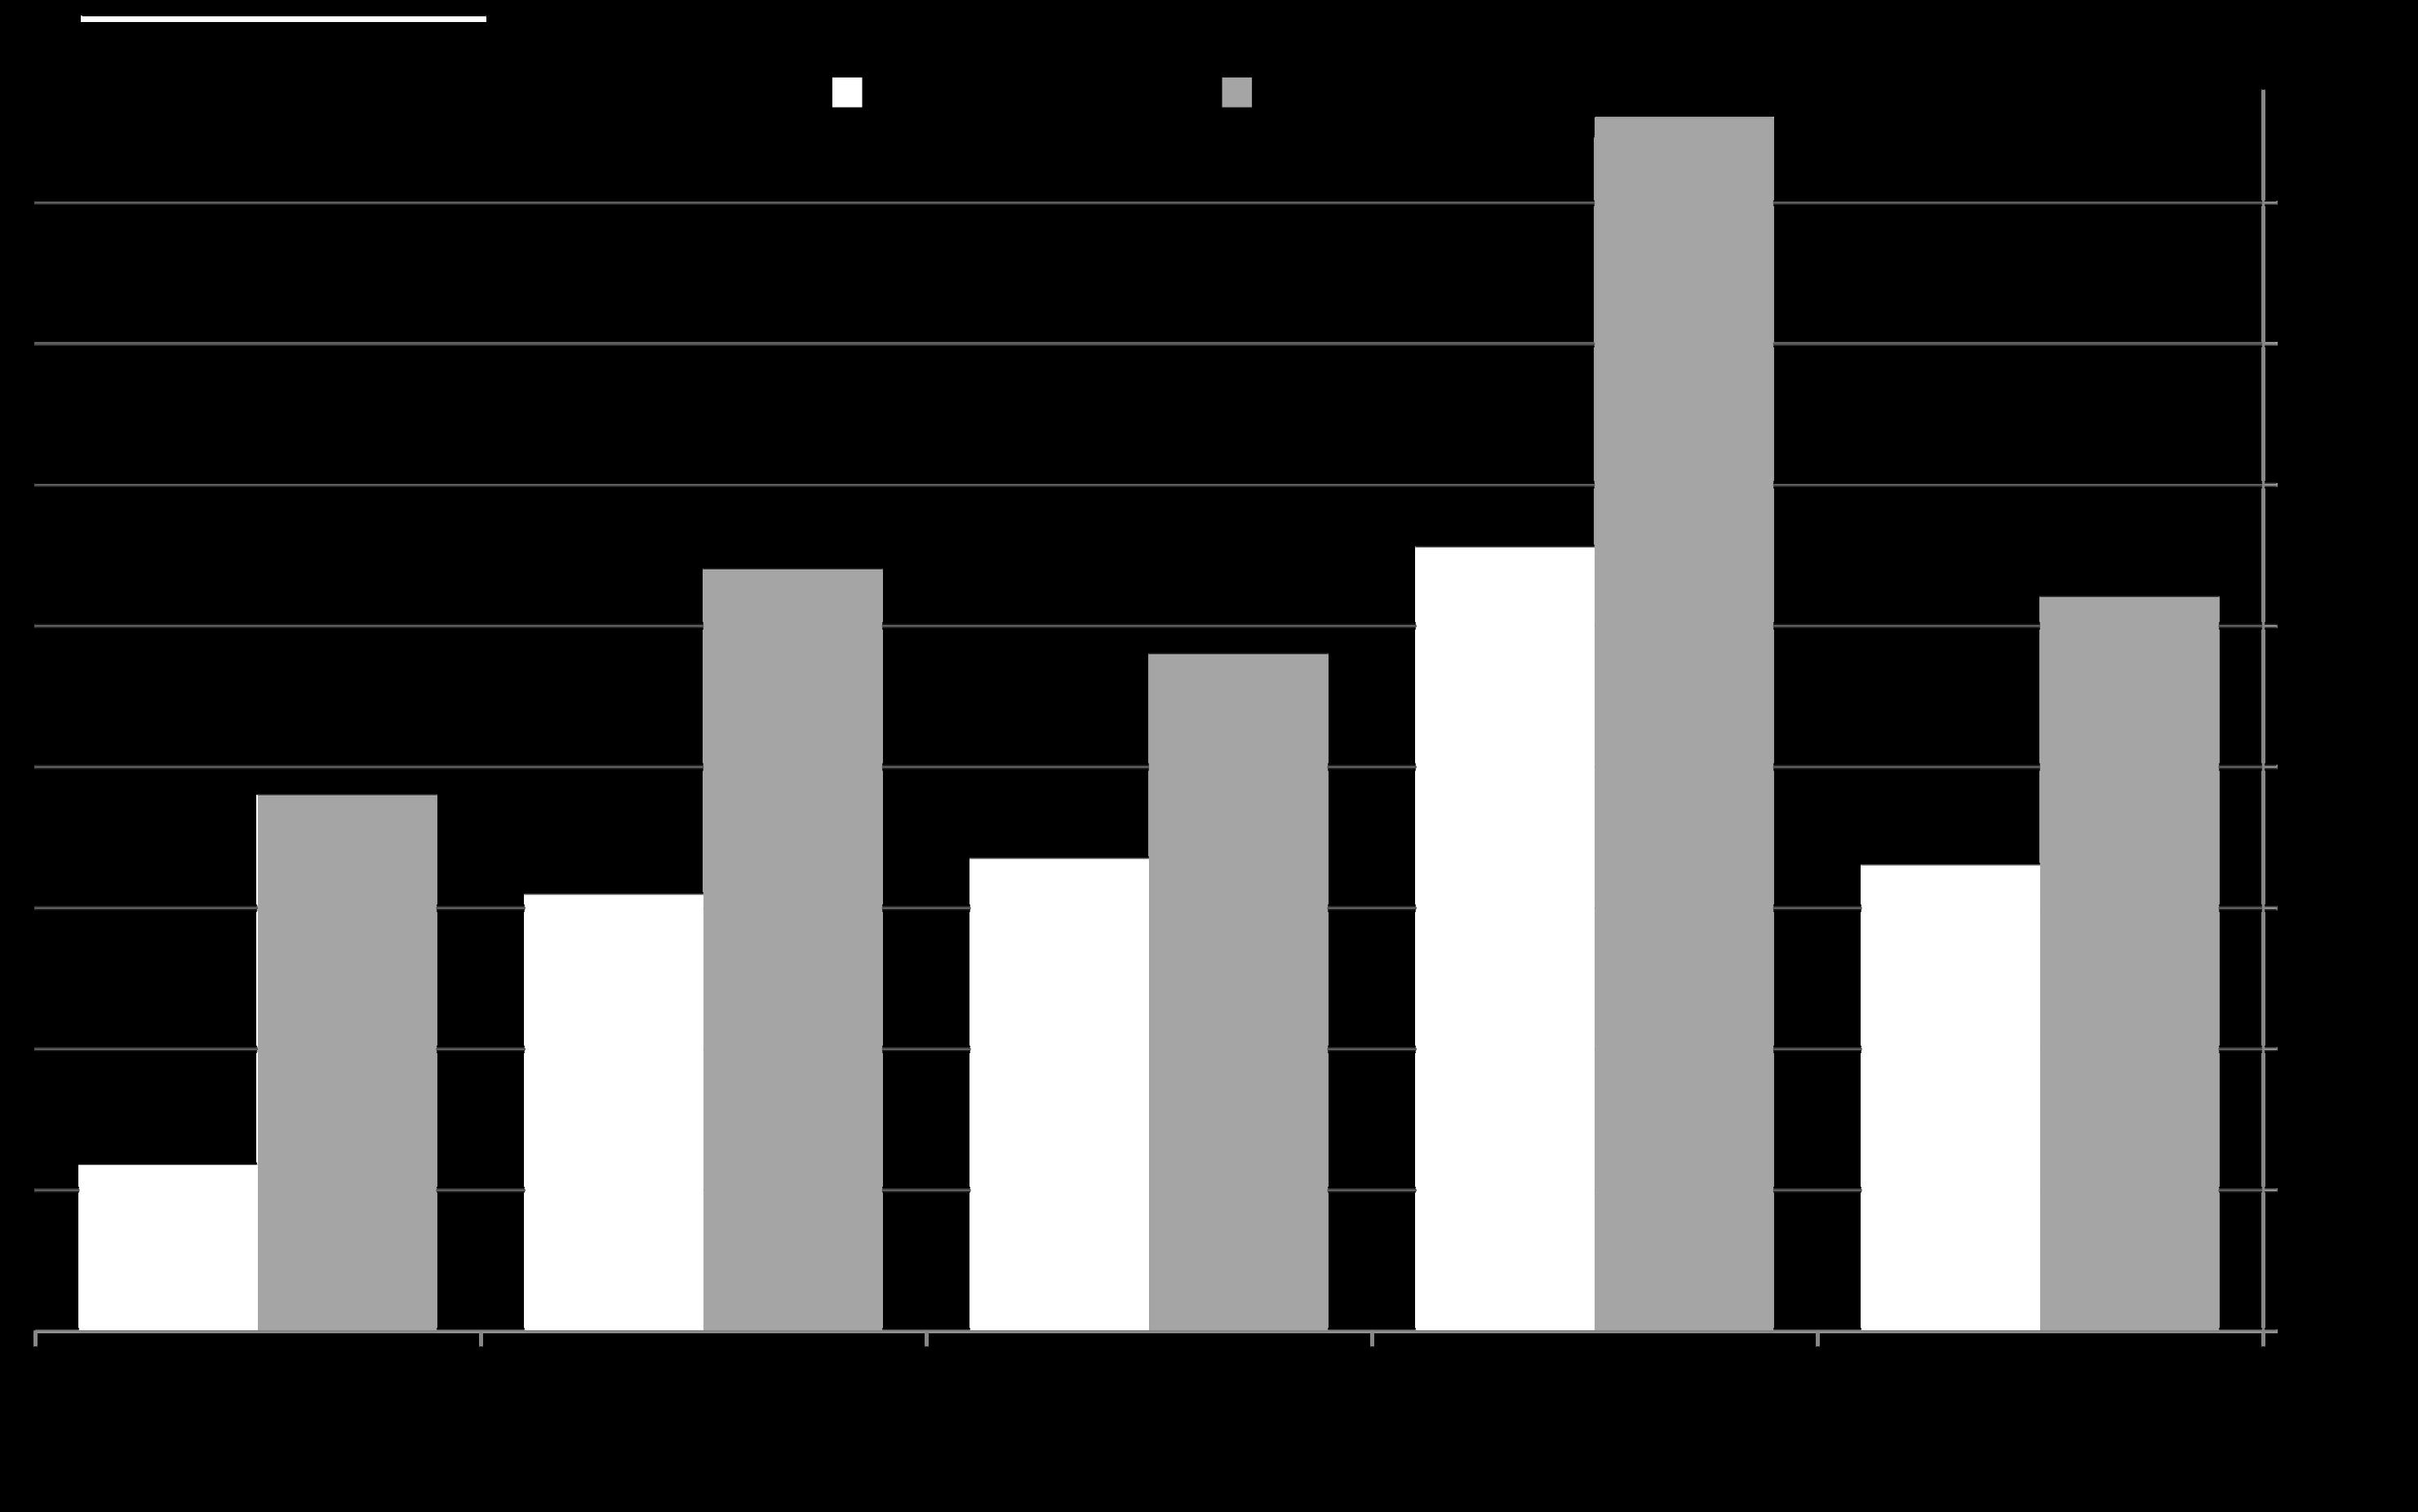
Percentage of Buyers Having Difficulties Obtaining Insurance
State of California, 2025 vs. 2023, by Property Location* 2023 2025
The ability to find comprehensive, affordable homeowner’s insurance continues to be an increasingly serious issue for buyers (and homeowners). In a 2025 survey, 17% of CA real estate agents reported having a transaction terminate due to an inability to do so.
*Asked of Buyer’s agents: “Did thebuyer have difficulties obtaining fire/homeowners insurance?”
Many factors affect home insurance costs including susceptibility to natural disasters like severe weather events and fire; property construction; local construction costs; and, as in CA, state regulation of insurers. Overall, rates have been rapidly accelerating with increasing damage claims, and often vary enormously between regions of the same state.
*PerBankrate: https://www.bankrate.com/insurance/homeowners-insurance/homeowners-insurance- cost/#cost-by-state. Rates refreshed September 2025. The average annual home insurance premium for a home with a dwelling coverage amount of $300,000. Will not include flood or earthquake insurance.
Data from sources deemed reliable but may contain errors and subject to revision.
Share of Sales in Which Buyers Paid All Cash
National Home Sales in Selected Price Segments*
Percentage of U.S. home sales in price segment in which buyers paid all cash.
“All-cash home purchases remain a powerful force shaping the housing market. Roughly one-third of homes sold in the first half of 2025 were paid for in all cash…High-wealth and older households are far more likely to purchase homes with cash…Investors, especially institutional players, are a key driver of cash purchases... [with] limited liability companies and corporate entities accounting for a disproportionate share of [investor] cash transactions. Secondhome buyers, particularly in vacation markets, also frequently buy with cash.” Excerpted quotes*
1.3% of U.S. home sales were for $5,000,000+.
$200,000$350,000 21%
69% of U.S. home sales sold between $200,000 and $1,000,000. (21% sold for less than $200,000.)
9% of U.S. home sales sold between $1,000,000 & $5,000,000.
-
-
-
*U.S. home sales in first half of 2025 per Realtor.com Research Report, “Cash Is King: Trends in All-Cash Home Sales,”https://www.realtor.com/research/all-cash-sale-trends-h1-2025/dated 10/7/25.Percentagesrounded. Data deemed reliable but may contain errors and subject to revision. All numbers to be considered approximate.
Years of Homeownership before Selling
California Real Estate Market since 2000*
Homeowners have been staying in their homes longer before selling due to the “mortgage lock-in effect” of recent years, but, over the longer term, to the increasing age of the population and of homeowners specifically: Older age groups tend to move much less often than younger segments. This has large ramifications for the market’s supply and demand dynamics, causing significantly fewer listings to be available for purchase at any given time.
Percentage of Homes Purchased by International Buyers
California Real Estate Market since 2008*
The percentage of CA homes purchased by foreign buyers (in Q2) continued to decline. Of foreign buyers, the top 3 nations of origin in 2025 were India, Mexico and China. The percentage of buyers from China (13%) in 2025 is down from an average of 29% in 2019 – 2024. Due to new national immigration and visa policies, the percentage is expected to plunge in the next survey.
*Data per California Association of Realtors, 2025 Housing Market Survey, Q2 transactions. Data from sources deemed reliable, but not guaranteed and may contain errors. All numbers should be considered approximate.
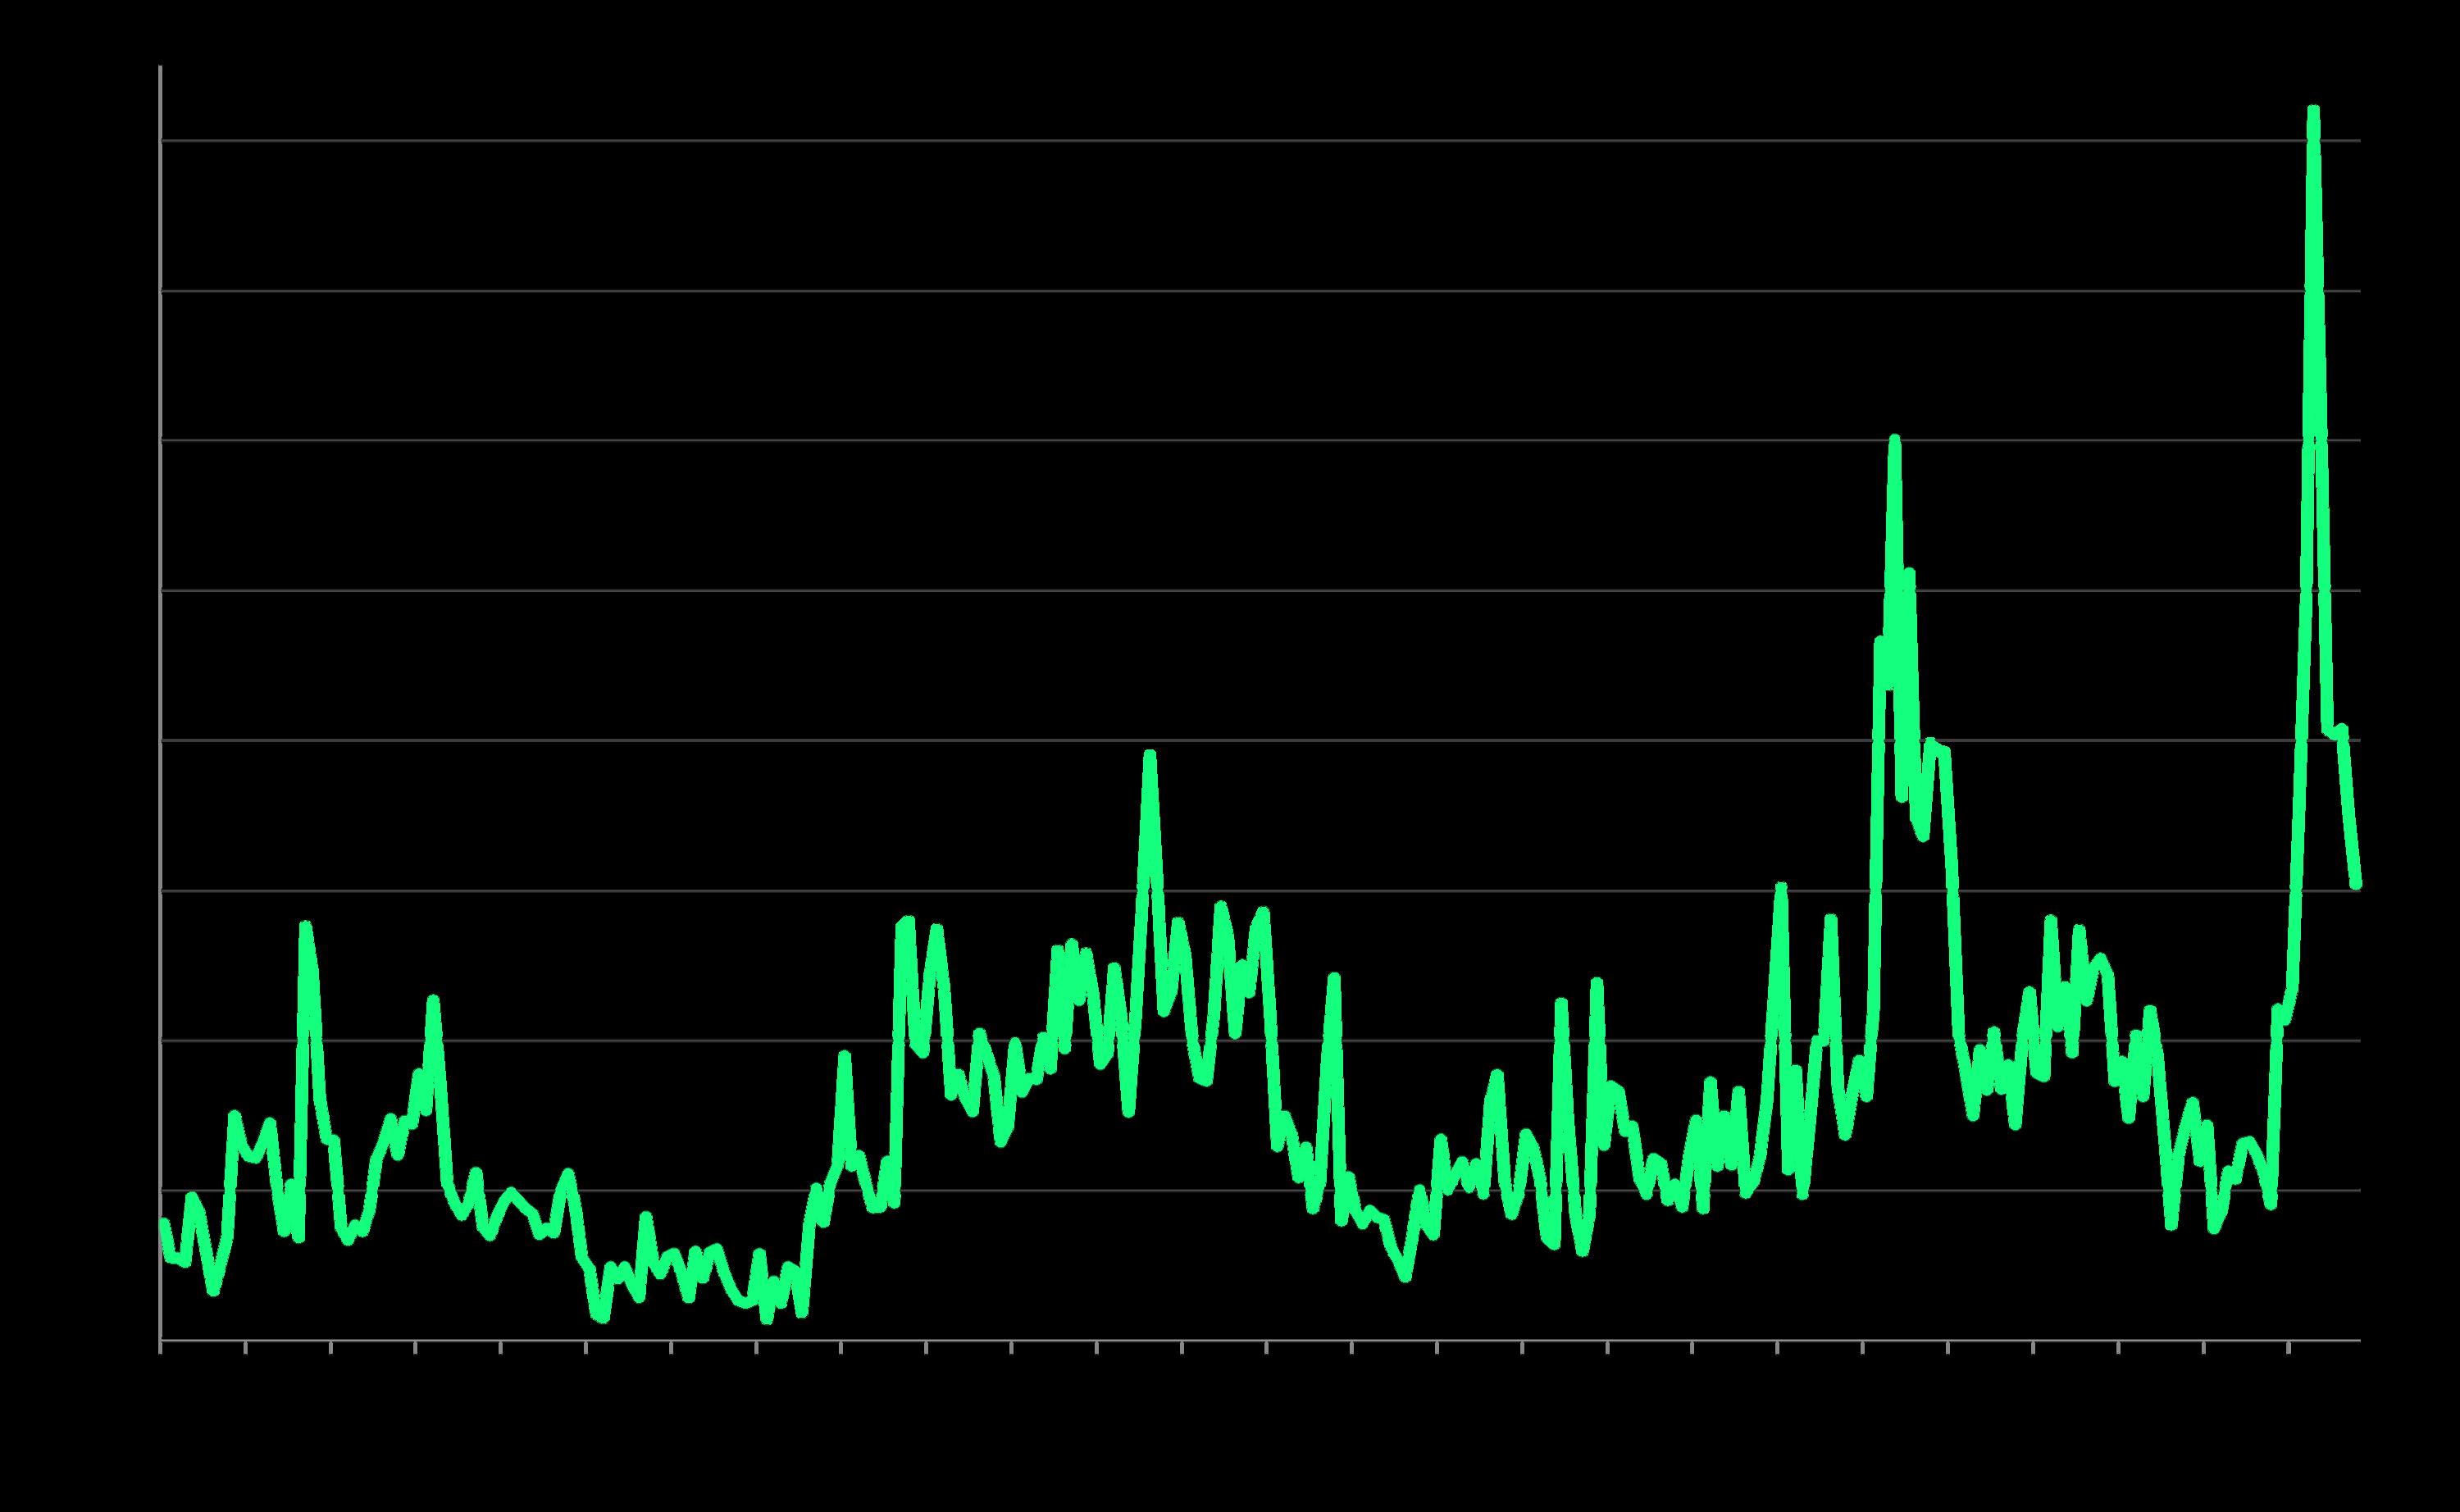
Per Freddie Mac (FHLMC), on November 6, 2025 theweekly average,30-year,conforming-loan interest rate rose slightly to 6.22%.
*Freddie Mac (FHLMC), 30-Year Fixed Rate Mortgage Weekly Average: https://www.freddiemac.com/pmms. Data from sources deemed reliable. Different sources of mortgage data sometimes vary in their determinations of daily and weekly rates. Data from sources deemed reliable but may contain errors. All numbers approximate.
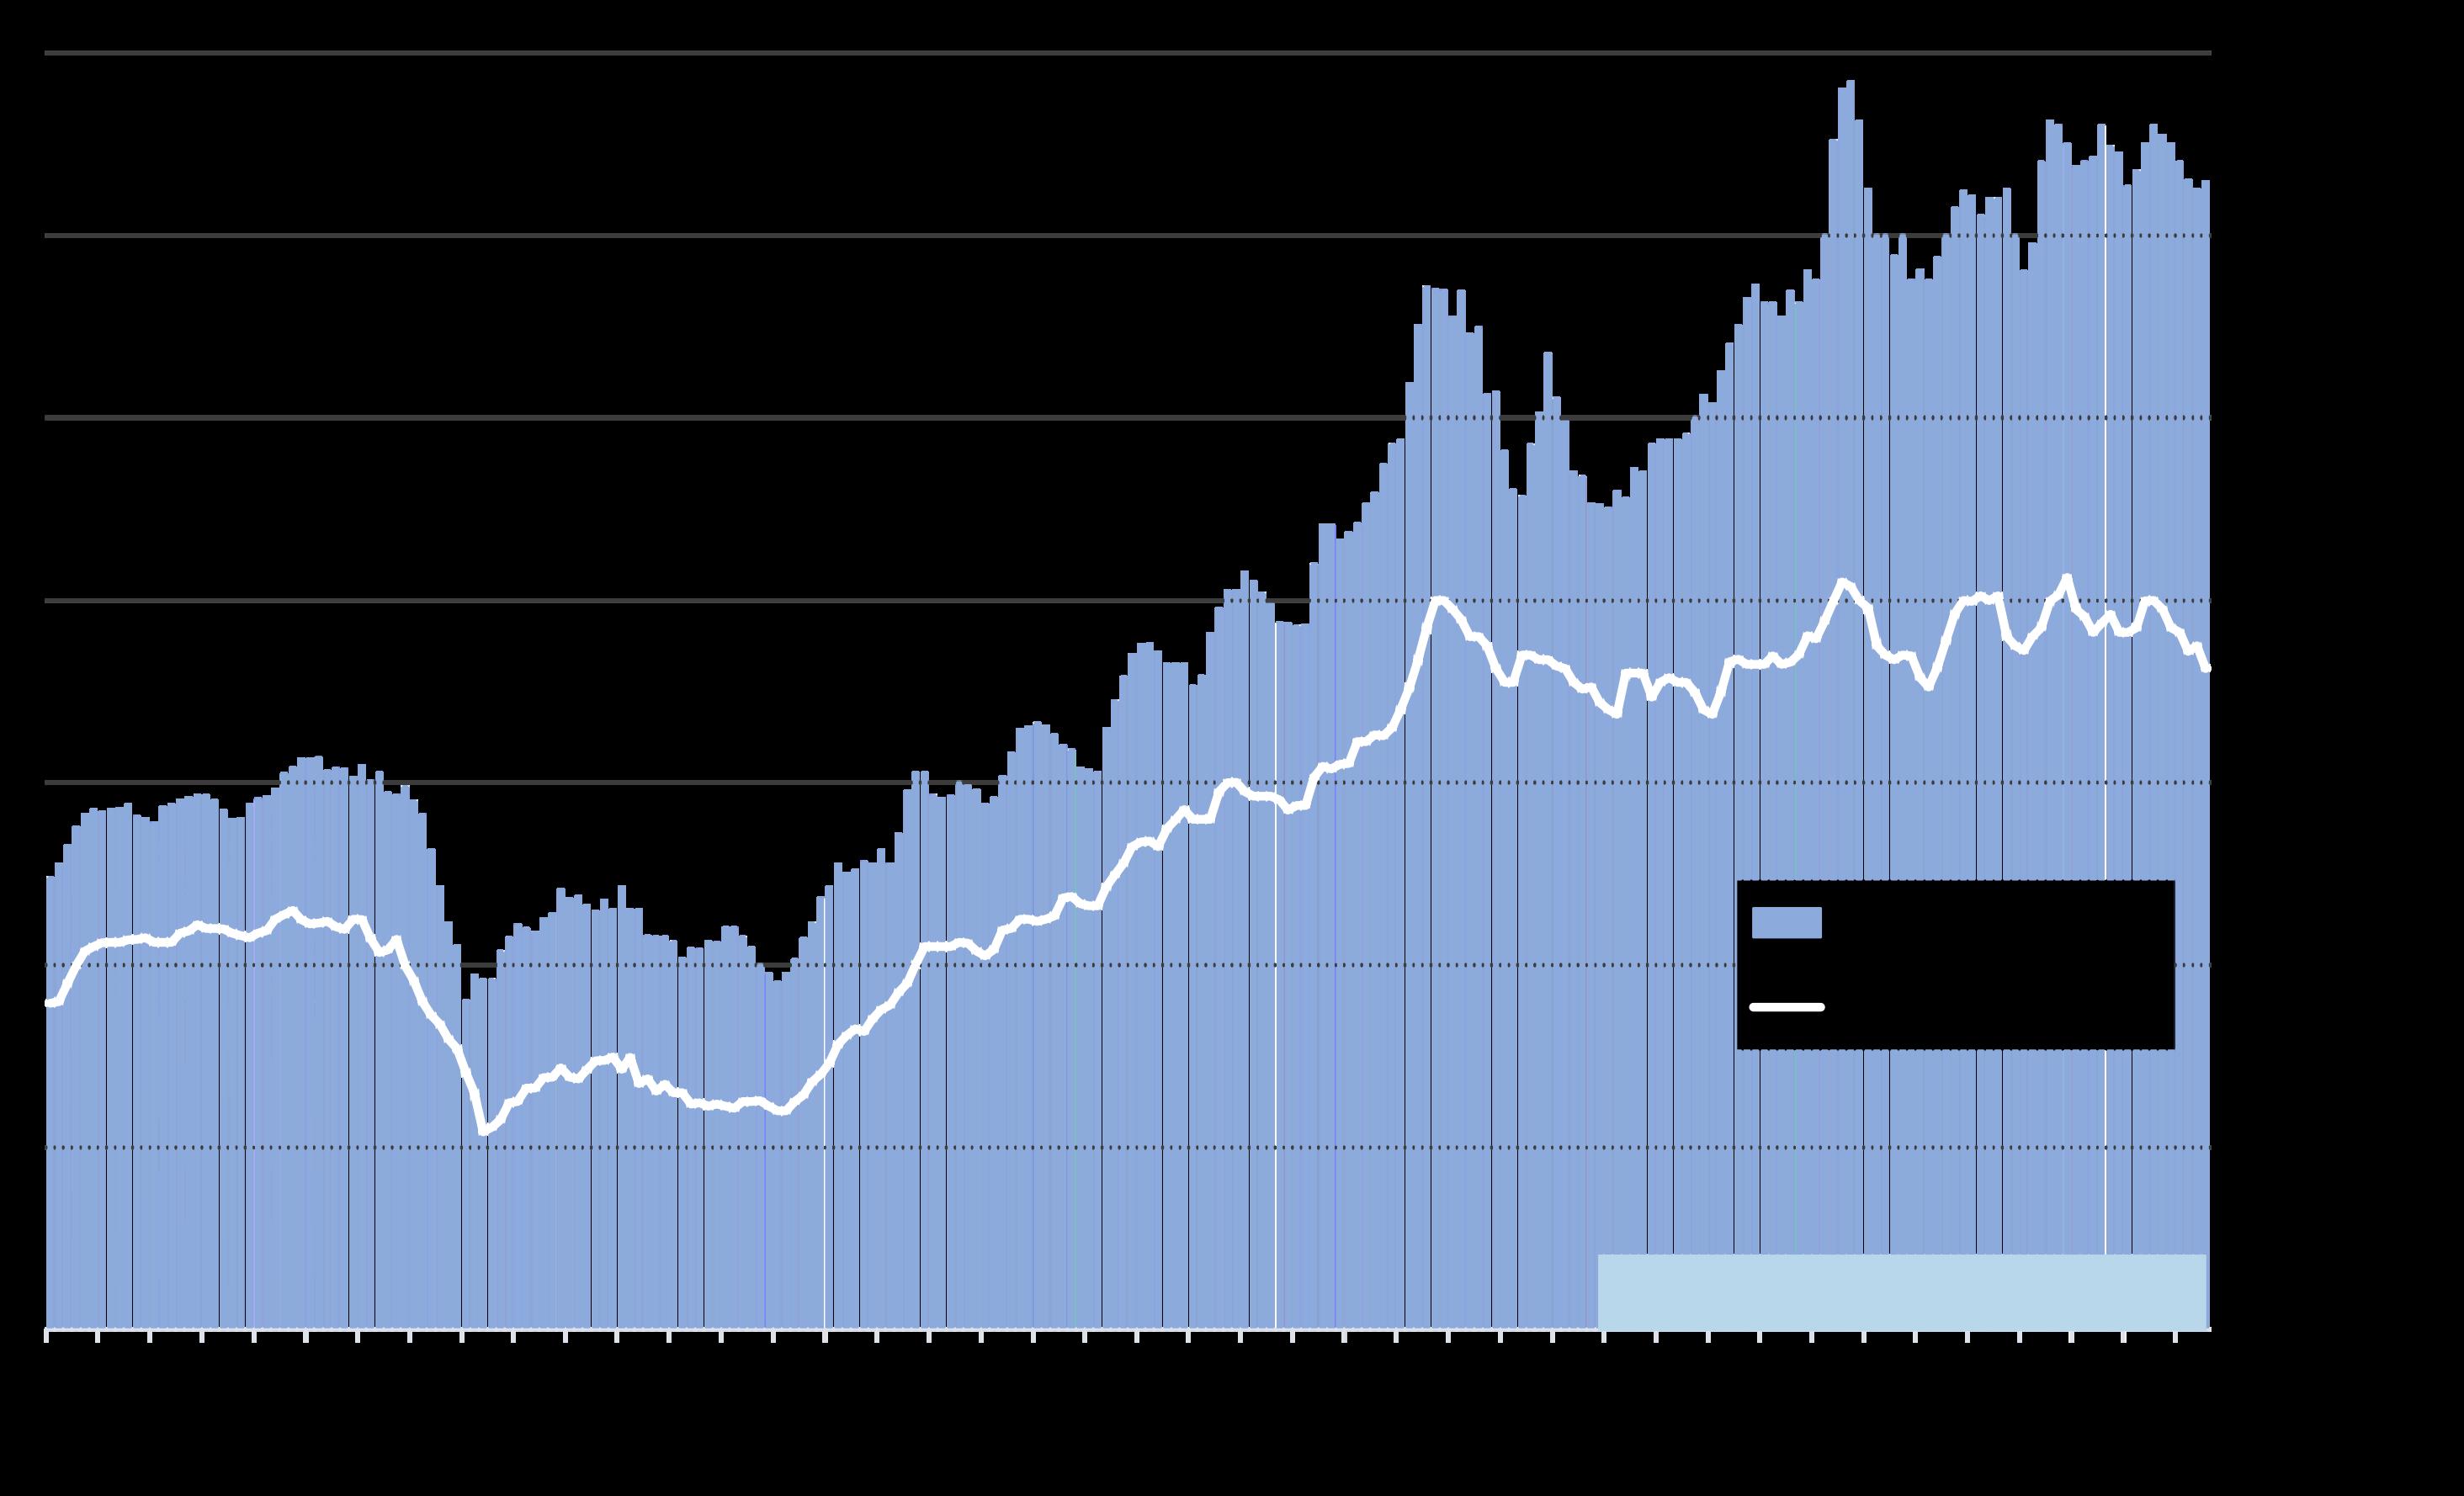
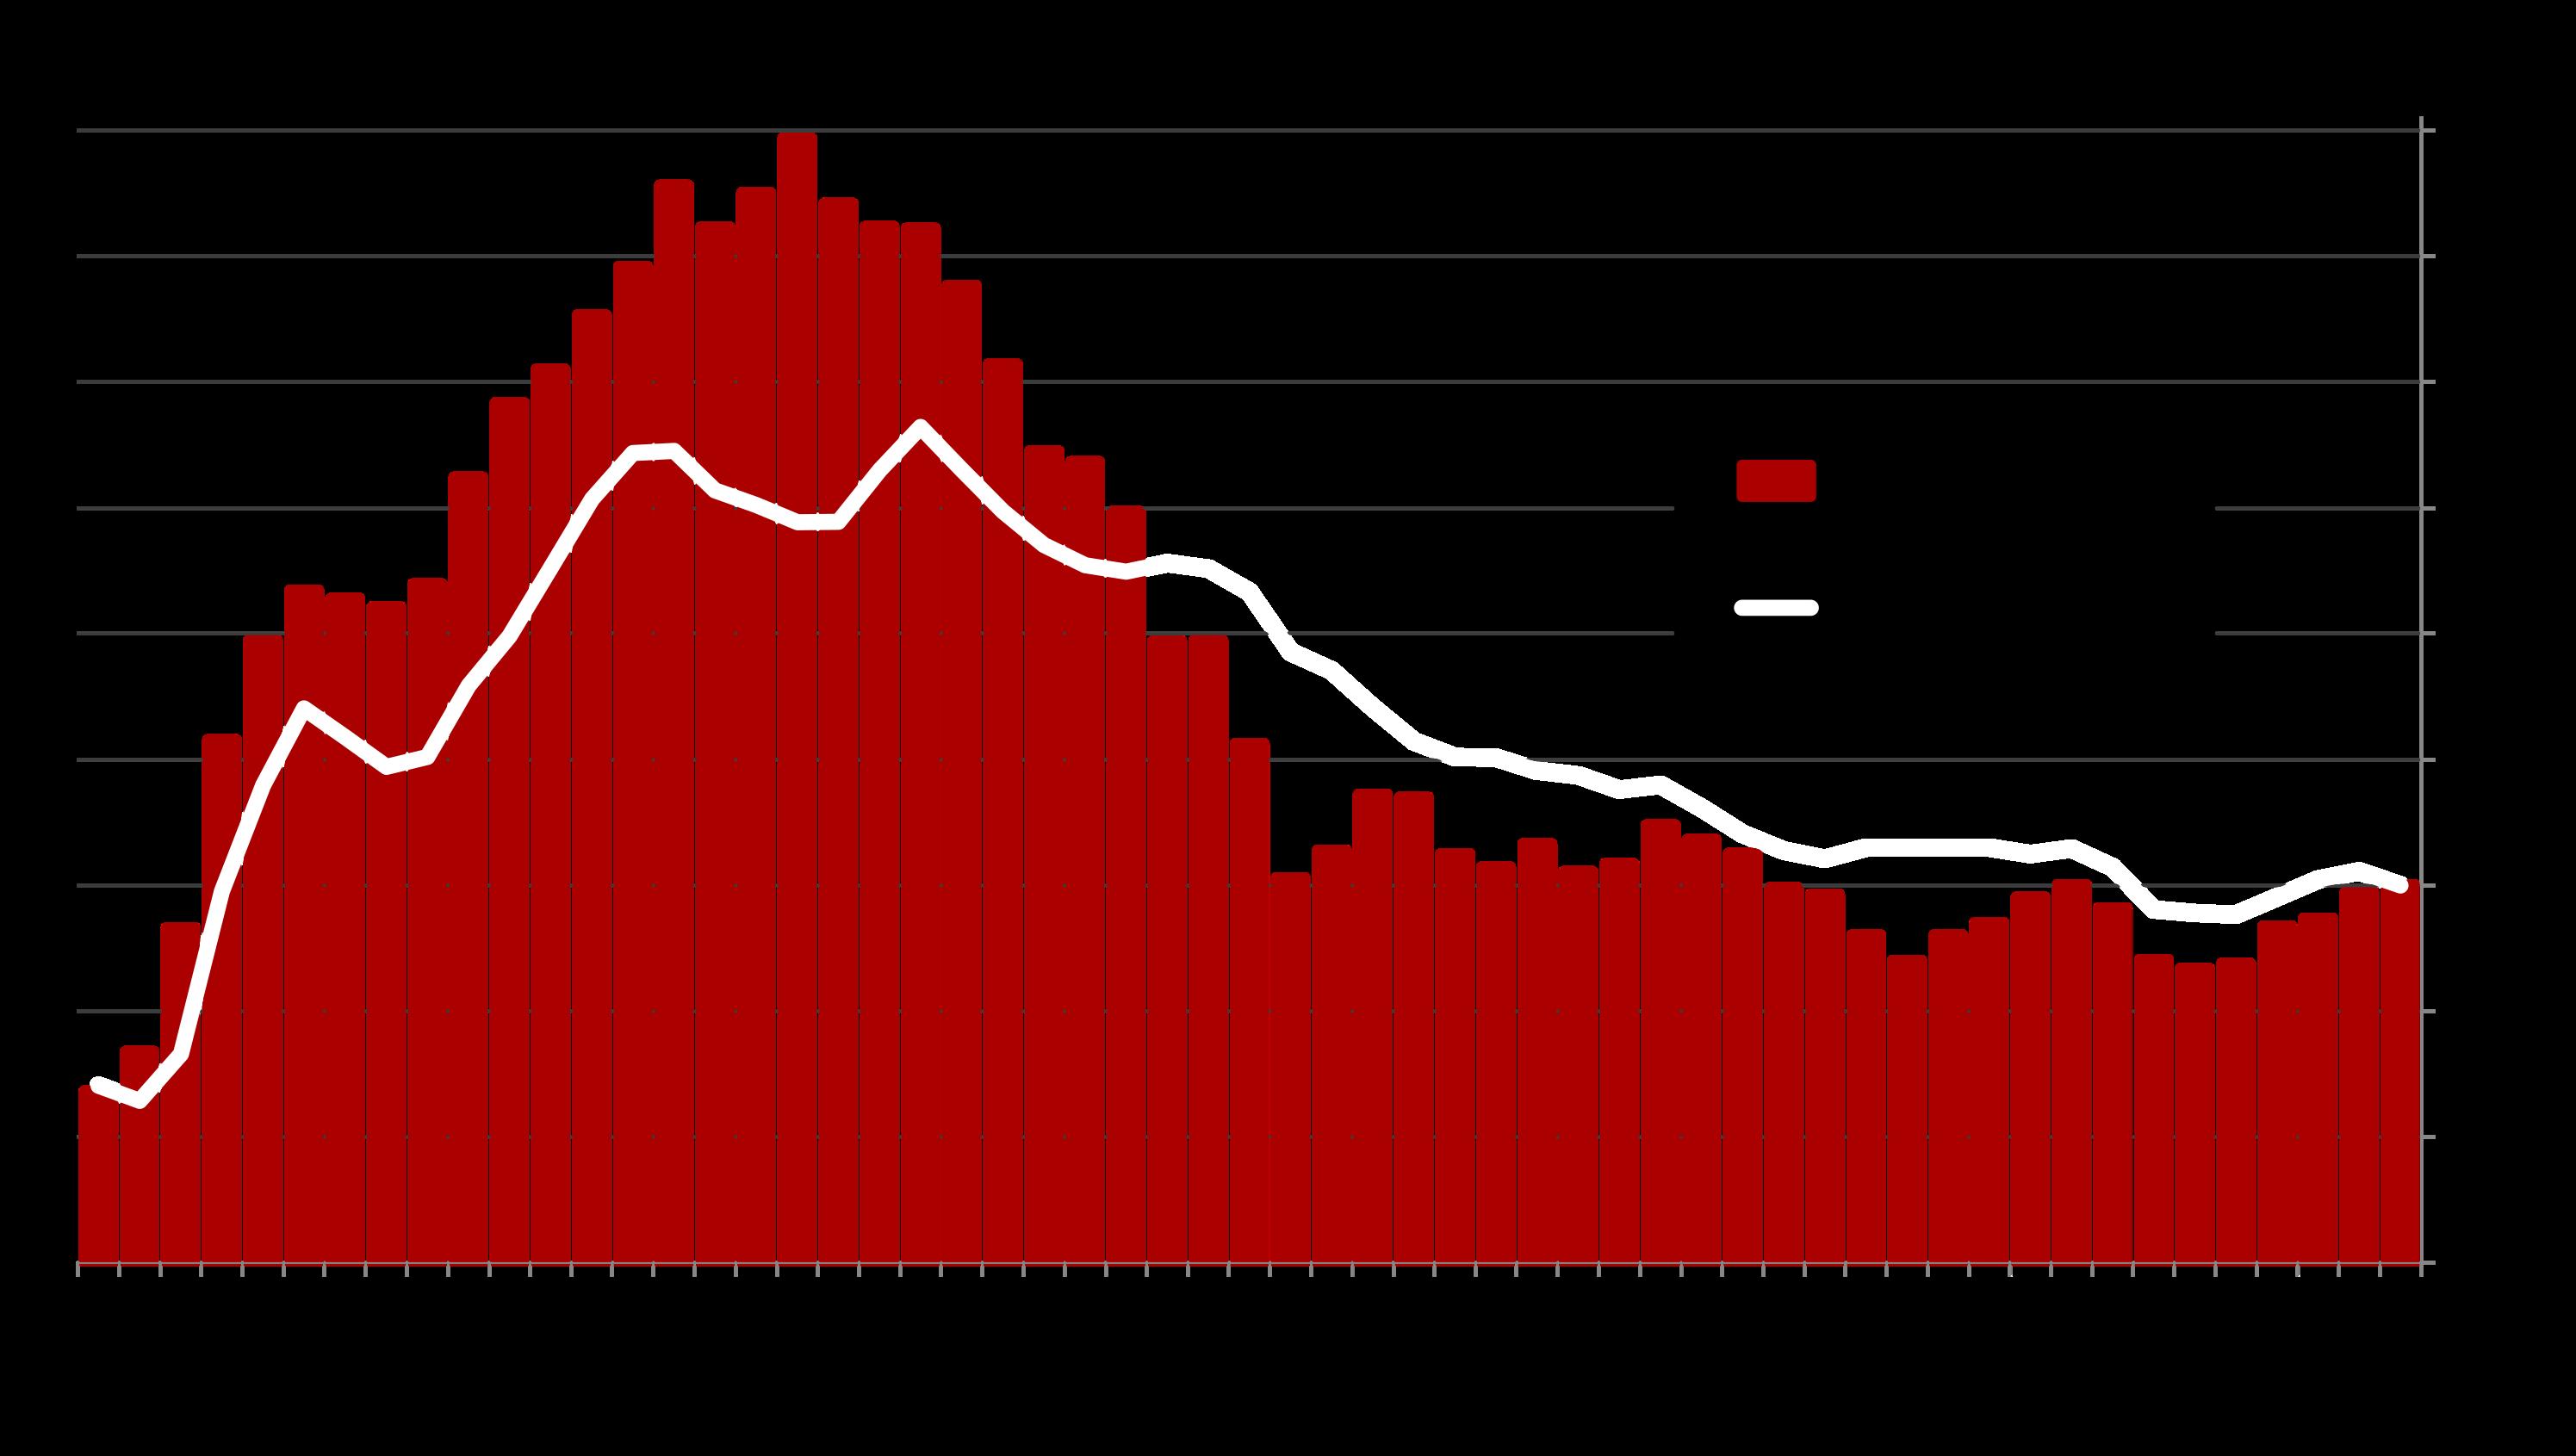
Bay Area Home Sales Volume vs. 30-Year Mortgage Interest Rate
Significant changes in interest rates and economic conditions will typically affect sales volumes in later months.
Many factors affect real estate markets, but generally speaking, when interest rates fall, sales volume rises, and vice versa.
The “target inflation rate” for the Federal Reserve Bank is 2%.
10/24/25
*Consumer Price Index for All Urban Consumers: All Items in U.S. City Average [CPIAUCSL], per Federal Reserve Bank of St. Louis; https://fred.stlouisfed.org/graph/?g=8dGq. Data from U.S. Bureau of Labor Statistics. CPIAUCSL is a
urban consumers.
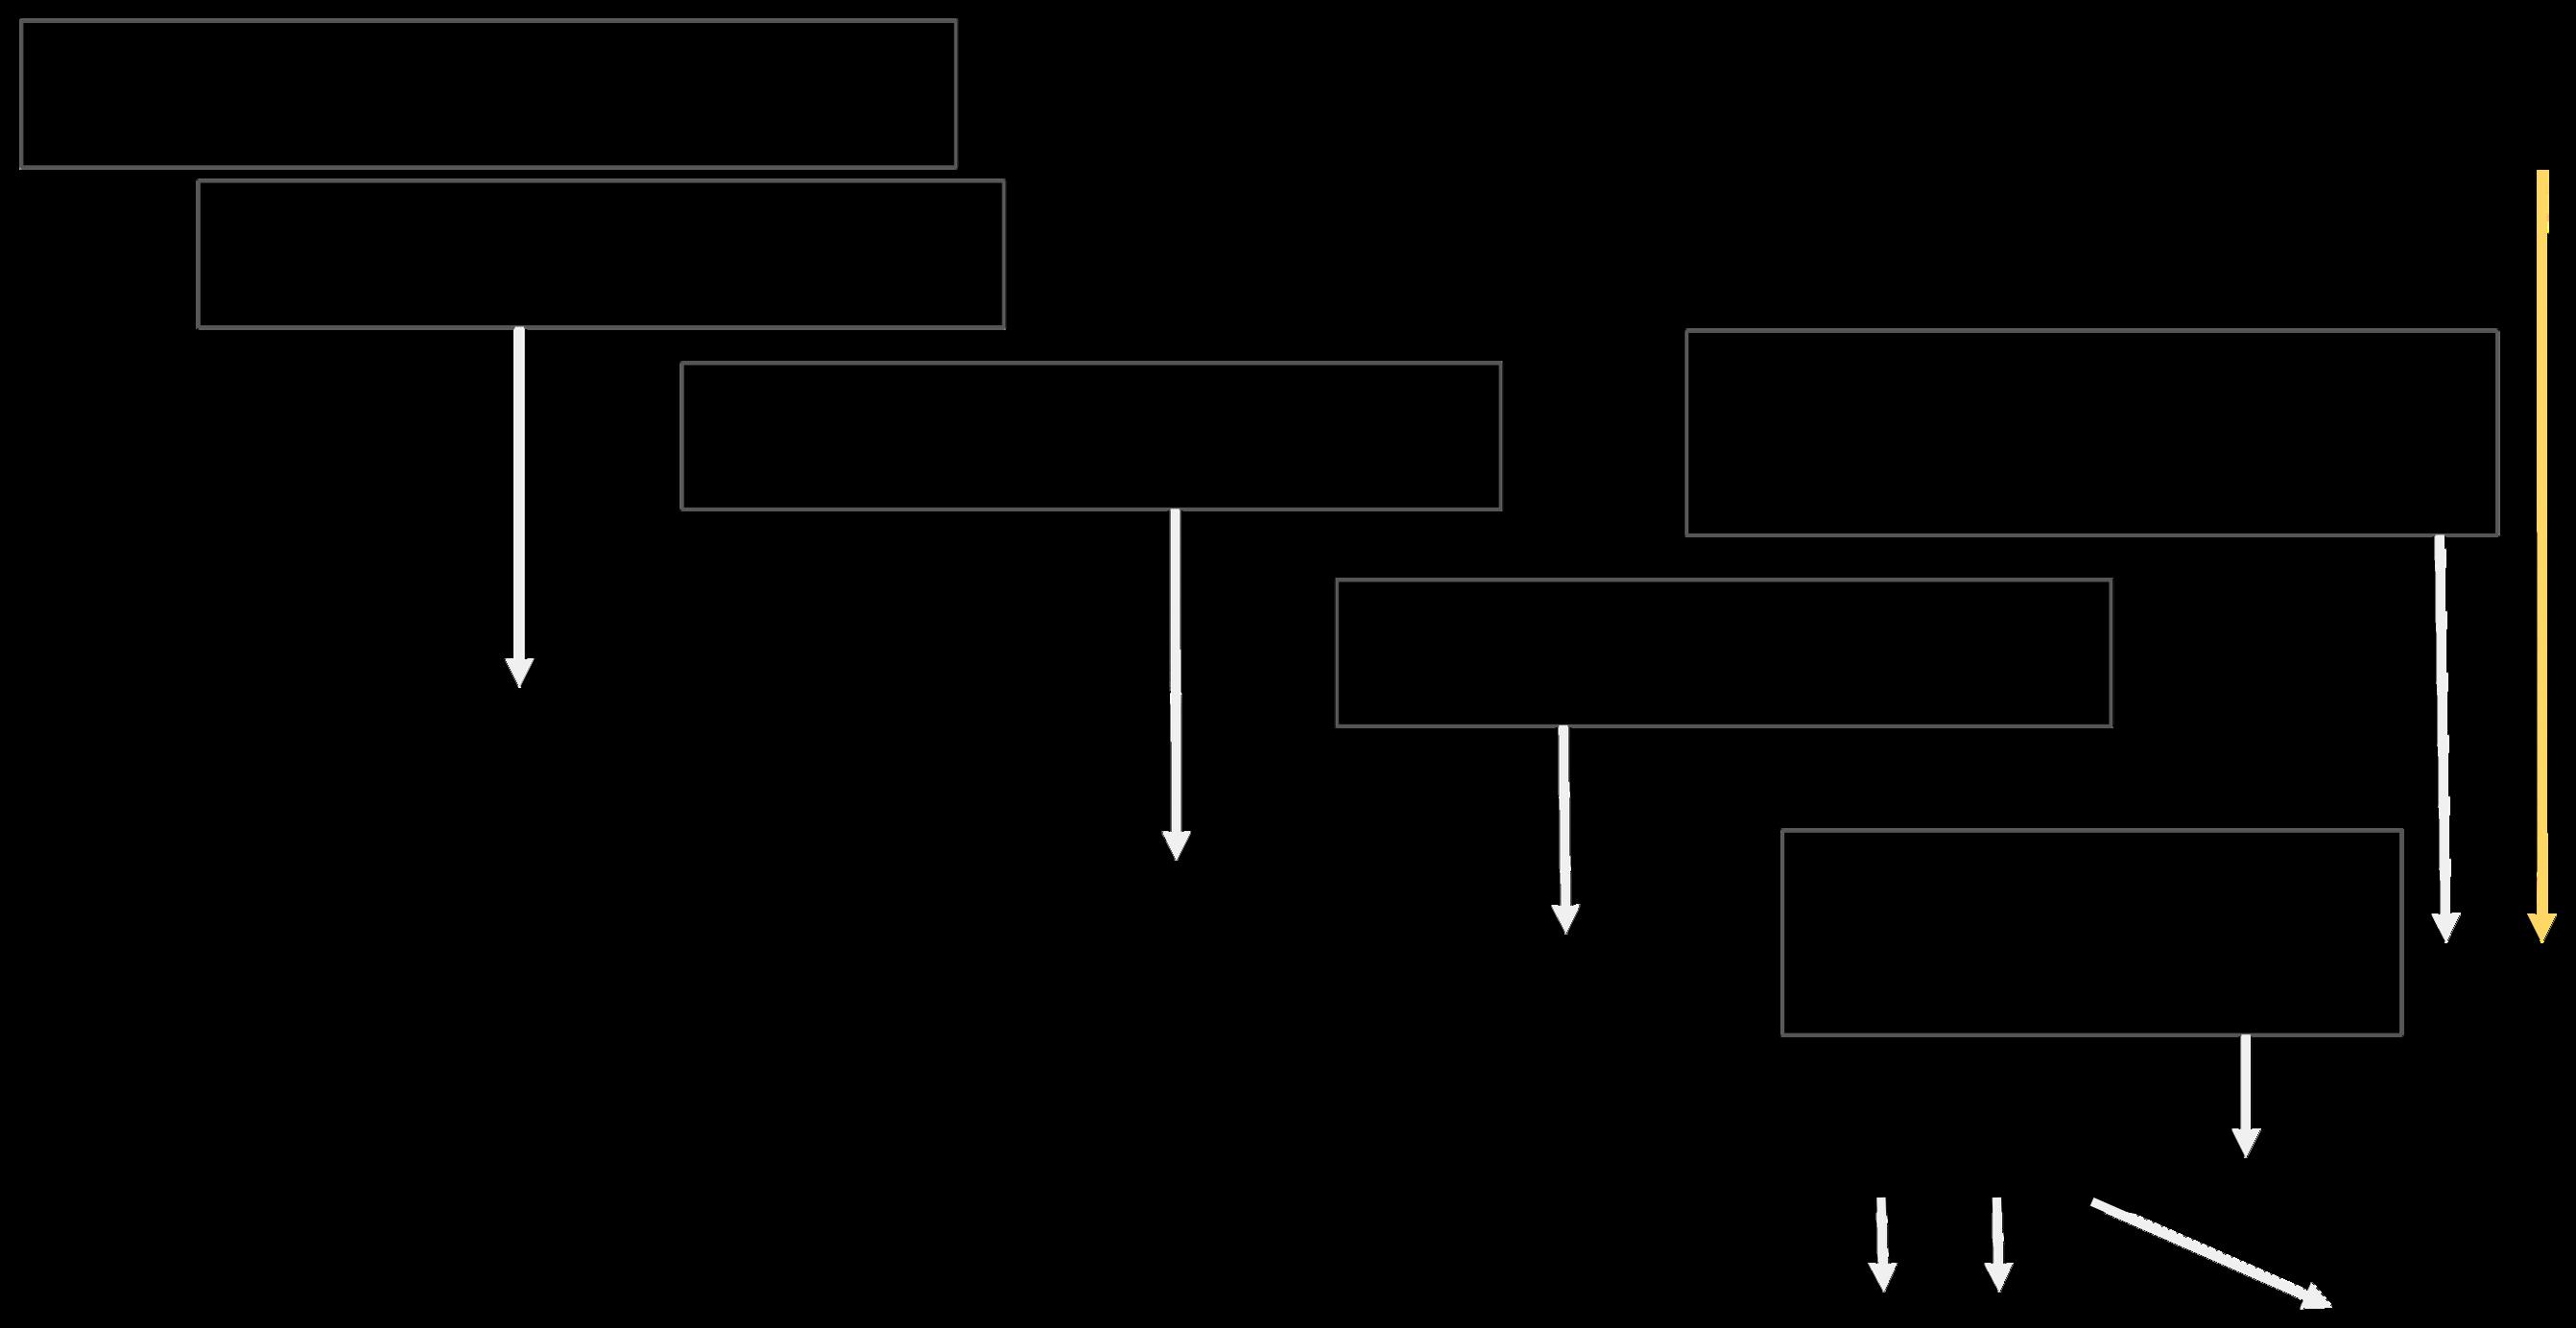
Federal Funds Interest Rate since 1981
& Economic Interventions by Federal Reserve Bank*
Updated October 29, 2025
◄ Early 1980’s: Fed aggressively raises fed funds target rate to lower inflation rate
In September 2024, the Fed reduced the rate by a half point, and then by a quarter point in November and December. In September and October 2025, the rate was reduced twice, by a quarter point each time.
Junk bond
2022/2023/2024: Acting to counter inflation, Fed increases target rate 11 times, then pauses 8/2023 – 8/2024
Subprime crash: Fed drops rate 10 times to effectively zero in 2007-08 boom
2019, 2020, 2021: With the pandemic, the Fed drops the rate to effectively zero
High-tech &
Subprime pandemic booms
* Per Federal Reserve Bank of St. Louis and New York; https://fred.stlouisfed.org/series/FEDFUNDS; Last reading per https://www.newyorkfed.org/markets/reference-rates/effr. Other data referenced from sources deemed reliable but may contain errors and subject to revision.
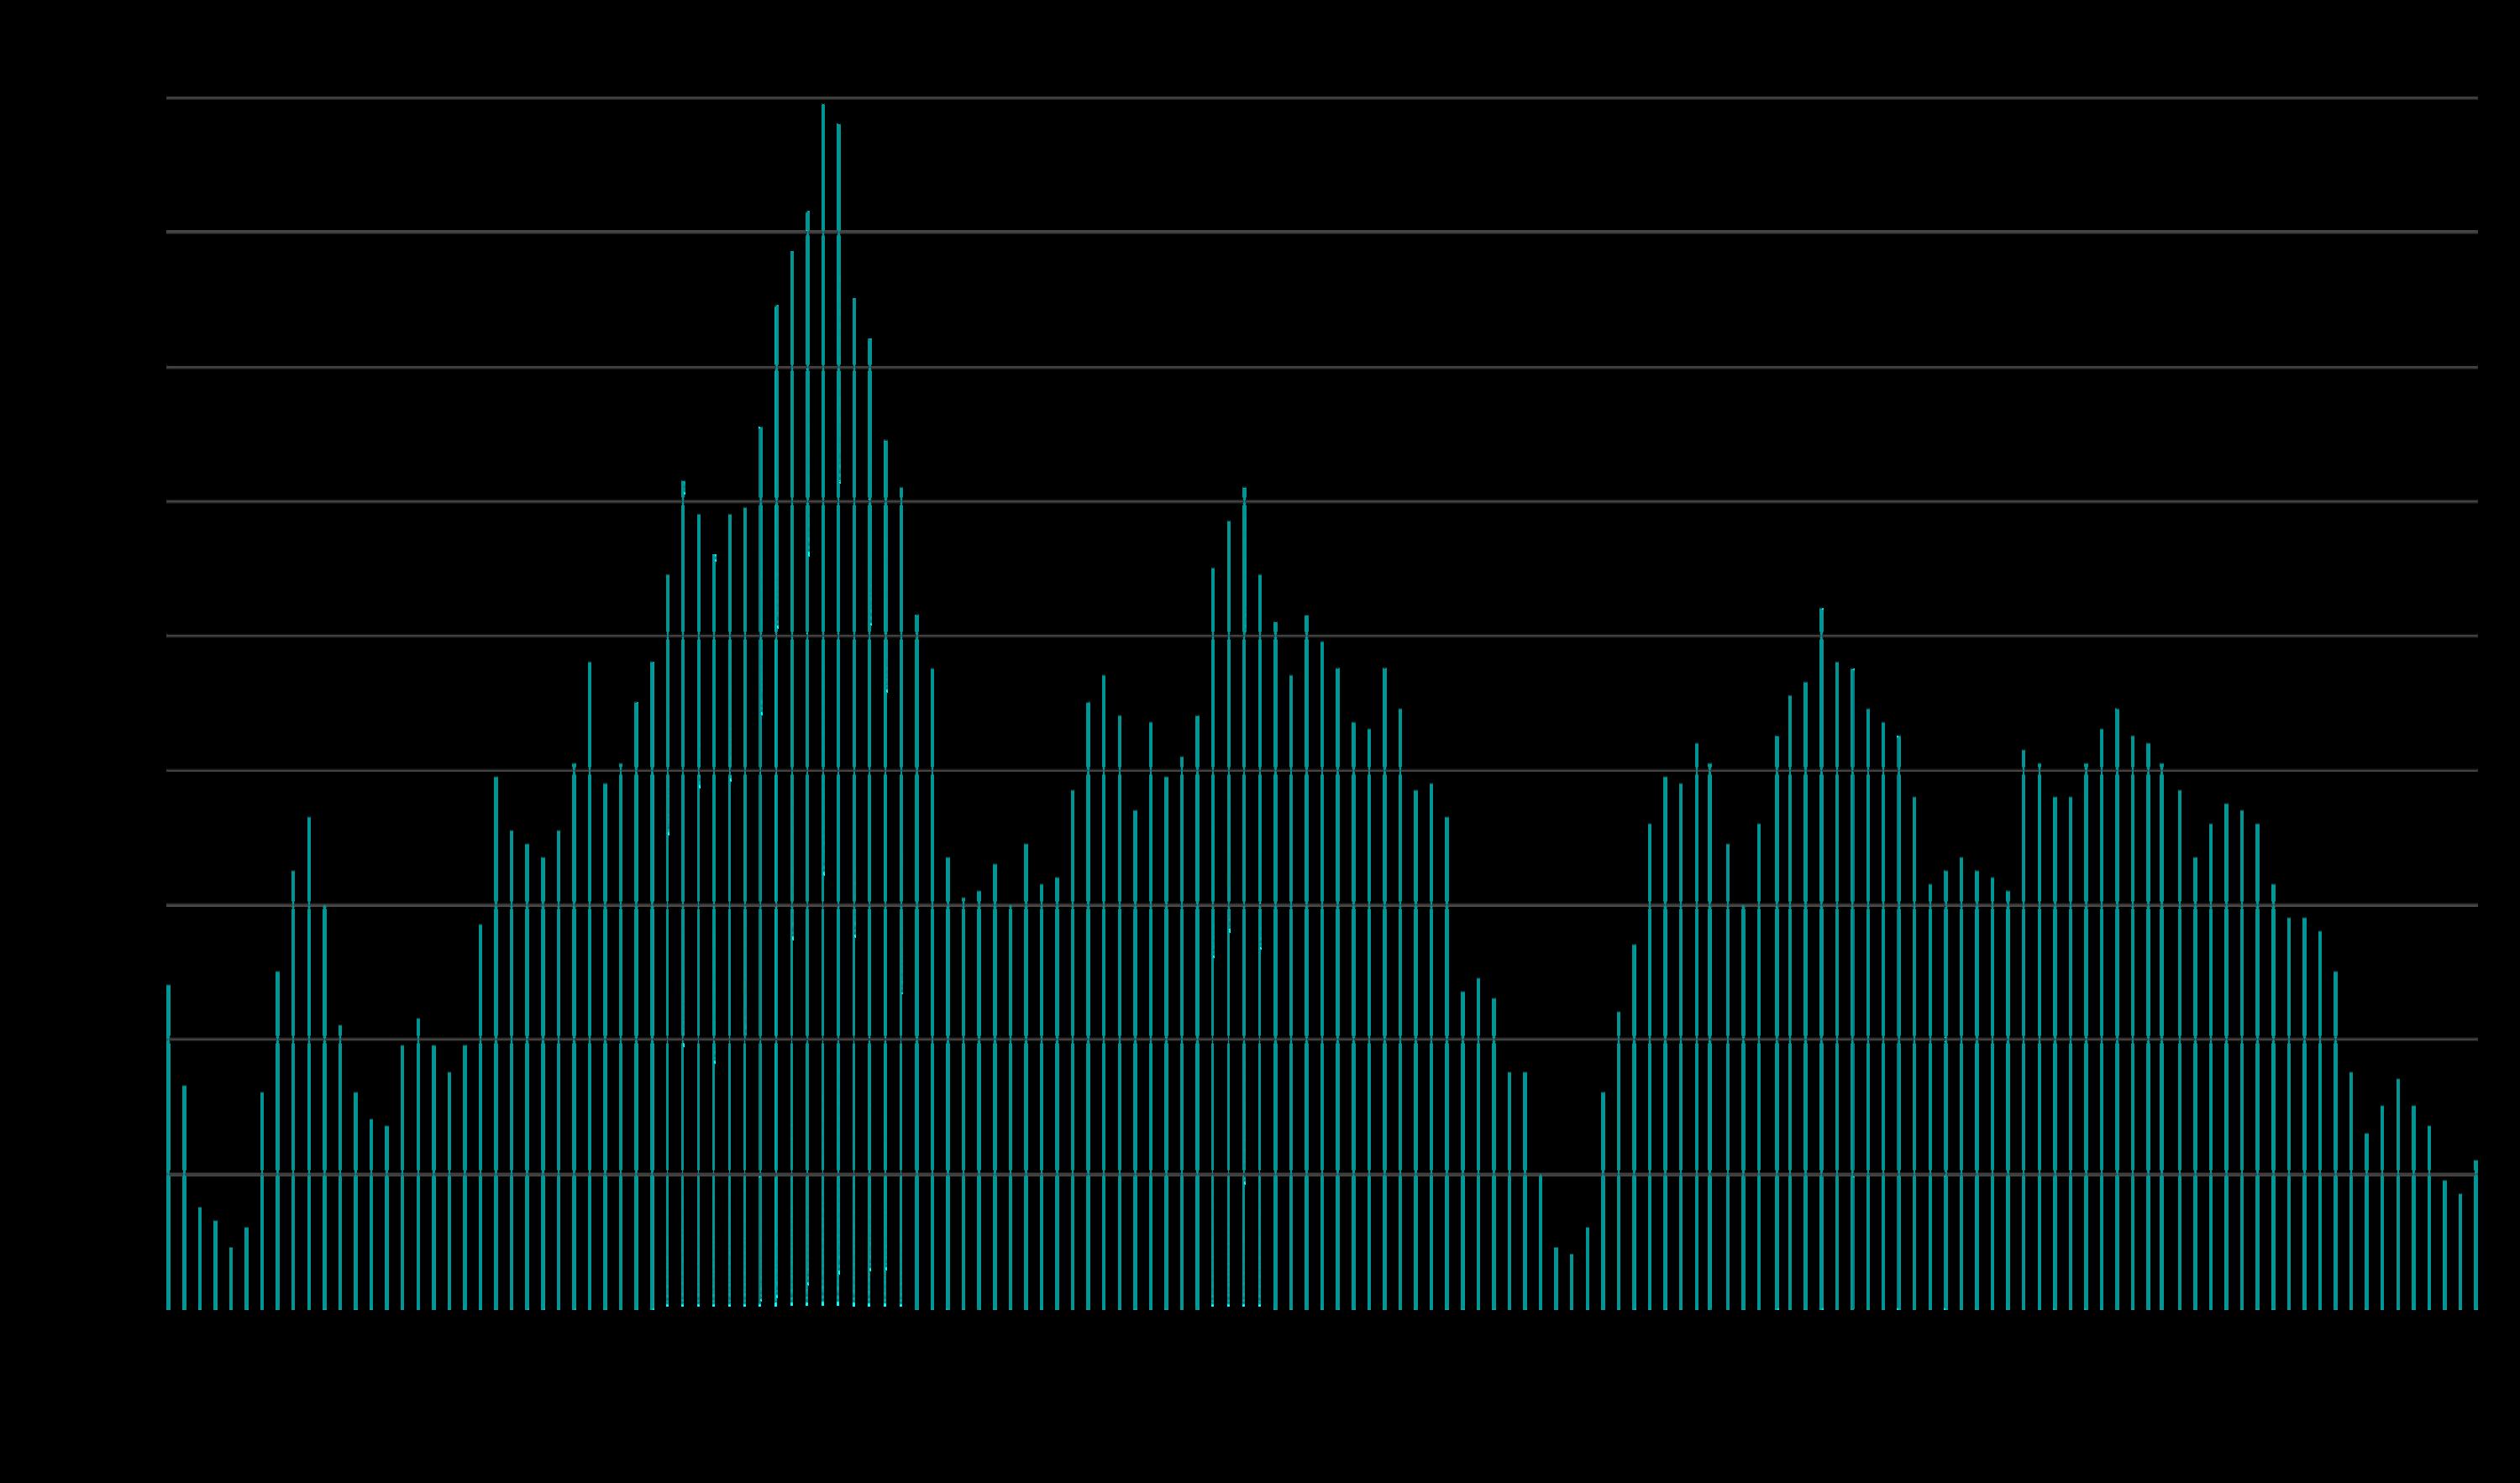
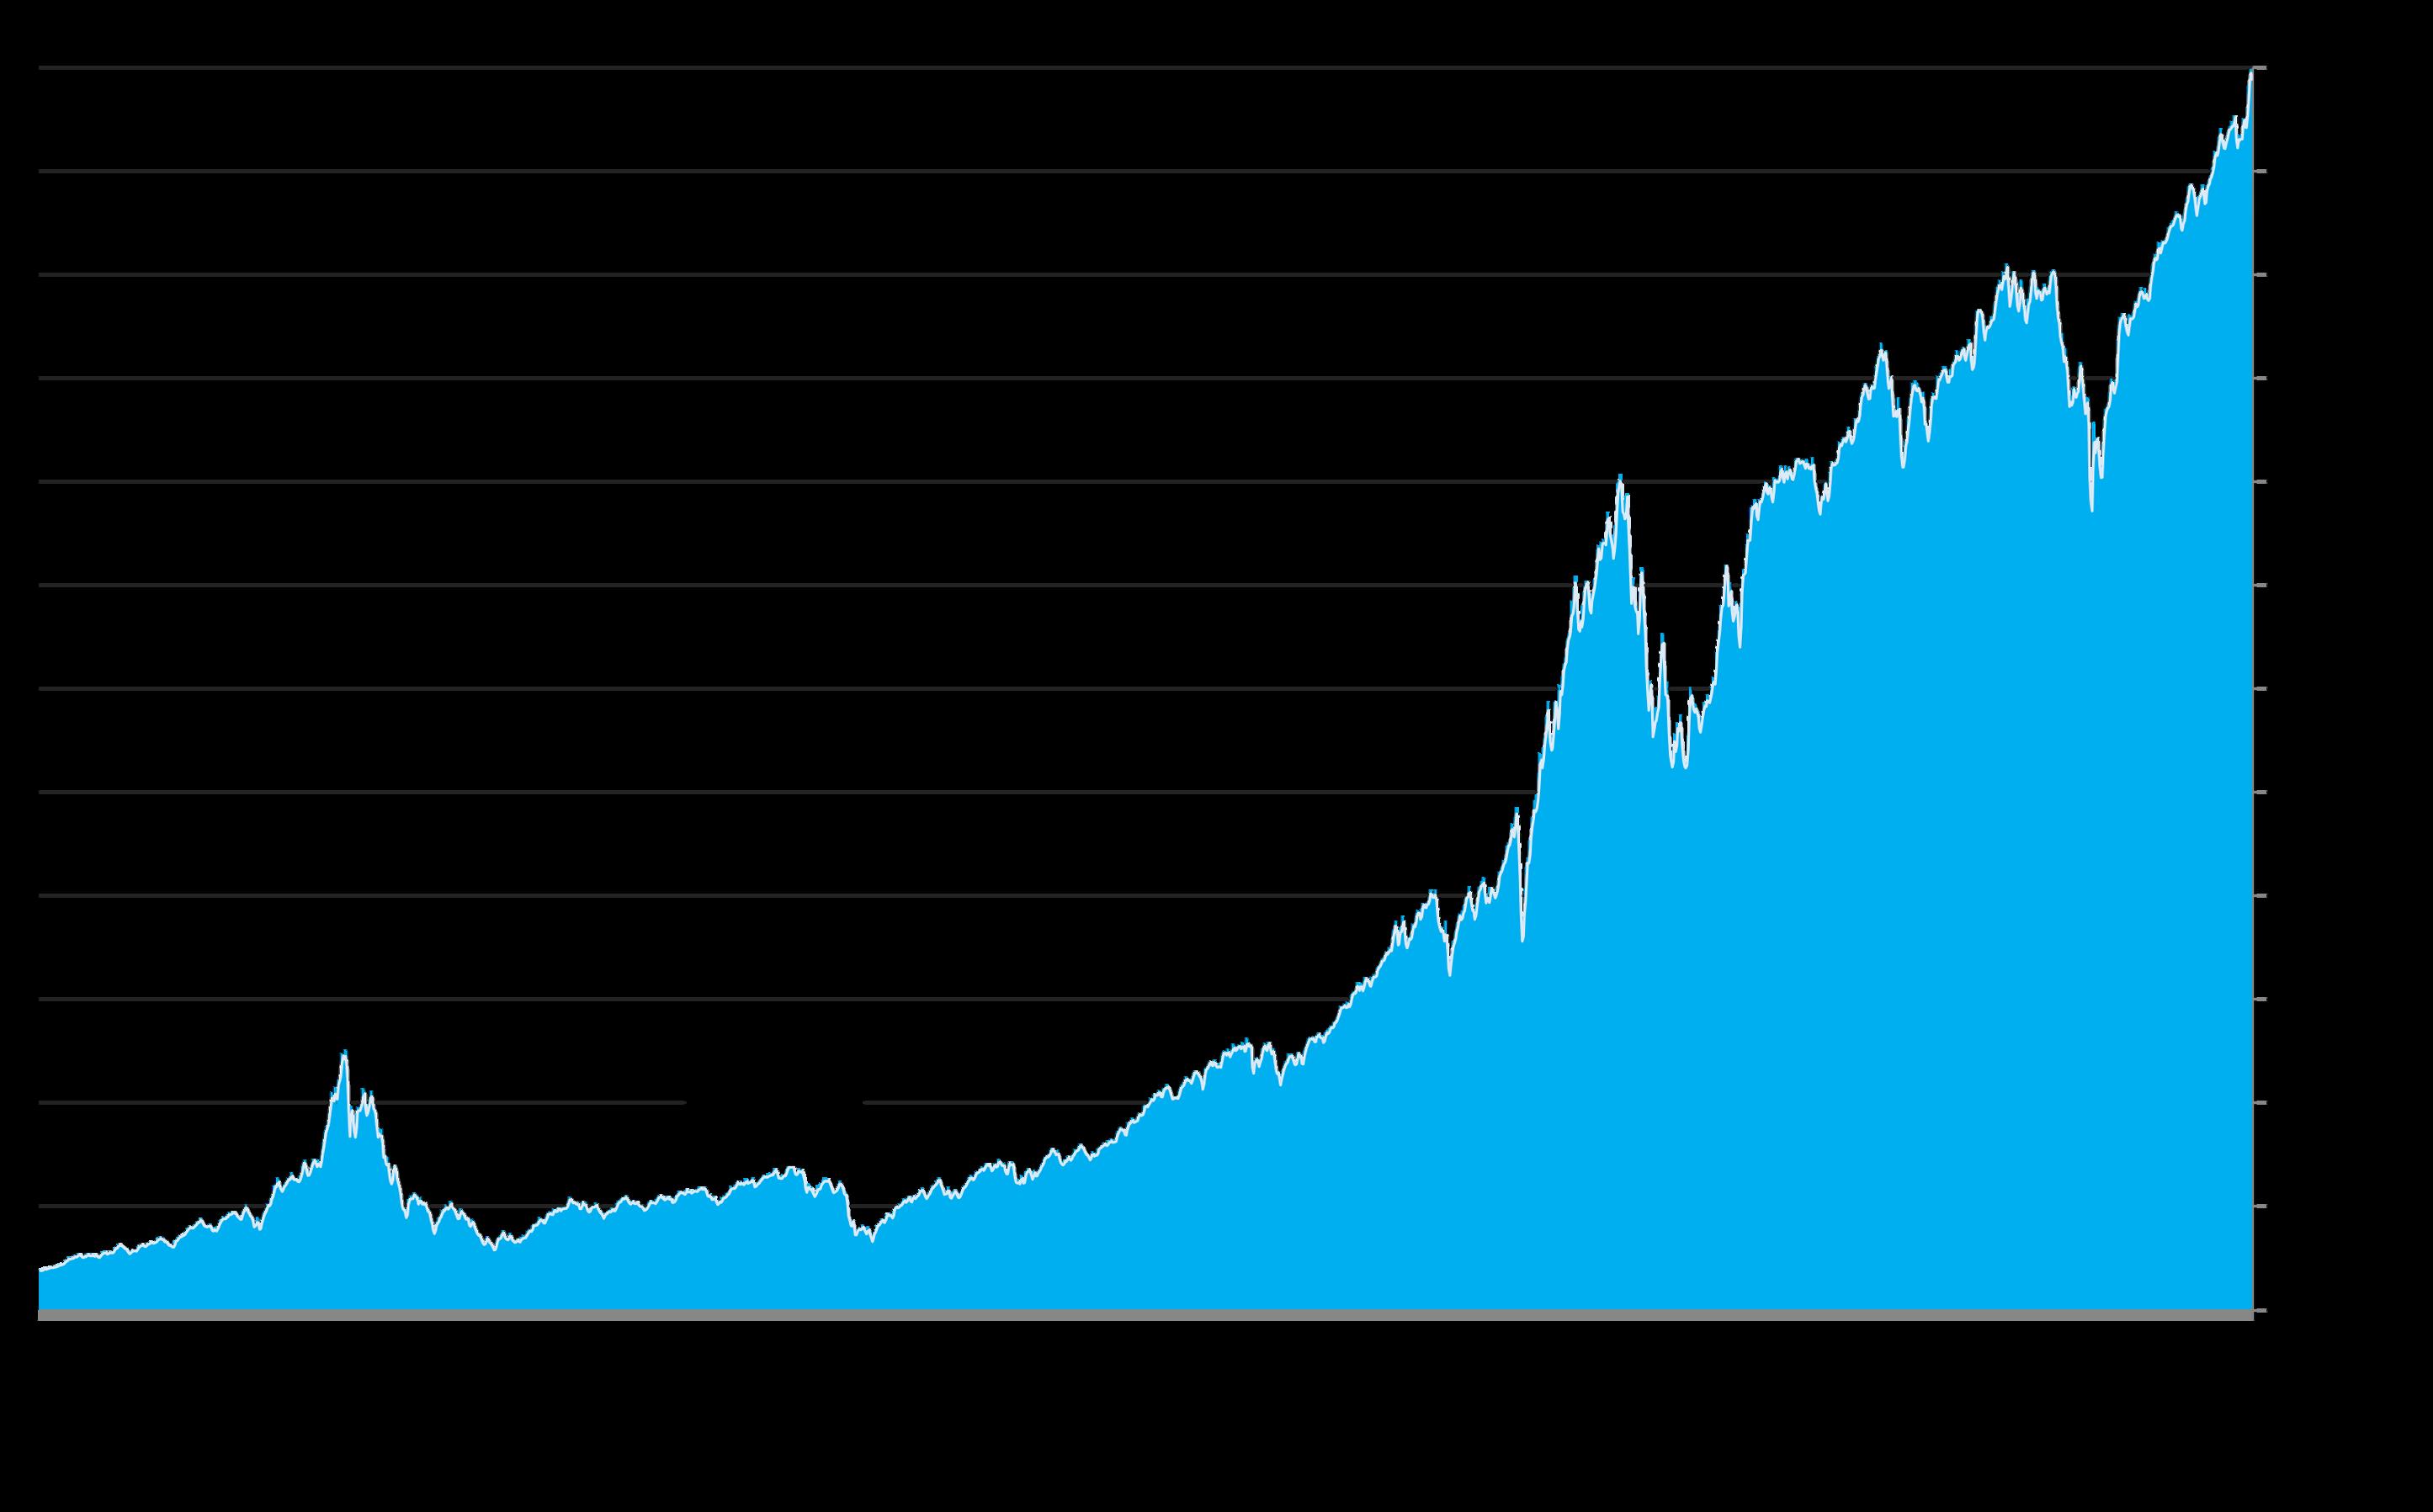
“The Nasdaq Composite Index is a market capitalizationweighted index of more than 2,500 stocks listed on the Nasdaq stock exchange. It is a broad index that is heavily weighted toward the important technology sector.” Investopedia.com
The Nasdaq hit a new all-time high in late October 2025.
The S&P 500 Index, not illustrated here, also hit a new peak. Changes in stock market values have a large impact on housing markets, especially more affluent, higher price segments.
Per https://fred.stlouisfed.org/series/NASDAQCOM. Because of number of data points, not every week has a separate column. Data from sources deemed reliable but may contain errors and subject to revision. For general illustration purposes only.
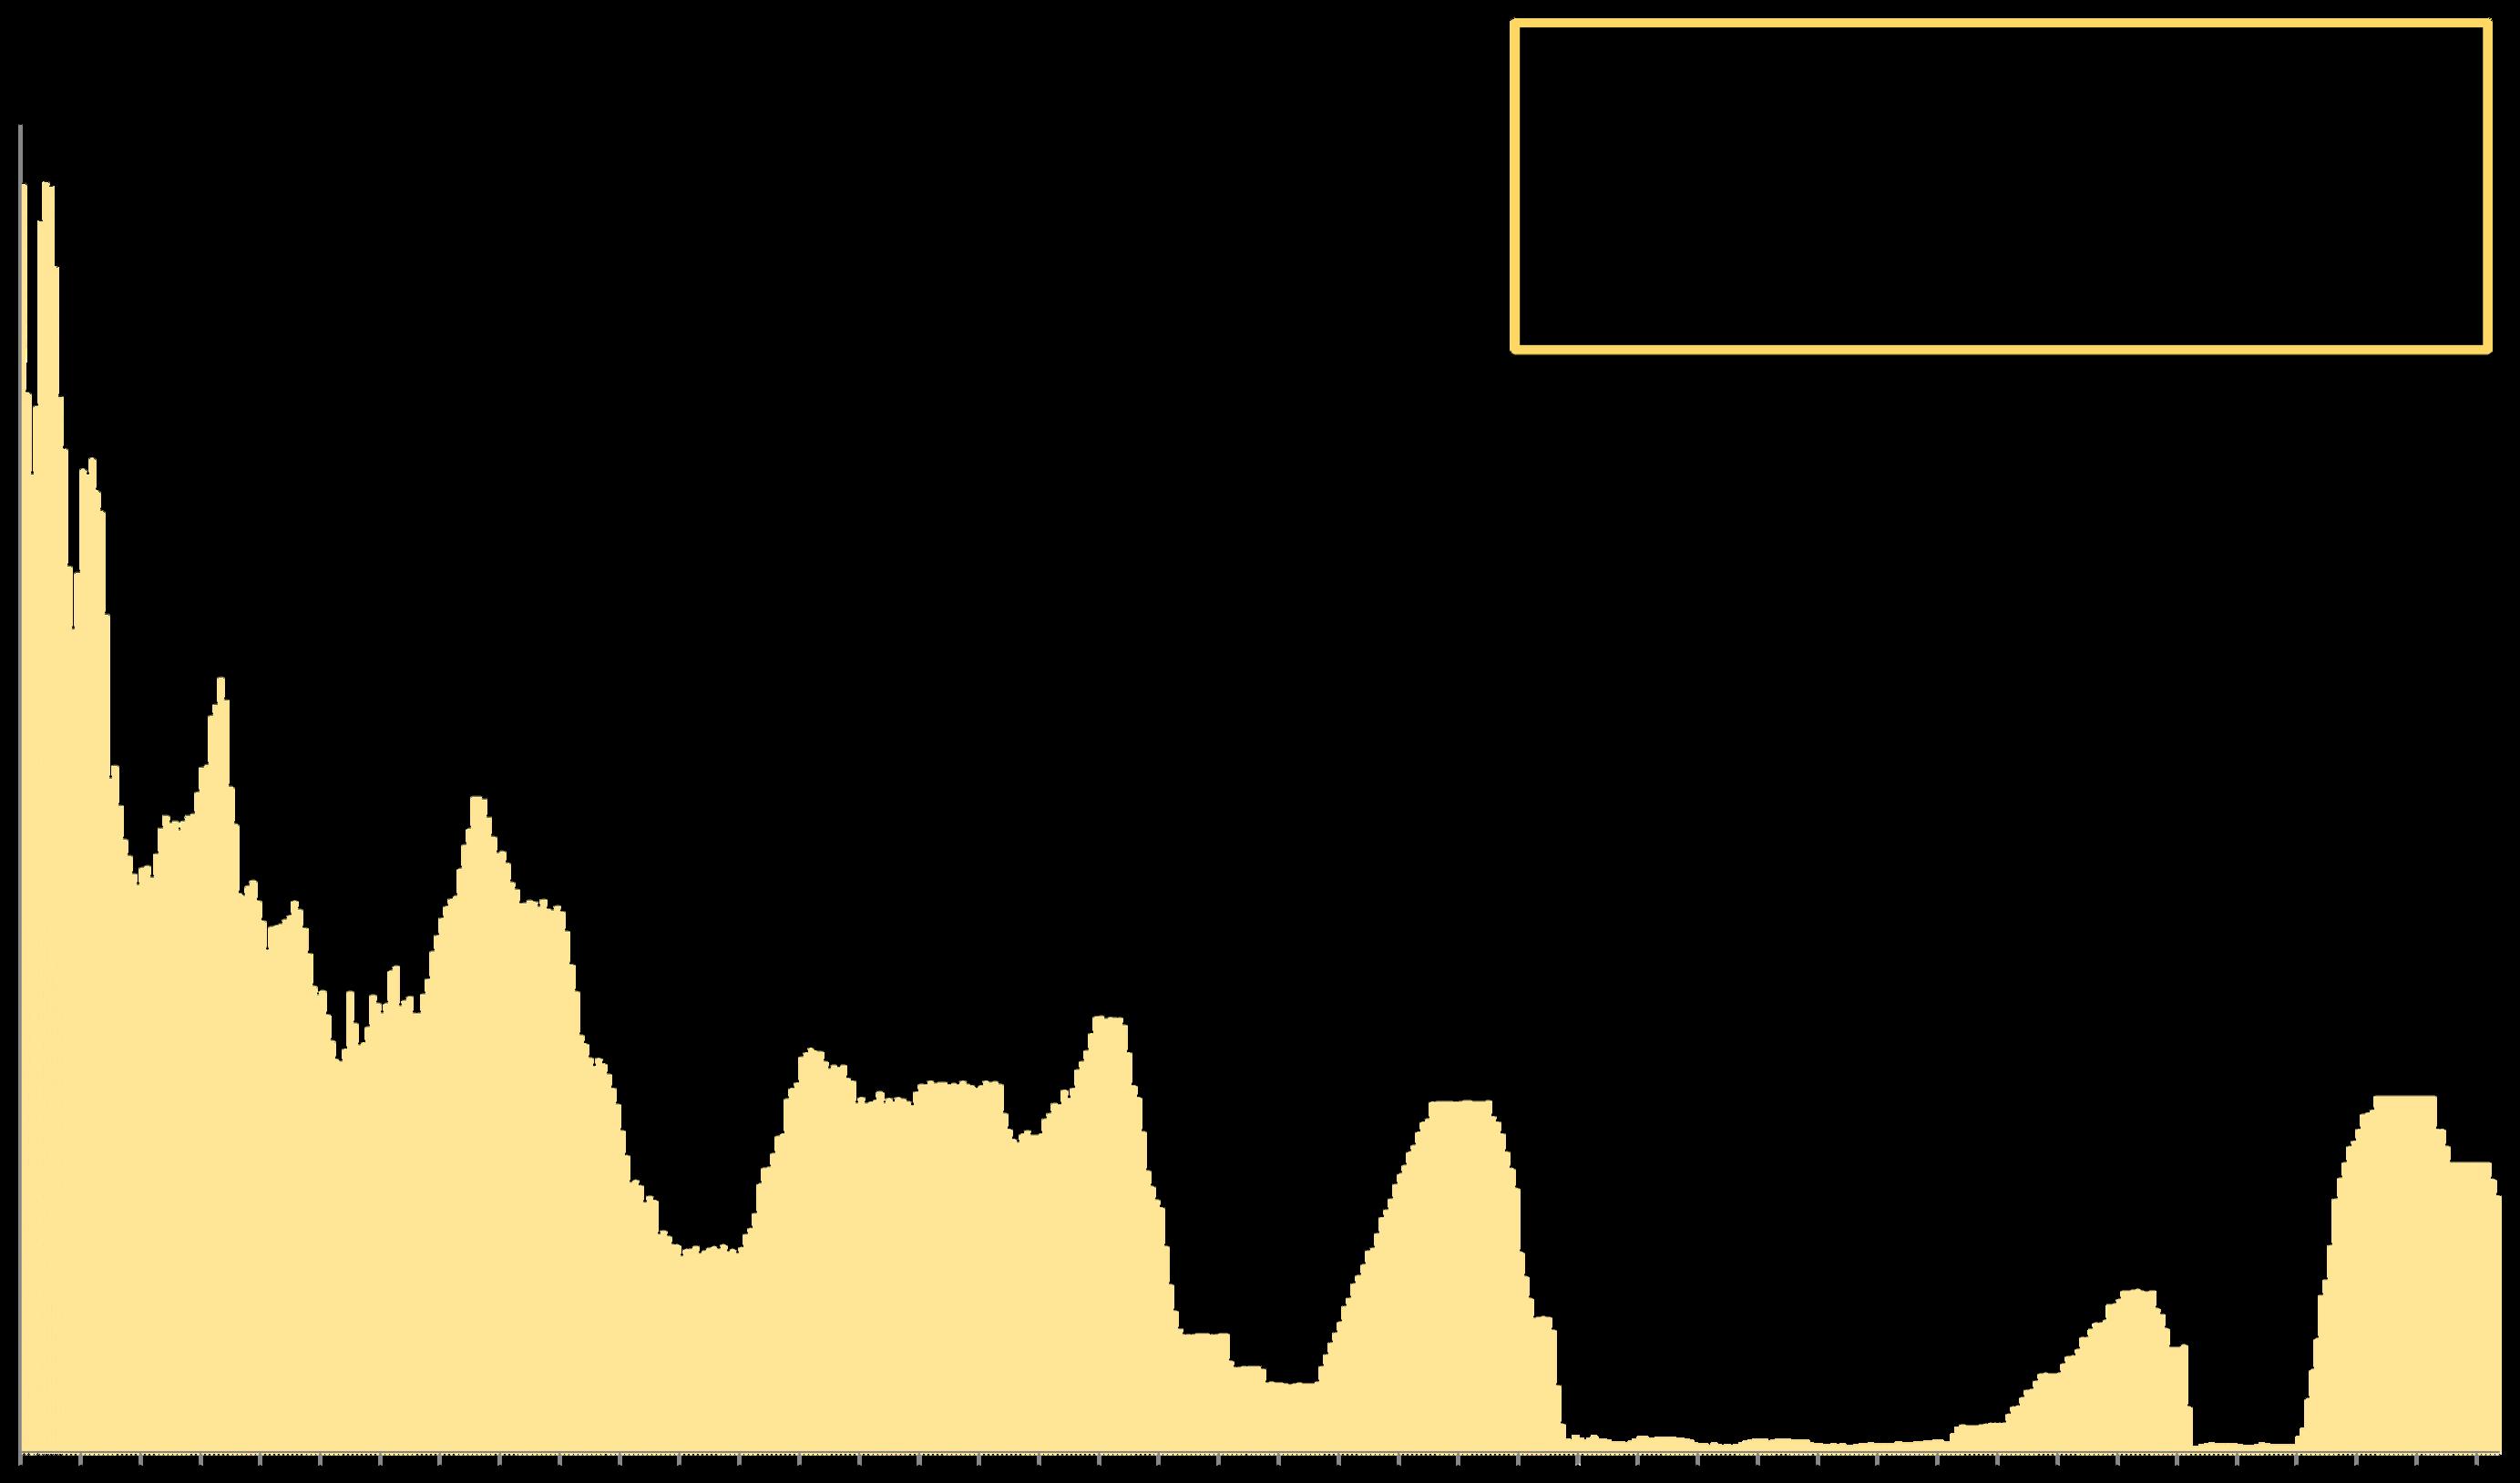
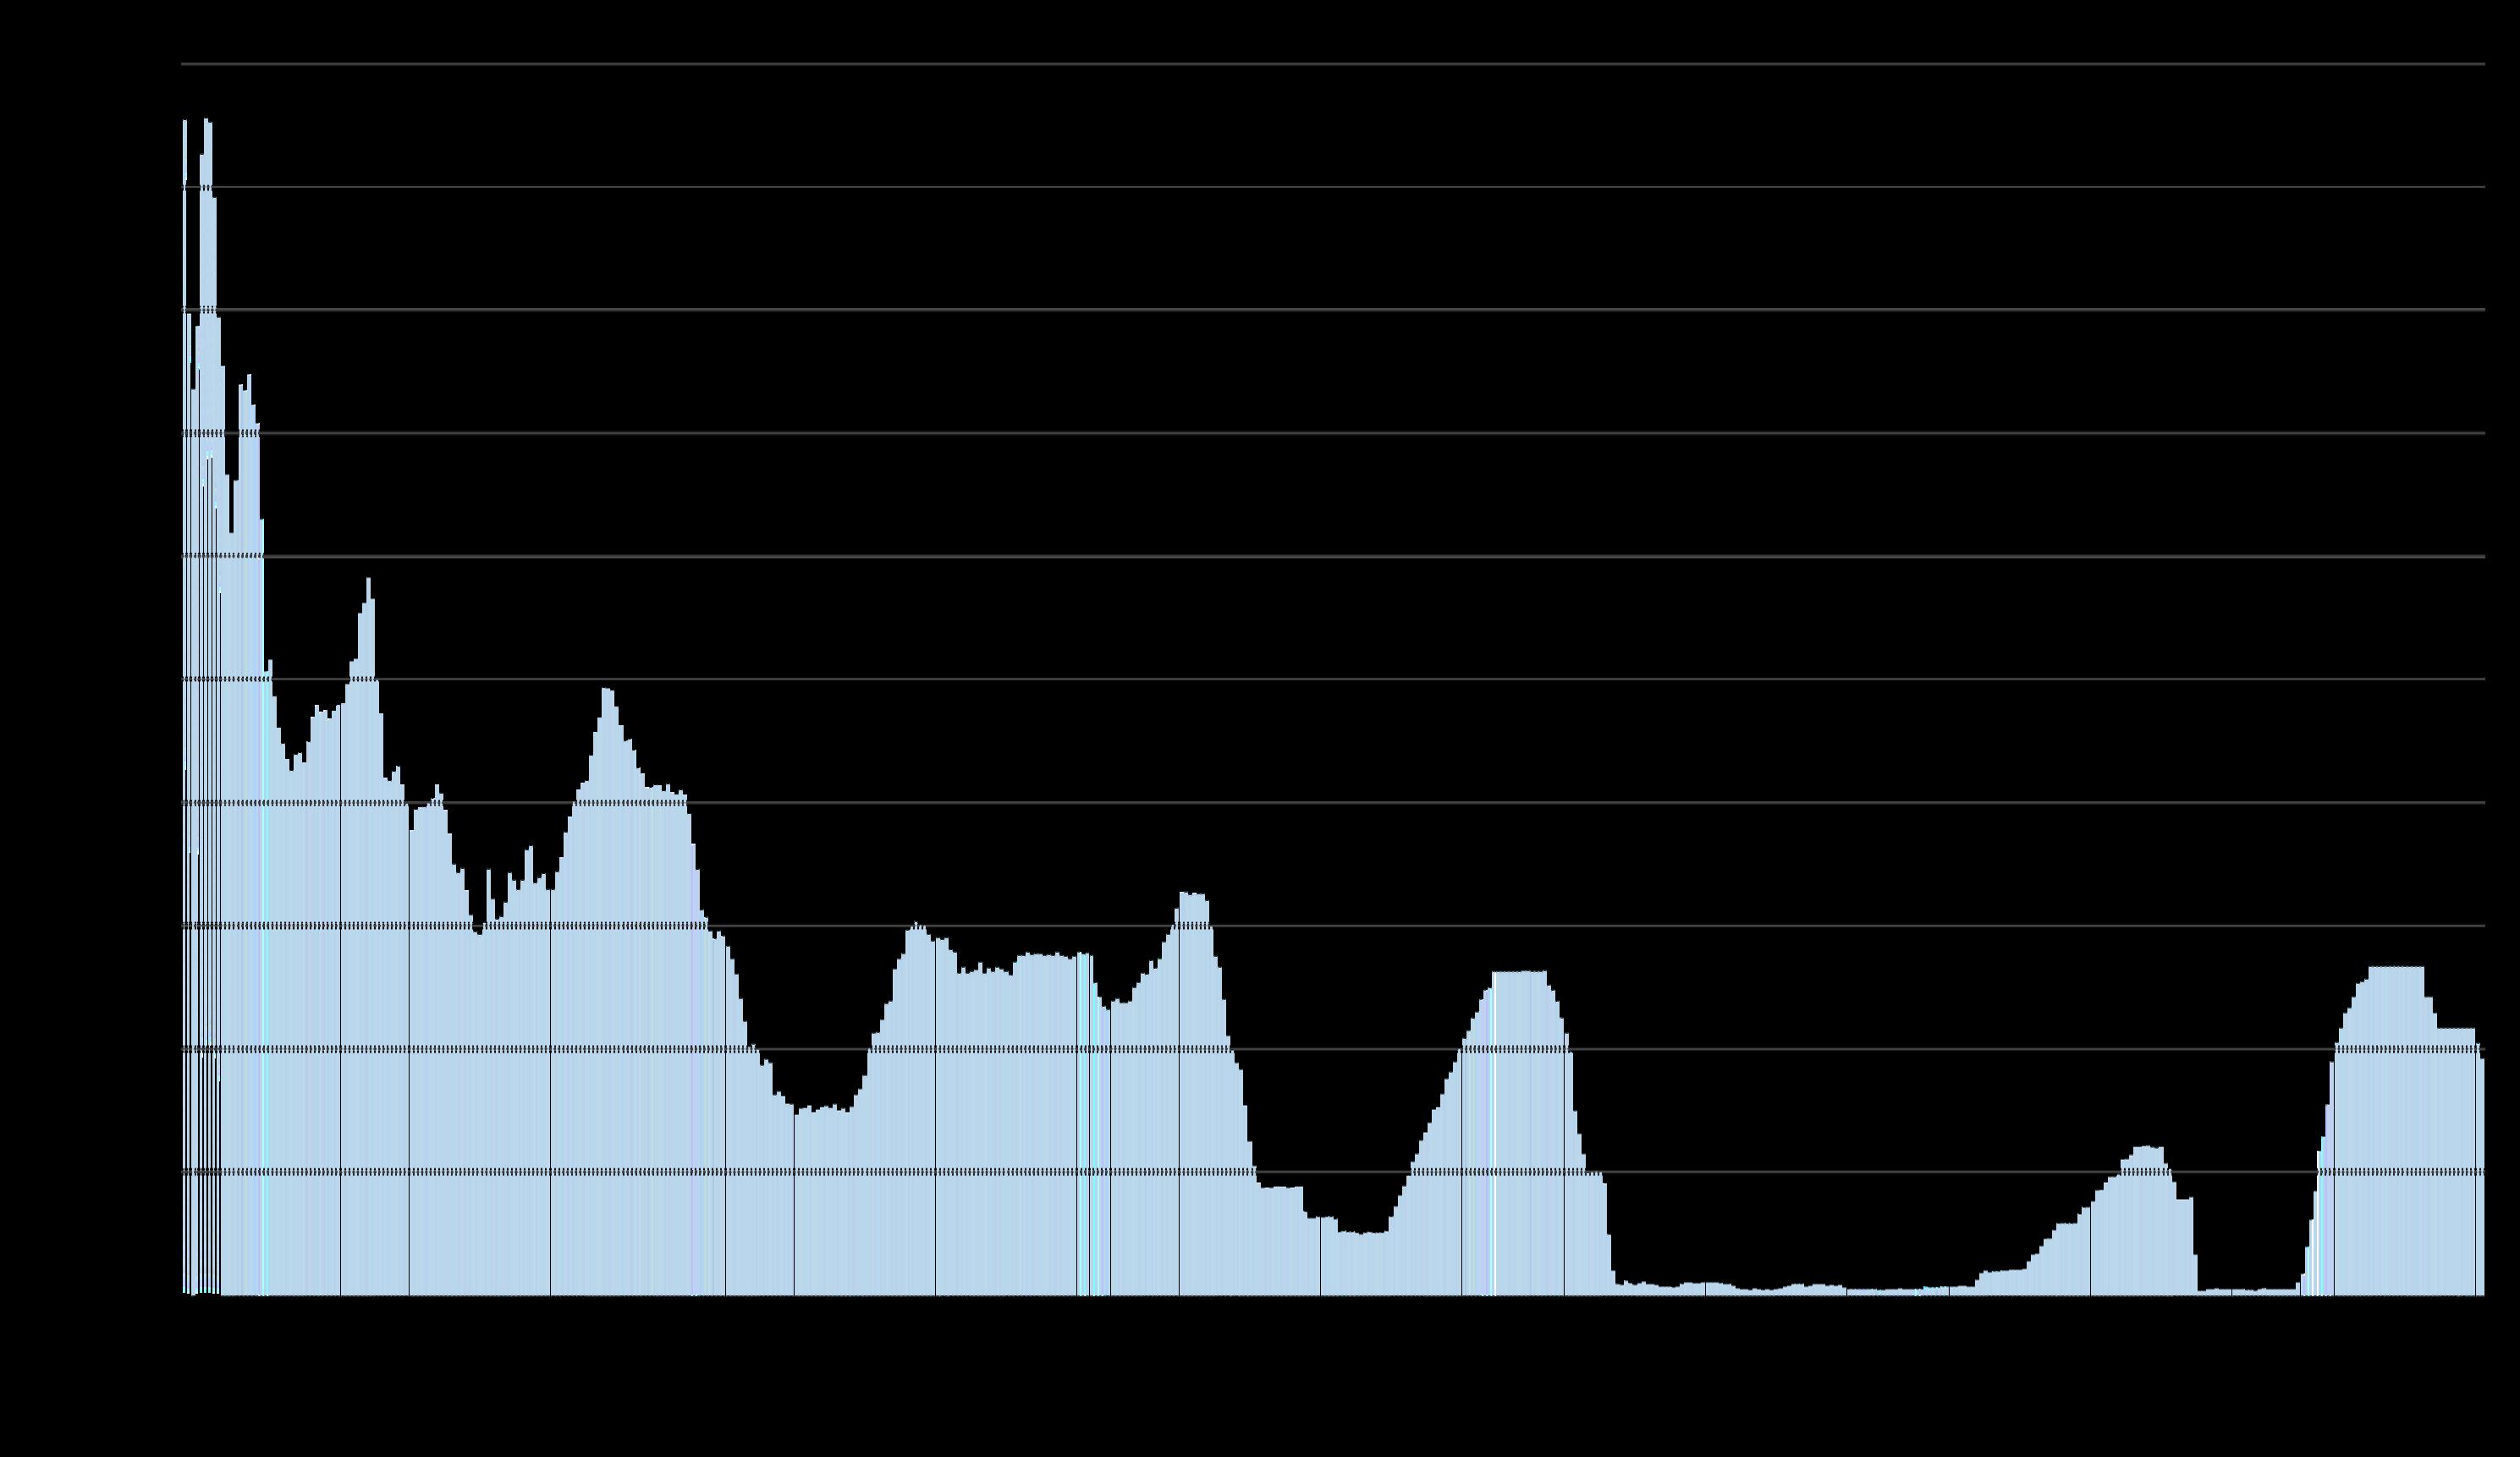
The Economic Policy Uncertainty Index reading in October 2025 continued to drop, having plummeted since April’s tariff shock, though remaining relatively high by long-term norms.
The Economic Uncertainty Index is constructed from data analysis of 1) an index of search results from 10 large newspapers for terms related to economic and policy uncertainty, 2) reports by the Congressional Budget Office, and 3) the Federal Reserve Bank of Philadelphia's Survey of Professional Forecasters.*
*Source: 'Measuring Economic Policy Uncertainty' by Scott Baker, Nicholas Bloom and Steven J. Davis, 3component index, www.PolicyUncertainty.com, https://www.policyuncertainty.com/us_monthly.html.
Statistics are generalities, essentially summaries of widely disparate data generated by dozens, hundreds or thousands of unique, individual sales occurring within different time periods. They are best seen not as precise measurements, but as broad, comparative indicators, with reasonable margins of error. Anomalous fluctuations in statistics are not uncommon, especially in smaller, expensive market segments. Last period data should be considered estimates that may change with late-reported data. Different analytics programs sometimes define statistics – such as “active listings,” “days on market,” and “months supply of inventory” – differently: what is most meaningful are not specific calculations but the trends they illustrate. Most listing and sales data derives from the local or regional multi-listing service (MLS) of the area specified in the analysis, but not all listings or sales are reported to MLS and these won’t be reflected in the data. “Homes” signifies real-property, single-household housing units: houses, condos, co-ops, townhouses, duets and TICs (but not mobile homes), as applicable to each market. City/town names refer specifically to the named cities and towns, unless otherwise delineated. Multi-county metro areas will be specified as such. Data from sources deemed reliable, but may contain errors and subject to revision. All numbers to be considered approximate.
Many aspects of value cannot be adequately reflected in median and average statistics: curb appeal, age, condition, amenities,
views, lot size, quality of outdoor space, “bonus” rooms, additional parking, quality of location within the neighborhood, and so on. How any of these statistics apply to any particular home is unknown without a specific comparative market analysis.
Median Sales Price is that price at which half the properties sold for more and half for less. It may be affected by seasonality, “unusual” events, or changes in inventory and buying trends, as well as by changes in fair market value. The median sales price for an area will often conceal an enormous variety of sales prices in the underlying individual sales.
Dollar per Square Foot is based upon the home’s interior living space and does not include garages, unfinished attics and basements, rooms built without permit, patios, decks or yards (though all those can add value to a home). These figures are usually derived from appraisals or tax records, but are sometimes unreliable (especially for older homes) or unreported altogether. The calculation can only be made on those home sales that reported square footage.
Photo use under the Creative Commons License: https://creativecommons.org/licenses/by-sa/2.0/
Compass is a real estate broker licensed by the State of California, DRE 01527235. Equal Housing Opportunity. This report has been prepared solely for information purposes. The information herein is based on or derived from information generally available to the public and/or from sources believed to be reliable. No representation or warranty can be given with respect to the accuracy or completeness of the information. Compass disclaims any and all liability relating to this report, including without limitation any express or implied representations or warranties for statements contained in, and omissions from, the report. Nothing contained herein is intended to be or should be read as any regulatory, legal, tax, accounting or other advice and Compass does not provide such advice. All opinions are subject to change without notice. Compass makes no representation regarding the accuracy of any statements regarding any references to the laws, statutes or regulations of any state are those of the author(s). Past performance is no guarantee of future results.