October 2025 Report with market data through September
San Francisco has seen an astonishing strengthening of its real estate market in recent months, presumably due to its rapidly accelerating AI start-up boom. Rents are rising at the fastest rate in the country and median sales prices have risen year over year. September sales and luxury home sales, as well the number of listings going into contract, all soared higher than in September 2024. New-listing activity almost doubled from August, but year-over-year, the number of active listings as well as the quantity of price reductions plunged. Increasing demand coupled with declining supply has added enormous pressure to the city’s market.
October sales data will give us further insight into the autumn selling season, before
activity typically begins to slow down in November for the mid-winter holidays. As of early October, 30-year mortgage rates, at about 6.3%, were essentially unchanged from early September (but well down from 7% in early 2025): The Fed’s first 2025 reduction of its benchmark rate, of .25%, had little effect, though consensus opinion is that further cuts are probably coming before the end of the year. Inflation continued to tick up slightly, while stock markets hit new all-time highs. Nationally, consumer confidence remained low, with significant concerns regarding personal finances, employment and inflation – though affluent consumers deeply invested in stock markets were less concerned than low and middle income segments.
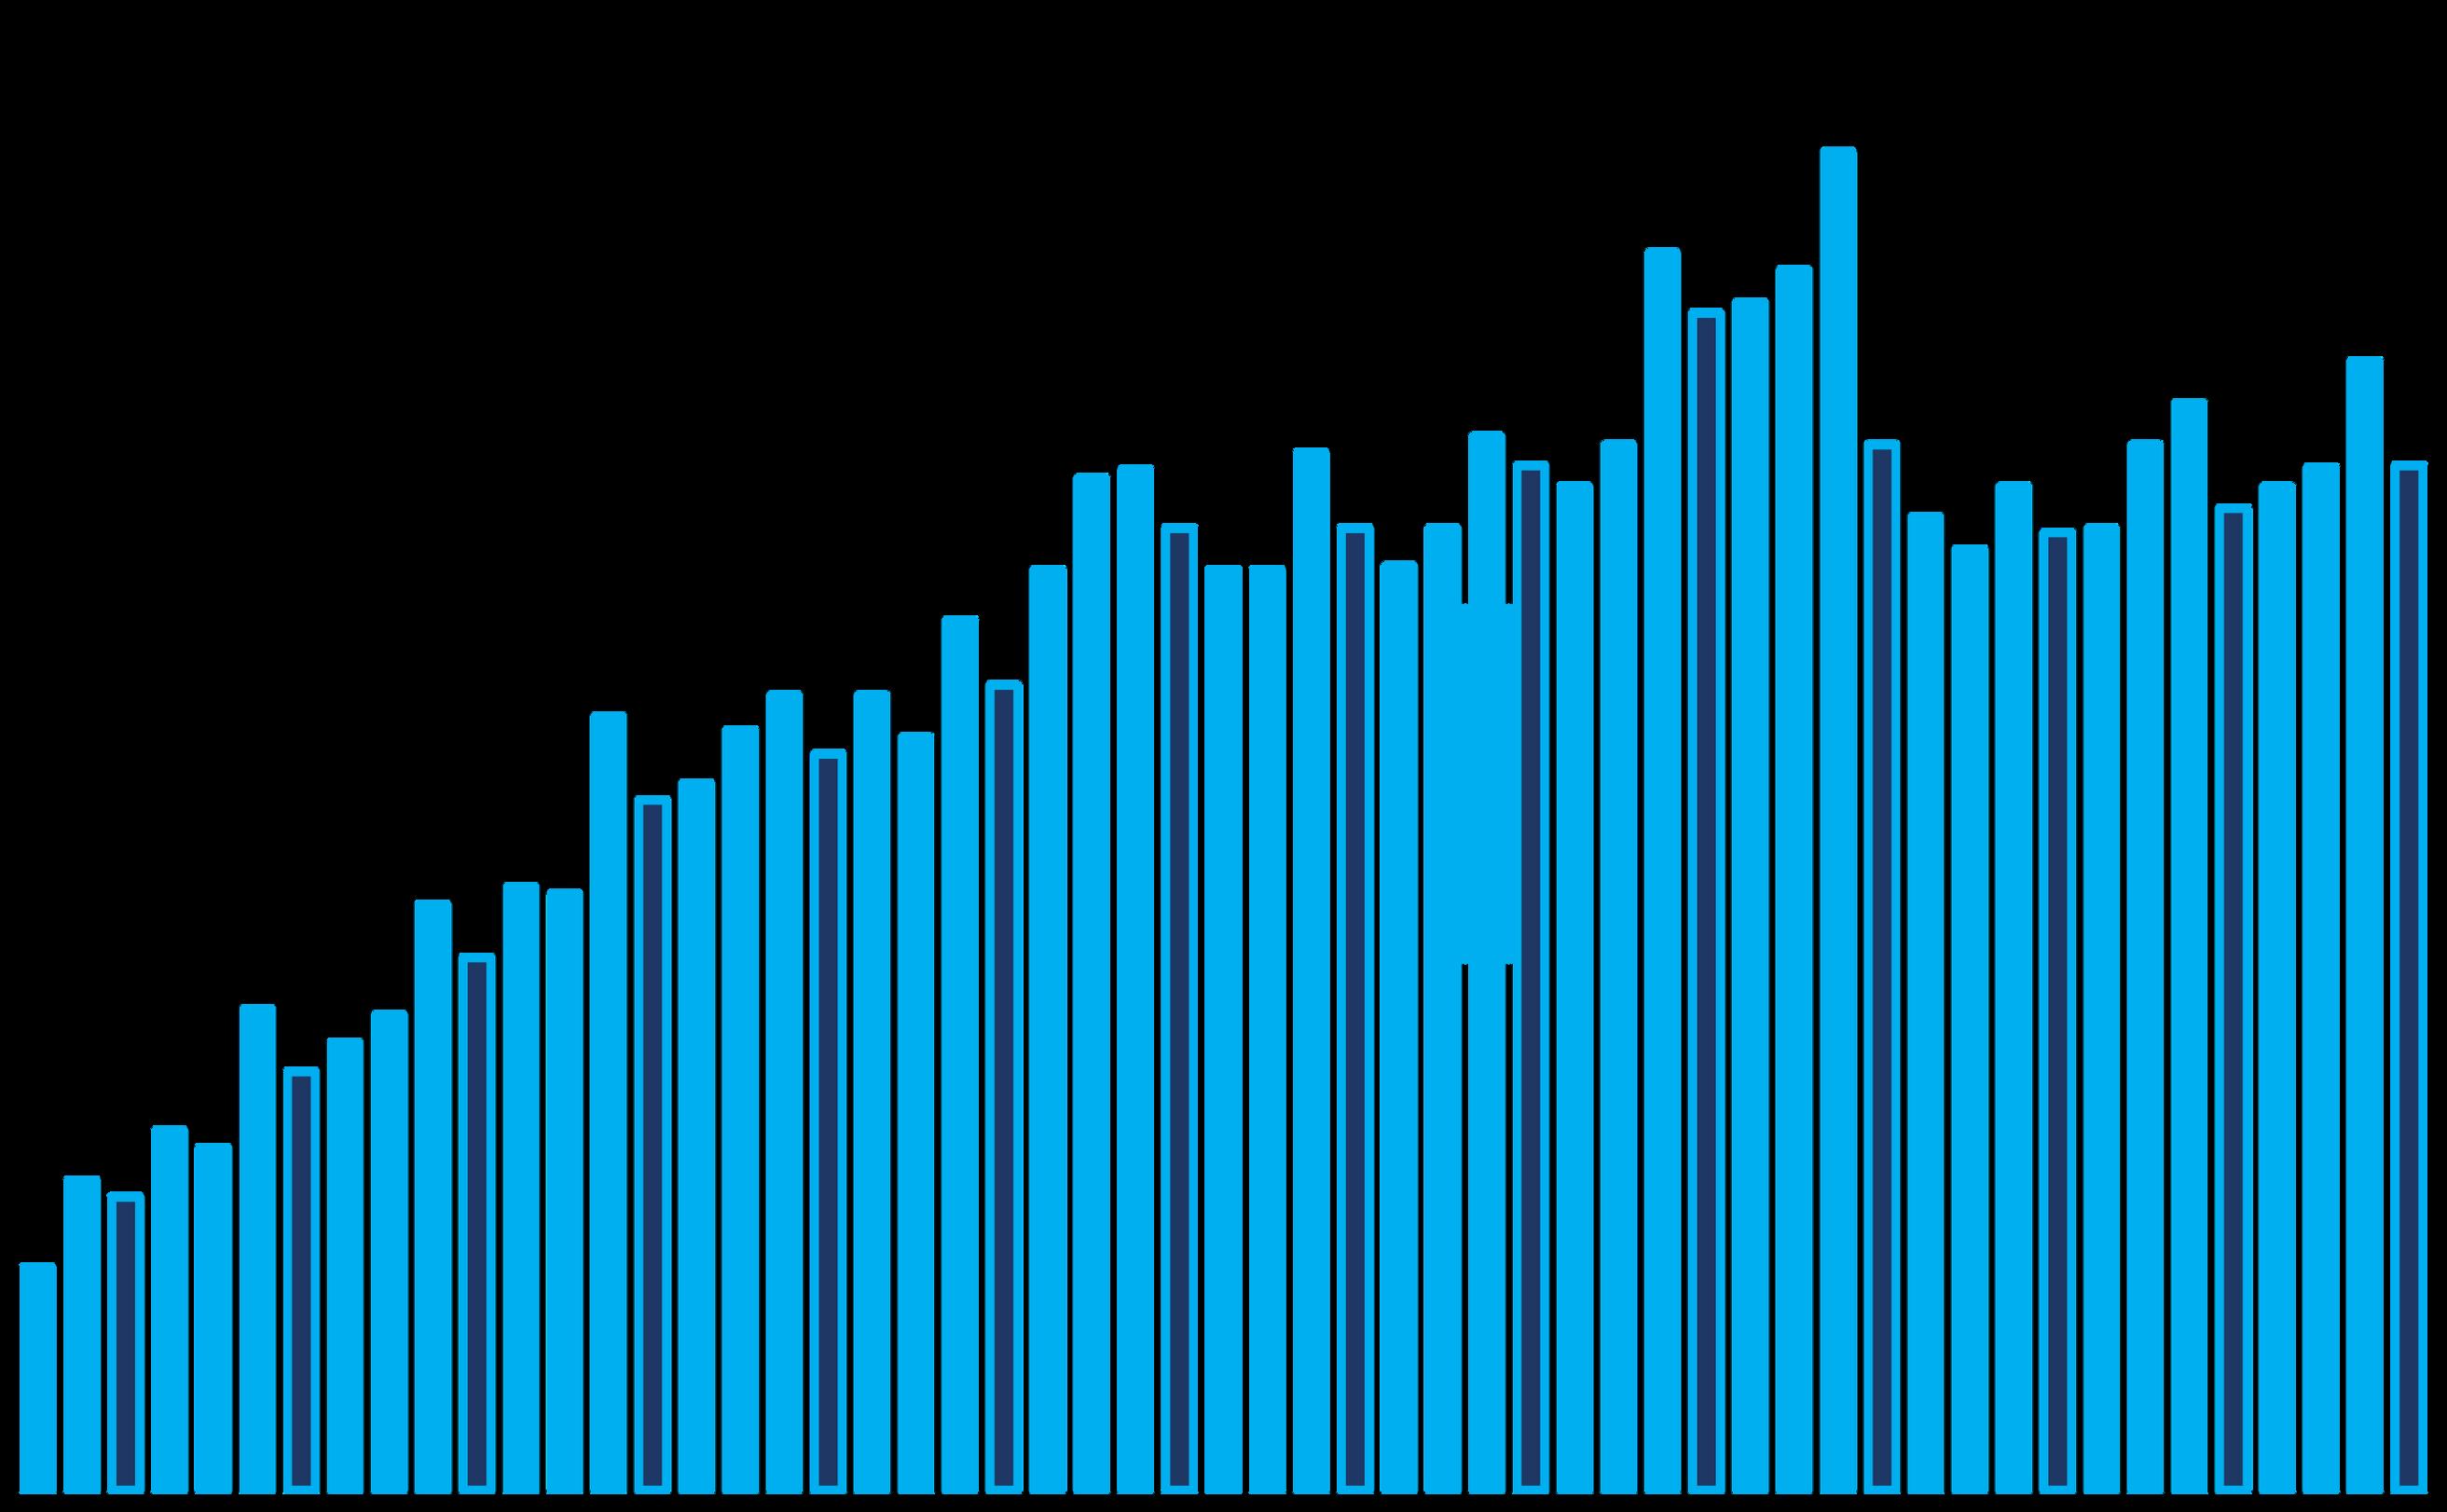
San Francisco House Price Trends
Median House Sales Prices since 2012, by Quarter
Median sales price is that price where half the homes sold for more and half for less, and can be affected by other factors besides changes in fair market value. It is a very general statistic that disguises a wide range of prices in the underlying sales.
Seasonal fluctuations are common, and it’s not unusual for median sales prices to peak for the year in Q2.
The Q3 2025 median house sales price fell back from Q2 (as is the usual seasonal dynamic), but was up about 3.2% year over year.
Appreciation is typically measured year over year to account for market seasonality.
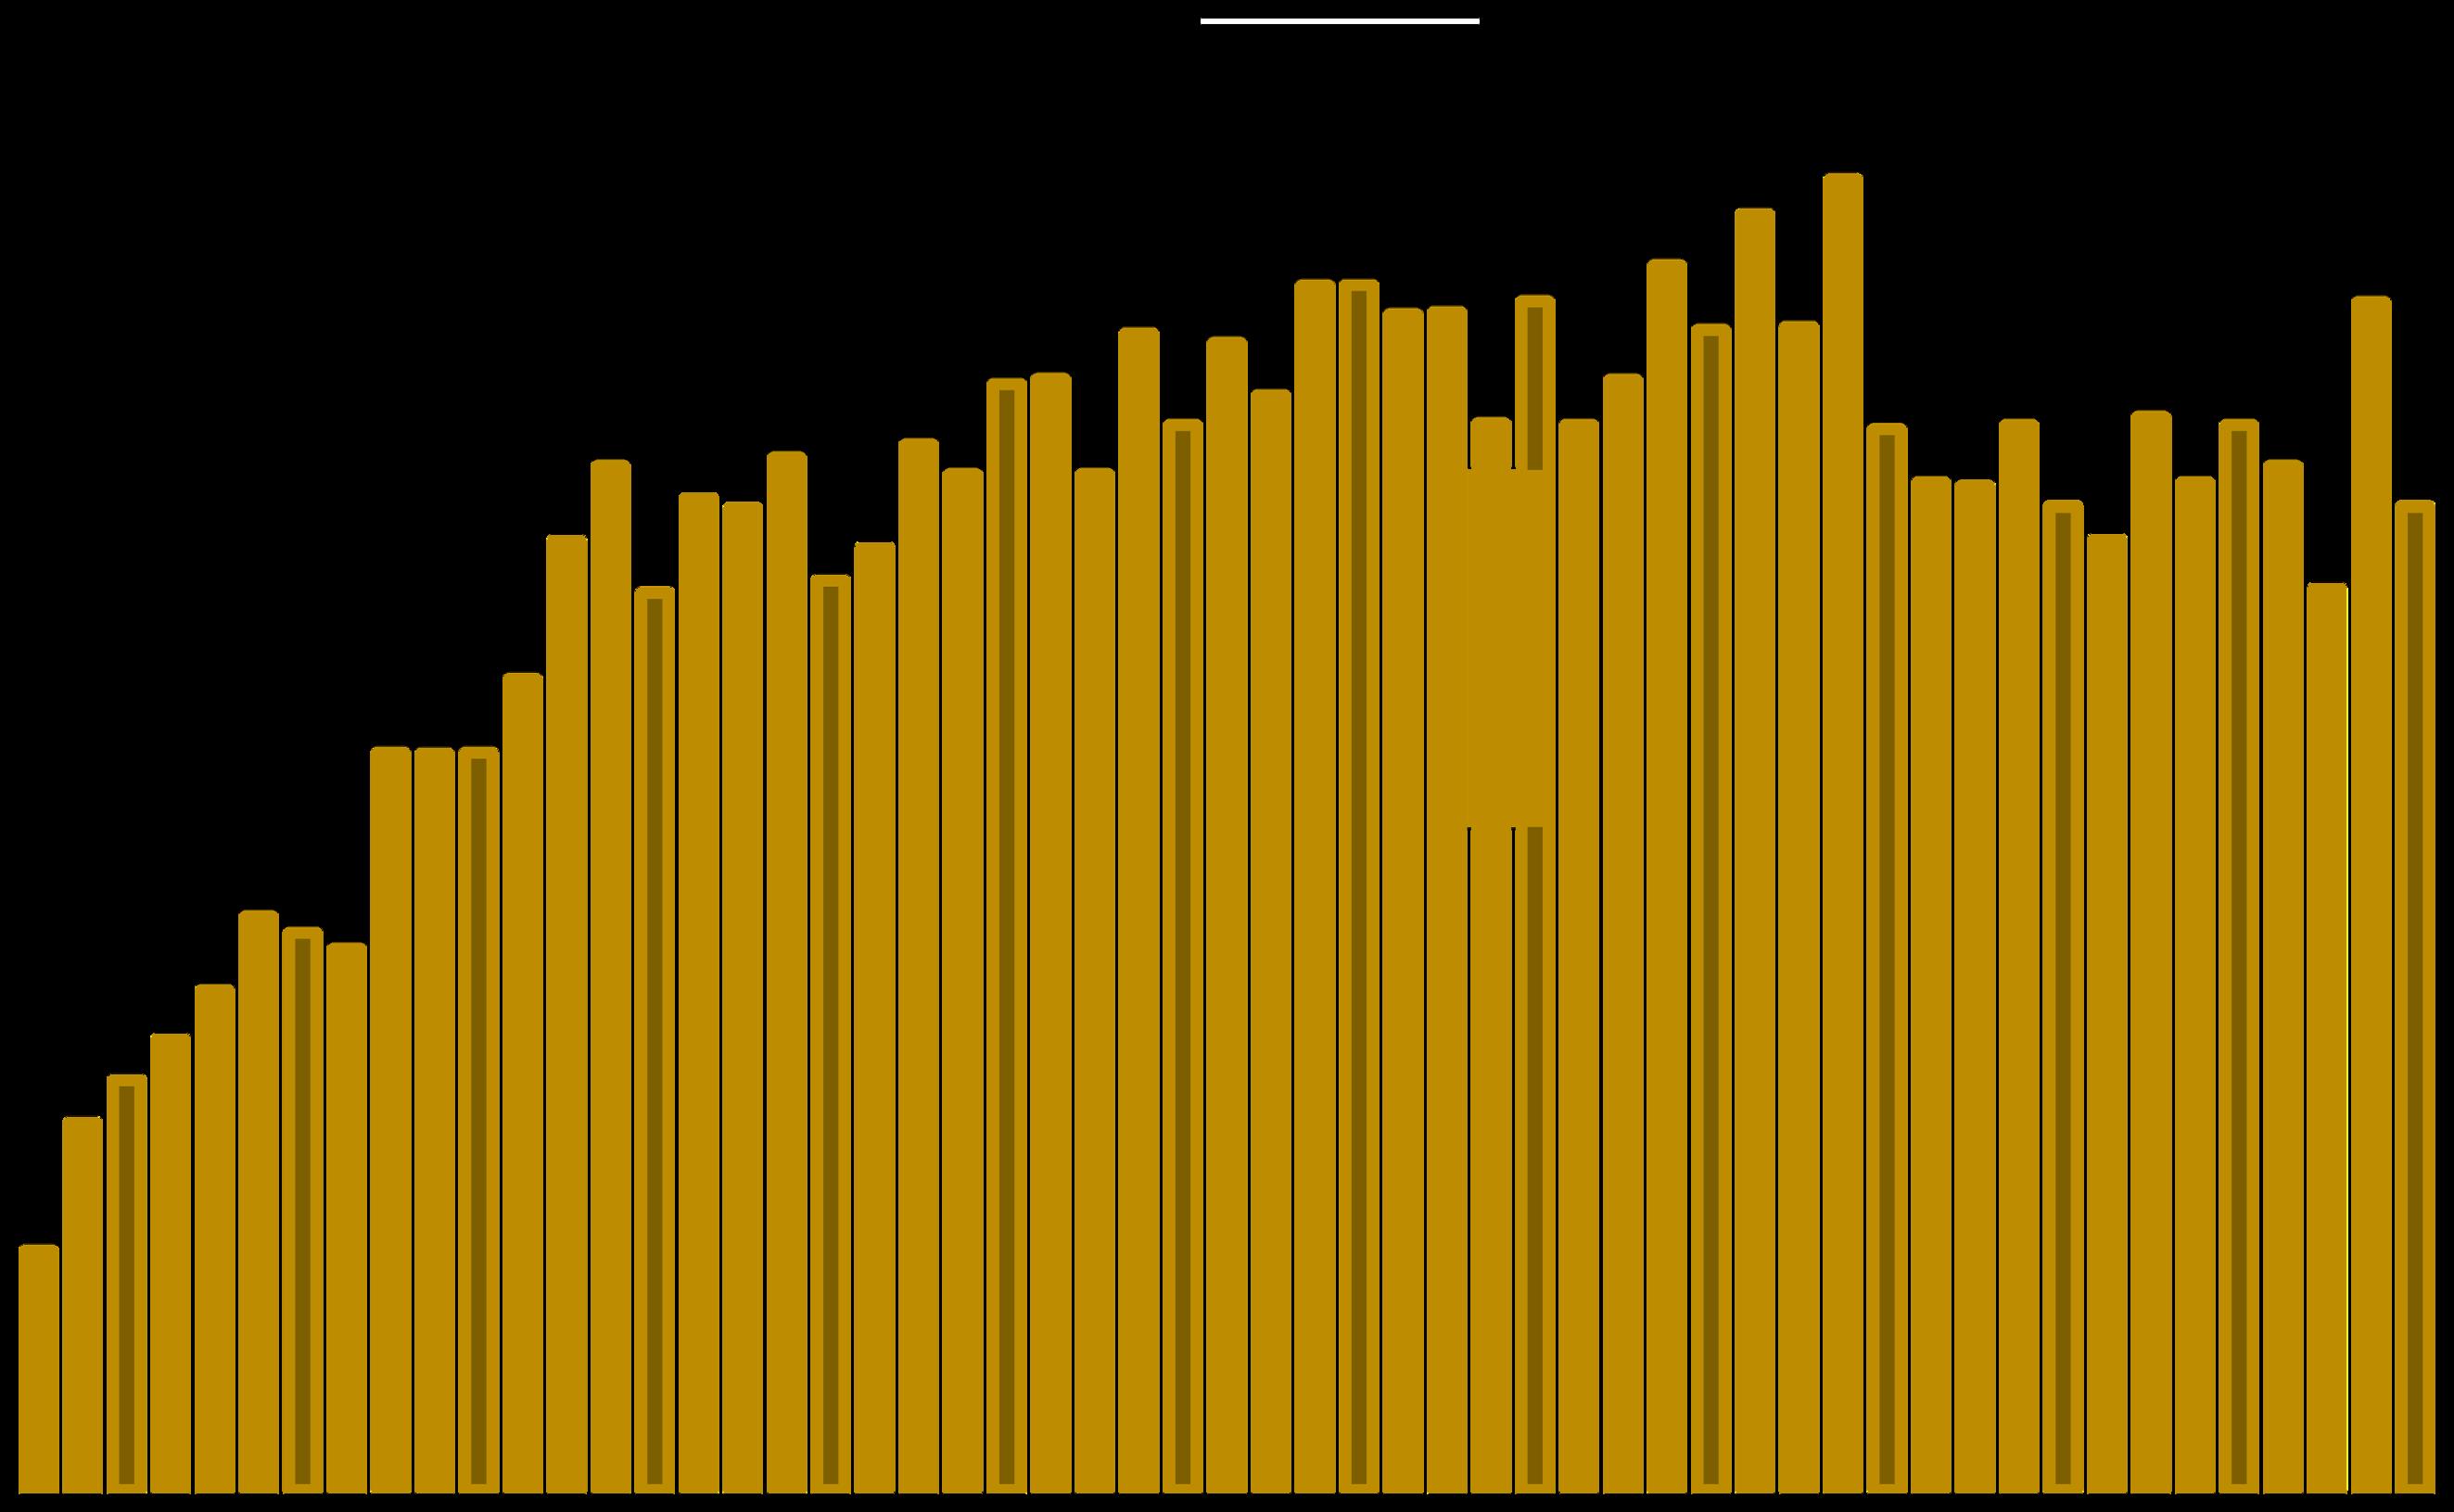
Median Condo Sales Prices, 2012 – Present, by Quarter
Seasonal fluctuationsarecommon. Itisnot unusual for median sales prices to peak for the calendar year in Q2. Different city districts have seen varying median price trends.
Q2 2015 Q2 2023
In September 2025, the number of SF condo sales
2025 median condo sales price fell back, but its 6-month rolling median sales price is up 2.2% year over year. soared 50% higher than in September 2024.
Outsized price spikes up or down should be considered preliminary until substantiated over the longer term. 2022 Q2 Q2 2025
3-Month-Rolling,MedianDollarperSquareFoot Values*
Median $/sq.ft. value is a general statistic, disguising an enormous range of values in the underlying sales. It is often affected by other factors besides changes in fair market value. Monthly and seasonal fluctuations are common, which explain many of the regular ups and downs in this chart.
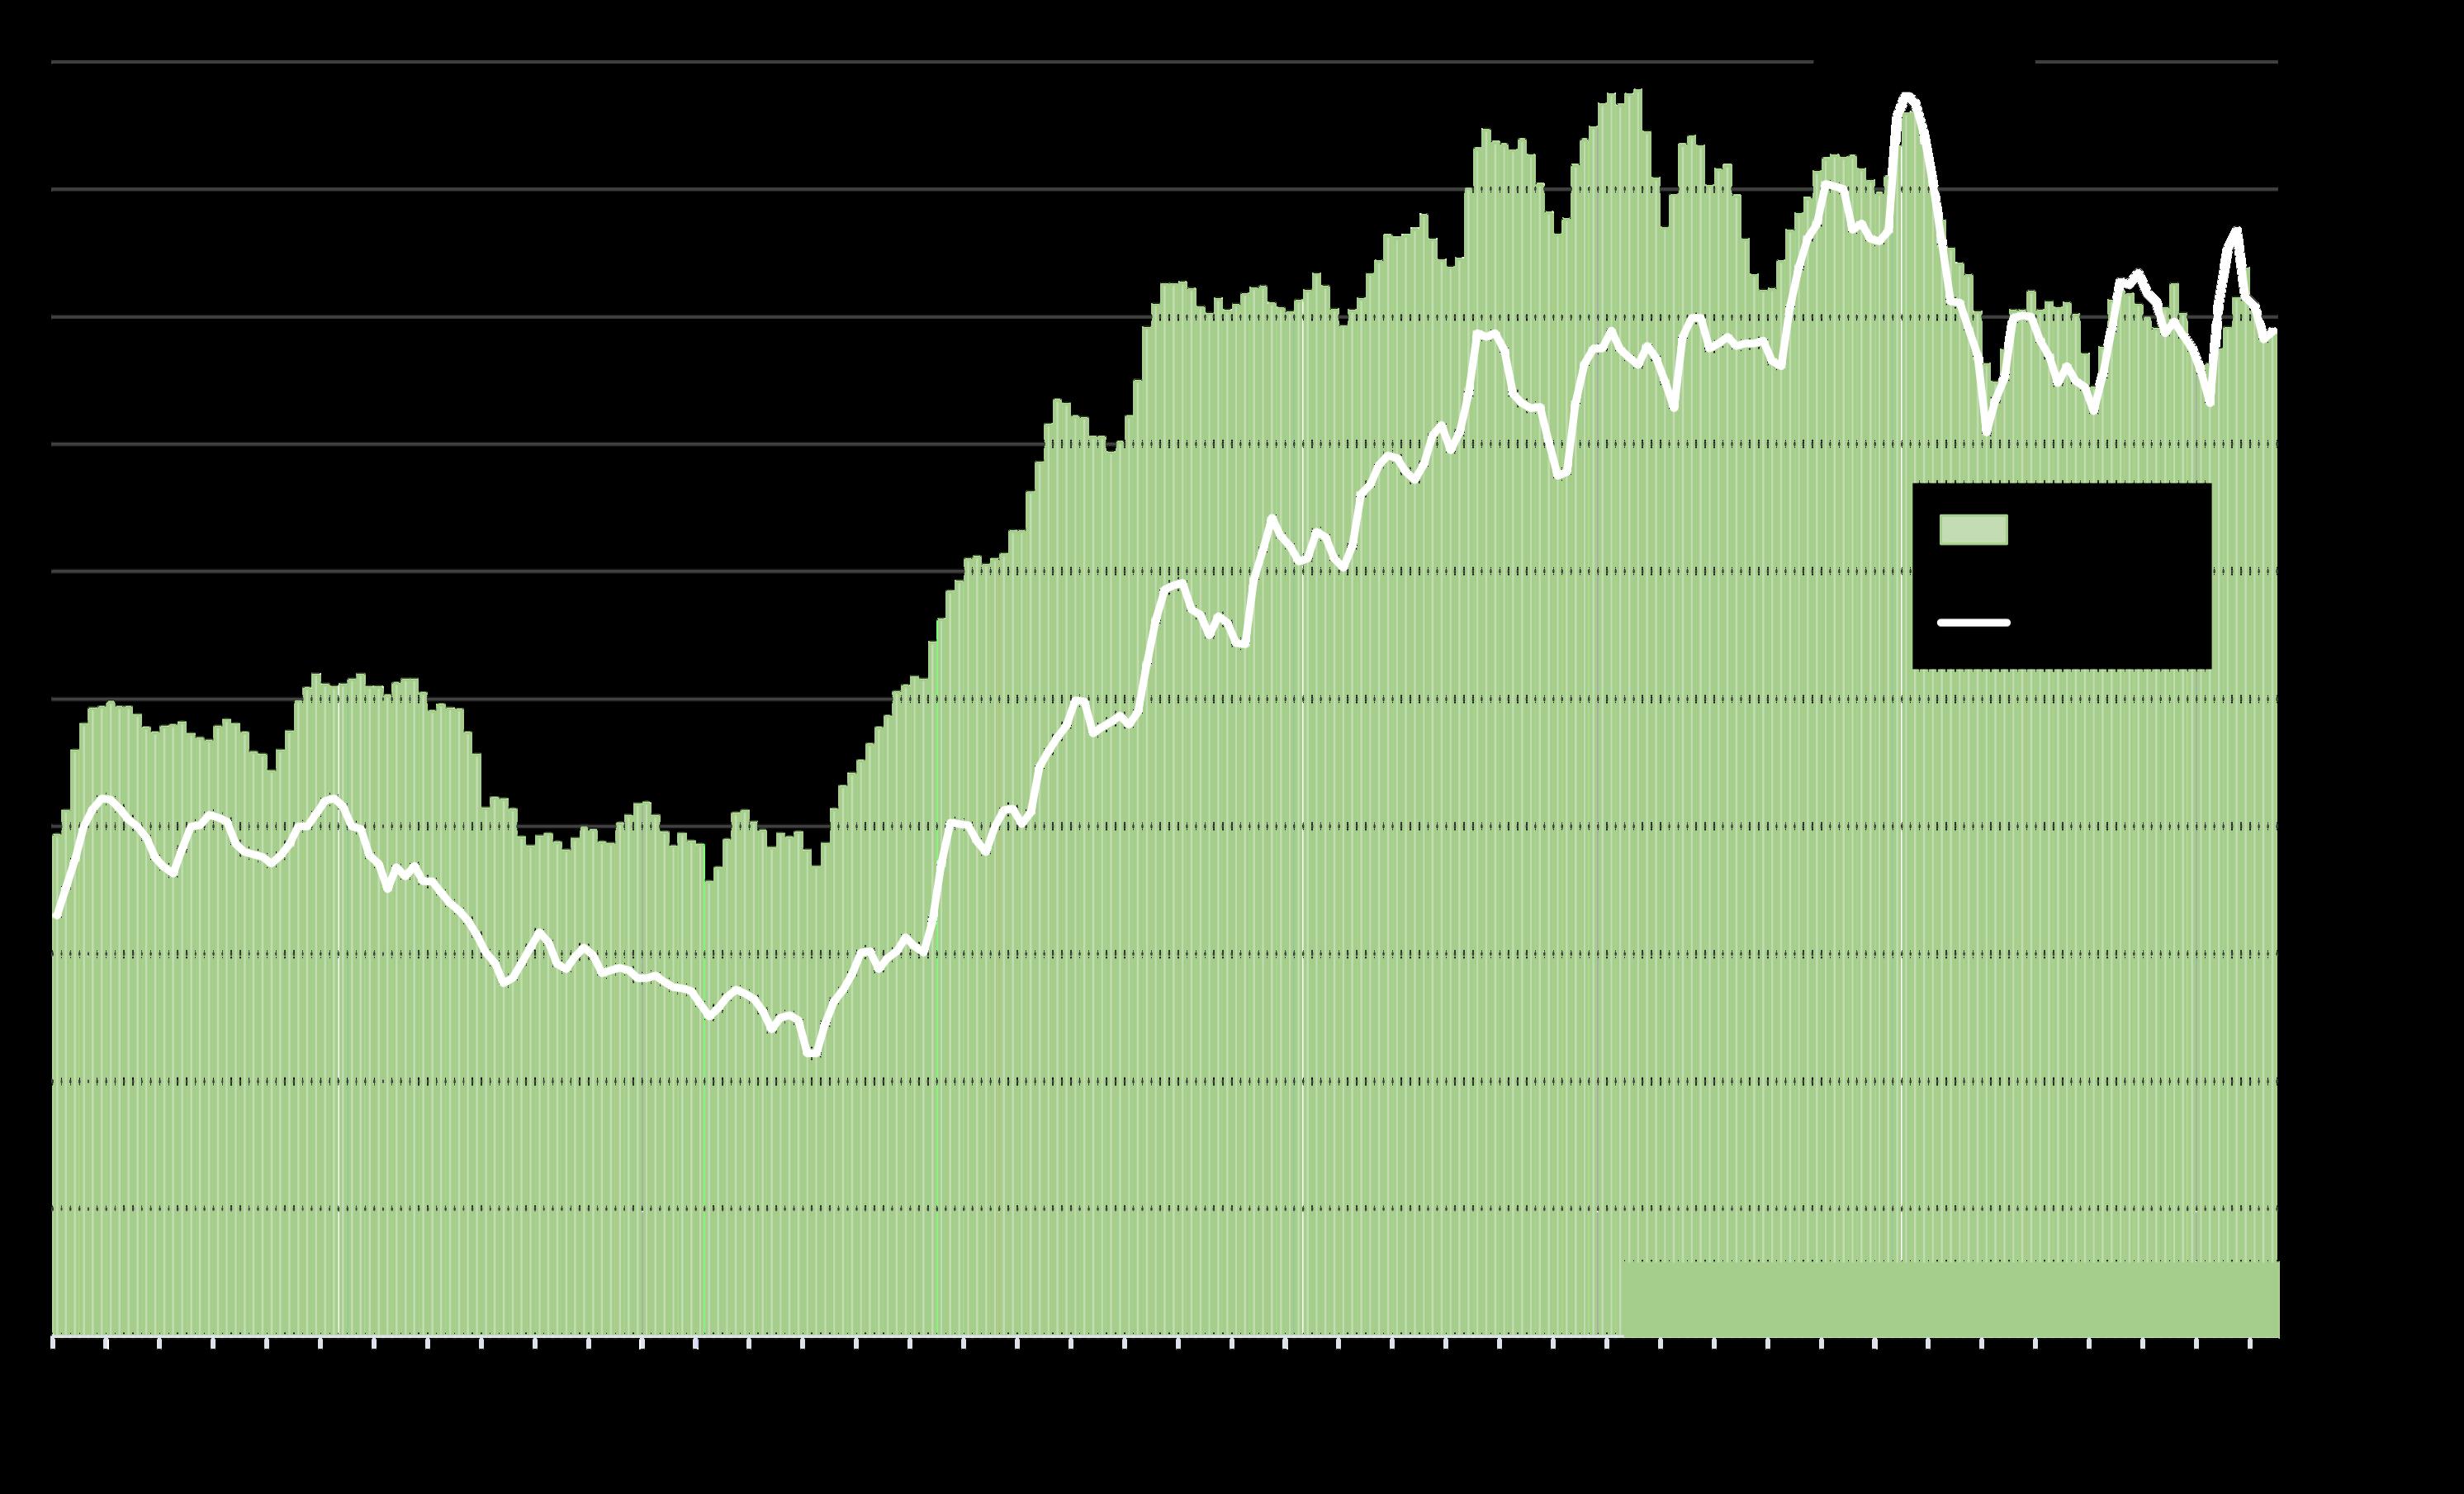
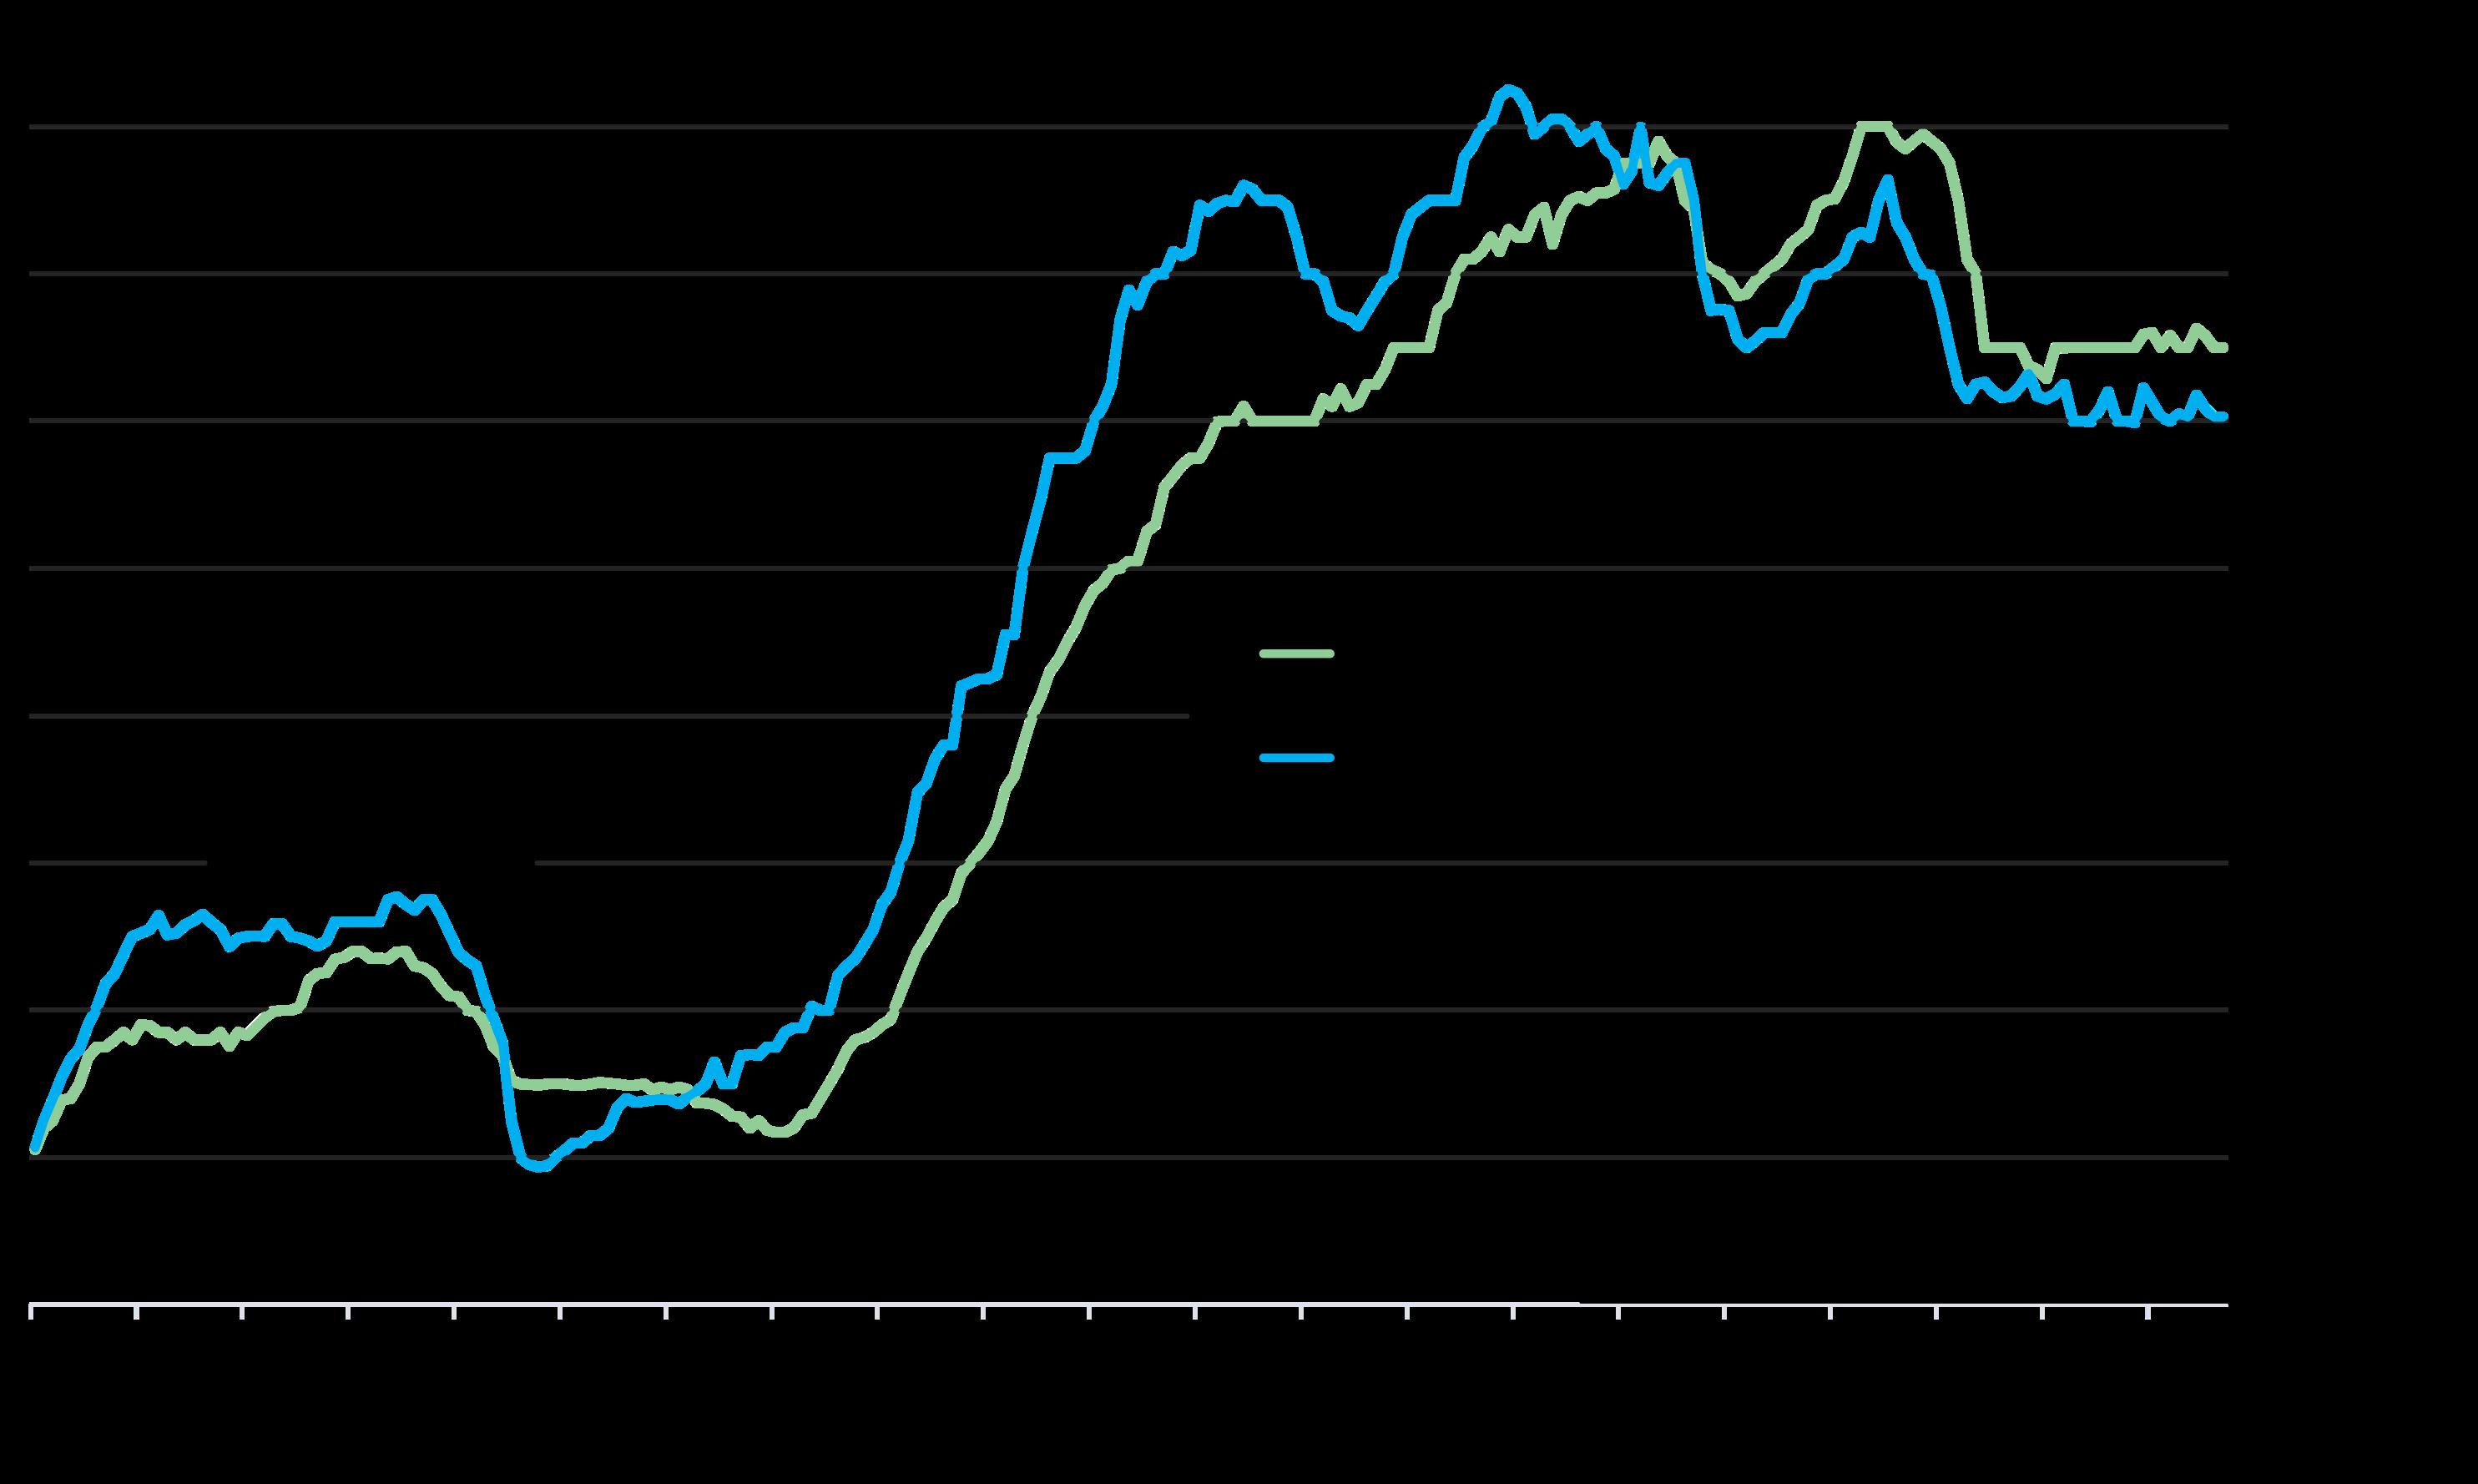
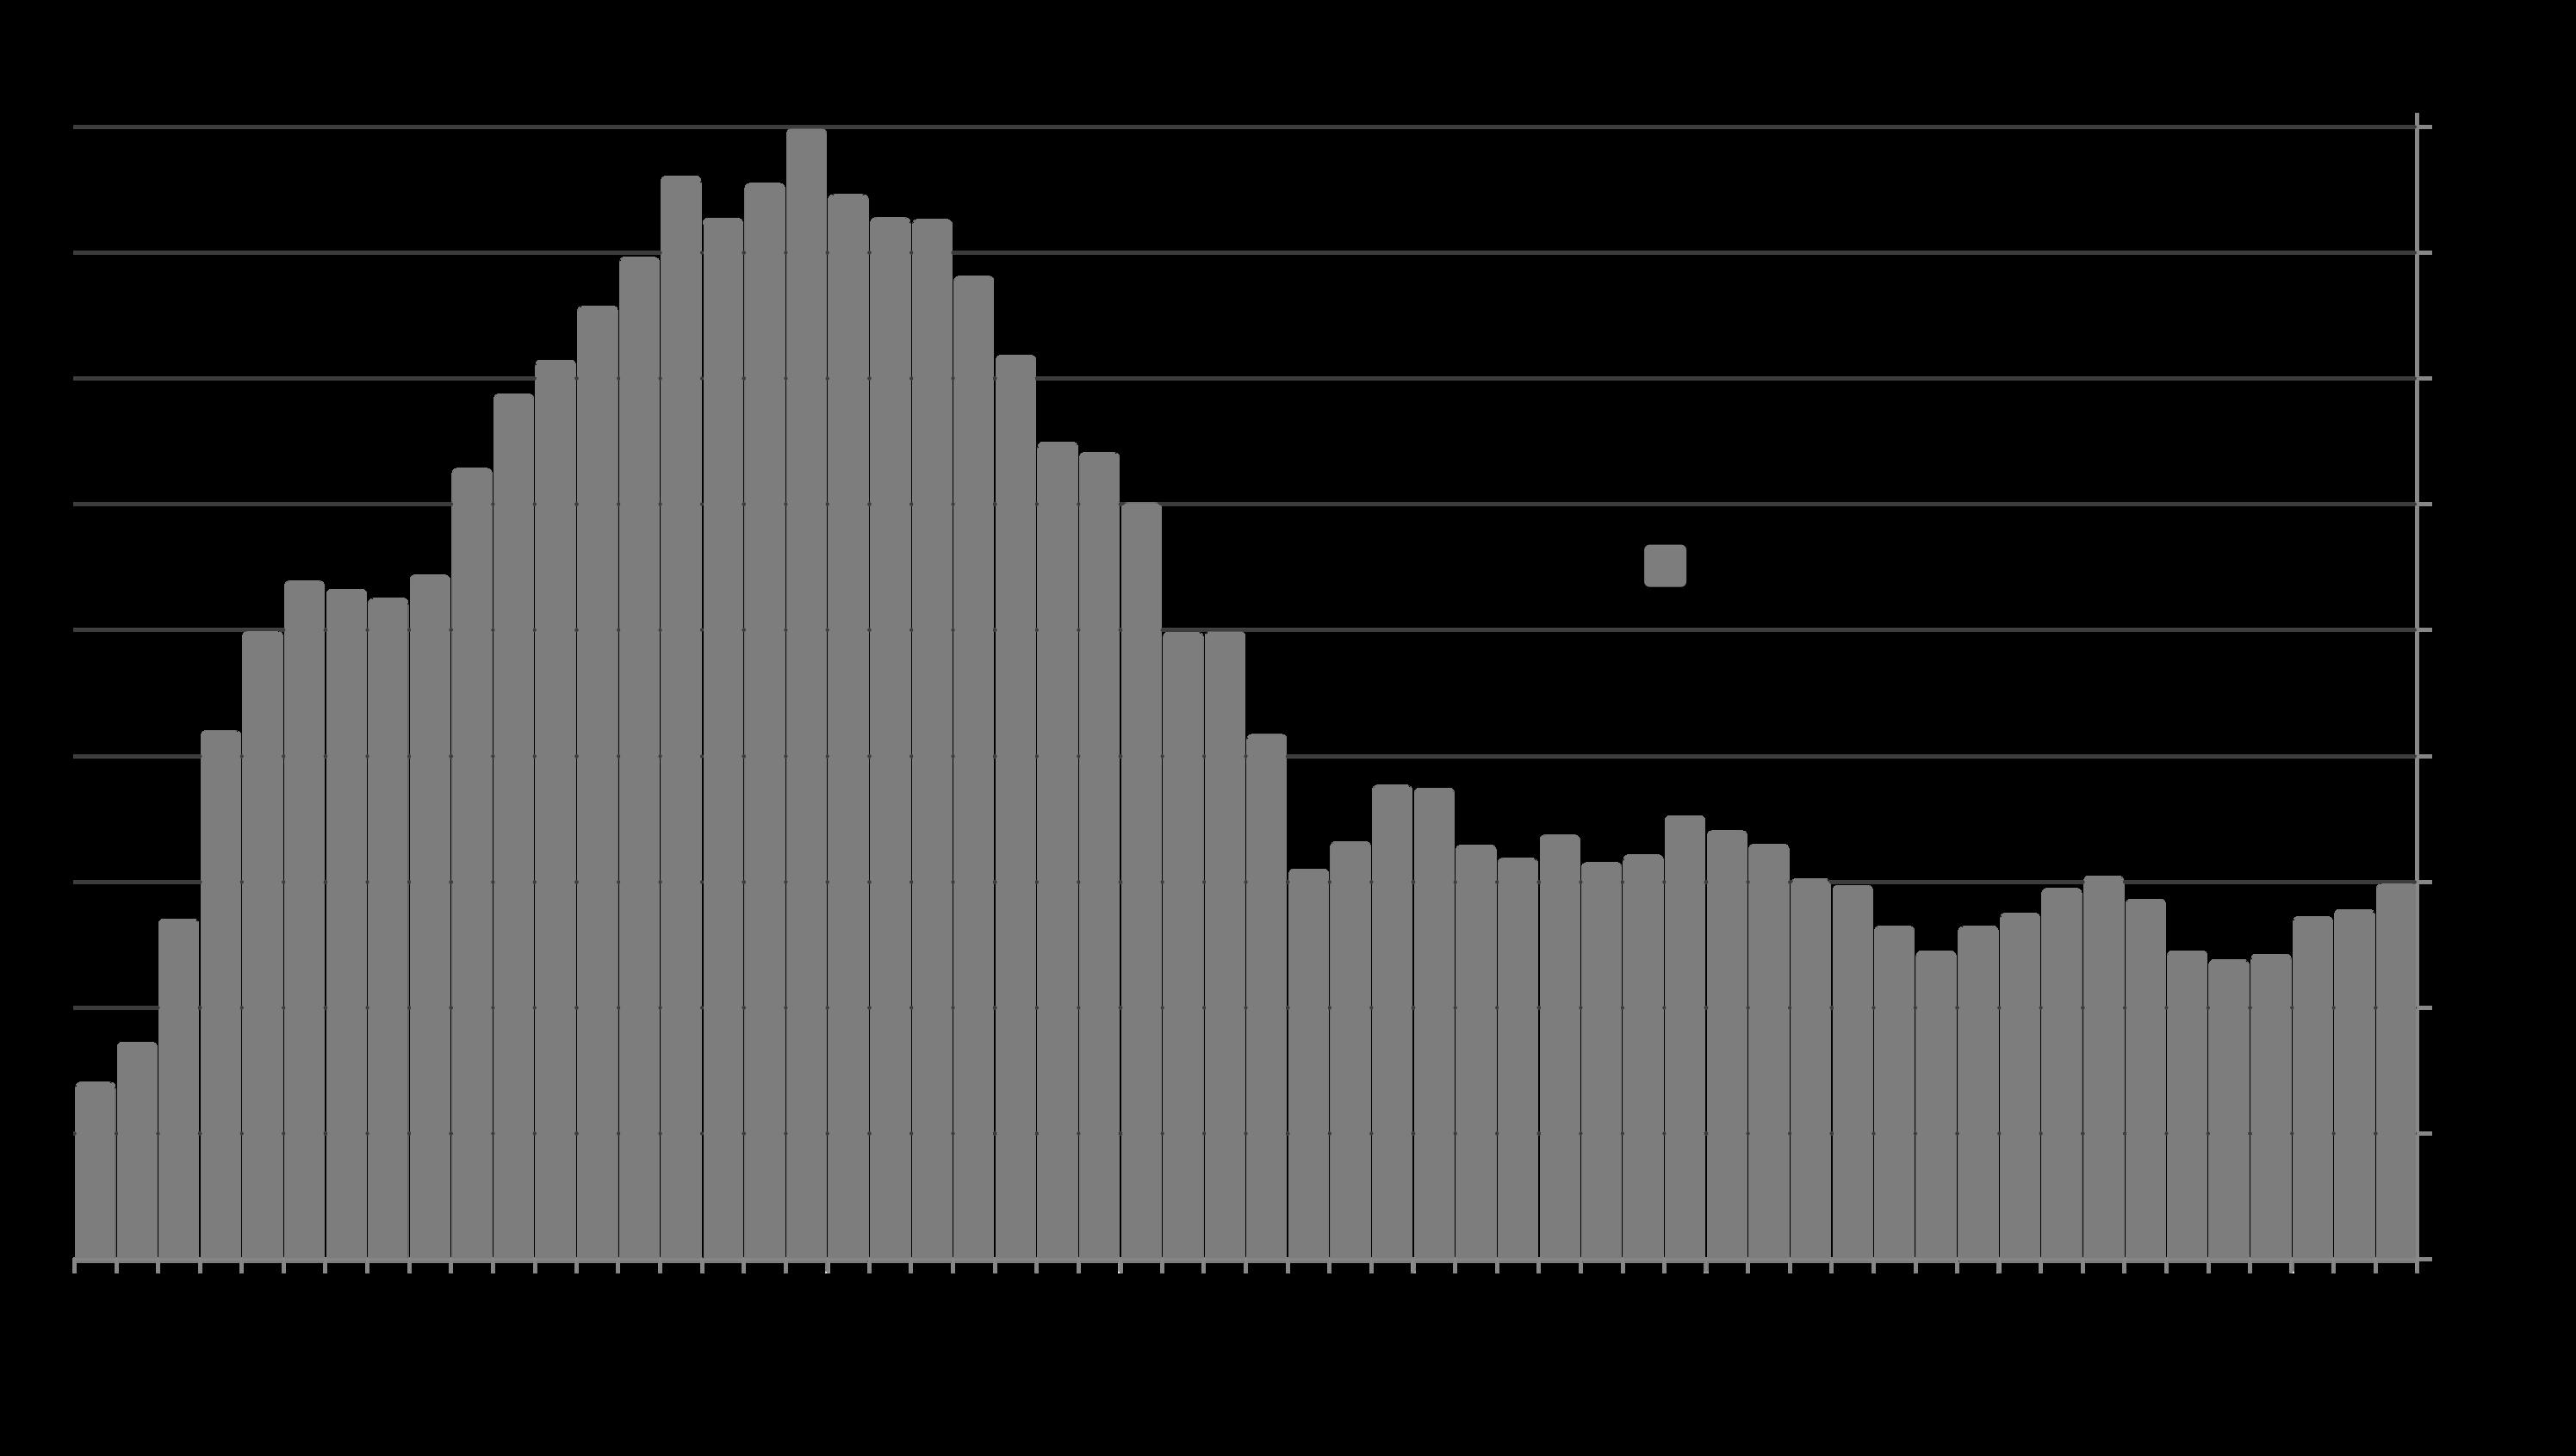
San Francisco CONDO Prices: Downtown vs. Non-Downtown
12-Month-Rolling, Median 2-Bedroom Condo Sales Prices since 2005*
Comparing median 2-bedroom condo sales prices in the greater Downtown/South of Market/Civic Center area (the center of large-project, newcondo construction, office buildings and high-tech employment) – the blue line – with the rest of San Francisco (mostly smaller, older buildings, in less urban environments) – the green line.
Median sales prices also vary widely within these two broad regions.
Condo Market in Non-Downtown Area
Greater Downtown/SoMa Condo Market
2007-2008
NOTE: 12-month-rolling sales data smooths the median sales price trend lines and removes seasonality from the analysis, but it can lag short-term changes in 2025.
Great recession, foreclosure crisis
*12-month rolling median condo sales values reported to NorCal MLS Alliance, per Infosparks. Analysis may contain errors and subject to revision. Does not include new-project sales unreported to MLS. All numbers approximate, and may change with late-reported sales.
MedianResidentEarnings&PercentageofPopulation by Level of Education*
$80,000
$60,000
$40,000
$20,000 $140,000 $120,000
$0 $100,000 No high school diploma High school diploma
San Francisco is one of the most educated and affluent counties in the country. Of California counties, it has the 2nd highest percentage of residents (after Marin) holding either Bachelor’s, Graduate or Professional degrees.
Among holders of bachelor’s, graduate and professional enormously depending on the specialty of the degree, i.e. liberal arts, education, social services, business, computer science, law, medicine and so on. degrees, median earnings can vary
Some college or AA degree Bachelor's degree Graduate or Professional degree
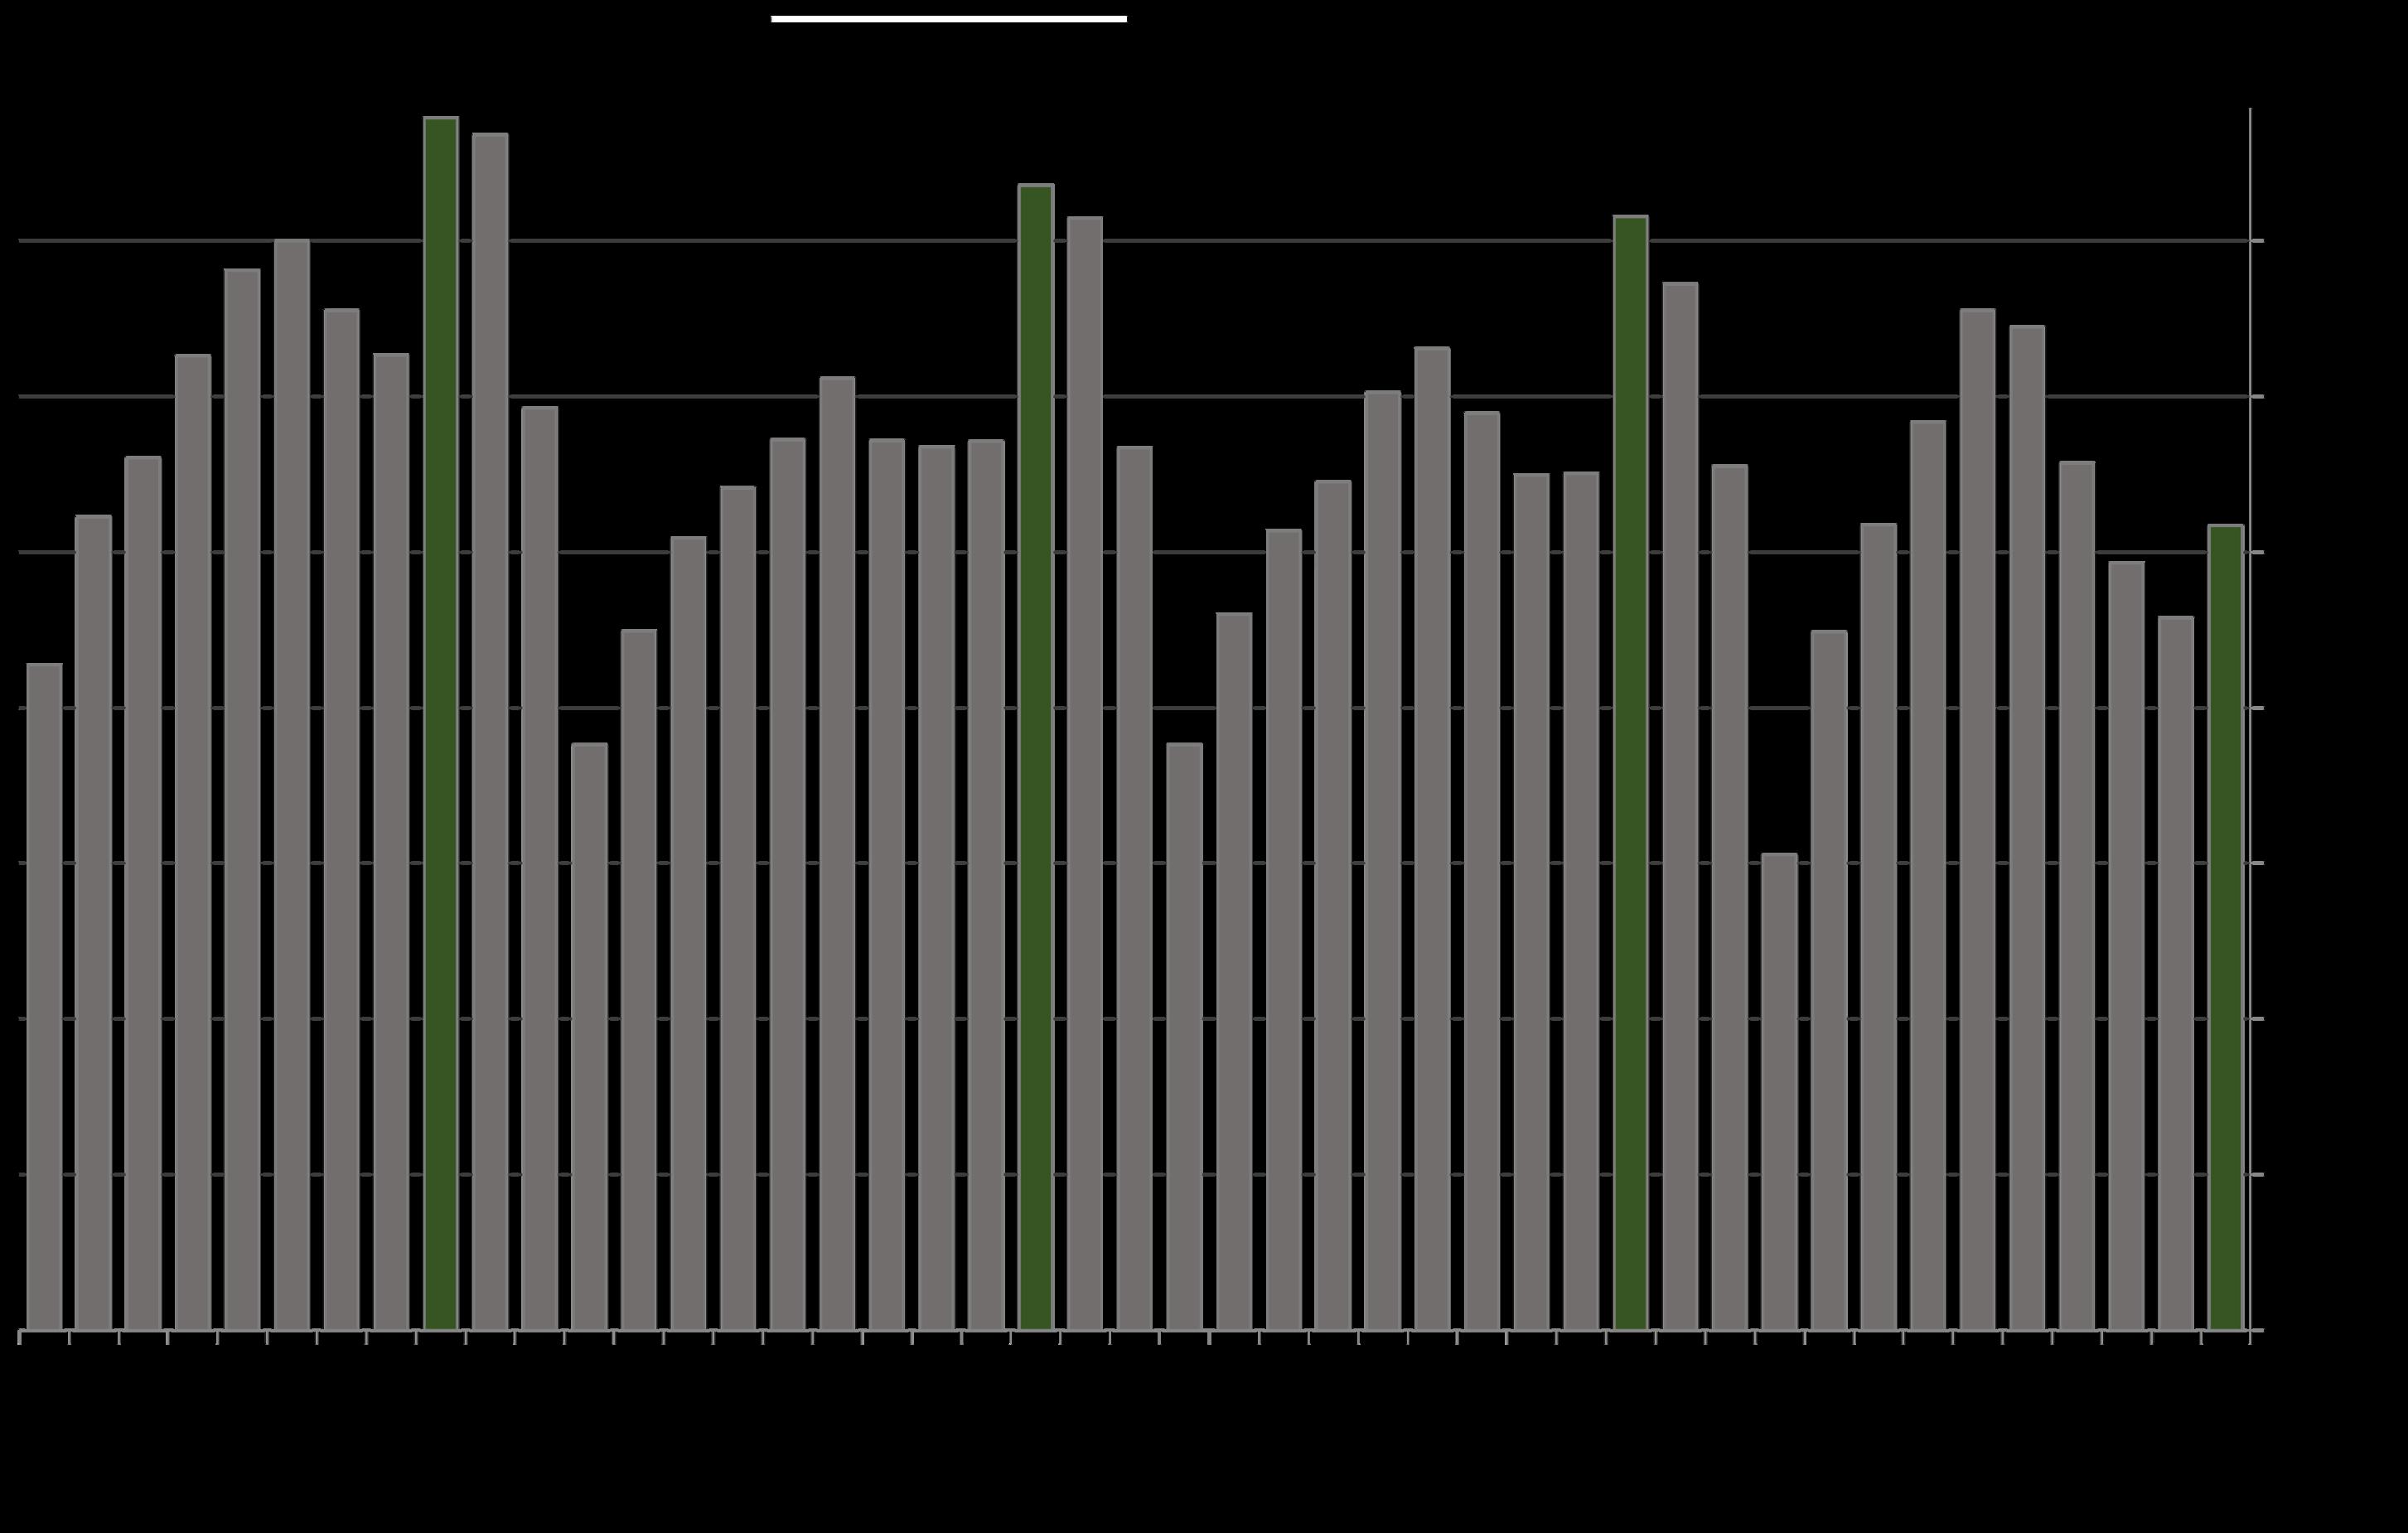
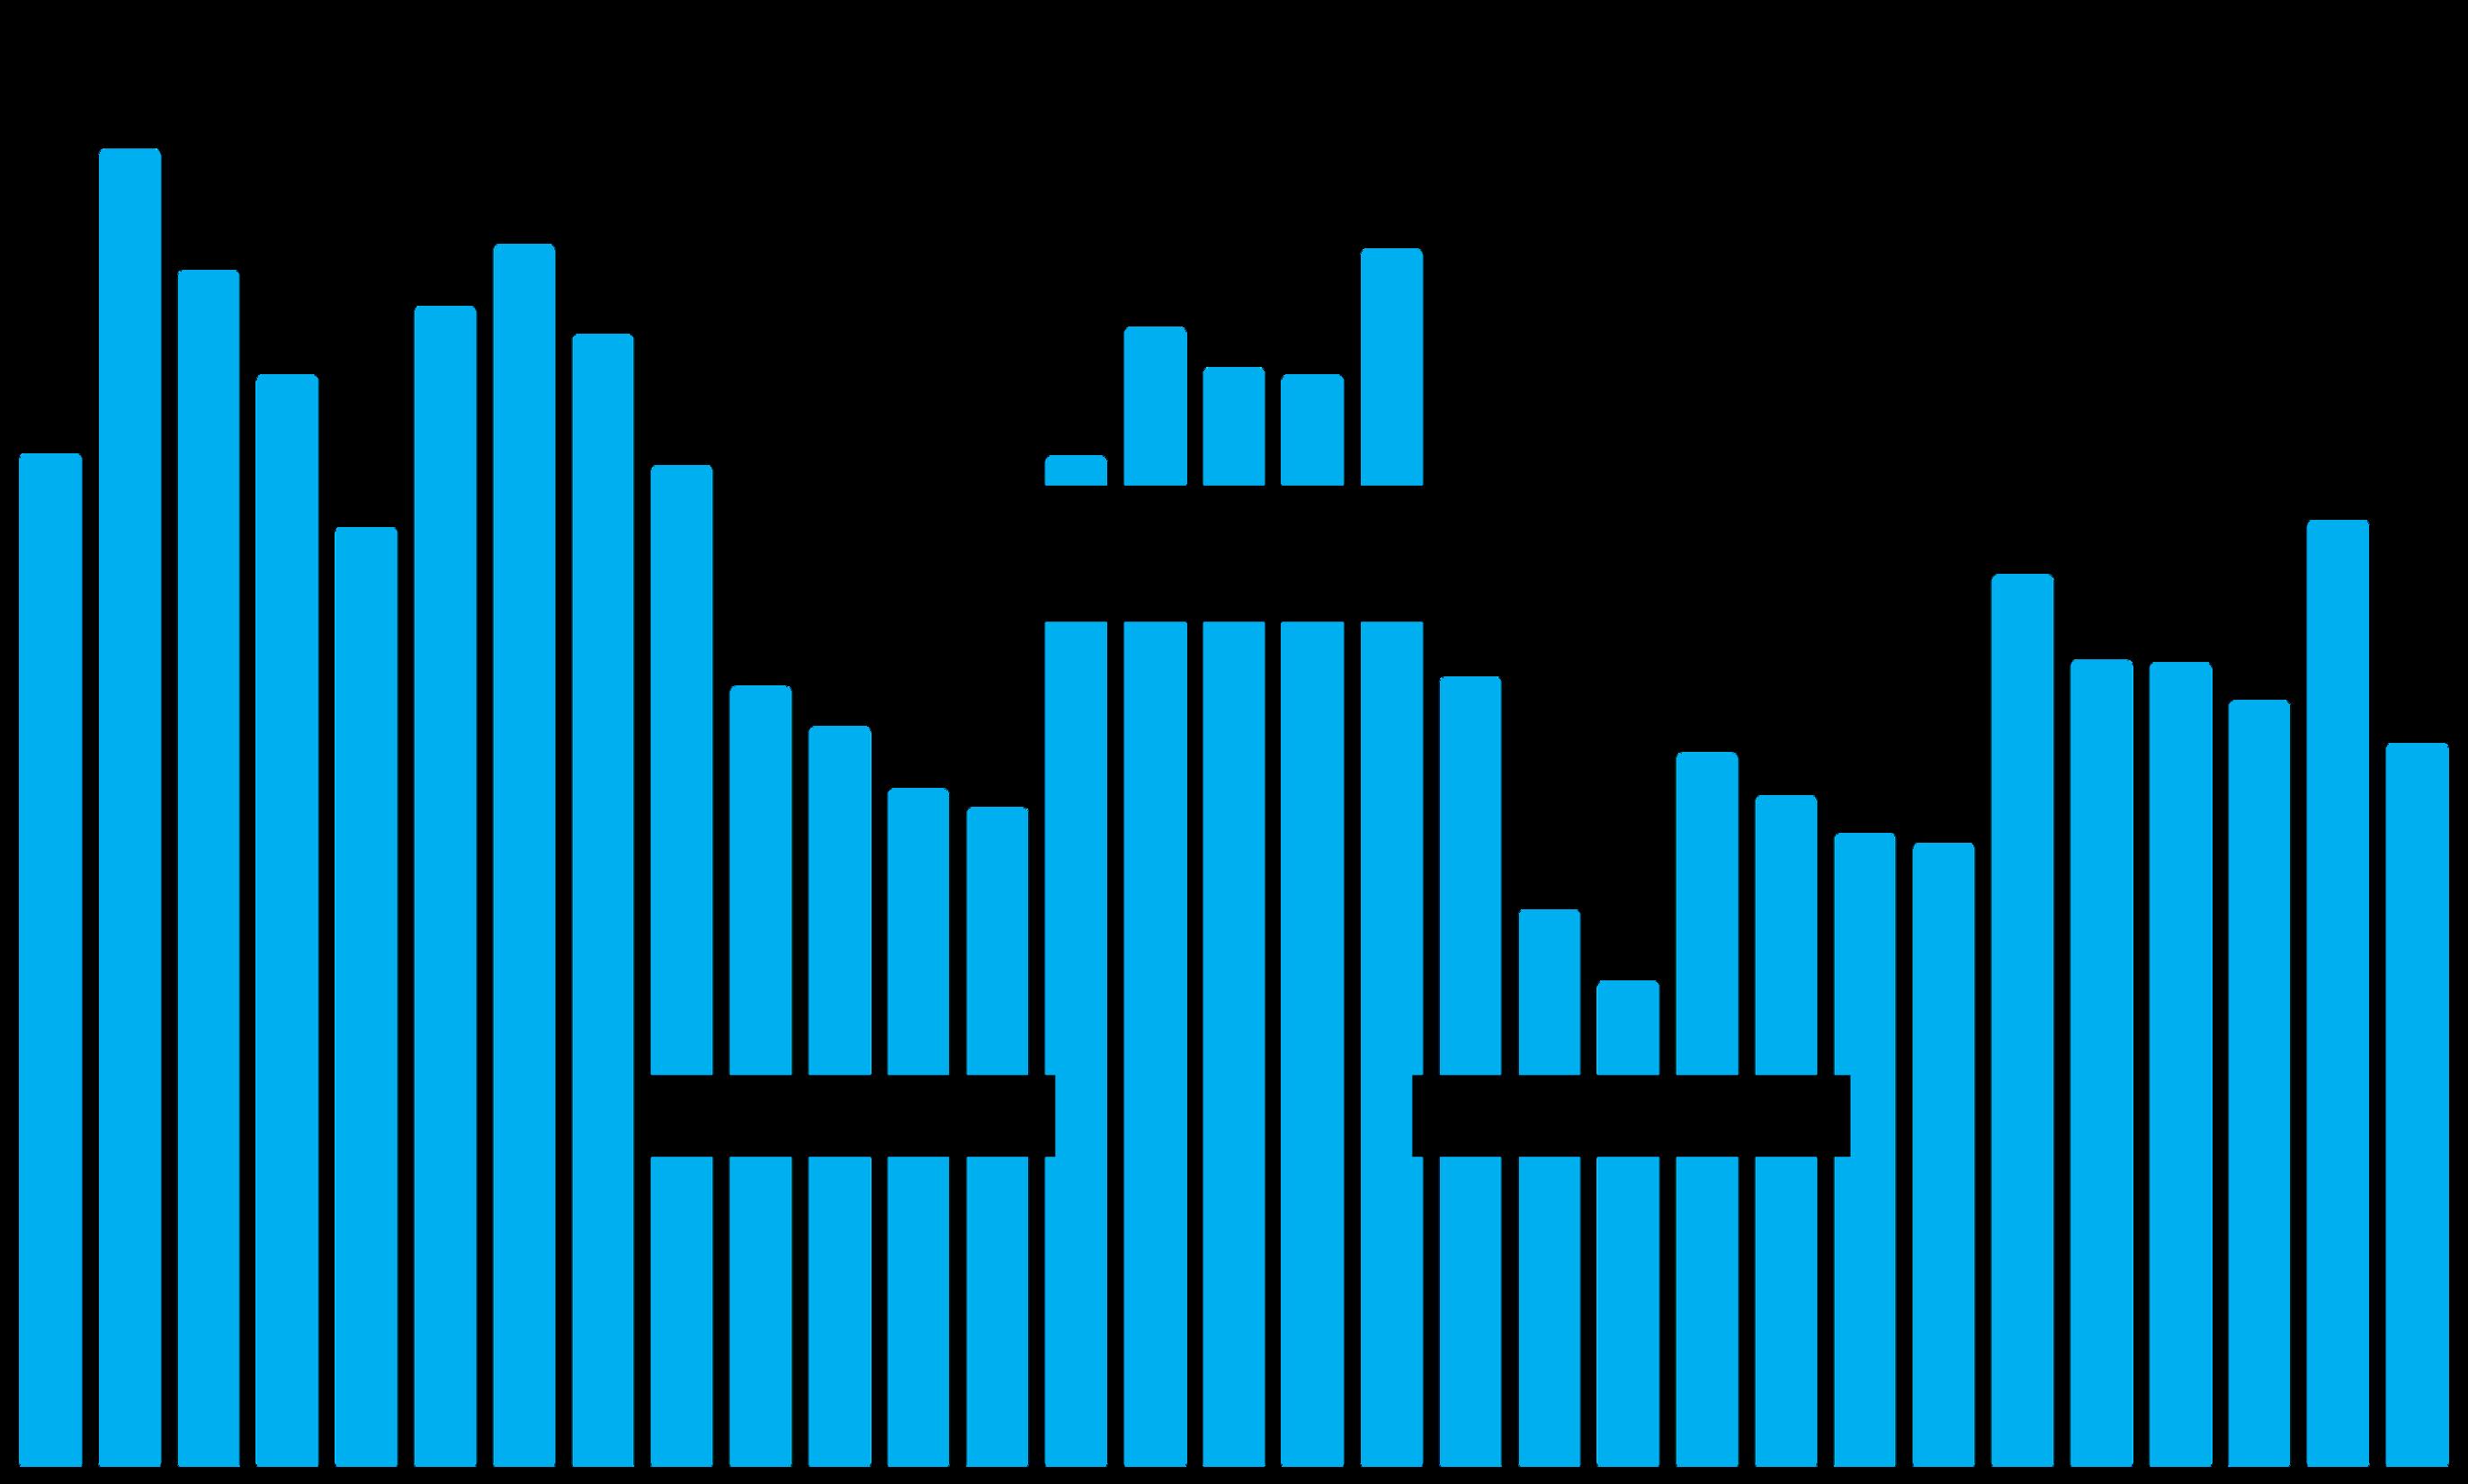
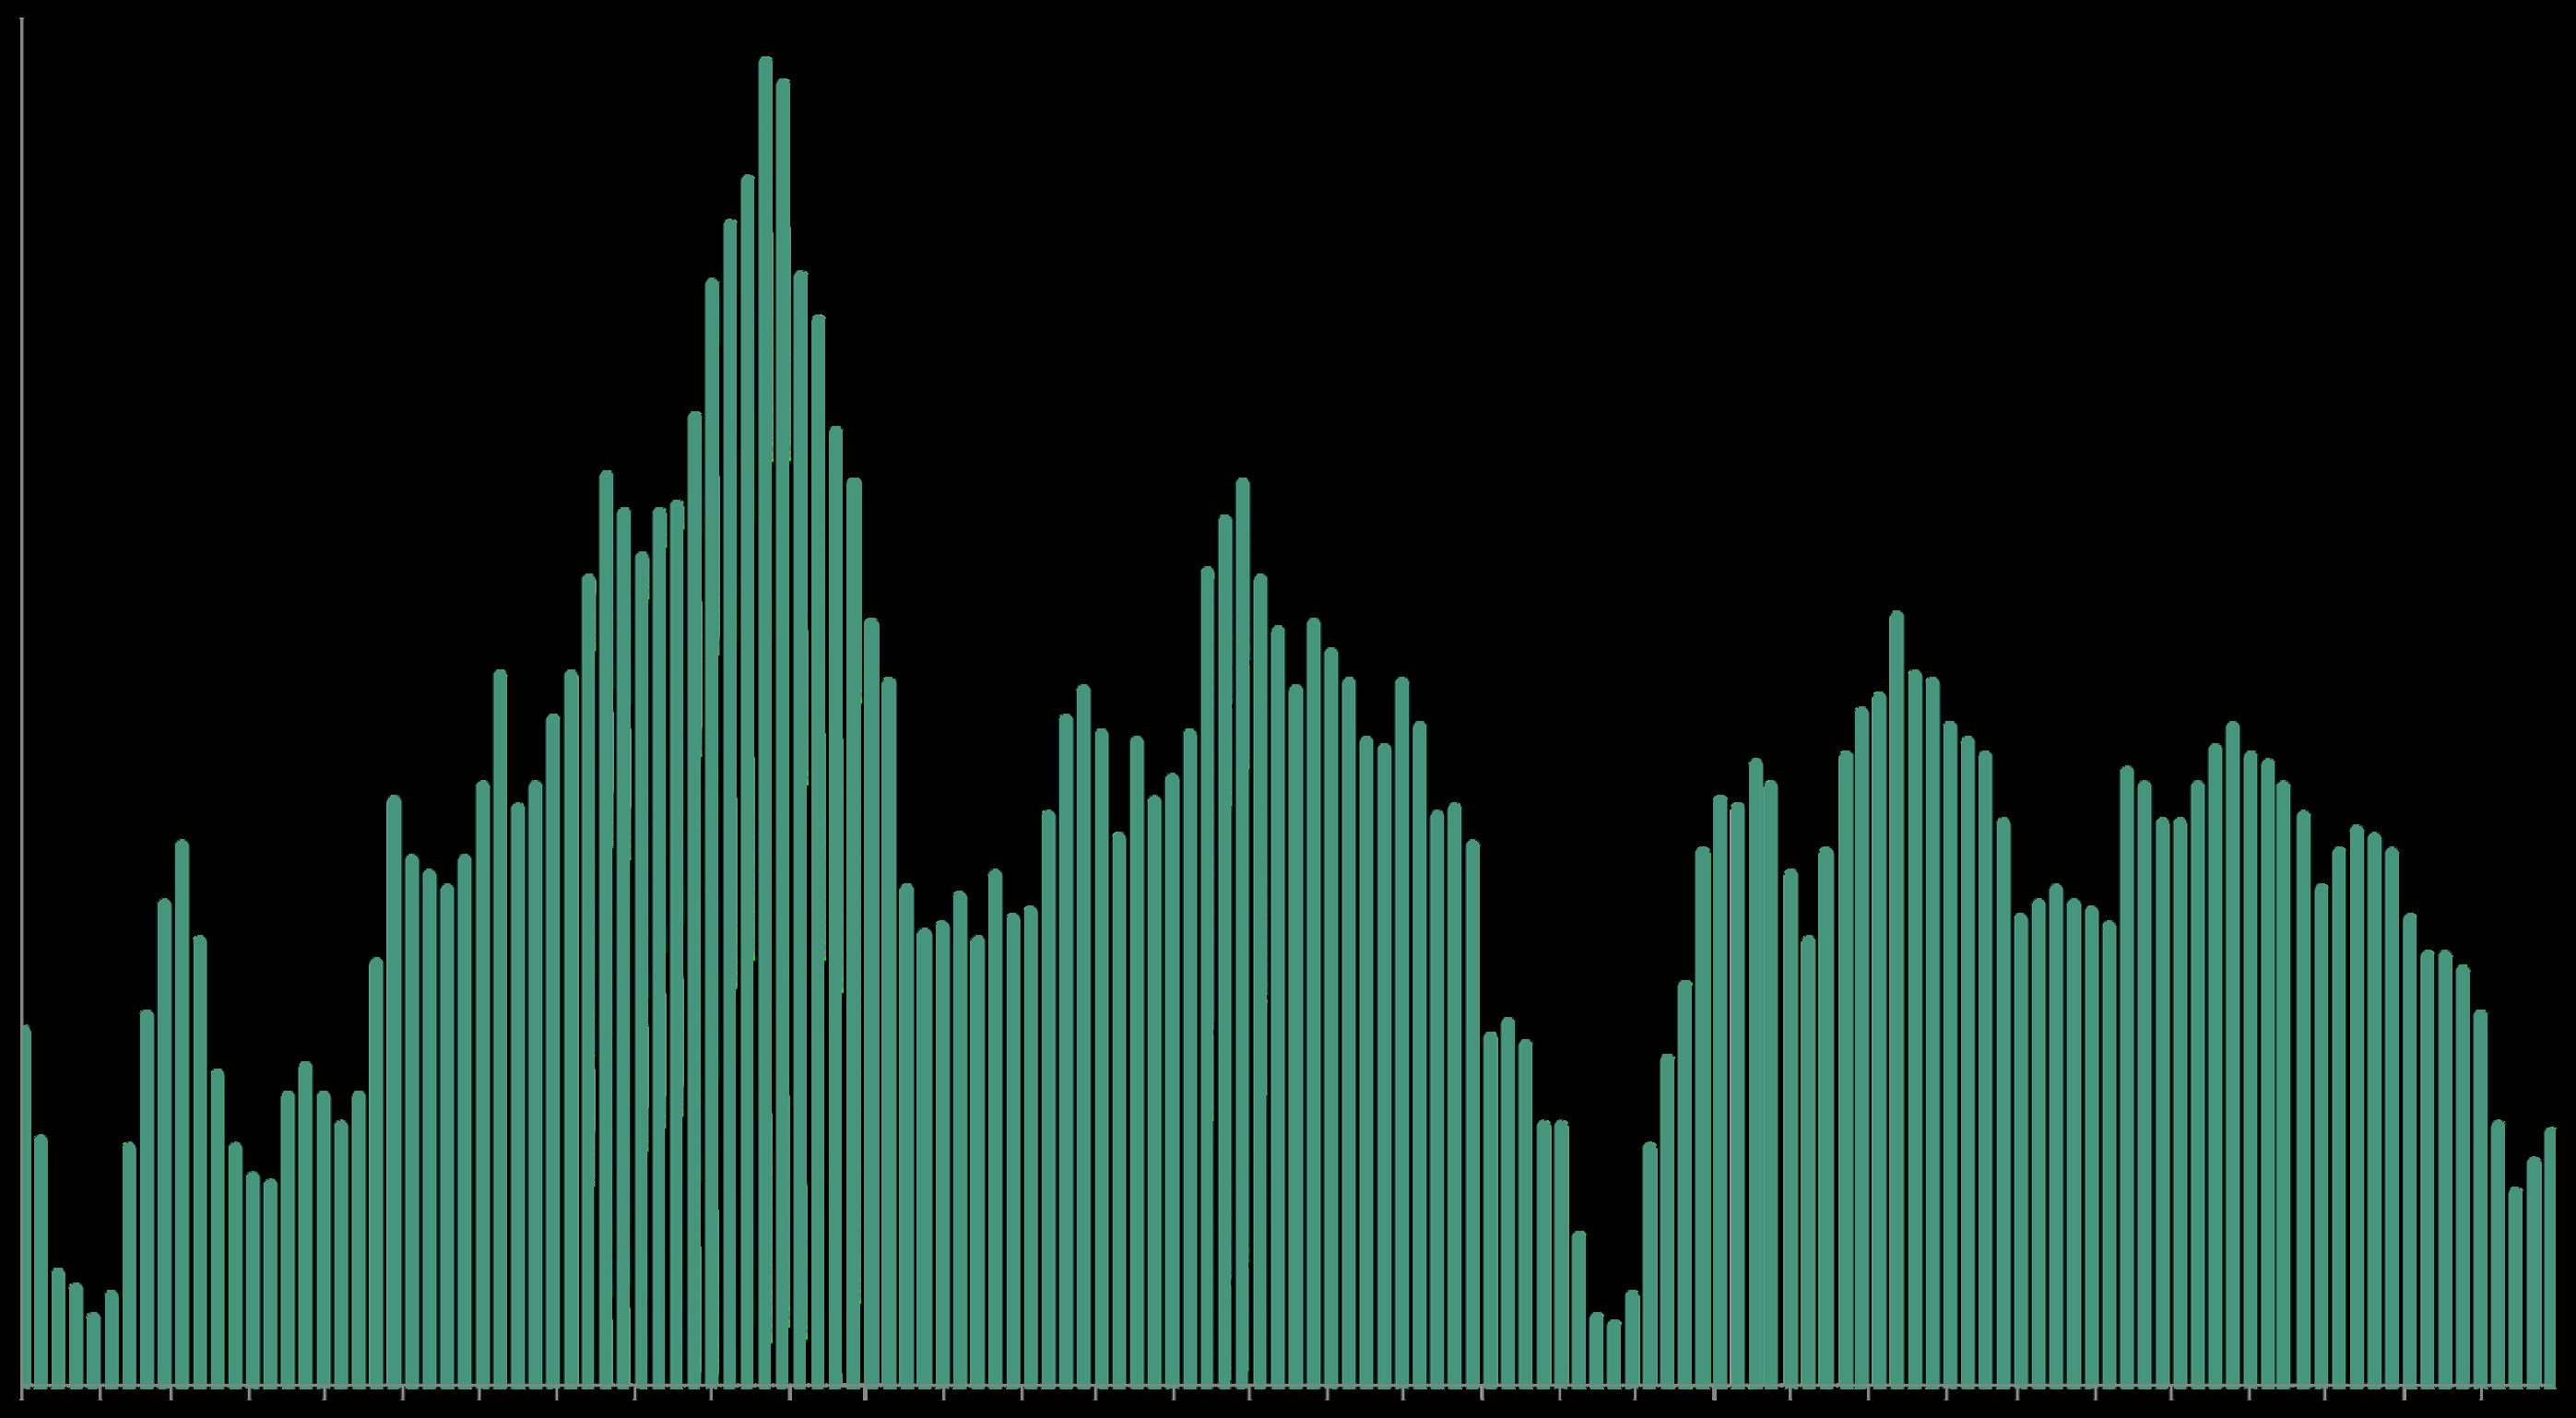
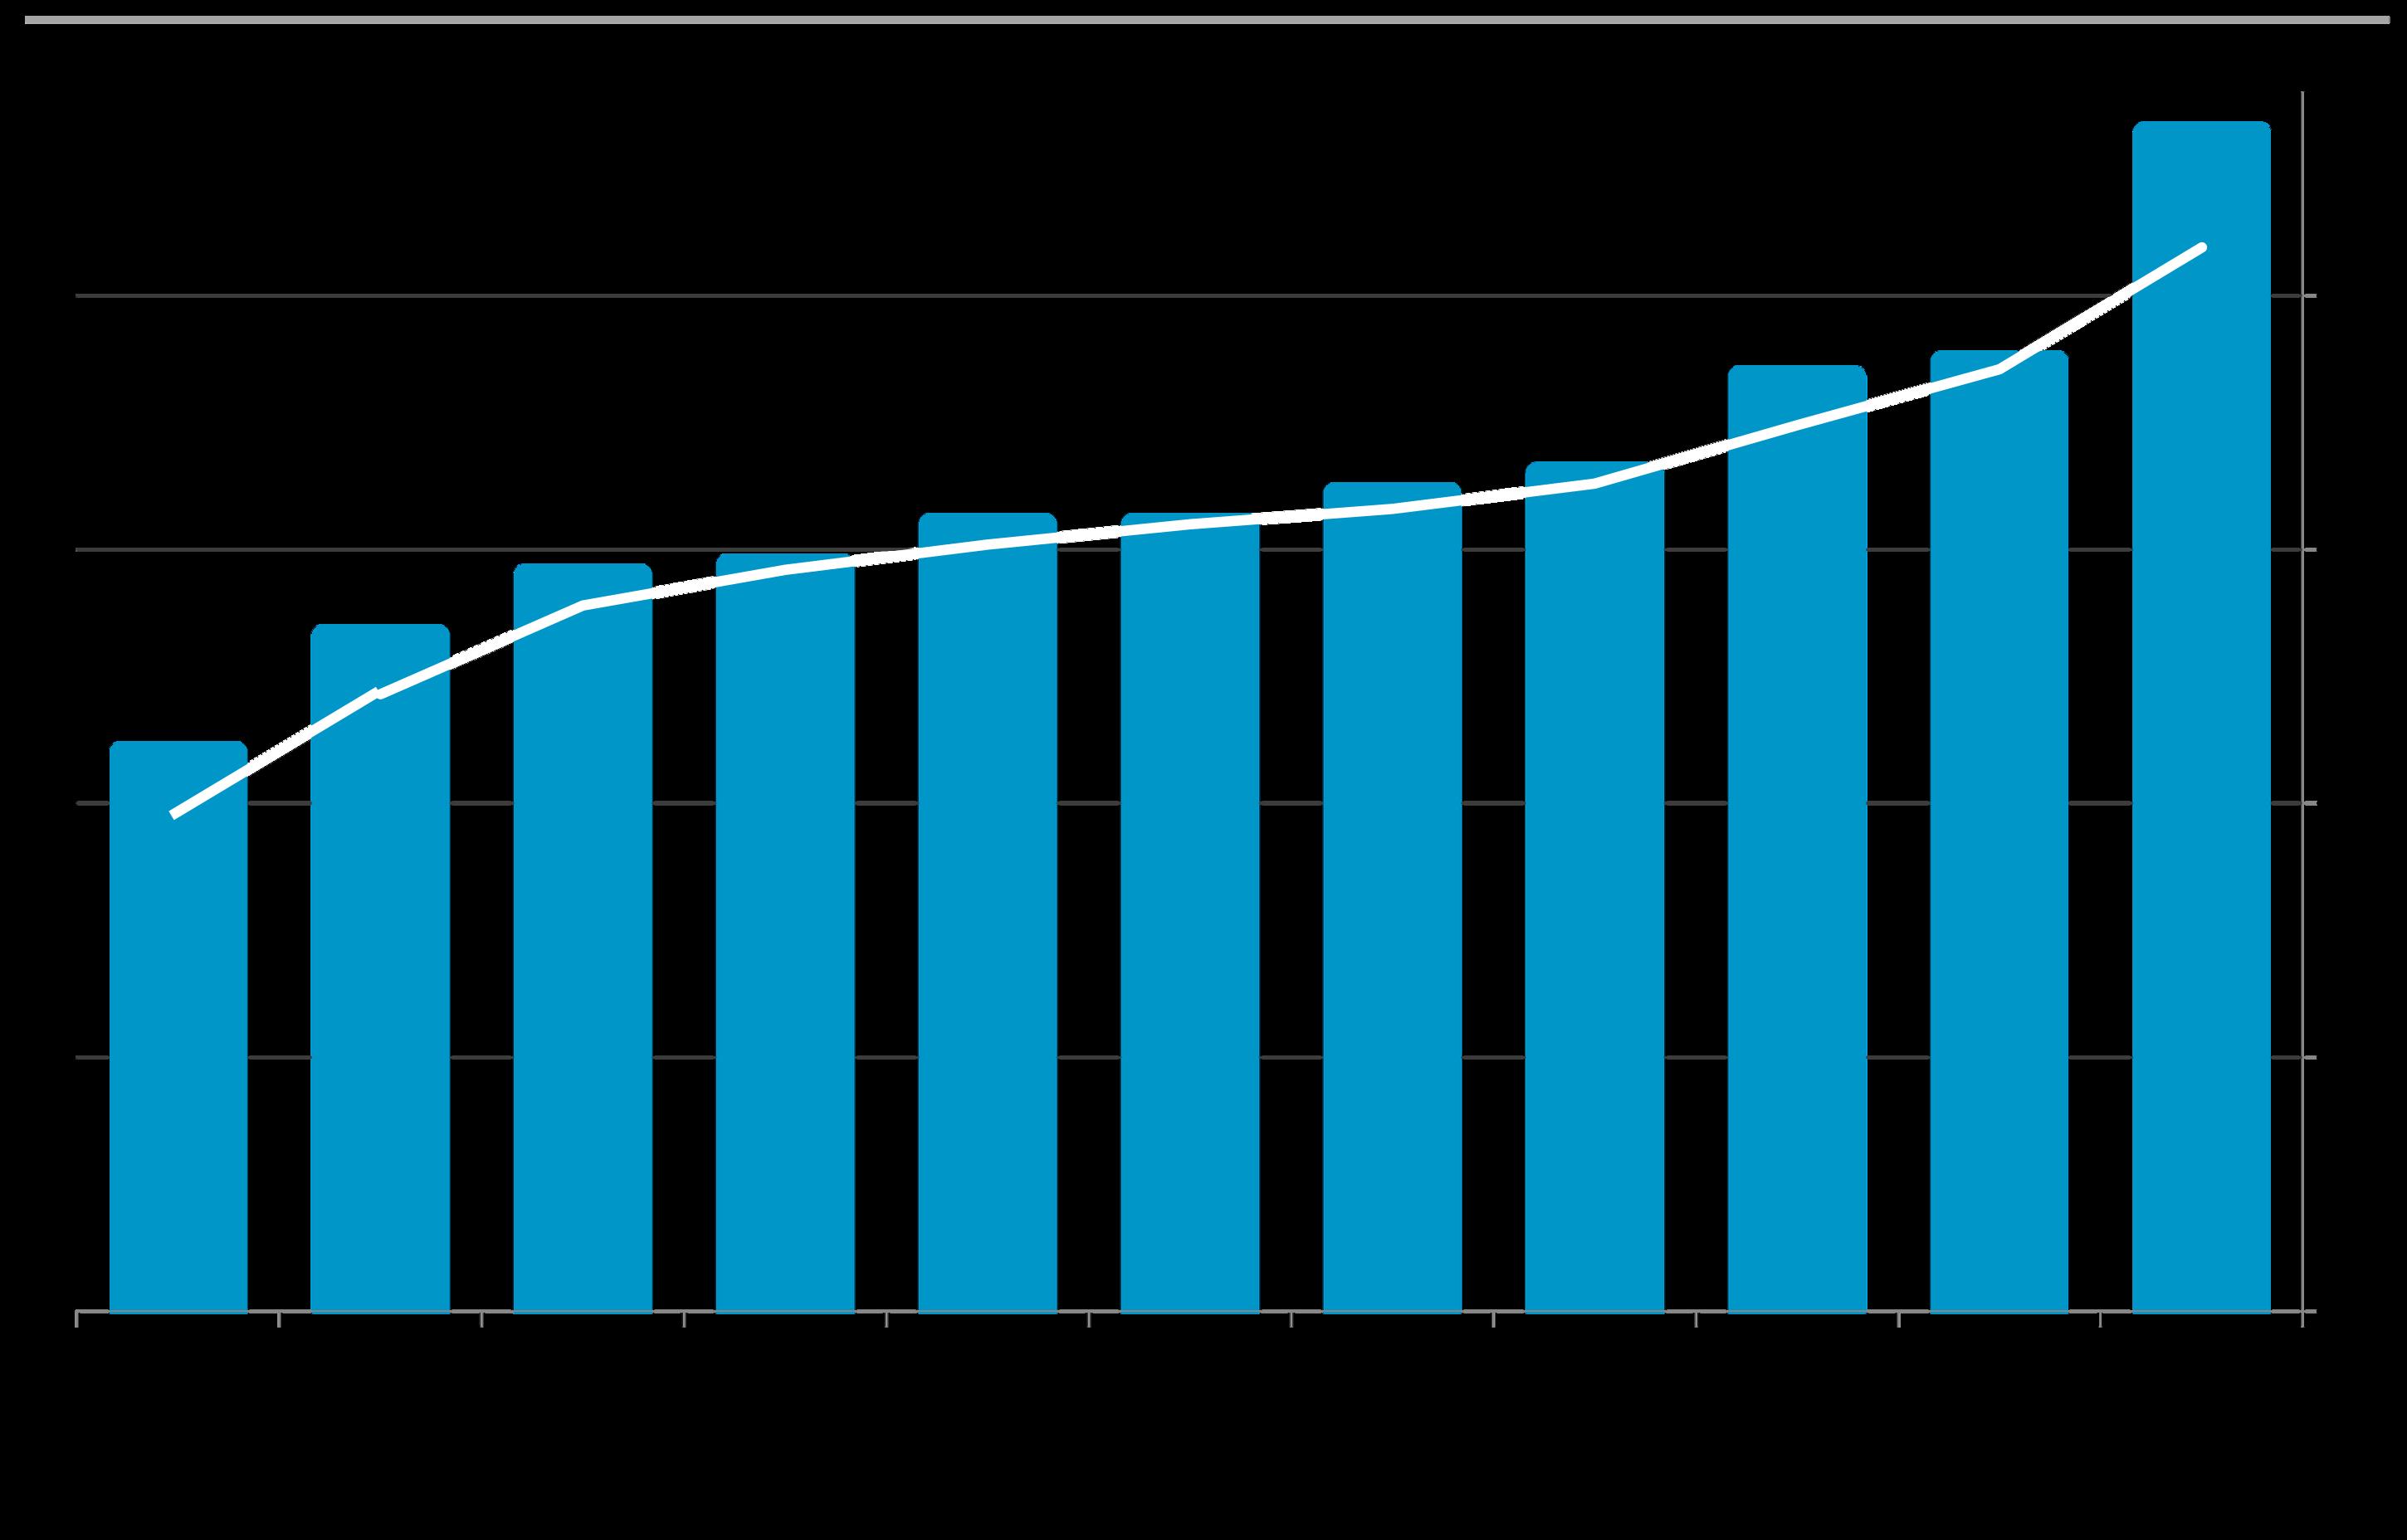
New Listings Coming on Market
San Francisco Market Dynamics & Seasonality*
The number of new listings surged dramatically in September 2025 from August –to its highest count of 2025 YTD – but declined 10% year over year.
*August figure estimated using data available in early September. Per Realtor.com Research: https://www.realtor.com/research/data/, listings posted on site. Data from sources deemed reliable, but may contain errors and subject to revision. May not include “coming-soon” listings. All numbers approximate.
The number of listings for sale on 10/1/25 rebounded modestly from the previous month, but plunged 28% year over year. 29% of listings were houses, 59% condos, 8% TICs, and 4% co-ops.*
The # of active listings on a given day is affected by 1) the # of new listings coming on market, 2) how quickly buyers put them into contract, 3) the sustained heat of the market over time, and 4) sellers pulling their homes off the market without selling.
* Houses, condos, co-ops, TICs, townhouses: Active/Coming-Soon listings posted to NorCal MLS Alliance. Doesnotinclude new-projectcondos notlisted onMLS.Data from sources deemedreliable,butmay contain errors and subject to revision. All numbers approximate. The # of active listings changes constantly.
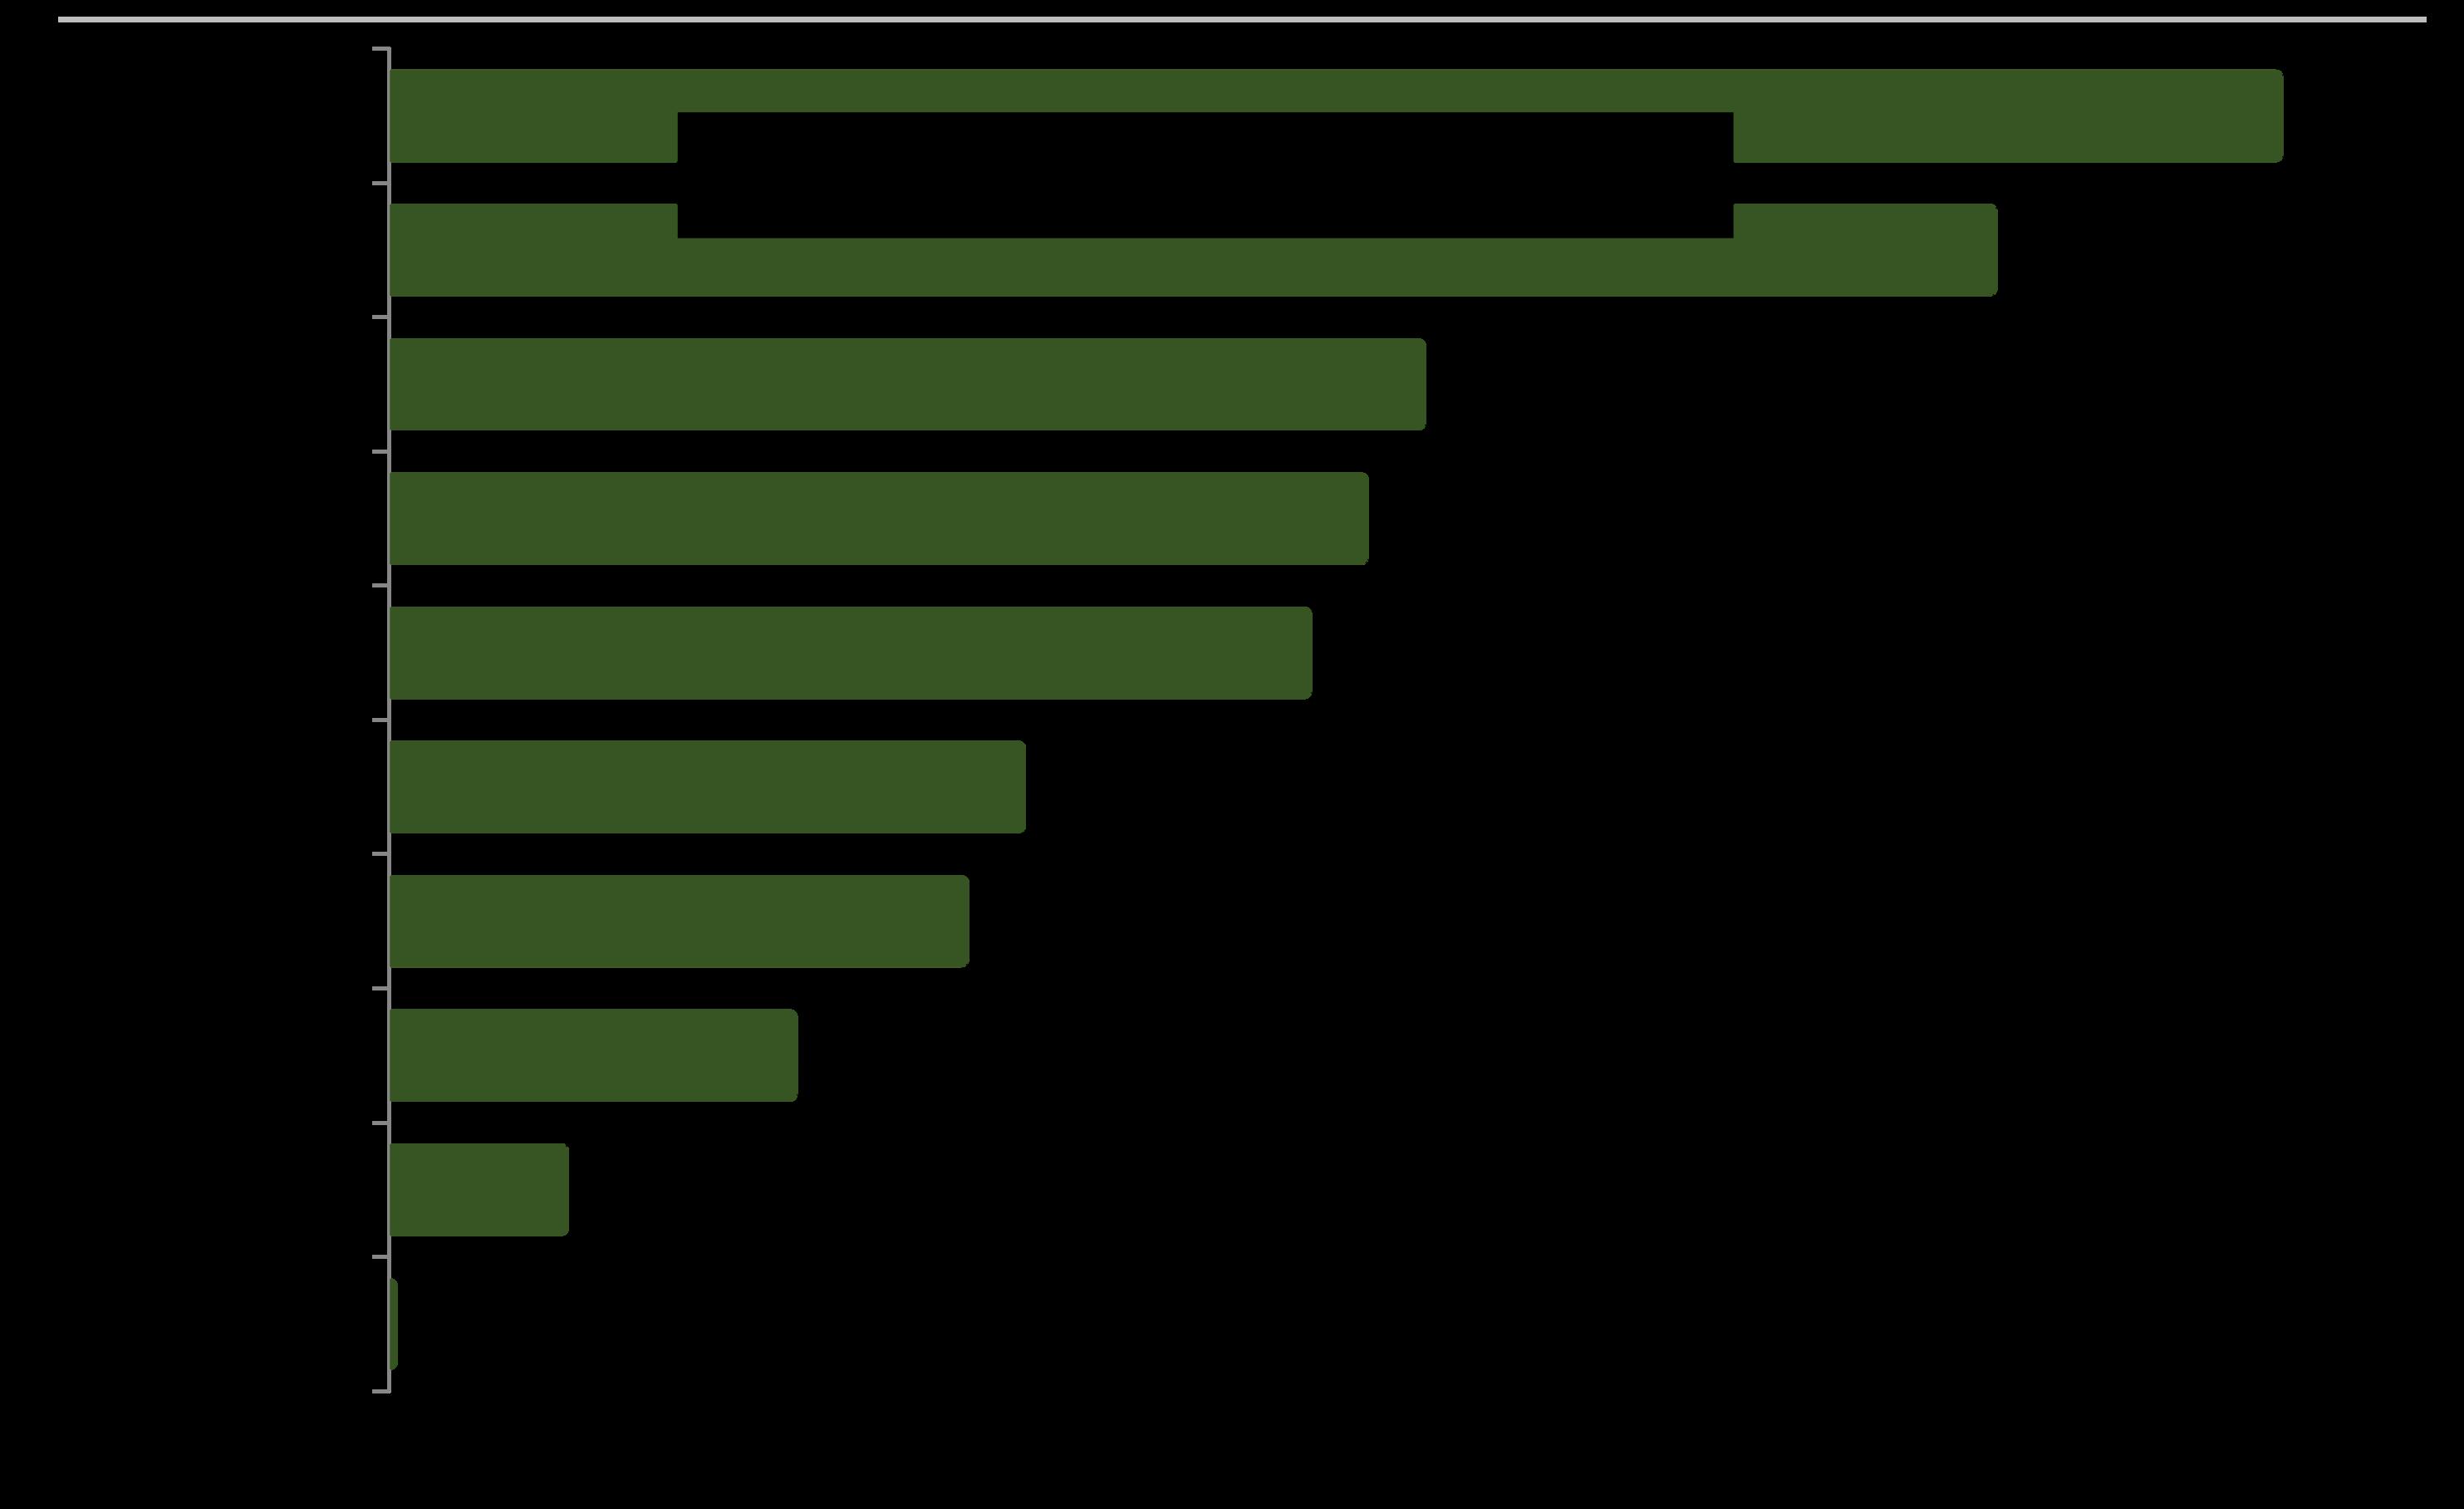
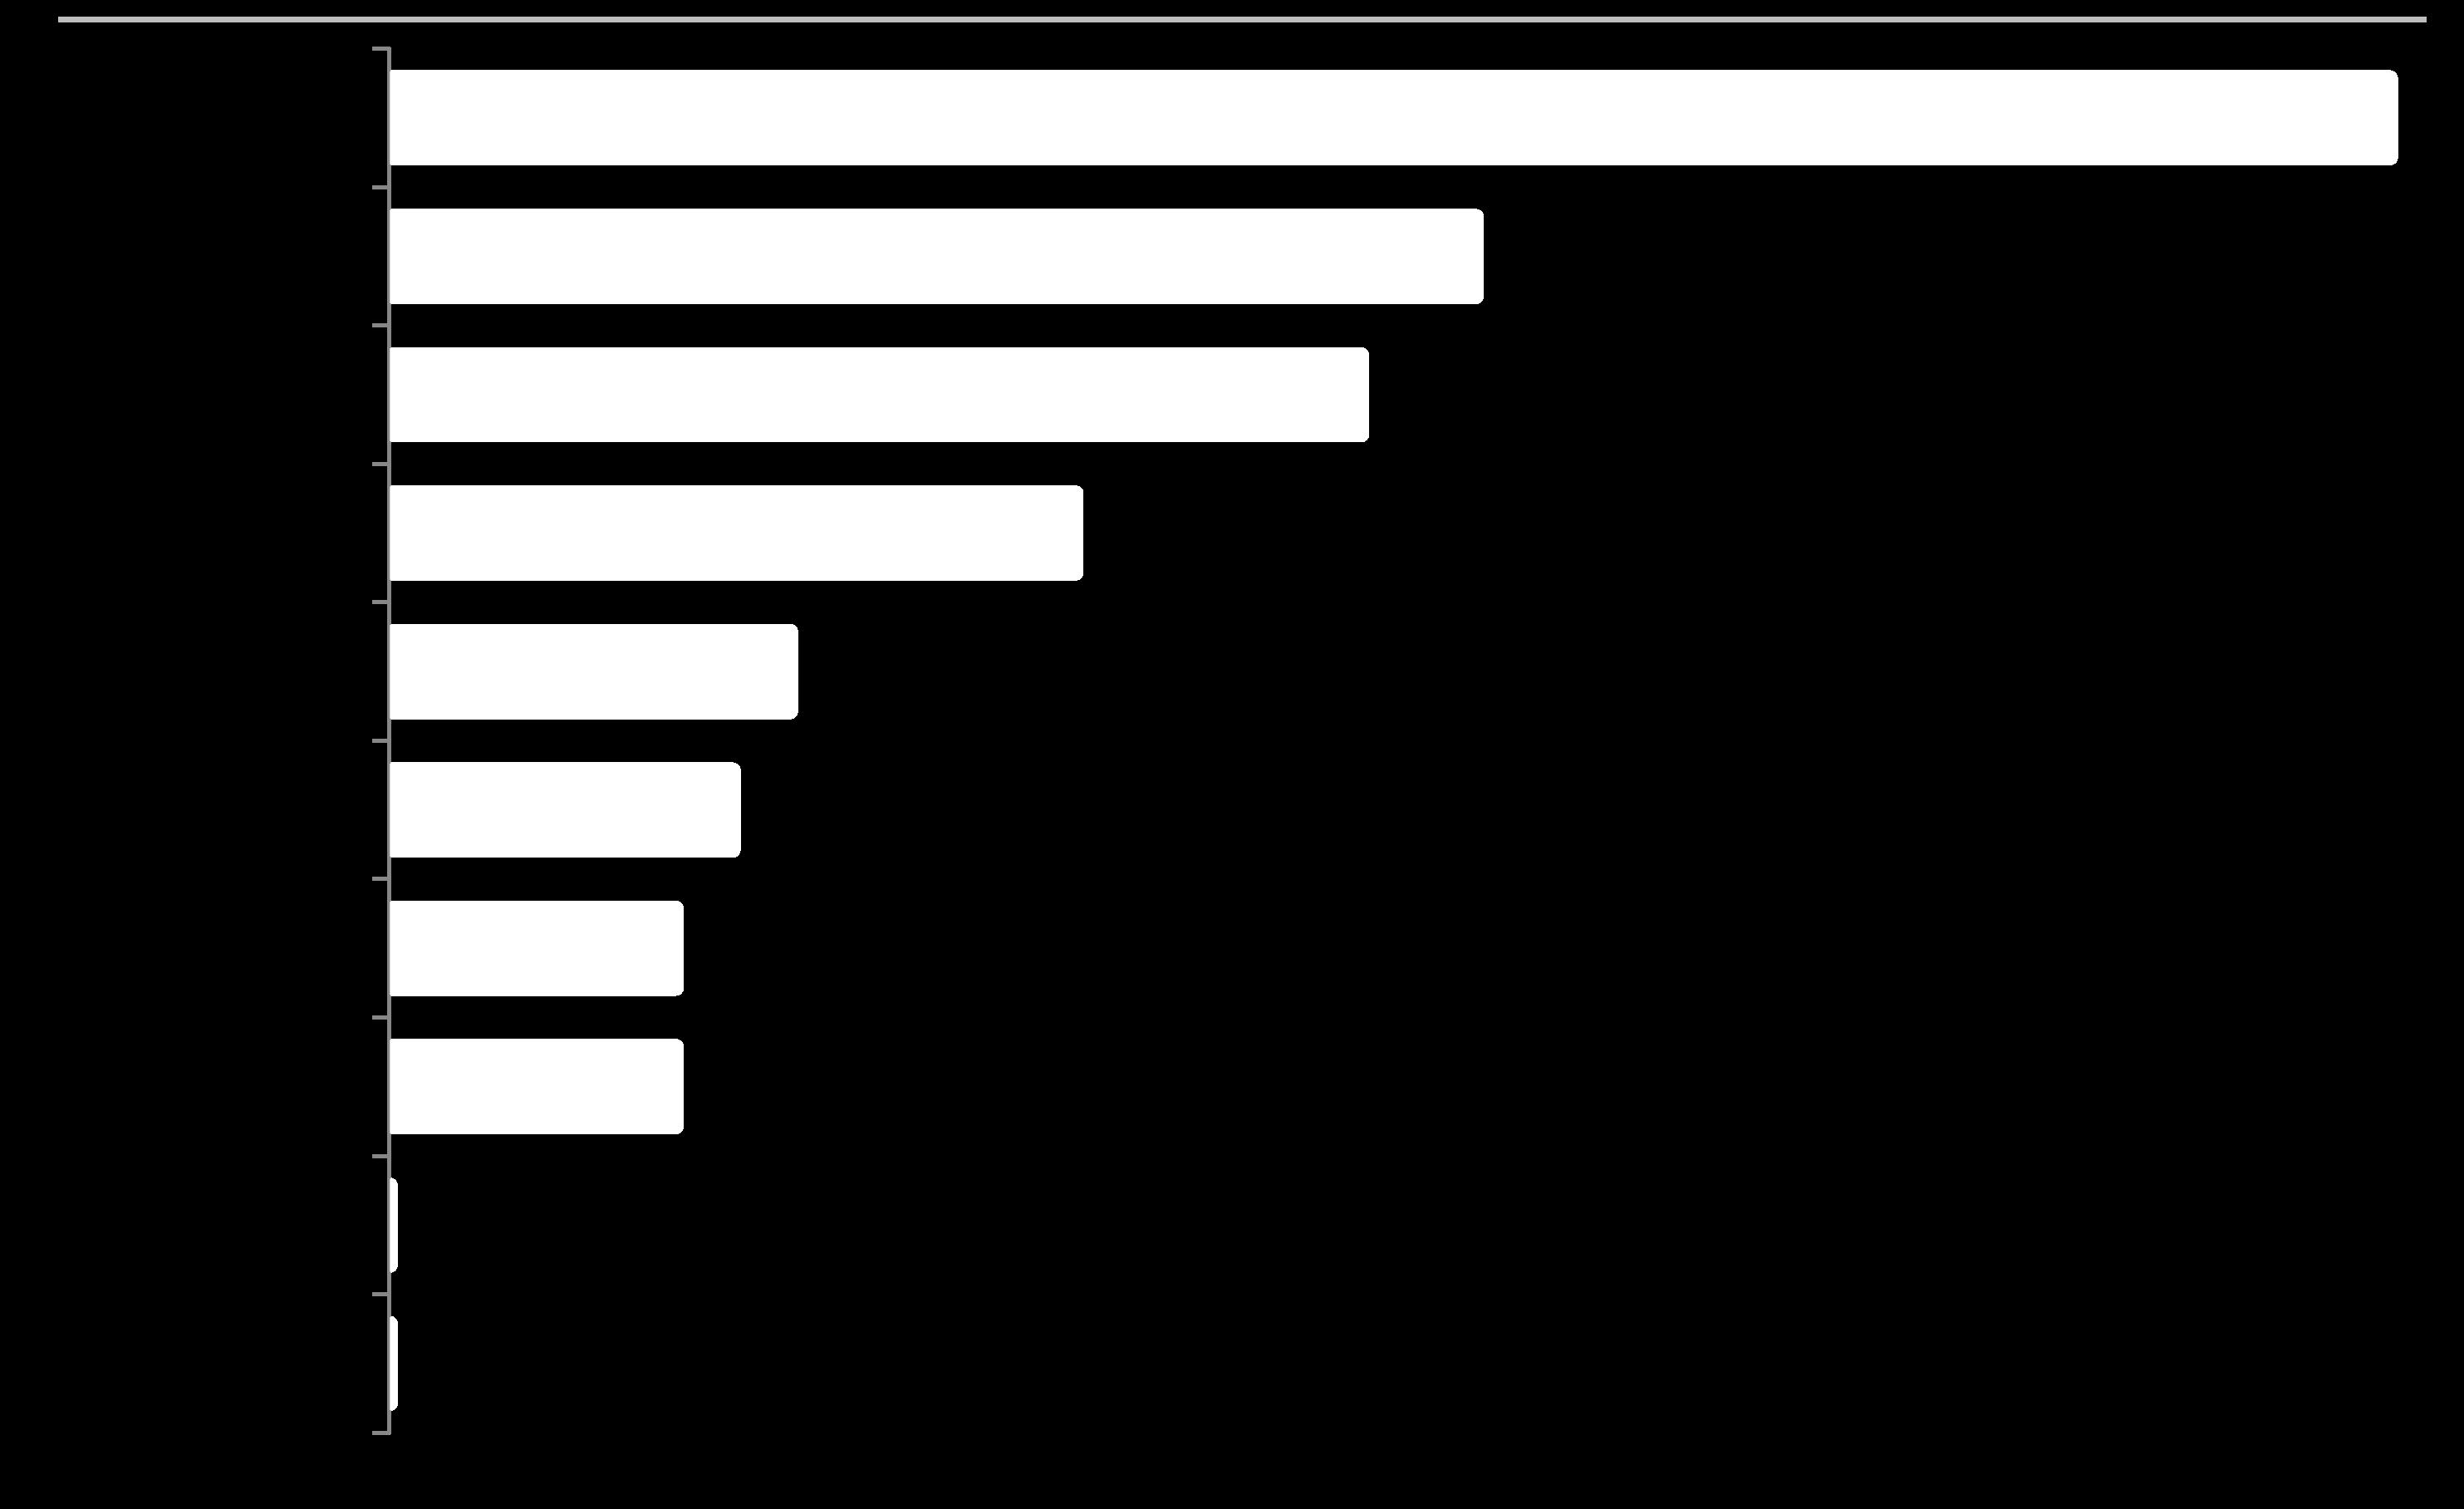
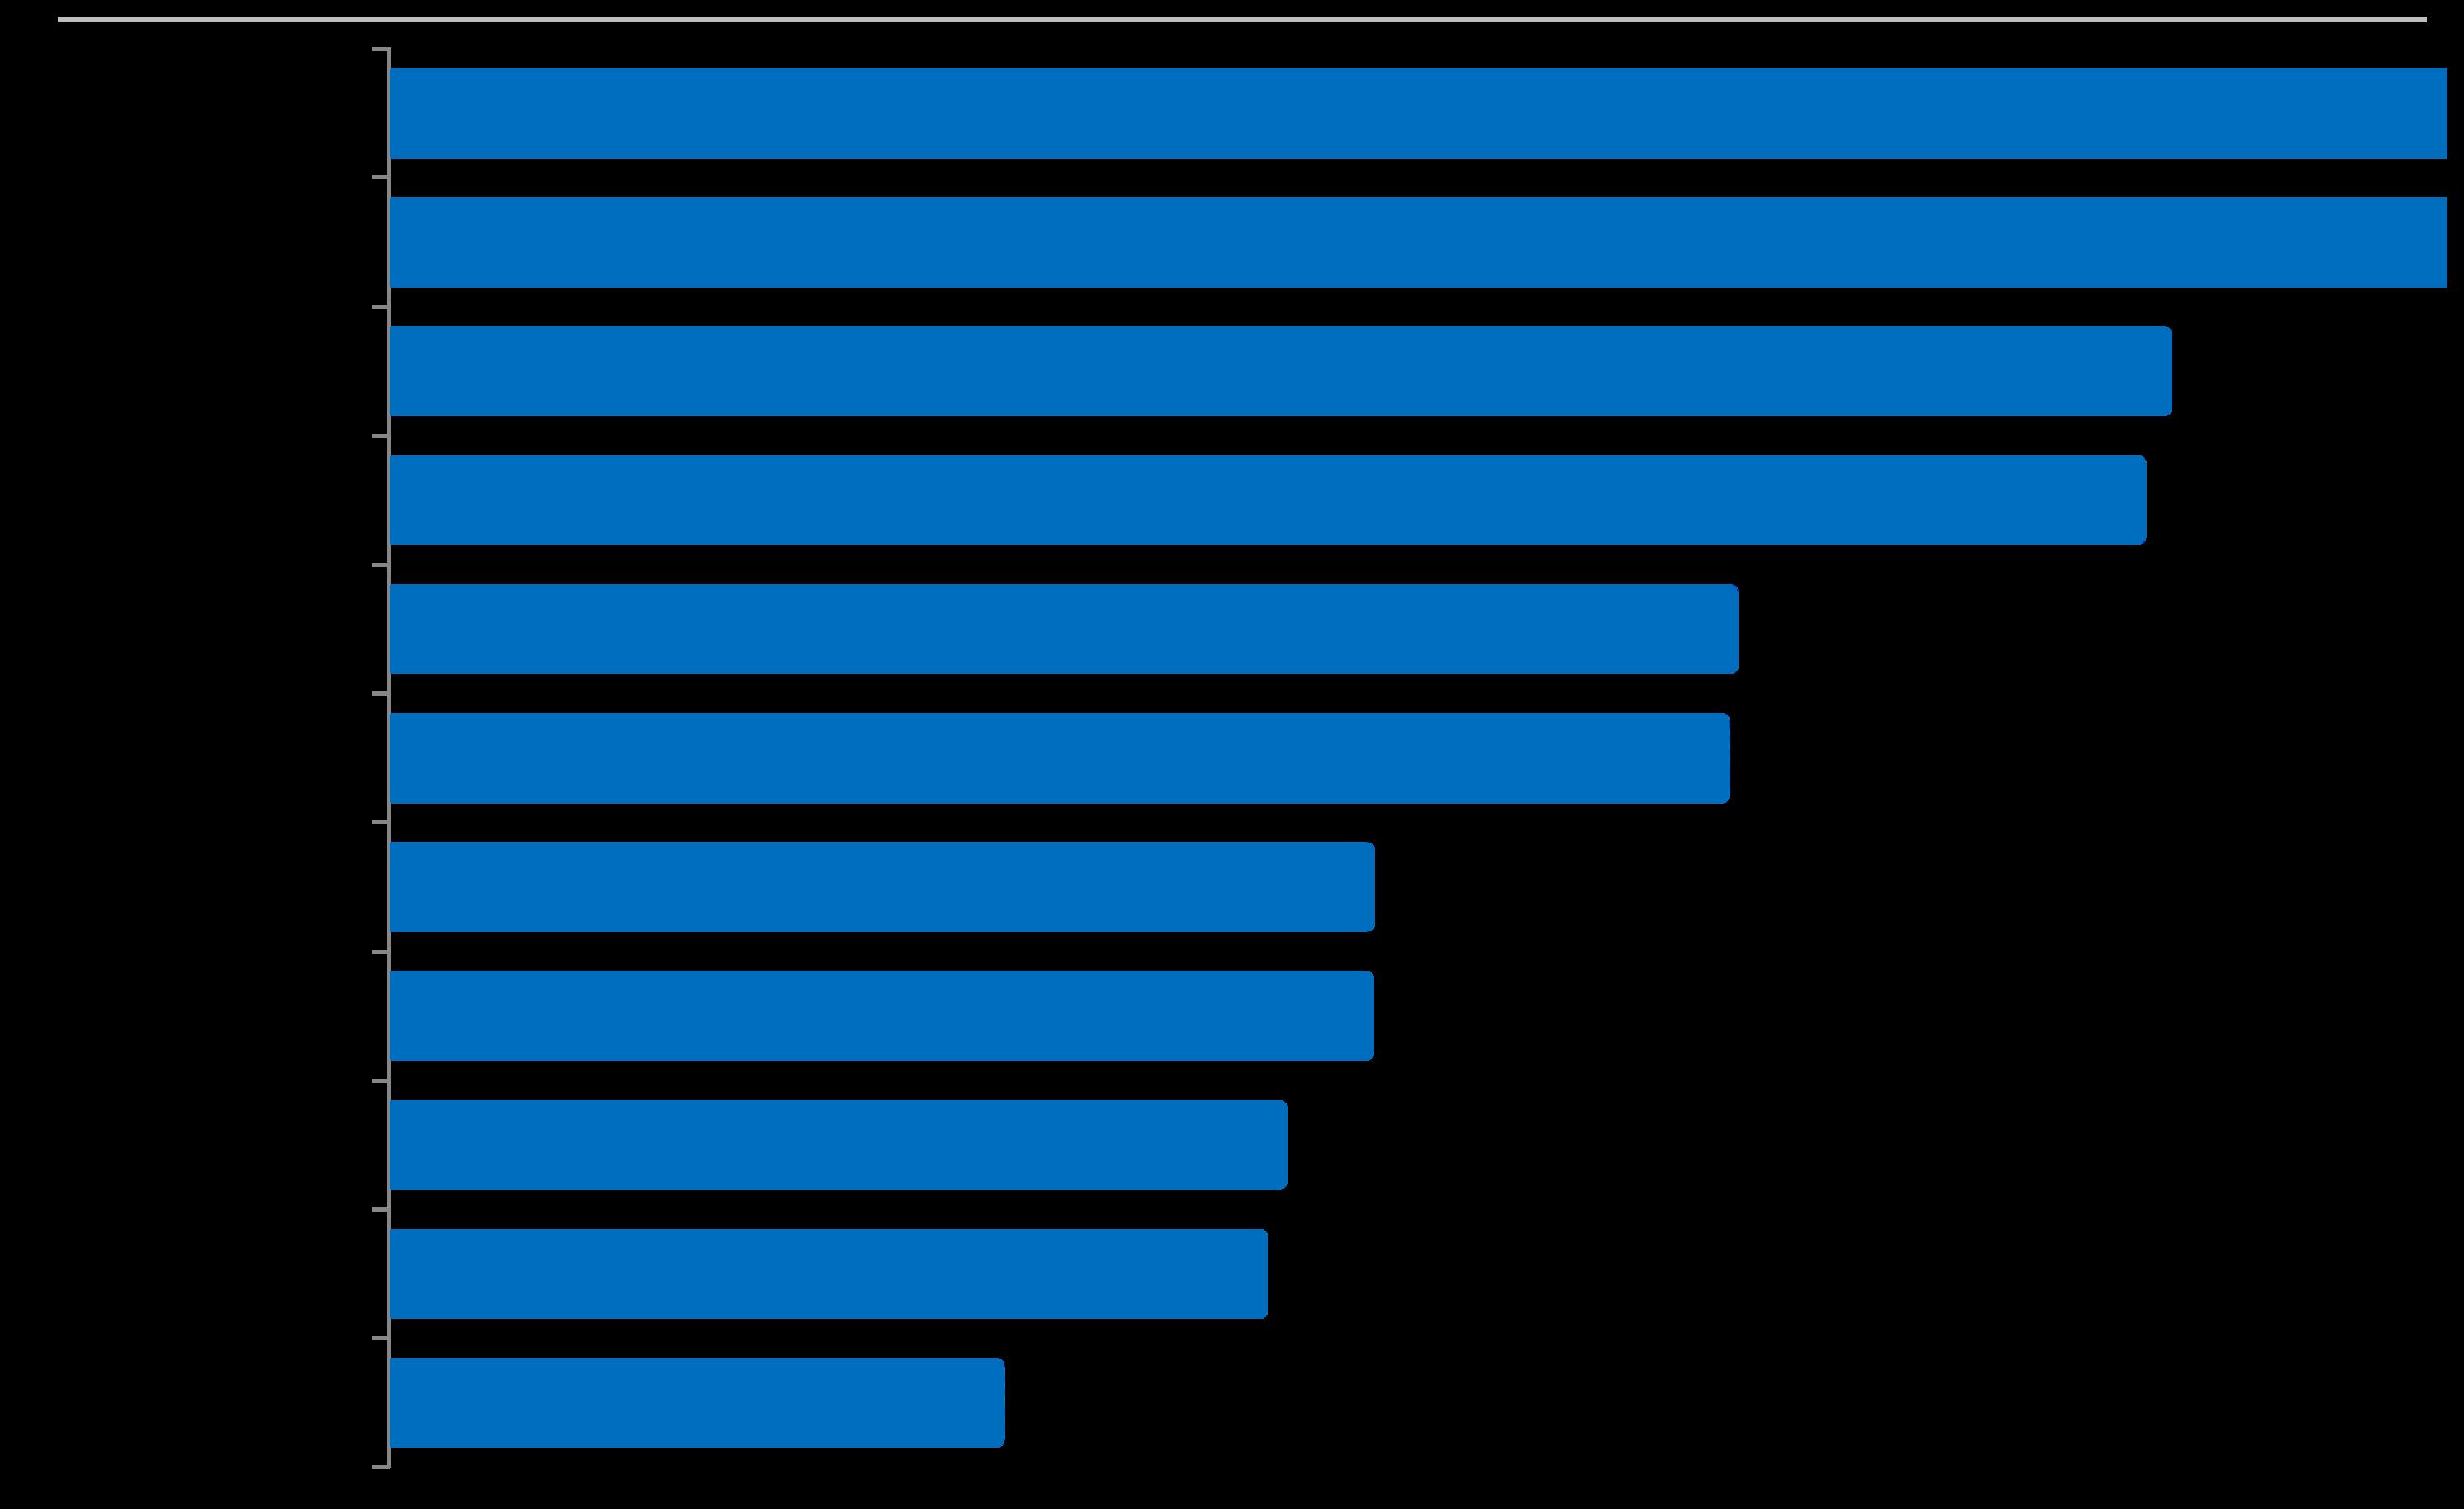
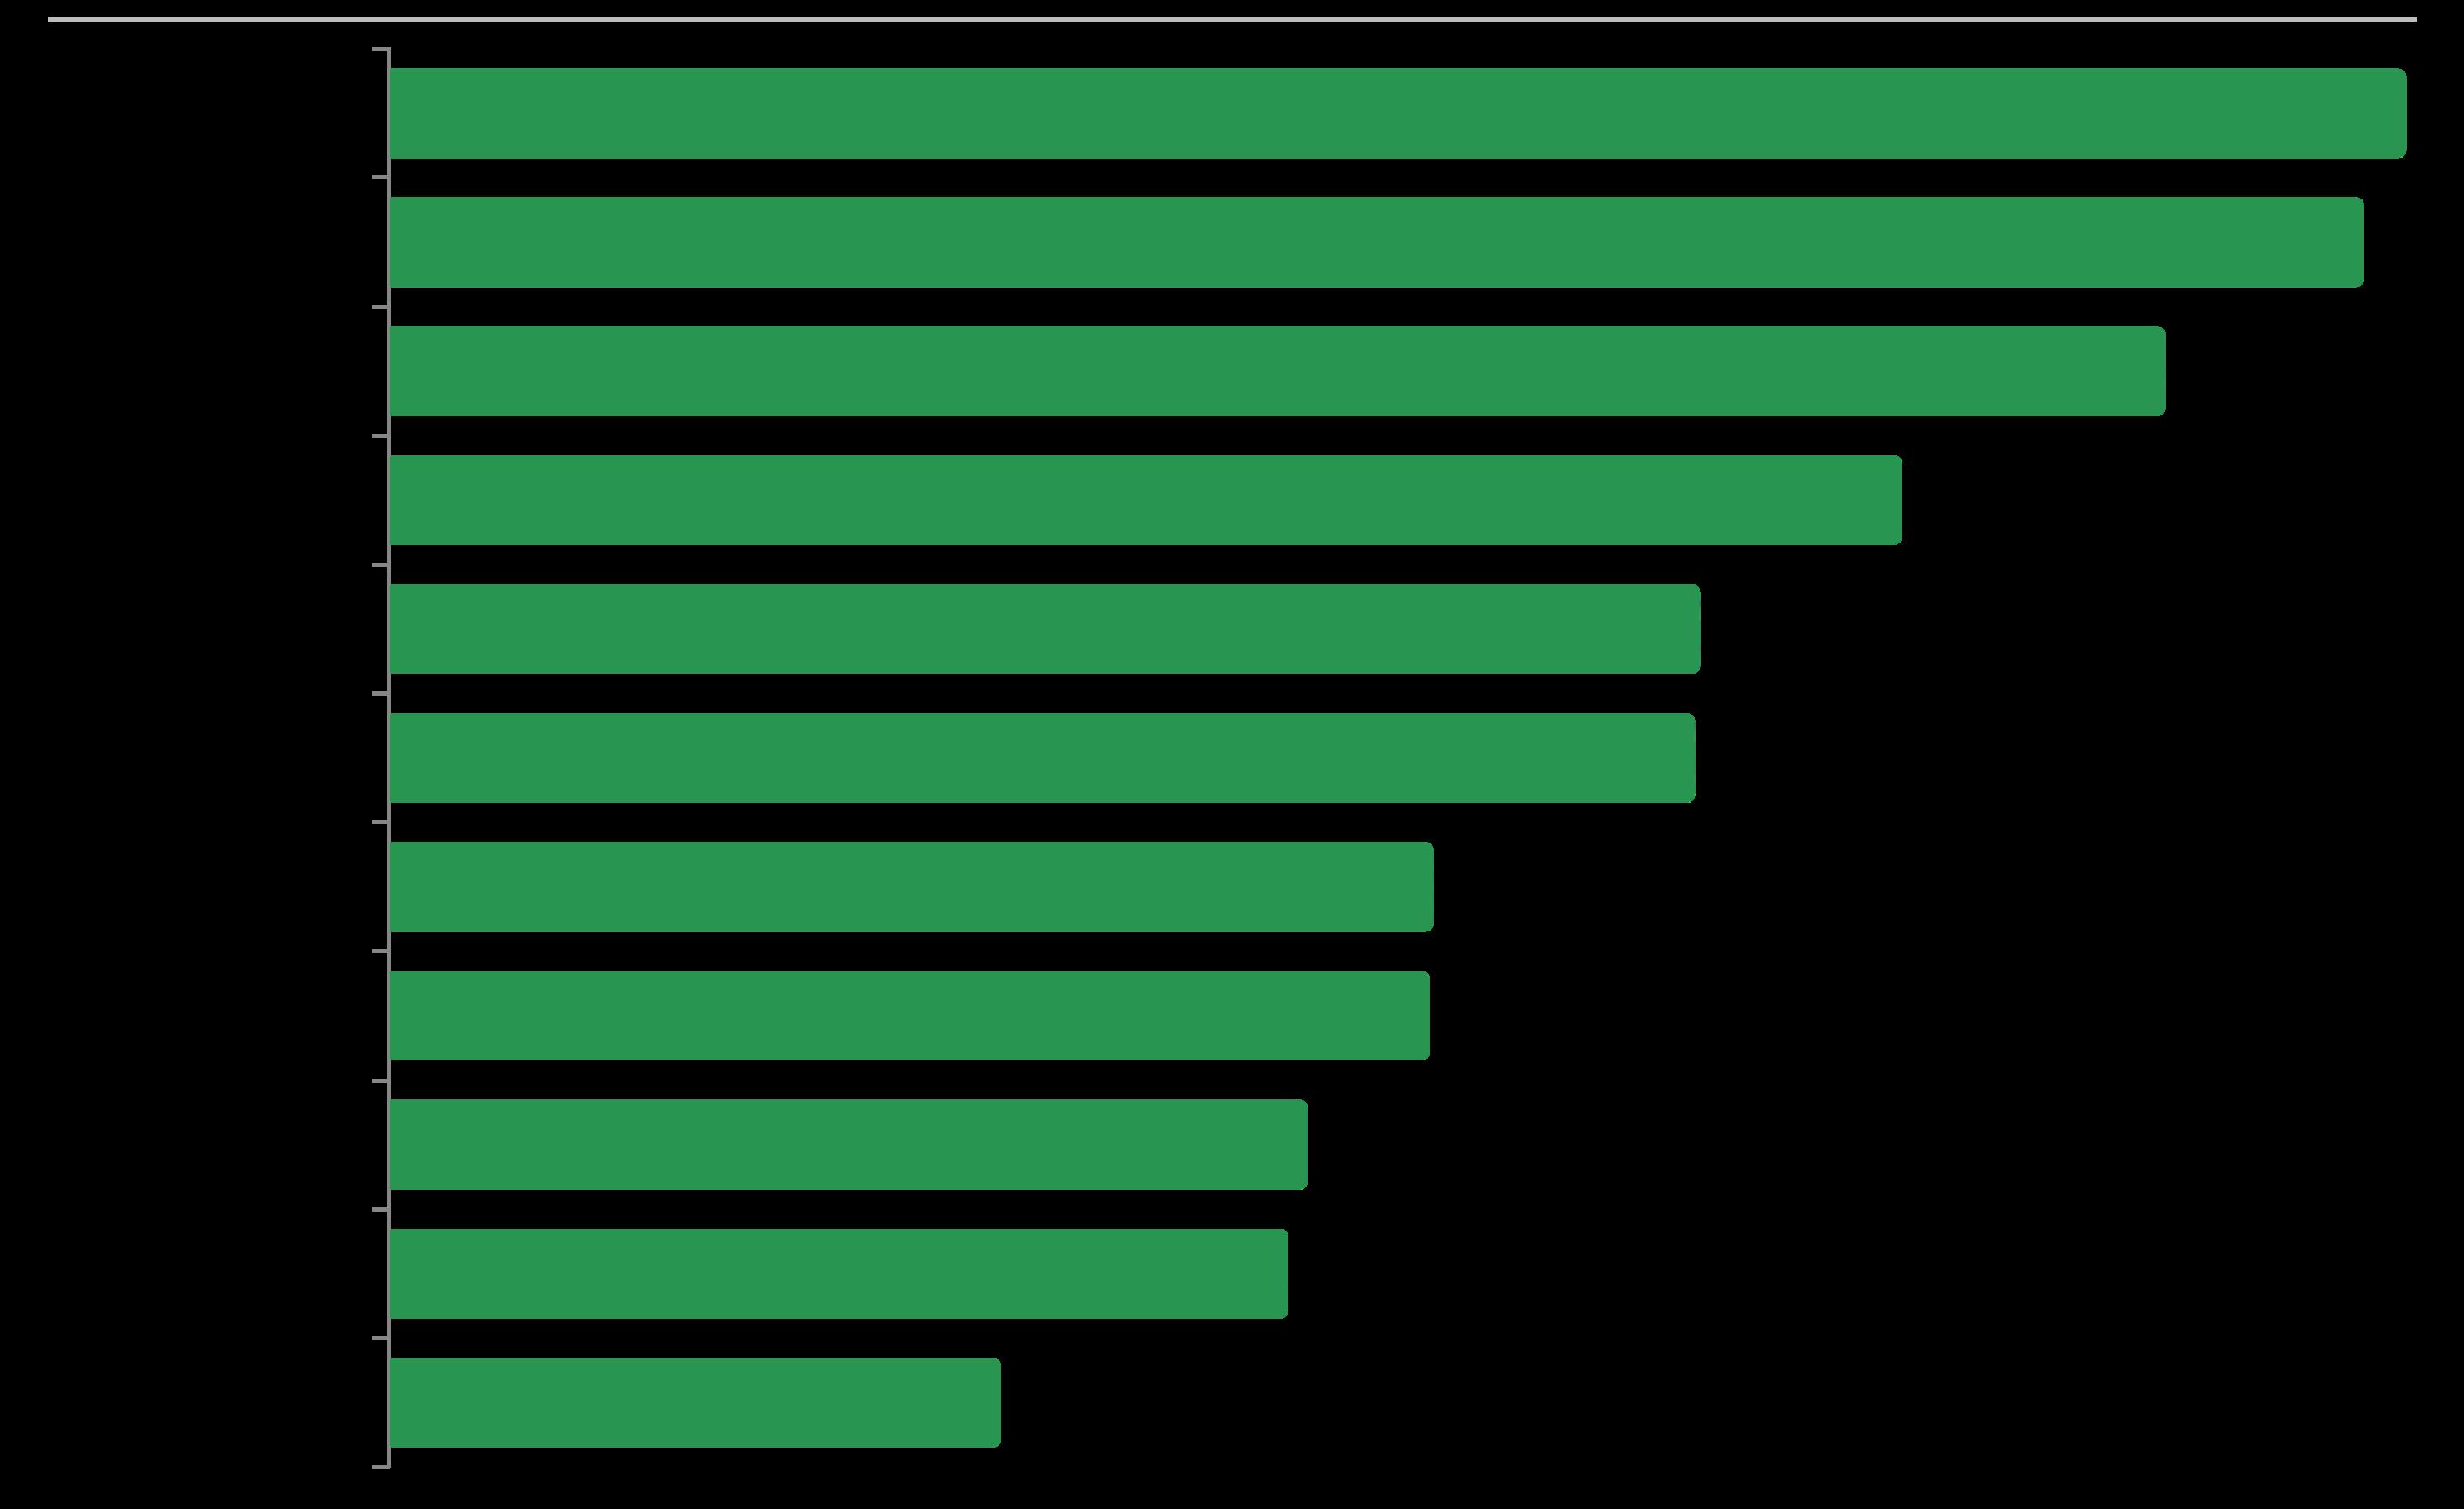
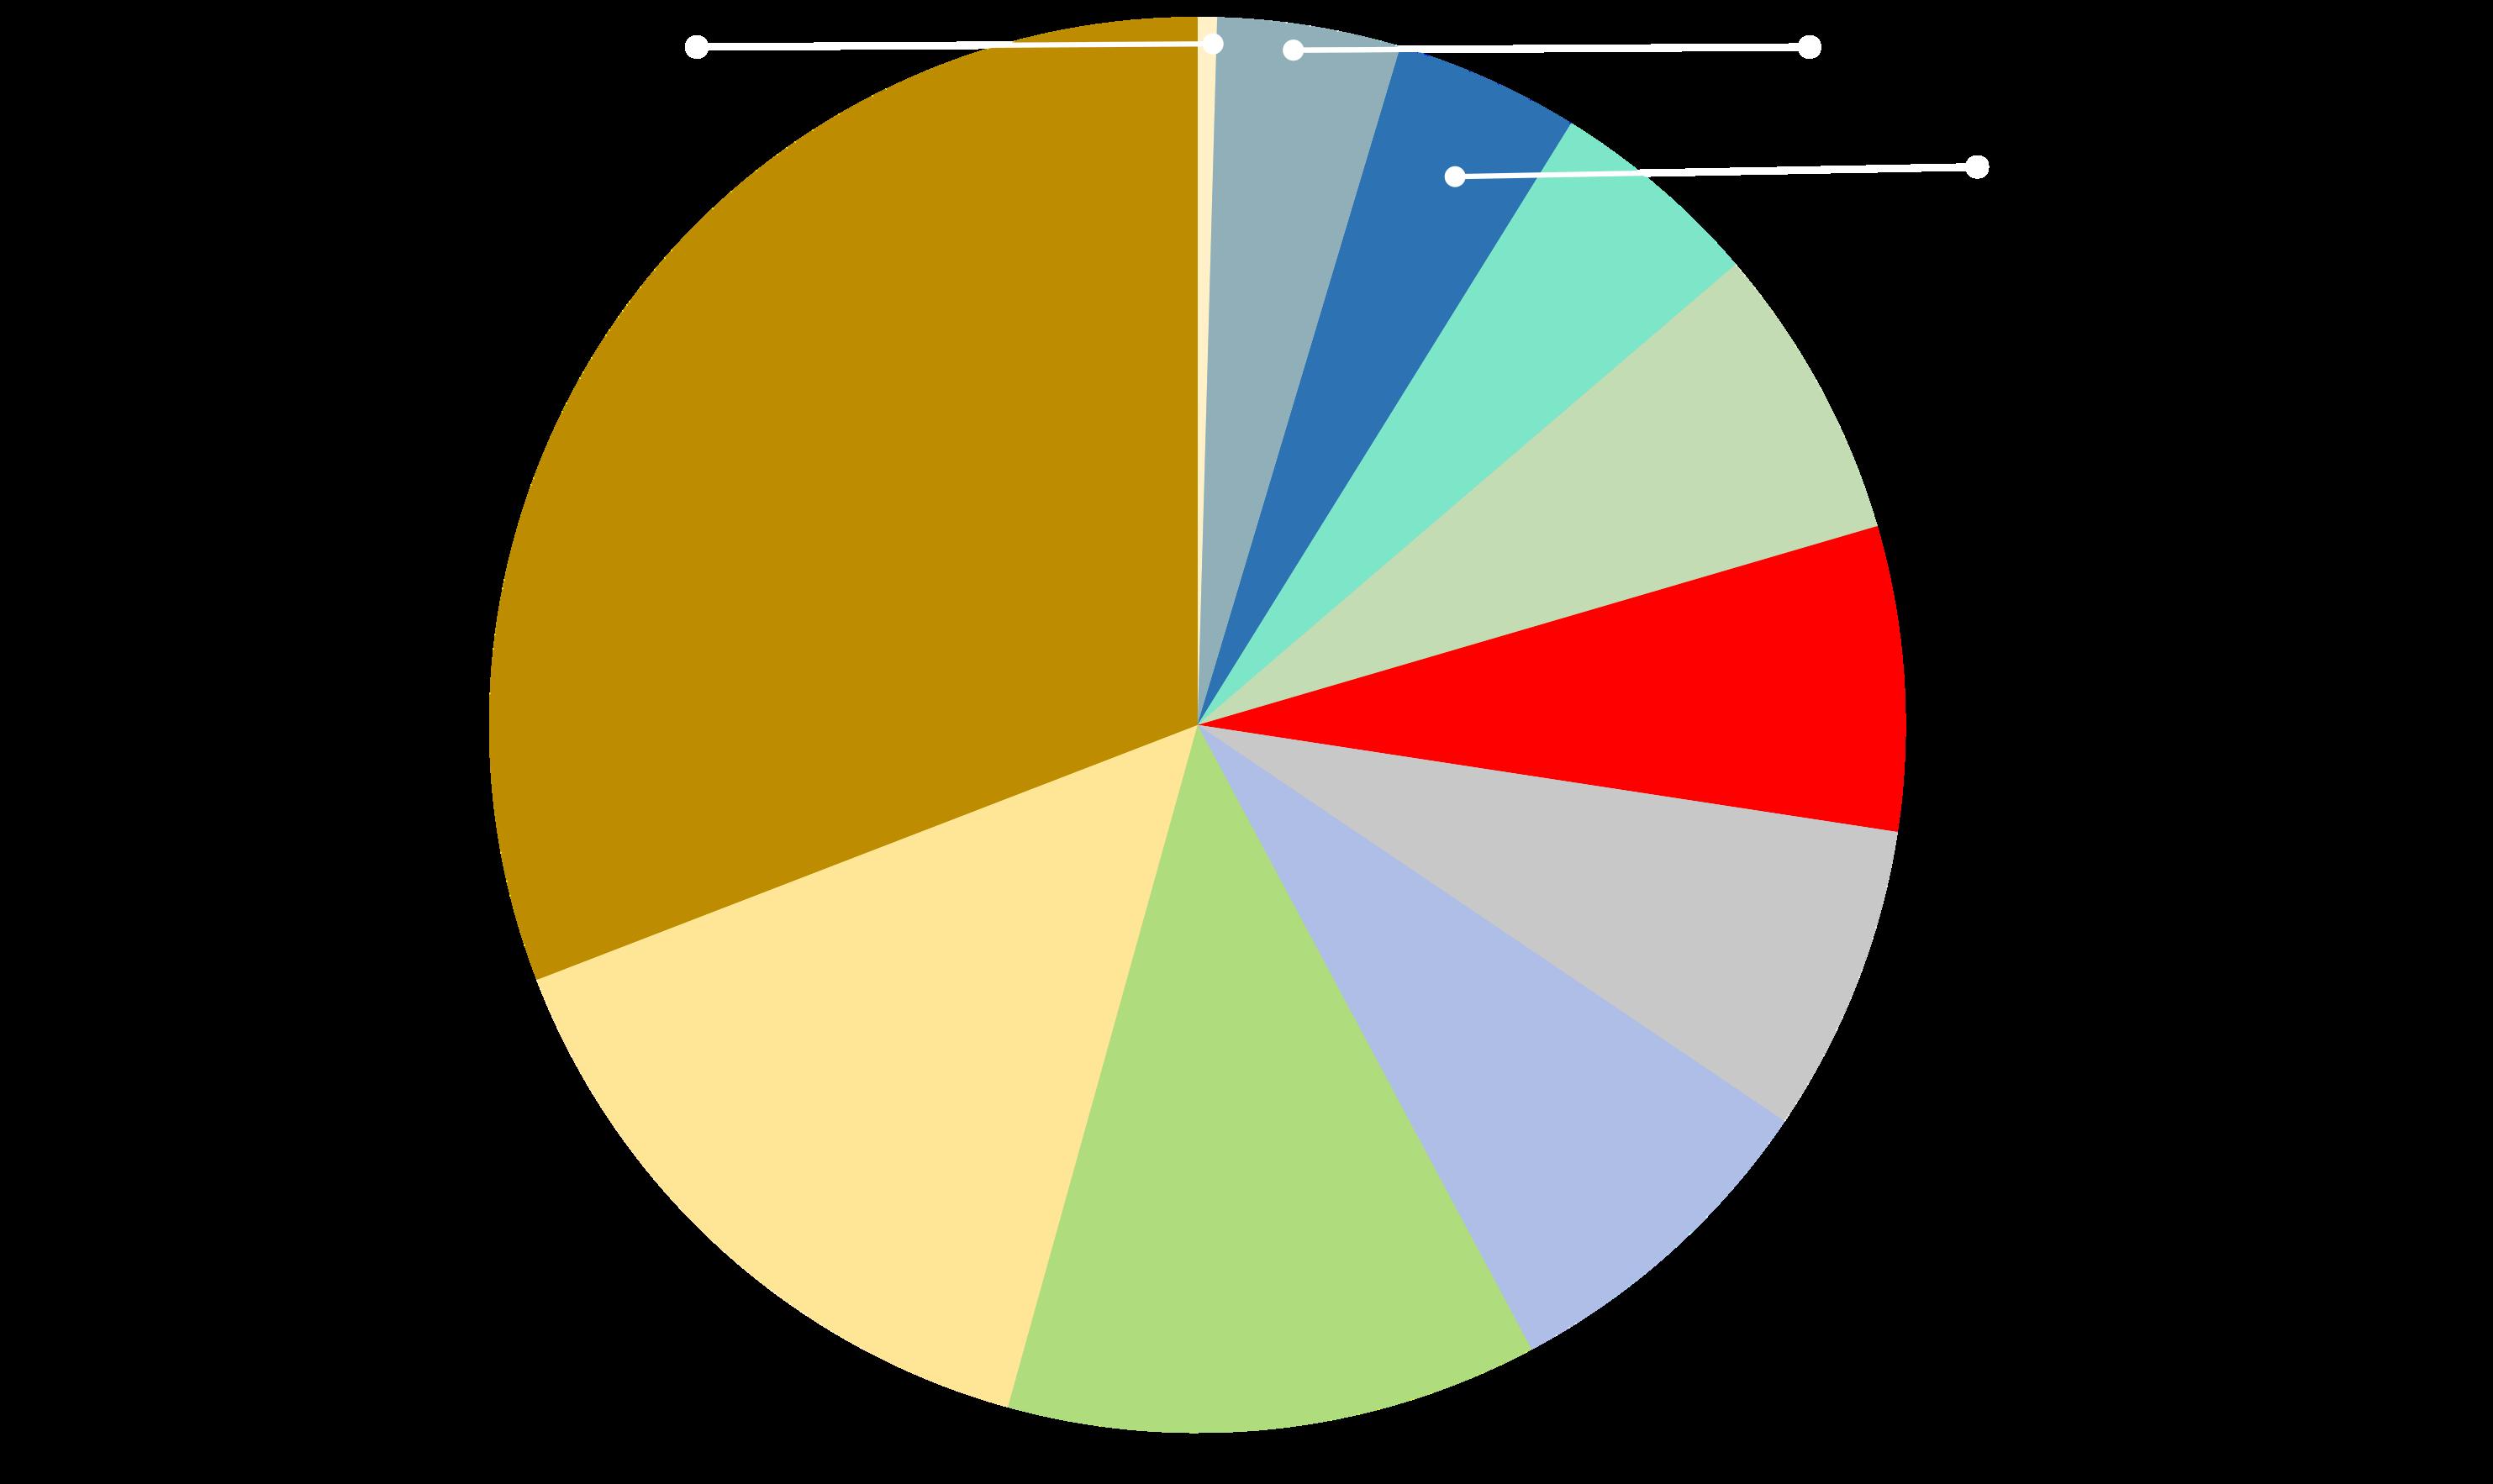
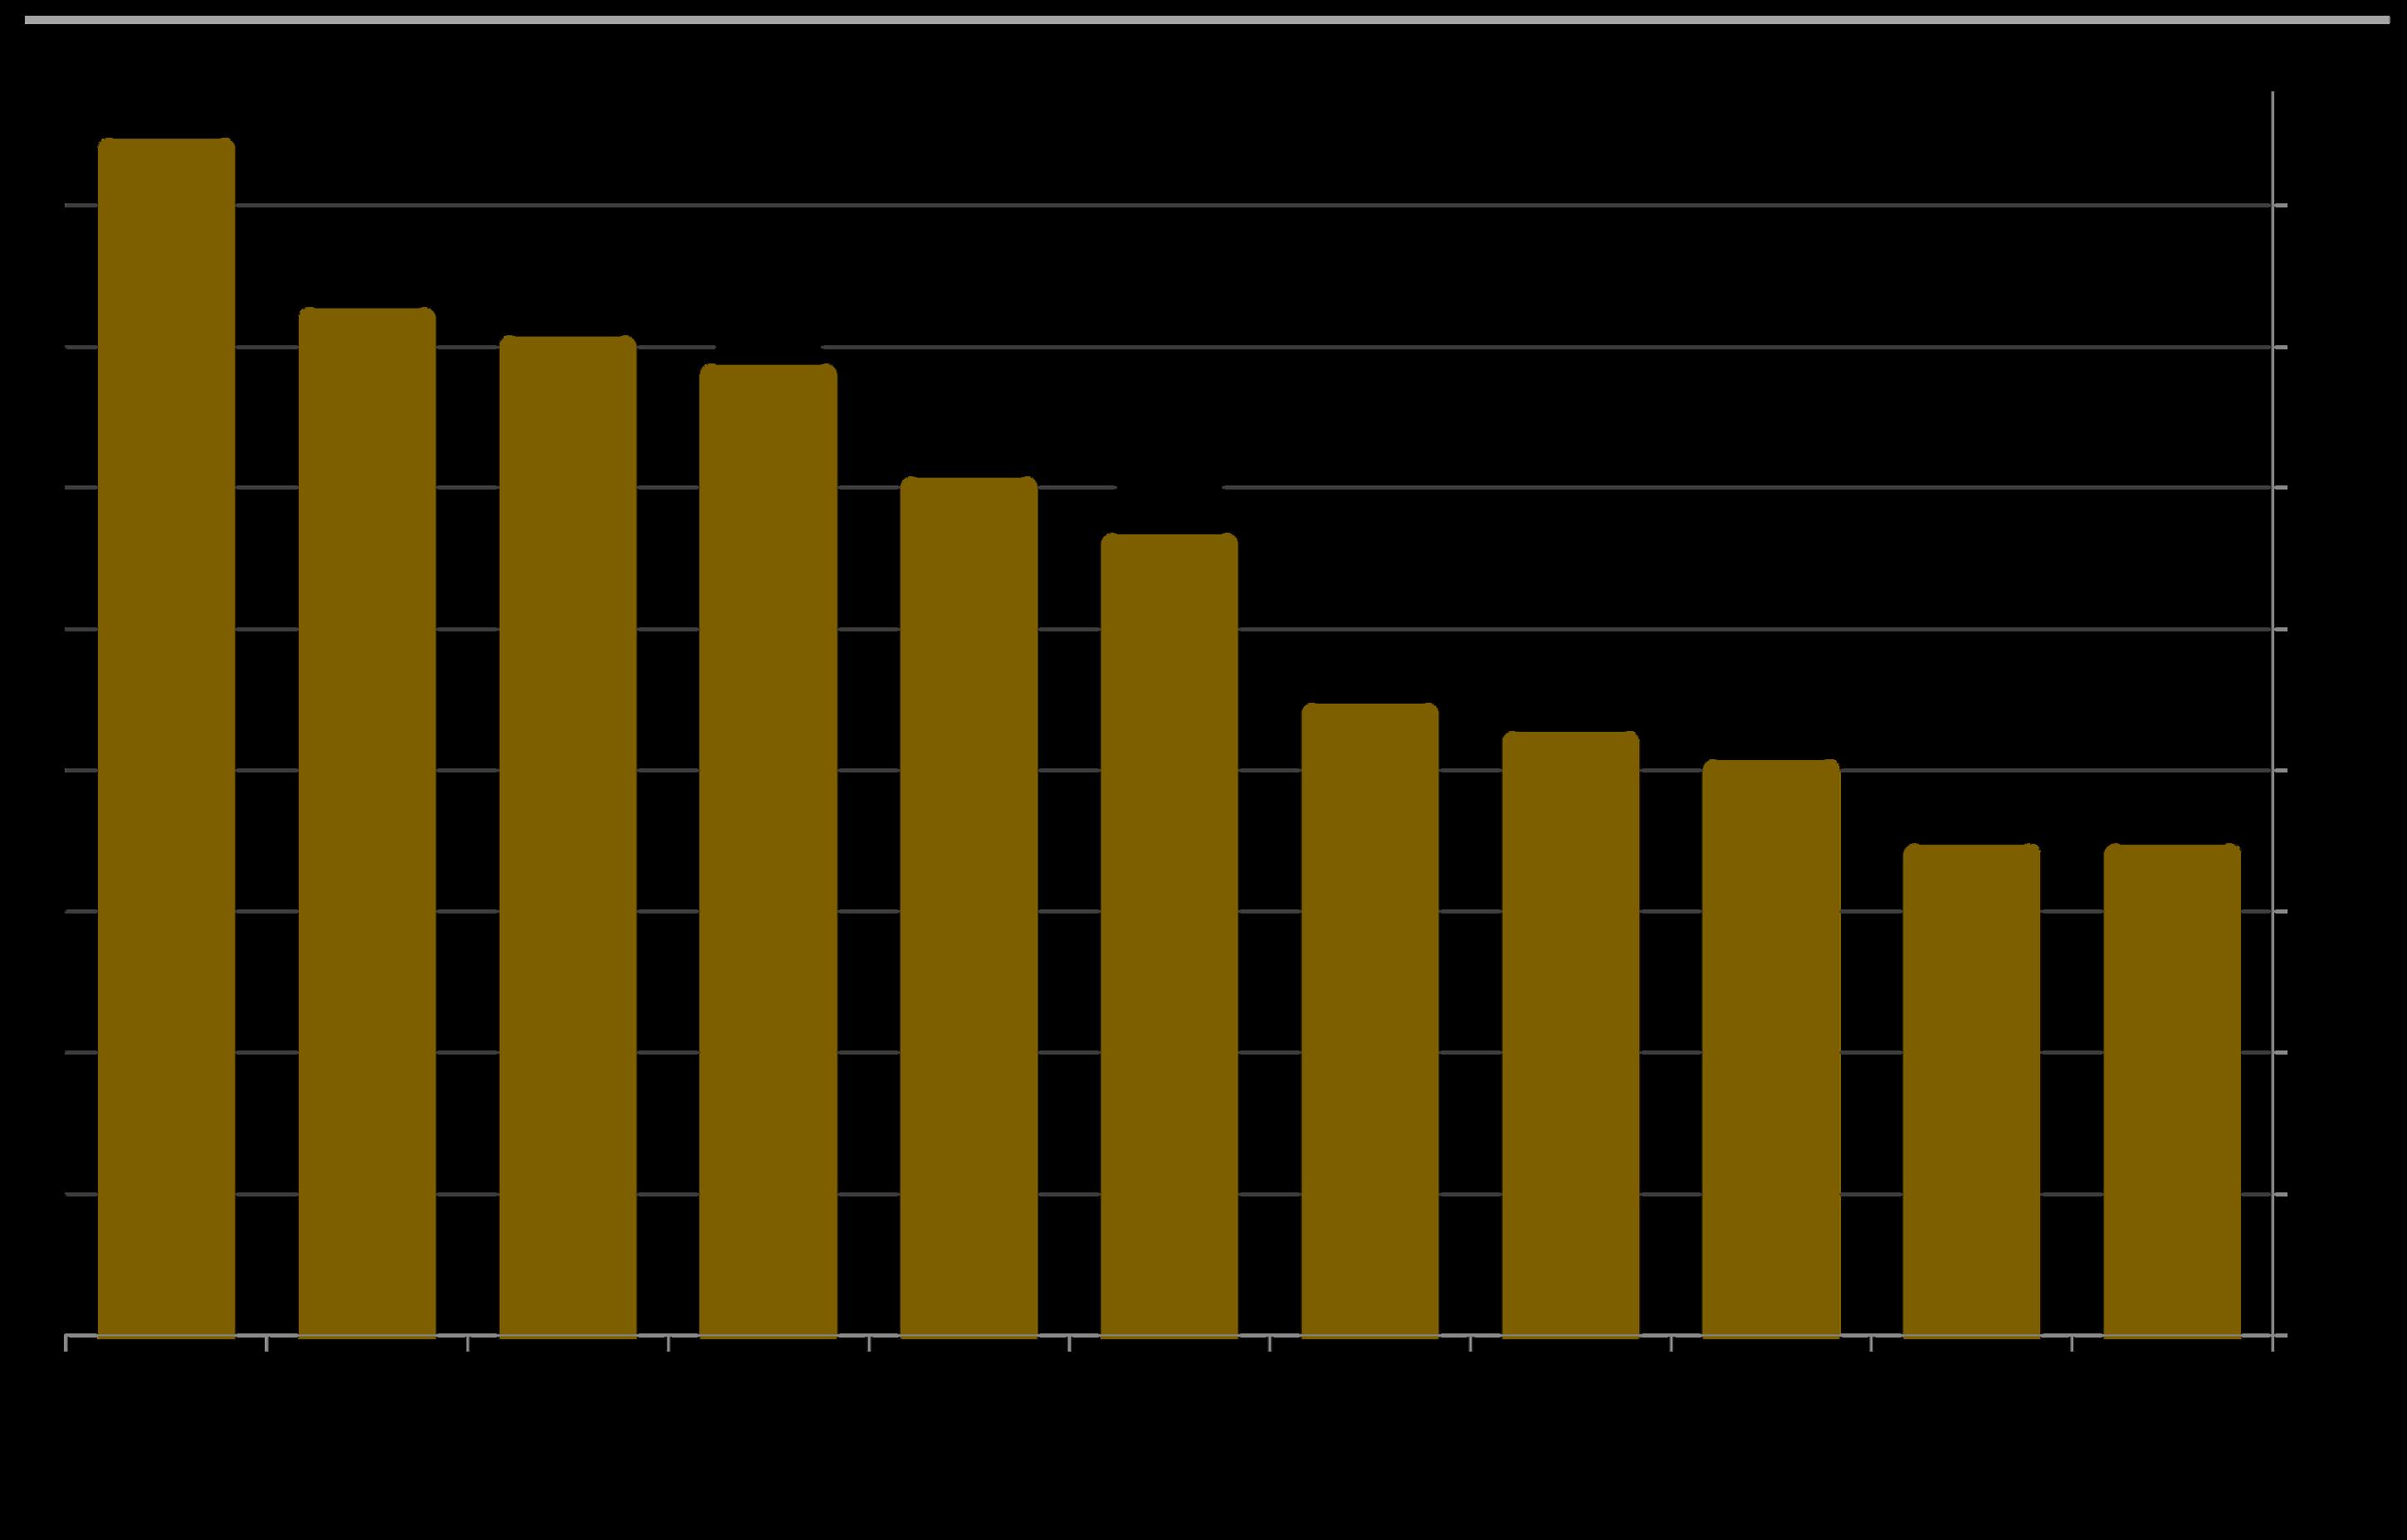
Year-over-Year % Change in Number of Active Listings on Market
by Bay Area County, as of October 1, 2025*
Comparing the number of active listings on 10/1/25 to the number on 10/1/24
Marin Napa
Napa & Sonoma Counties have seen the largest year-overyear % increases in their number of listings on the market.
San Francisco Alameda Santa Clara Monterey Sonoma
Contra Costa Santa Cruz San Mateo
Inventory trends can vary between and submarkets, price segments
San Francisco was the only Bay Area County that saw a year-over-year property types within the same county.
decline in its number of active listings on 10/1/25 – and it was a very substantial decline. This is helping to pressurize its real estate market.
*Active/coming-soon listings posted to NorCal MLS Alliance on October 1st 2025 and 2024. Percentages rounded. Data fromsources deemed reliable,but maycontain errorsandsubjectto revision. Not all homes for sale are posted to MLS. All numbers approximate.
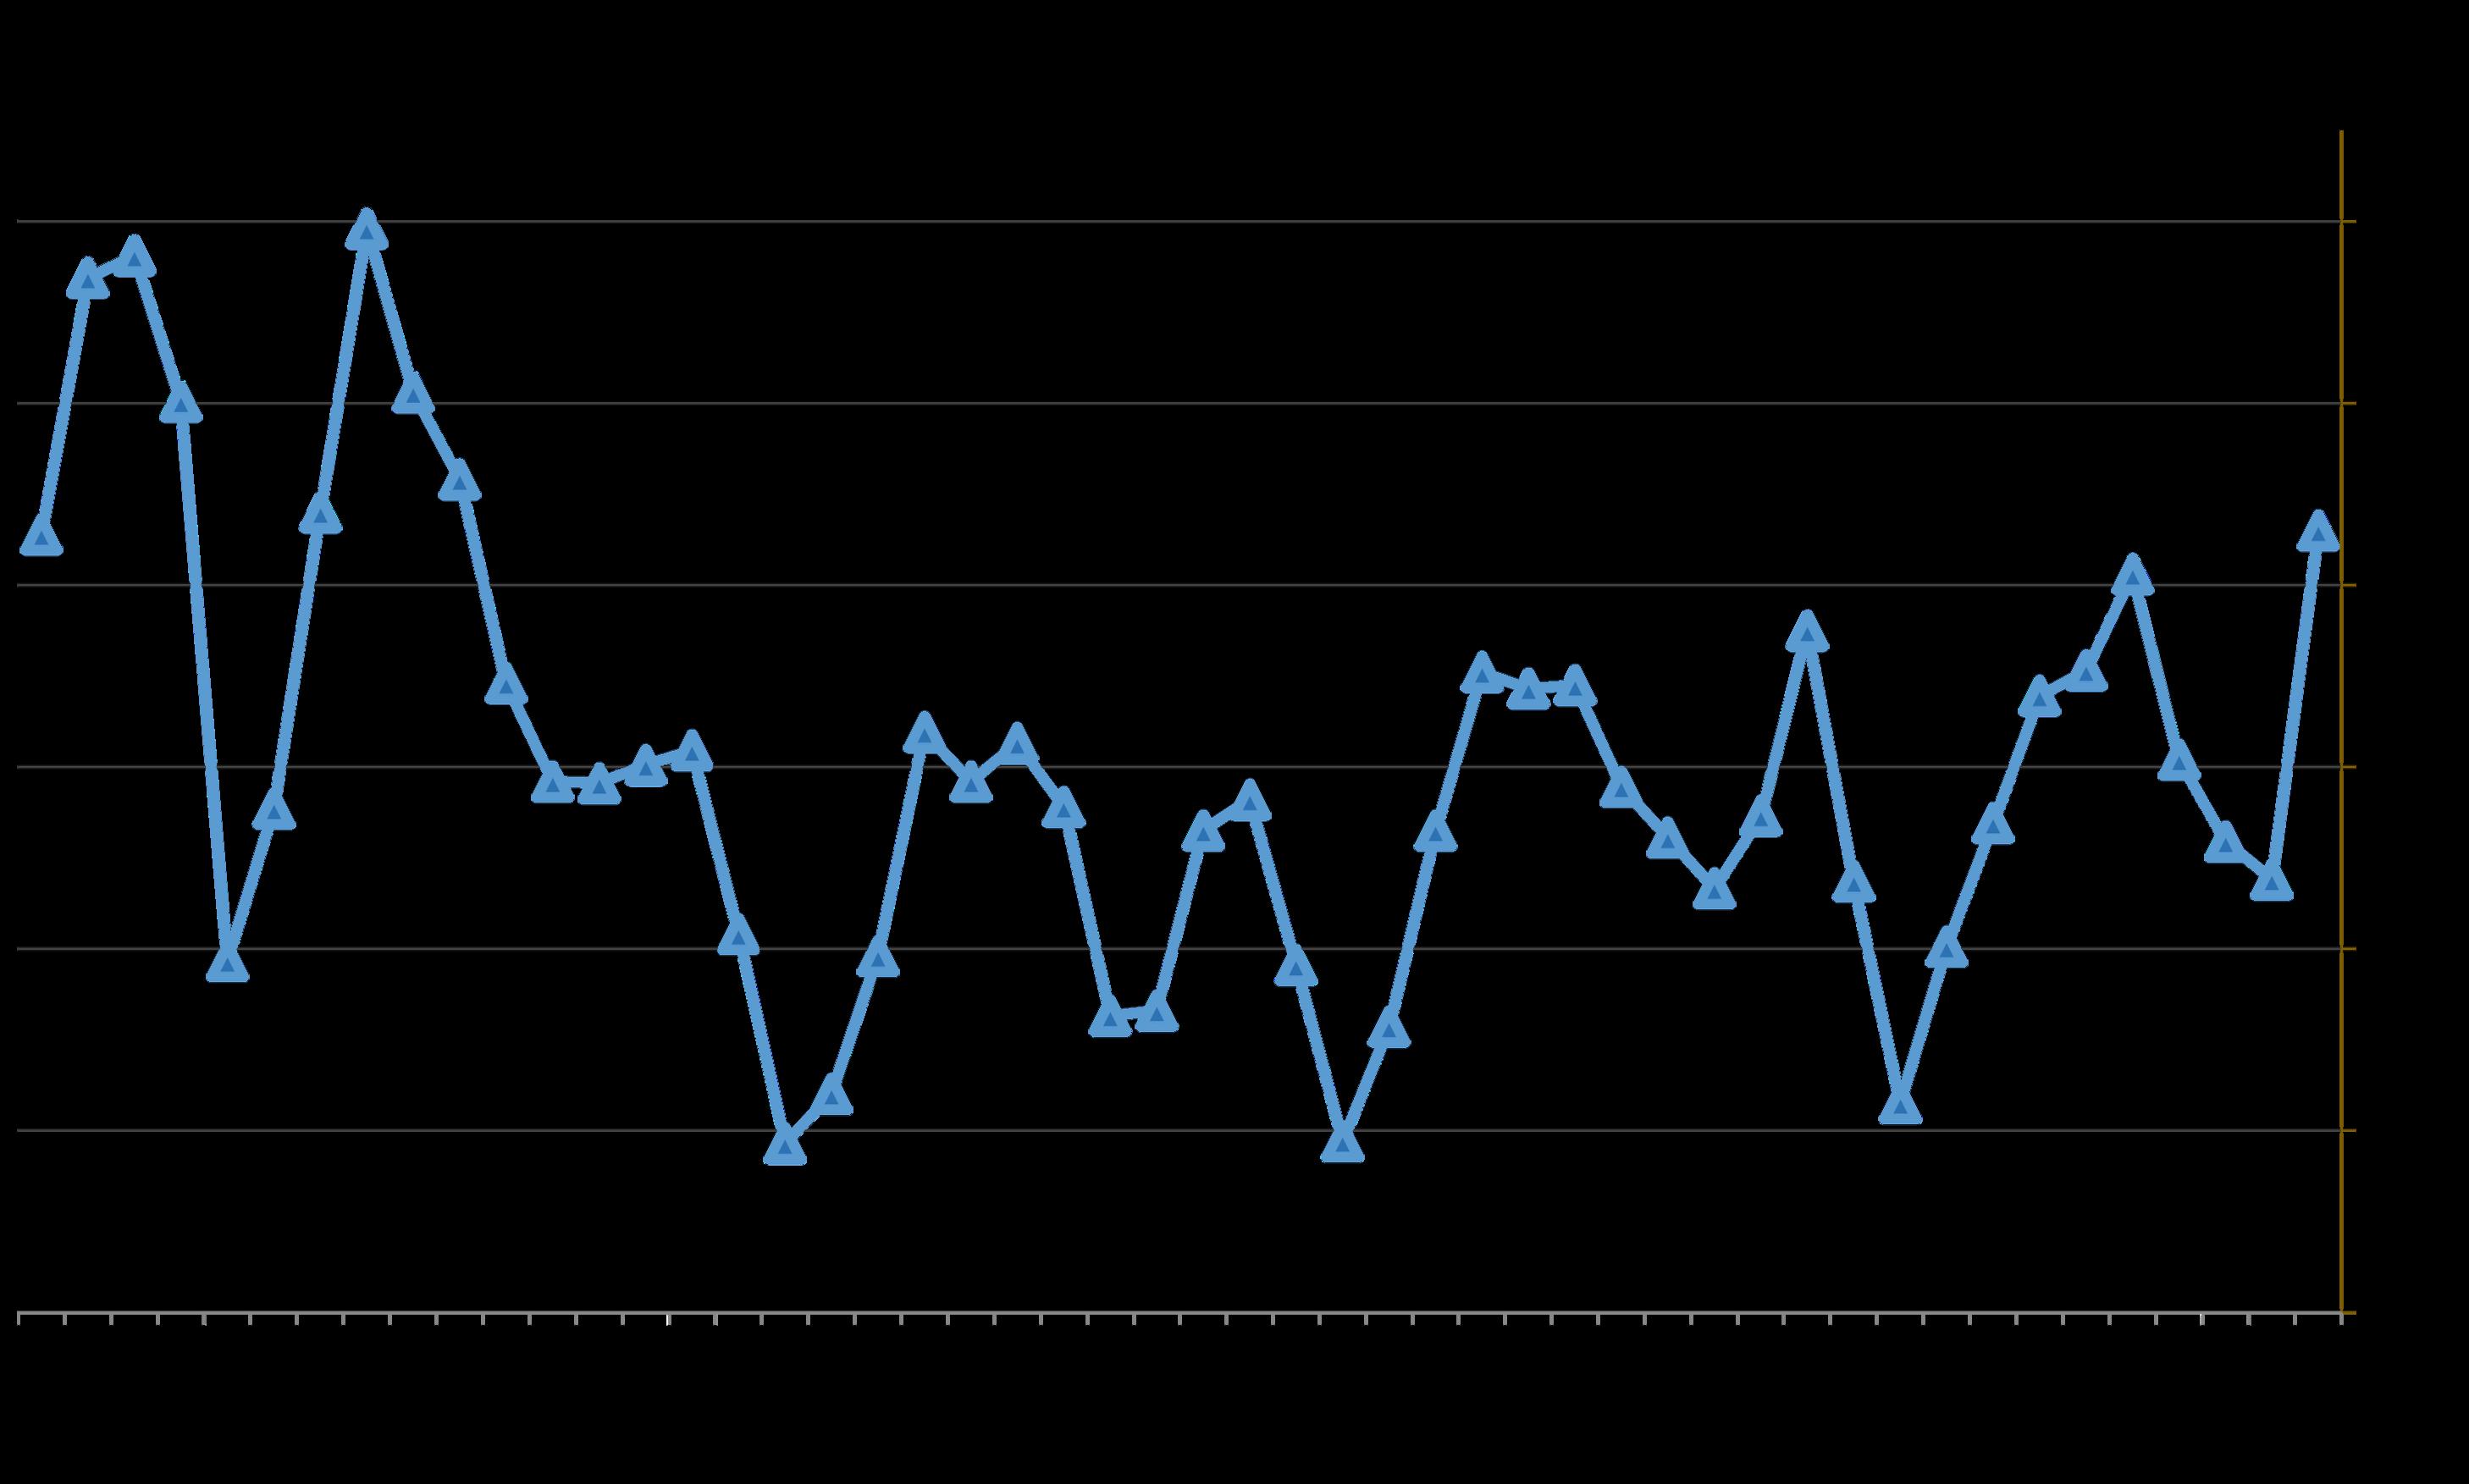
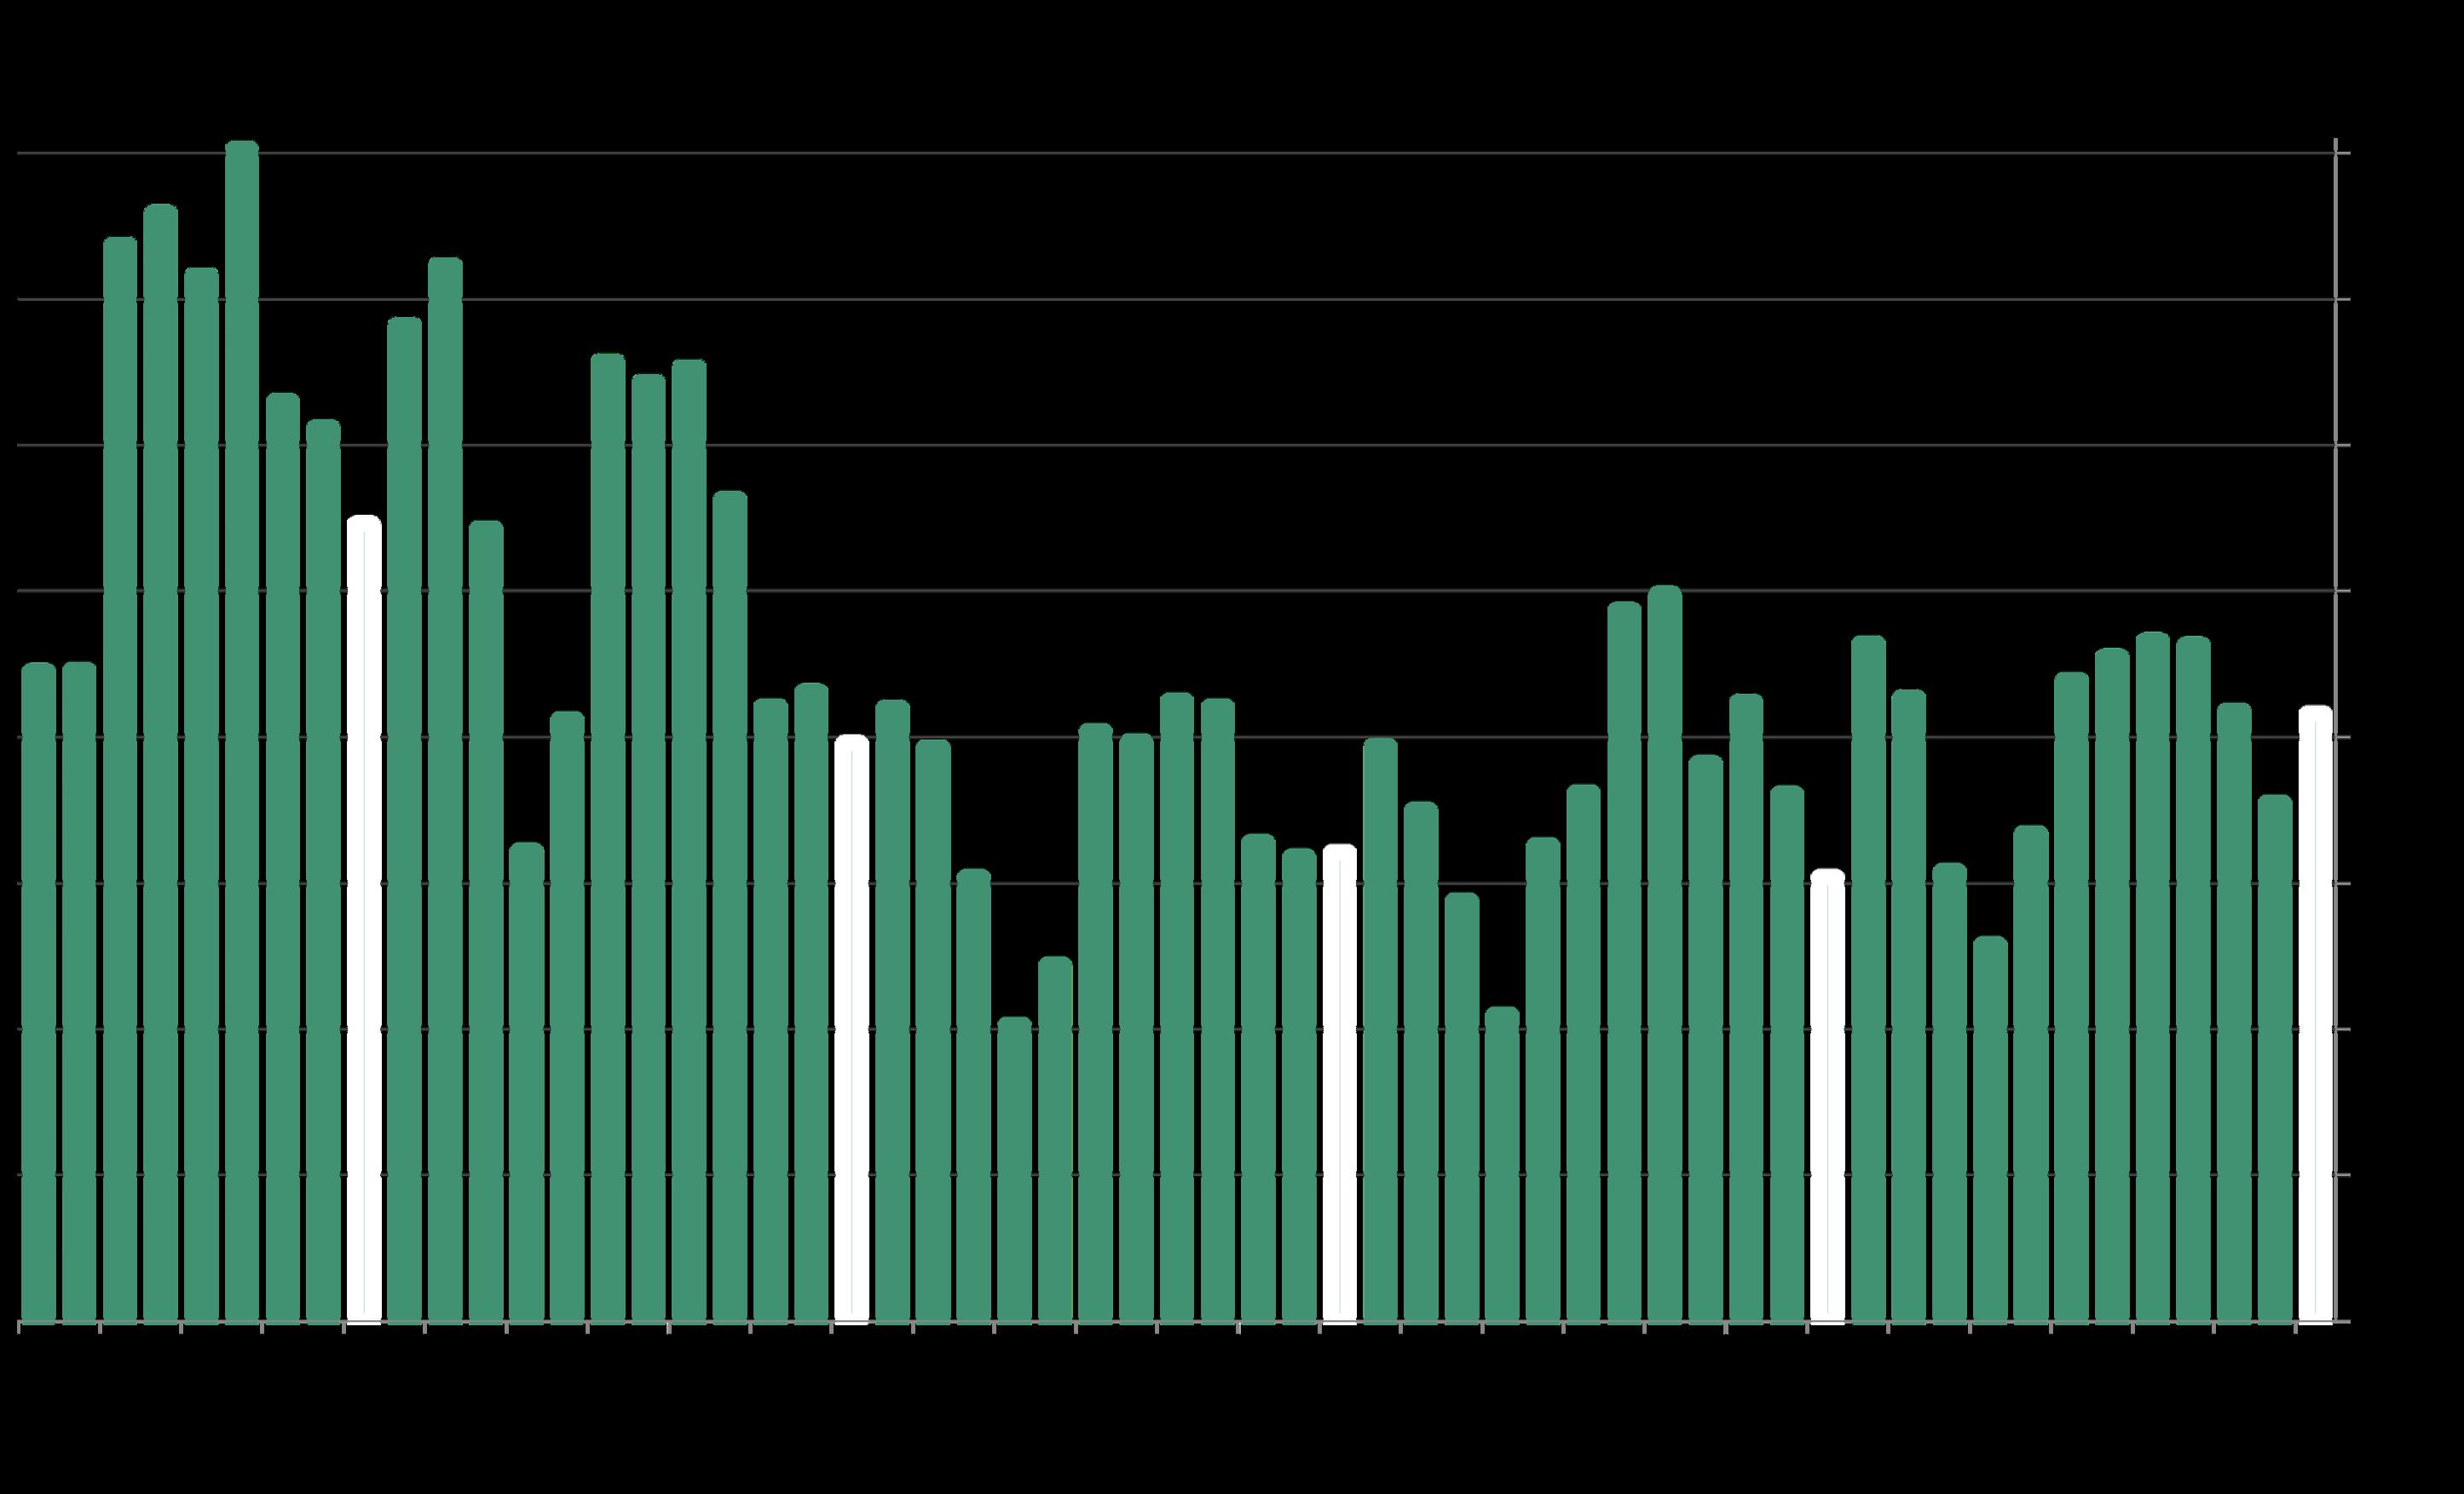
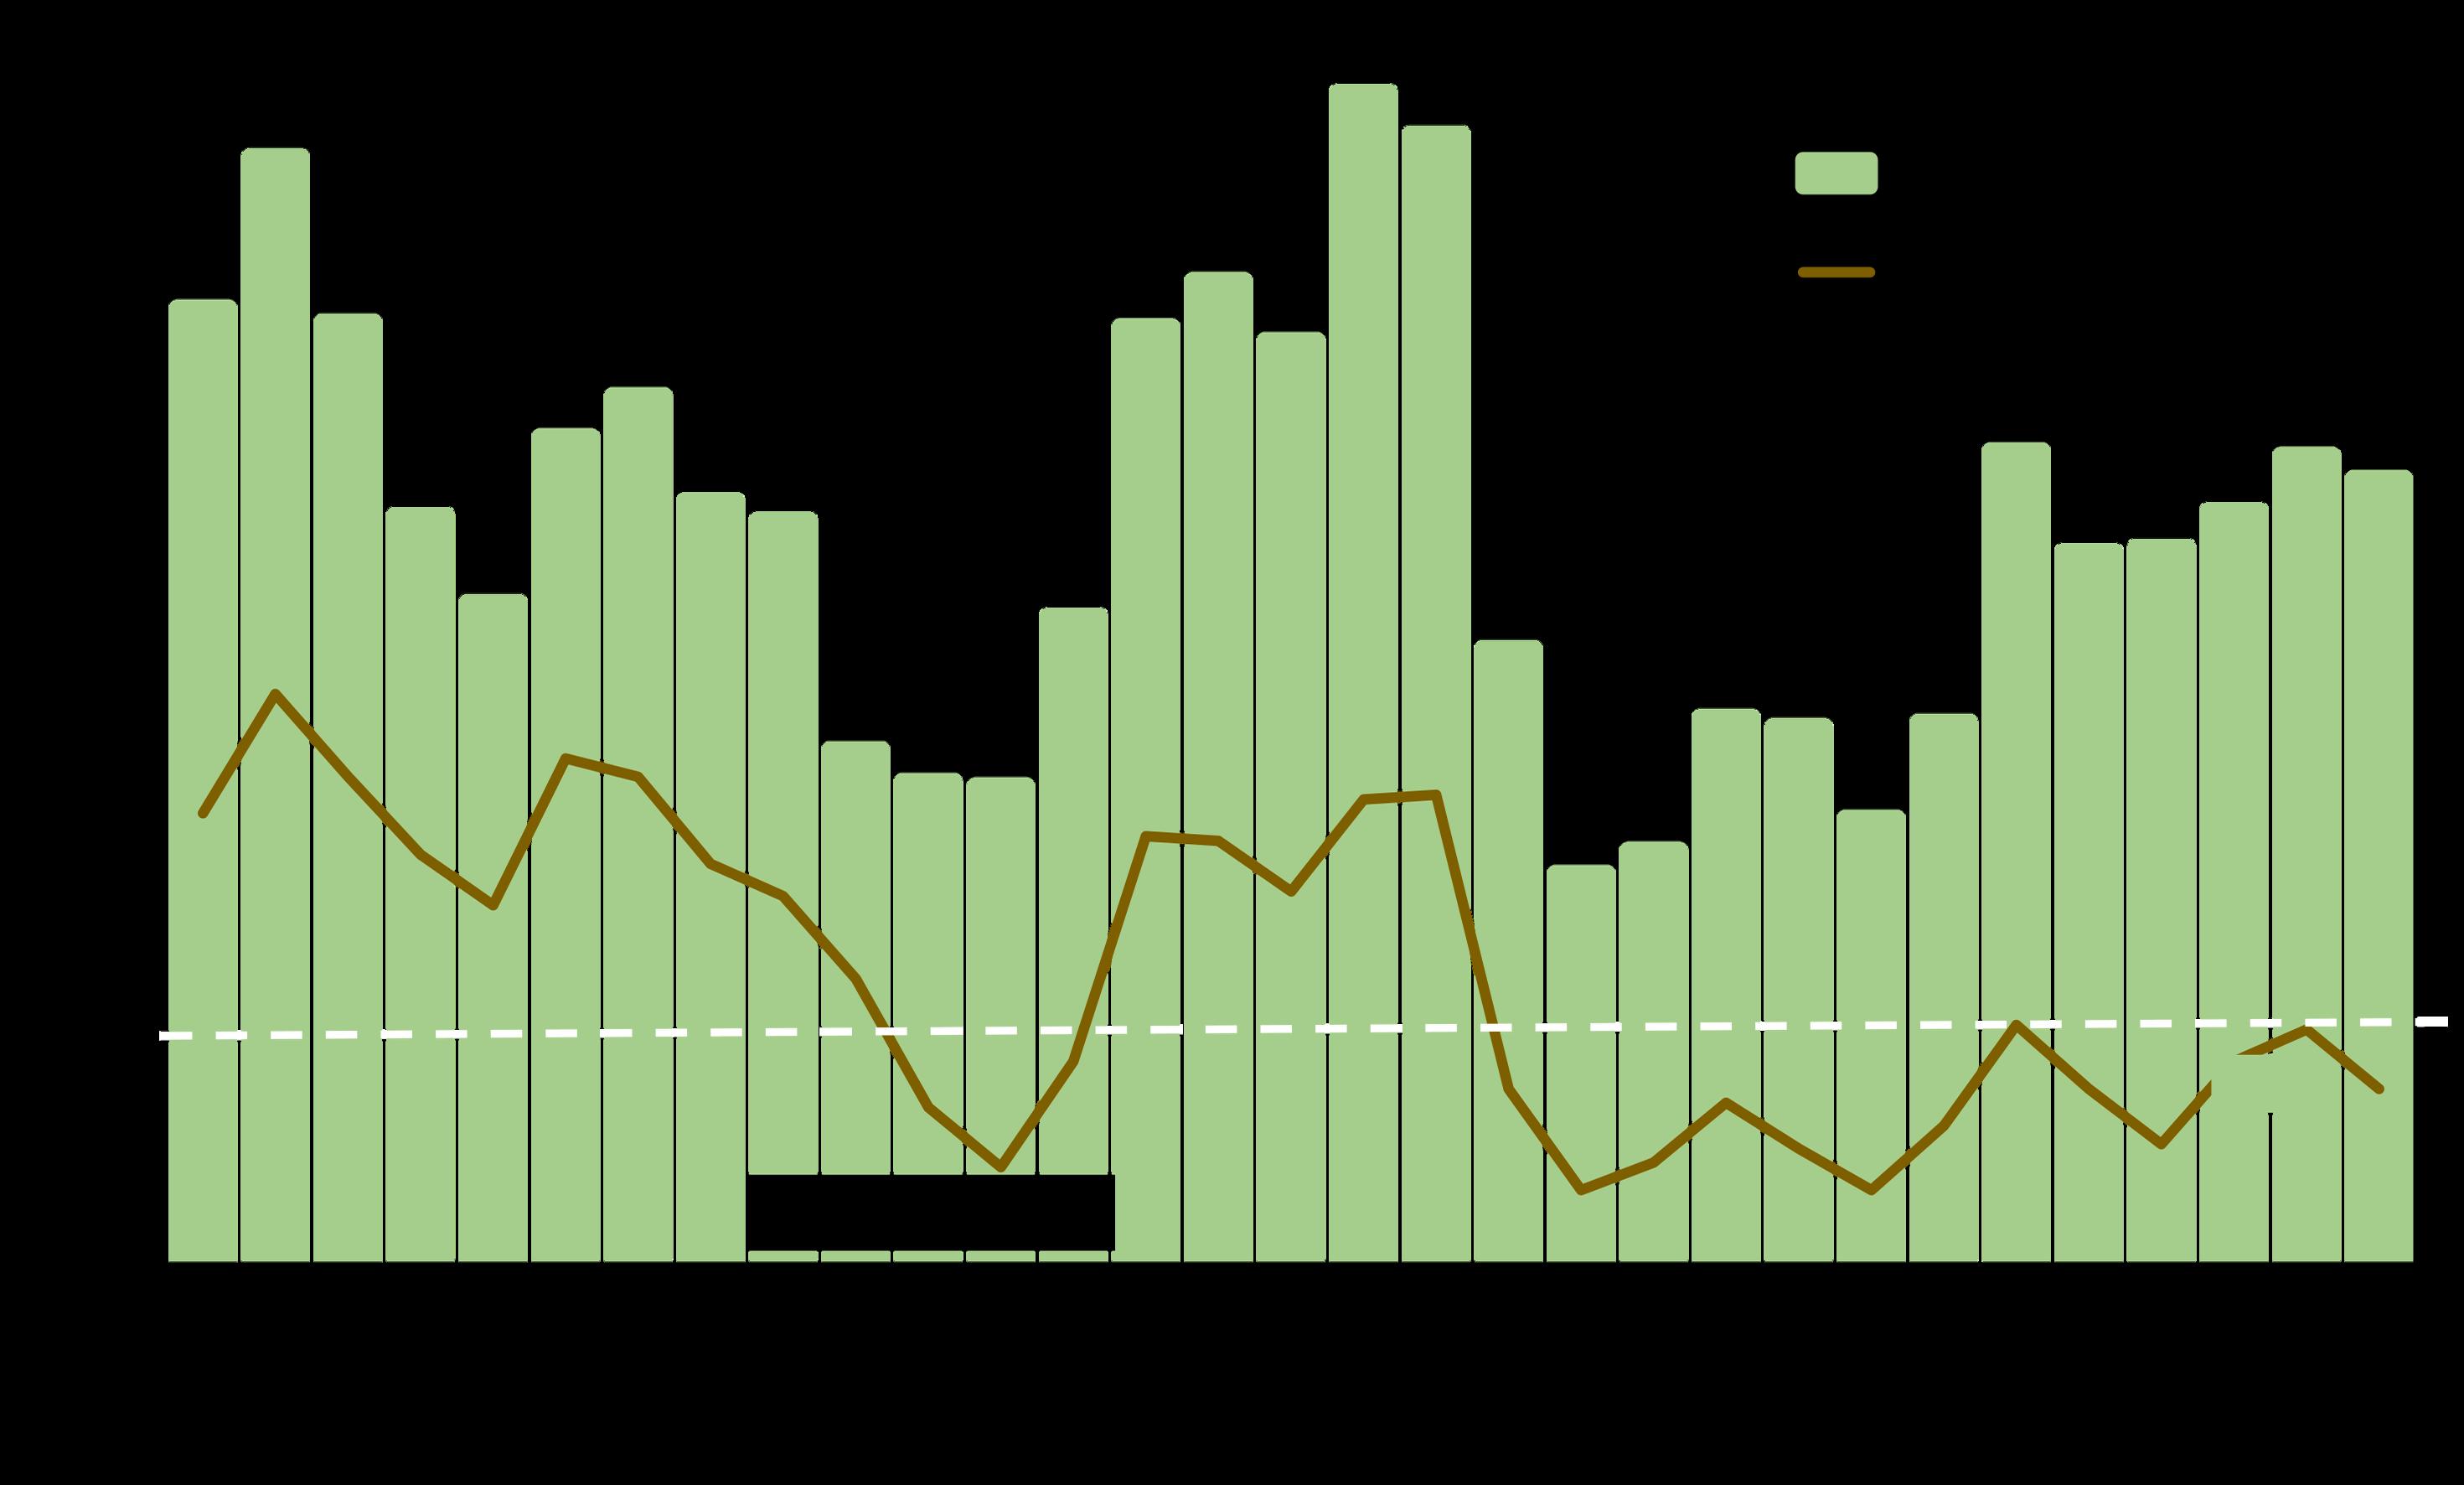
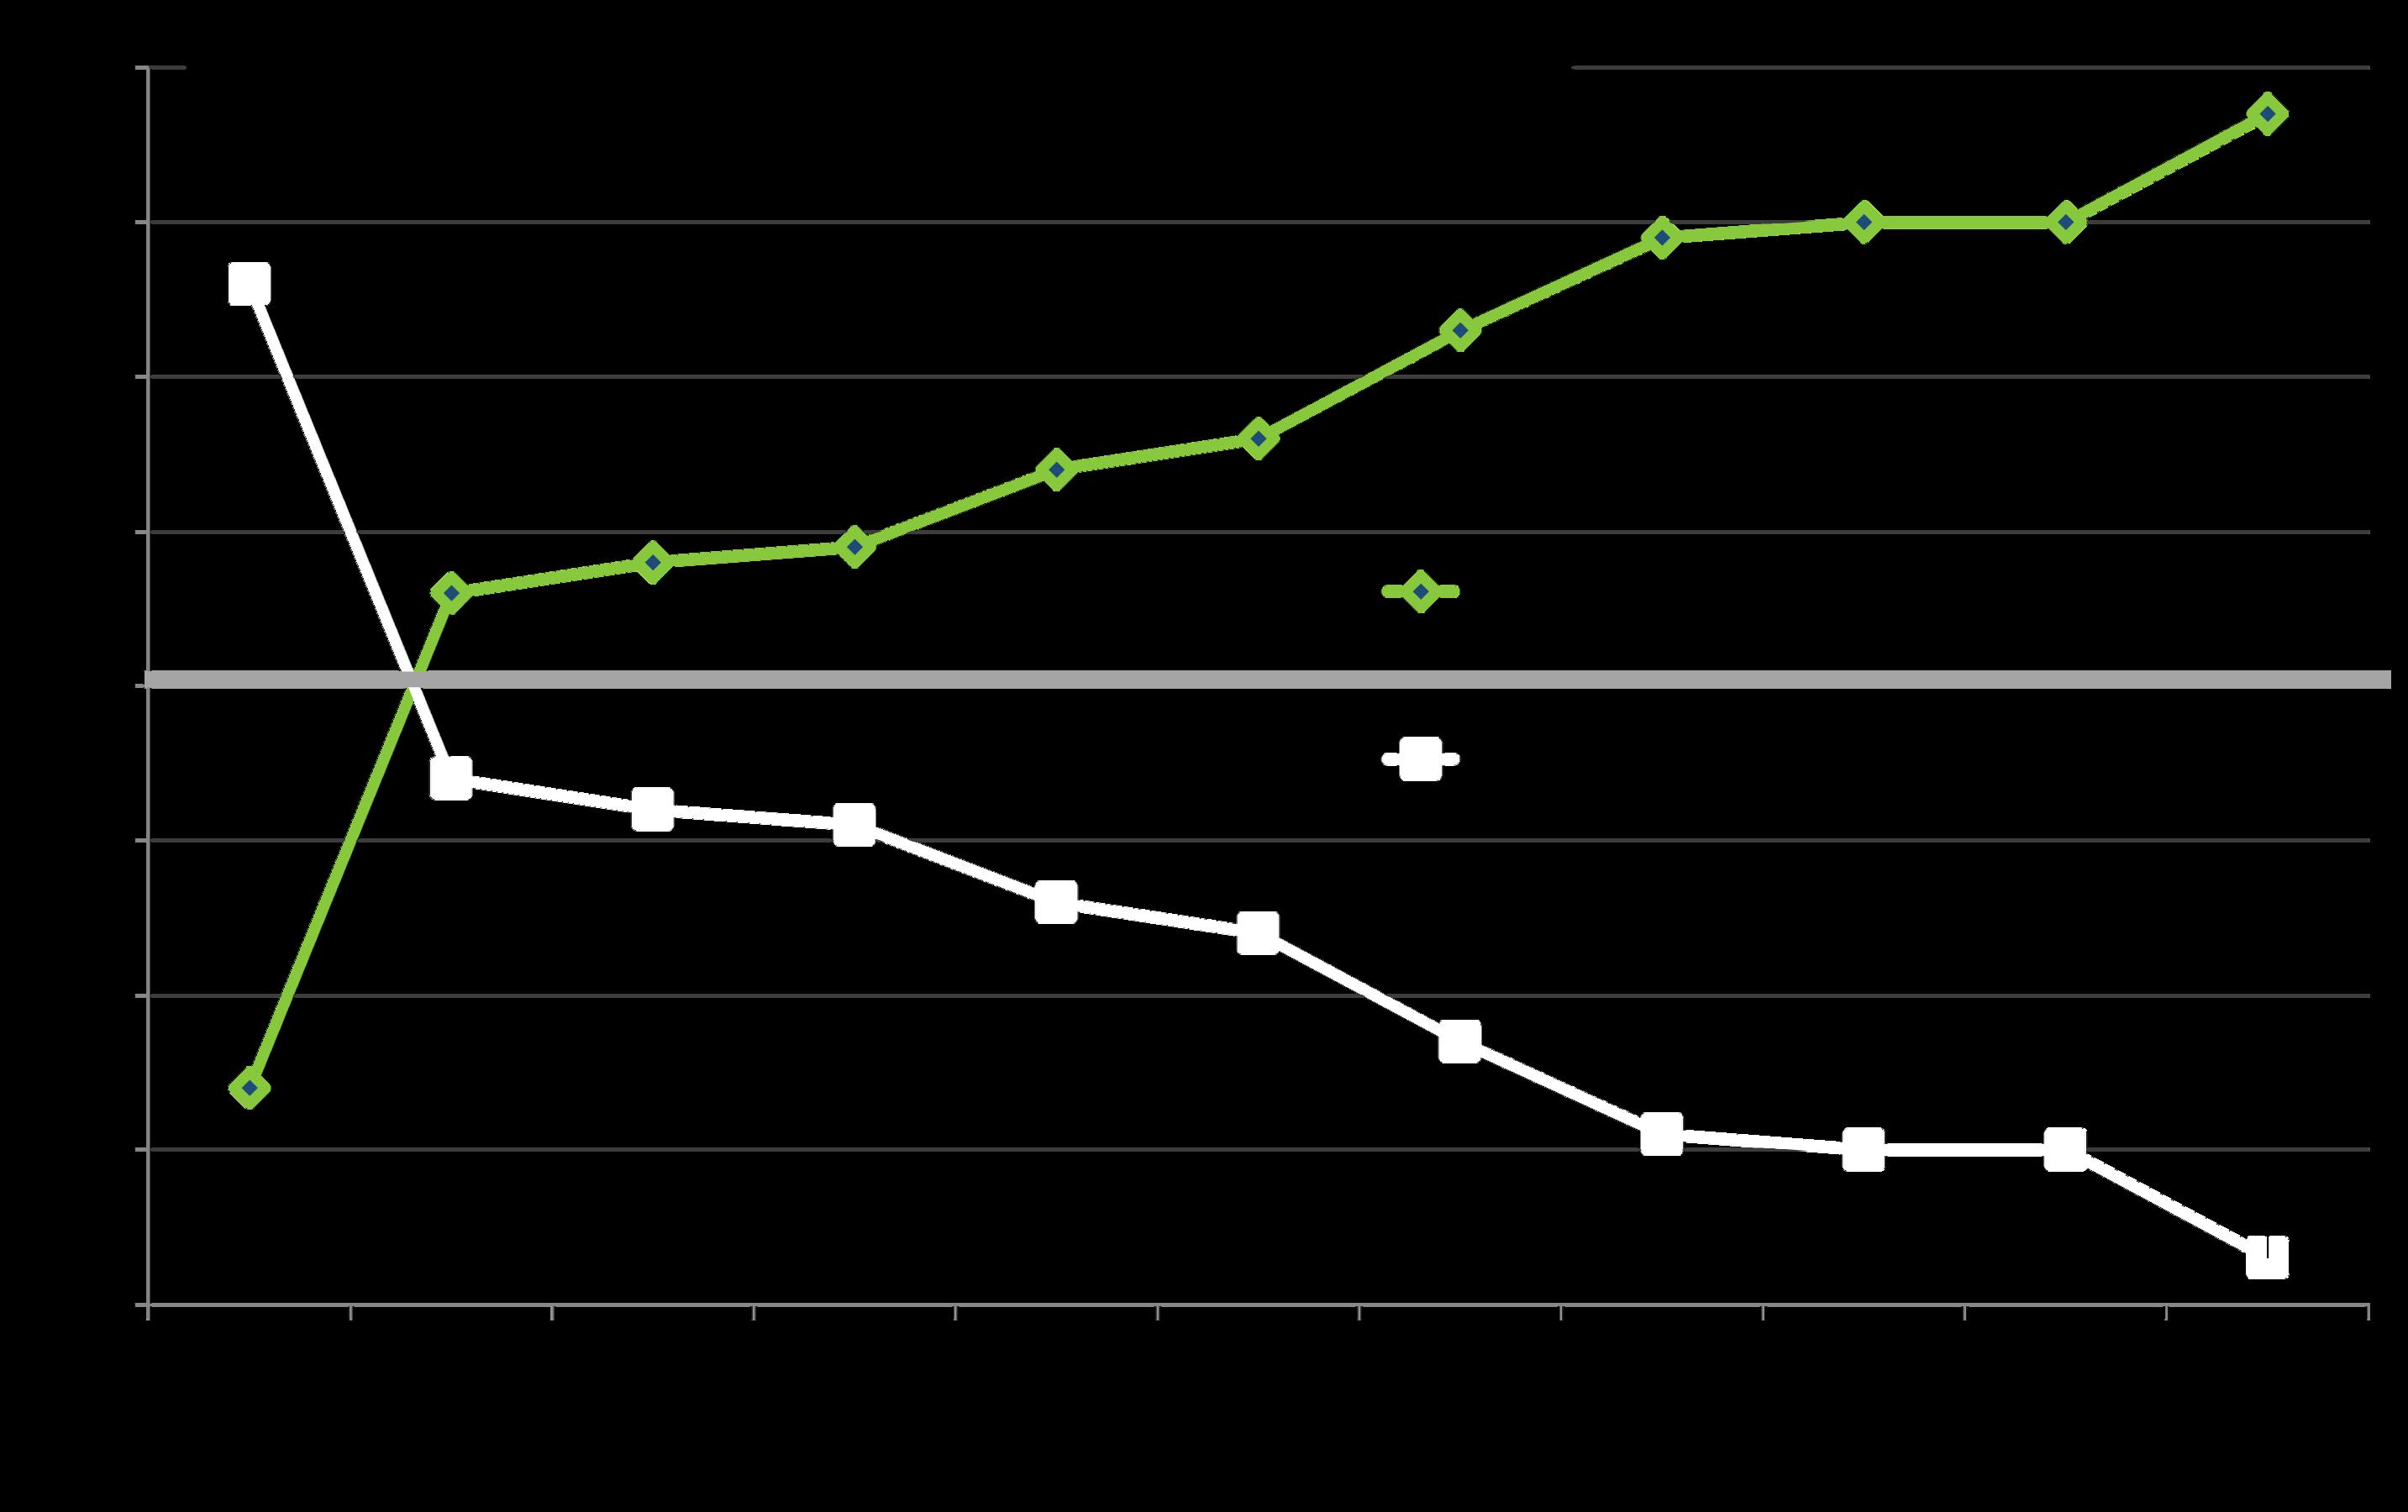
Pending Ratio
The pending ratio is a version of absorption rate: The higher the percentage, the greater the demand as compared to the supply of listings available to buy.
The pending ratio in September 2025 was the highest September percentage since the peak of the pandemic boom. It is the only Bay Area County that saw a yearover-year increase in its pending ratio – and it was a very substantial increase: 15 percentage points.
The pending ratio is the ratio of the pending listing count (listings in contract) to the active listing count within the month. It is an approximate measure of demand vs. supply.
*August figure estimated using data available in early September. Per Realtor.com Research: https://www.realtor.com/research/data/, listings posted on site. Data from sources deemed reliable, but maycontainerrorsandsubjectto revision.All numbersapproximate.
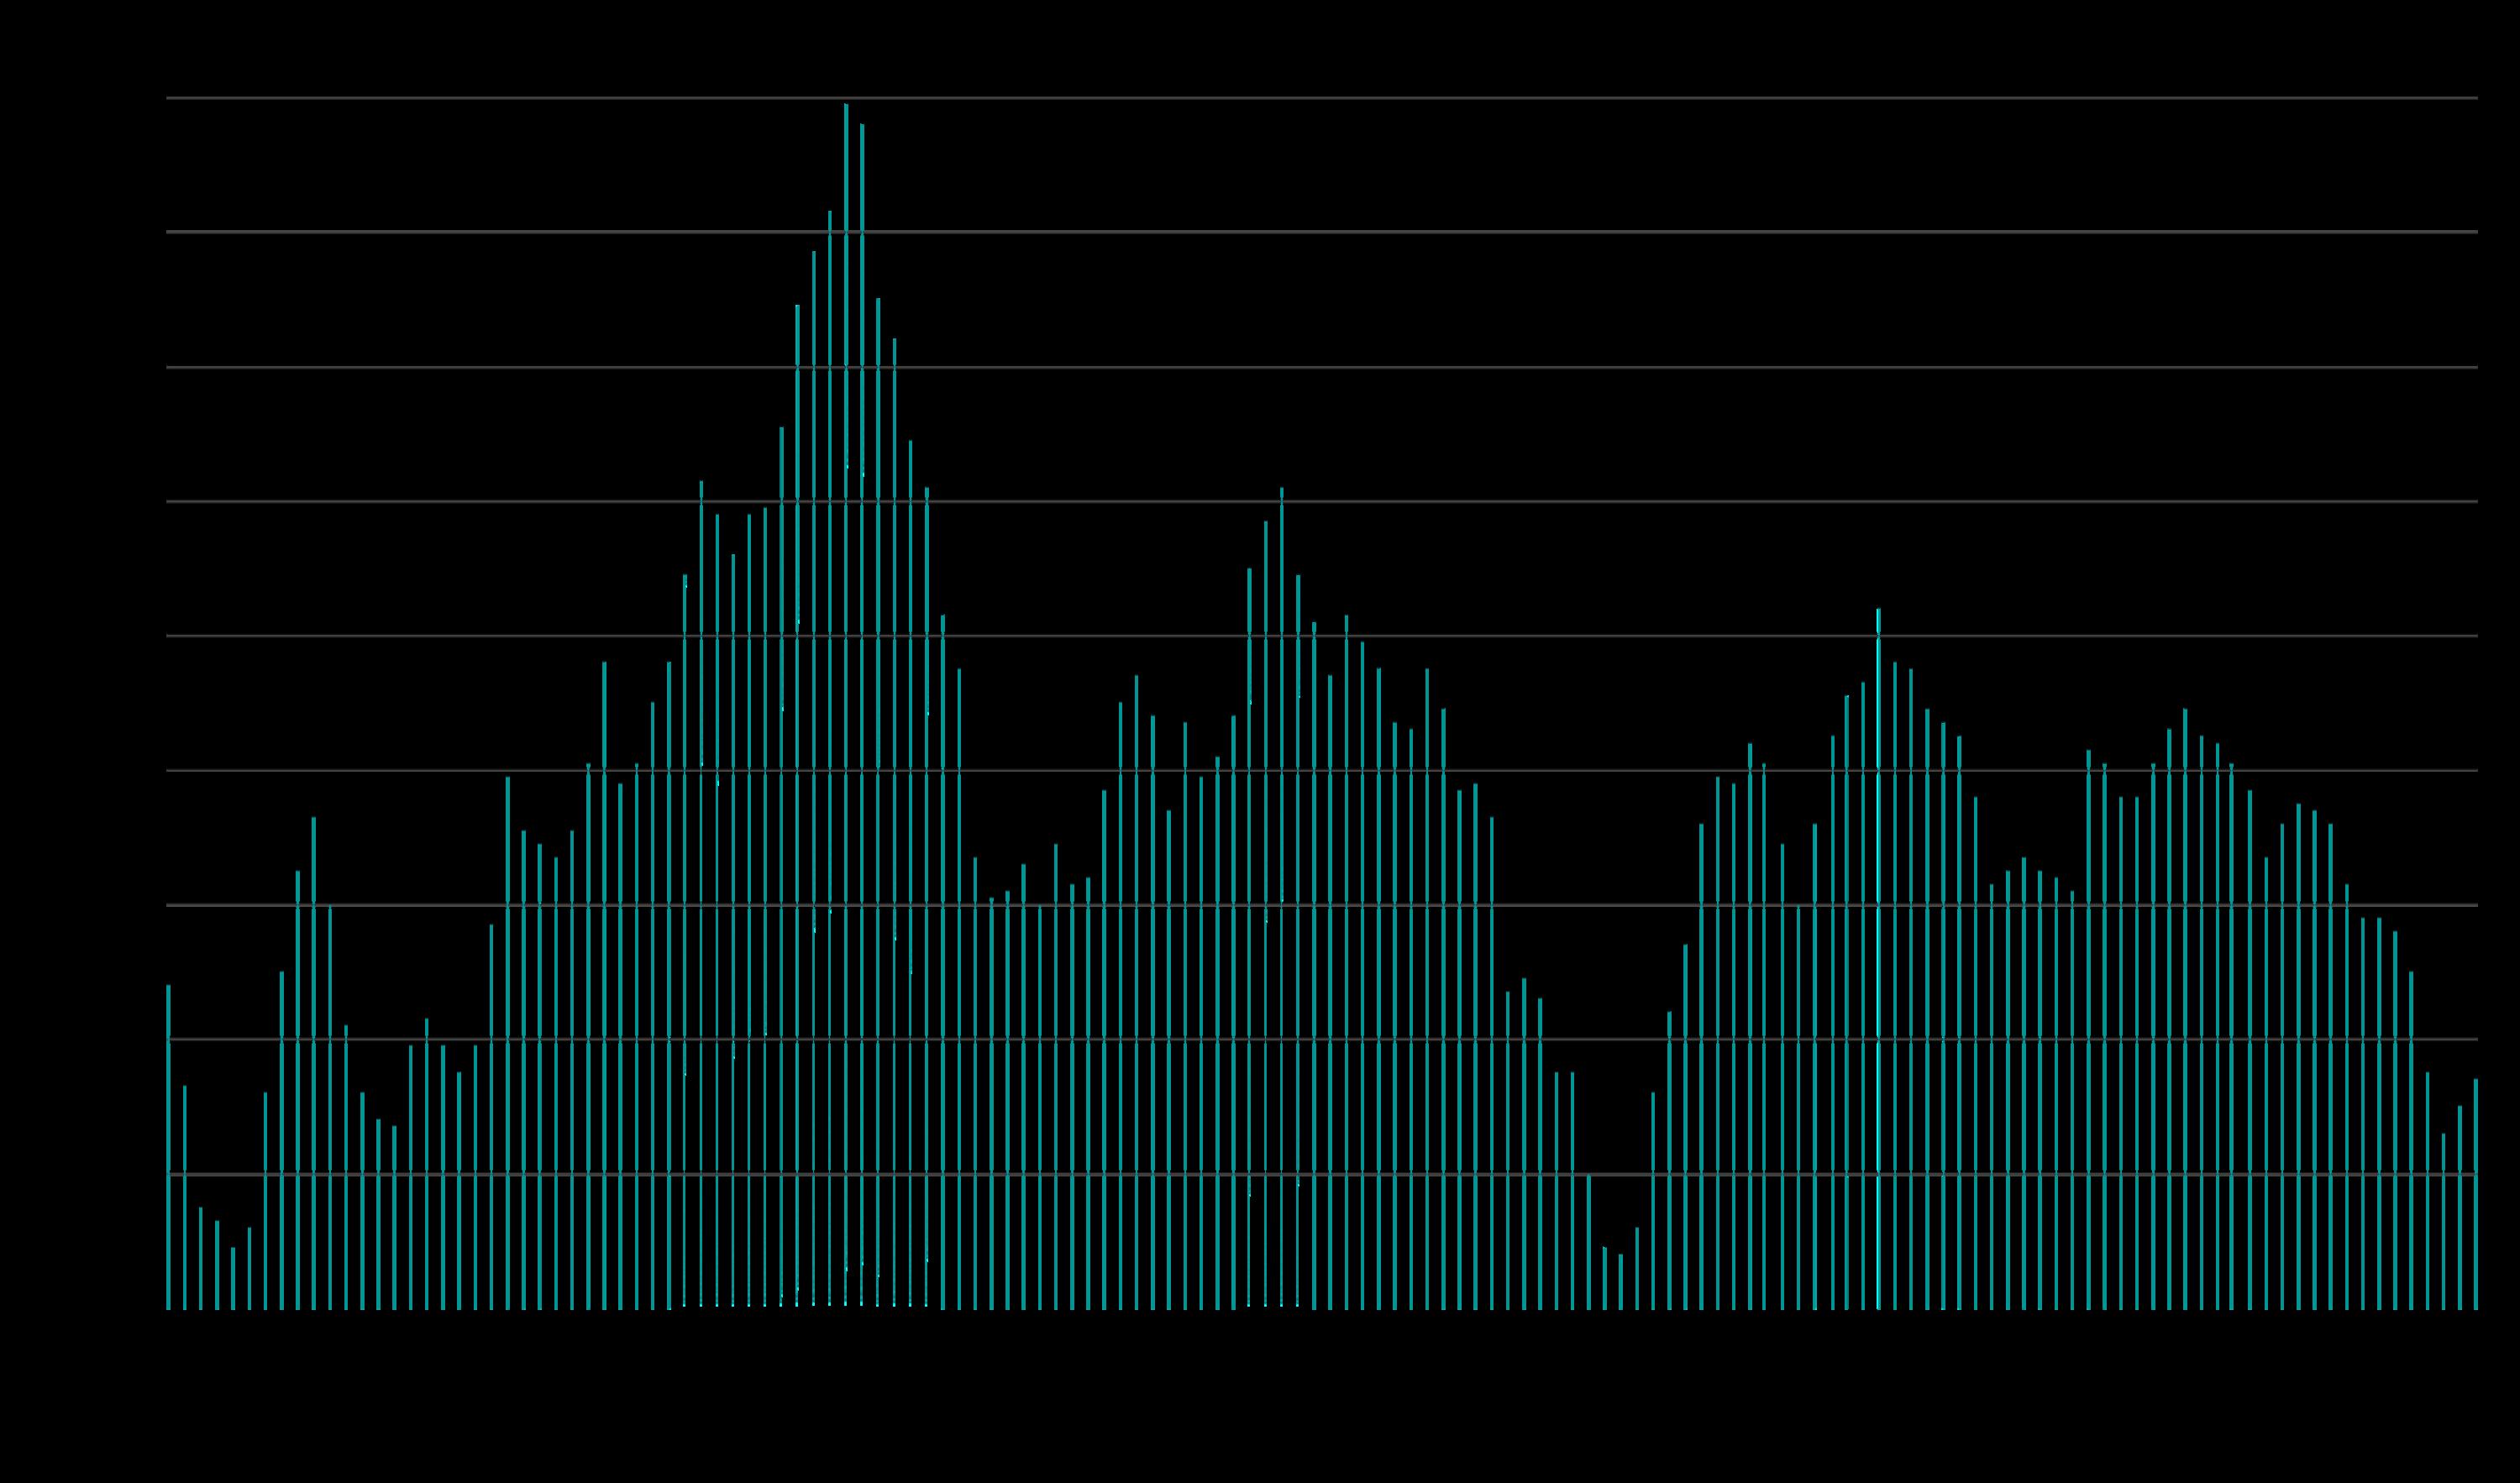
Listings Accepting Offers (Going into Contract)
Demand, asmeasuredbythe number of listings going into contract, typically climbs through spring, declines in summer, rebounds in early fall, and plunges in December. Besides demand, sales activity can be constrained by the number of homes available to buy. Fueled by demand and the surge of new listings, the number of homes going into contract in September 2025 soared 57% from August and 42% from September 2024 – to its highest September count since 2021.
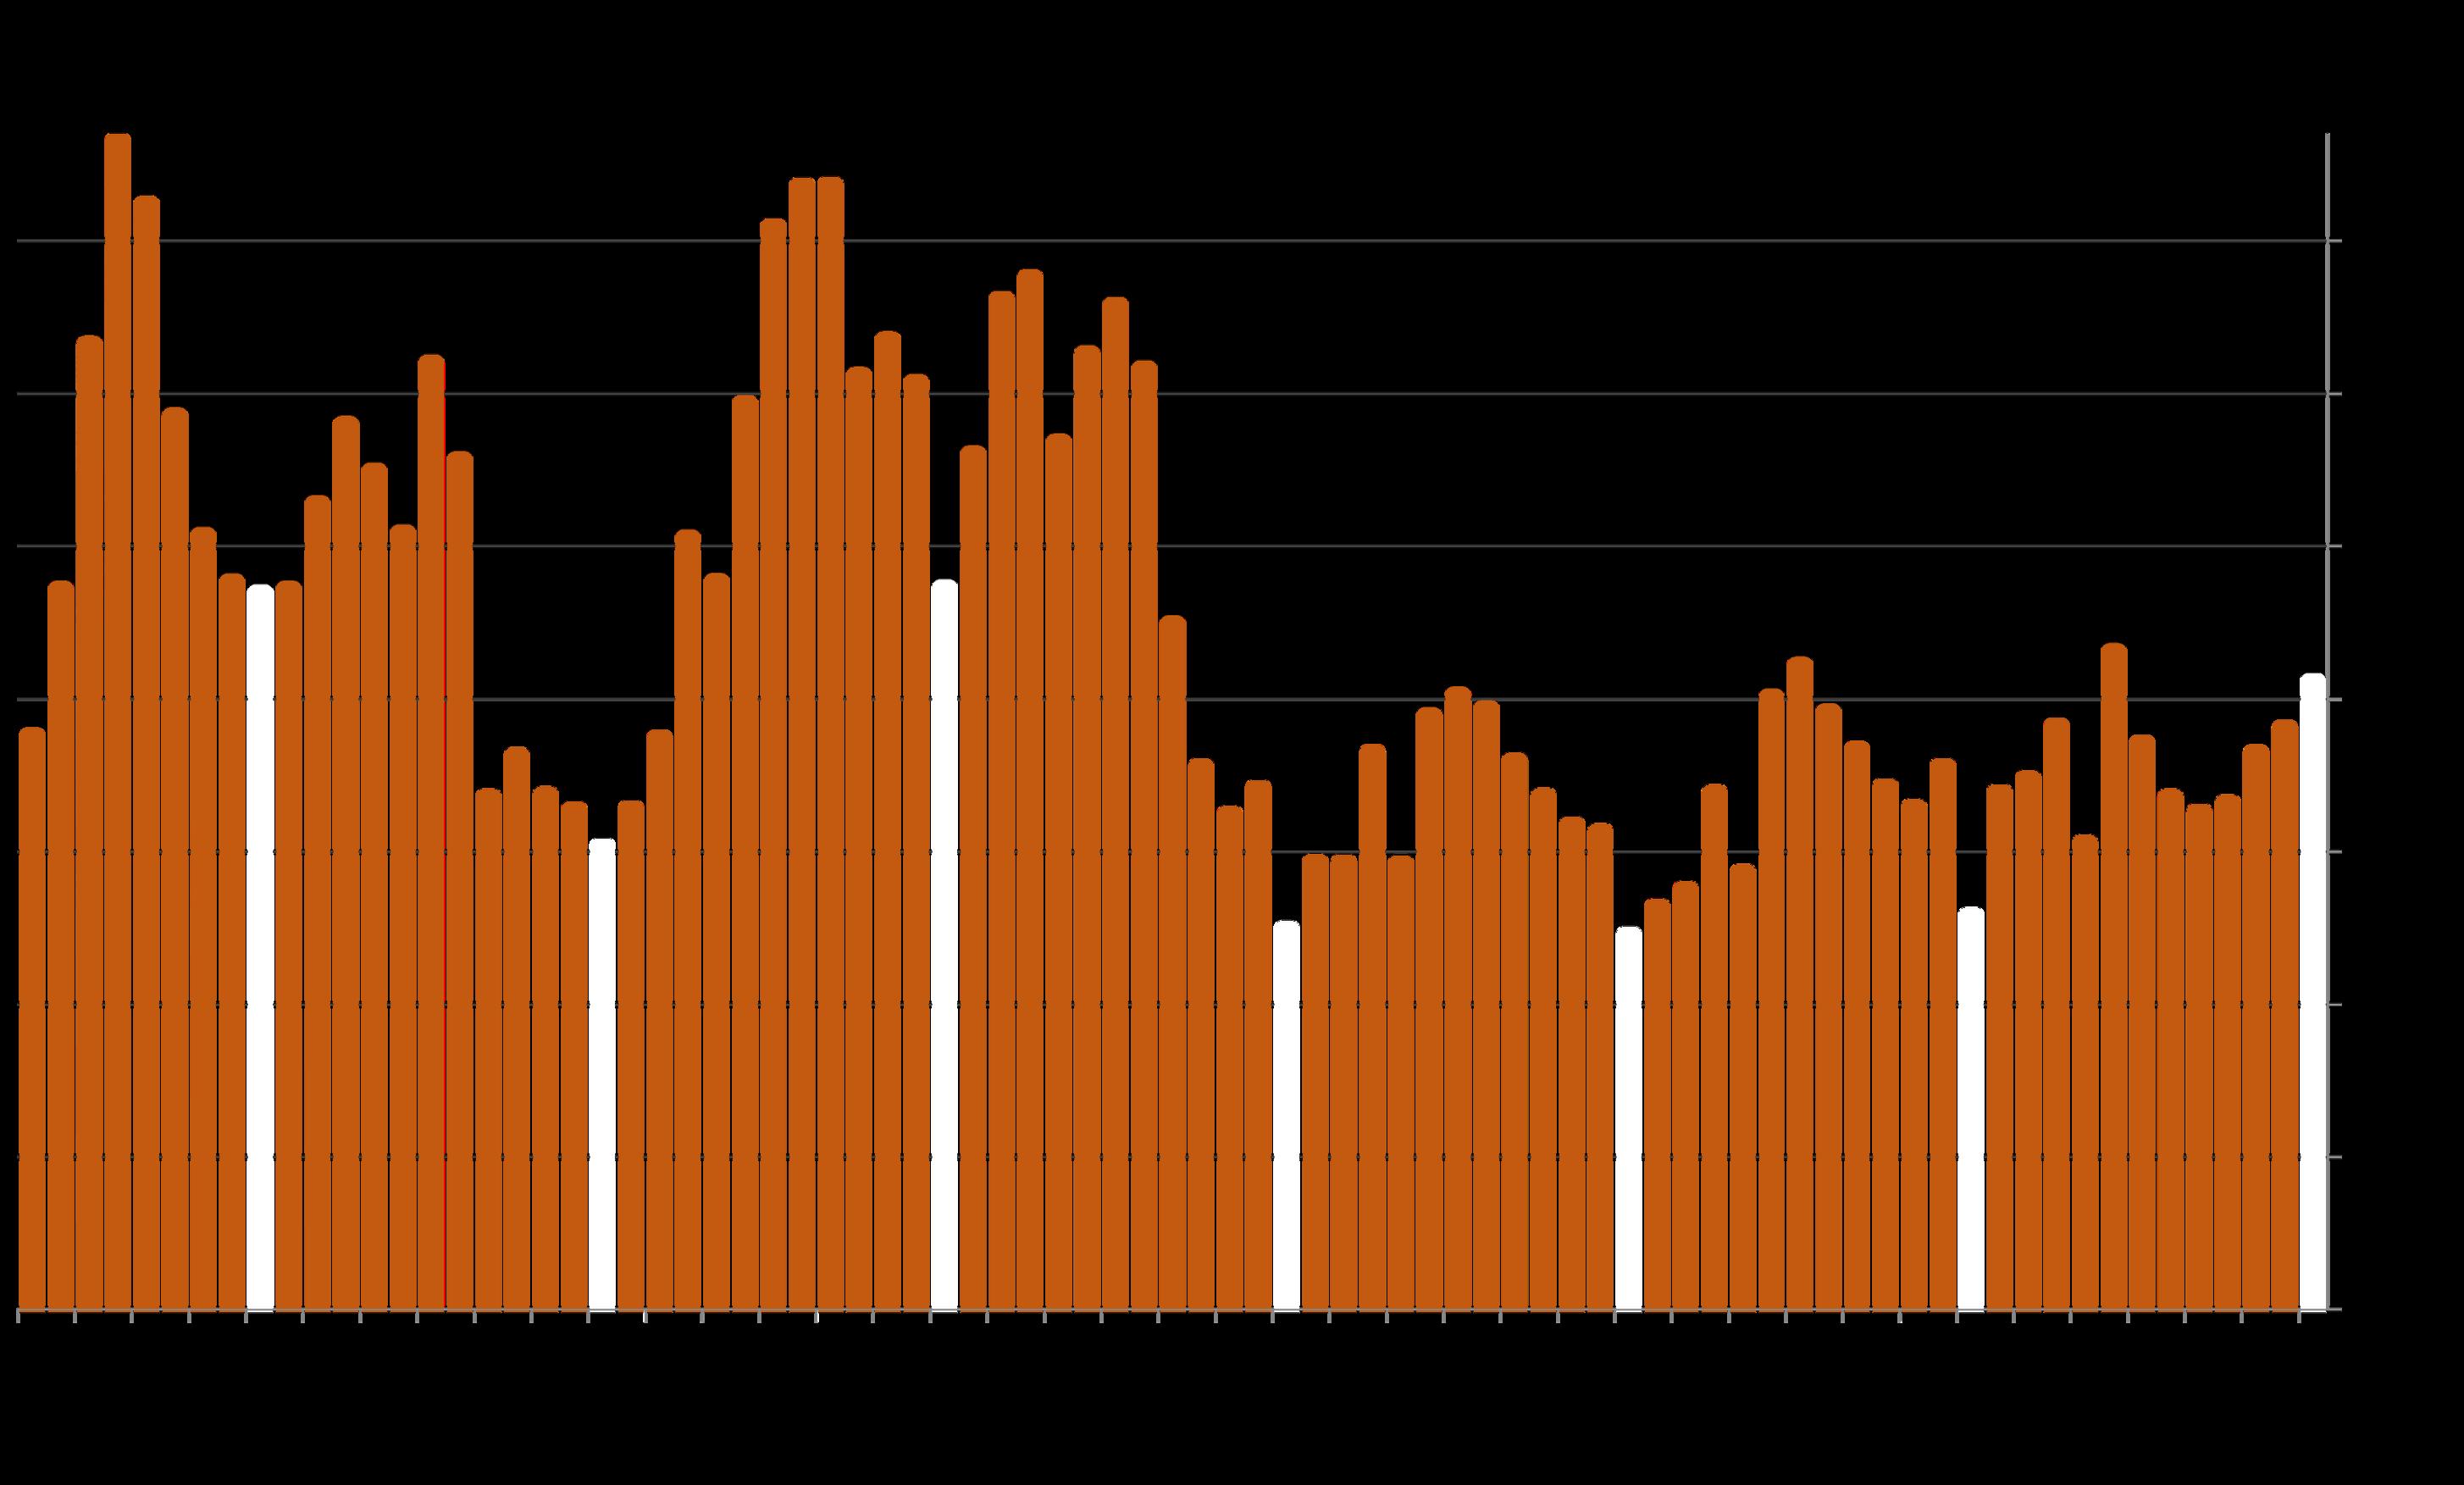
Monthly Home Sales Volume*
San Francisco Market Dynamics & Seasonality
Sales in one month mostly reflect accepted offers in the previous month. The number of sales in September 2025 rose about 35% from September 2024. It can be expected to surge substantially higher in October.
House sales made up approximately 43% of
September 2025 sales, and condos, co-ops, TICs and townhouses made up 57%.
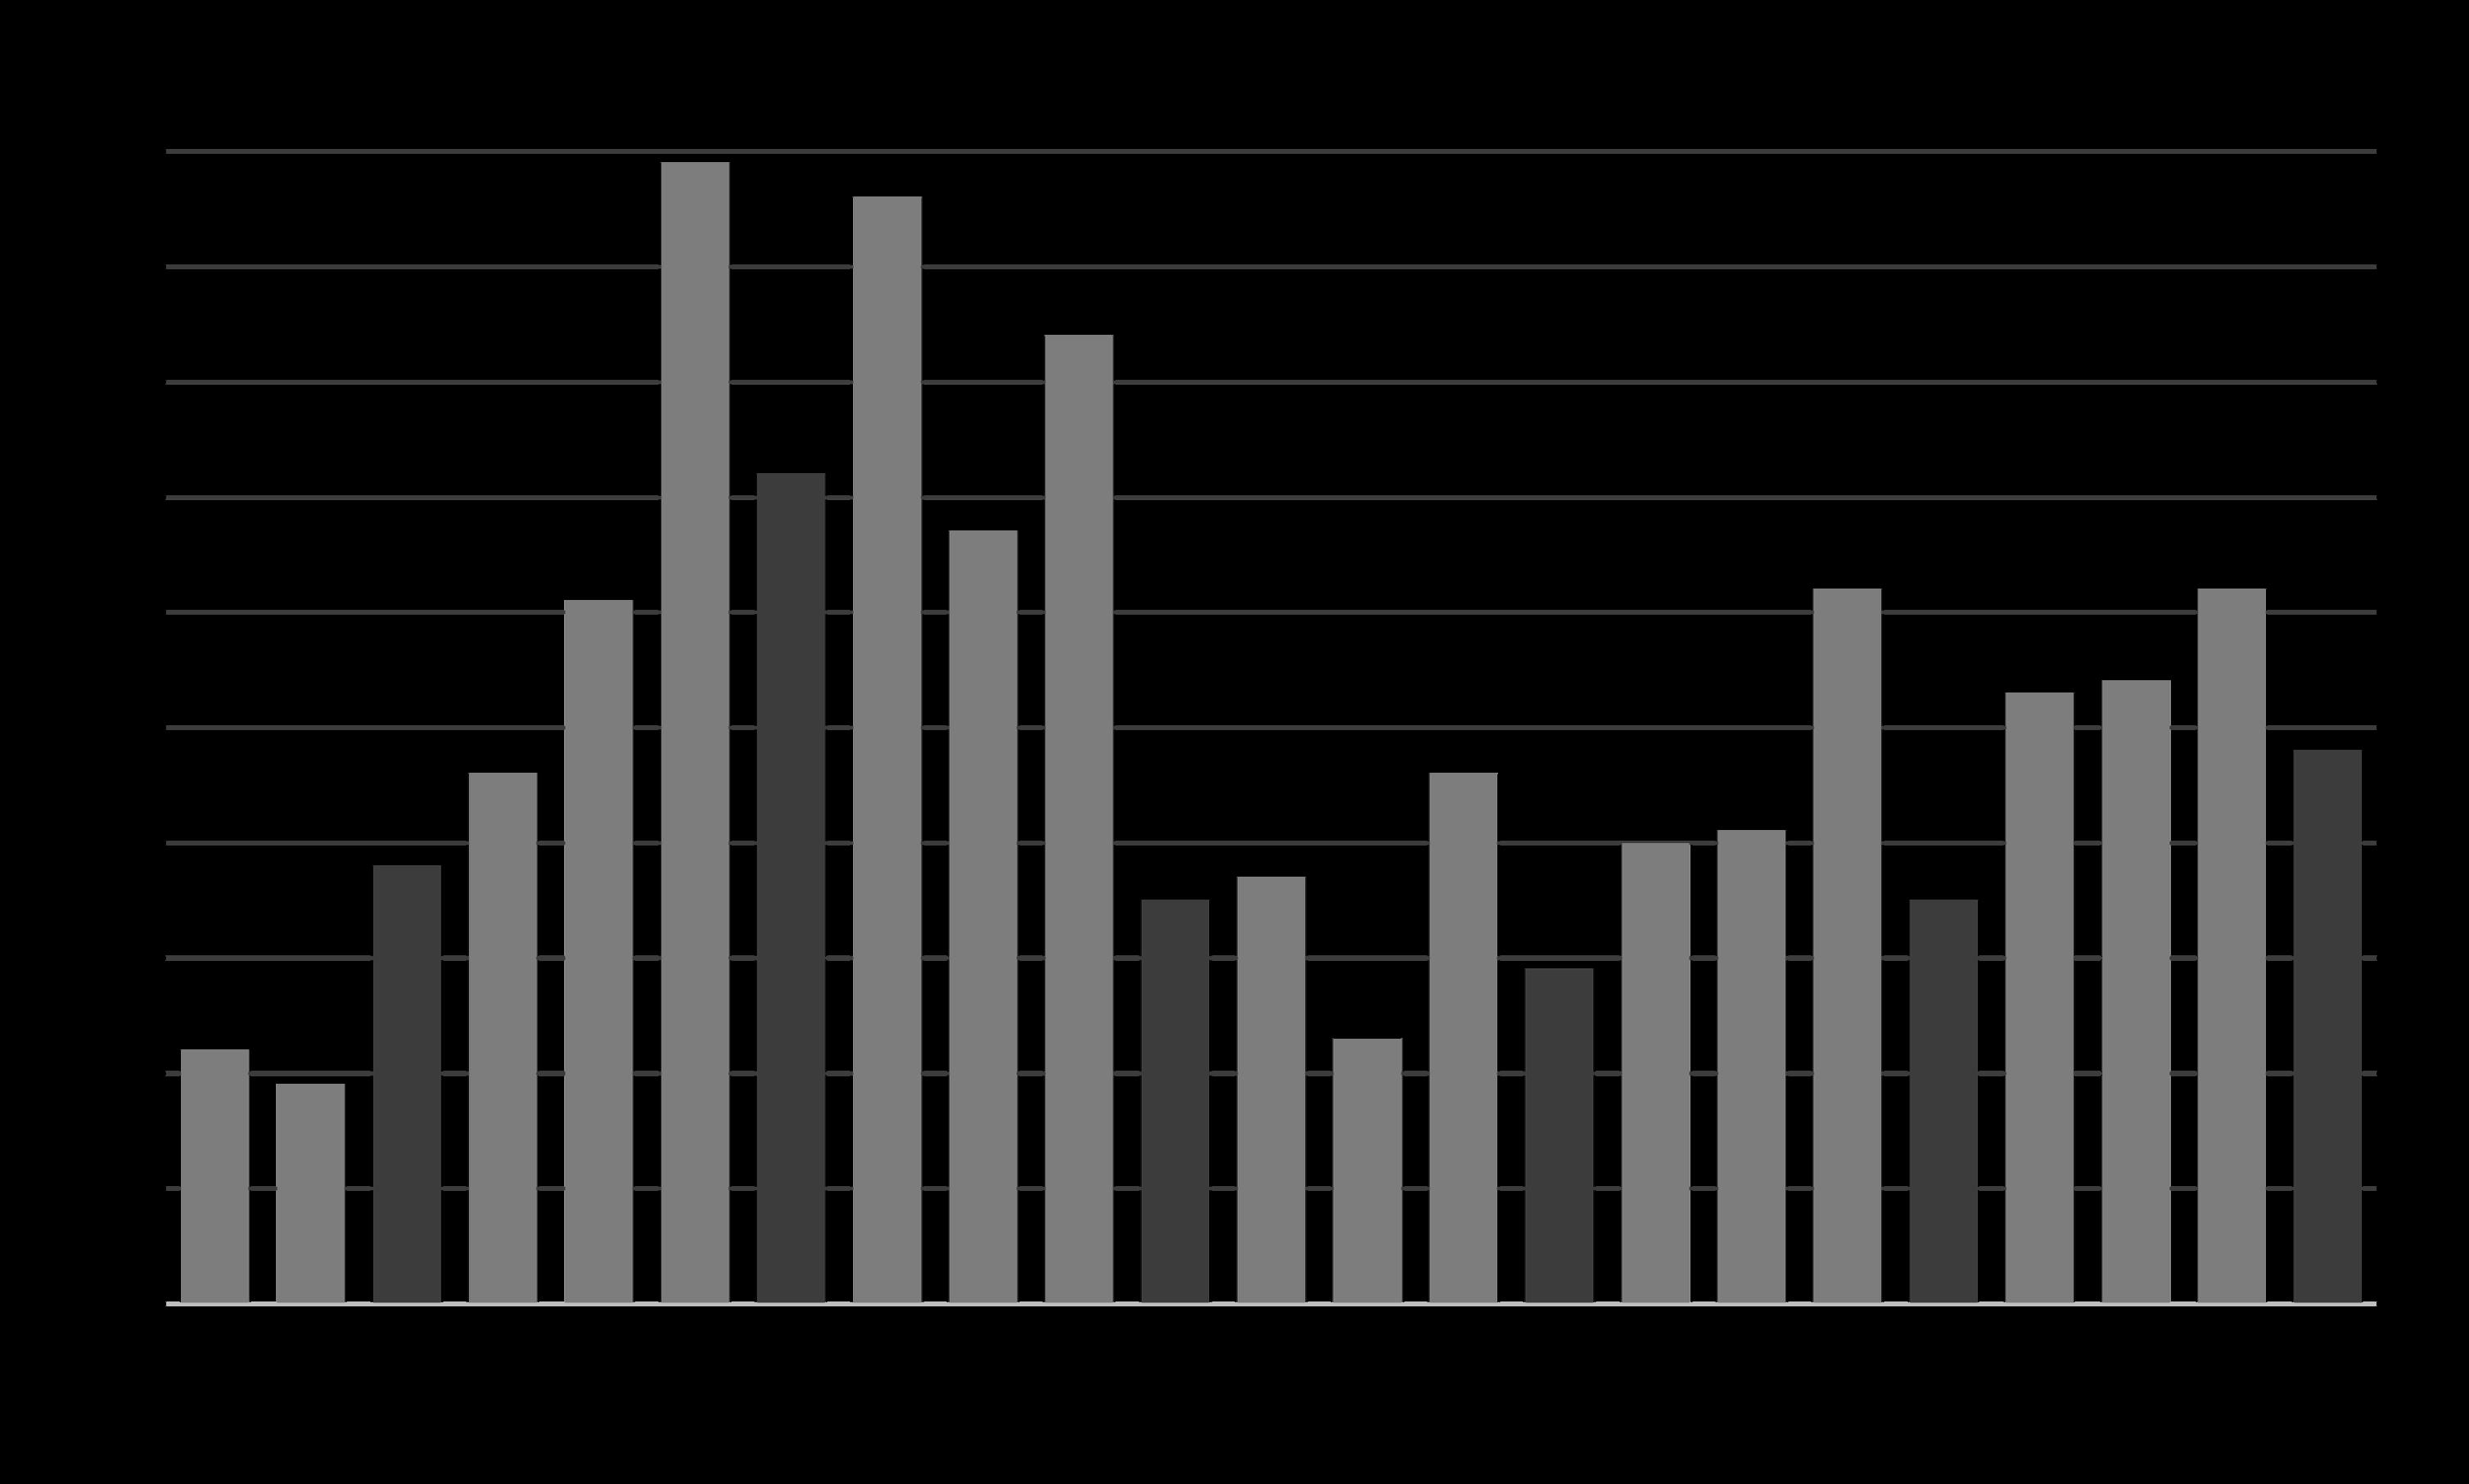
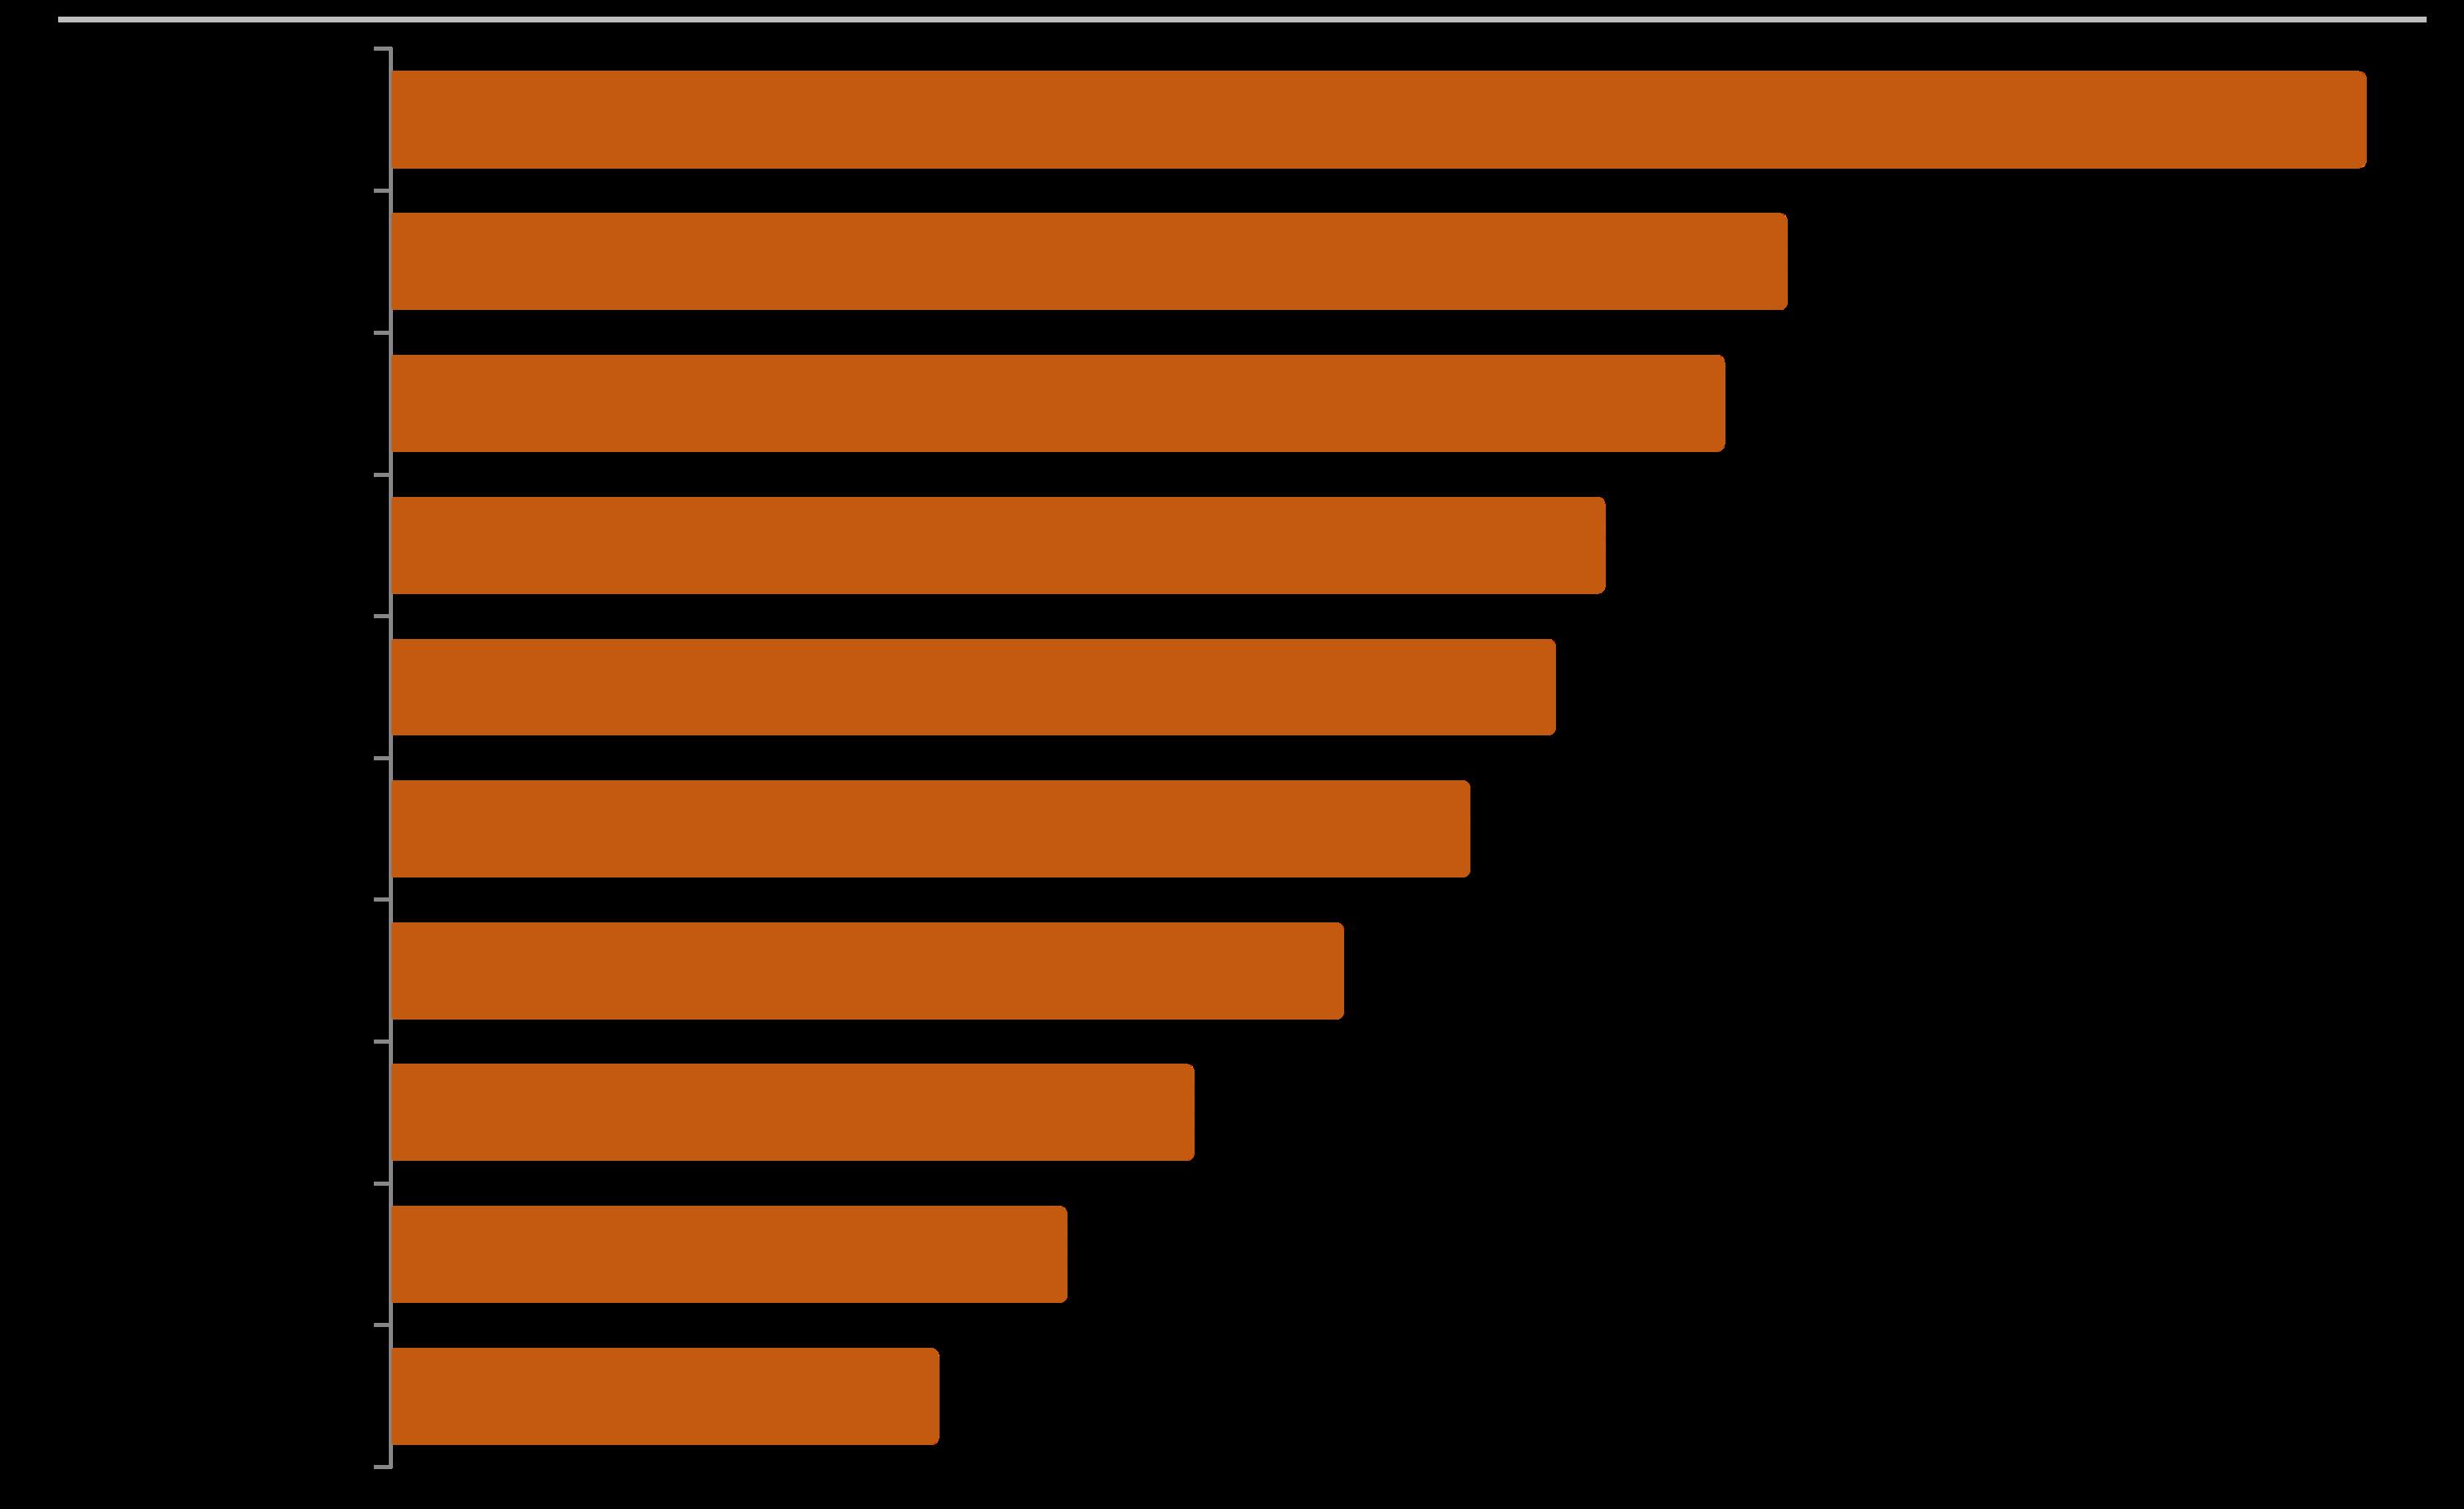
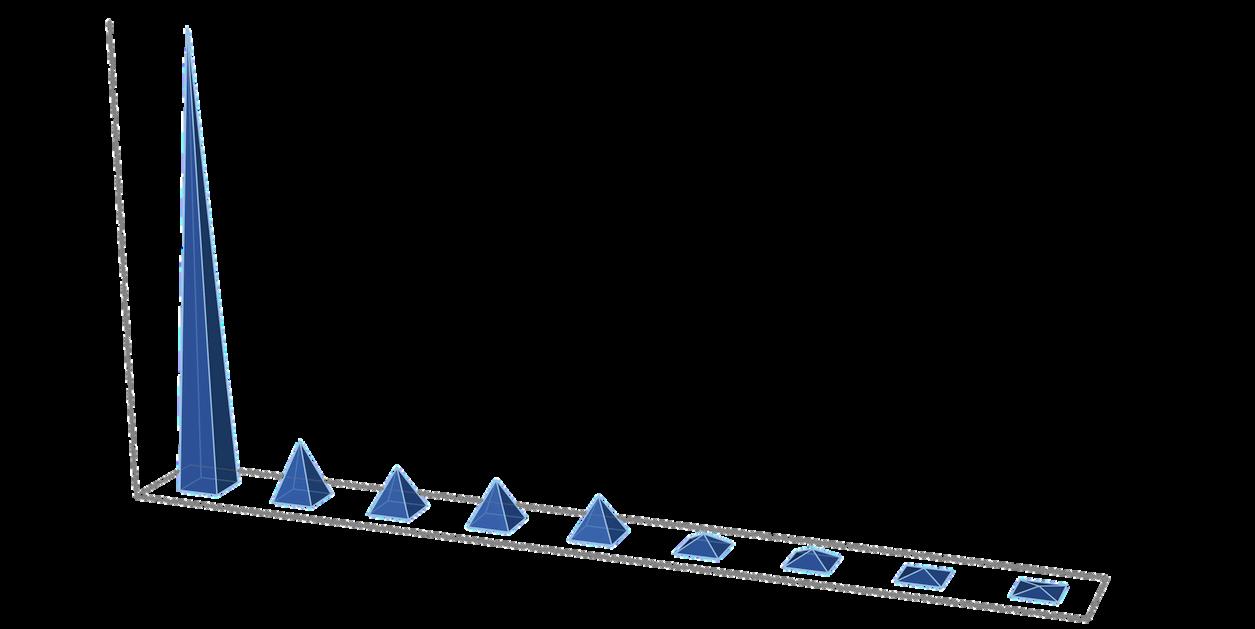
% Change in Monthly Number of Home Sales by Bay Area County, September 2025 Sales*
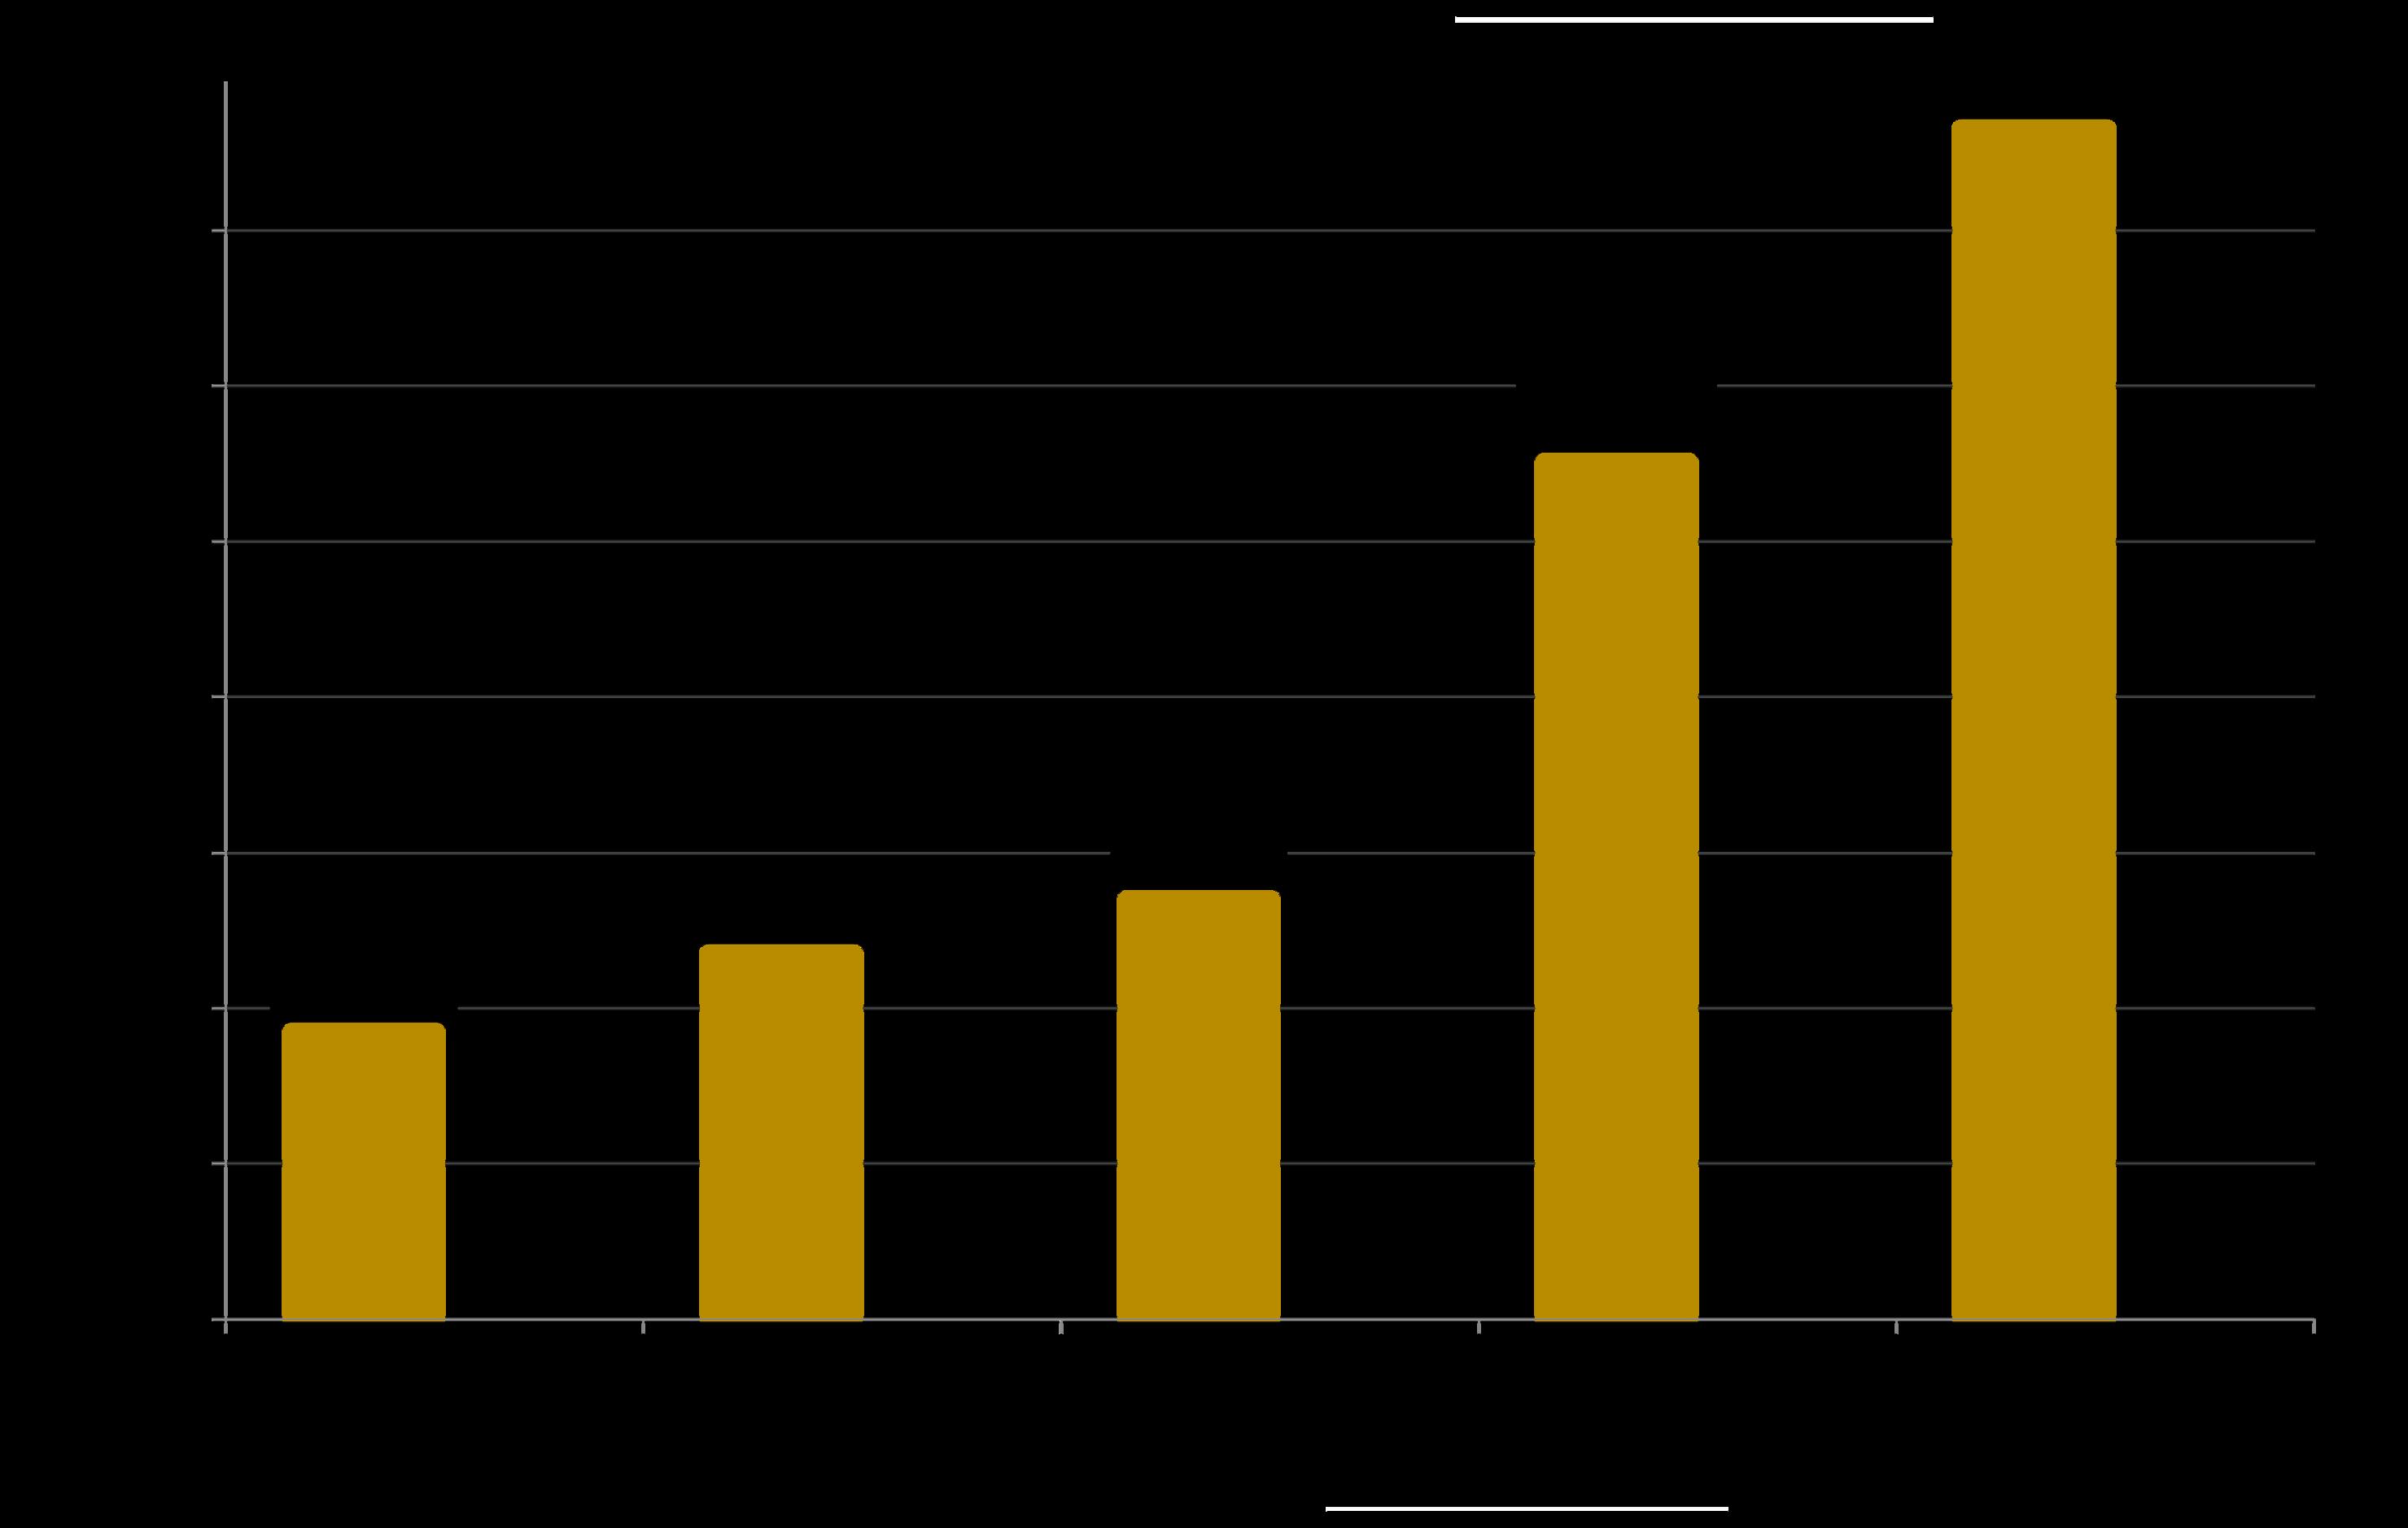
San Francisco Luxury Home Sales by Quarter
The market for luxury homes fluctuates by season, with spring (Q2) typically the most active market of the year.
Q3 2025 luxury home sales dropped back from Q2 –as is the usual seasonal trend – but were 37%
than in Q3 2024 to hit its highest Q3 count since 2021. (On a monthly basis, not illustrated here, September 2025 luxury home sales rose 55% year over year.)
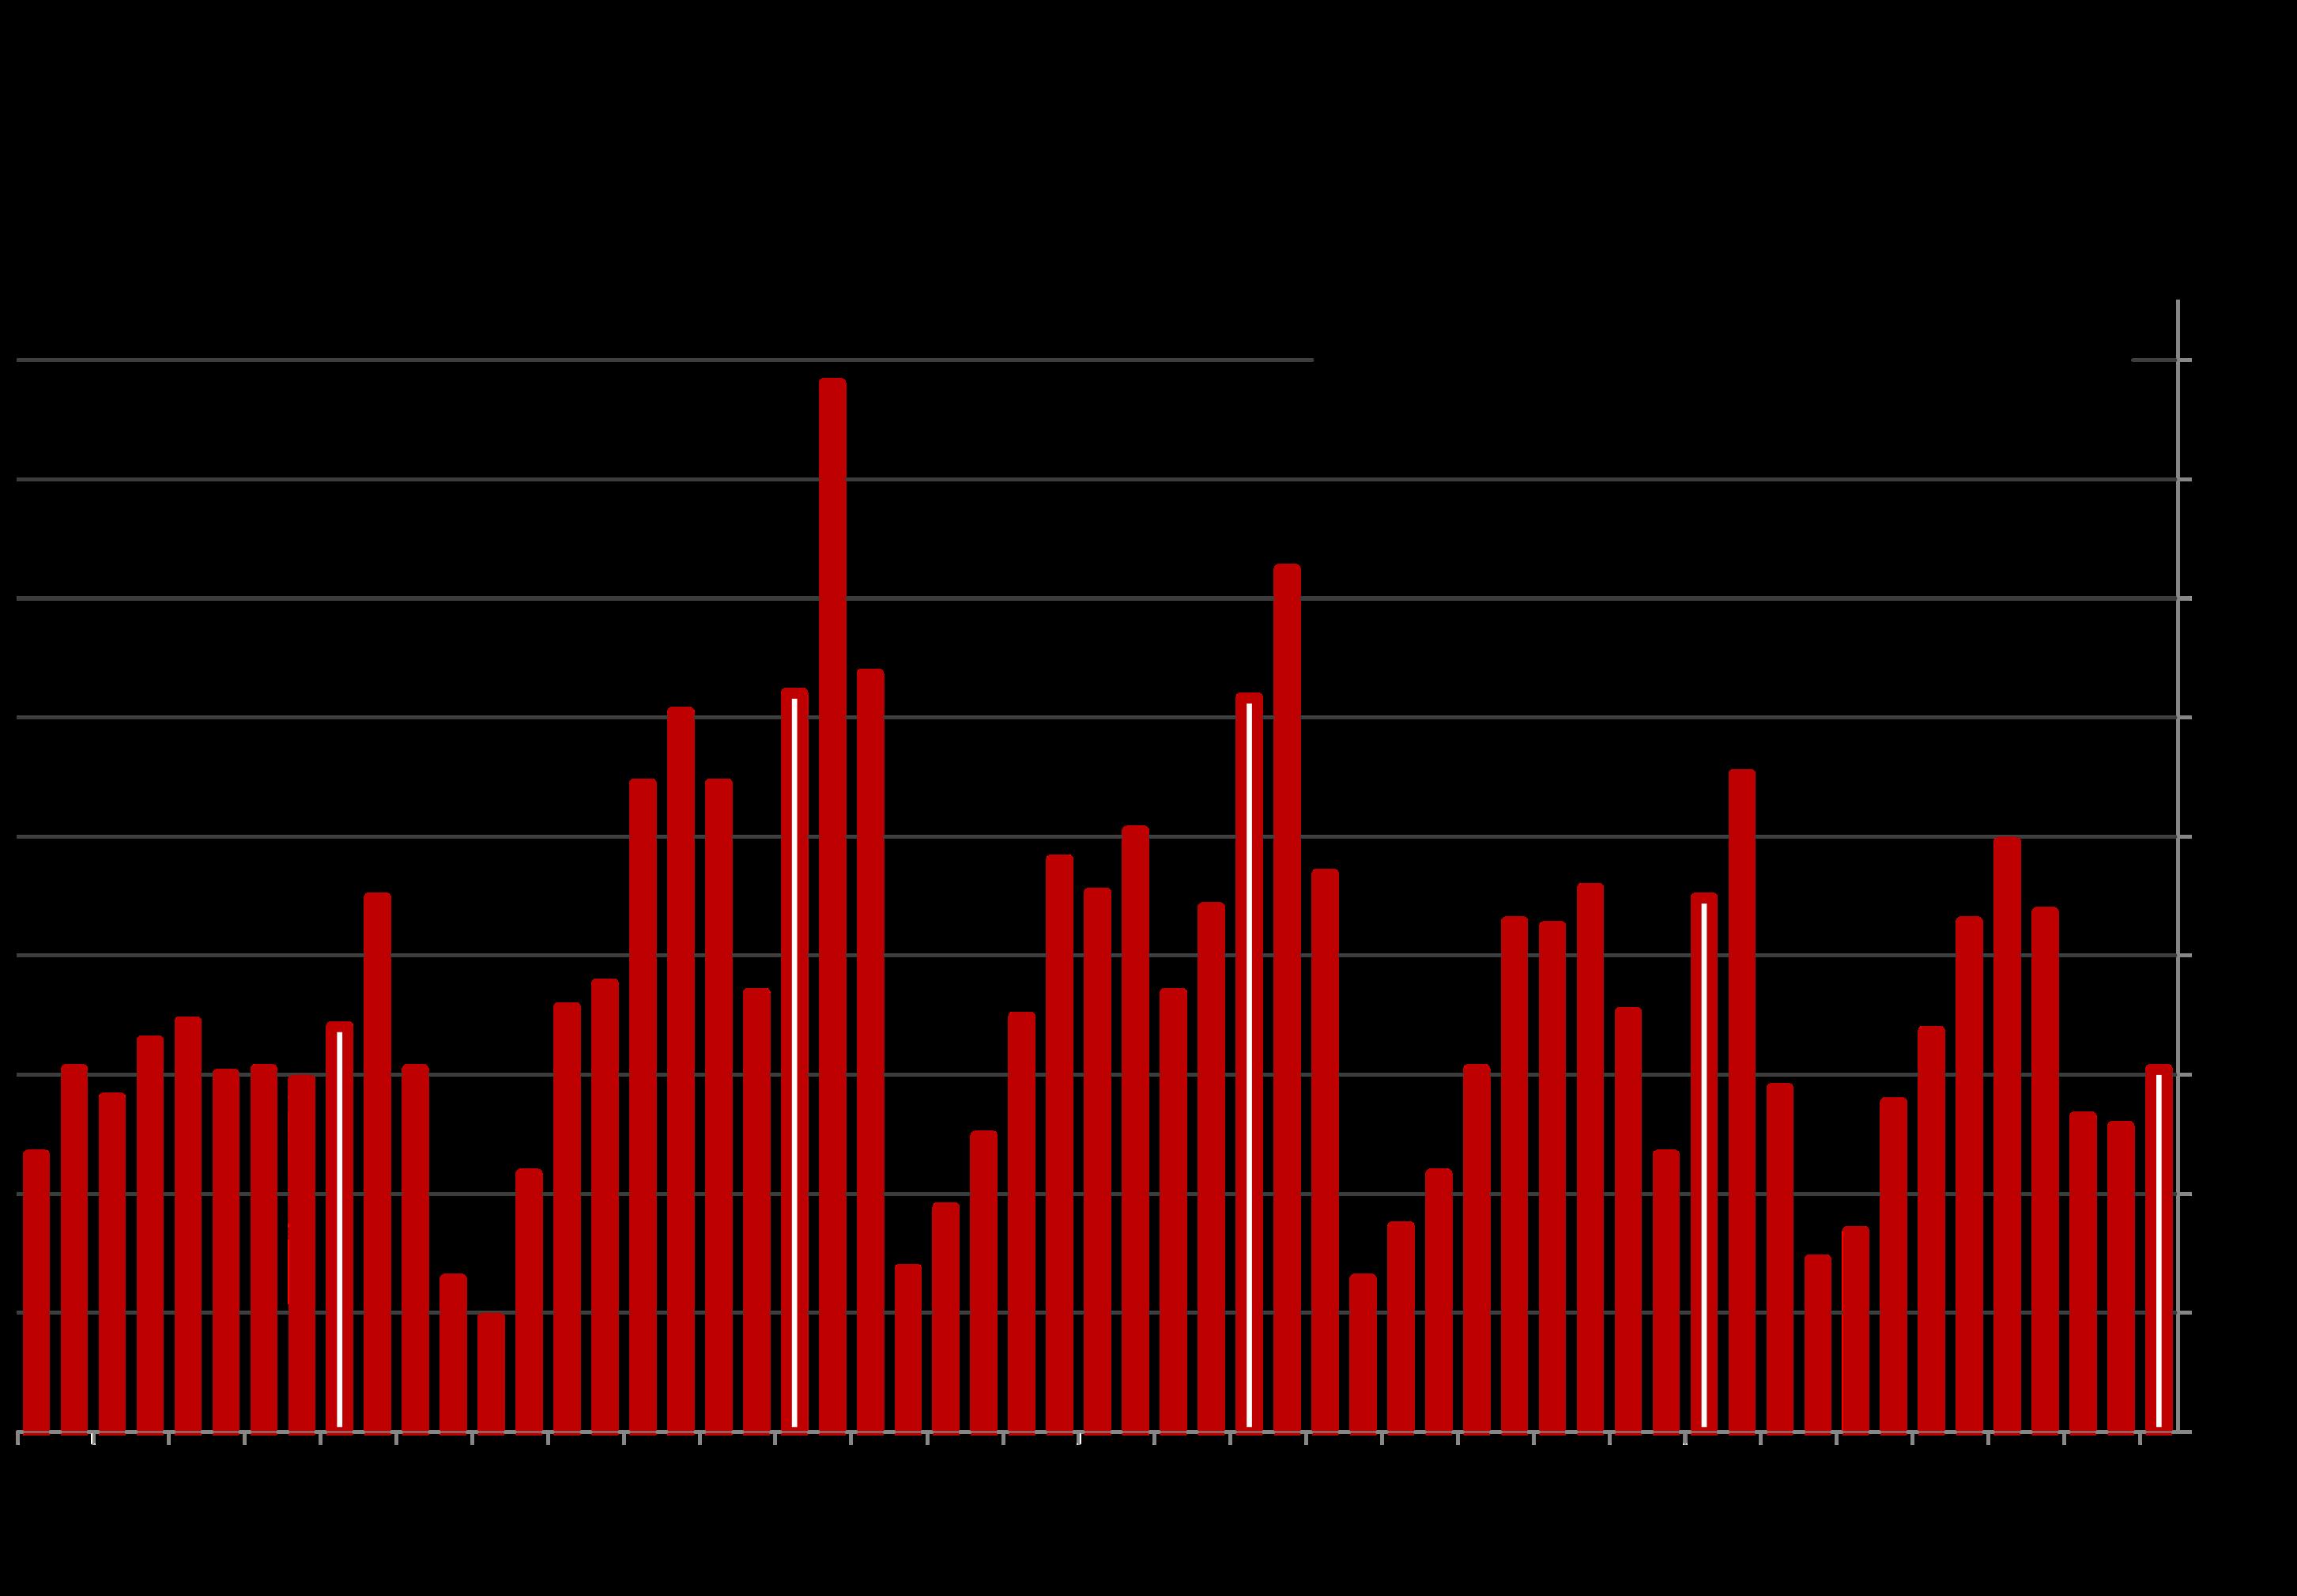
Price Reductions on Active Listings
San Francisco Market Dynamics & Seasonality
The number of price reductions typically ebbs and flows by season, but can also be affected by specific events in the economy and the market. In September 2025, price reductions declined 32% from September 2024 – to the lowest September count in 4+ years.
Percentage of Sales Over List Price
In Q3 2025, 72% of house sales and 31% of condo sales sold for over the list price. This chart illustrates the % for all home sales: 50%. (On a monthly basis, not illustrated
in
Avg. Sales Price to Original List Price Percentage
San Francisco Market Dynamics since 2018, by Quarter
100% signifies an average sales price at original list price. This metric can be distorted by underpricing strategies.
Over & Underbidding
Asking Price
Residential market activity reported to NORCAL MLS® ALLIANCE, per Infosparks. Data from sources deemed reliable, but may contain errors and subject to revision. Percentages rounded, all numbers are approximate, and may change with late-reported sales.
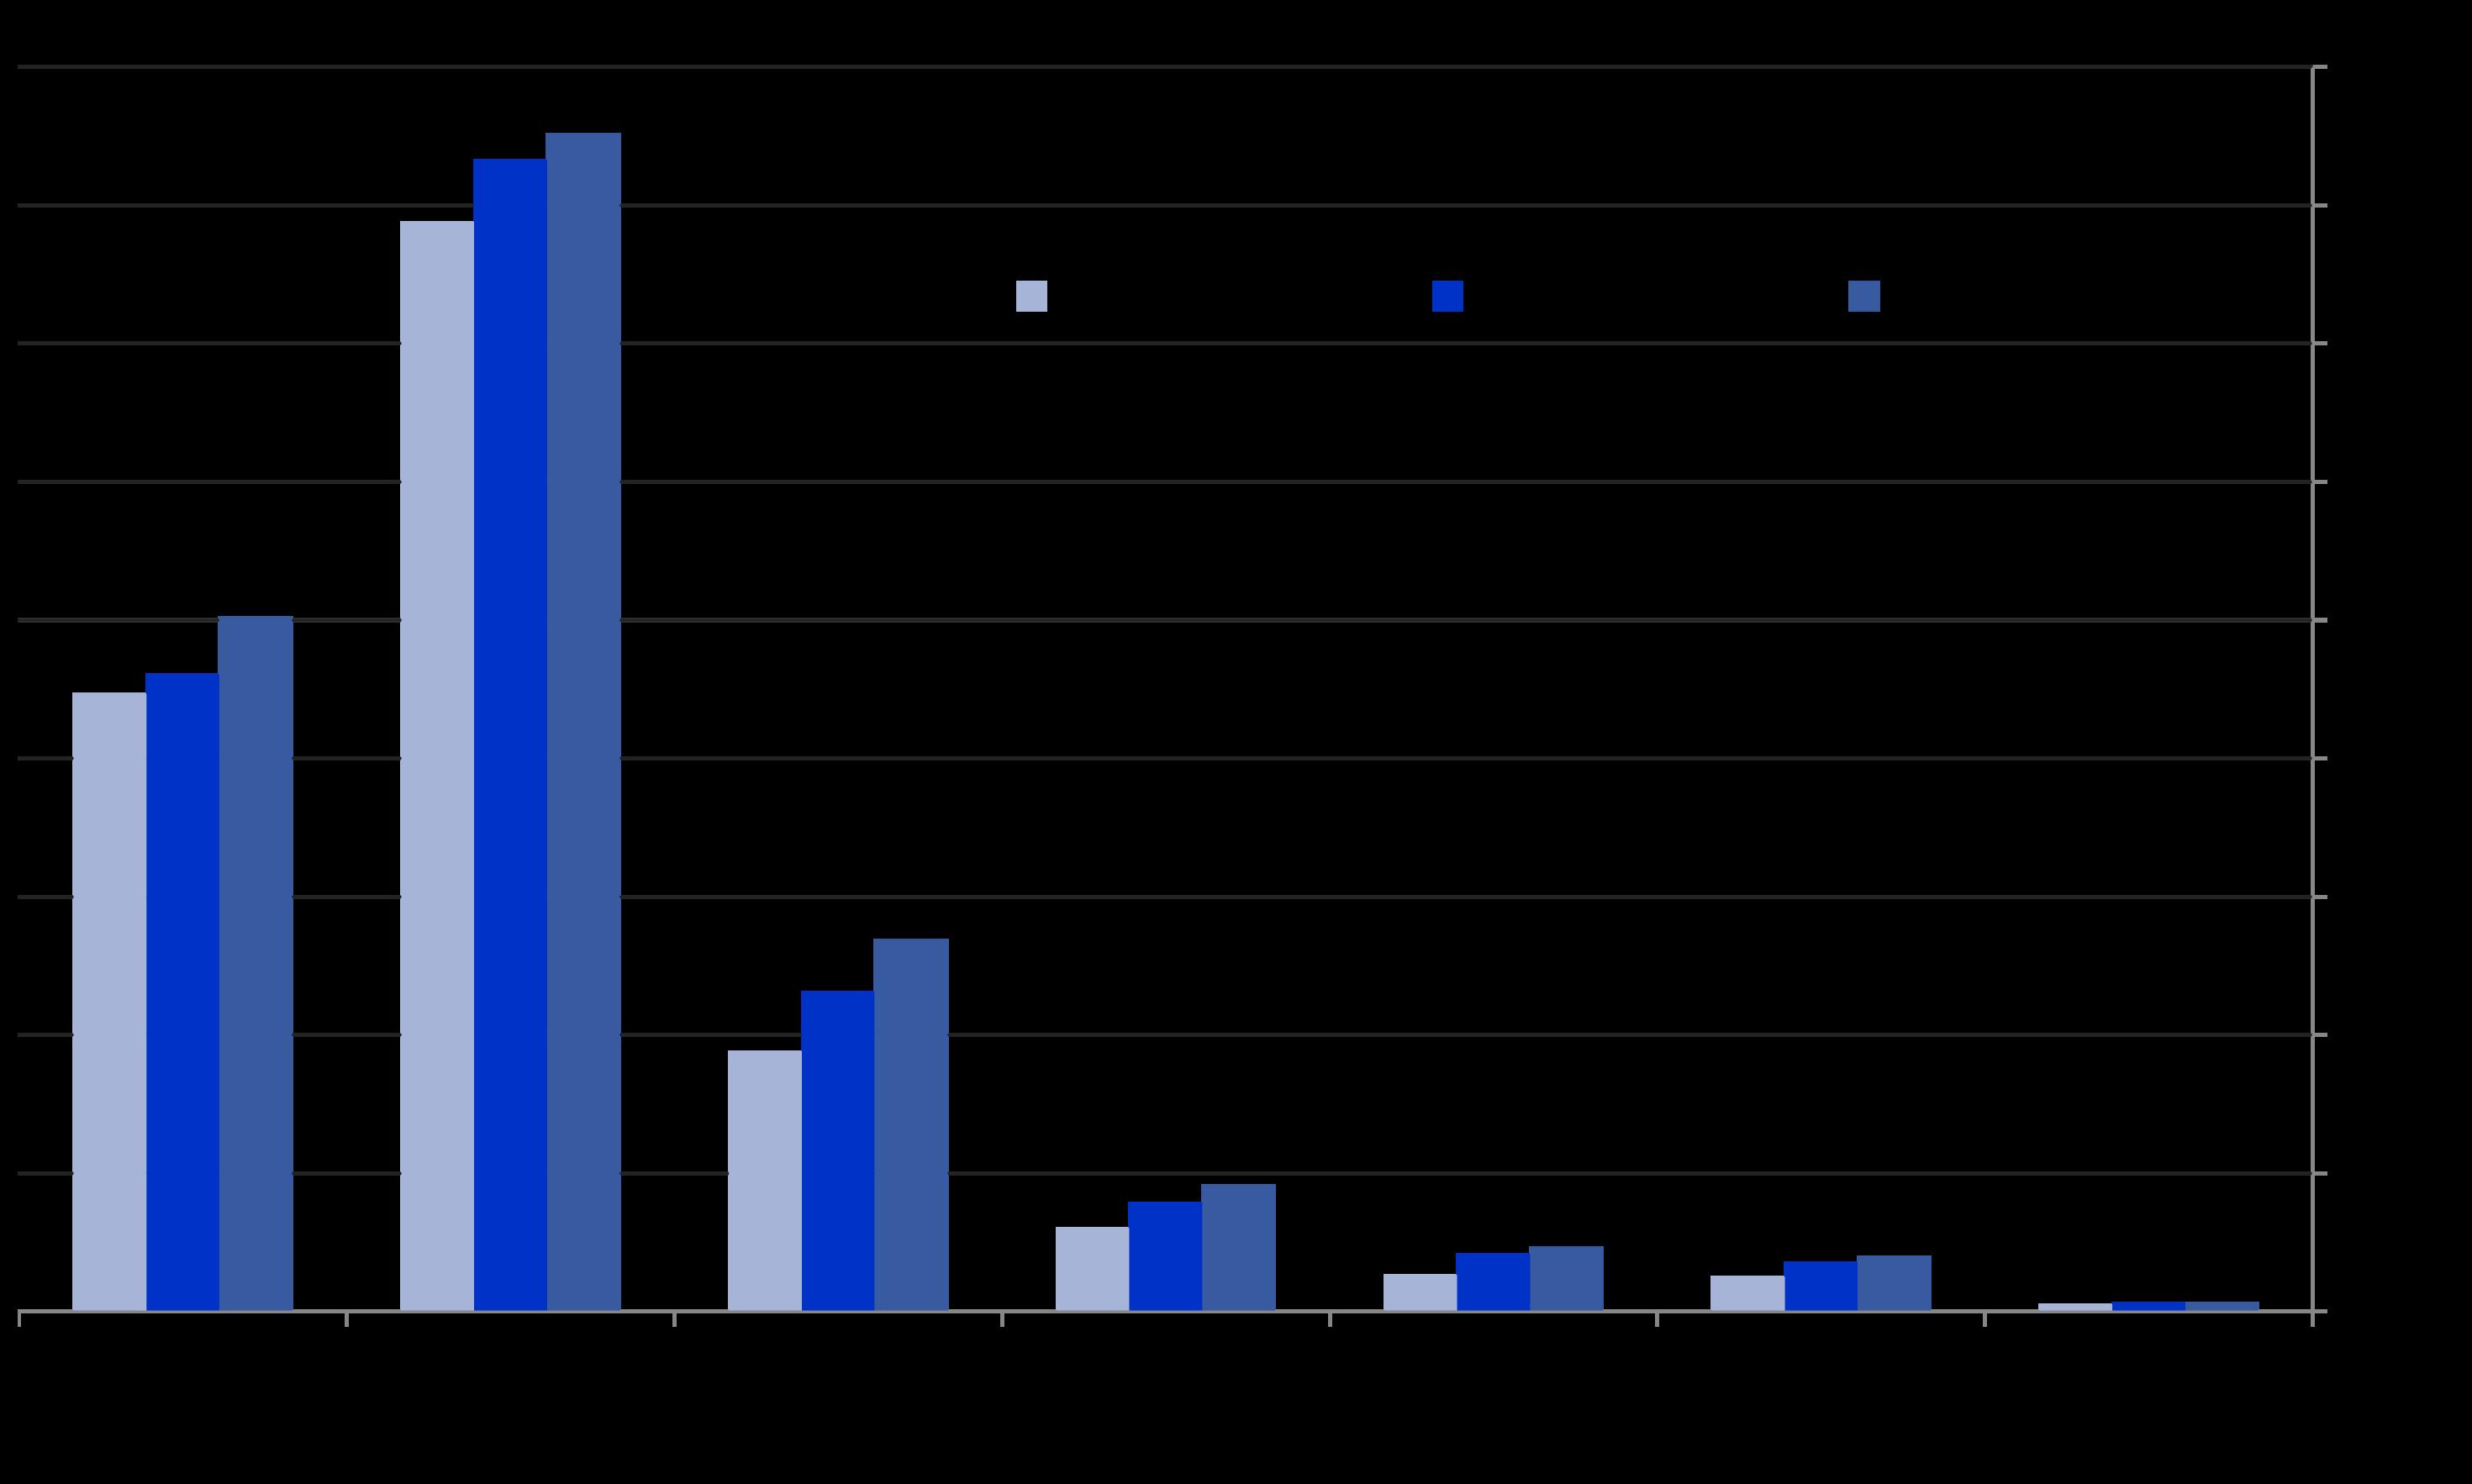
Median House Sales Prices & Year-over-Year % Change by Bay Area County, 2025 YTD Sales*
San Mateo
$2,000,000
Santa Clara Marin
$1,725,000
San Francisco
$1,700,000
Santa Cruz Alameda Monterey
$2,000,000 + 3.8% Napa
Contra Costa
$1,303,500
$1,295,000
House sales reported by 9/30/25*
Sonoma Solano
$846,000
$950,000 $949,000 $865,000 + 1% + 5.3% No change + 0.3% -1.1% No change -3.7% -1.1% No change -1.5%
Median price is that price at which half the sales occurred for more and half for less. It is a very general statistic that typically disguises an enormous range of sales prices in the individual underlying sales. It may fluctuate for reasons other than changes in fair market value. Median house sizes vary between counties, and counties contain submarkets ofwidelydifferent values. Howthese pricesapply toanyparticular home is unknown
$590,000
Sales reported to NorCal MLS Alliance in 2025 by September 30, 2025, per Infosparks. Data from sources deemed reliable, but may contain errors and subject to revision. Not all sales are reported to MLS. All numbers approximate and may change with late-reported sales. without a comparative market analysis.
Median House Dollar per Square Foot Value
by Bay Area County, 2025 YTD Sales*
San Mateo
$1,152
House sales reported by 9/30/25*
San Francisco Marin
$1,128
$1,014
$863
Santa Cruz Alameda Monterey Napa
Contra Costa
Santa Clara Sonoma
$747
$744
$594 $592 $522
Solano
$511 $346
Dollar per square foot is calculated on interior livable space and does not include garages, attics, basements, storage rooms, rooms built without permit, patios, decks or lot size. Values are affected by location, age, quality of construction, condition, architectural style, home size, lot size, views, parking, amenities and many other factors. Counties contain submarkets of widely different values, and how these values apply to any particular home is unknown without a specific comparative market analysis.
Sales reported to NorCal MLS Alliance in 2025 by September 30, 2025, per Infosparks. Data from sources deemed reliable, but may contain errors and subject to revision. Not all sales are reported to MLS. All numbers approximate and may change with late-reported sales.
Median 2-Bedroom Condo Sales Prices
by Bay Area County, 2025 YTD Sales*
San Francisco
$1,240,000
San Mateo
$875,000
Monterey
$835,500
Santa Clara Santa Cruz Marin
$760,000
Alameda
$729,000
Contra Costa
$675,000
Sonoma Solano
$595,500 $501,000 $421,000
Condo sales reported by 9/30/25*
Median price is that price at which half the sales occurred for more and half for less. It is a very general statistic that typically disguises an enormous range of sales prices in the individual underlying sales. It may fluctuate for reasons other than changes in fair market value. Median condo sizes vary between counties, and counties contain submarkets of widely different values.
$340,000
Sales reported to NorCal MLS Alliance in 2025 by September 30, 2025, per Infosparks. Data from sources deemed reliable, but may contain errors and subject to revision. Not all sales are reported to MLS. All numbers approximate and may change with late-reported sales.
Per Freddie Mac (FHLMC), on October 2, 2025 the weekly average, 30-year, conforming-loan interest rate rose slightly to 6.34%.
*Freddie Mac (FHLMC), 30-Year Fixed Rate Mortgage Weekly Average: https://www.freddiemac.com/pmms. Data from sources deemed reliable. Different sources of mortgage data sometimes vary in their determinations of daily and weekly rates. Data from sources deemed reliable but may contain errors. All numbers approximate.
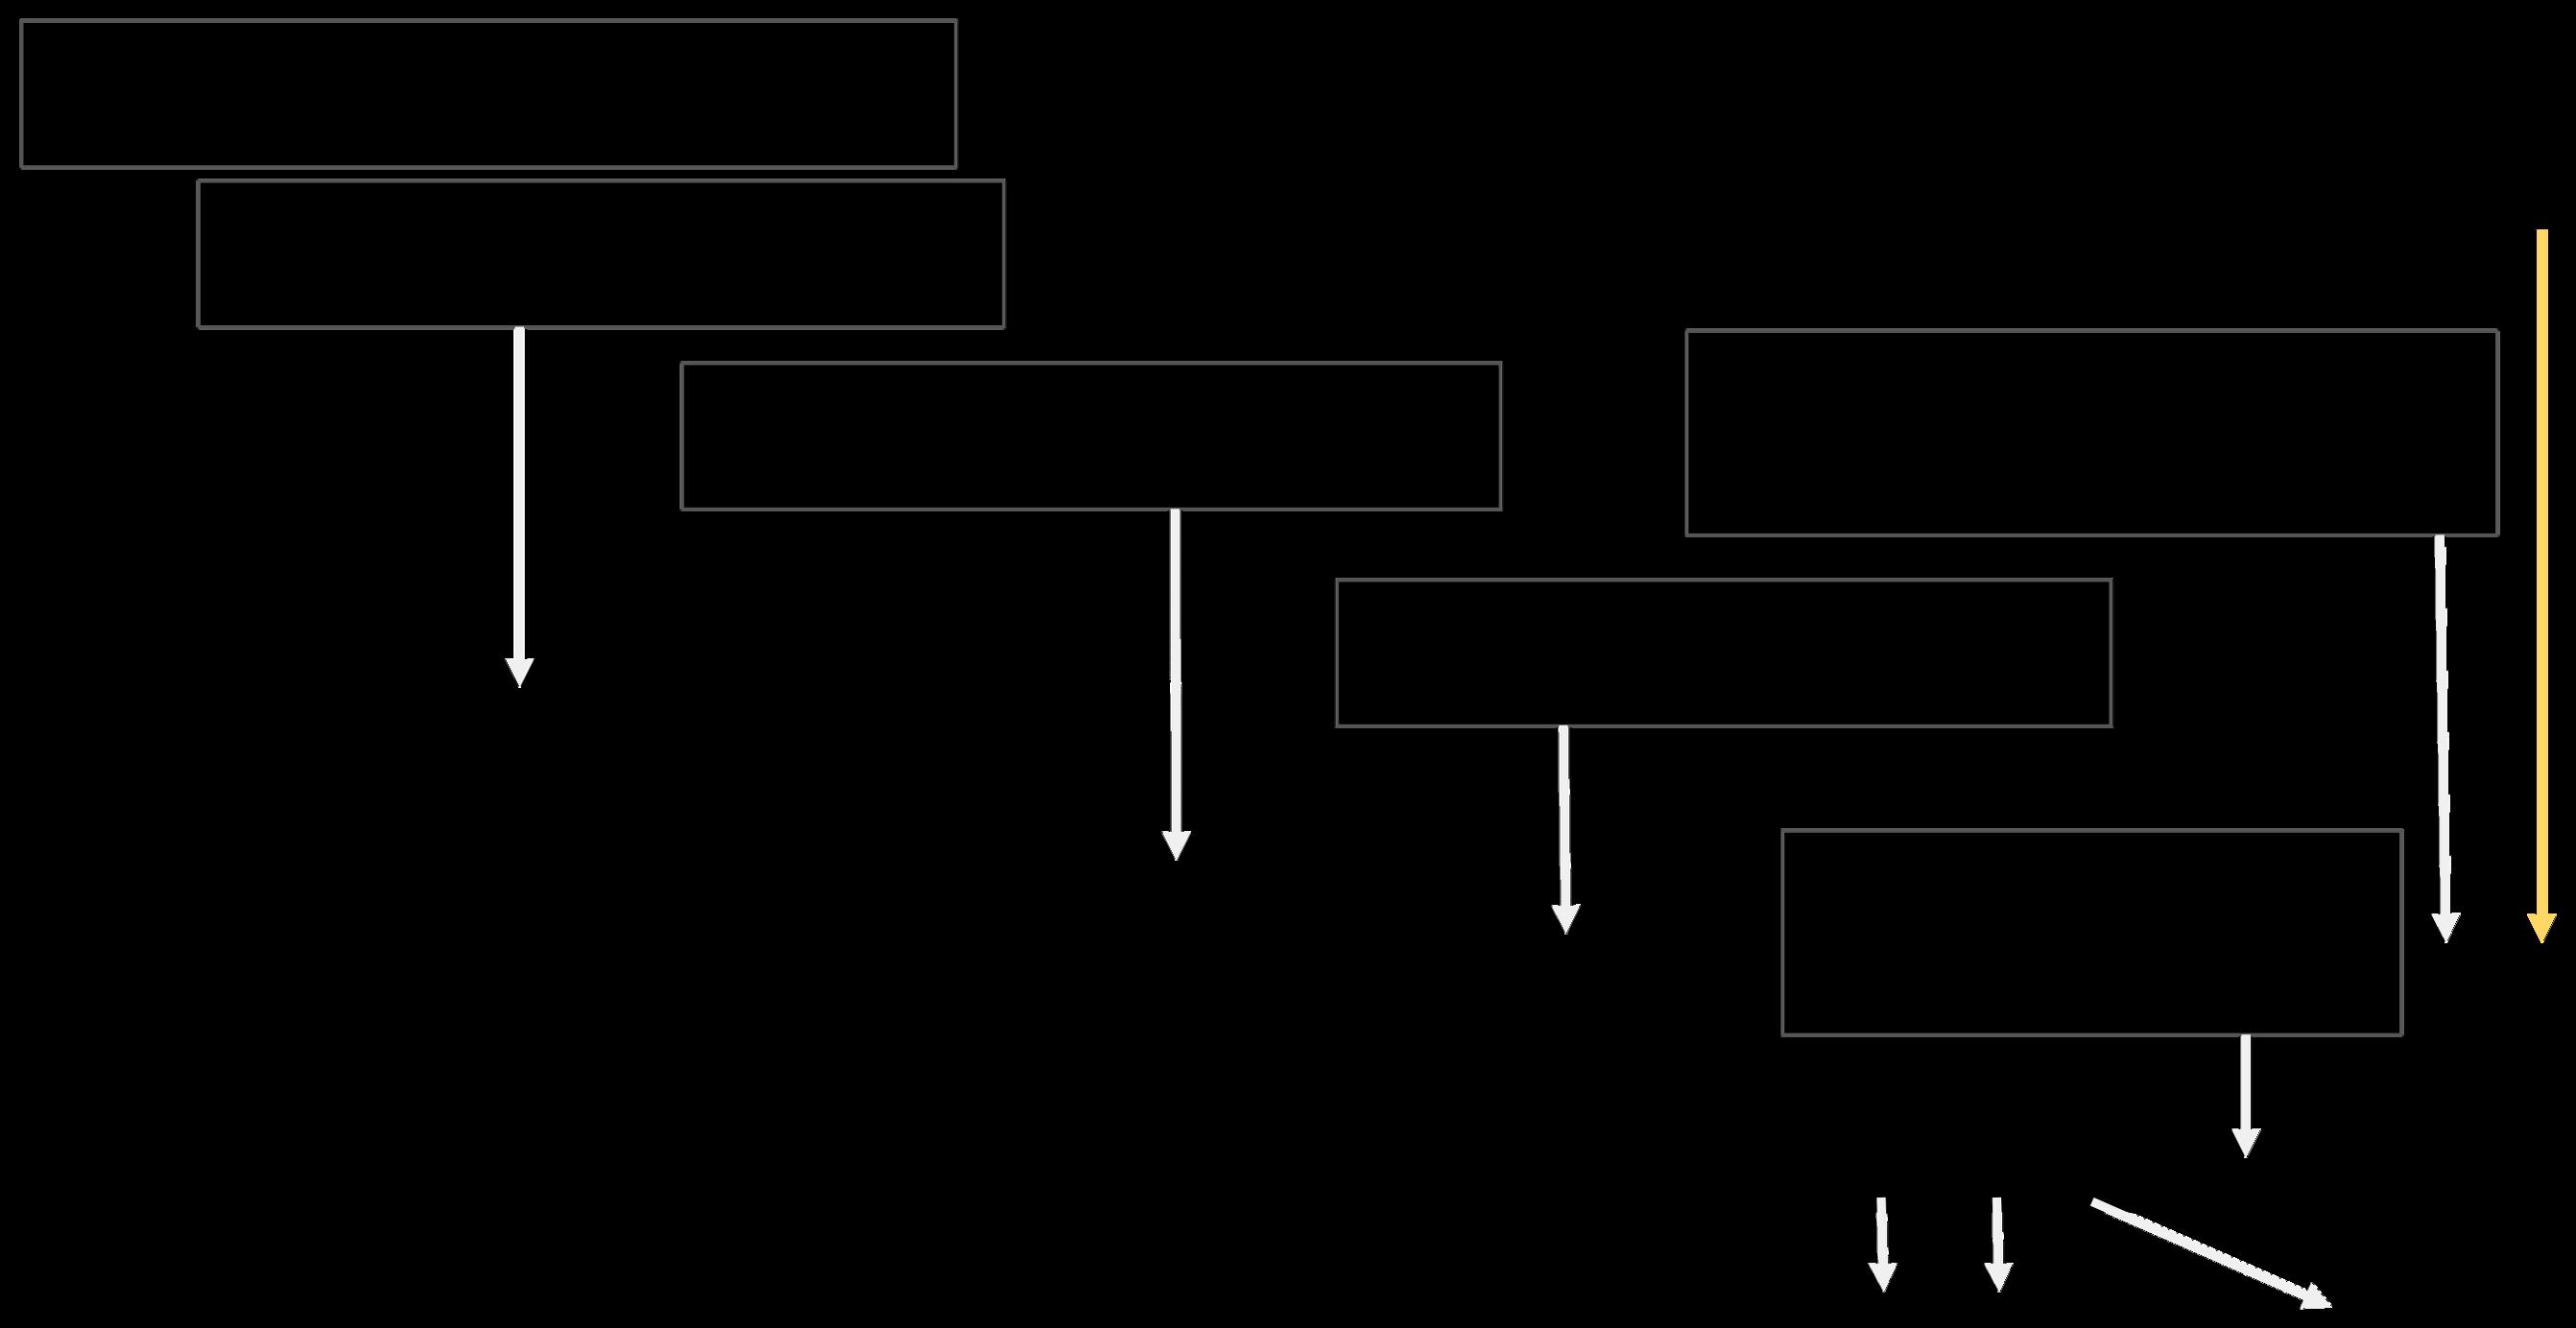
Federal Funds Interest Rate since 1981
& Economic Interventions by Federal Reserve Bank*
Updated September 17, 2025
◄ Early 1980’s: Fed aggressively raises fed funds target rate to lower inflation rate
In September 2024, the Fed reduced the rate by a half point, and then by a quarter point in November and December. This past September, the rate was reduced for the first time in 2025 by another quarter point. Further cuts are expected.
2022/2023/2024: Acting to counter inflation, Fed increases target rate 11 times, then pauses 8/2023 – 8/2024
Subprime crash: Fed drops rate 10 times to effectively zero in 2007-08 boom
2019, 2020, 2021: With the pandemic, the Fed drops the rate to effectively zero High-tech &
Subprime pandemic booms
* Per Federal Reserve Bank of St. Louis and New York; https://fred.stlouisfed.org/series/FEDFUNDS; Last reading per https://www.newyorkfed.org/markets/reference-rates/effr. Other data referenced from sources deemed reliable but may contain errors and subject to revision.
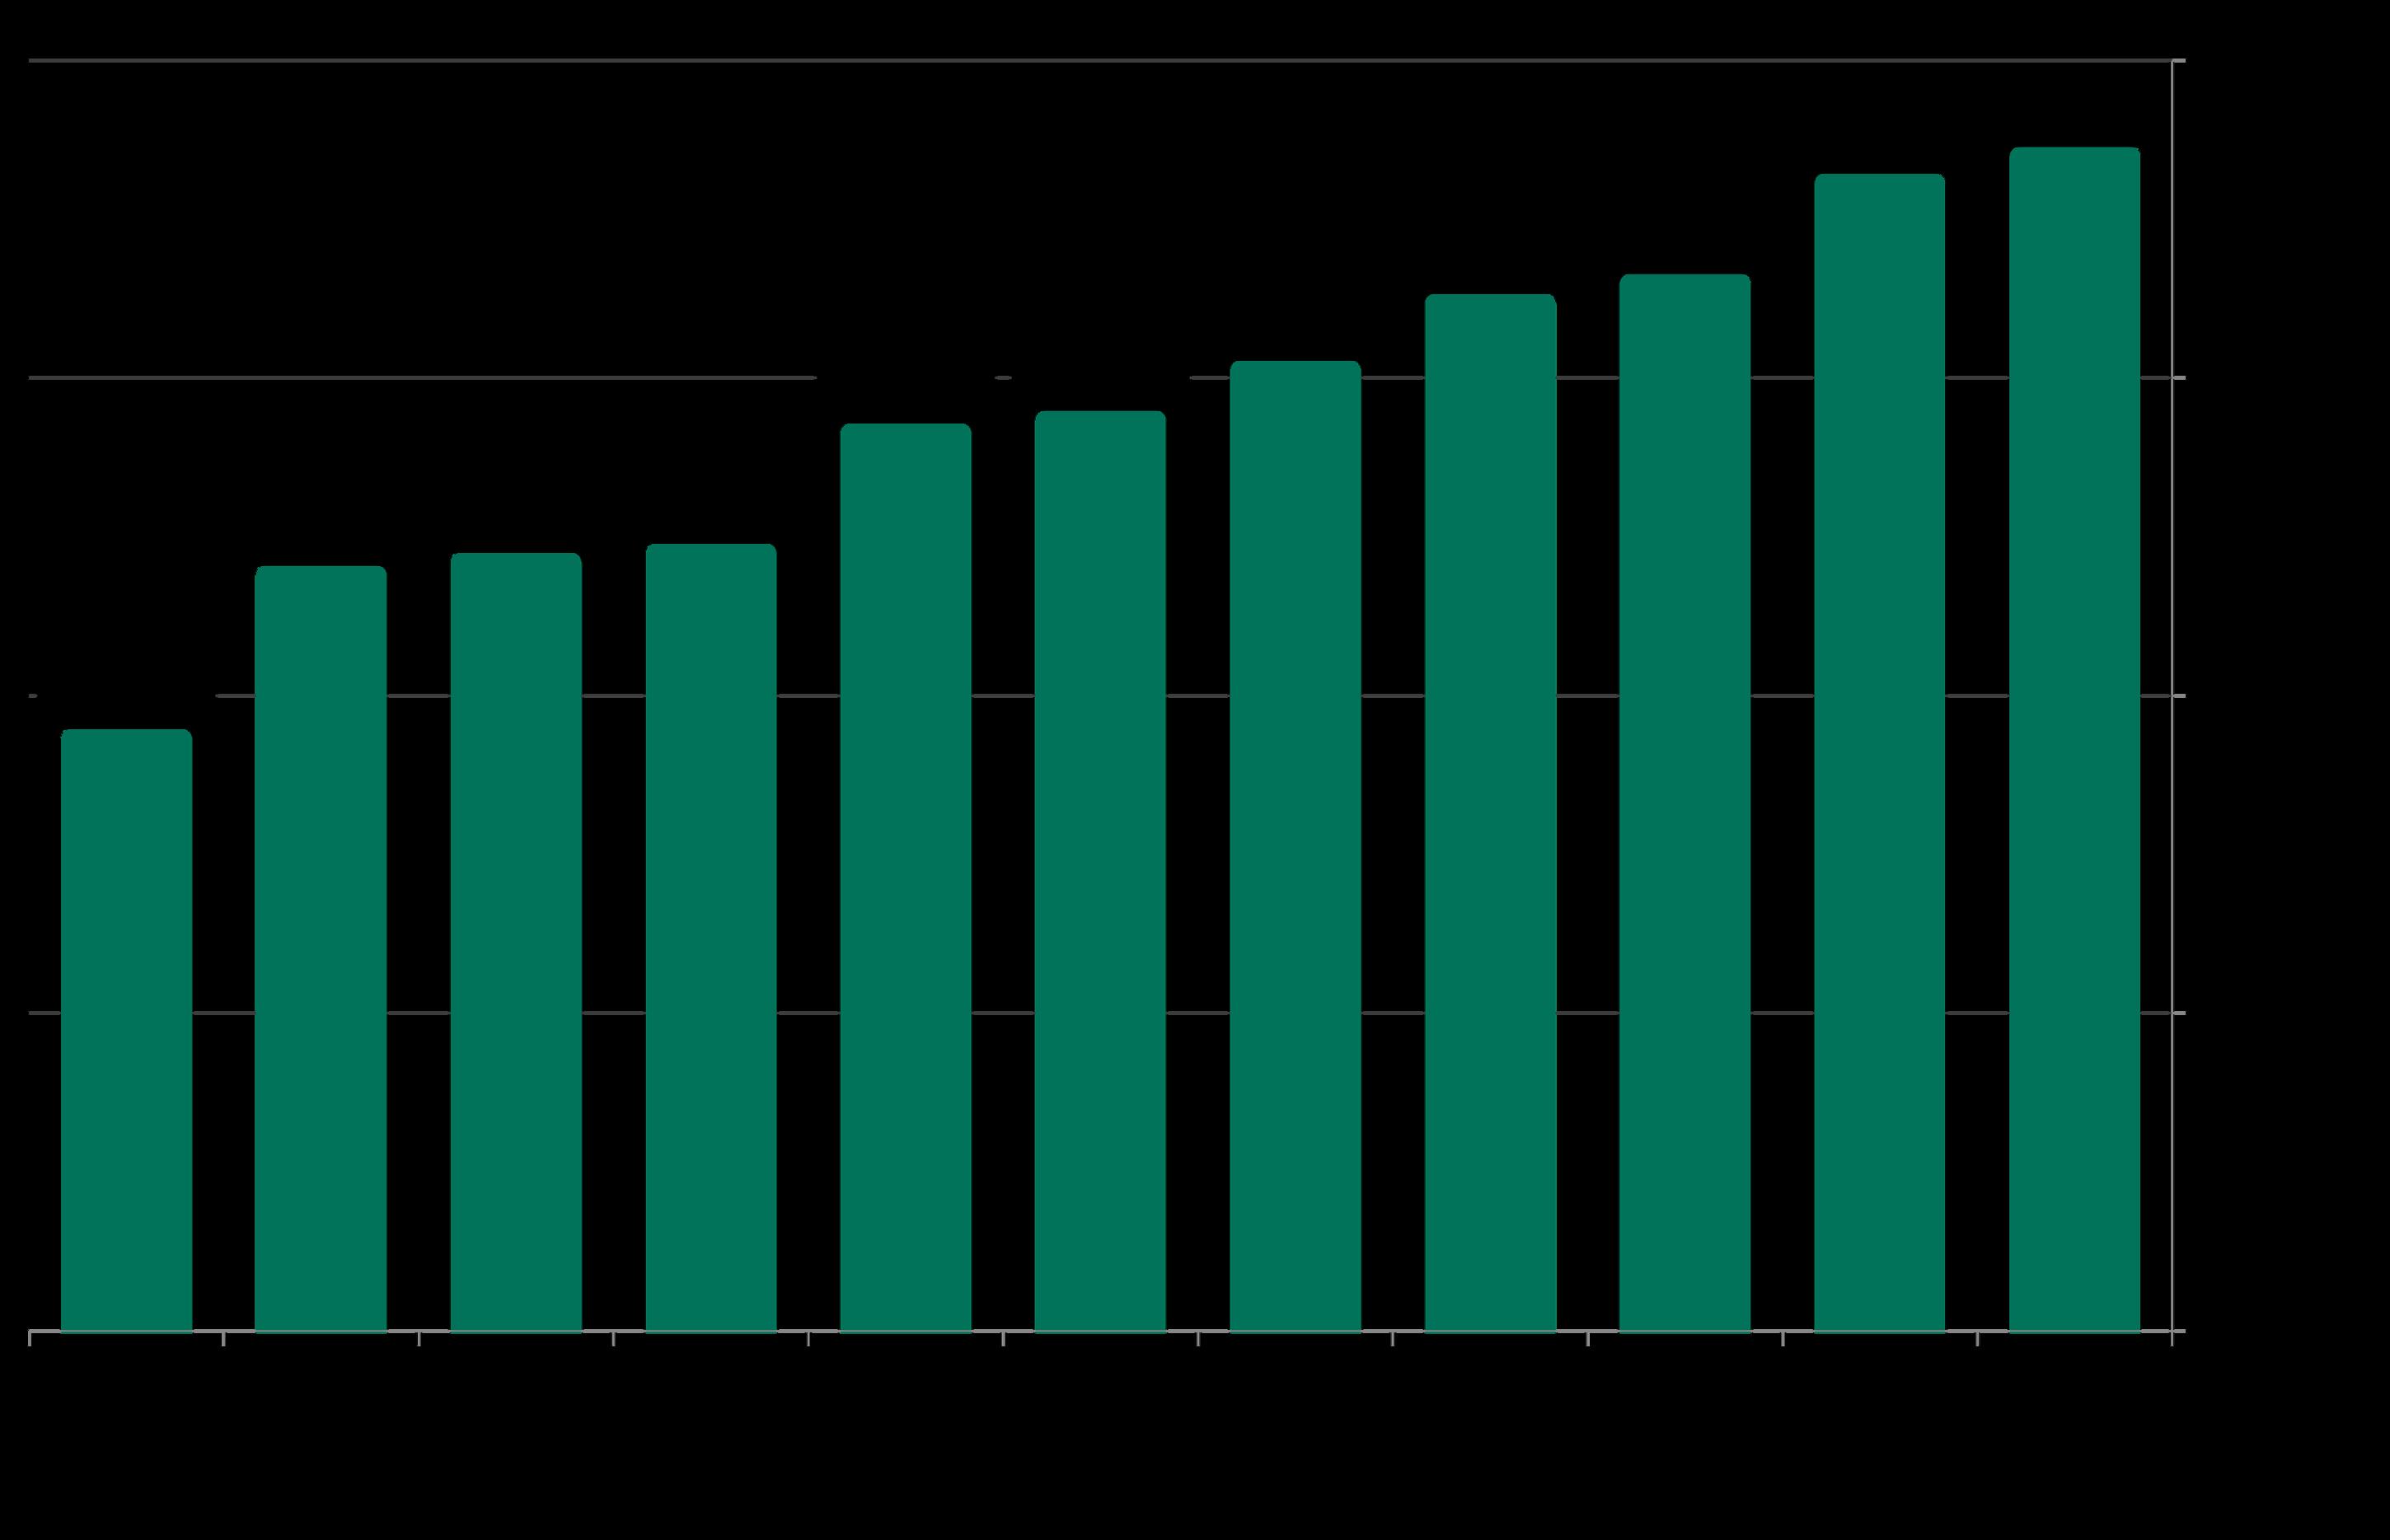
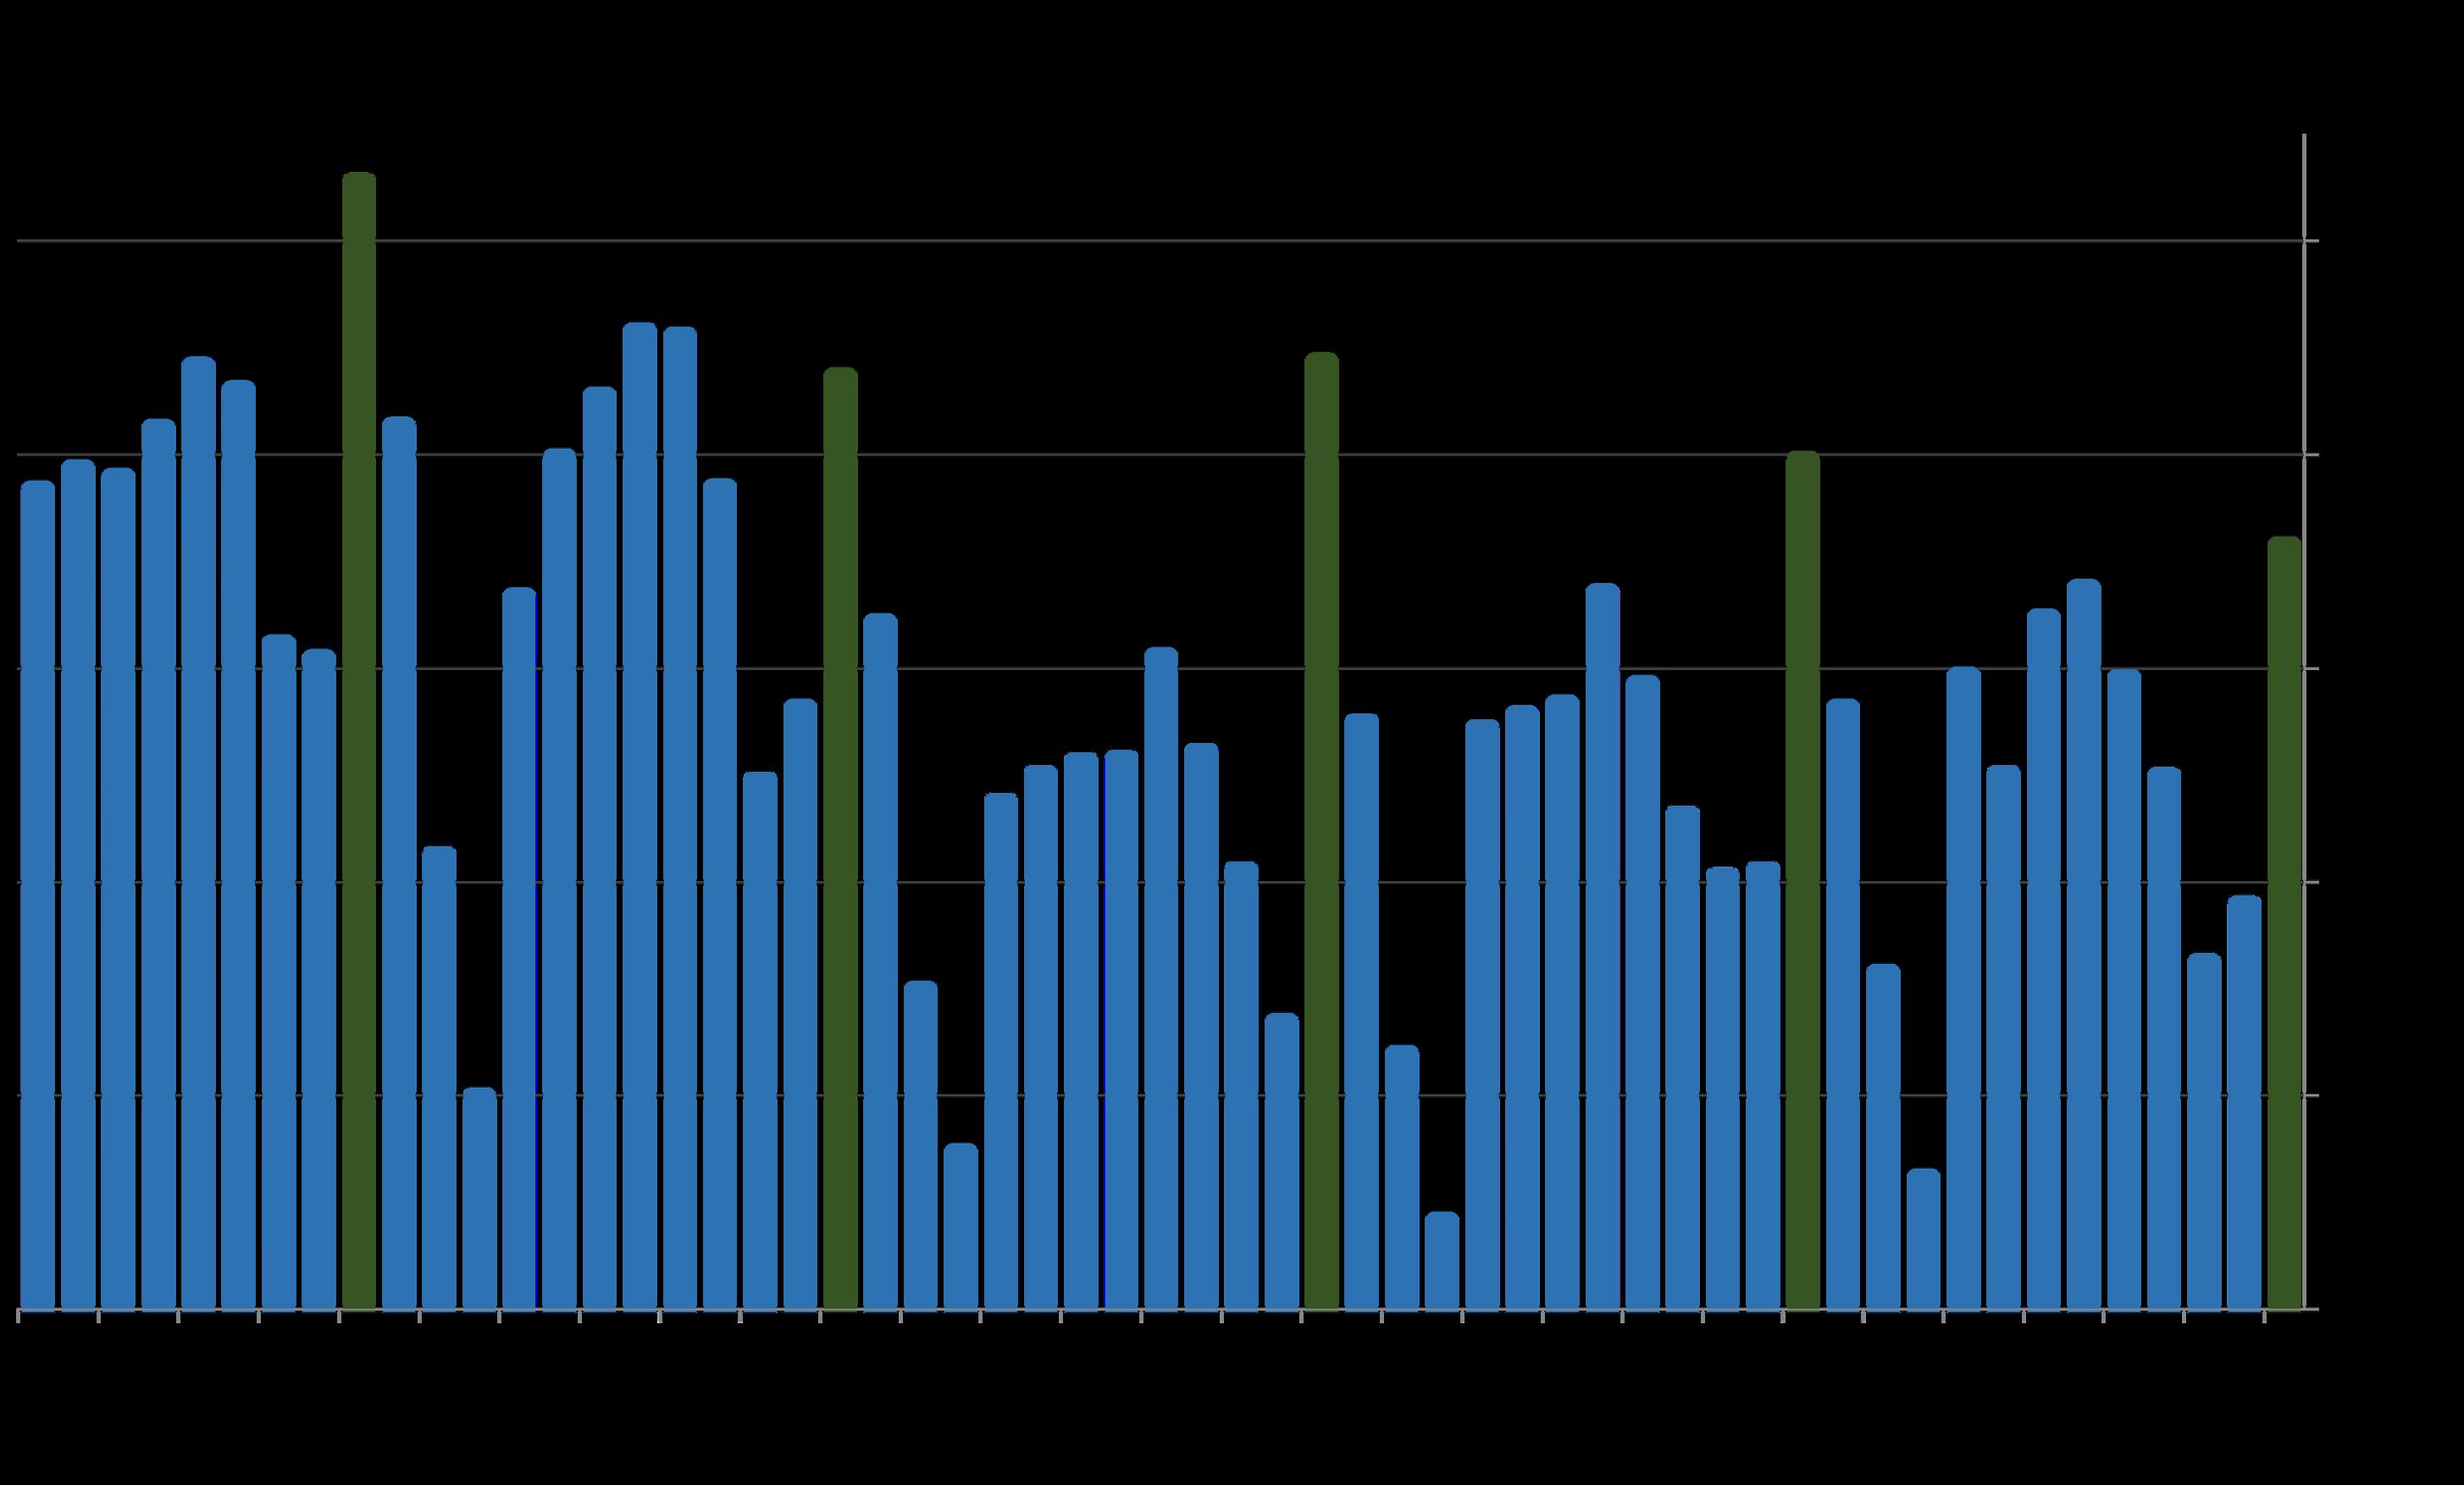
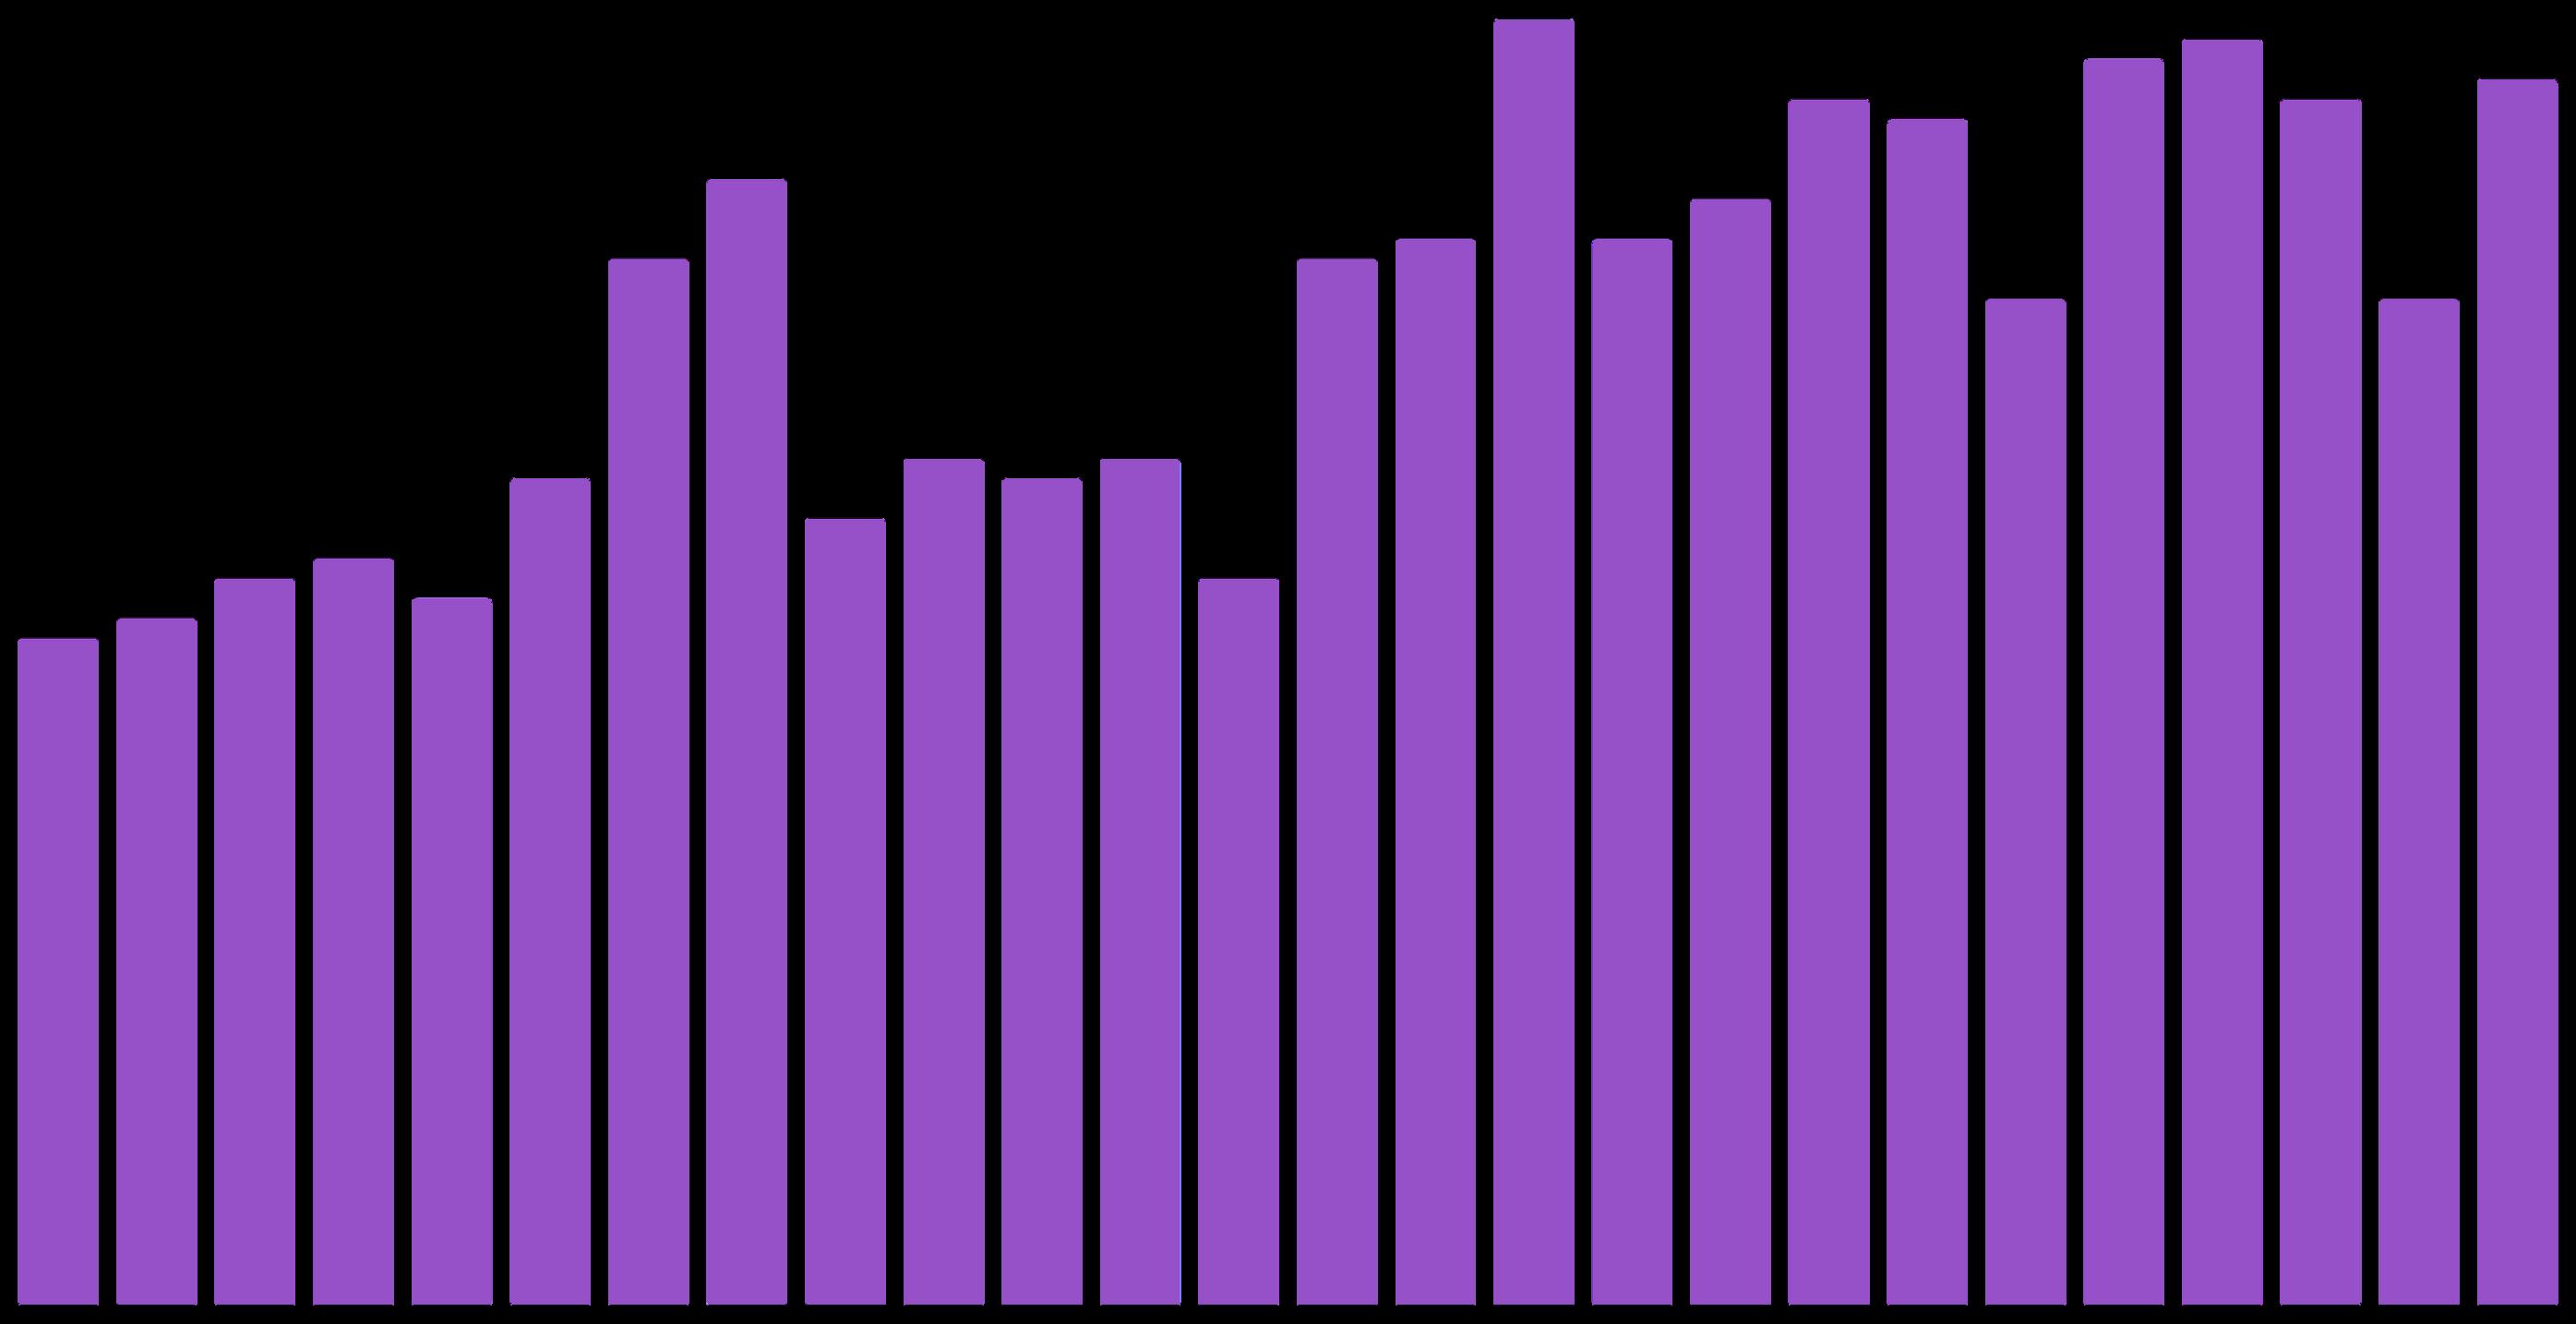
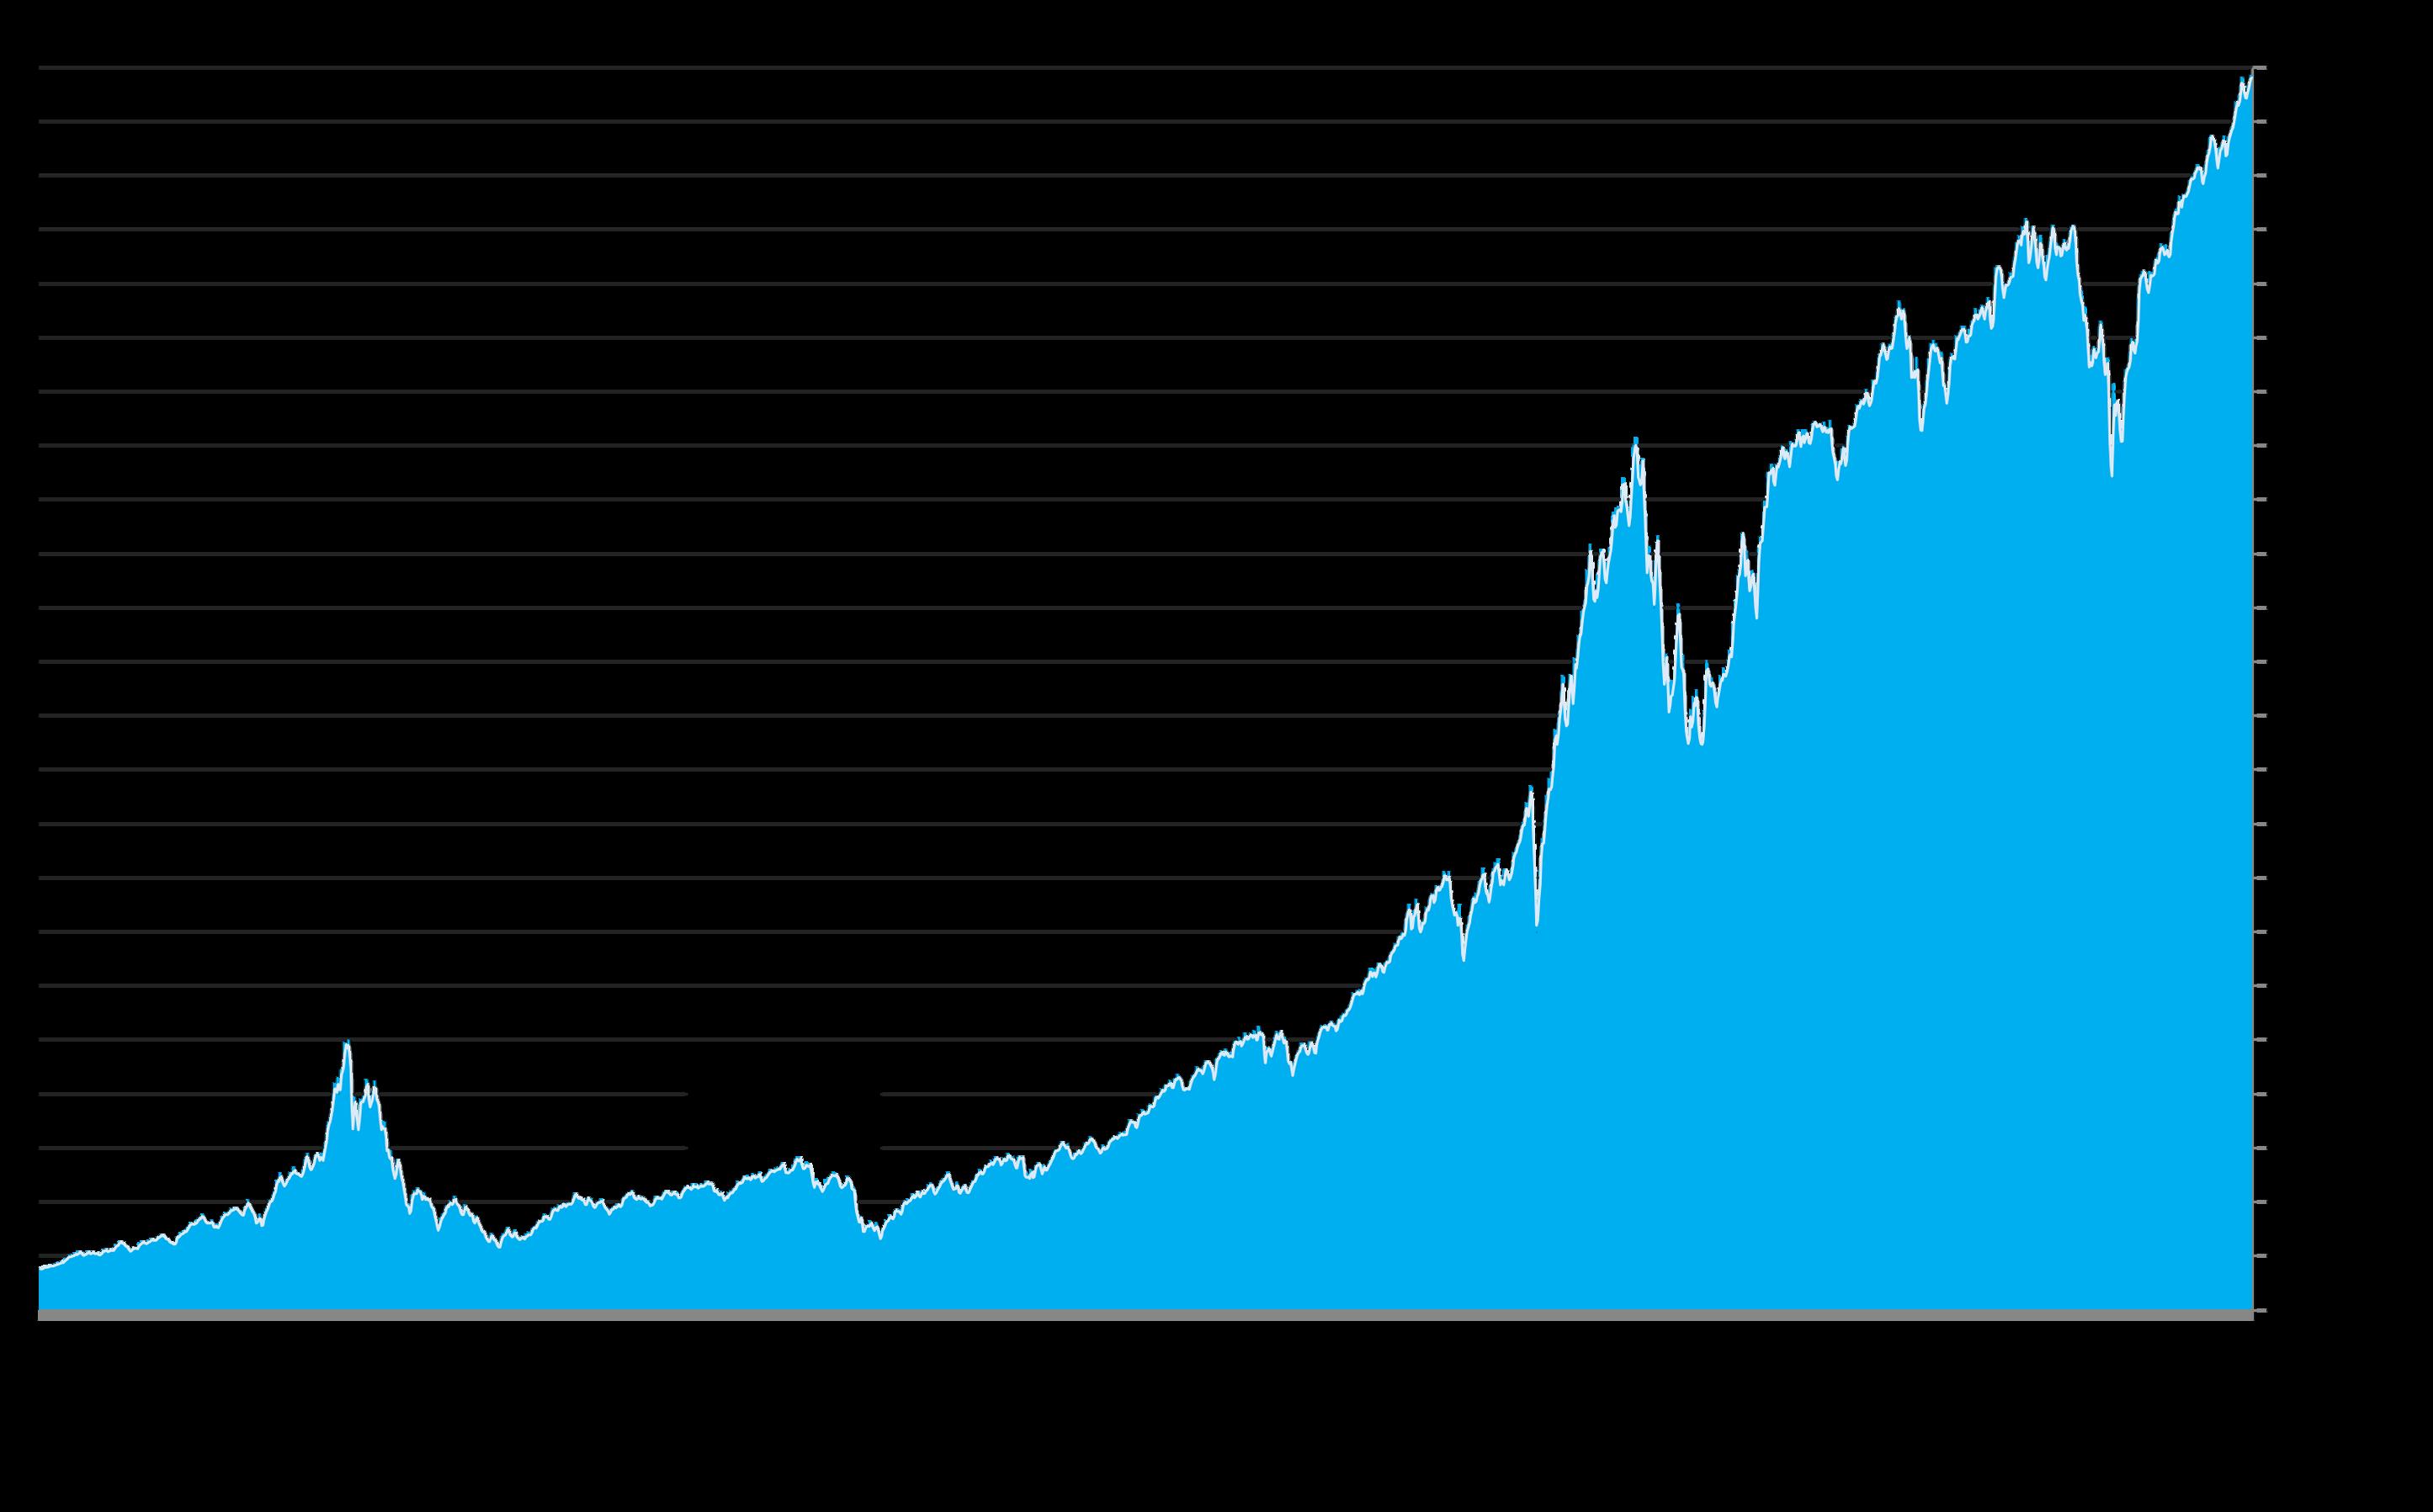
Nasdaq Composite Index
23,000
“The Nasdaq Composite Index is a market capitalizationweighted index of more than 2,500 stocks listed on the Nasdaq stock exchange. It is a broad index that is heavily weighted toward the important technology sector.” Investopedia.com
The Nasdaq hit a new all-time high in early October
2025. The S&P 500 Index, not illustrated here, also hit a new peak. Changes in stock market values have a large impact on housing markets, especially more affluent, higher price segments.
Per https://fred.stlouisfed.org/series/NASDAQCOM. Because of number of data points, not every week has a separate column. Data from sources deemed reliable but may contain errors and subject to revision. For general illustration purposes only.
Inflation: Consumer Price Index (CPI), Year-over-Year Percentage Change, by Month 2021 – 2025 YTD*
The general “CPI-All Items” inflation reading for August 2025 rose to 2.9%. “Core CPI” (all
3.1%.*
CPI - All Items
not illustrated
The “target inflation rate” for the Federal Reserve Bank is 2%.
*Consumer Price Index for All Urban Consumers: All Items in U.S. City Average [CPIAUCSL], per Federal Reserve Bank of St. Louis; https://fred.stlouisfed.org/graph/?g=8dGq. Data from U.S. Bureau of Labor Statistics. CPIAUCSL is a price index of a basket of goods and services paid by urban consumers. This index includes roughly 88
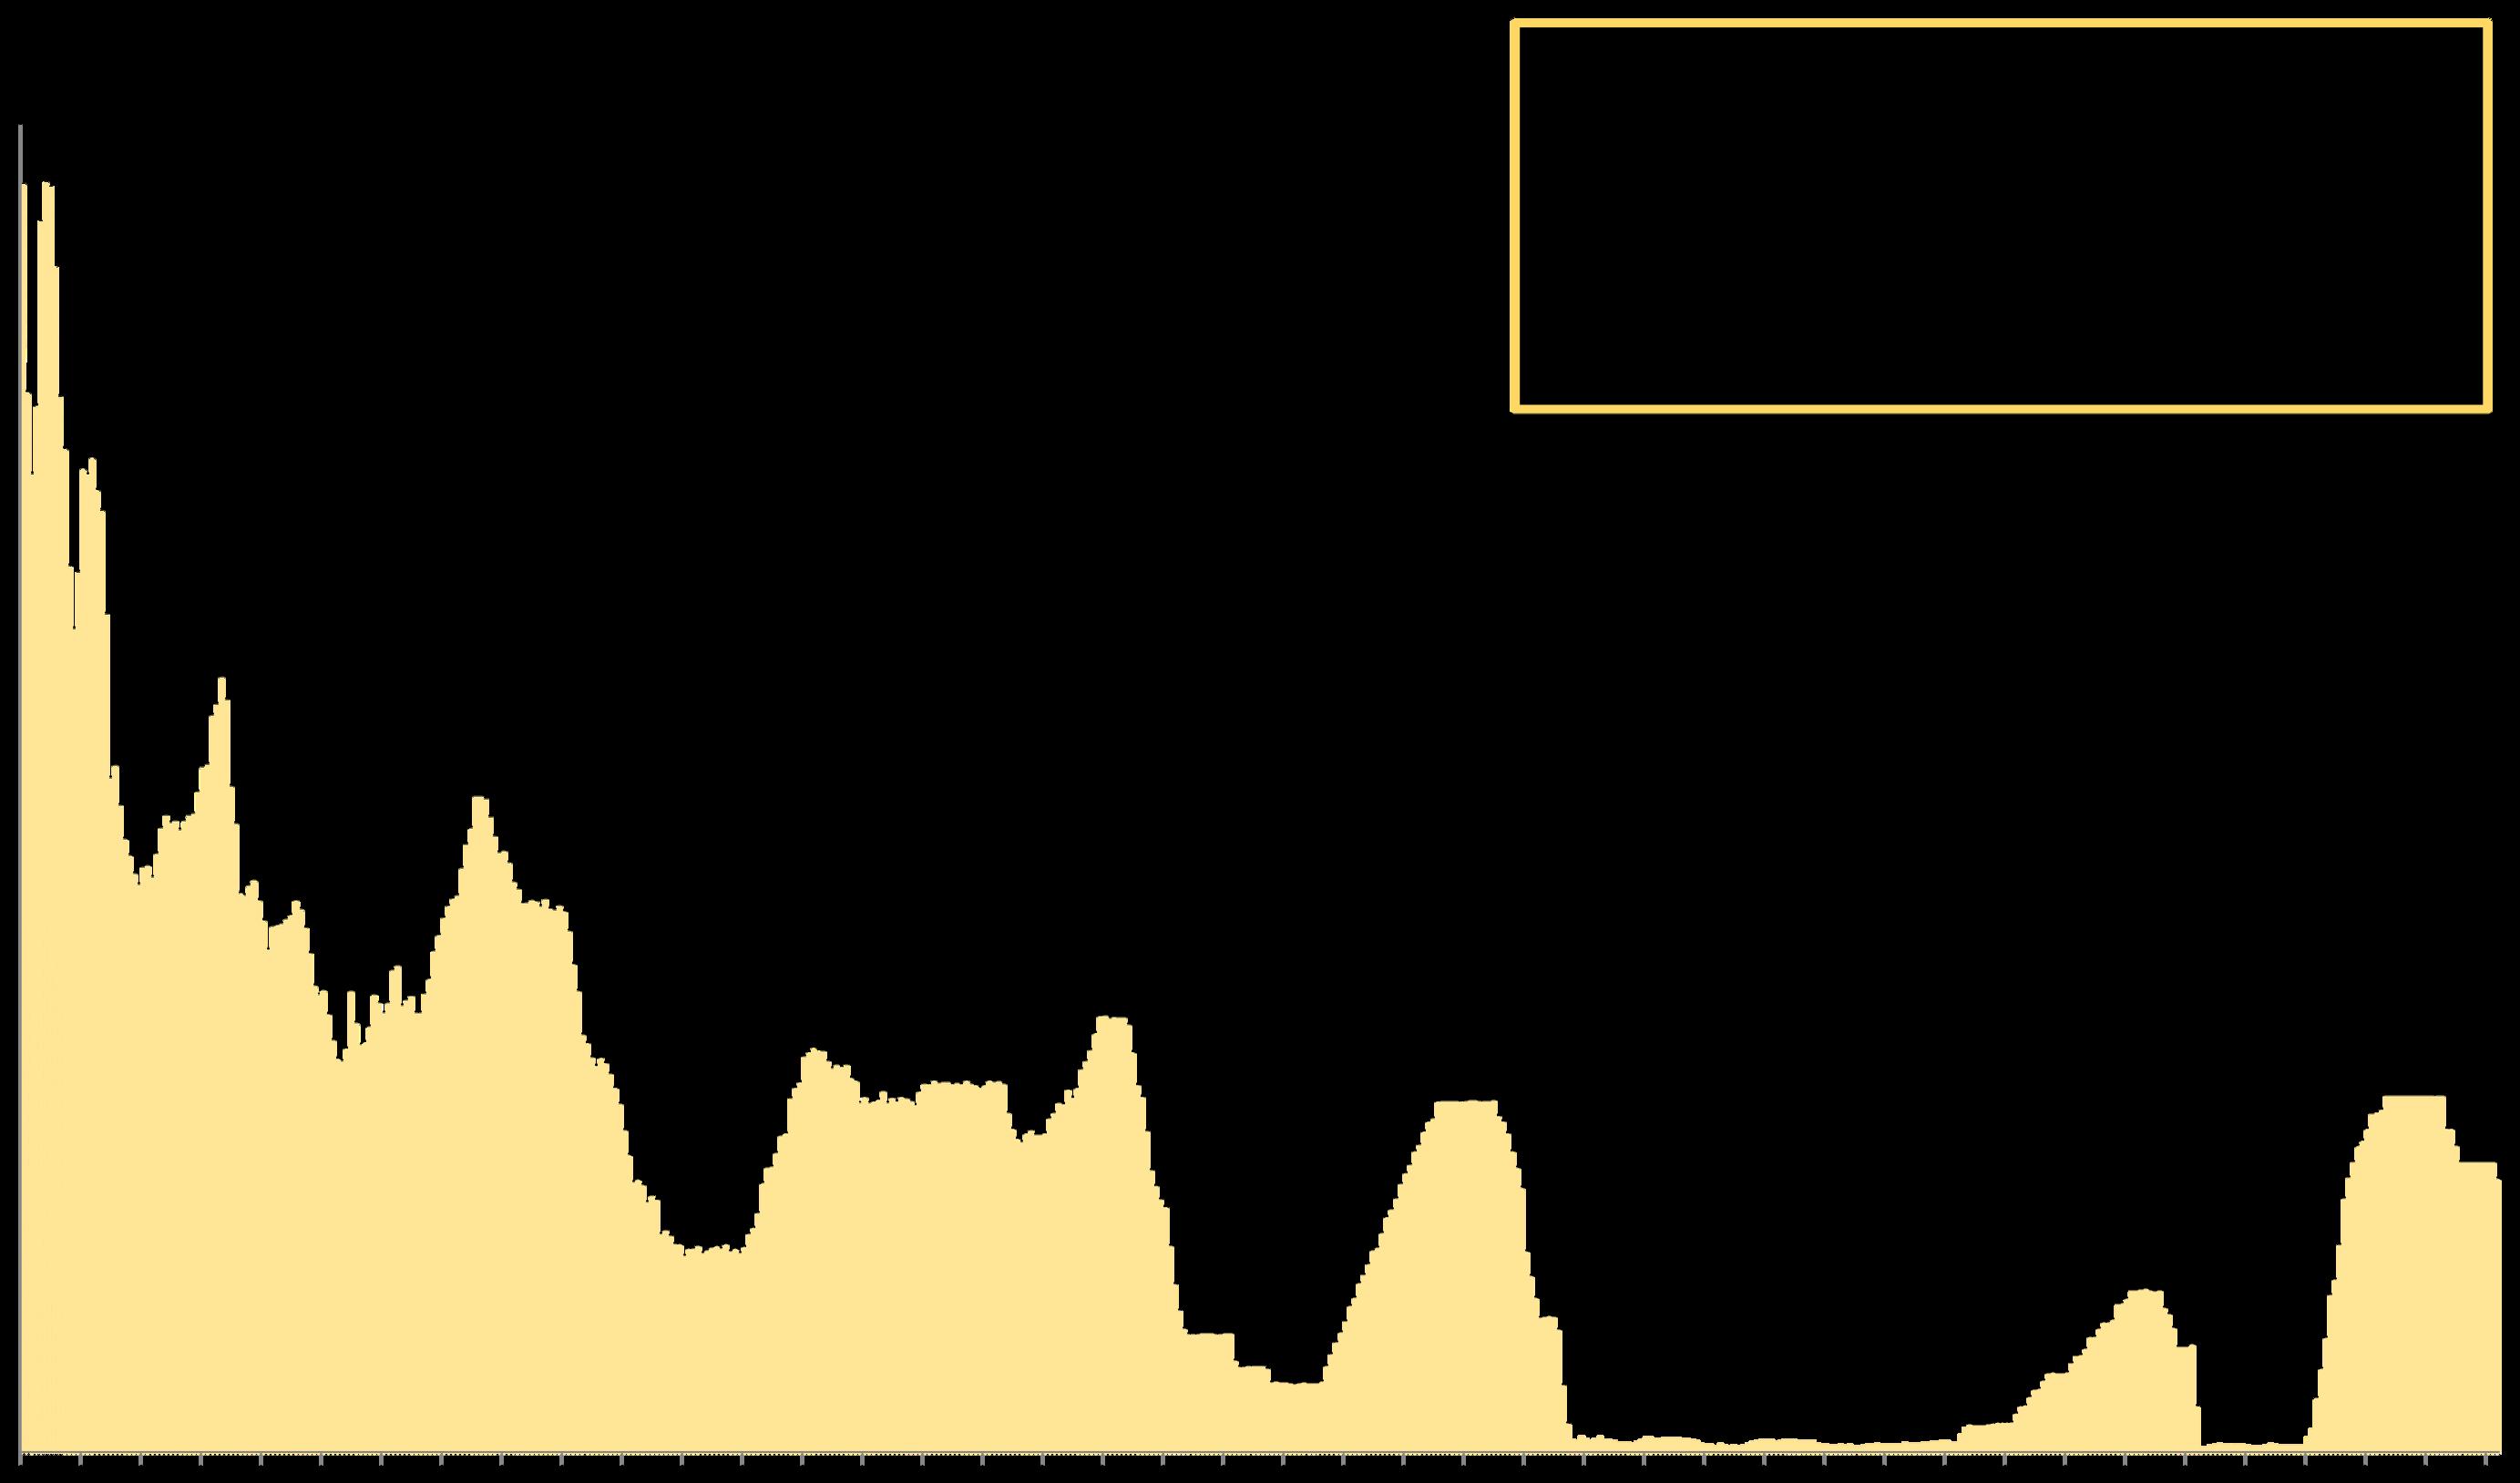
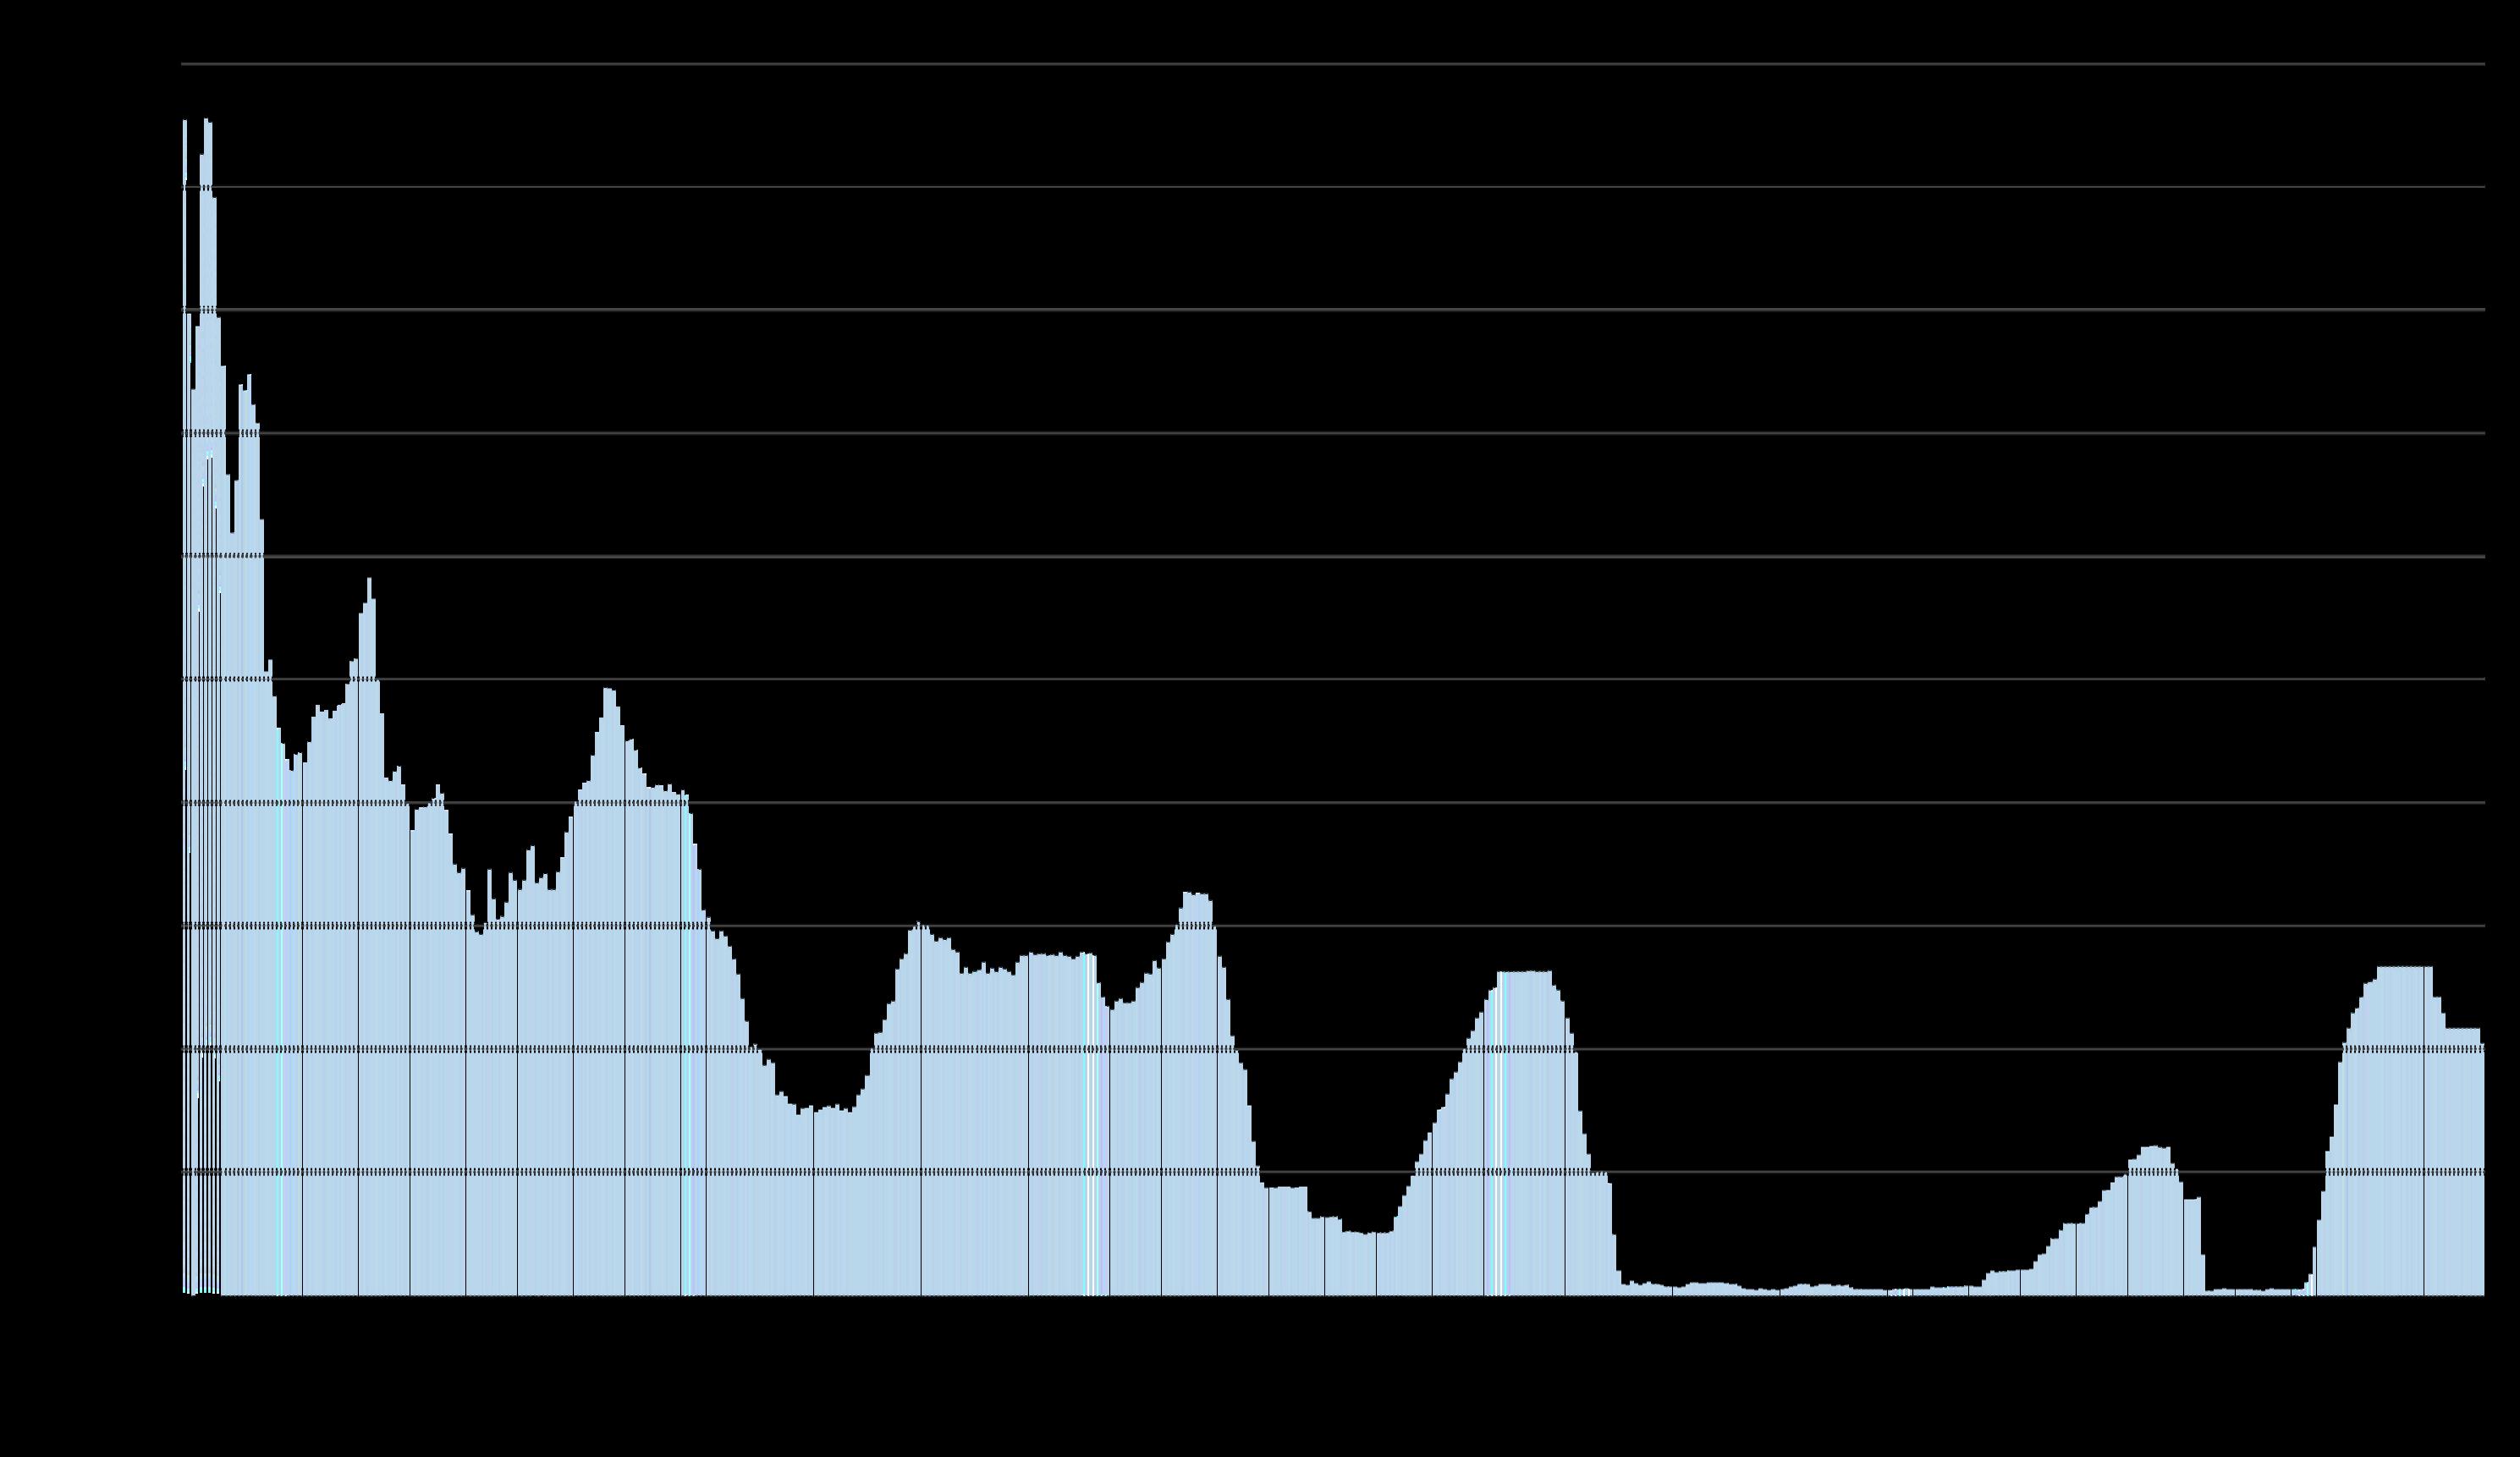
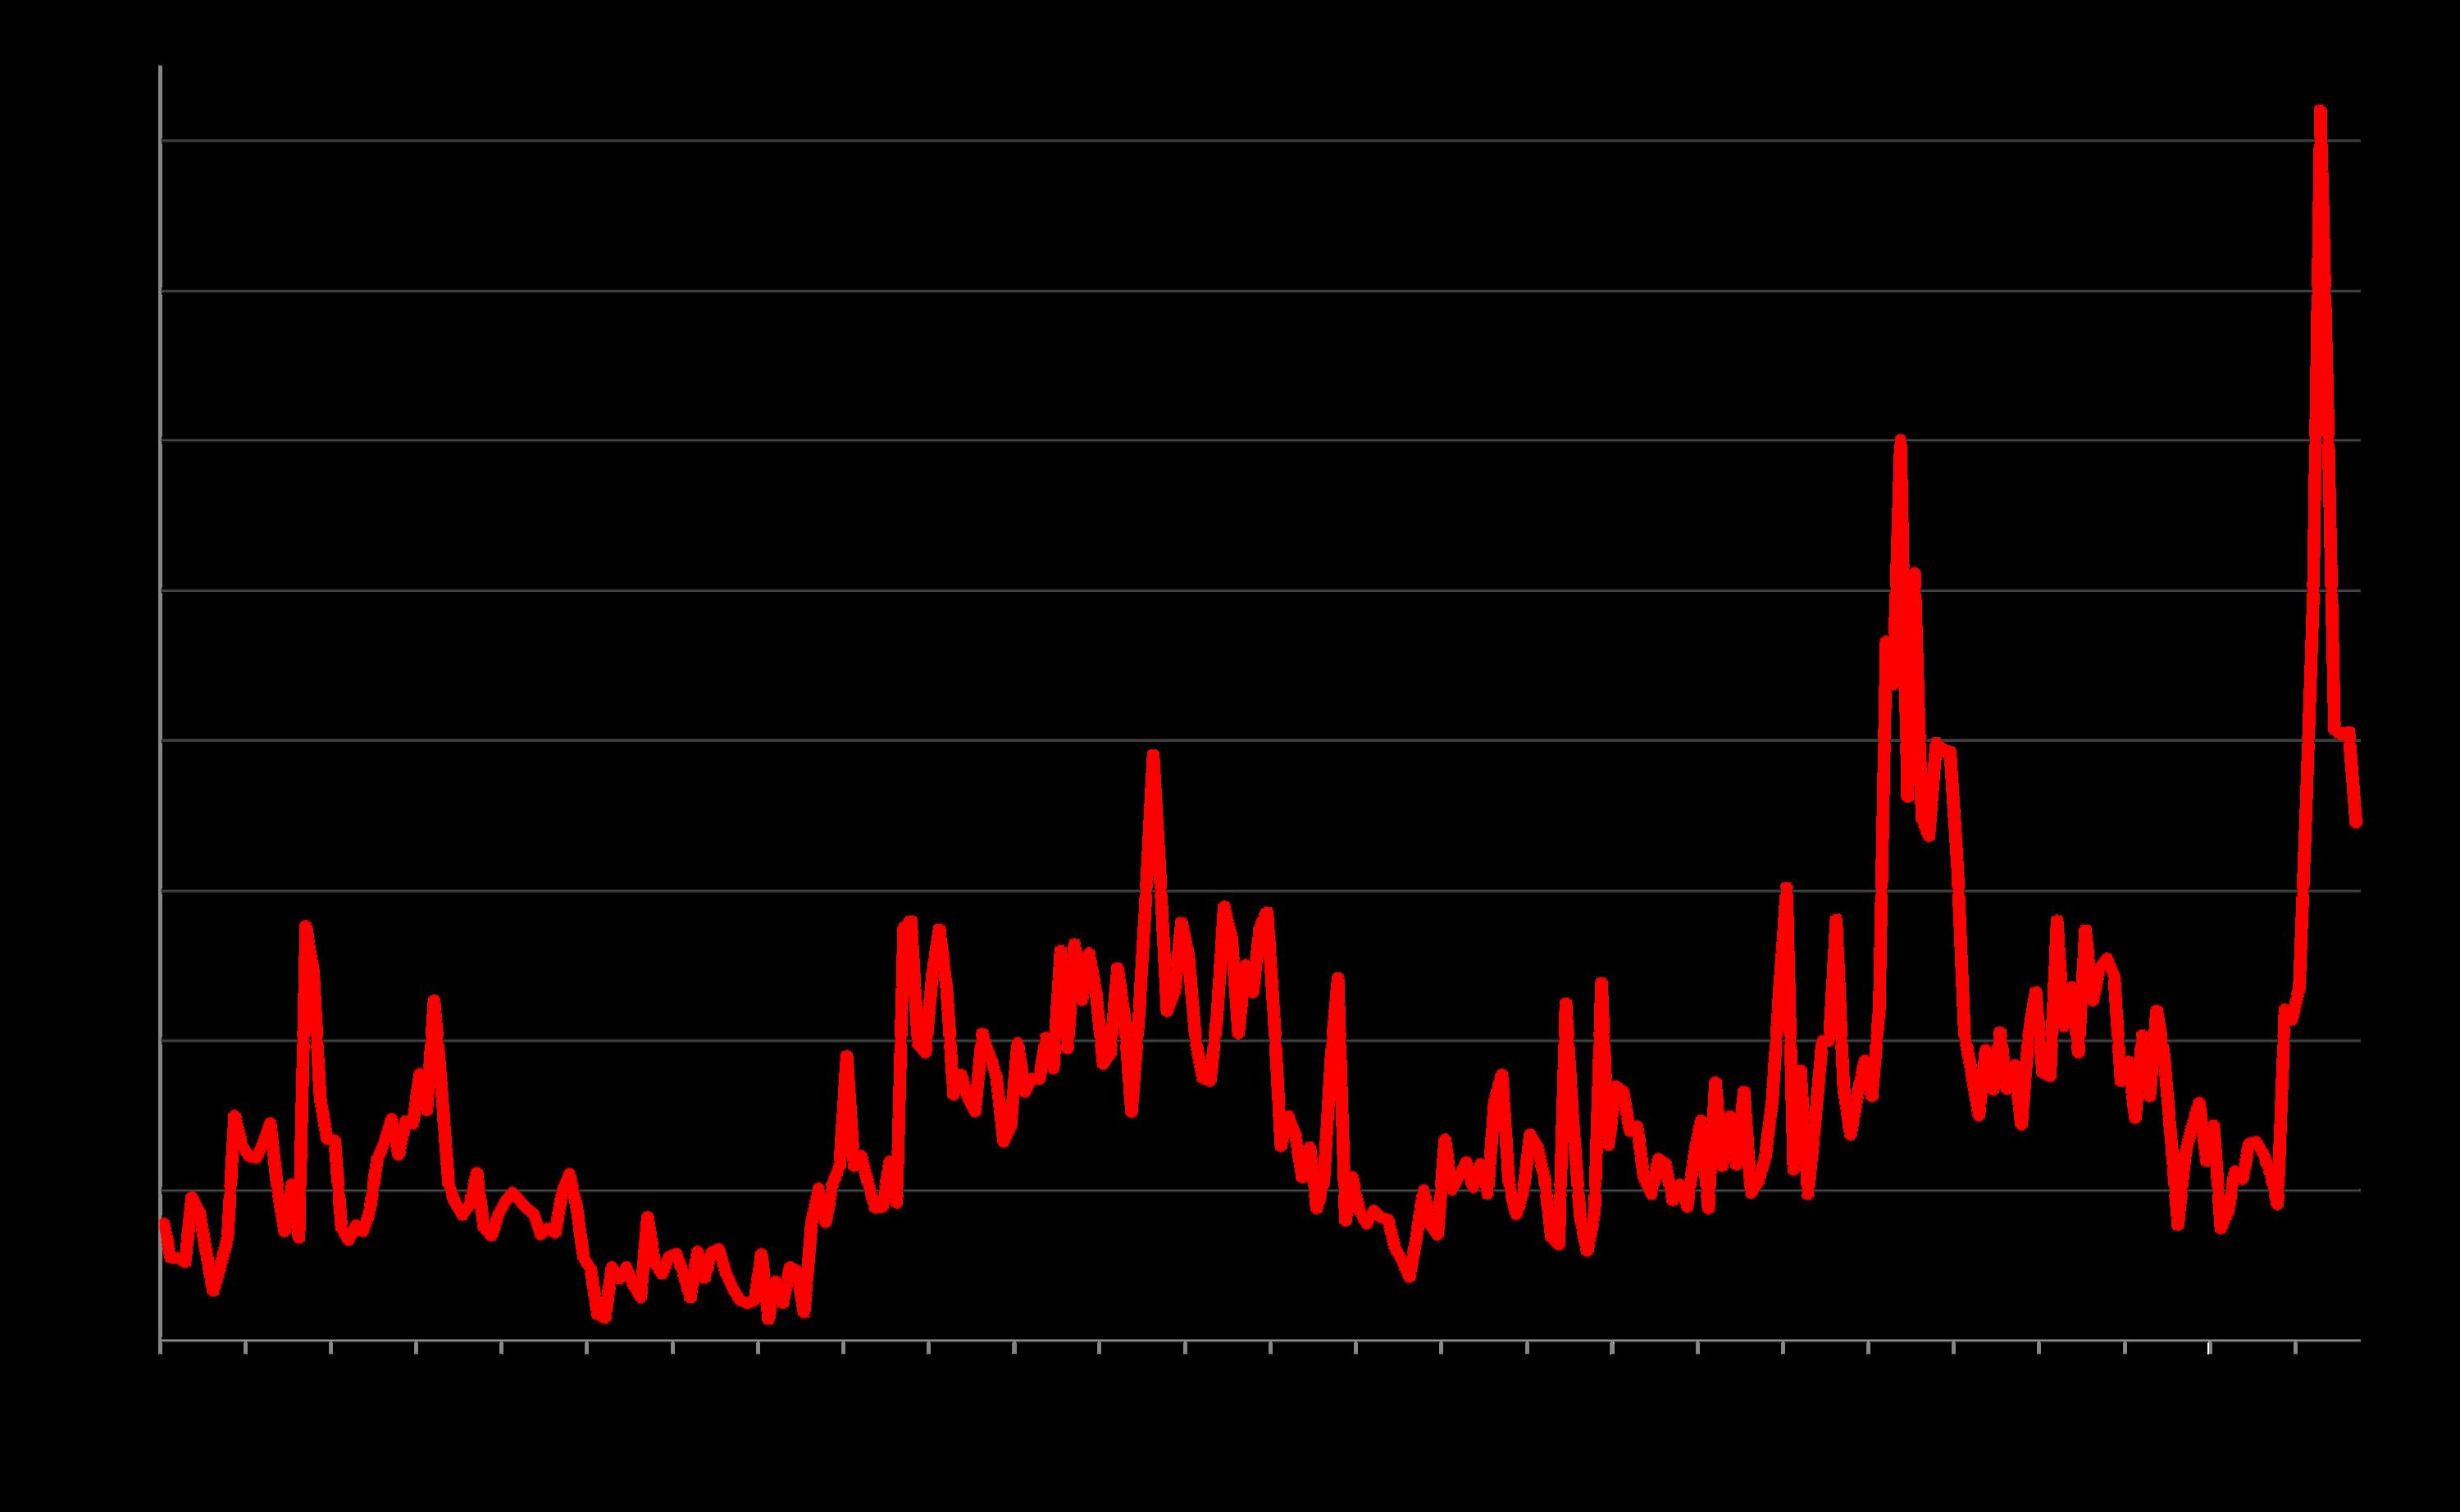
Economic Policy Uncertainty Index*
By Month since January 2000
The Economic Policy Uncertainty Index reading in September 2025 declined from August, having plummeted since April’s tariff shock, though remaining high by long-term norms.
The Economic Uncertainty Index is constructed from data analysis of 1) an index of search results from 10 large newspapers for terms related to economic and policy uncertainty, 2) reports by the Congressional Budget Office, and 3) the Federal Reserve Bank of Philadelphia's Survey of Professional Forecasters.*
*Source: 'Measuring Economic Policy Uncertainty' by Scott Baker, Nicholas Bloom and Steven J. Davis, 3component index, www.PolicyUncertainty.com, https://www.policyuncertainty.com/us_monthly.html.
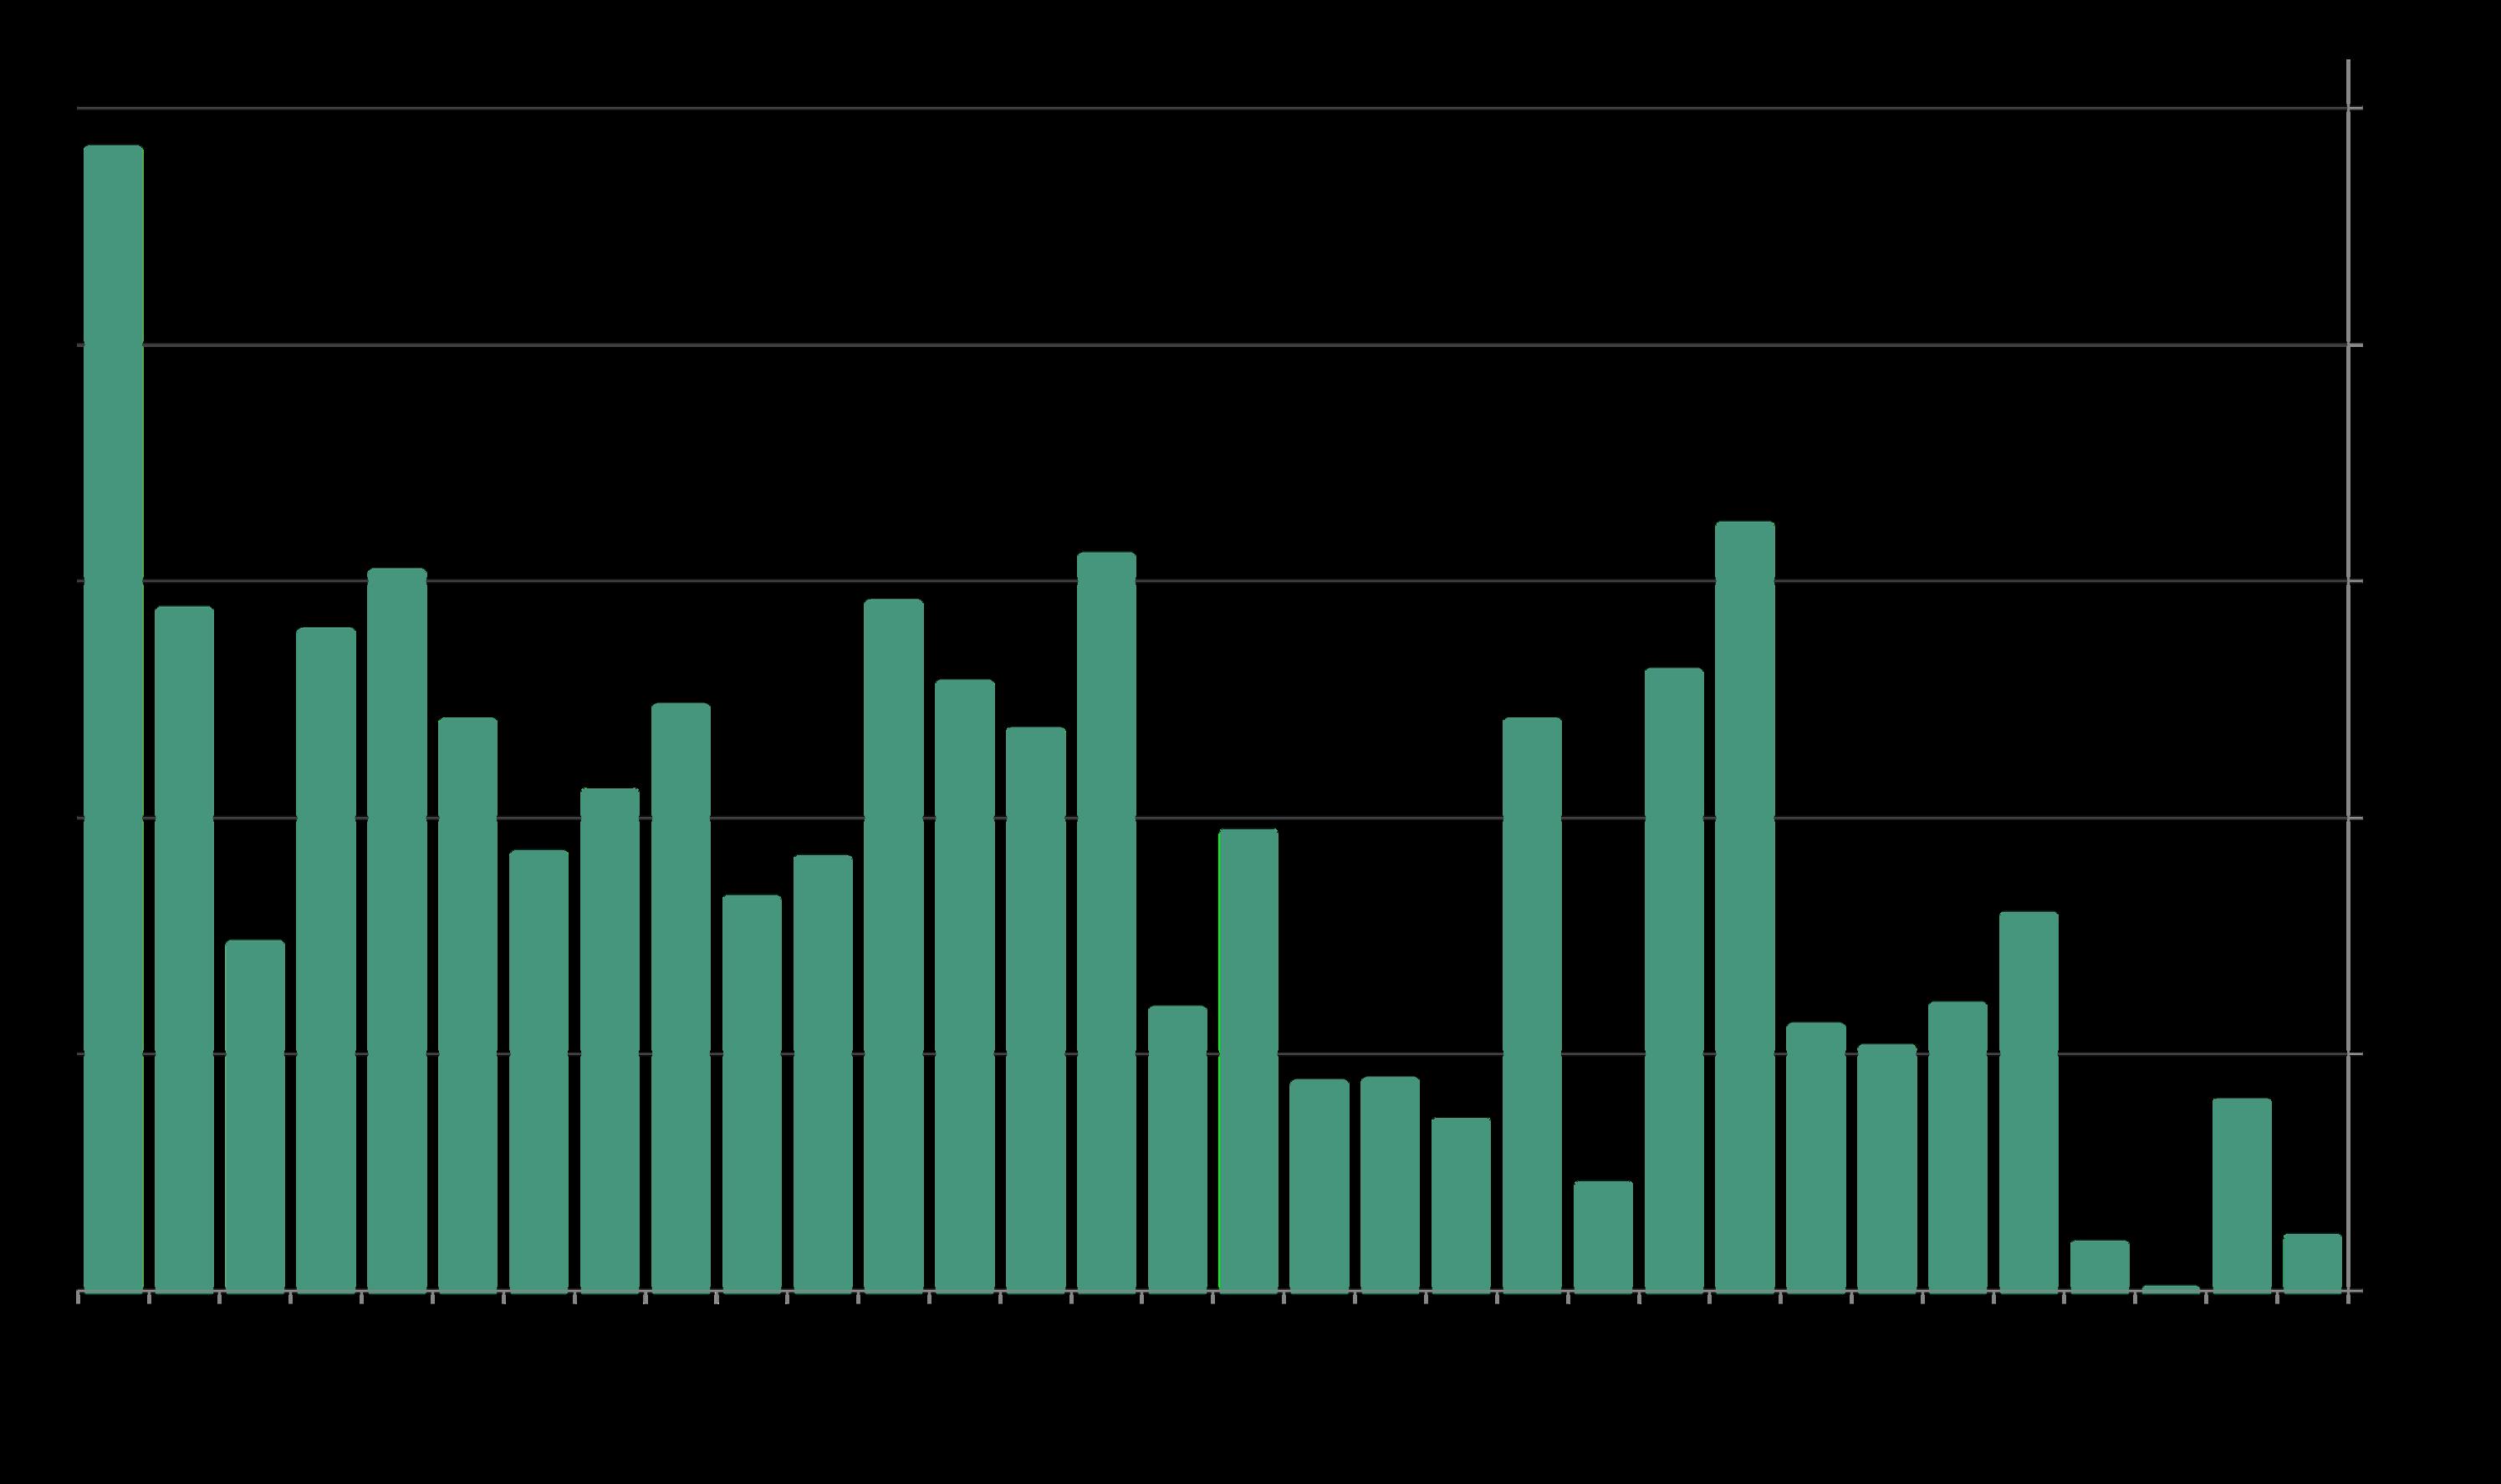
MonthlyChangeinNumber of Jobs, in Thousands*
Monthly Change in U.S. NonFarm Employment, in Thousands
Weak employment growth in recent months has raised both fears regarding the U.S. economy and hopes of interest rate cuts by the Federal Reserve Bank.
Note: BLS often revises its monthly estimates, sometimes very substantially: For example the original May-June 2025 estimate of 291,000 new jobs has been revised down to 6,000.
*U.S. Bureau of Labor Statistics, “All employees, thousands, total nonfarm, seasonally adjusted”: https://data.bls.gov/timeseries/CES0000000001&output view=net 1mth. Last 2 readings are labeled “preliminary” and often substantially revised. Data from sources deemed reliable but may contain errors.
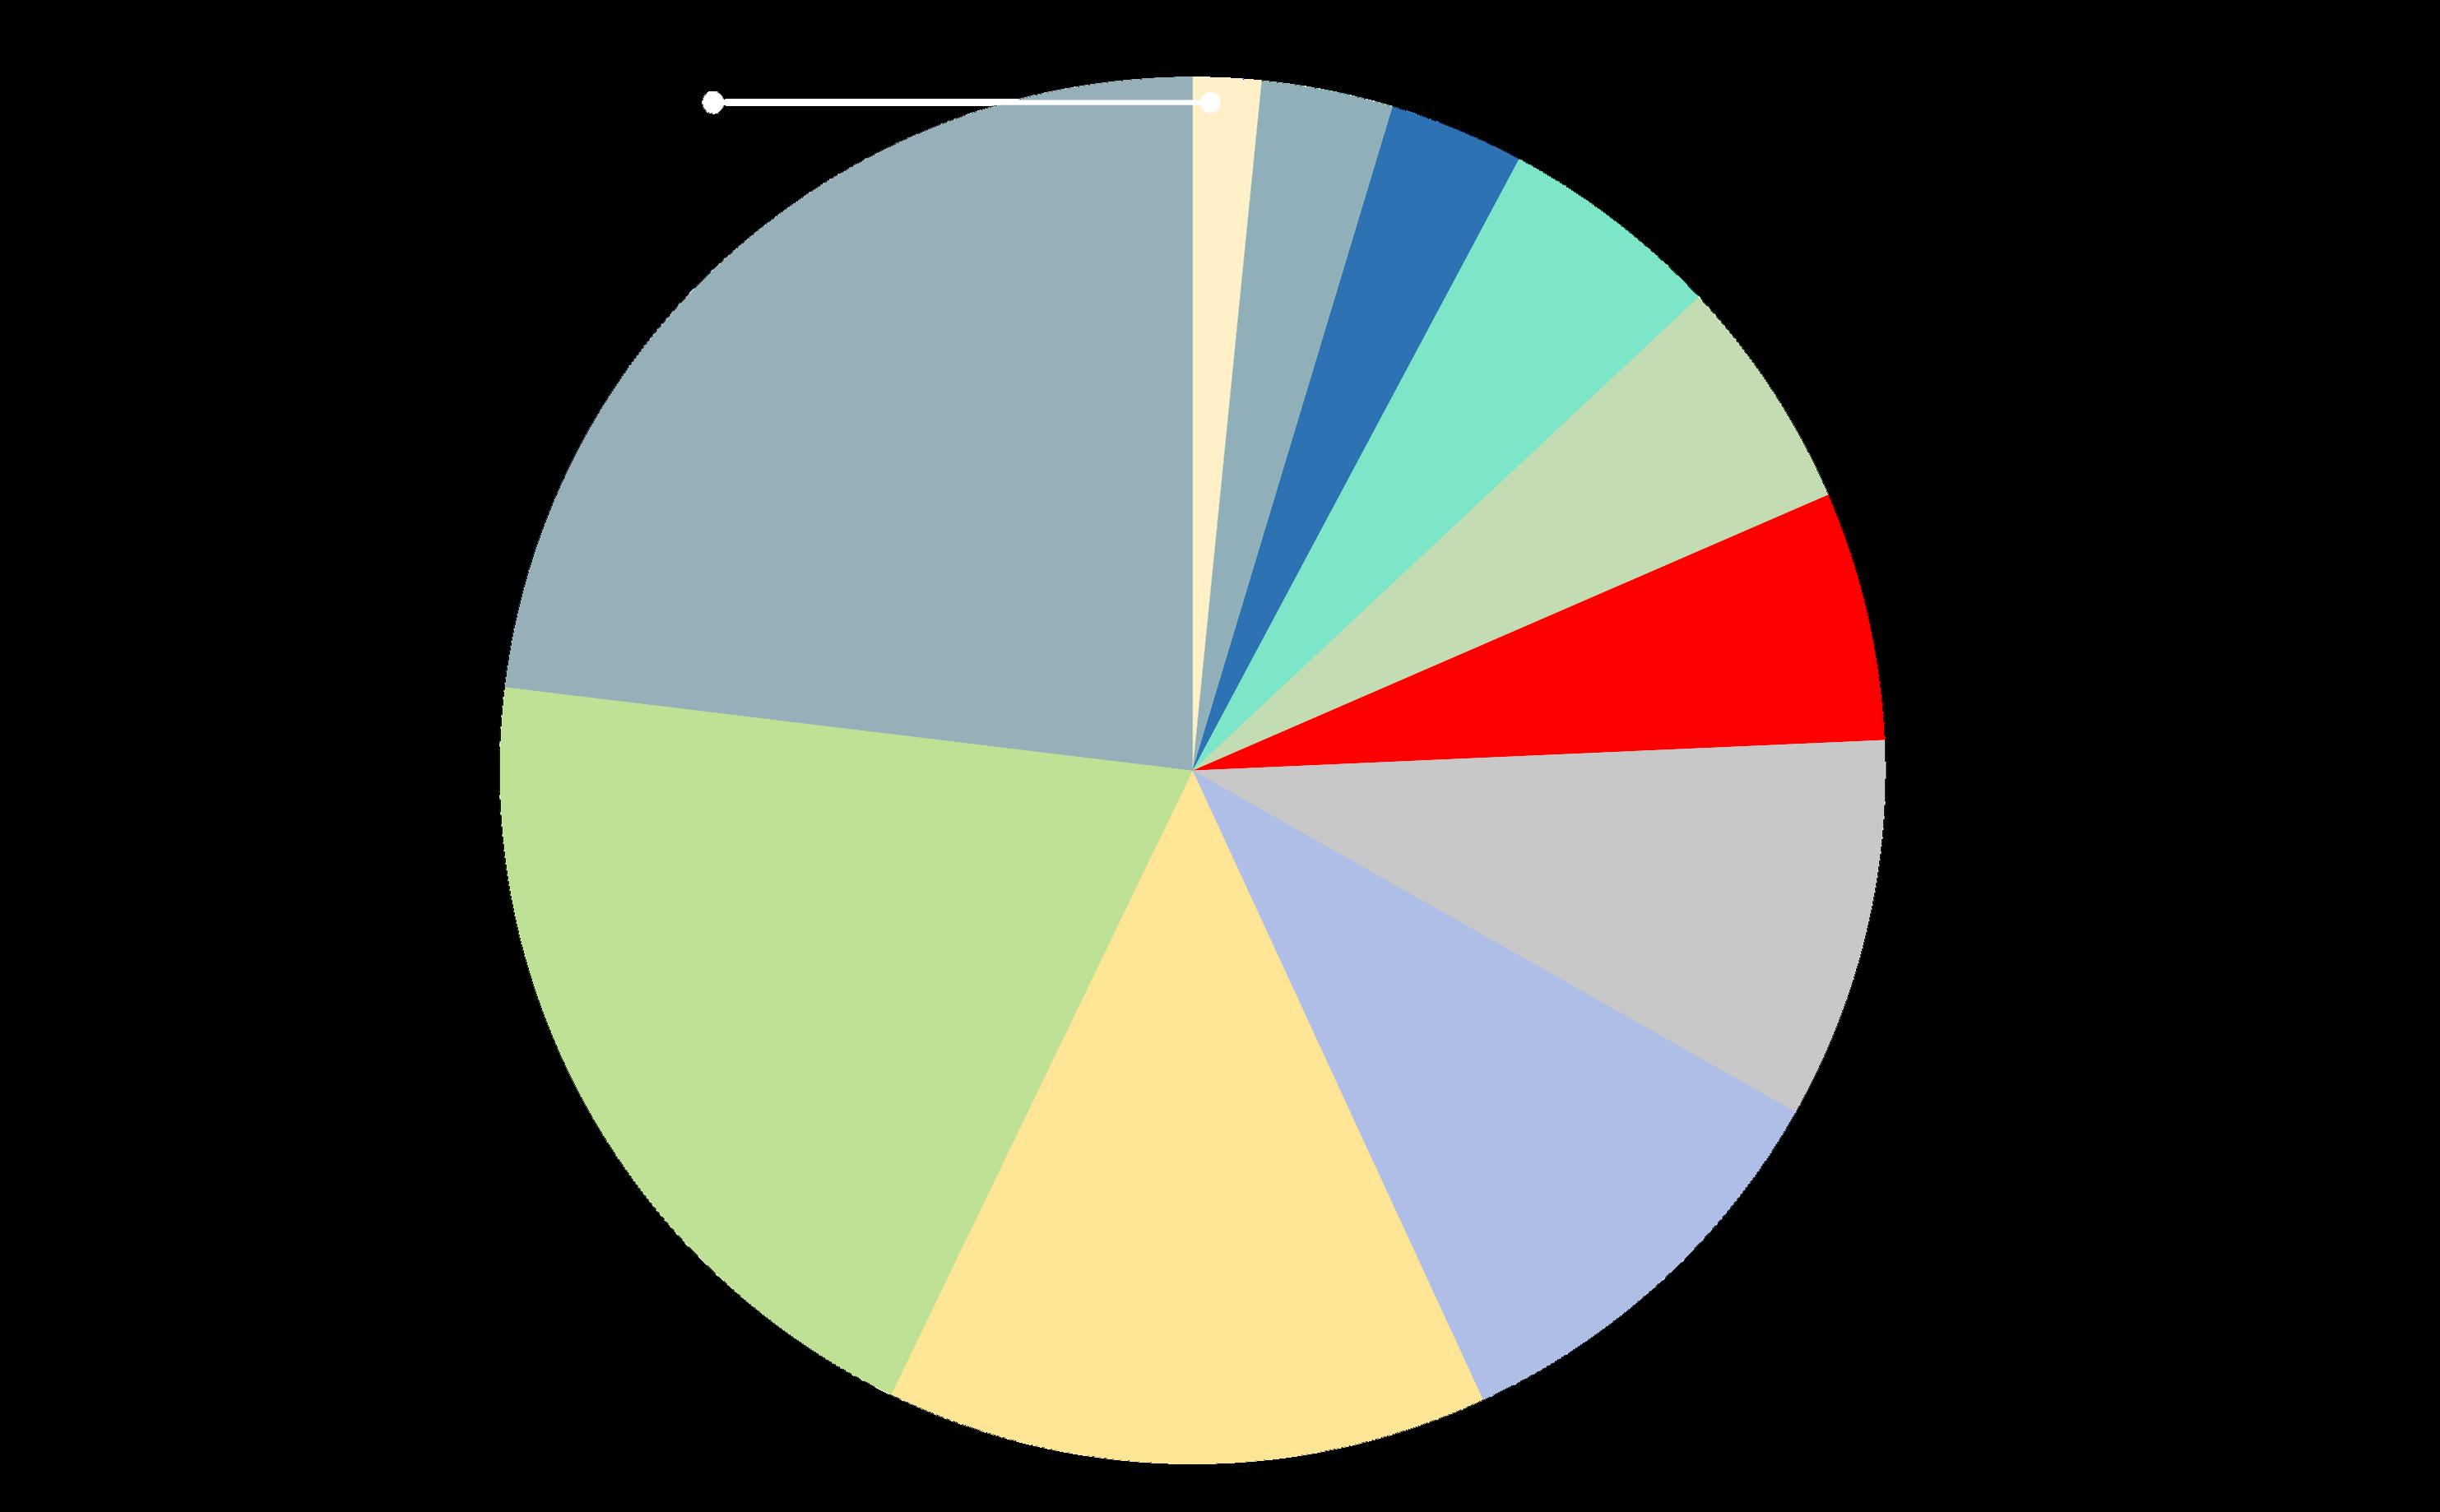
Bay Area Population
Number of Residents by
Per U.S. Census 2024 1-Year ACS estimates published September 2025
Sonoma
Bay Area County Sizes
Bay Area Population Density
San Francisco is the second most densely populated city in the country. It has almost 8 times as many residents per square mile as Alameda County and almost a hundred times more than Napa.
Owner & Tenant Occupancy
San Francisco is the only Bay Area County with a majority tenant population ▼ (though some cities within other counties also have tenant majorities).
Generally speaking, median age has been increasing across Bay Area counties, and in the United States as a whole. Of CA counties, Marin has the 2nd highest median age (after Nevada County).
Foreign-Born Residents
PercentageofPopulation,byBay
Area County
The largest source of the foreign-born populations of Santa Clara, San Mateo, San Francisco, Alameda, Contra Costa & Solano Counties has been from Asian countries – especially China and India – while in Monterey, Sonoma, Napa, Marin and Santa Cruz, the largest share came from Latin America.
Approximately 55% to 60% of foreign-born Bay Area residents are now naturalized U.S. citizens.
Statistics are generalities, essentially summaries of widely disparate data generated by dozens, hundreds or thousands of unique, individual sales occurring within different time periods. They are best seen not as precise measurements, but as broad, comparative indicators, with reasonable margins of error. Anomalous fluctuations in statistics are not uncommon, especially in smaller, expensive market segments. Last period data should be considered estimates that may change with late-reported data. Different analytics programs sometimes define statistics – such as “active listings,” “days on market,” and “months supply of inventory” – differently: what is most meaningful are not specific calculations but the trends they illustrate. Most listing and sales data derives from the local or regional multi-listing service (MLS) of the area specified in the analysis, but not all listings or sales are reported to MLS and these won’t be reflected in the data. “Homes” signifies real-property, single-household housing units: houses, condos, co-ops, townhouses, duets and TICs (but not mobile homes), as applicable to each market. City/town names refer specifically to the named cities and towns, unless otherwise delineated. Multi-county metro areas will be specified as such. Data from sources deemed reliable, but may contain errors and subject to revision. All numbers to be considered approximate.
Many aspects of value cannot be adequately reflected in median and average statistics: curb appeal, age, condition, amenities,
views, lot size, quality of outdoor space, “bonus” rooms, additional parking, quality of location within the neighborhood, and so on. How any of these statistics apply to any particular home is unknown without a specific comparative market analysis.
Median Sales Price is that price at which half the properties sold for more and half for less. It may be affected by seasonality, “unusual” events, or changes in inventory and buying trends, as well as by changes in fair market value. The median sales price for an area will often conceal an enormous variety of sales prices in the underlying individual sales.
Dollar per Square Foot is based upon the home’s interior living space and does not include garages, unfinished attics and basements, rooms built without permit, patios, decks or yards (though all those can add value to a home). These figures are usually derived from appraisals or tax records, but are sometimes unreliable (especially for older homes) or unreported altogether. The calculation can only be made on those home sales that reported square footage.
Photo use under the Creative Commons License: https://creativecommons.org/licenses/by-sa/2.0/
Compass is a real estate broker licensed by the State of California, DRE 01527235. Equal Housing Opportunity. This report has been prepared solely for information purposes. The information herein is based on or derived from information generally available to the public and/or from sources believed to be reliable. No representation or warranty can be given with respect to the accuracy or completeness of the information. Compass disclaims any and all liability relating to this report, including without limitation any express or implied representations or warranties for statements contained in, and omissions from, the report. Nothing contained herein is intended to be or should be read as any regulatory, legal, tax, accounting or other advice and Compass does not provide such advice. All opinions are subject to change without notice. Compass makes no representation regarding the accuracy of any statements regarding any references to the laws, statutes or regulations of any state are those of the author(s). Past performance is no guarantee of future results.