December 2025 Report with market data through November
The real estate market began its usual mid-winter holiday season slowdown in November, marked by a substantial decline in both listing and sales activity. This contraction typically speeds up through December - normally the year's slowest month - before the market begins to wake up in mid-January. As illustrated within this report, by virtually every indicator – prices, inventory, overbidding, speed of sale – the San Francisco market this past fall saw a stunning surge in demand, which we ascribe to the accelerating AI startup boom in the city. San Francisco now has one of the most heated markets in the country. Our focus now shifts toward the New Year's market. In the past, the beginning of the year frequently ushered in a substantially higher level of activity that continued to build into spring. This occurred in early 2025 until affected by the "tariff shock" and subsequent economic reactions, initiating a significant slowdown in April. In the broader financial landscape, the first week of December saw the S&P 500 and Nasdaq largely recover from their substantial declines in November; and the 30-year mortgage rate was close to a 14-month low. While consumer confidence showed a modest rise from November, it remains very low by long-term standards – but this does not seem to be impacting the SF market.
Attention is now focused on the Federal Reserve’s upcoming decision regarding an end-of-year benchmark-rate reduction, and the subsequent inflation report due later in the month.
Report created in good faith using data from sources deemed reliable but may contain errors and subject to revision. Last period figures are preliminary estimates based on data available early in the following month. All numbers approximate and may change with late-reported activity.
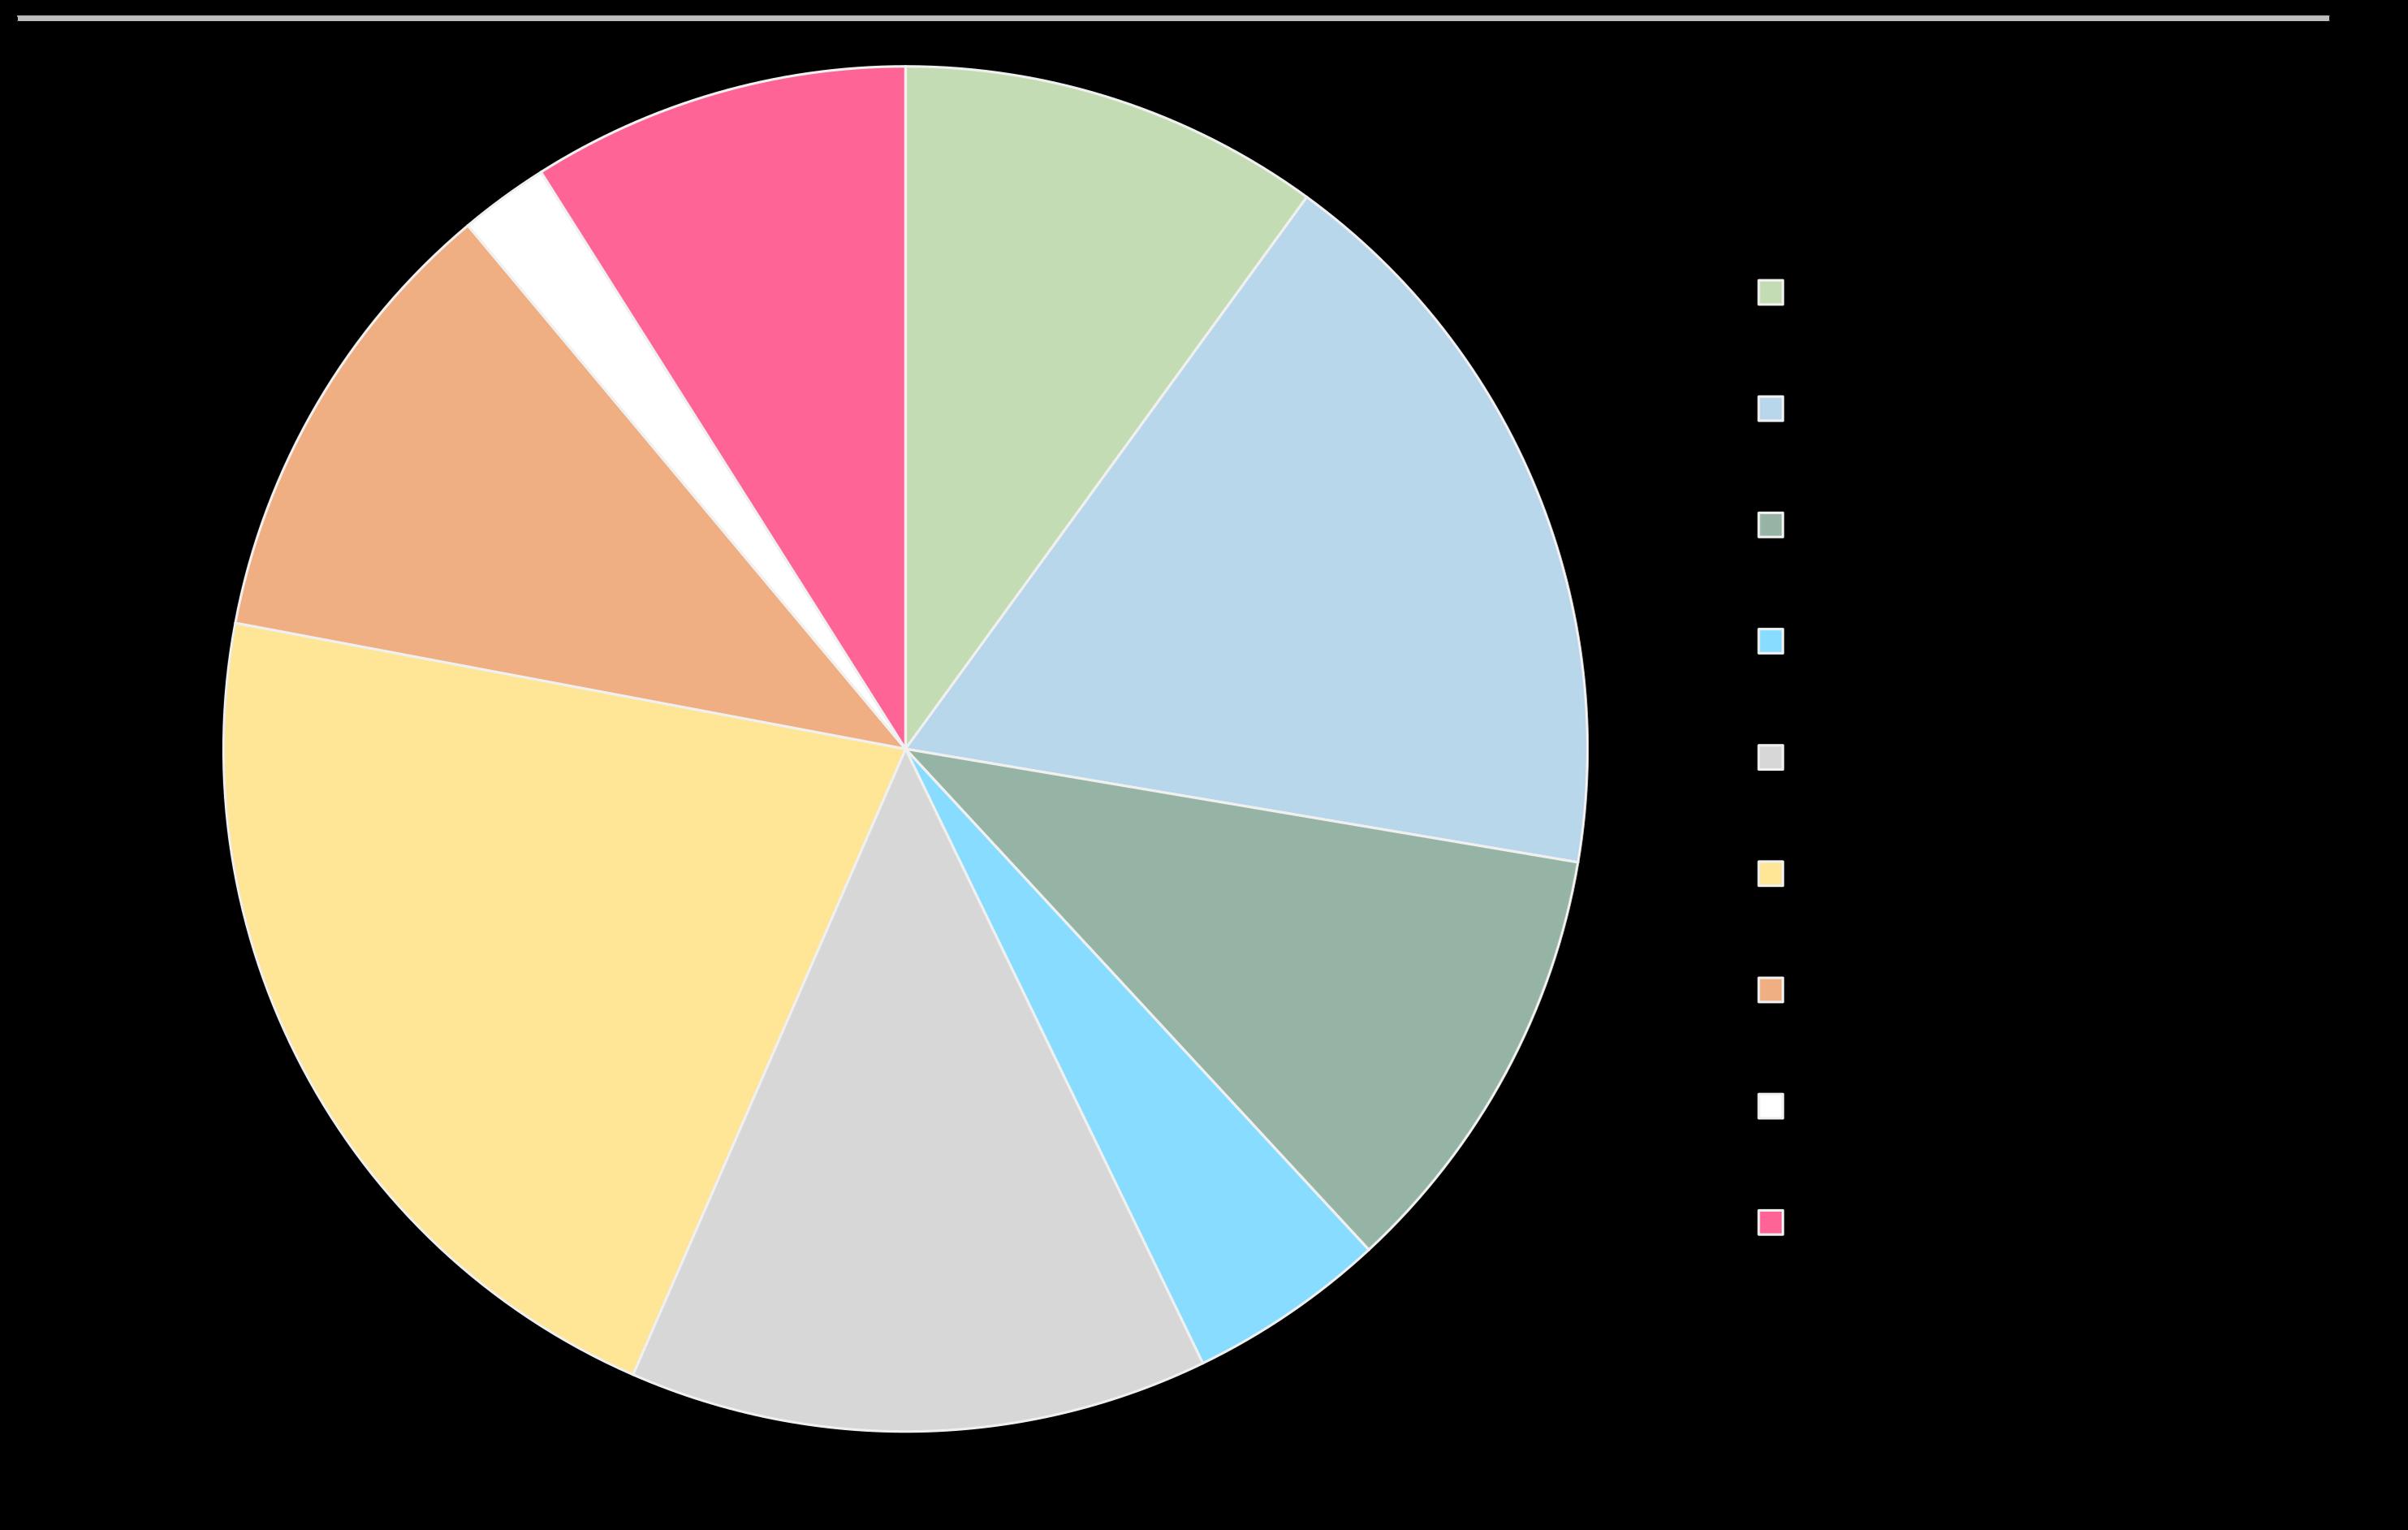
San Francisco Home Sales Breakdown
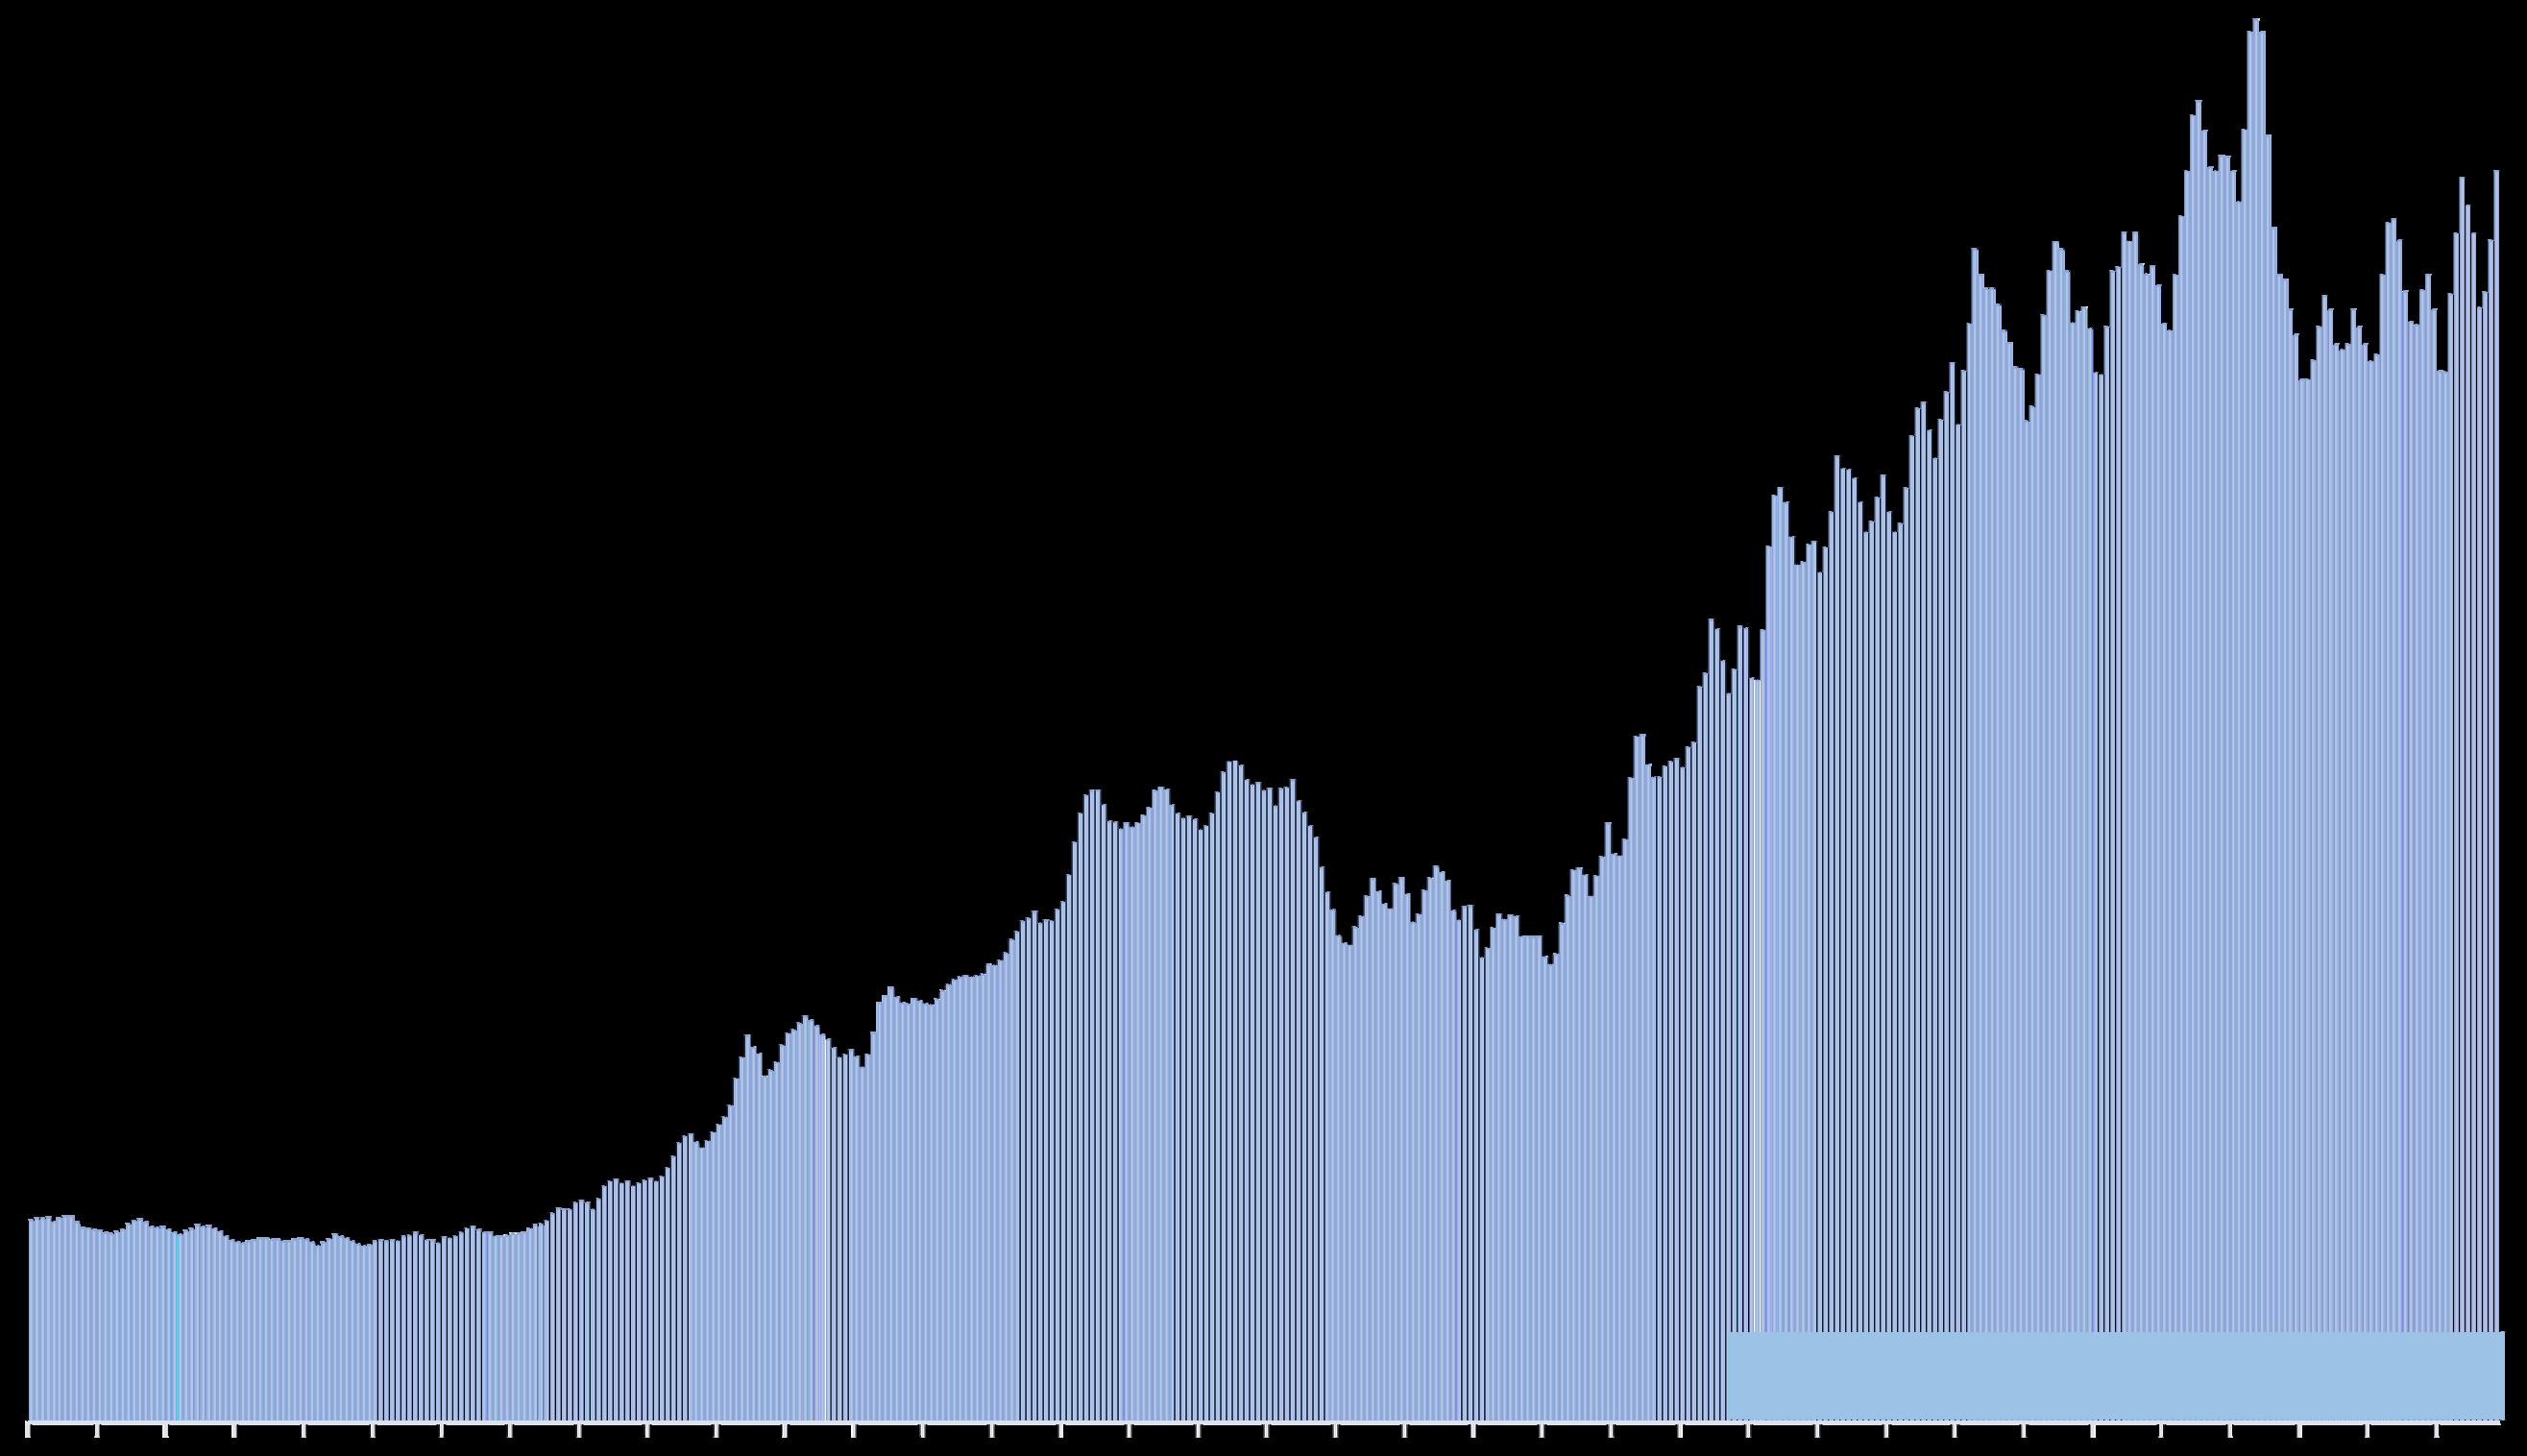
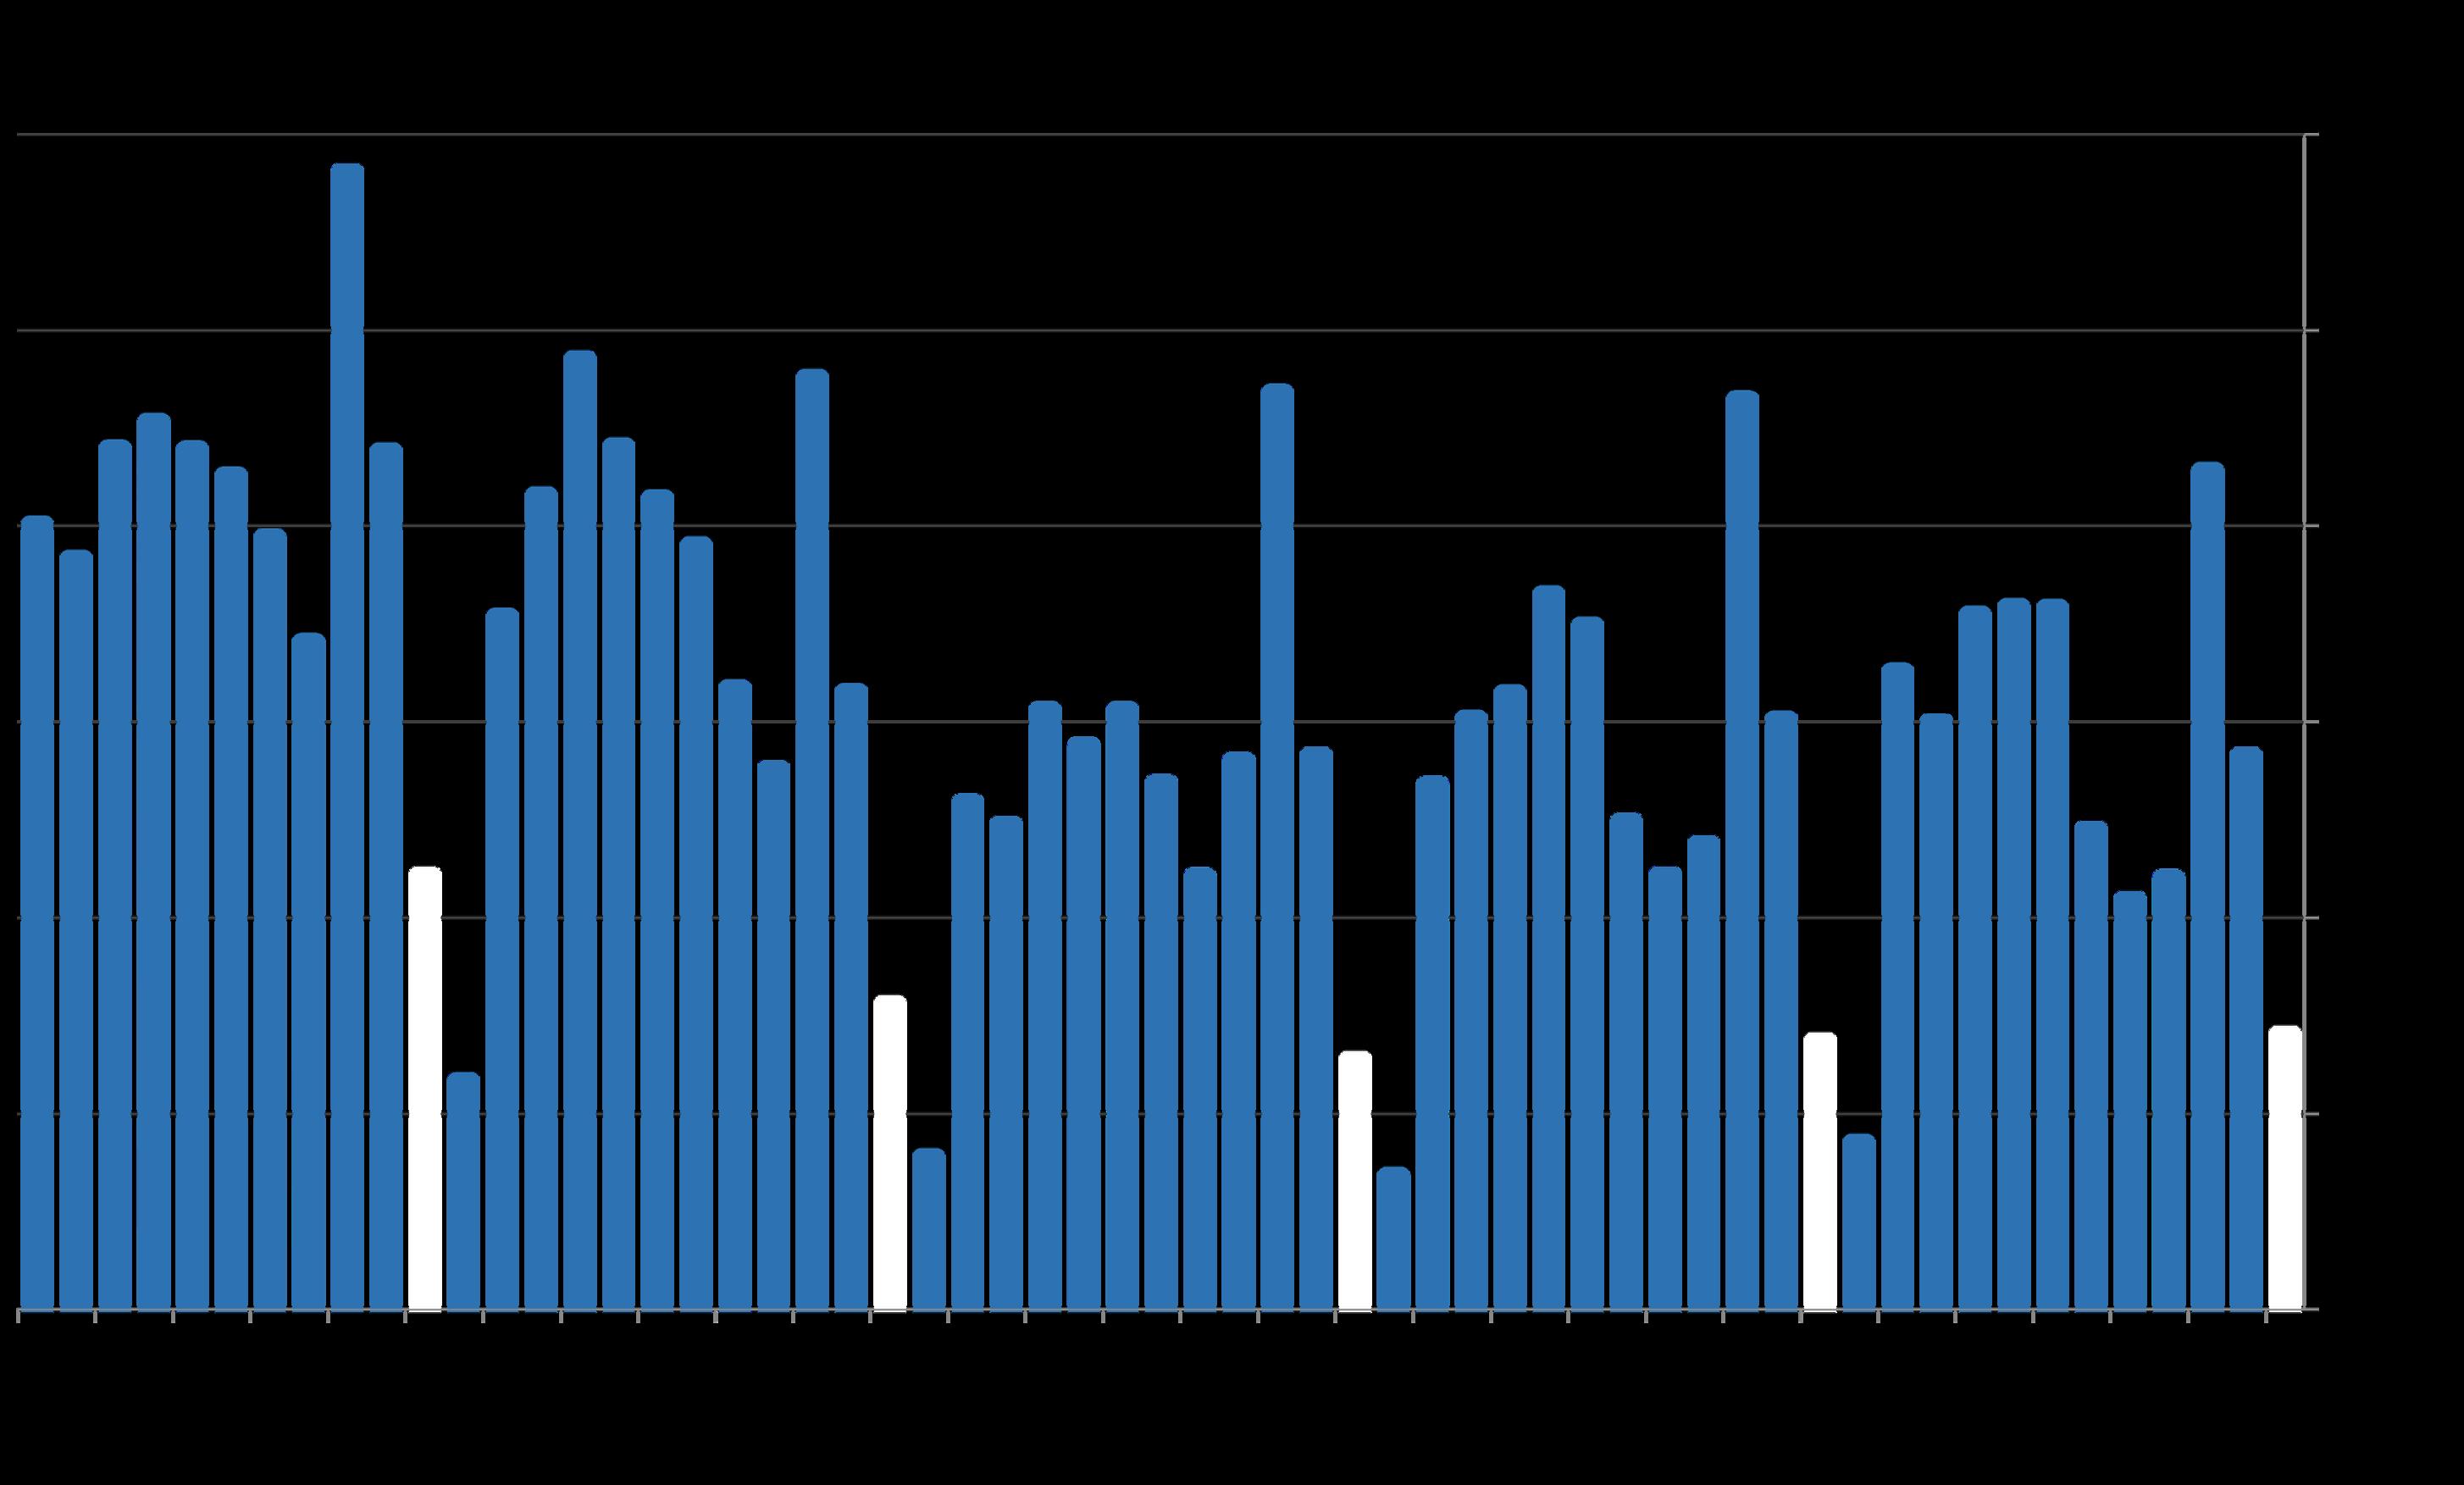
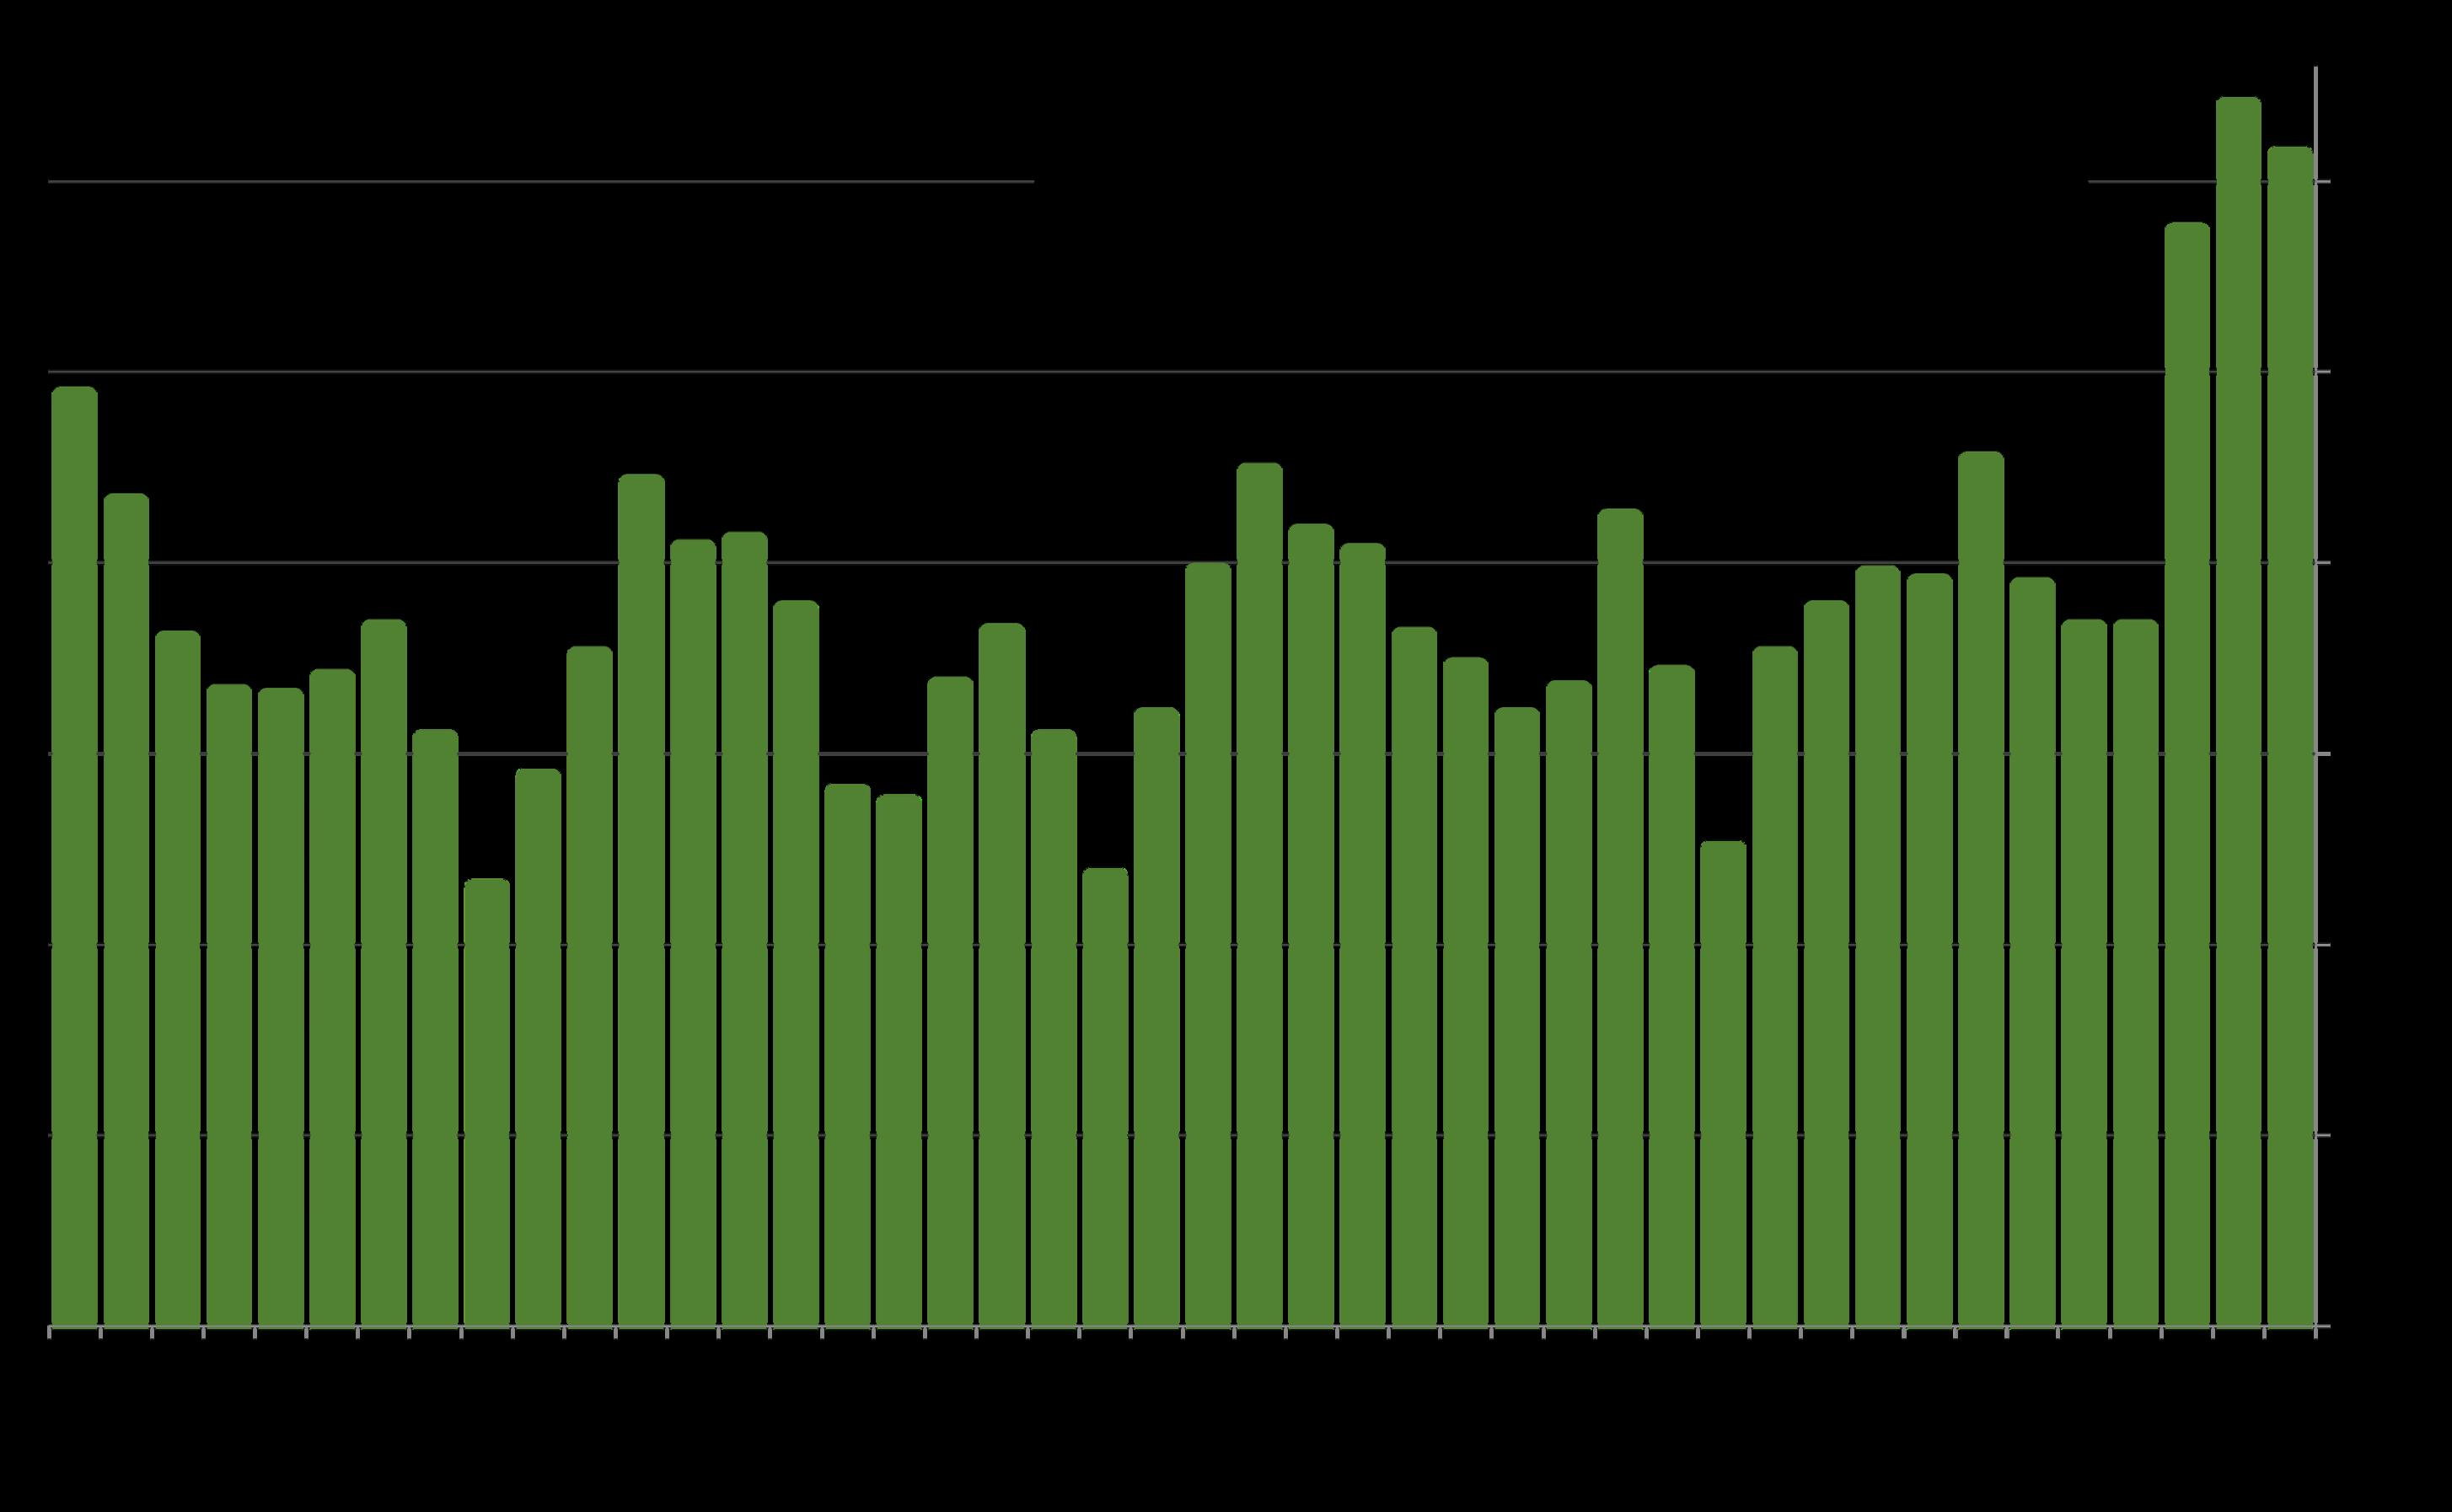
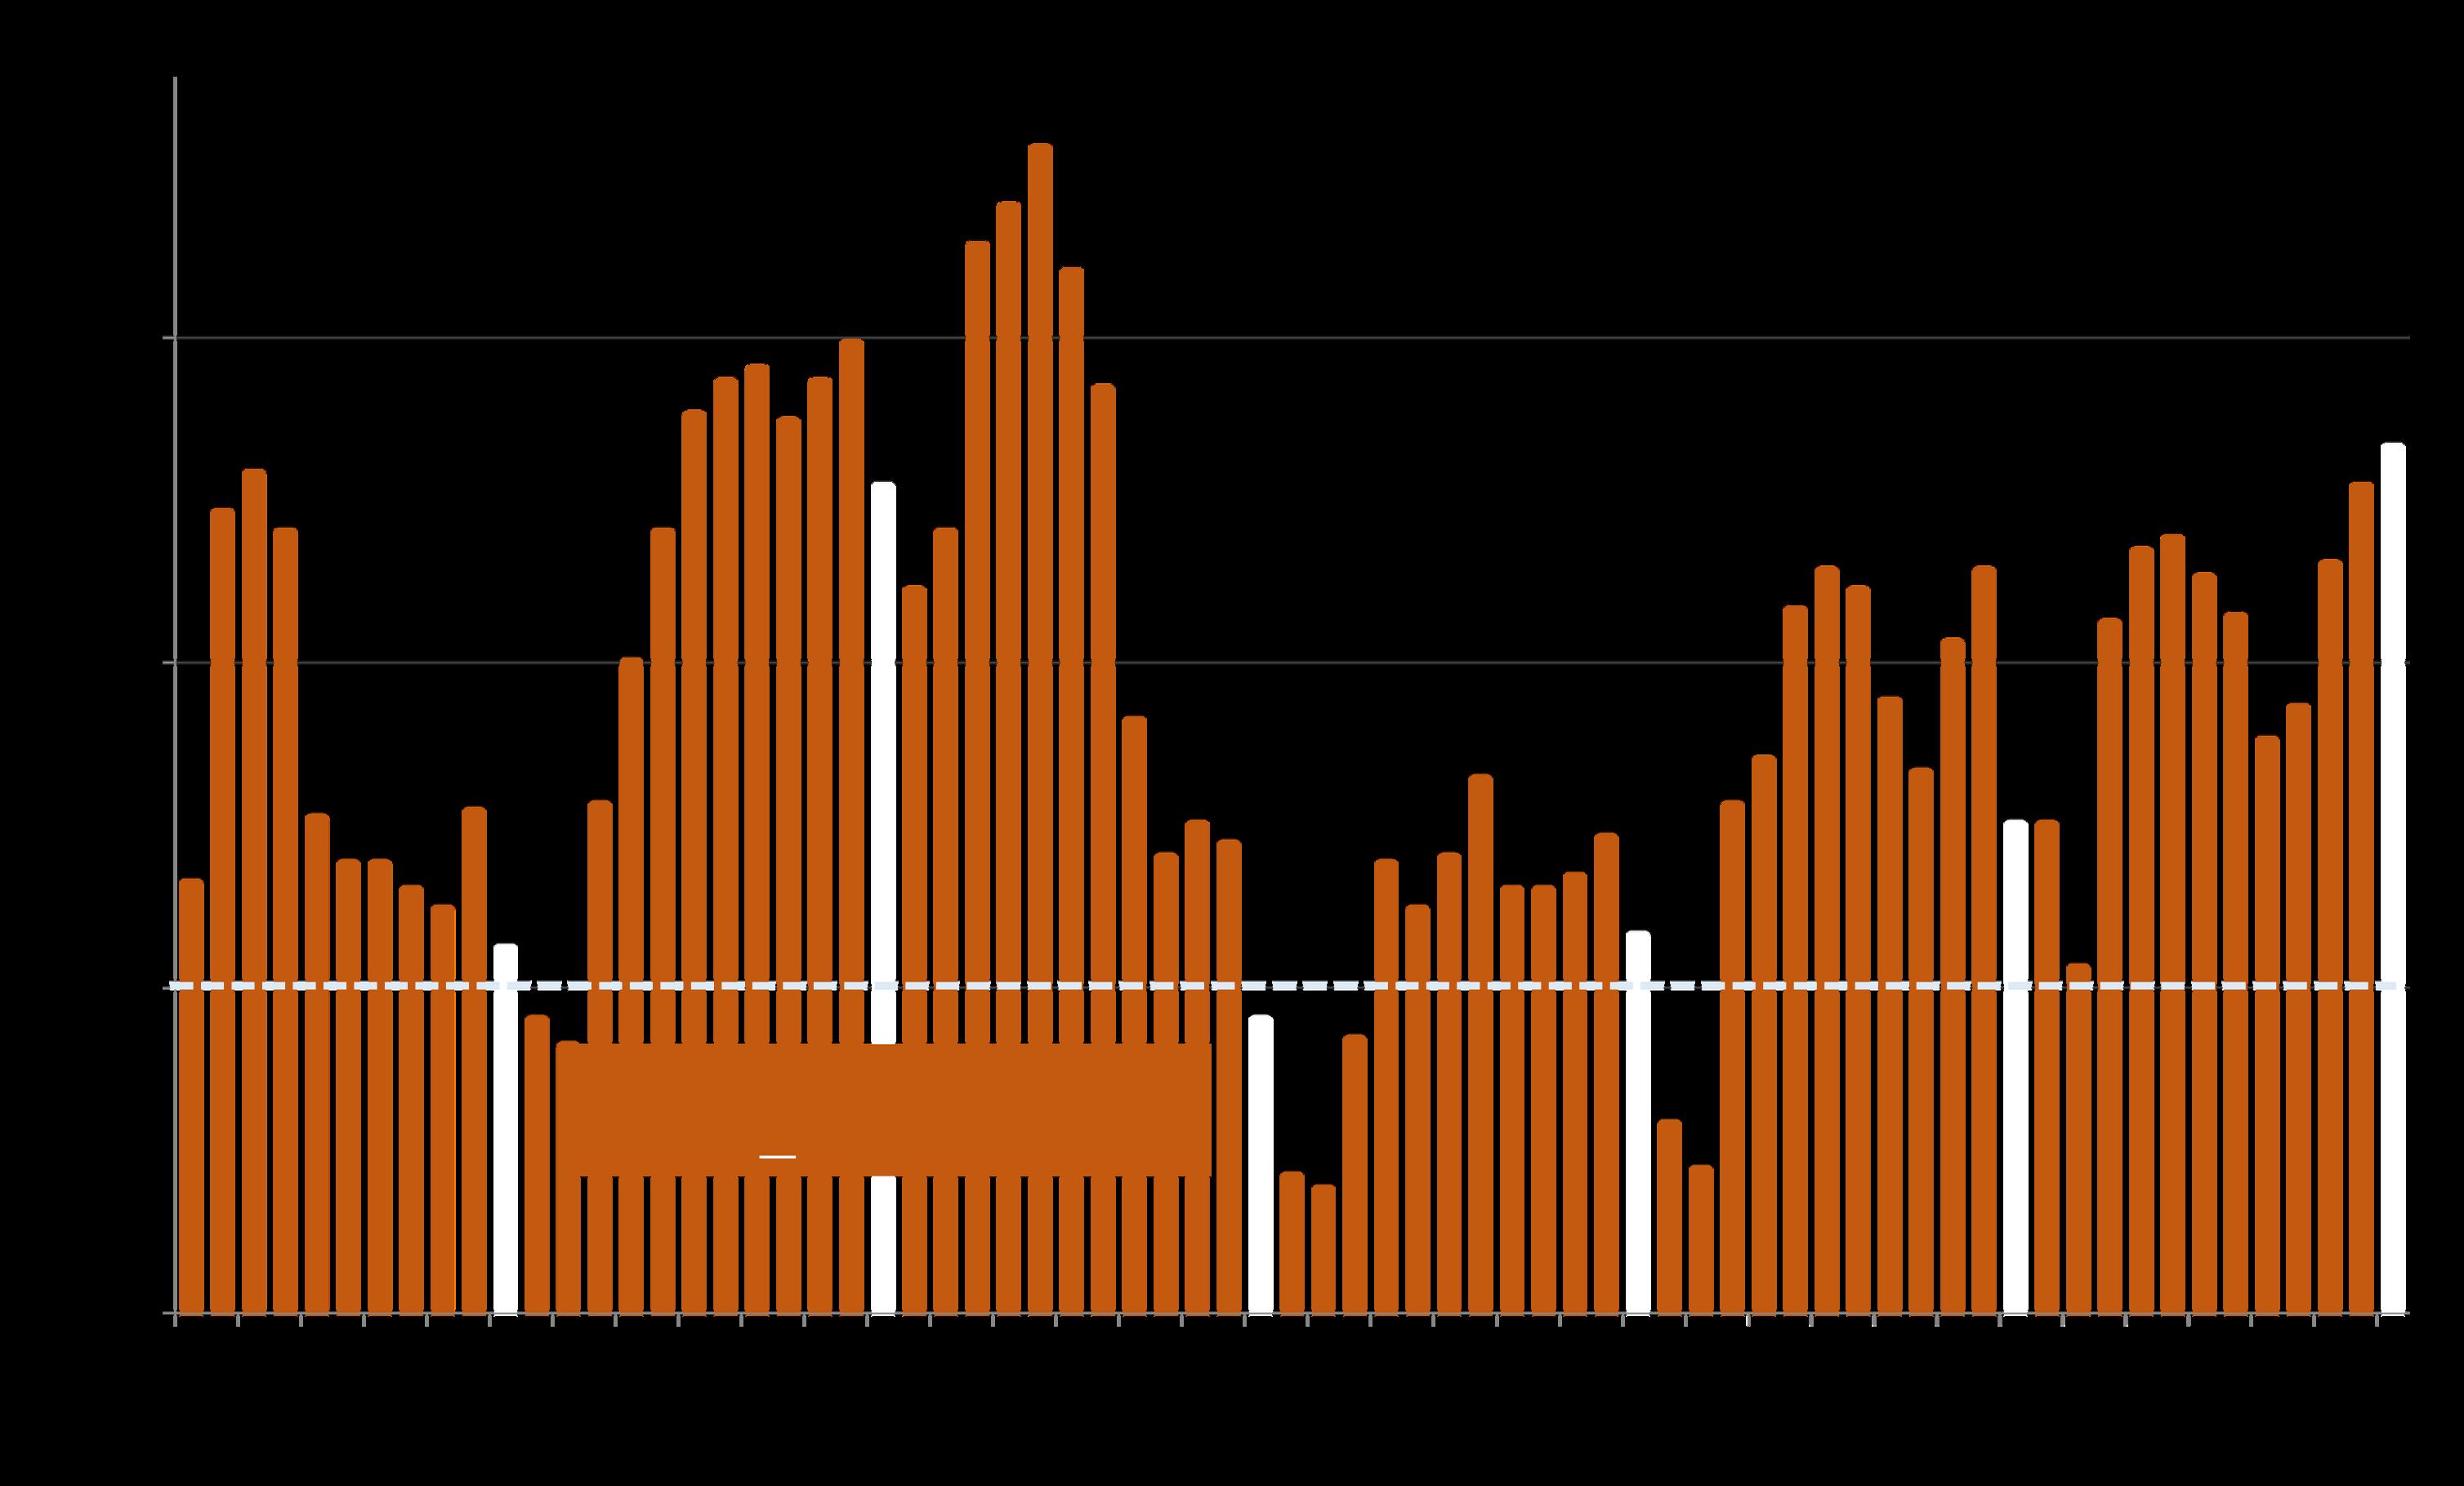
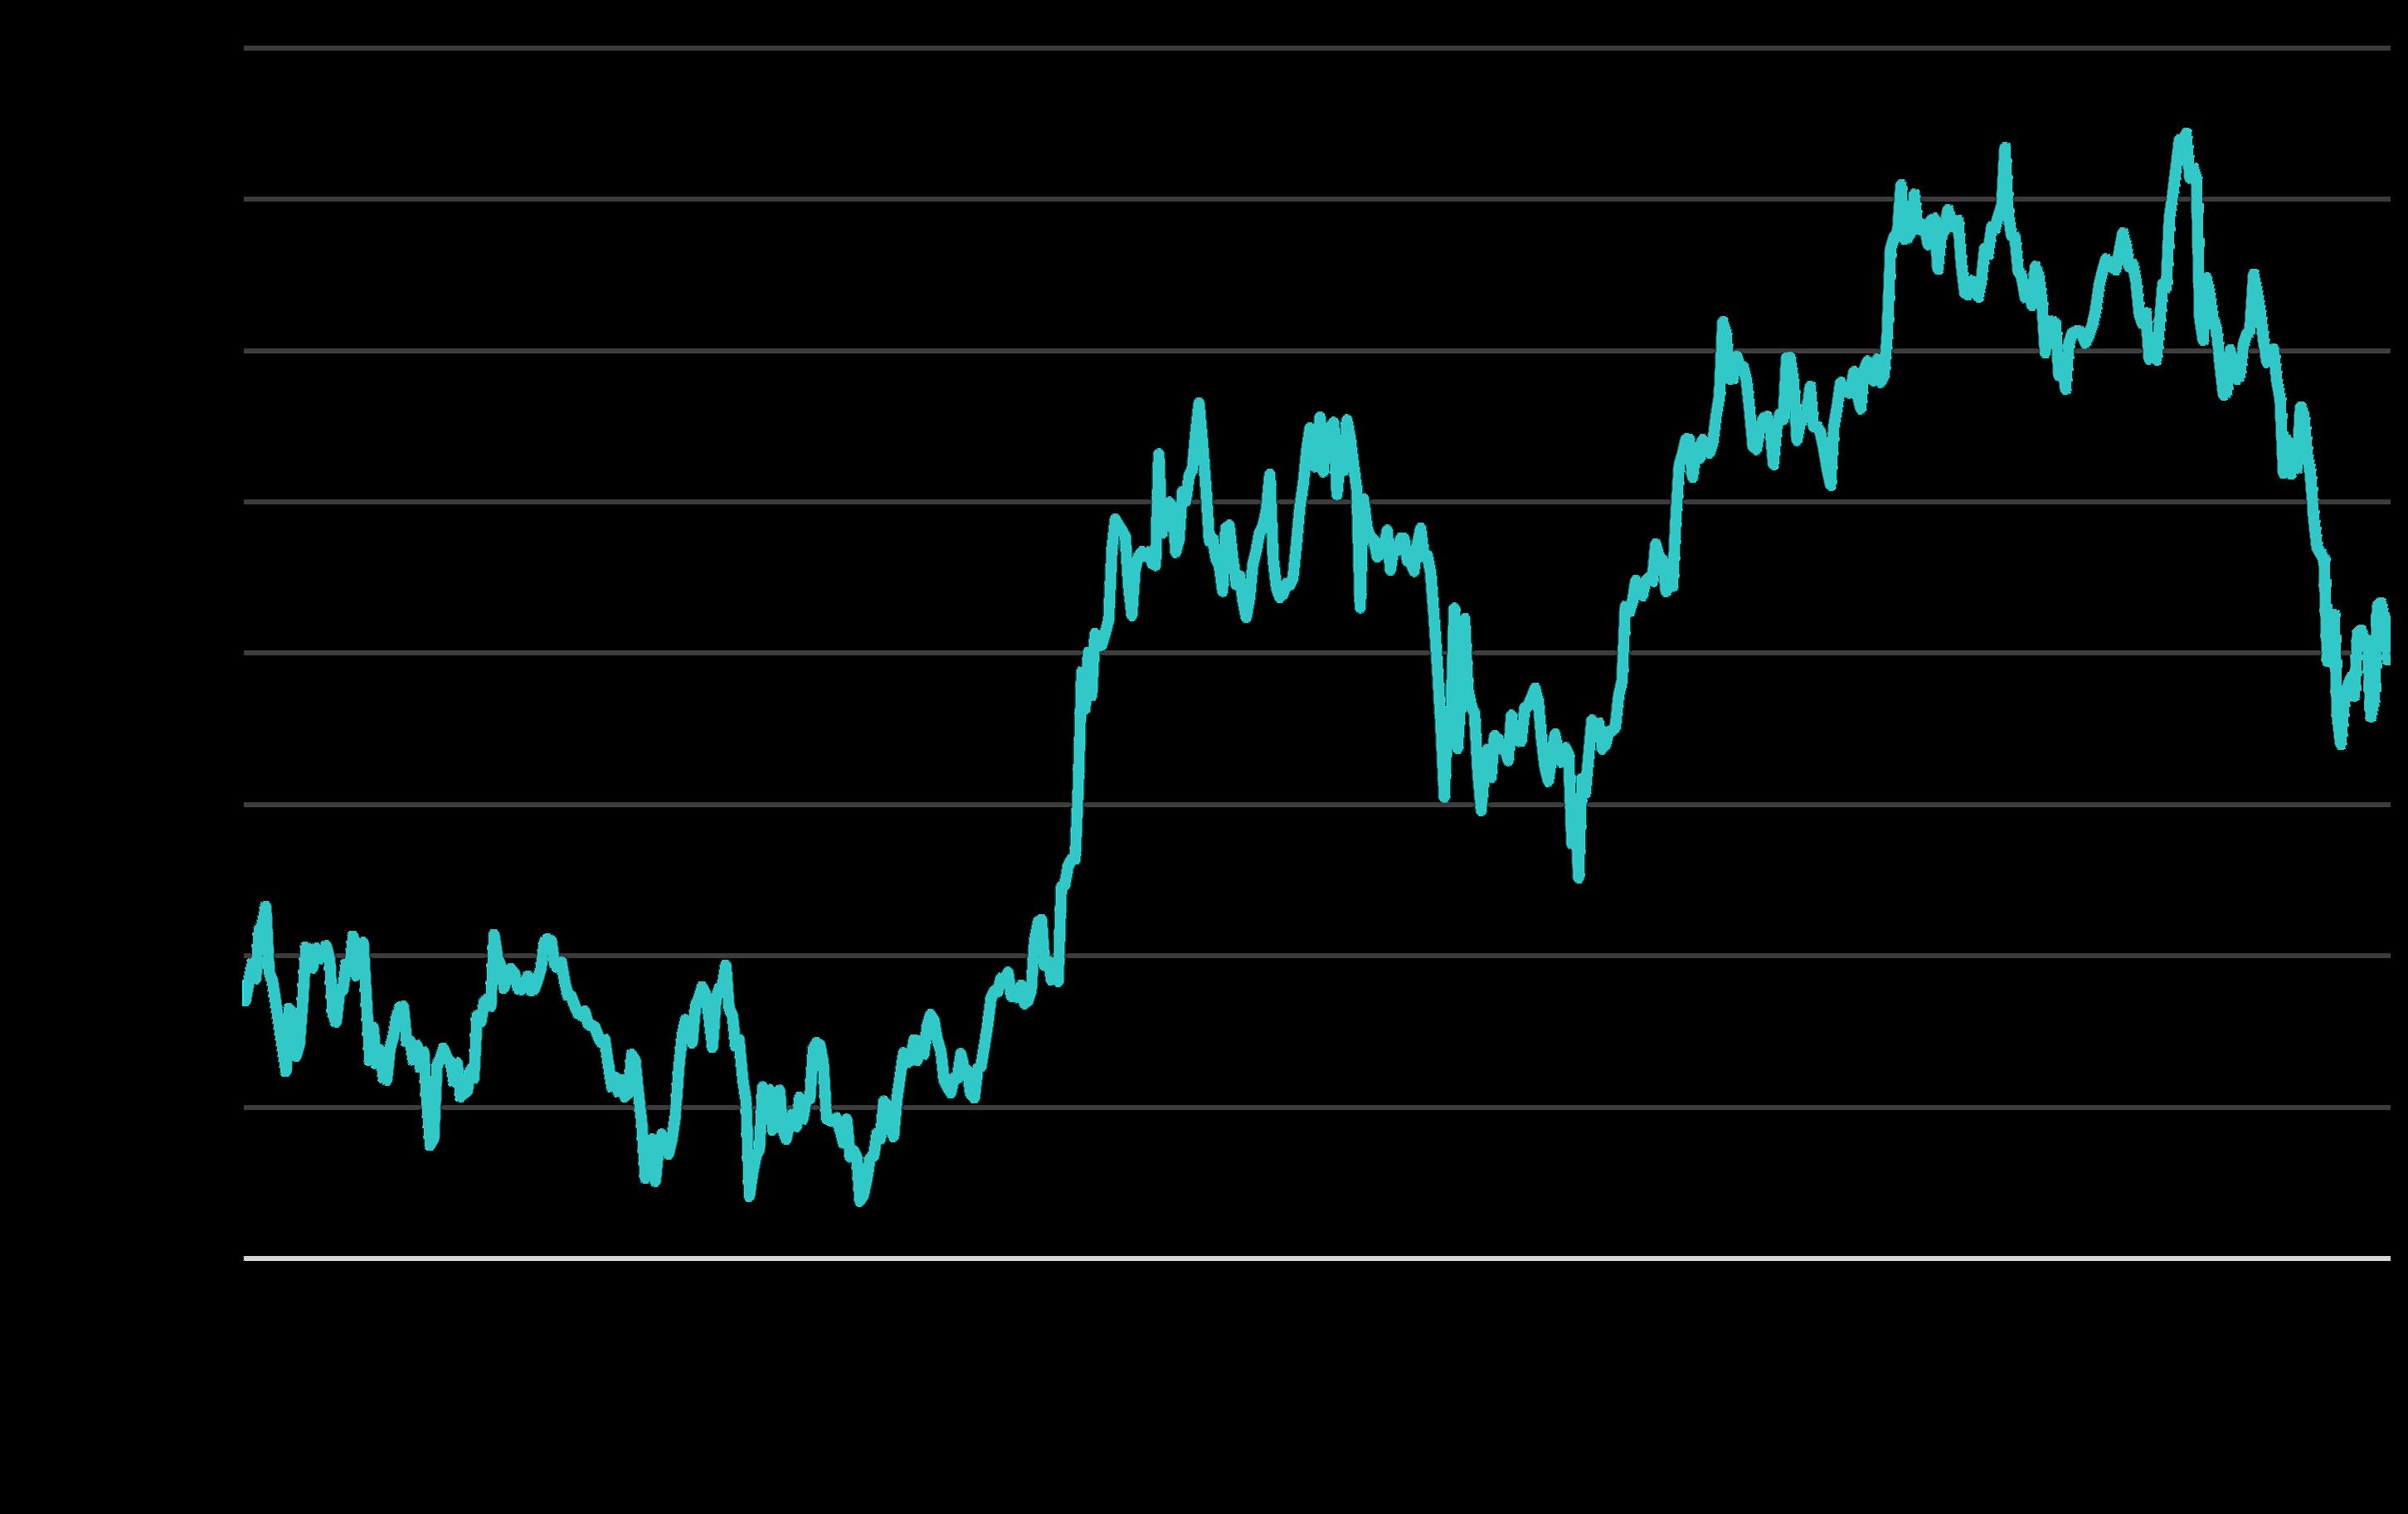
Monthly Median House Sales Prices, 3-Month Rolling
The 3-month-rolling median house sales price in November 2025, $1,800,000, spiked up from October to its highest point since 2022, rising about 9% year-over-year. On a single-month basis (not 3-month-rolling) the median house sales price in November rose 15% year over year.
Median sales price is that price at which half the sales occurred for more and half for less. It is a very general statistic, disguising an enormous range of sales prices in the underlying sales. It is often affected by other factors besides changes in fair market value. Monthly and seasonal fluctuations are common, which explain many of the regular ups and downs in this chart. Median sales prices typically peak for the year in spring.
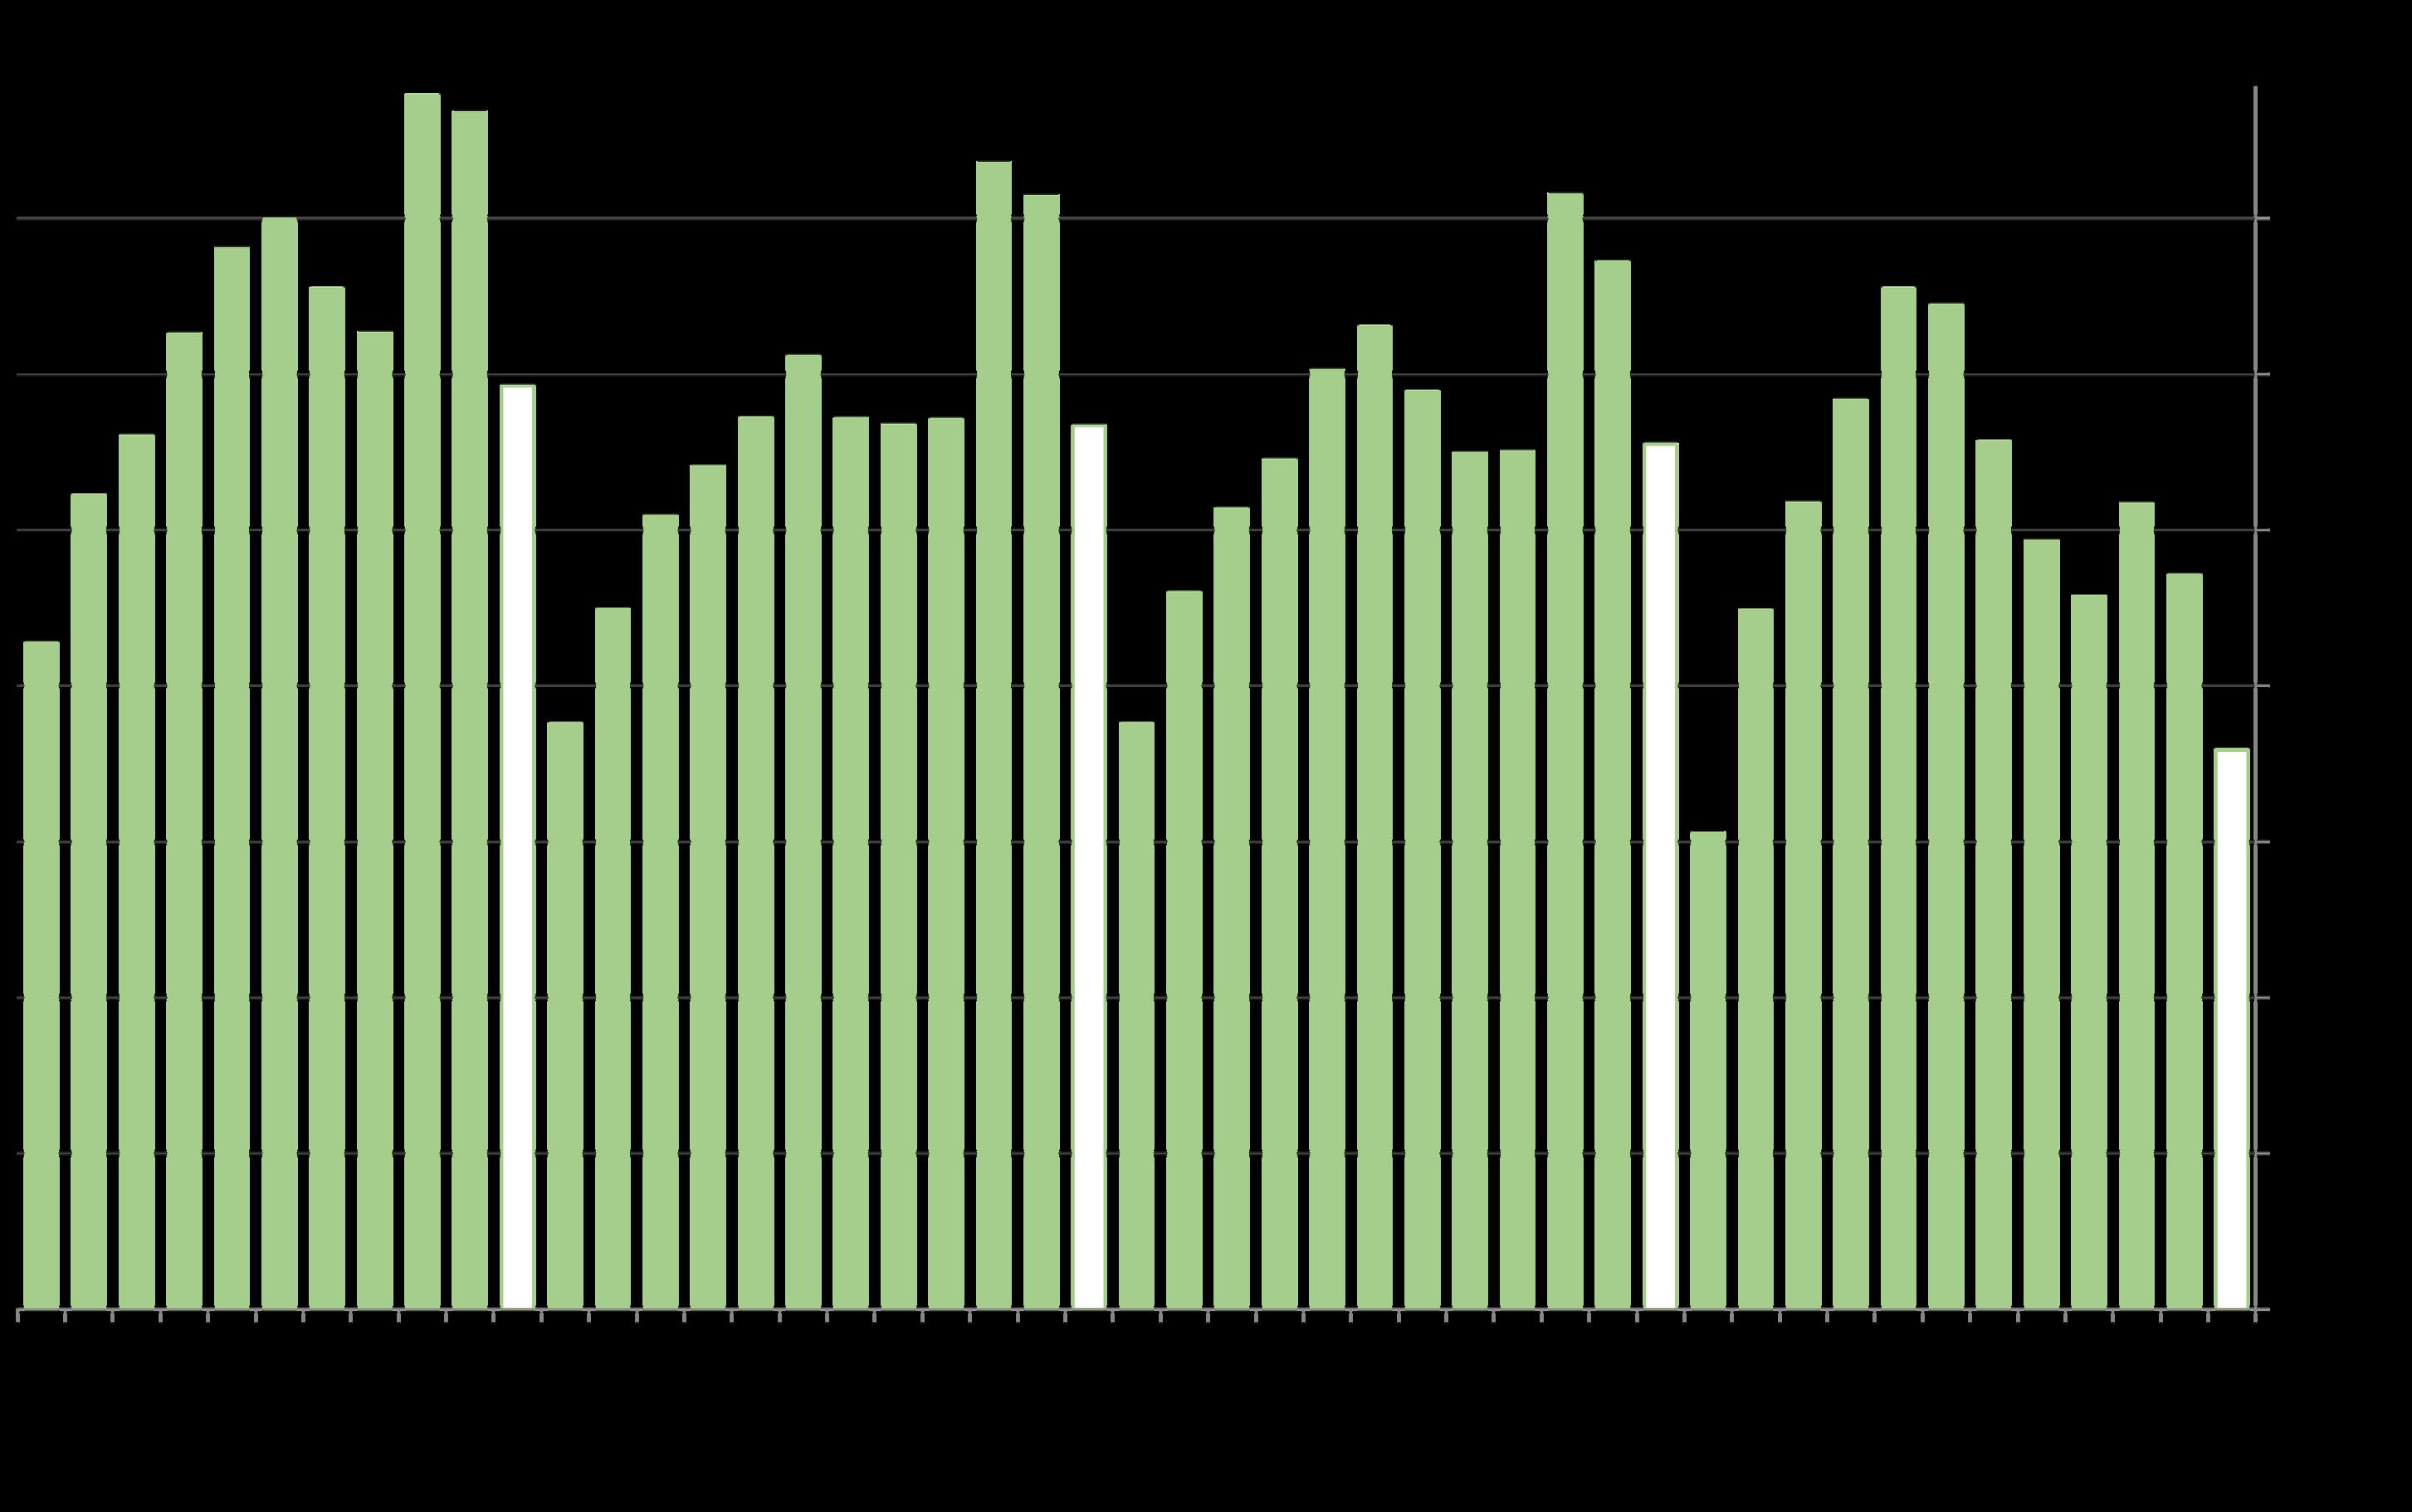
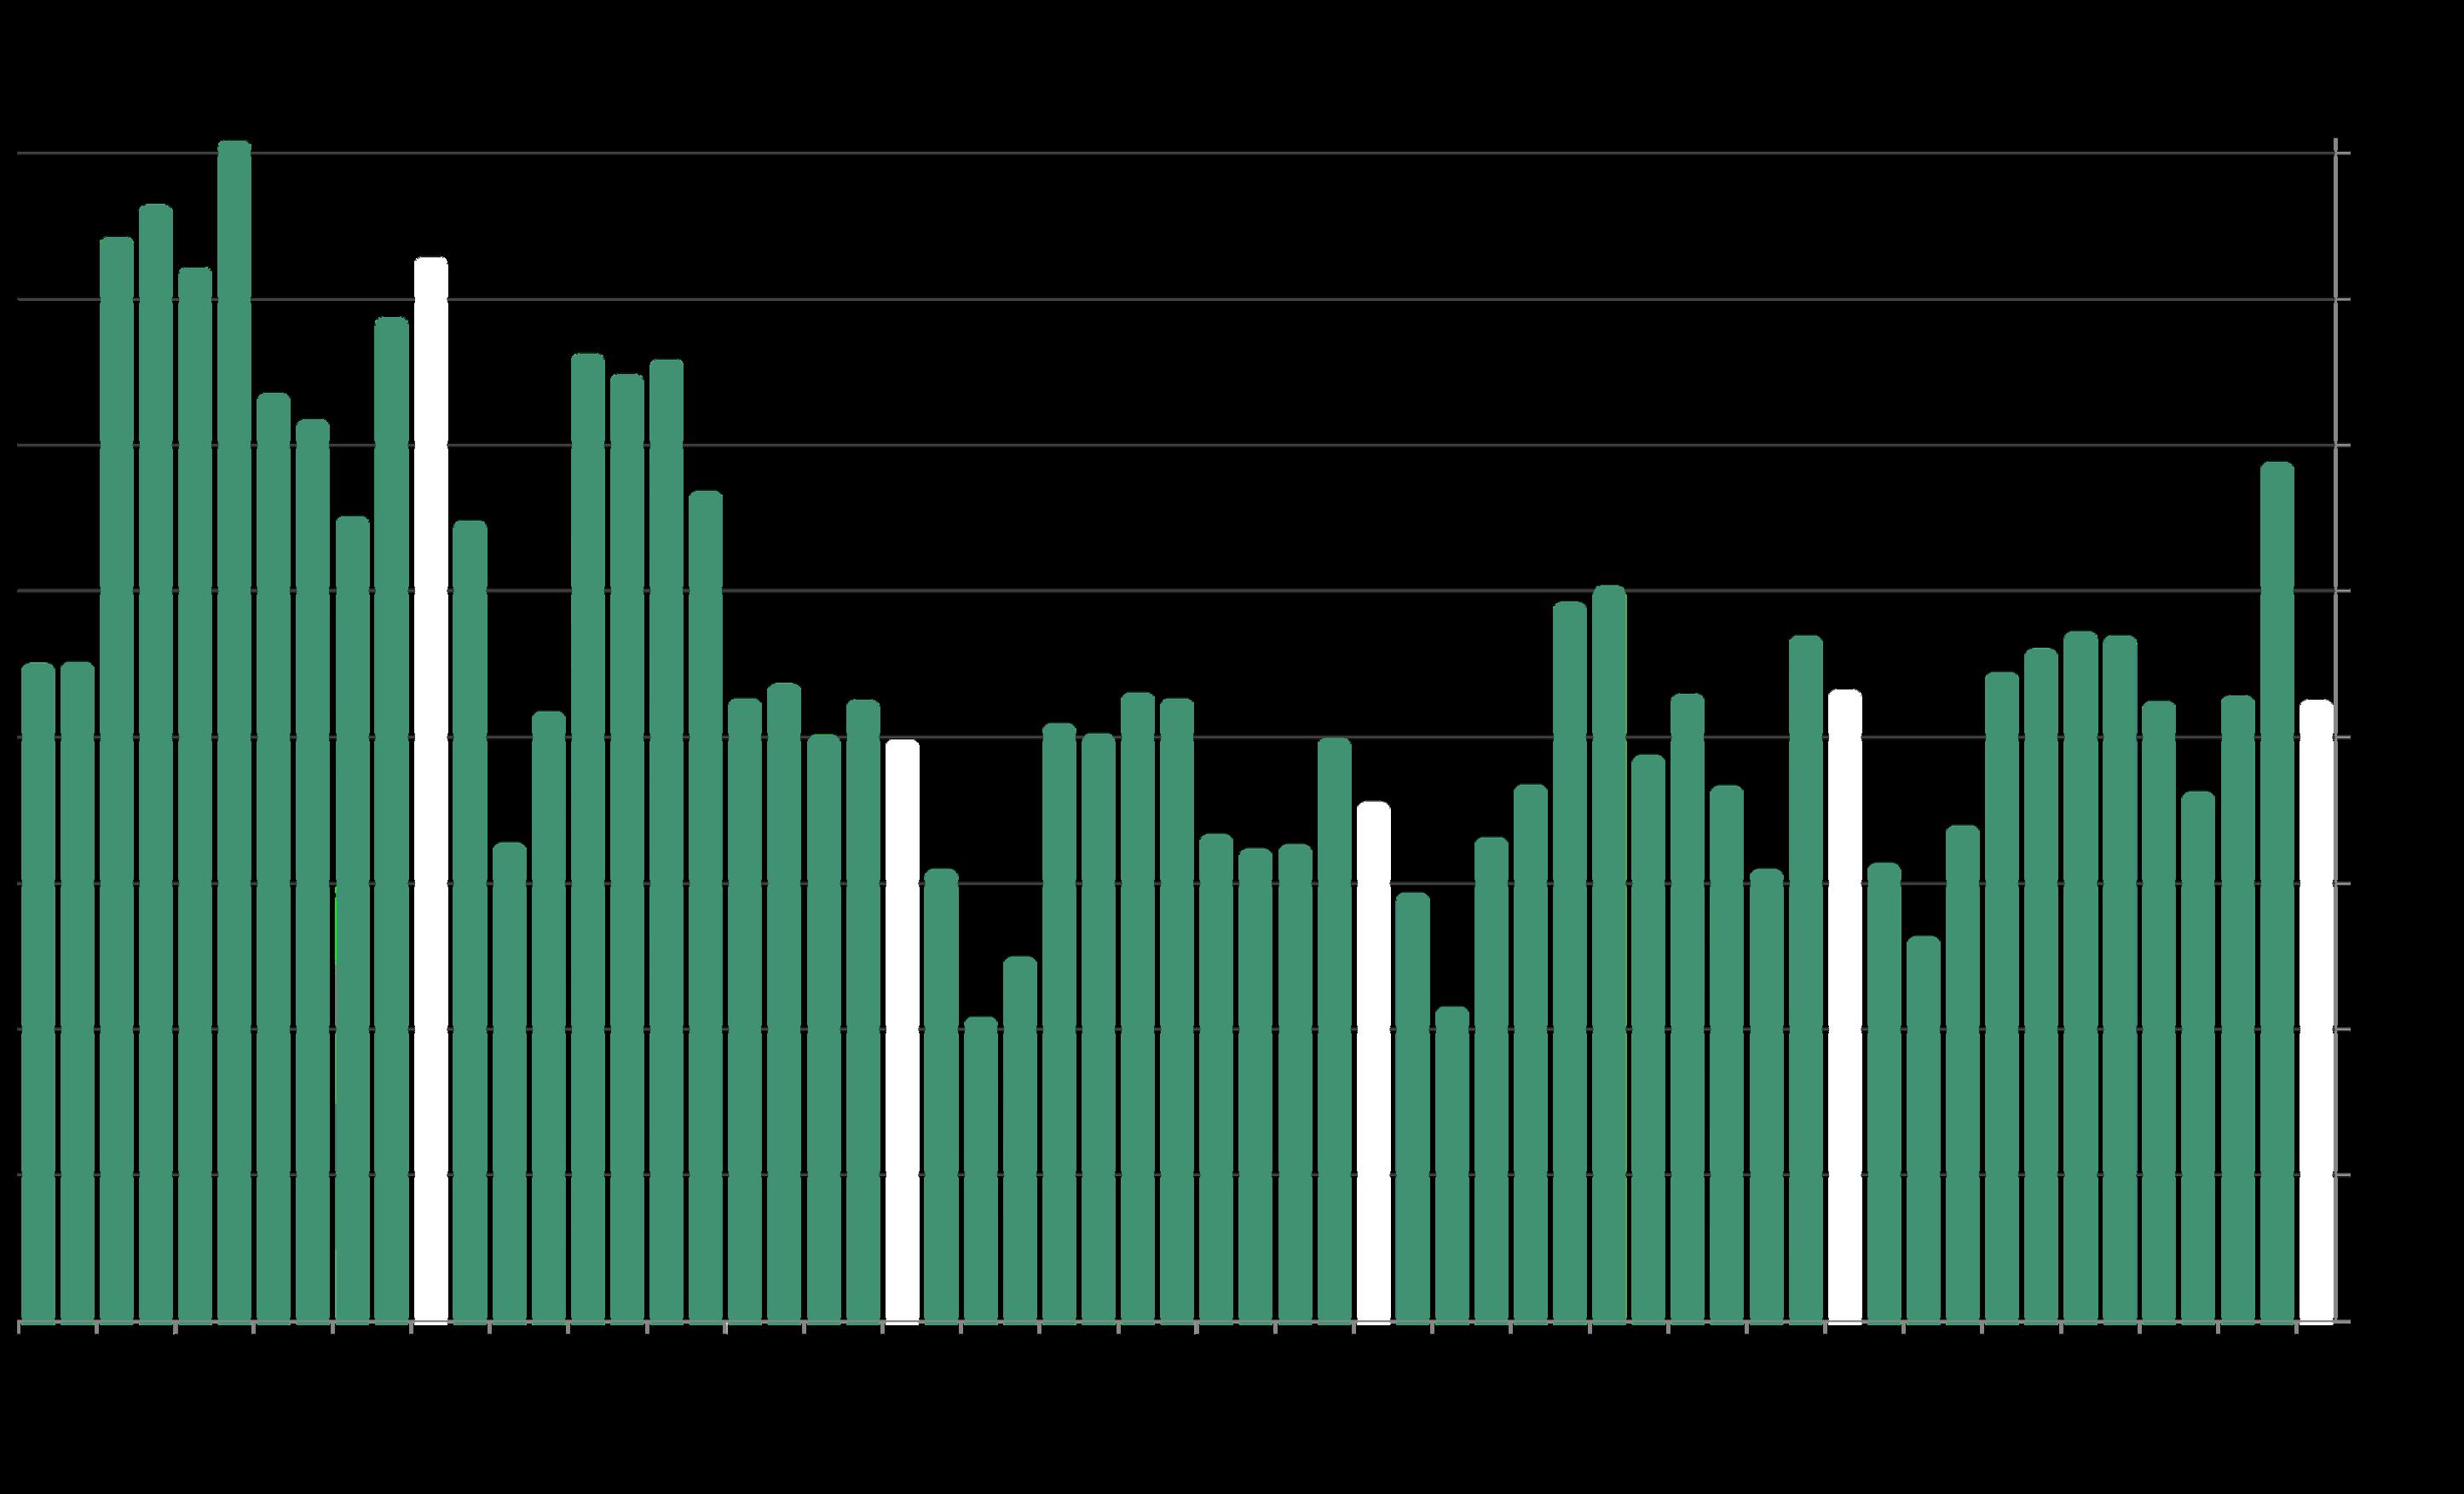
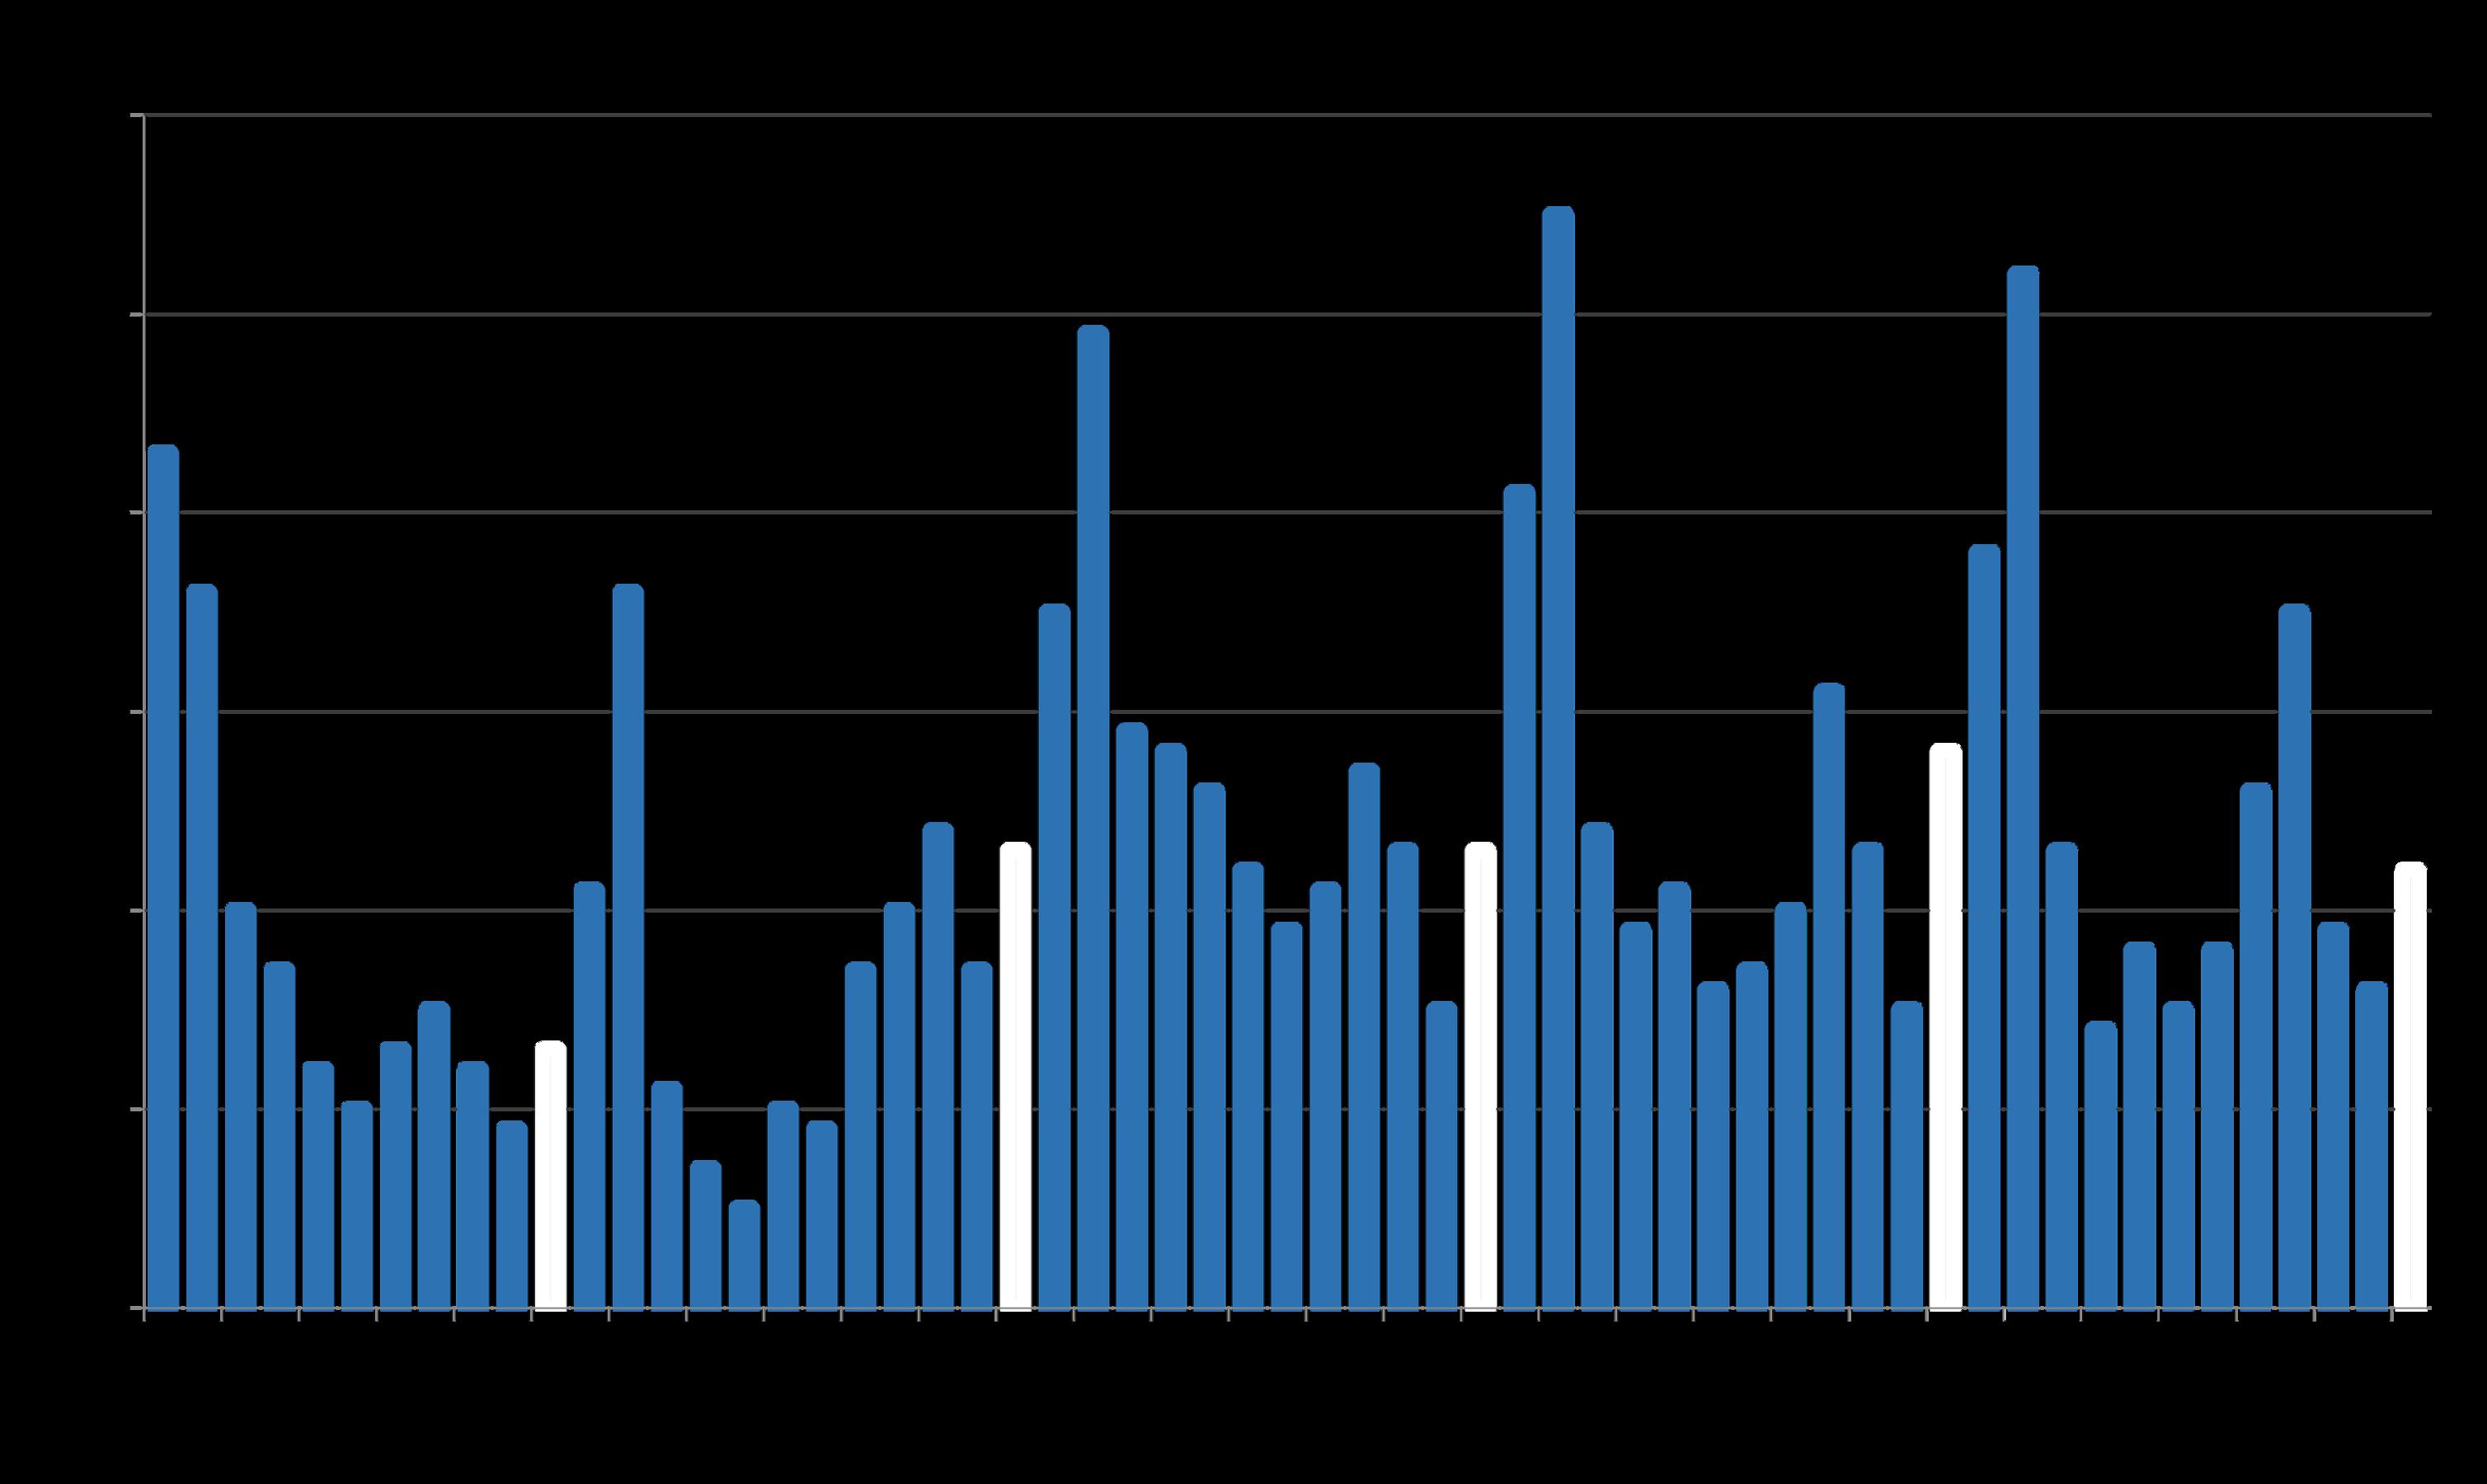
Median 2-Bedroom Condo Sales Price, 3-Month Rolling
Median sales price is that price at which half the sales occurred for more and half for less. It is a very general statistic, often affected by other factors besides changes in fair market value. Monthly and seasonal fluctuations are common, and longer-term trends are more meaningful than short-term changes. Looking specifically at 2bedroom condos helps to ensure that price trends are comparing apples to apples.
The 3-month-rolling median 2-bedroom condo sales price in November 2025, $1,297,500, surged to its highest point since 2022, rising about 6.5% year over year.
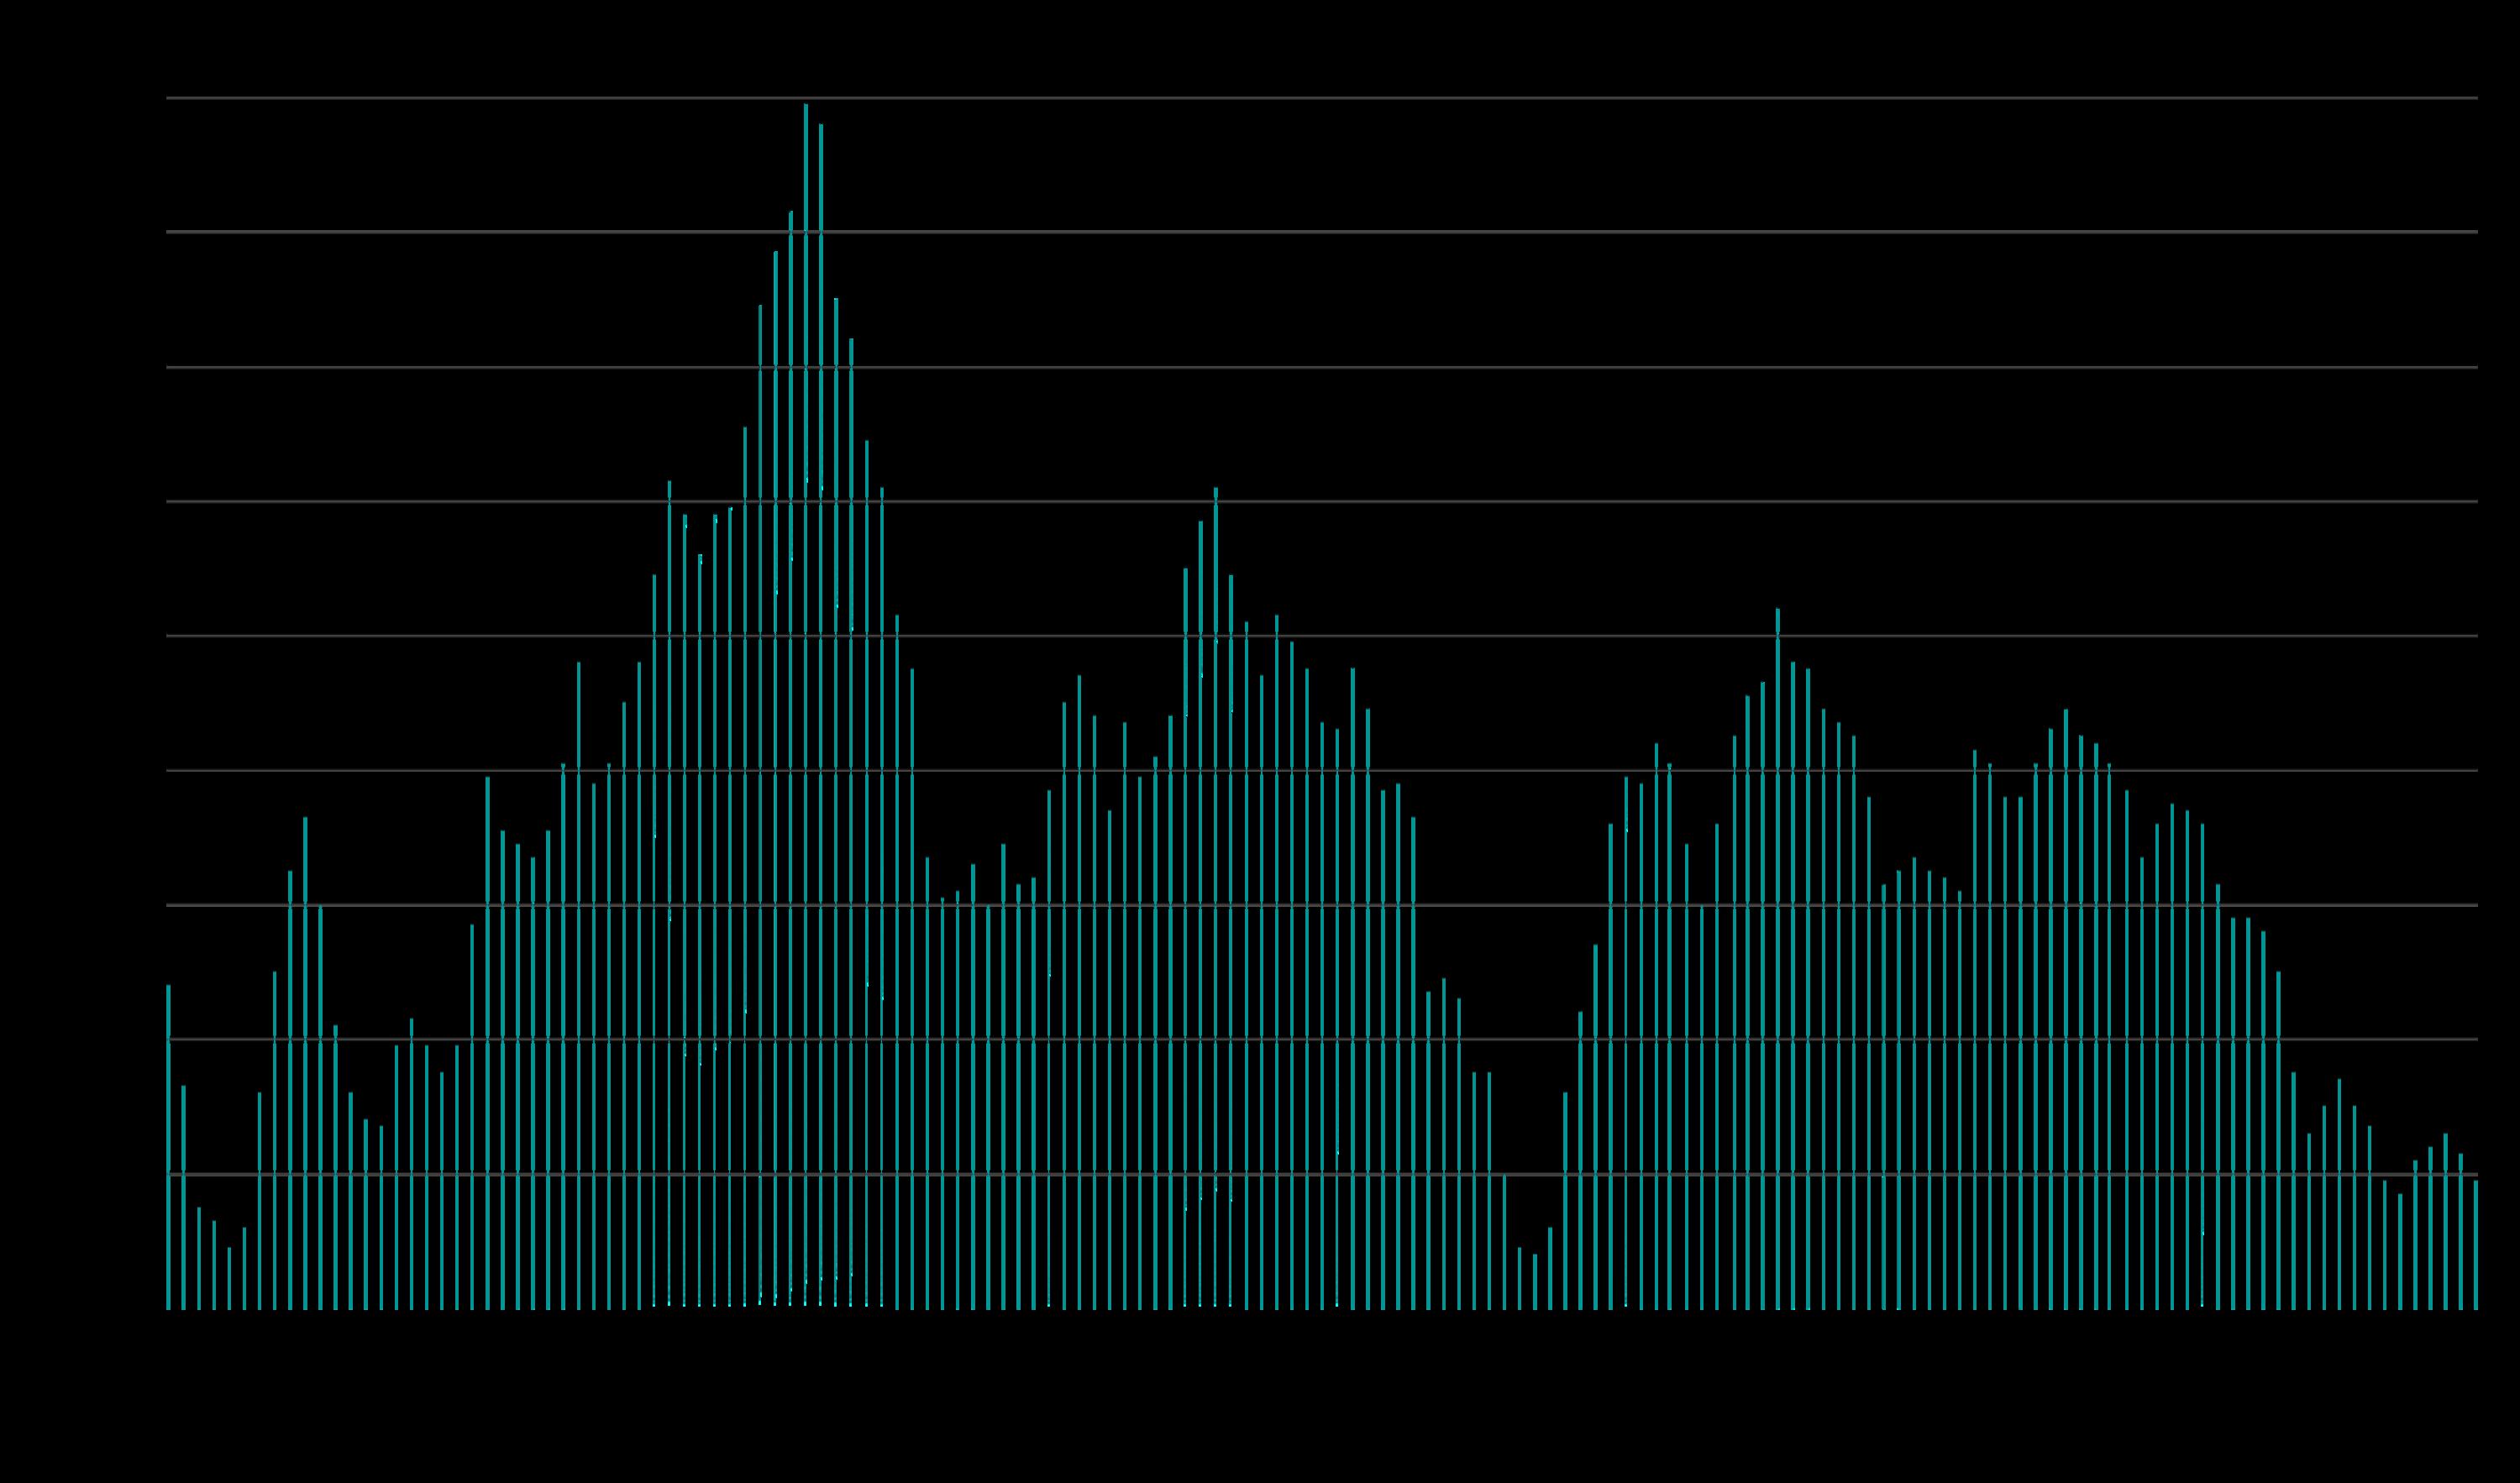
Median $/sq.ft. value is a general statistic, disguising an enormous range of values in the underlying sales. It is often affected by other factors besides changes in fair market value. Monthly and seasonal fluctuations are common, which explain many of the regular ups and downs in this chart.
2005-2006-2007-2008
Great recession & foreclosure crisis
The 3-month-rolling median $/sq.ft. house value in November 2025 rose about 7.5% year over year; the
San Francisco CONDO Prices: Downtown vs. Non-Downtown
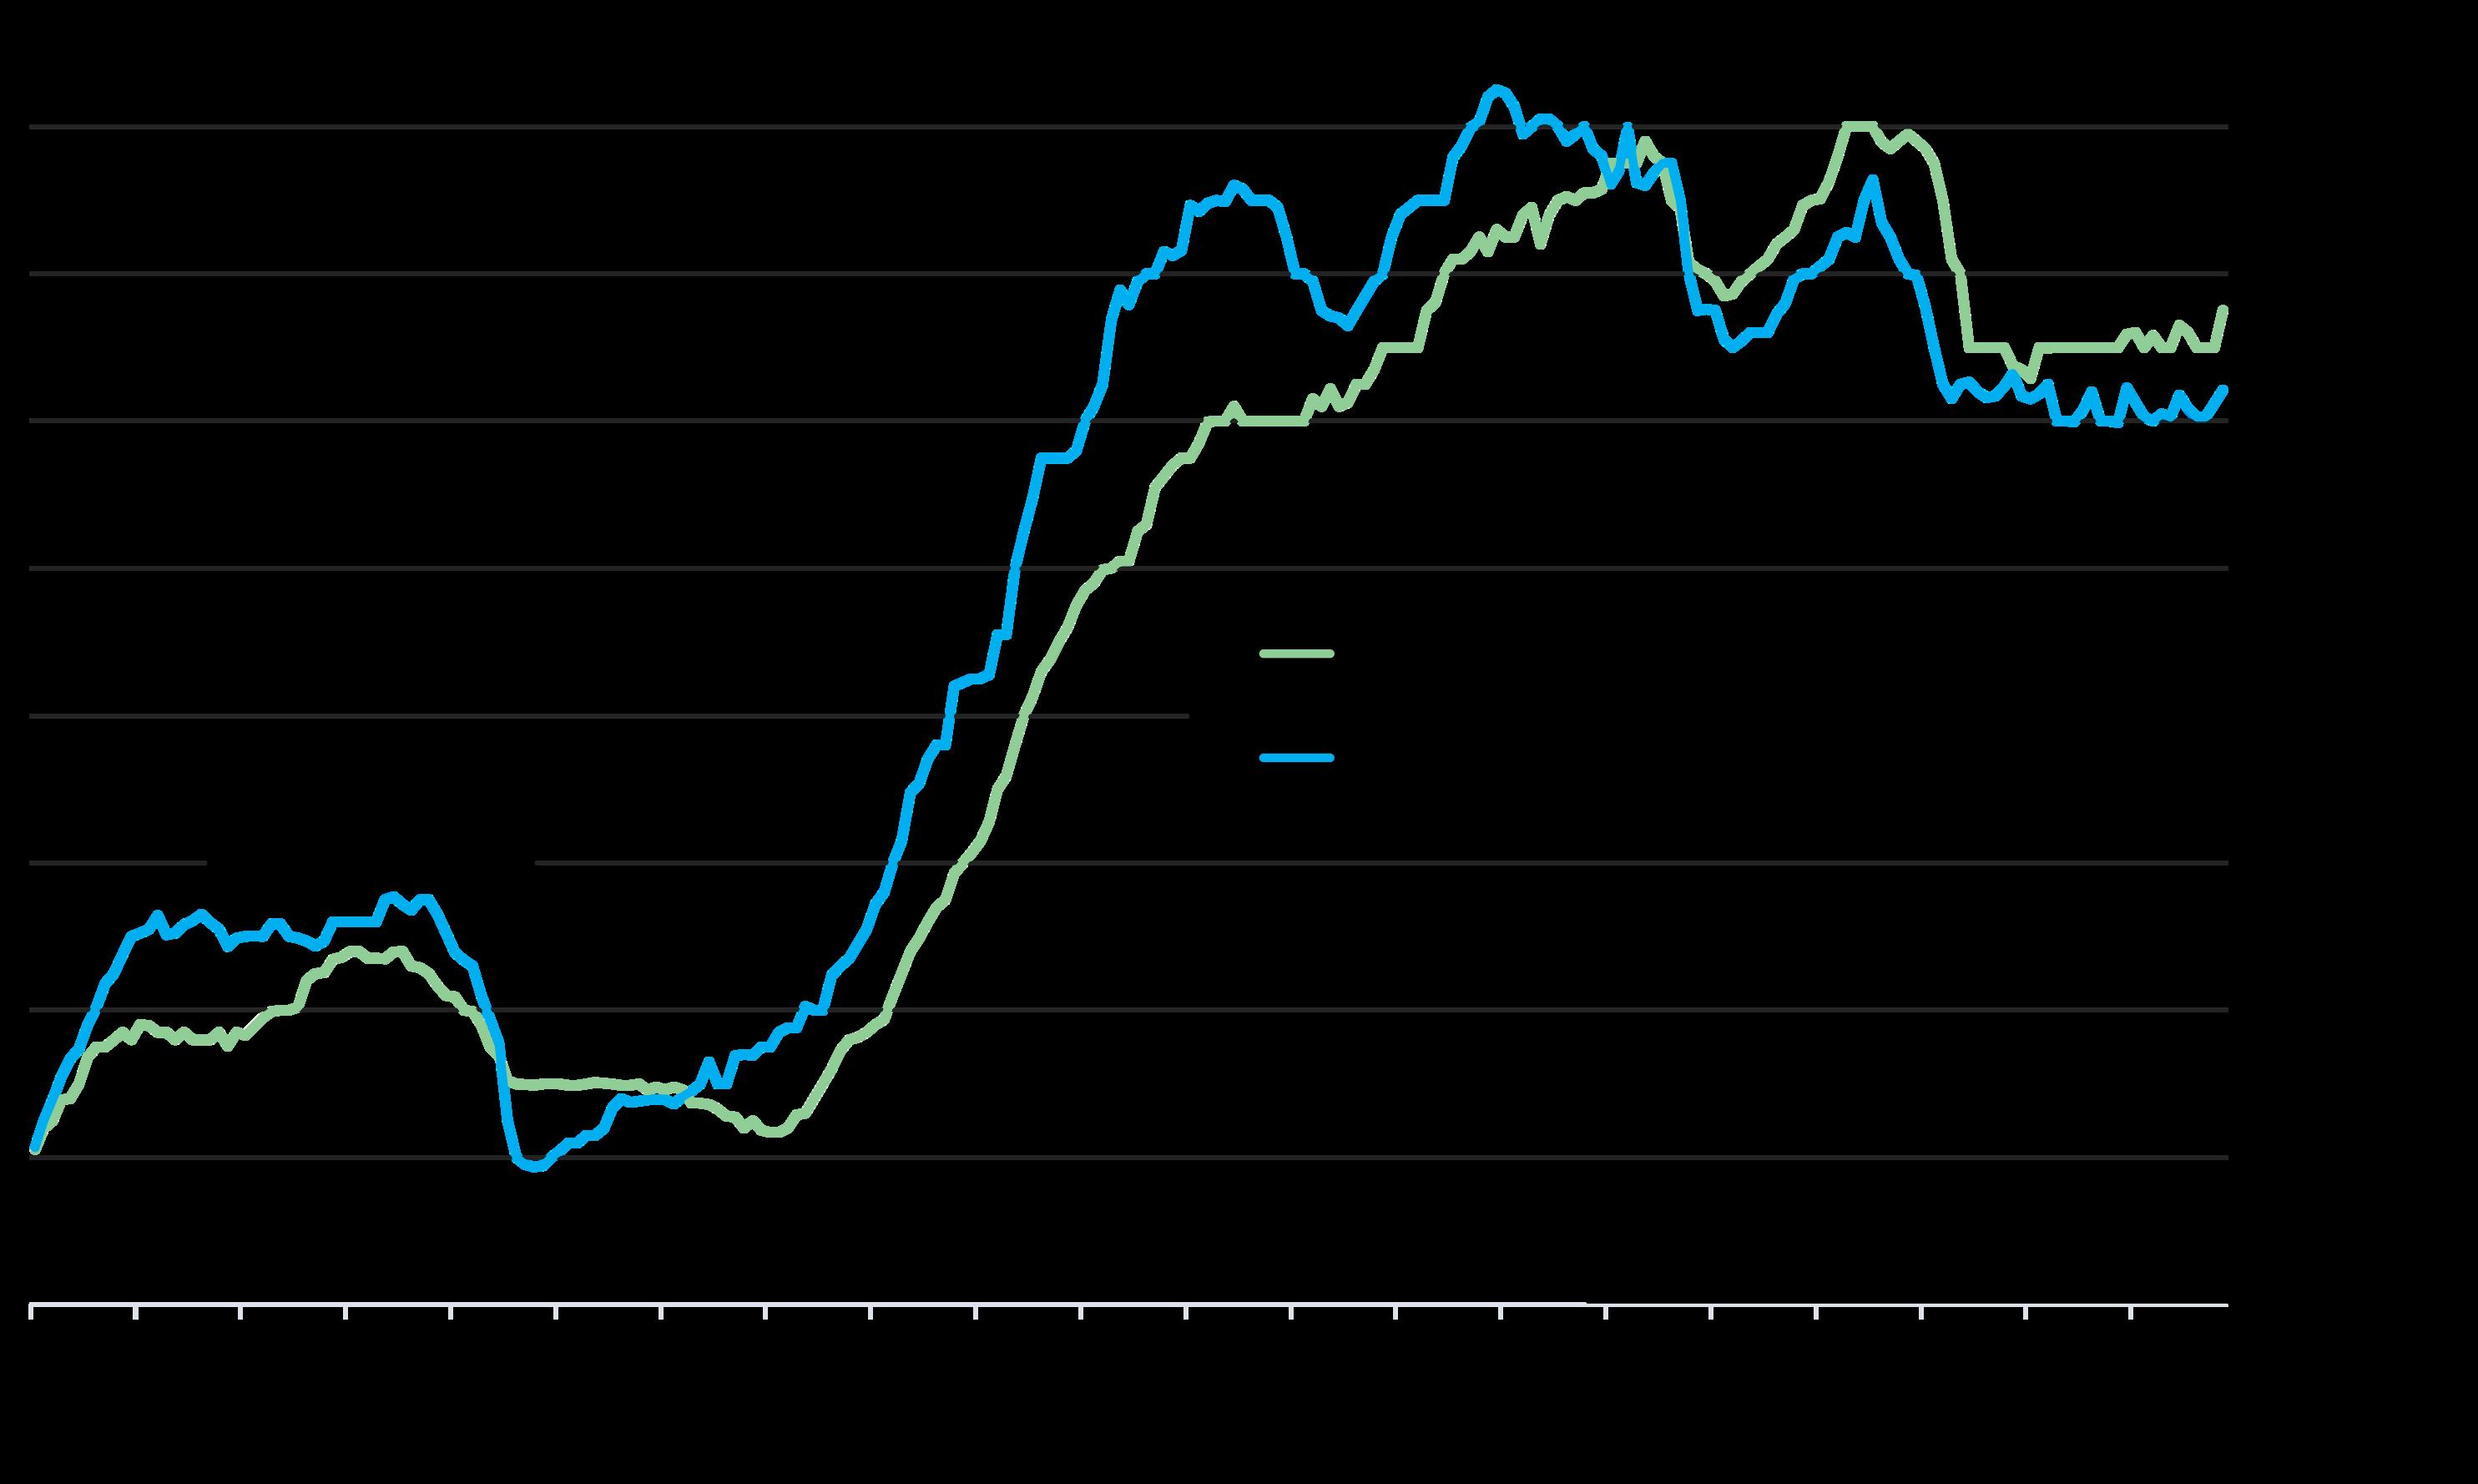
12-Month-Rolling, Median 2-Bedroom Condo Sales Prices since 2005*
Comparing median 2-bedroom condo sales prices in the greater Downtown/South of Market/Civic Center area (the center of large-project, newcondo construction, office buildings and high-tech employment) – the blue line – with the rest of San Francisco (mostly smaller, older buildings, in less urban environments) – the green line.
Median sales prices also vary widely within these two broad regions.
Great recession, foreclosure crisis
Condo Market in Non-Downtown Area
Greater Downtown/SoMa Condo Market
*12-month rolling median condo sales values reported to NorCal MLS Alliance, per Infosparks. Analysis may contain errors and subject to revision. Does not include new-project sales unreported to MLS. All numbers approximate and may change with late-reported sales. 2007-2008
NOTE: 12-month-rolling sales data smooths the median sales price trend lines and removes seasonality from the analysis, but it can lag short-term changes in 2025.
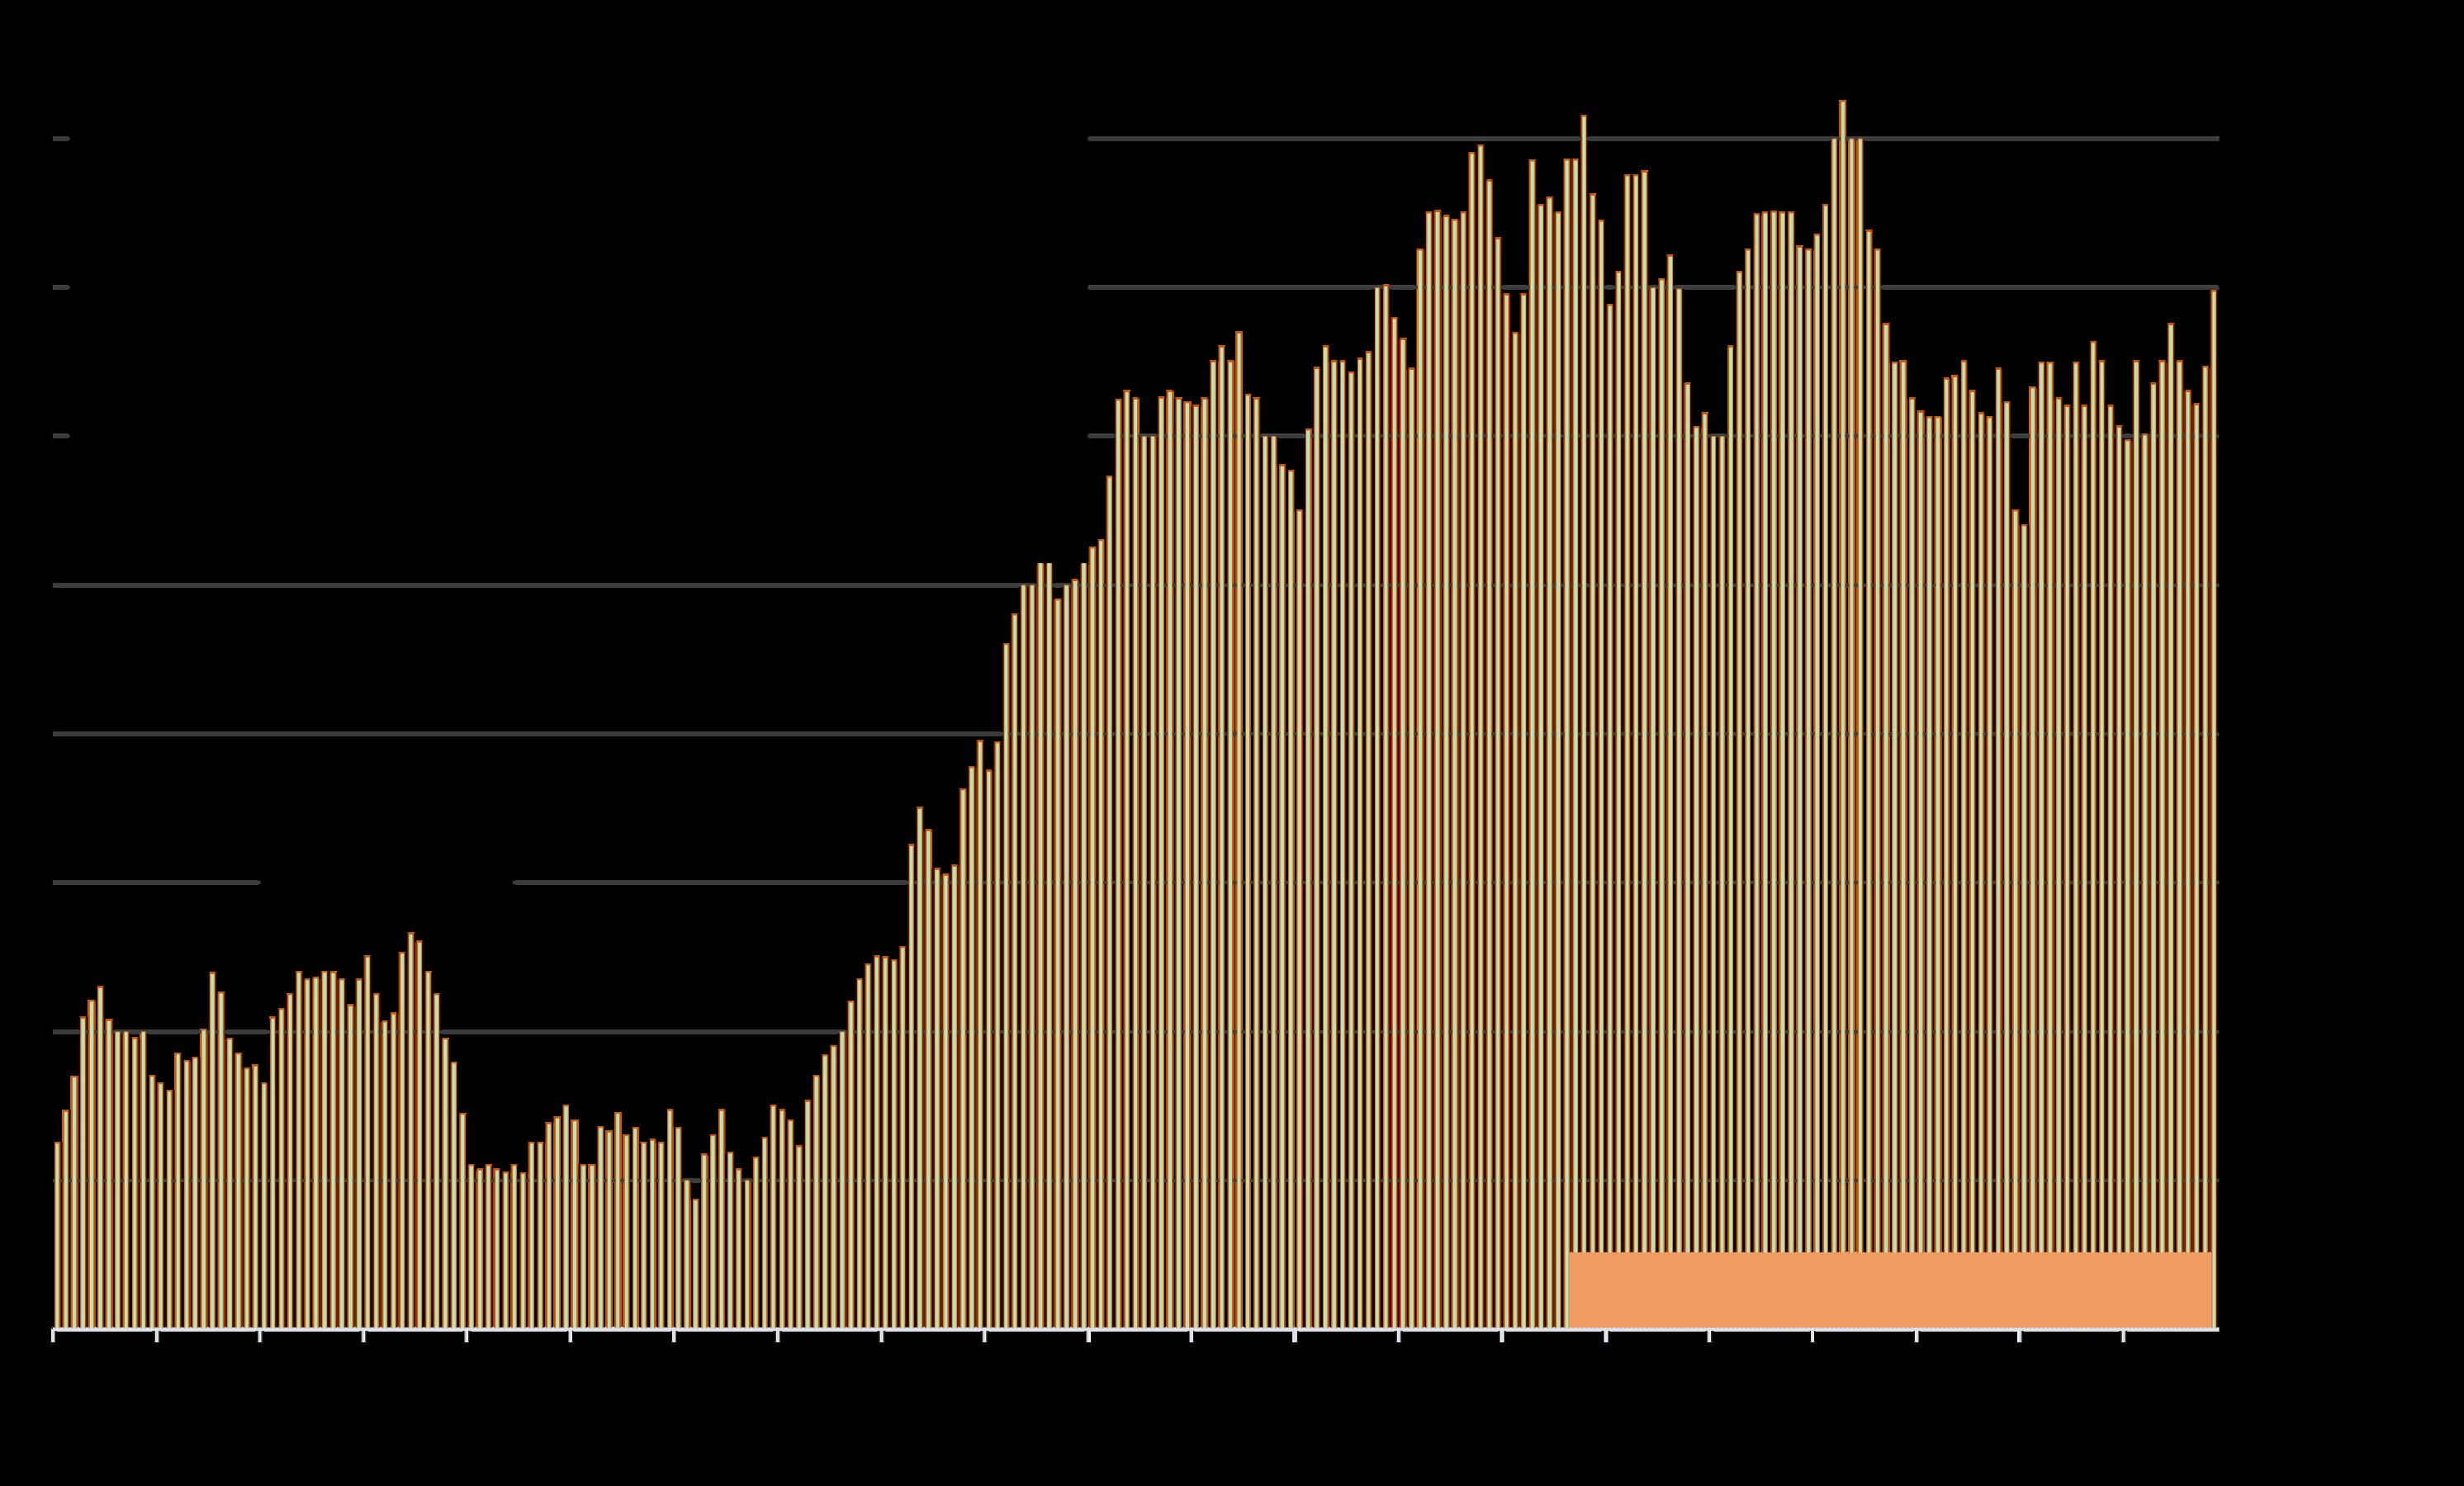
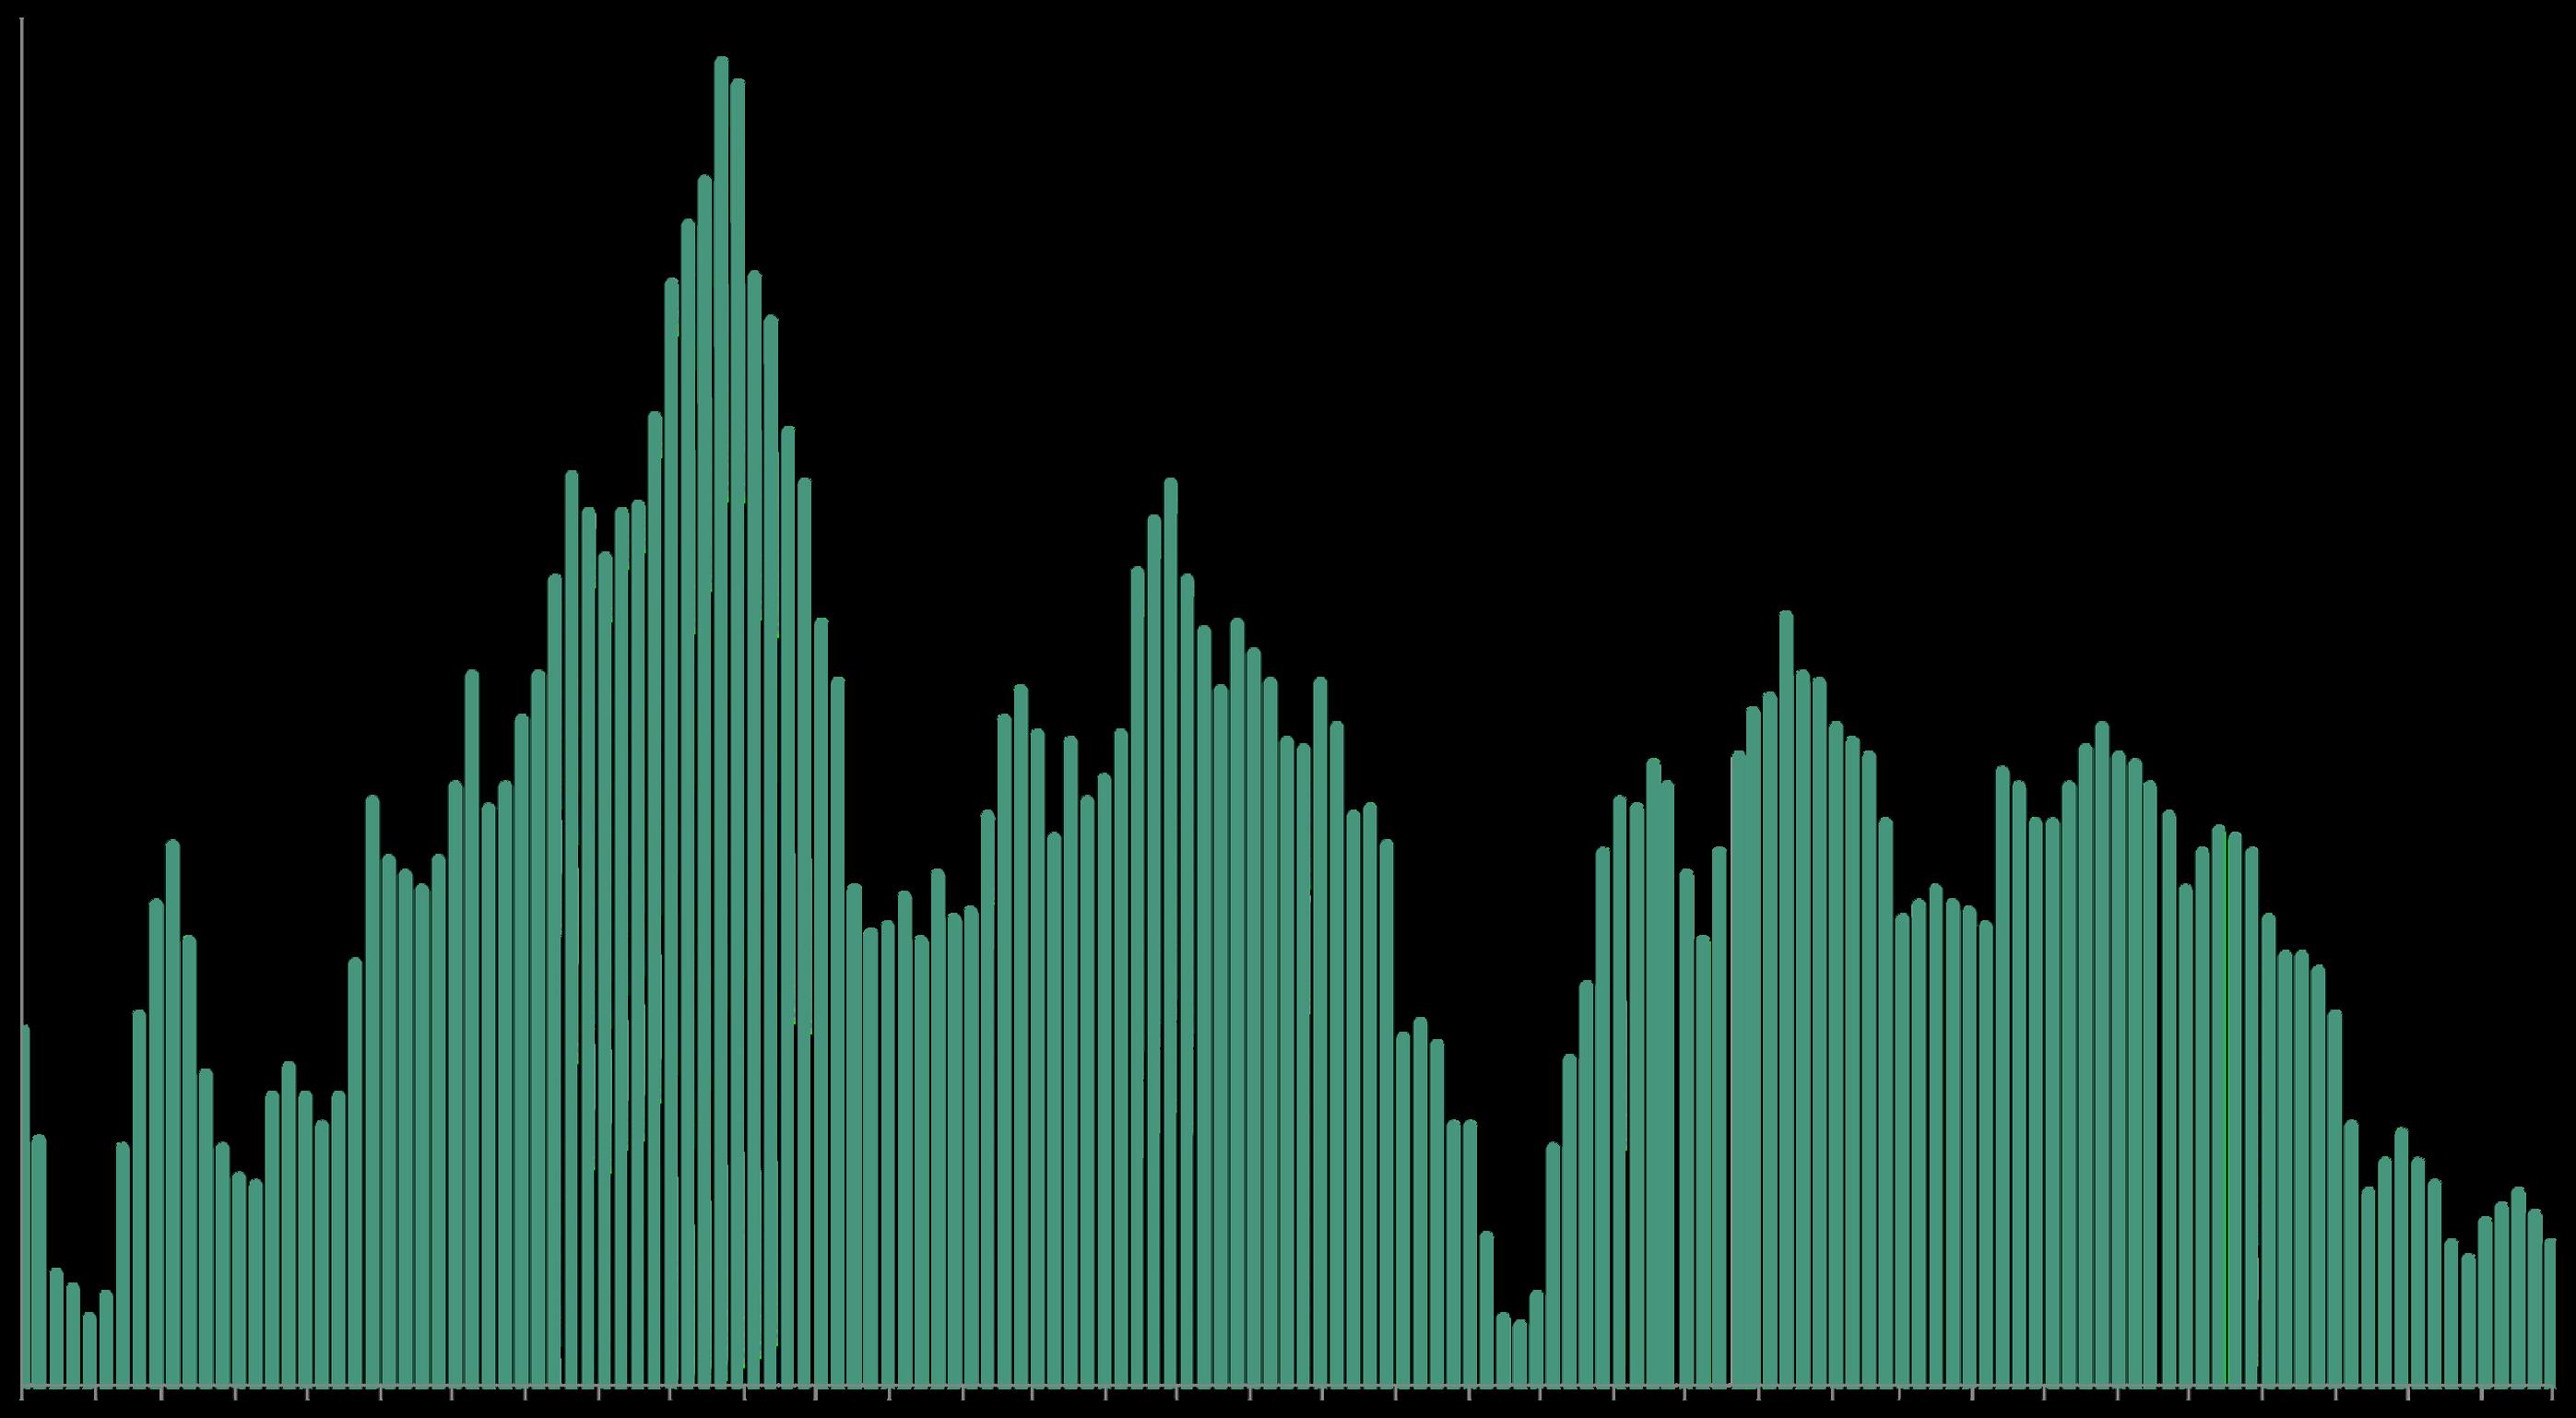
The number of new listings typically climbs through spring, declines in mid-summer, soars in September, and plunges in December.
As is the common seasonal trend, the number of new listings continued to plummet in November – and will typically hit its nadir in December.
*Listings posted to NorCal MLS Alliance. Data from sources deemed reliable but may contain errors and subject to revision. May not include “coming-soon” listings. All numbers approximate.
The number of listings for sale on 12/1/25 fell substantially from the previous month and plunged 35% year over year. 25% of listings were houses, 60% condos, 9% TICs, 5% coops, and 1% townhouses. Listing inventory typically continues to plummet within December.*
The # of active listings on a given day is affected by 1) the # of new listings coming on market, 2) how quickly buyers put them into contract, 3) the sustained heat of the market over time, and 4) sellers pulling their homes off the market without selling.
* Houses, condos, co-ops, TICs, townhouses: Active/Coming-Soon listings posted to NorCal MLS Alliance. Does not include new-project condosnot listedonMLS. Data fromsourcesdeemedreliablebutmaycontain errors and subject to revision. All numbers approximate. The # of active listings changes constantly.
San Francisco Homes for Sale
# of Listings by Days on Market, 12/2/25*
As of 12/2/25, 57% of active listings have been on the market for over 2 months without selling; 32% for over 3 months; and 15% for over 6 months.*
► December is typically the month when buyers can negotiate most aggressively, especially on listings with longer
on market.
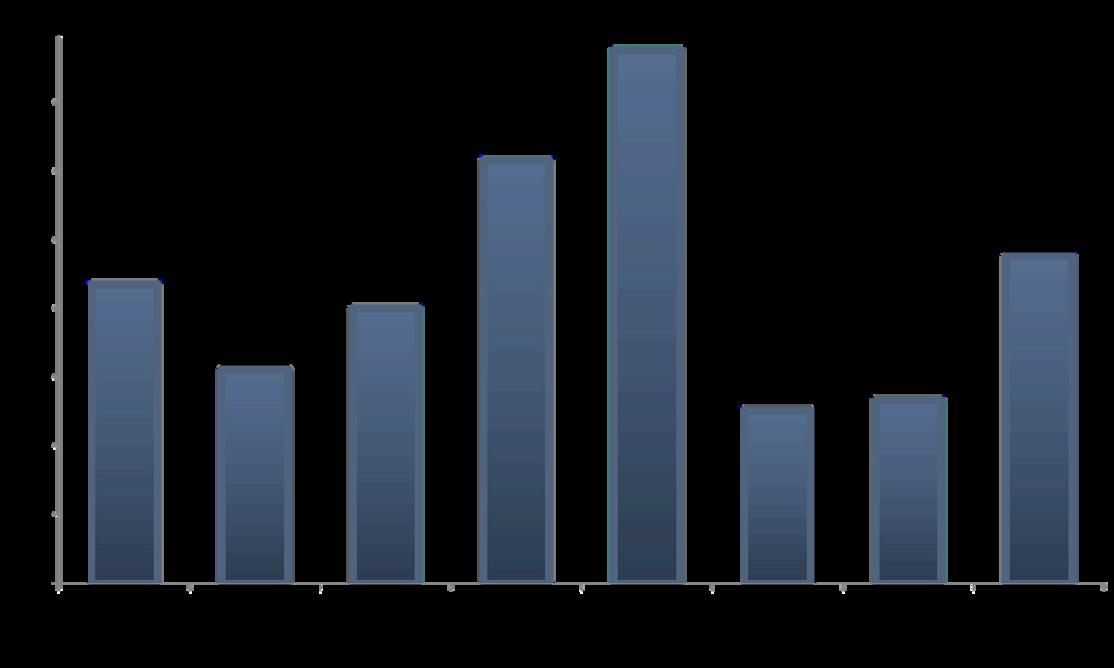
Active Listings over 90 Days on Market by Price Segment*
Under $1,000,000
$1m to $1,999,999
$2m to $2,999,999
$3m to $4,999,999 $5,000,000+
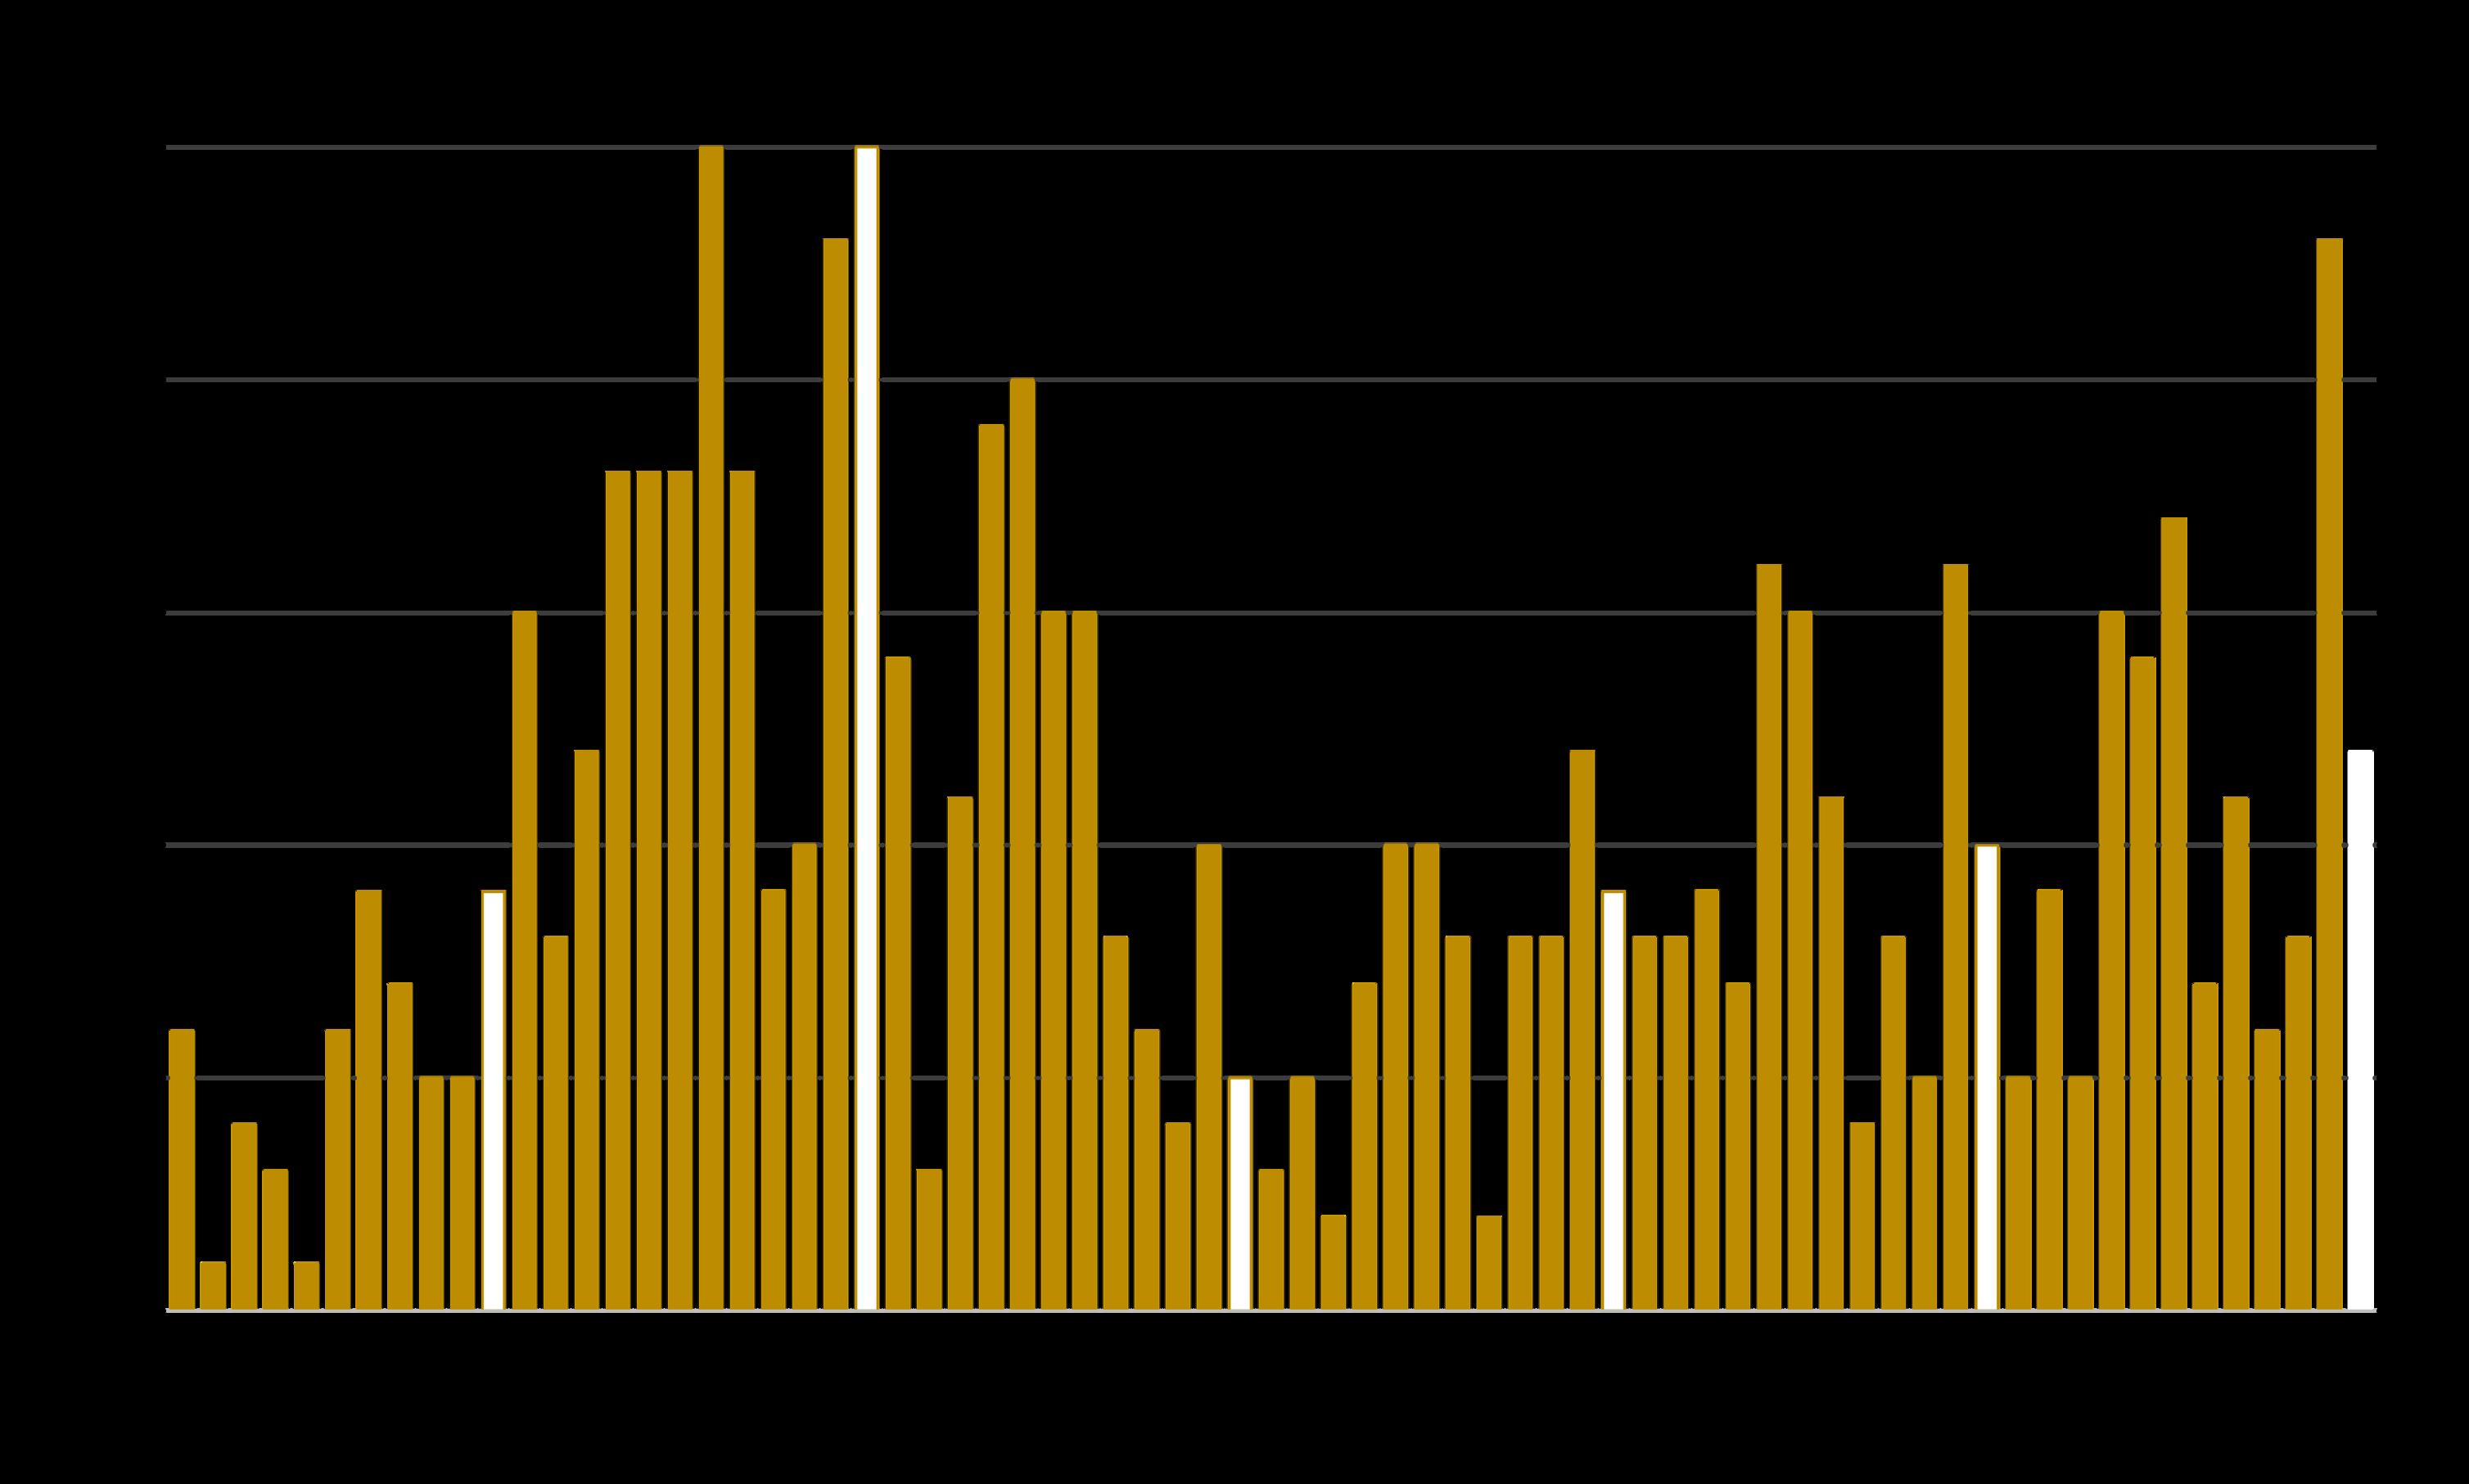
Listings Accepting Offers (Going into Contract)
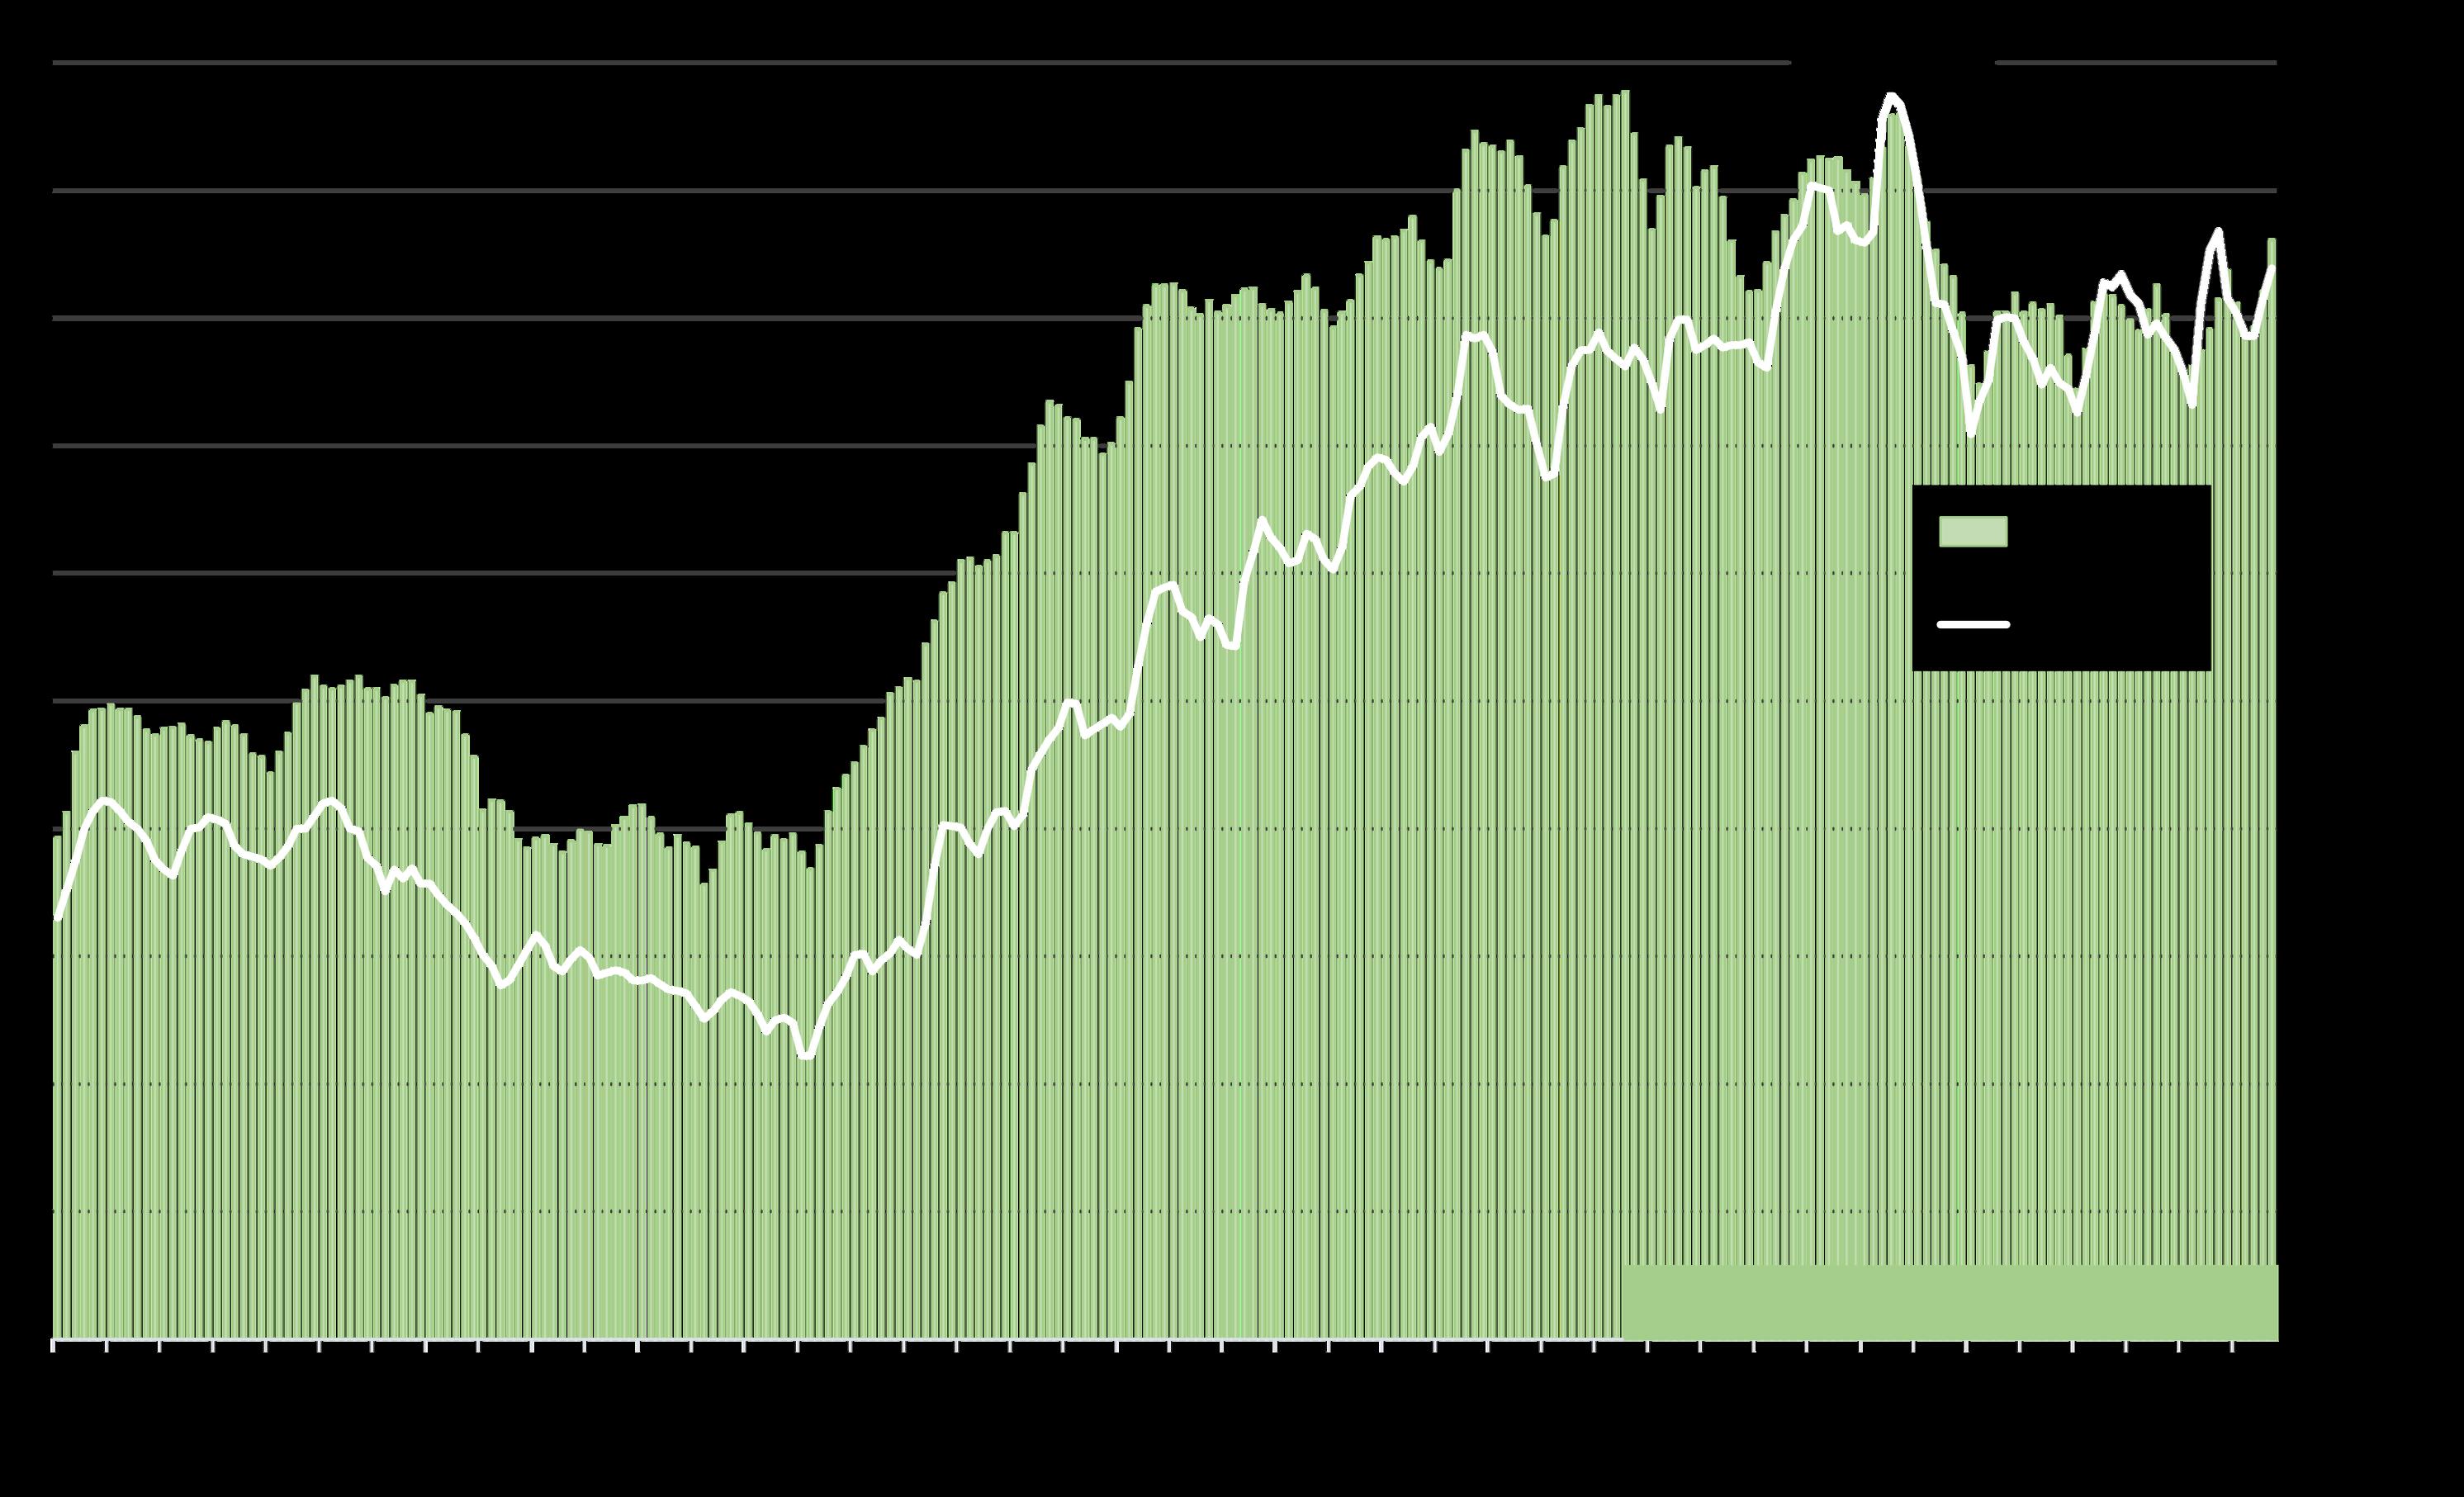
Demand, as measured by the number of listings going intocontract, typically climbs through spring, declines in summer, rebounds in early fall, and plunges in December. Sales activity in SF is being constrained by the number of homes available to buy. After soaring in September and October, the number of listings going into contract dropped back in November but rose about 10% year over year.
Percentage of Listings Accepting Offers
SanFrancisco: AbsorptionRatebyMonth
Absorption rate measures buyer demand vs. the supply of listings for sale: The higher the percentage, the more heated and competitive the market. The
market shifted dramatically in fall 2025.
*SFARMLS reported data, per Broker Metrics. Not all new-condo project activity is reported to MLS. Last month’s data estimated using available data and may change with late reported activity. Data from sources deemed reliable but may contain errors and subject to revision. All numbers approximate.
Monthly Home Sales Volume*
San Francisco Market Dynamics & Seasonality
The number of sales in November 2025 fell back
Sales in one month mostly reflect accepted offers in the previous month. from October and was essentially unchanged year over year. Sales are being constrained by the low inventory of listings for sale. House sales made up approximately 46.5% of November 2025 sales; condos made up 45%; co- ops, 1.5%; and TICs, 7%.
San Francisco Luxury Home Sales
Sales in one month mostly reflect accepted offers in the previous month. The market for luxury homes fluctuates by season, with spring and fall typically the most active markets of the year.
In October 2025, San Francisco had its highest monthly number of $5 million+ home sales in 4 years. Sales dropped back in November 2025 – as is the usual seasonal dynamic – but were the highest month-of-November count since 2021.
Overbidding List Prices in San Francisco
Percentage of Home Sales Closing over List Price
More overbidding
This statistic fluctuates according to seasonal demand trends, and is a lagging indicator of market activity 3-6 weeks earlier.
Overbidding is generally caused by buyer competition for new listings. The overall overbidding percentage in the latest month was 62% of sales (up from 51% in November 2024), but for houses alone, it was 82%, and for condos, 44%.
Average Sales Price to Original List Price Percentage
Thisstatisticcanbedistortedbystrategic
San Francisco Over/Under Bidding: Market Dynamics & Seasonality underpricing strategies by listing agents.
Spring-Autumn 2021 April 2022
Pandemic Year 1
100% = an average sales price at original list price.
This chart illustrates the average Sales Price to Original List Price Percentage for all residential sales: 8% over list price, the highest overbid % since mid-2022. But overbidding has been more common and dramatic for house sales than for condo sales: For houses alone in November 2025, the average was 16% above list price, and for condos, 1.5% over list price.
Spring-Autumn 2023
Sales reported to NorCal MLS Alliance, per Infosparks. Data derived from sources deemed reliable, but may contain errors and subject to revision. All numbers approximate, and may change with late-reported sales.
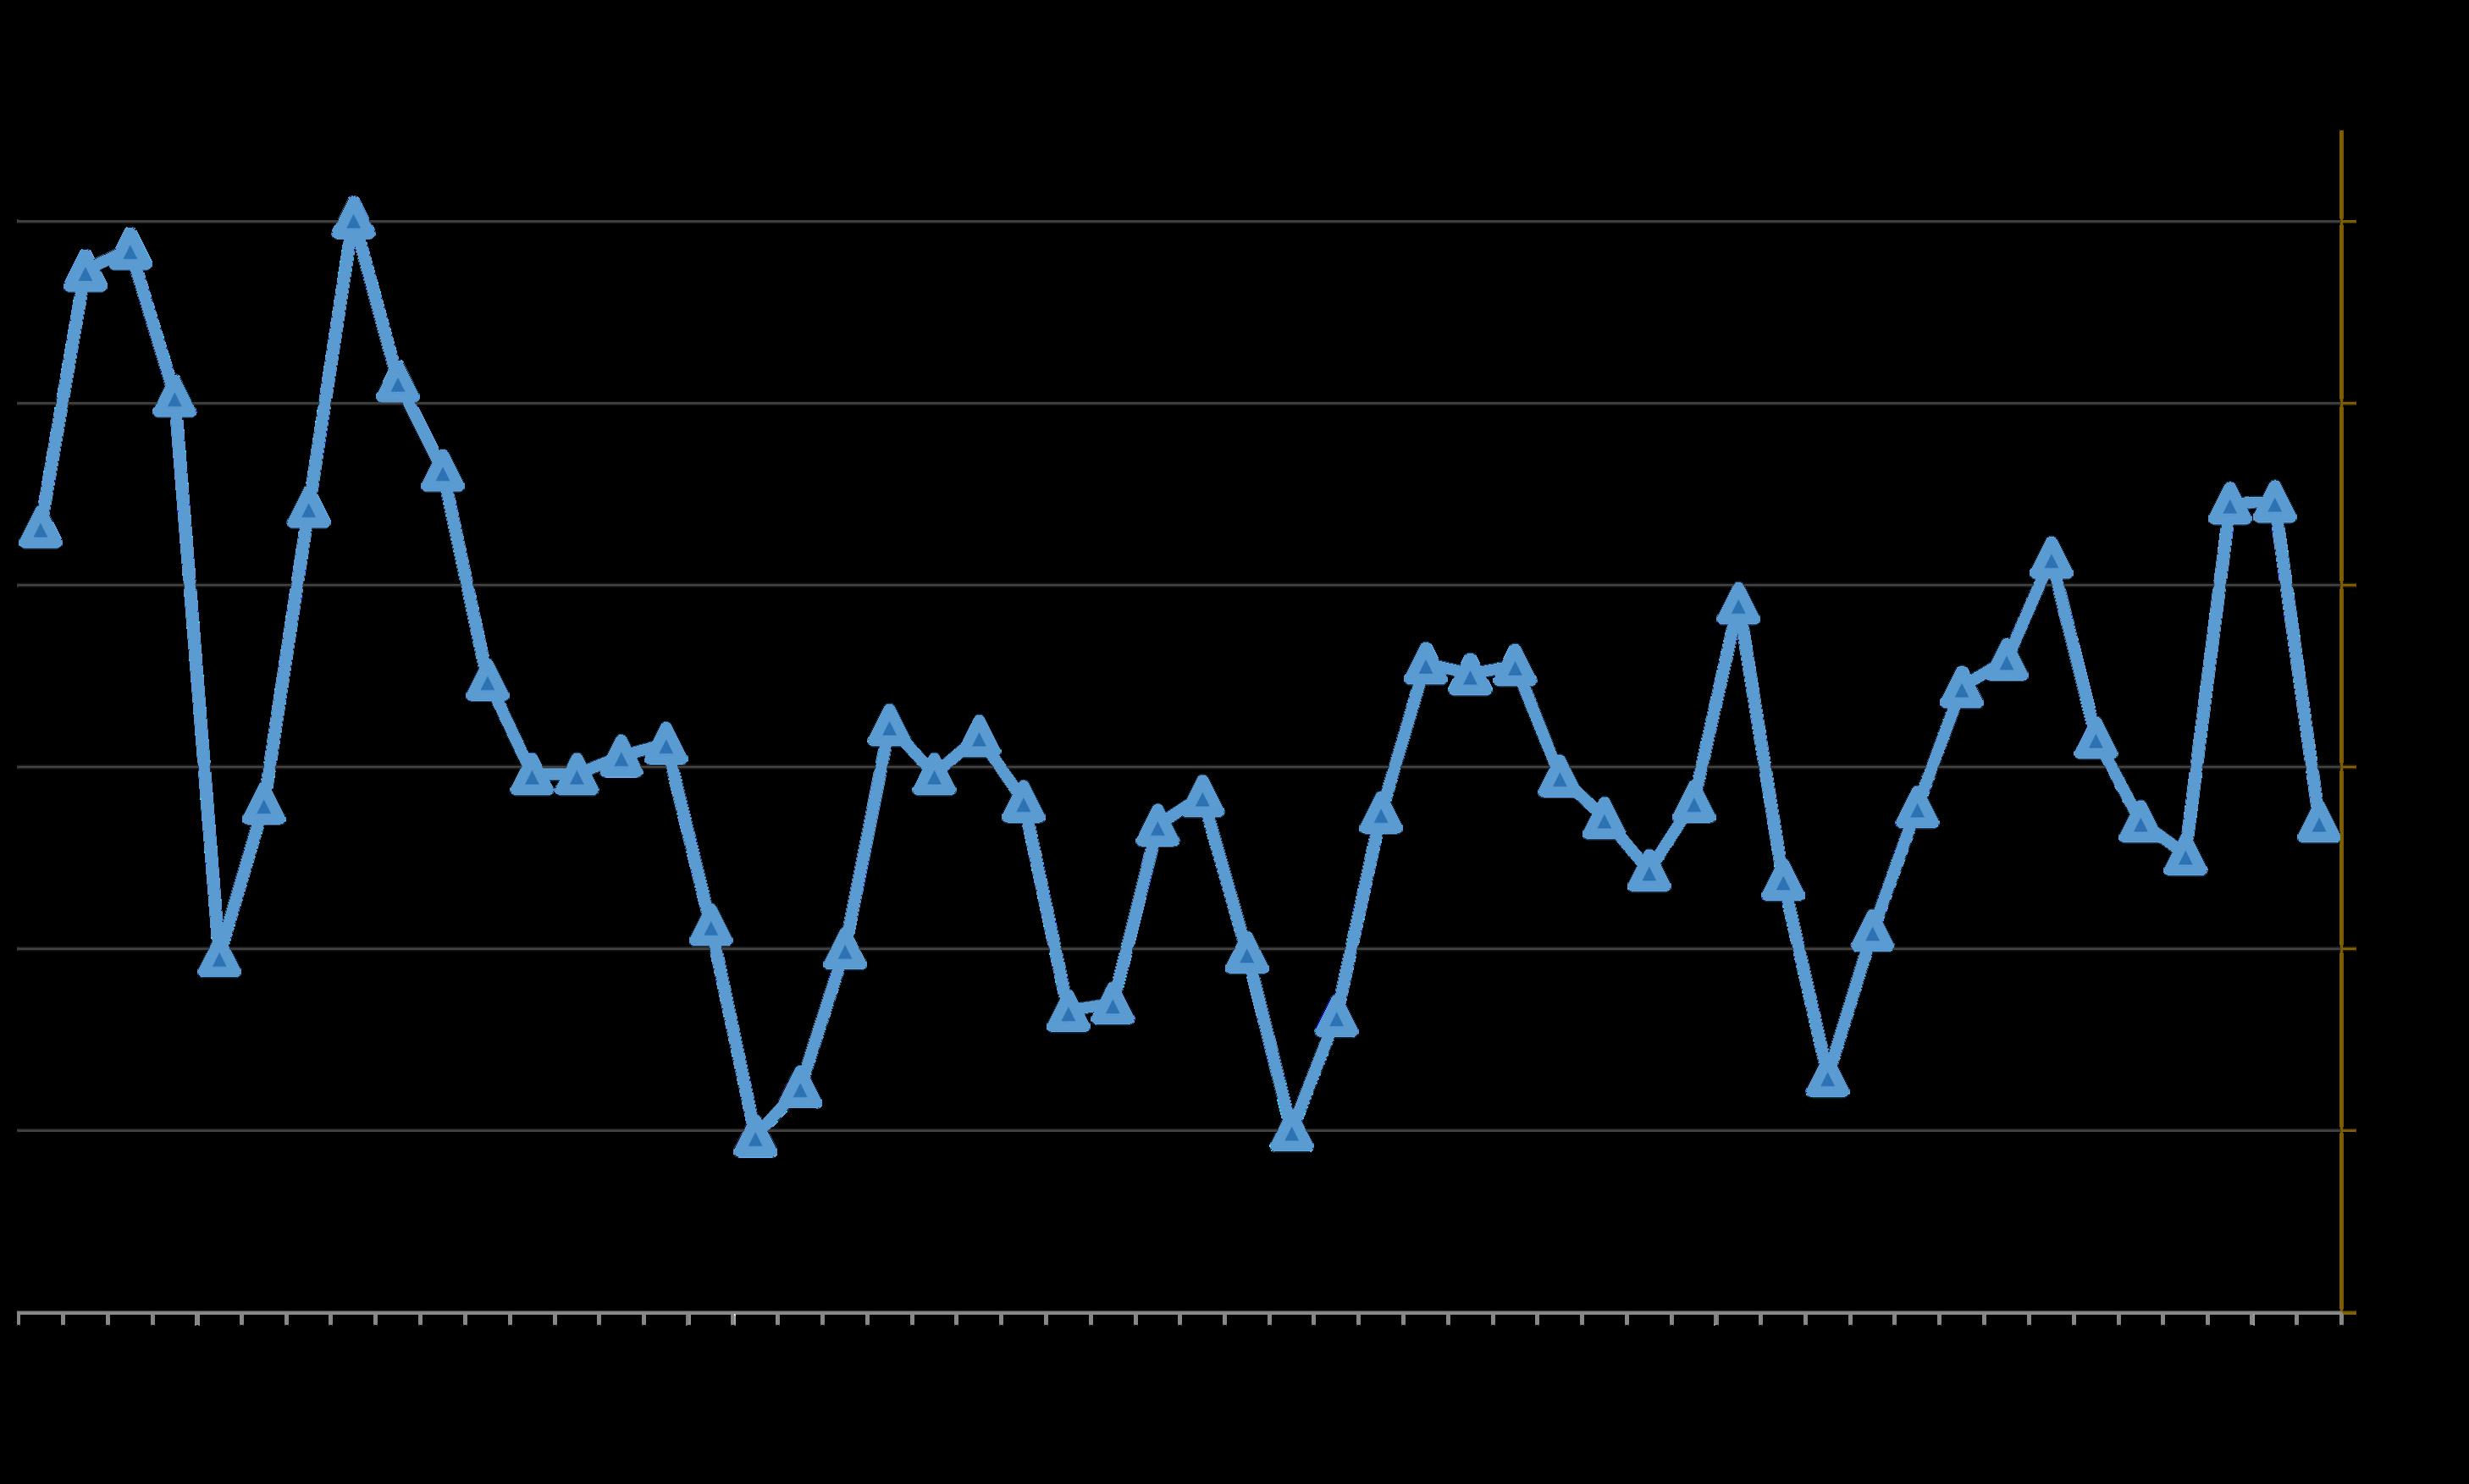
Average Days on Market – Speed of Sale
San Francisco Market Dynamics & Seasonality
Measuringhowlong it takesfor sold listingsto accept offers. Homes usually sell fastest in spring and early autumn –with the rush of new listings – and slowest in mid-winter (when the inventory of listings is at its oldest). Houses, on average, sell much faster than condos, co-ops and TICs.
This chart illustrates average days on market for all residential sales (42 days in November 2025, down from 48 in November 2024). But for houses alone, the average was 26 days, and for condos, 55 days.
Per Freddie Mac (FHLMC), on December 4, 2025, the weekly average, 30-year, conforming-loan interest rate was 6.19%, very close to its 14-month low.
The Fed’s next decision regarding another benchmark rate reduction is due 12/10/25.
*Freddie Mac (FHLMC), 30-Year Fixed Rate Mortgage Weekly Average: https://www.freddiemac.com/pmms. Data from sources deemed reliable. Different sources of mortgage data sometimes vary in their determinations of daily and weekly rates. Data from sources deemed reliable but may contain errors. All numbers approximate.
Financial
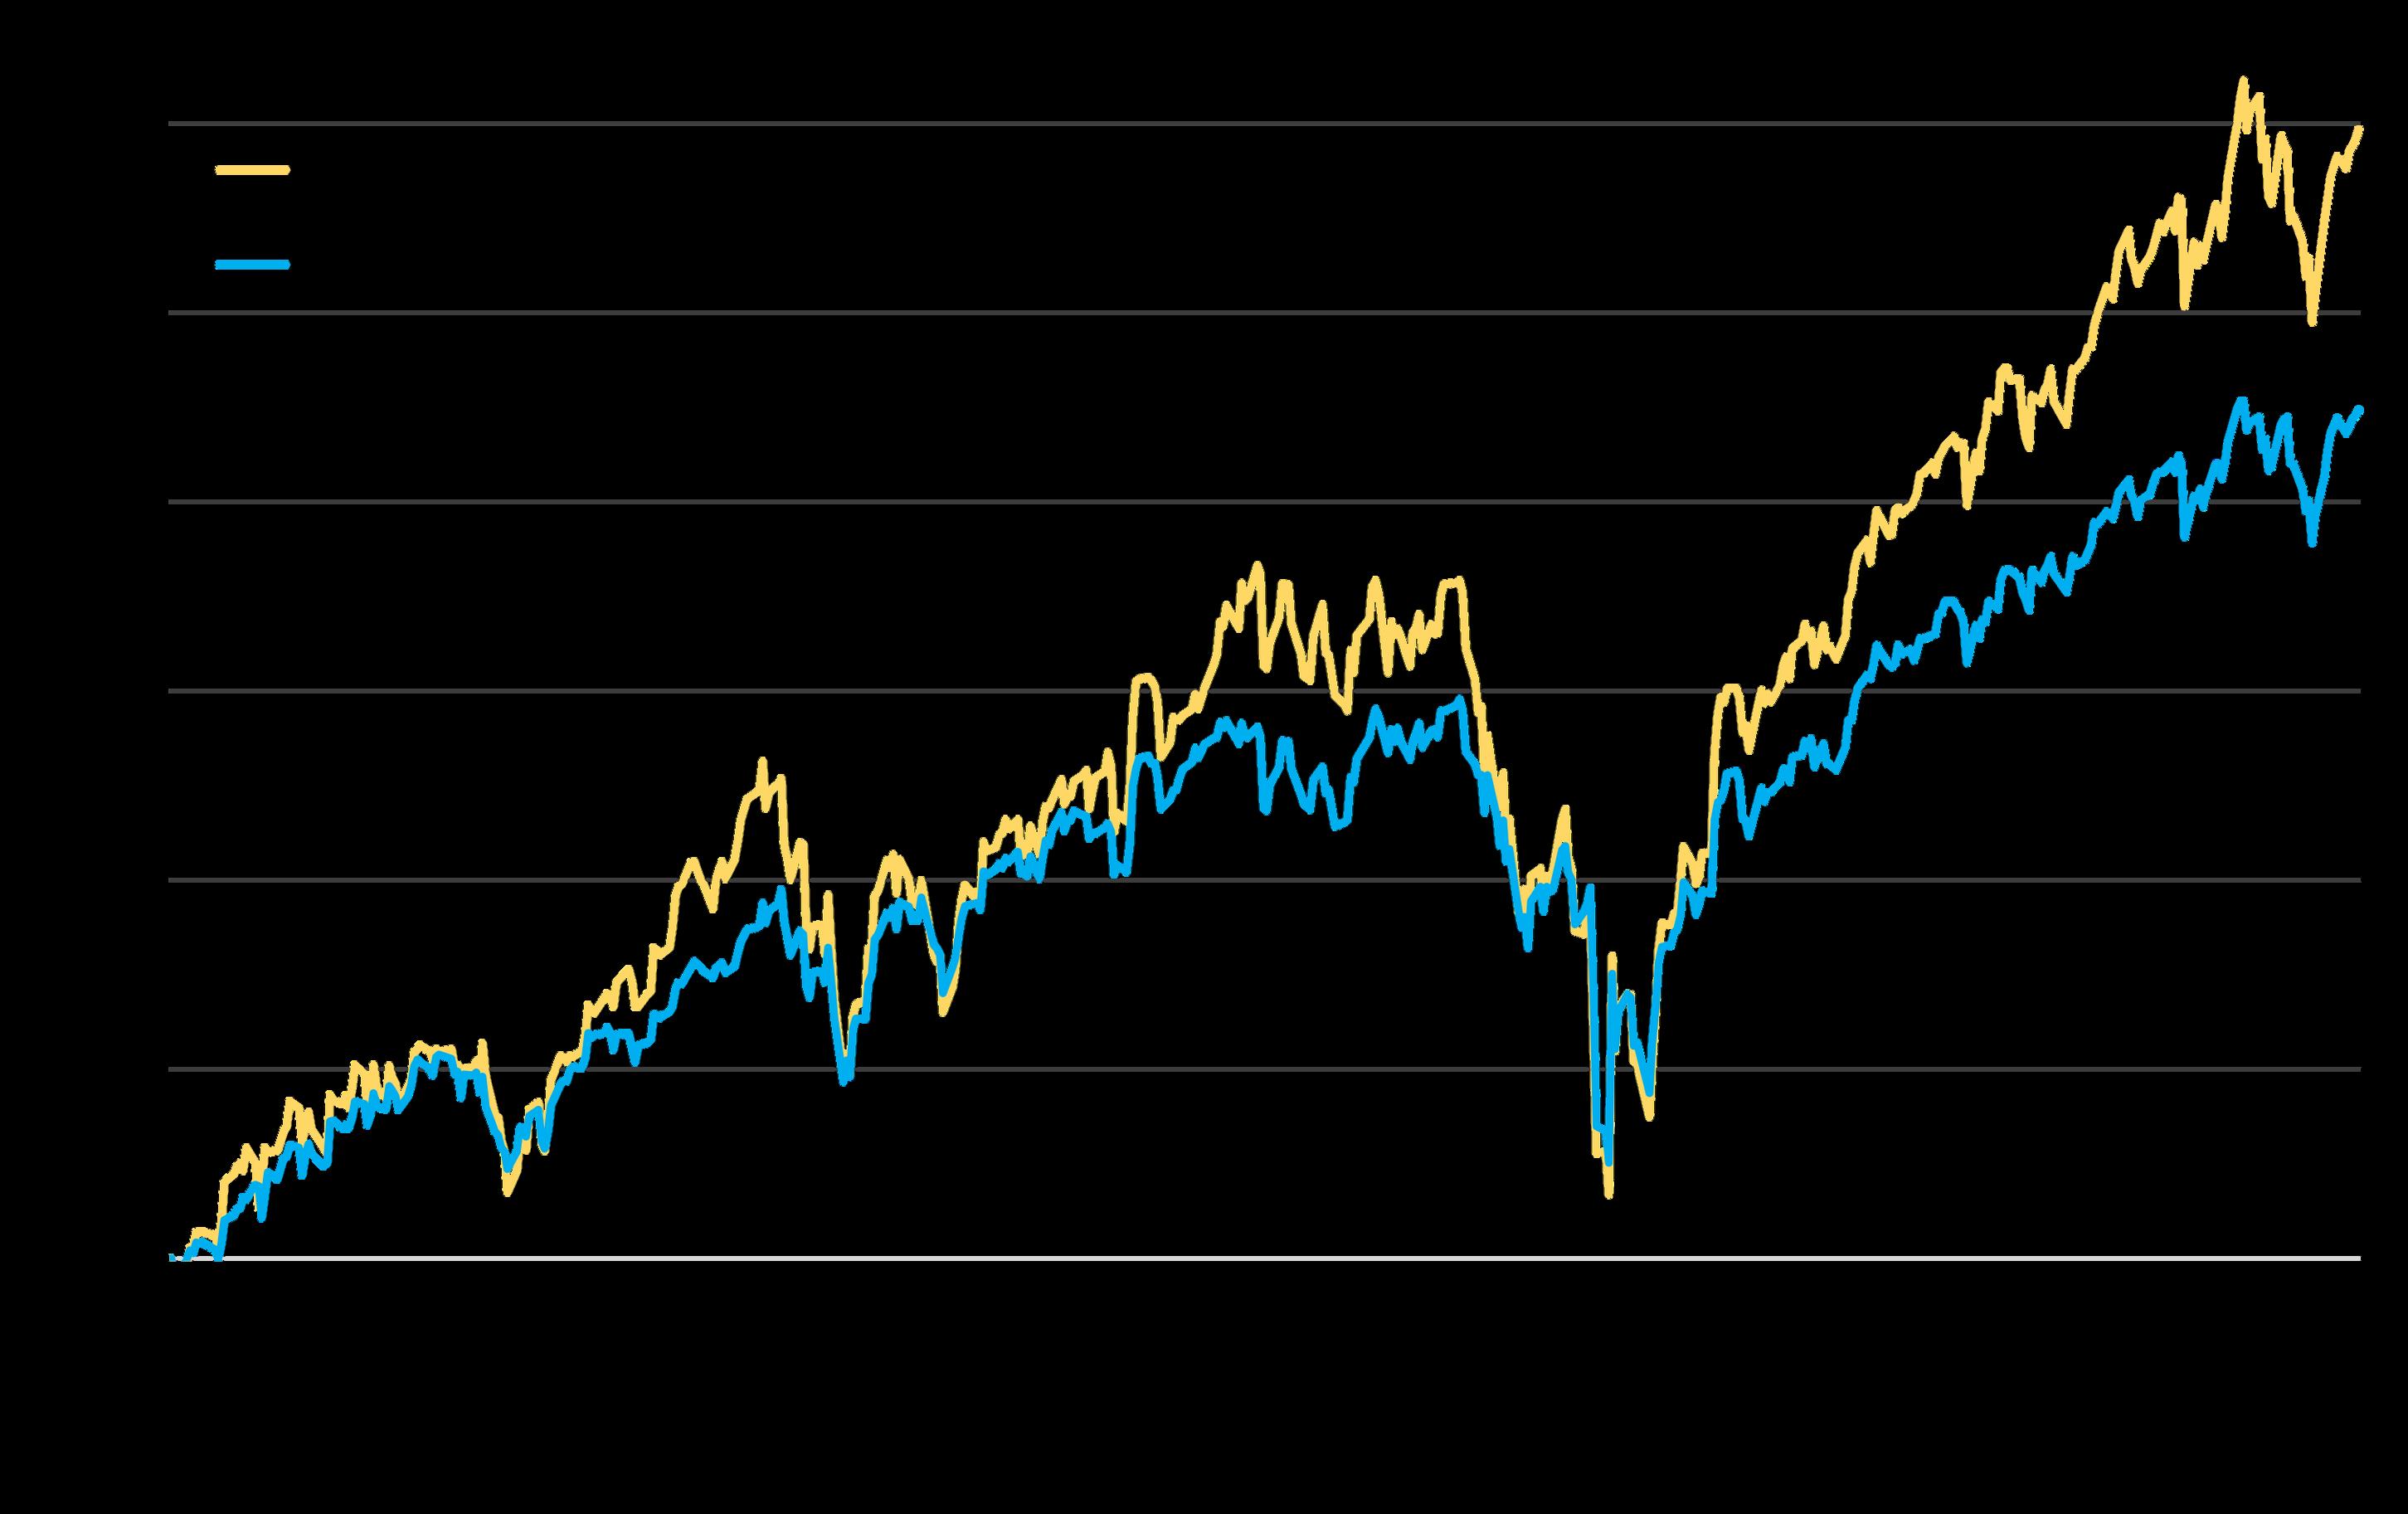
Markets, 2024 – 2025 YTD
Nasdaq Index: % Change since 01/24
S&P 500 Index: % Change since 01/24 Data
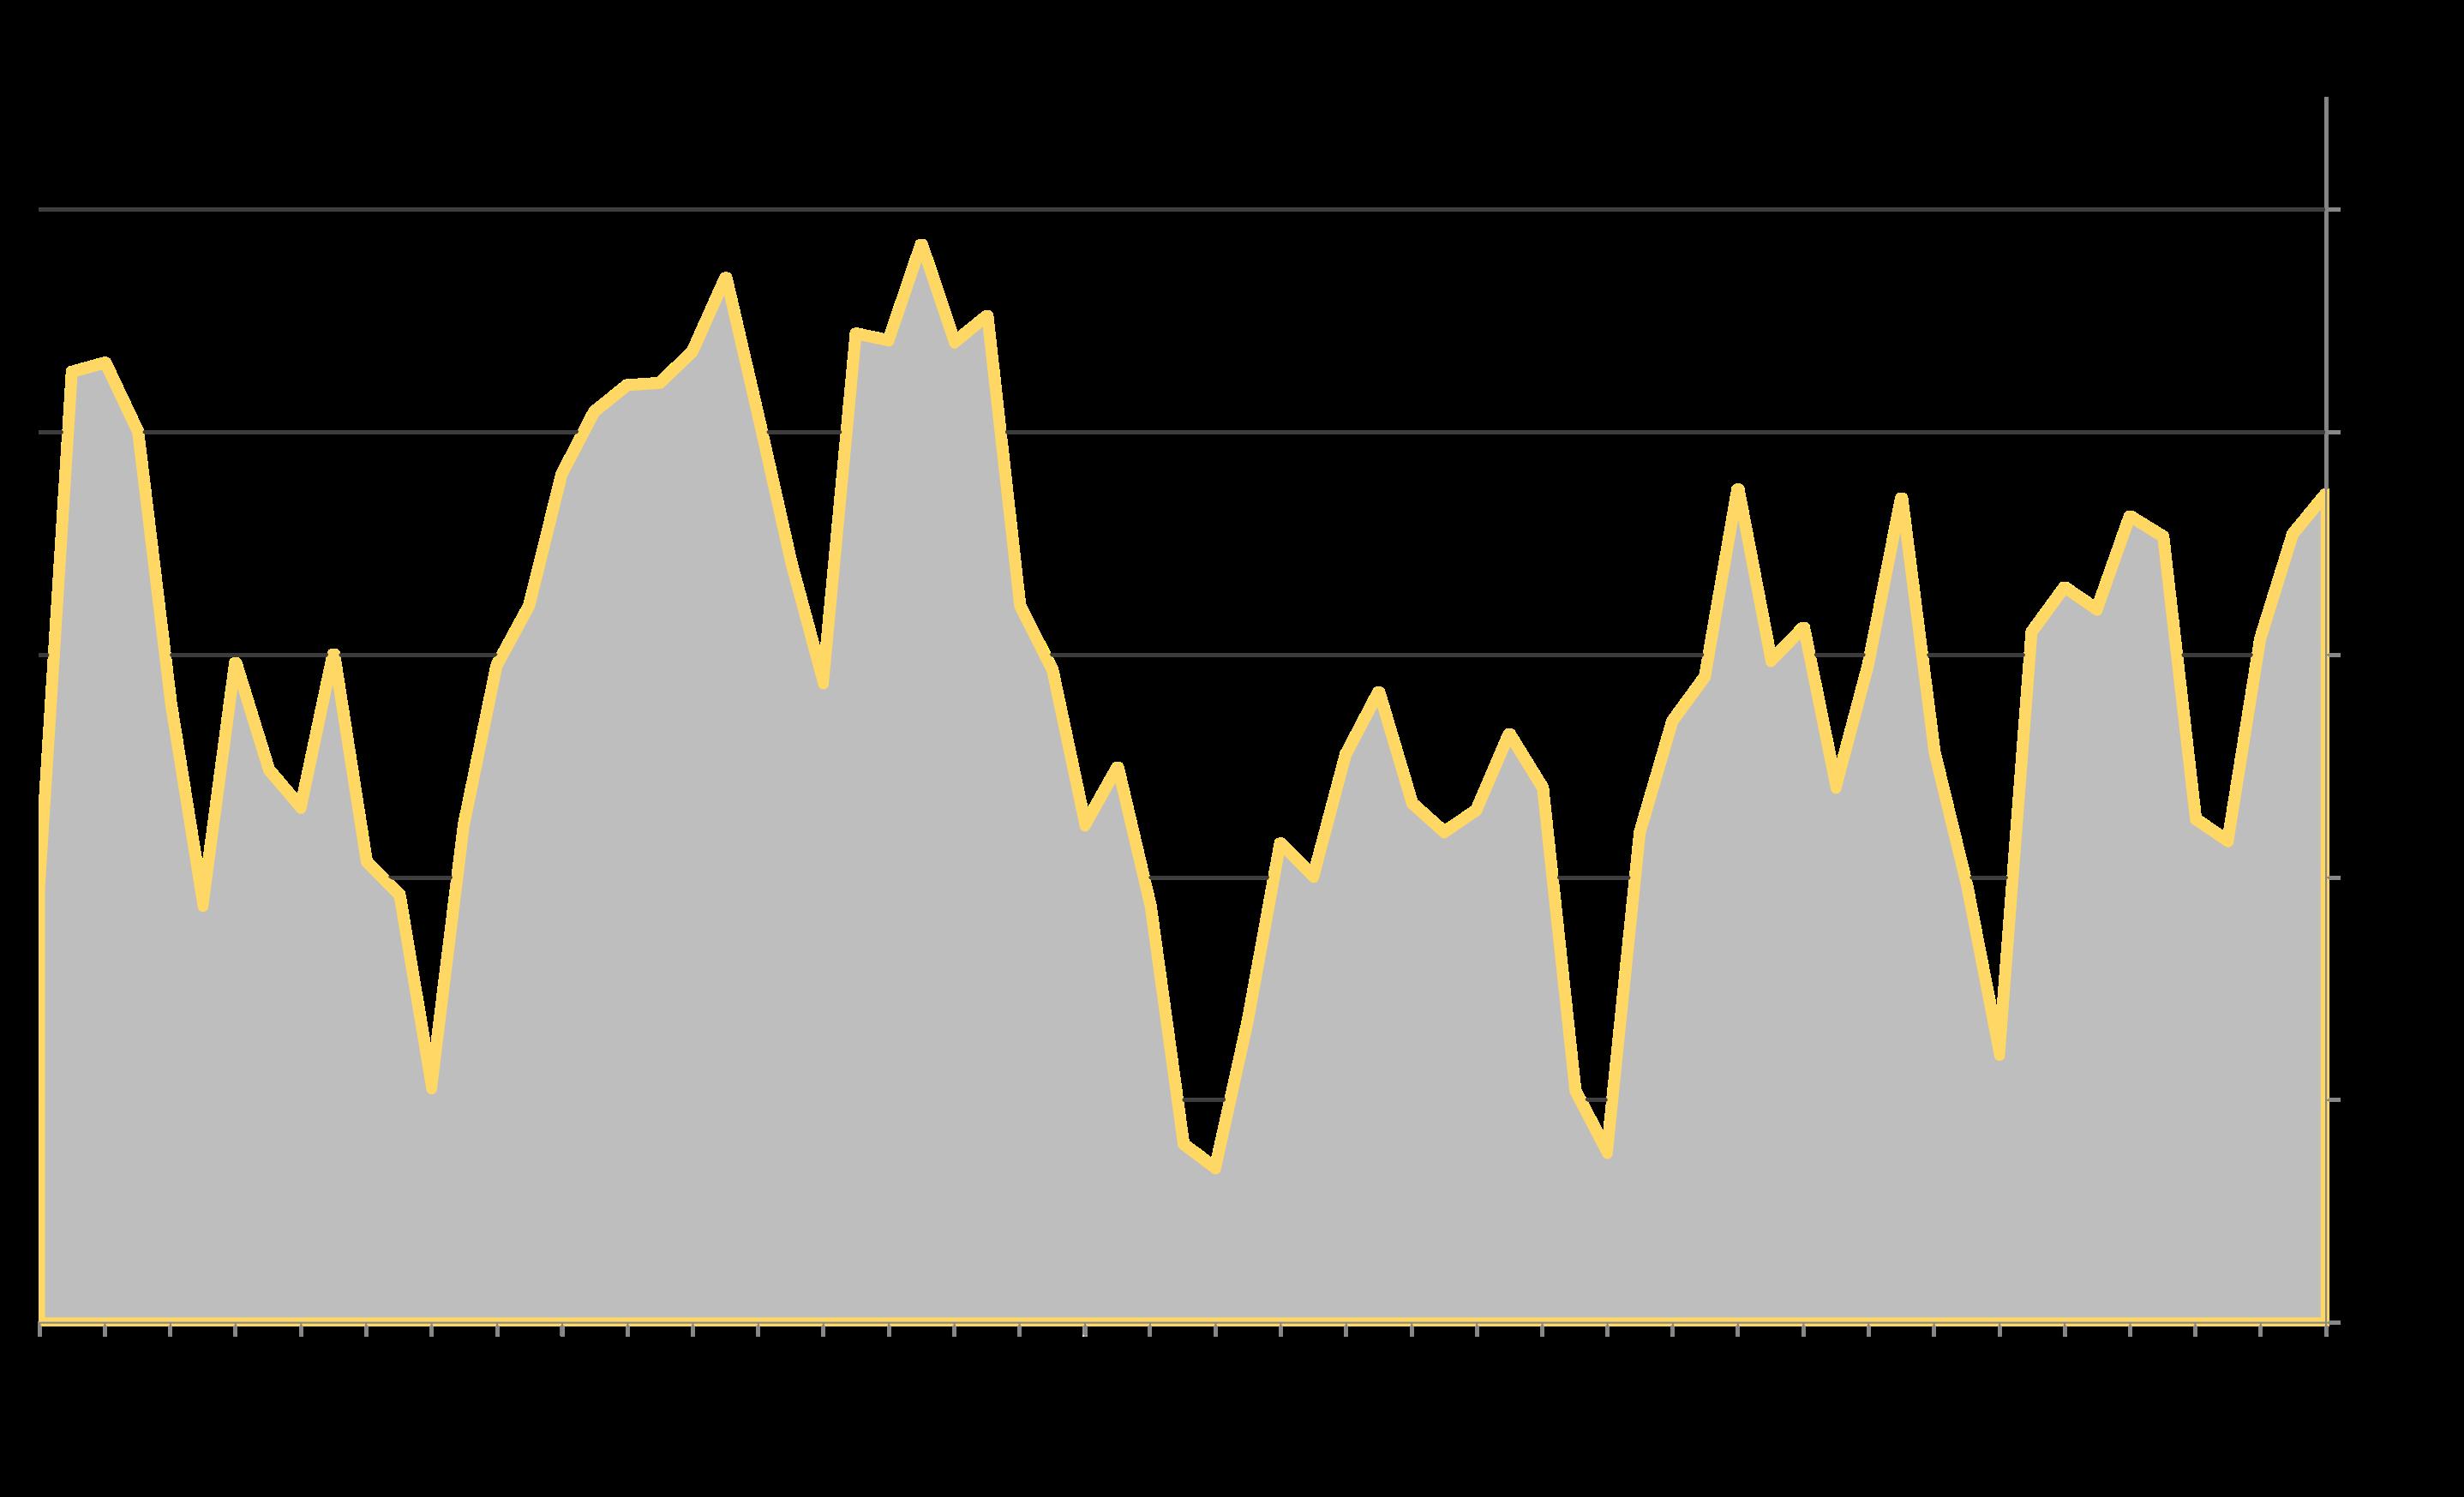
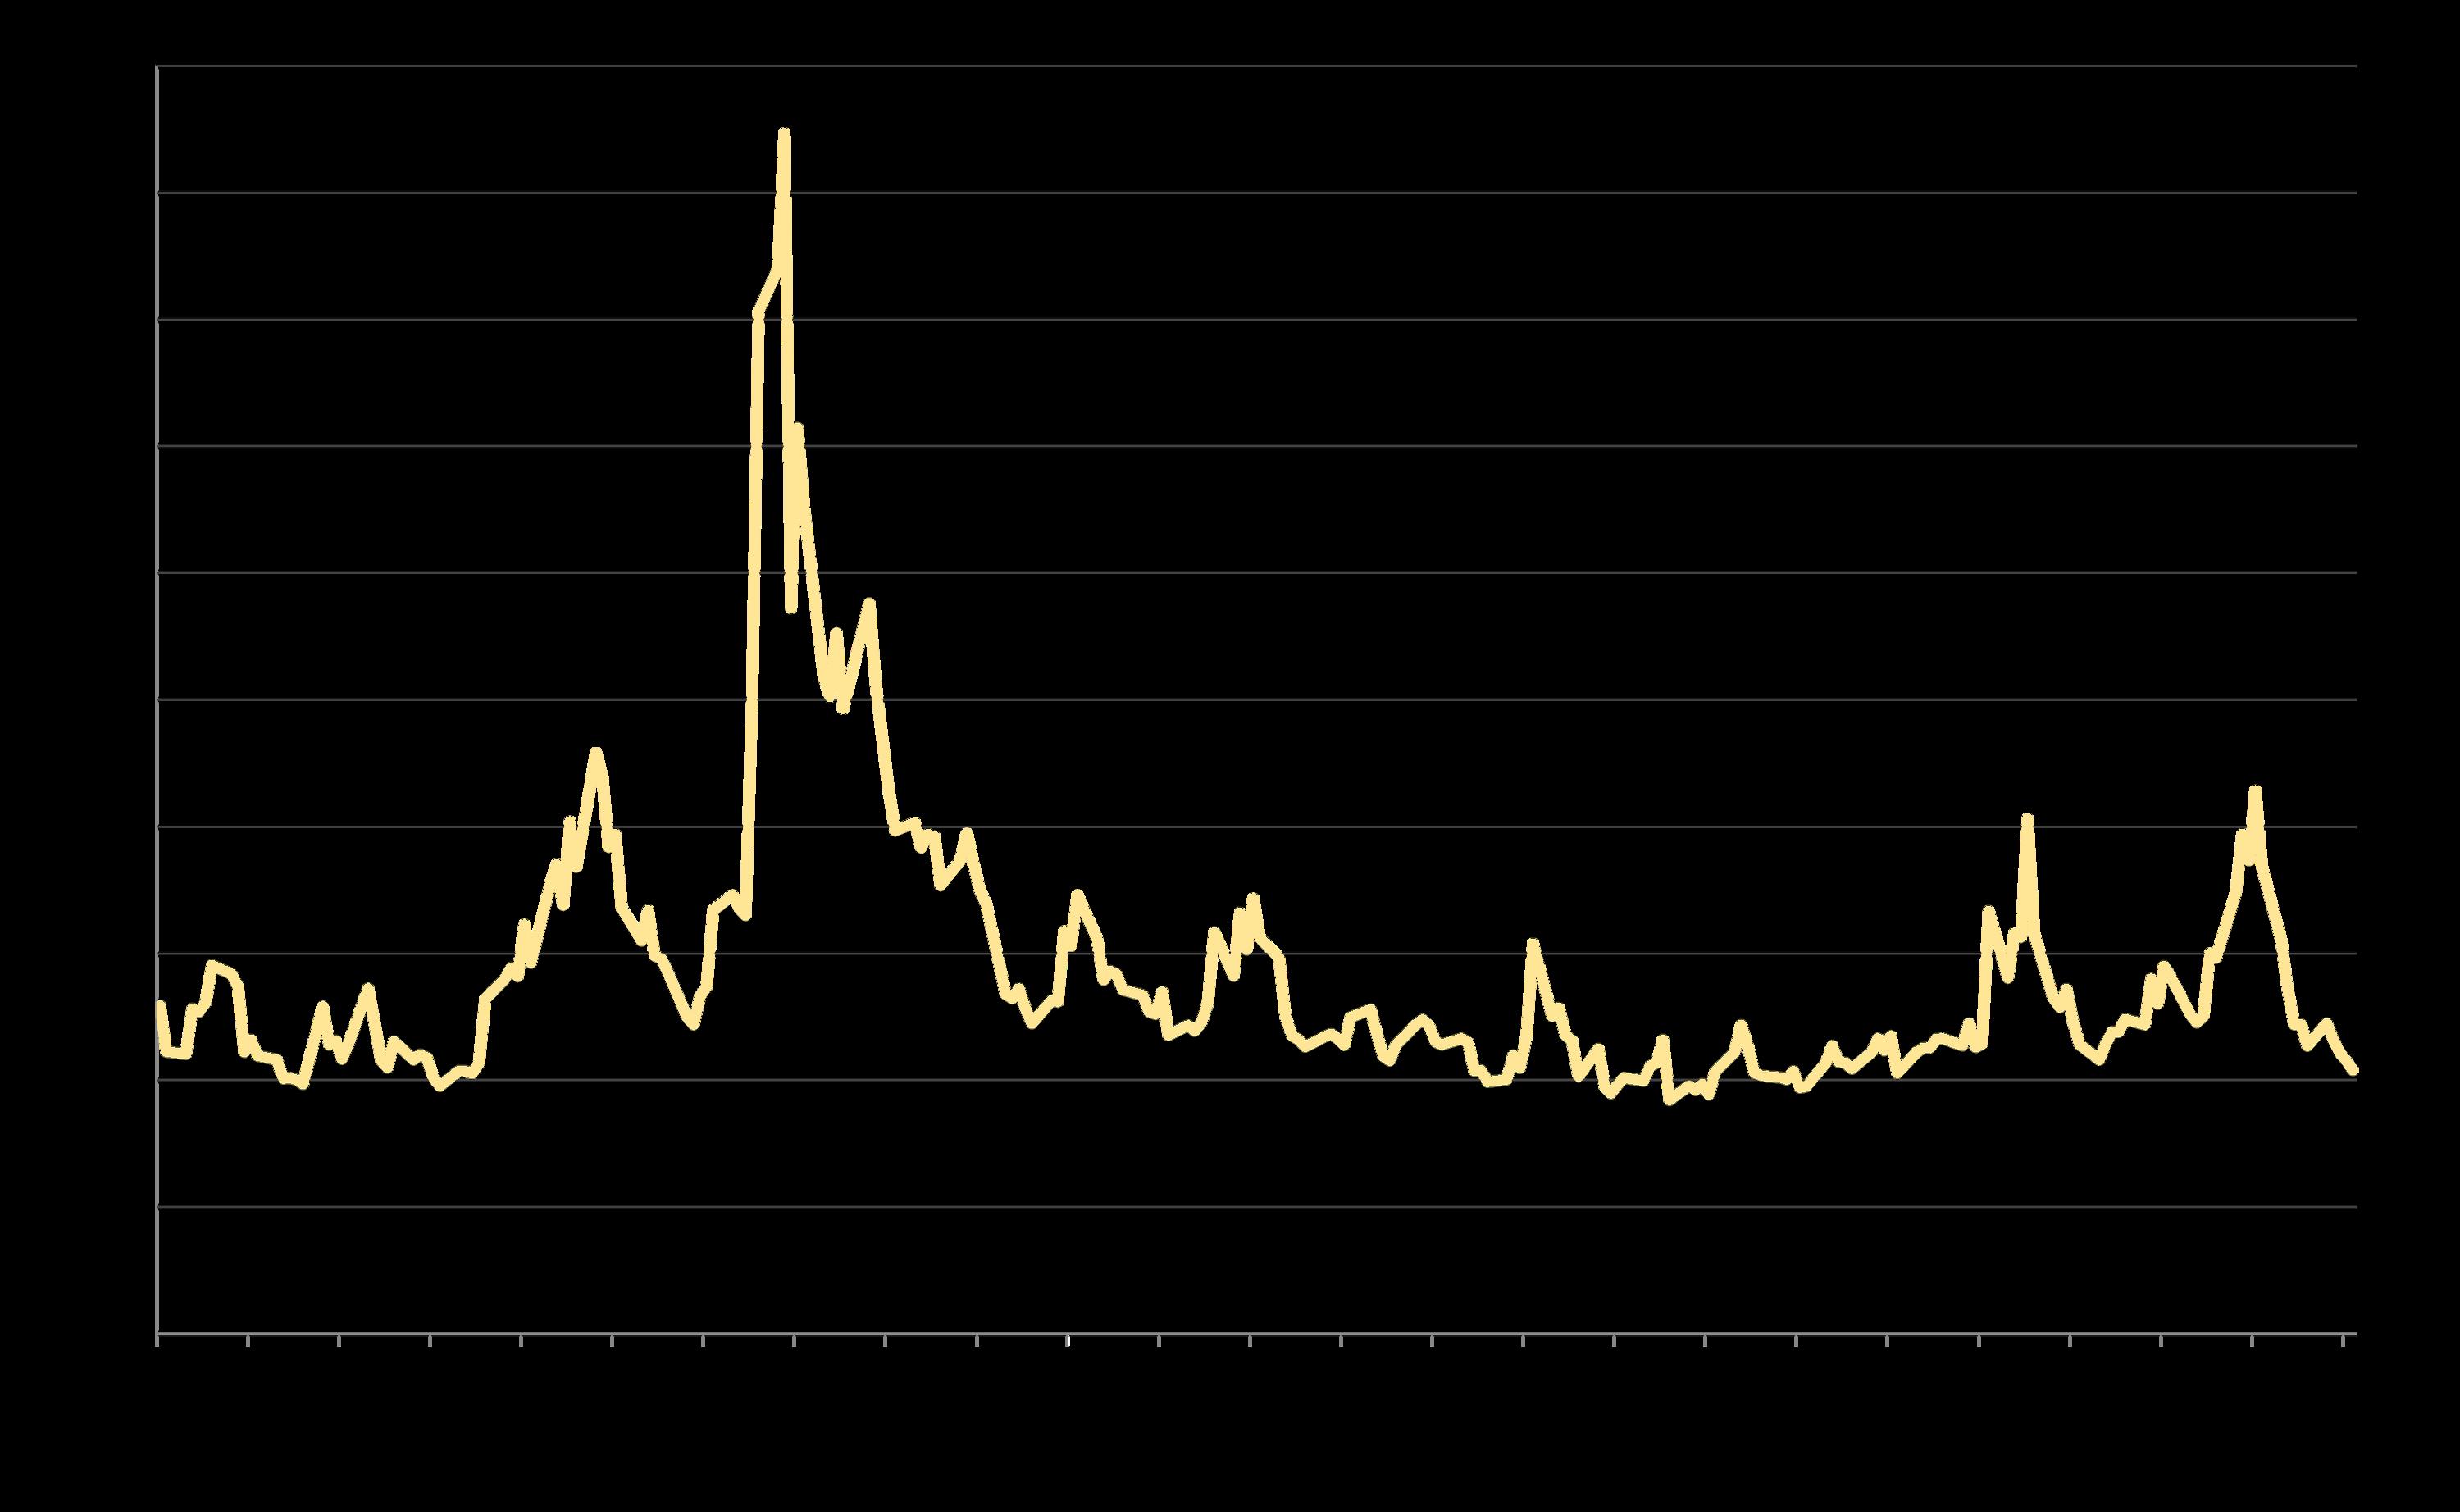
VIX Volatility Index*
By Day in 2025
“The CBOE Volatility Index, or VIX, is a real-time market index representing the [stock] market’s expectations for volatility over the coming 30 days. Investors use the VIX to measure the level of risk, fear, or stress in the market when making investment decisions.” Quote from
Investopedia
*CBOE Volatility Index (VIX), per https://www.cboe.com/tradable_products/vix/vix_historical_data/ and/or Yahoo! Finance: https://finance.yahoo.com/quote/%5EVIX/history/. Data from sources deemed reliable but may contain errors. All numbers approximate.
S&P 500 Cyclically-Adjusted Price to Earnings (CAPE) Ratio*
The CAPE ratio is a stock market valuation measure created by economist Robert Shiller. It is defined as the current price of the S&P 500 divided by the moving-average of 10 years of inflation-adjusted earnings and is principally used to assess likely future returns over longer periods. A higher CAPE ratio can suggest investors are expecting higher future growth, or that the stock market is overvalued.
As of December 1, 2025, the CAPE ratio is at its highest reading since the dotcom bubble.
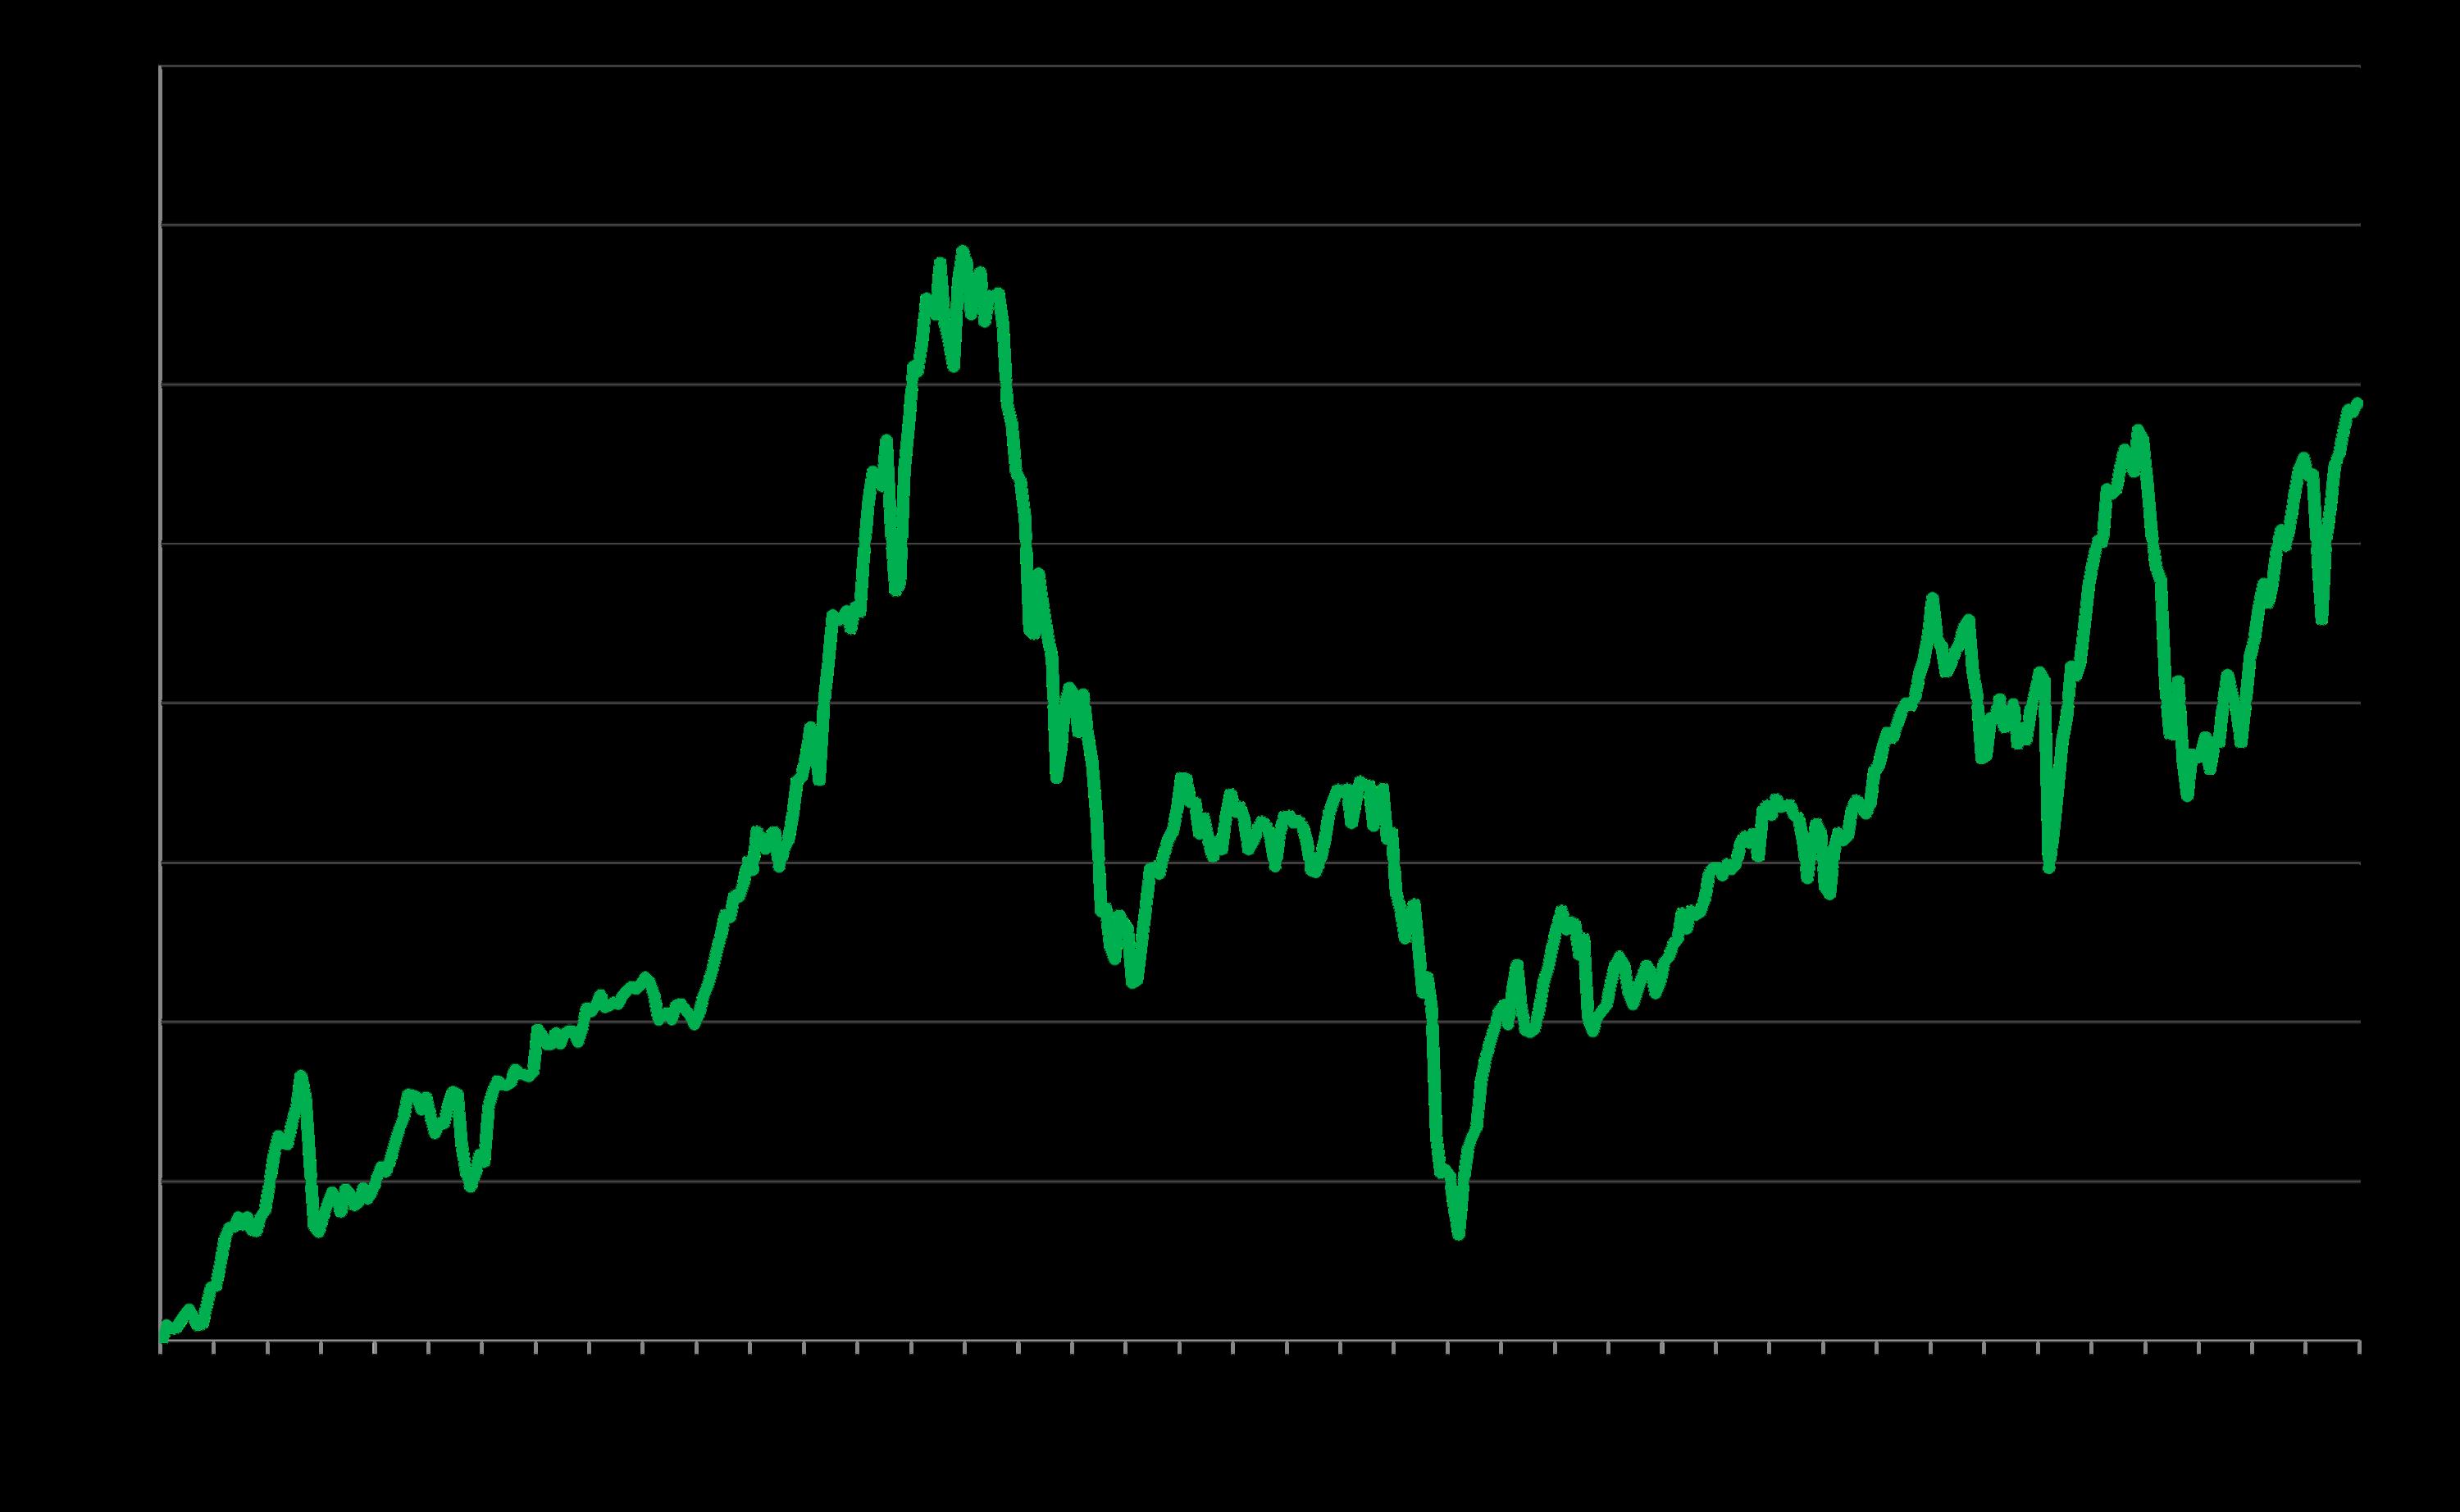
$50,000
ByDaysinceMarch 7, 2024
Data per https://www.nasdaq.com/market-activity/cryptocurrency/btc/historical. Data from source deemed reliable but may contain errors and subject to revision. Cryptocurrency values change constantly and all numbers to be considered approximate.
Statistics are generalities, essentially summaries of widely disparate data generated by dozens, hundreds or thousands of unique, individual sales occurring within different time periods. They are best seen not as precise measurements, but as broad, comparative indicators, with reasonable margins of error. Anomalous fluctuations in statistics are not uncommon, especially in smaller, expensive market segments. Last period data should be considered estimates that may change with late-reported data. Different analytics programs sometimes define statistics – such as “active listings,” “days on market,” and “months supply of inventory” – differently: what is most meaningful are not specific calculations but the trends they illustrate. Most listing and sales data derives from the local or regional multi-listing service (MLS) of the area specified in the analysis, but not all listings or sales are reported to MLS and these won’t be reflected in the data. “Homes” signifies real-property, single-household housing units: houses, condos, co-ops, townhouses, duets and TICs (but not mobile homes), as applicable to each market. City/town names refer specifically to the named cities and towns, unless otherwise delineated. Multi-county metro areas will be specified as such. Data from sources deemed reliable, but may contain errors and subject to revision. All numbers to be considered approximate.
Many aspects of value cannot be adequately reflected in median and average statistics: curb appeal, age, condition, amenities,
views, lot size, quality of outdoor space, “bonus” rooms, additional parking, quality of location within the neighborhood, and so on. How any of these statistics apply to any particular home is unknown without a specific comparative market analysis.
Median Sales Price is that price at which half the properties sold for more and half for less. It may be affected by seasonality, “unusual” events, or changes in inventory and buying trends, as well as by changes in fair market value. The median sales price for an area will often conceal an enormous variety of sales prices in the underlying individual sales.
Dollar per Square Foot is based upon the home’s interior living space and does not include garages, unfinished attics and basements, rooms built without permit, patios, decks or yards (though all those can add value to a home). These figures are usually derived from appraisals or tax records, but are sometimes unreliable (especially for older homes) or unreported altogether. The calculation can only be made on those home sales that reported square footage.
Photo use under the Creative Commons License: https://creativecommons.org/licenses/by-sa/2.0/
Compass is a real estate broker licensed by the State of California, DRE 01527235. Equal Housing Opportunity. This report has been prepared solely for information purposes. The information herein is based on or derived from information generally available to the public and/or from sources believed to be reliable. No representation or warranty can be given with respect to the accuracy or completeness of the information. Compass disclaims any and all liability relating to this report, including without limitation any express or implied representations or warranties for statements contained in, and omissions from, the report. Nothing contained herein is intended to be or should be read as any regulatory, legal, tax, accounting or other advice and Compass does not provide such advice. All opinions are subject to change without notice. Compass makes no representation regarding the accuracy of any statements regarding any references to the laws, statutes or regulations of any state are those of the author(s). Past performance is no guarantee of future results.