SelectedSnapshots of Comparative Market Values & Dynamics
Early October 2025 Report
Trends in individual counties sometimes diverge from those seen in the overall Bay Area.
2019 photo from the Copernicus Sentinel-2 Satellite Mission, published by the European Space Agency, used under the Creative Commons License
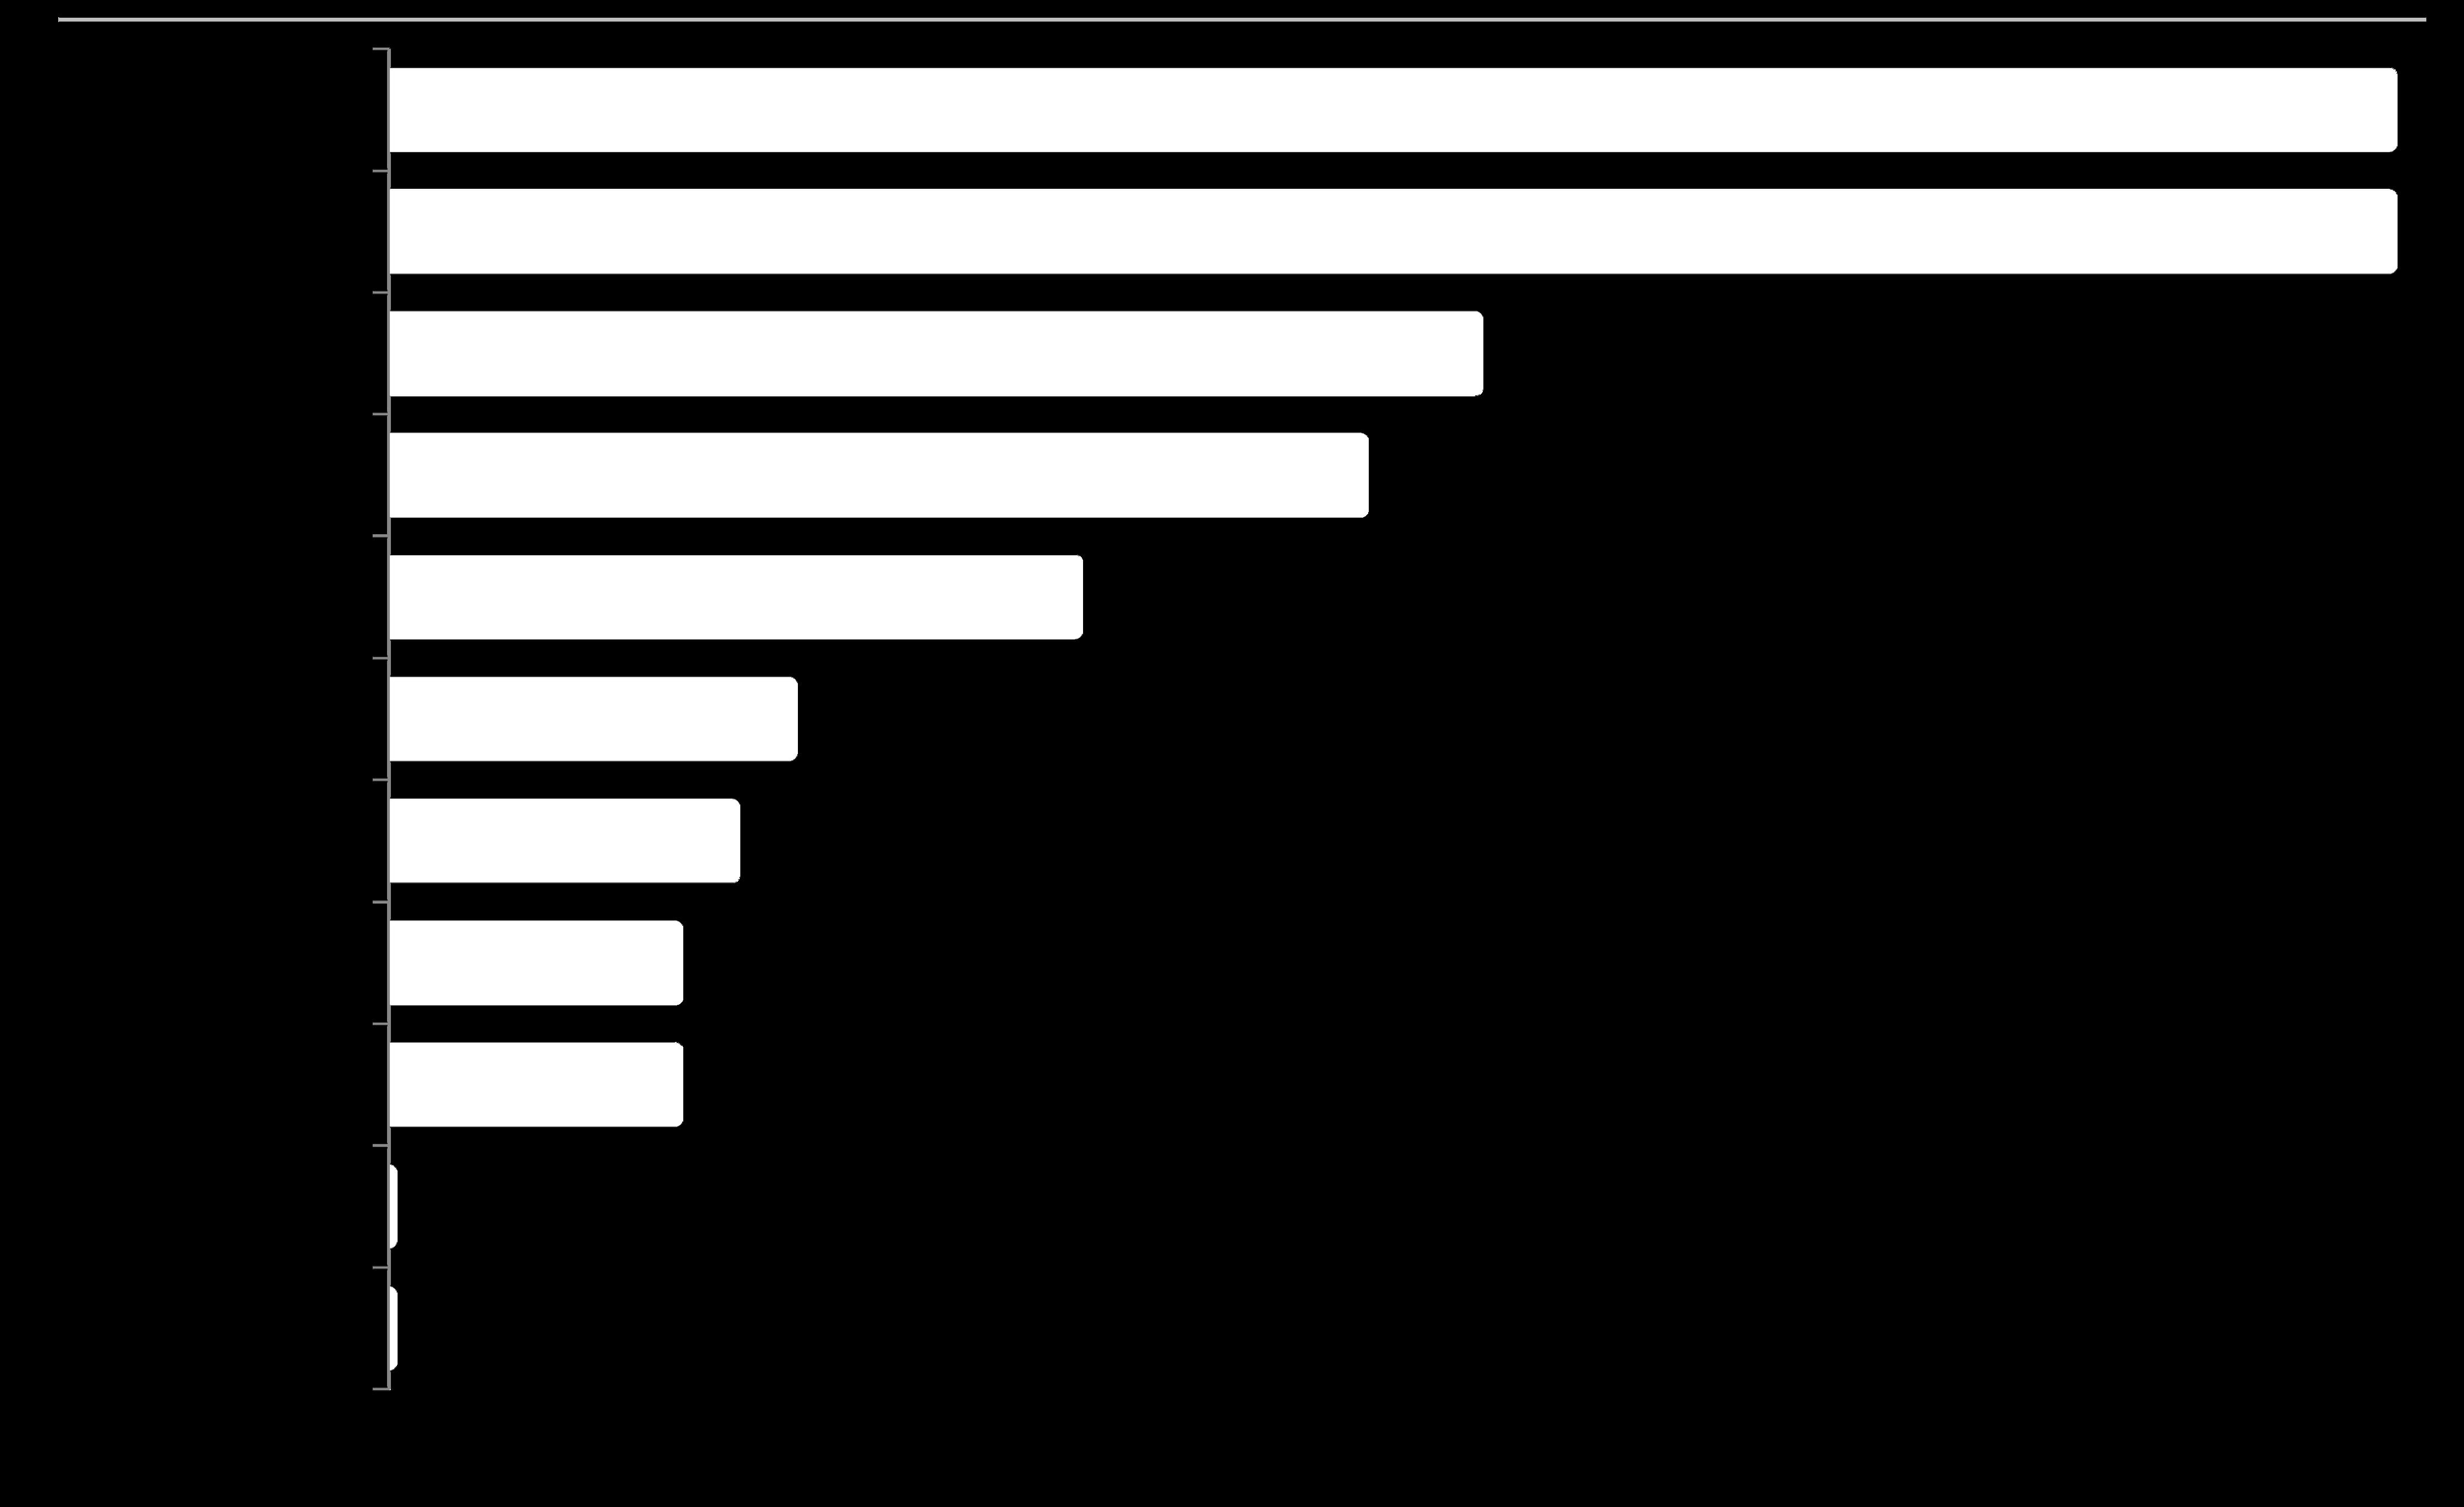
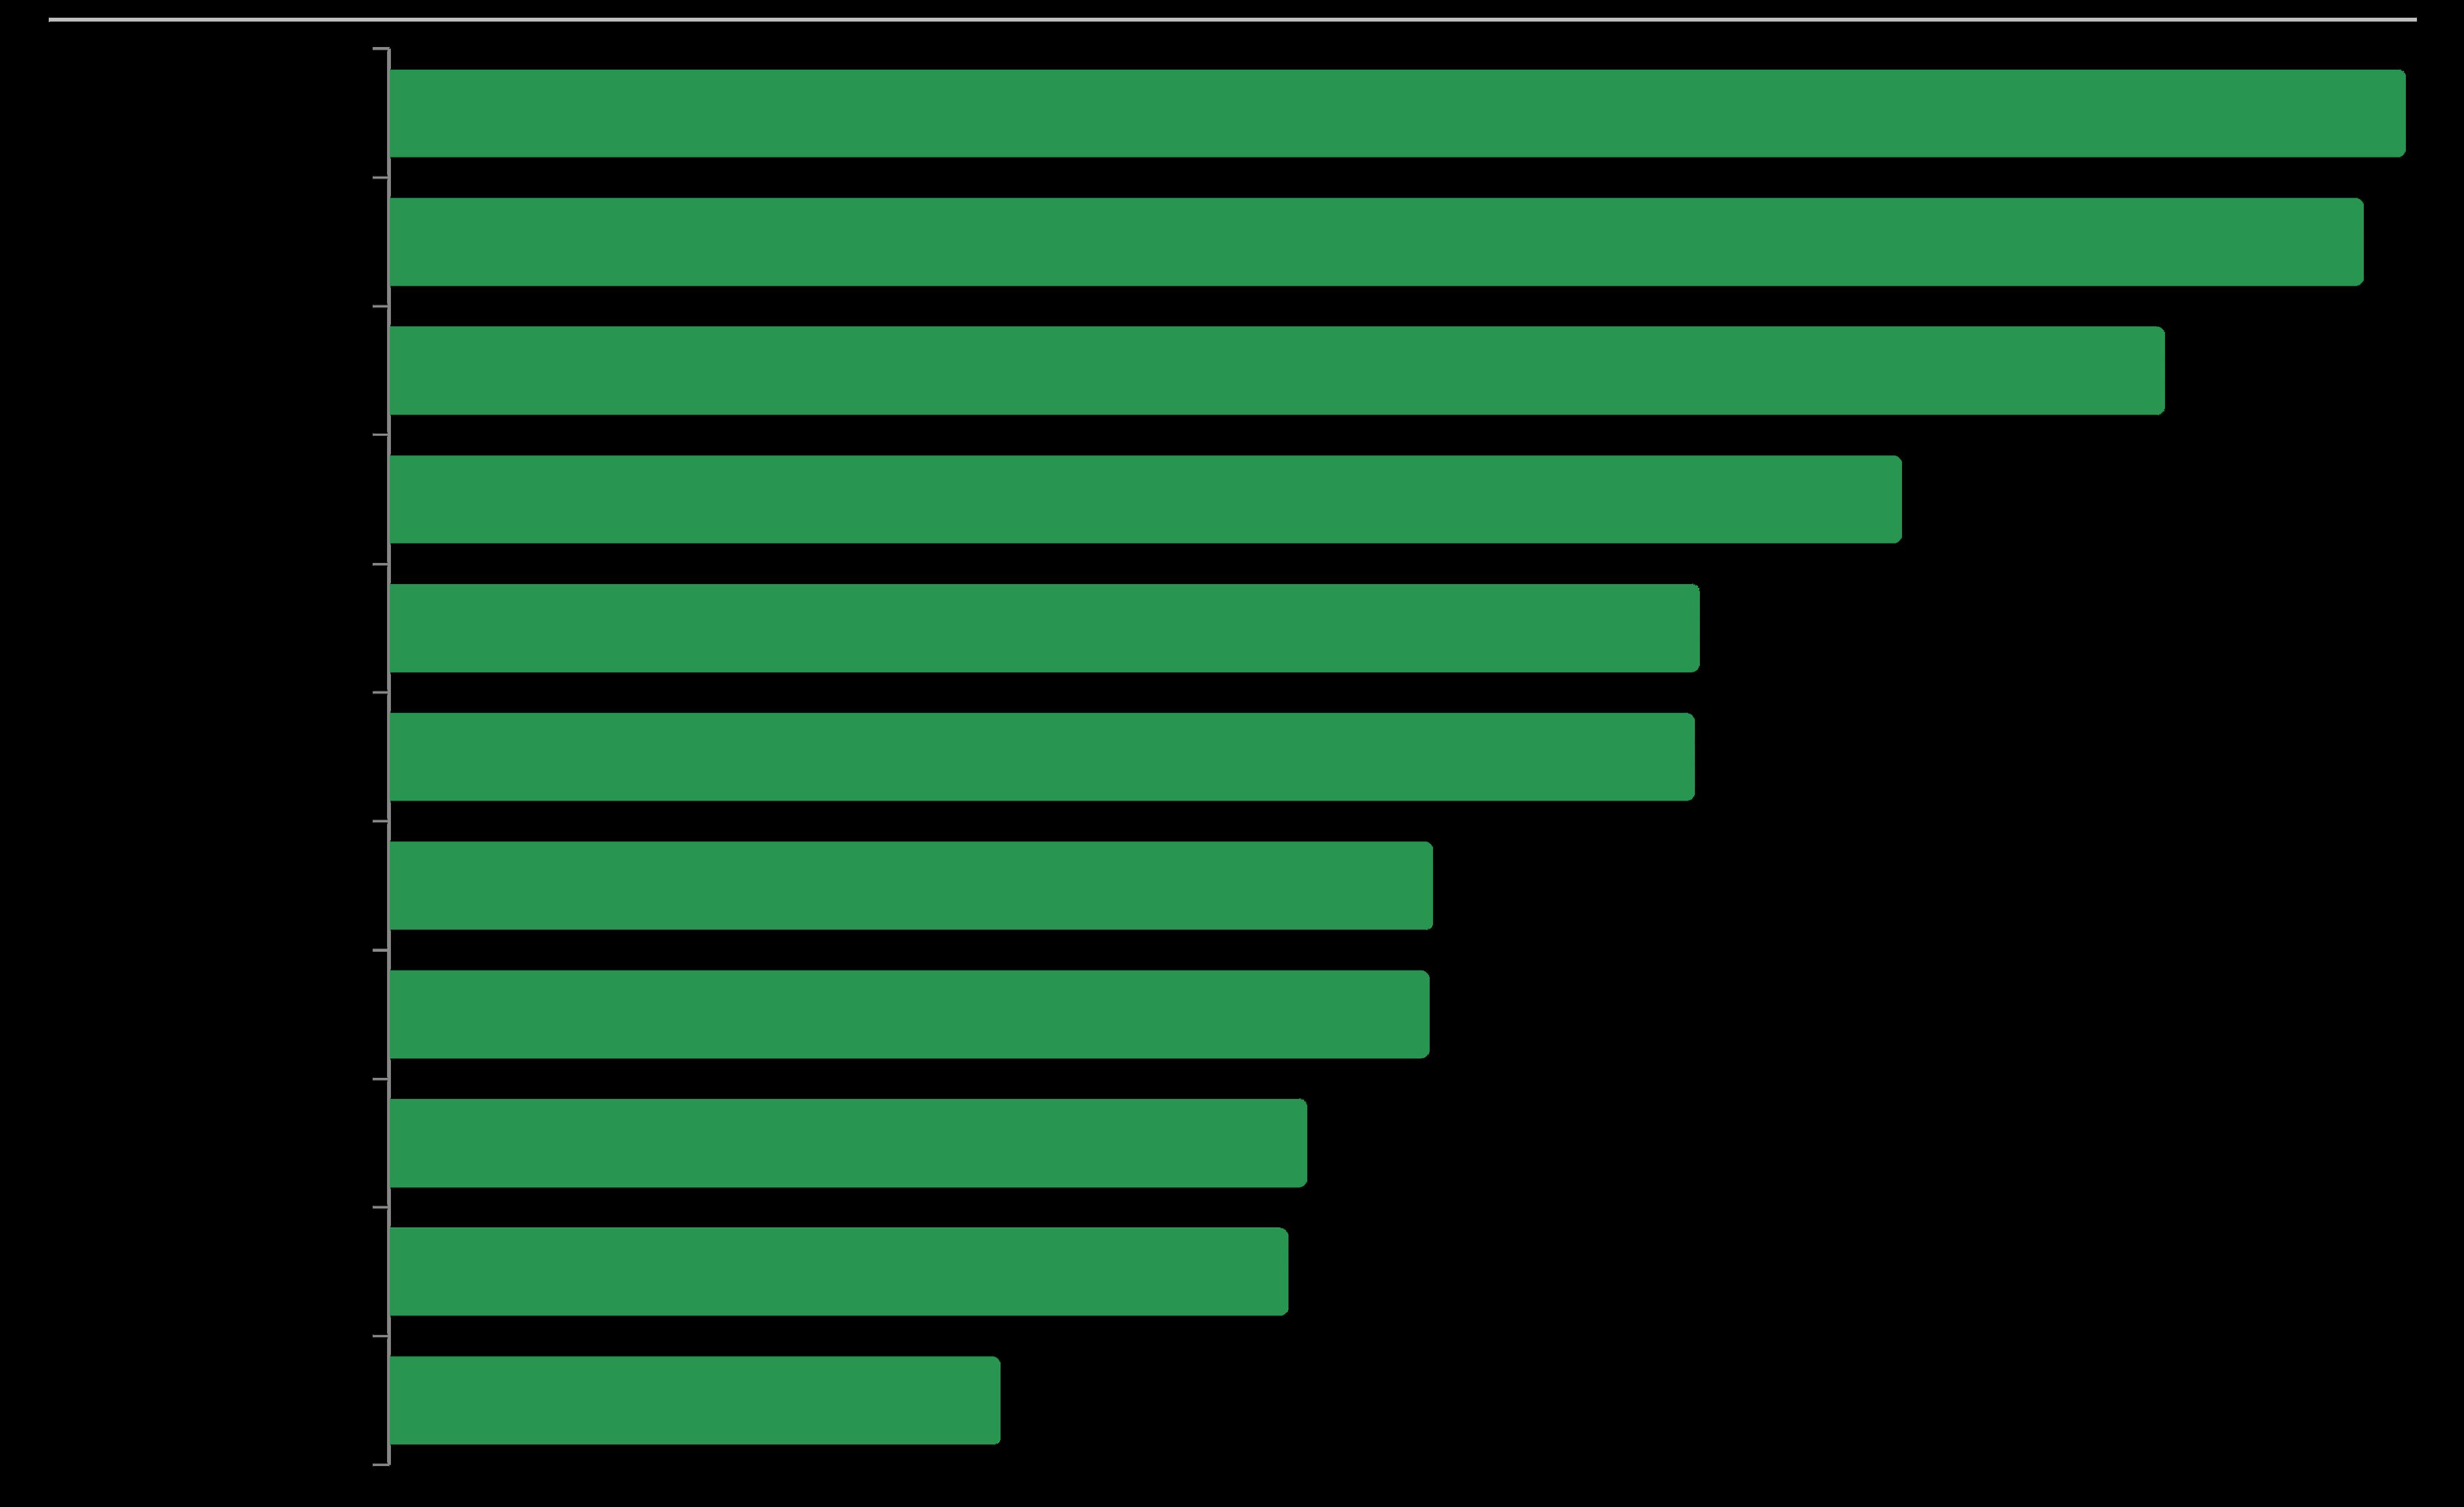
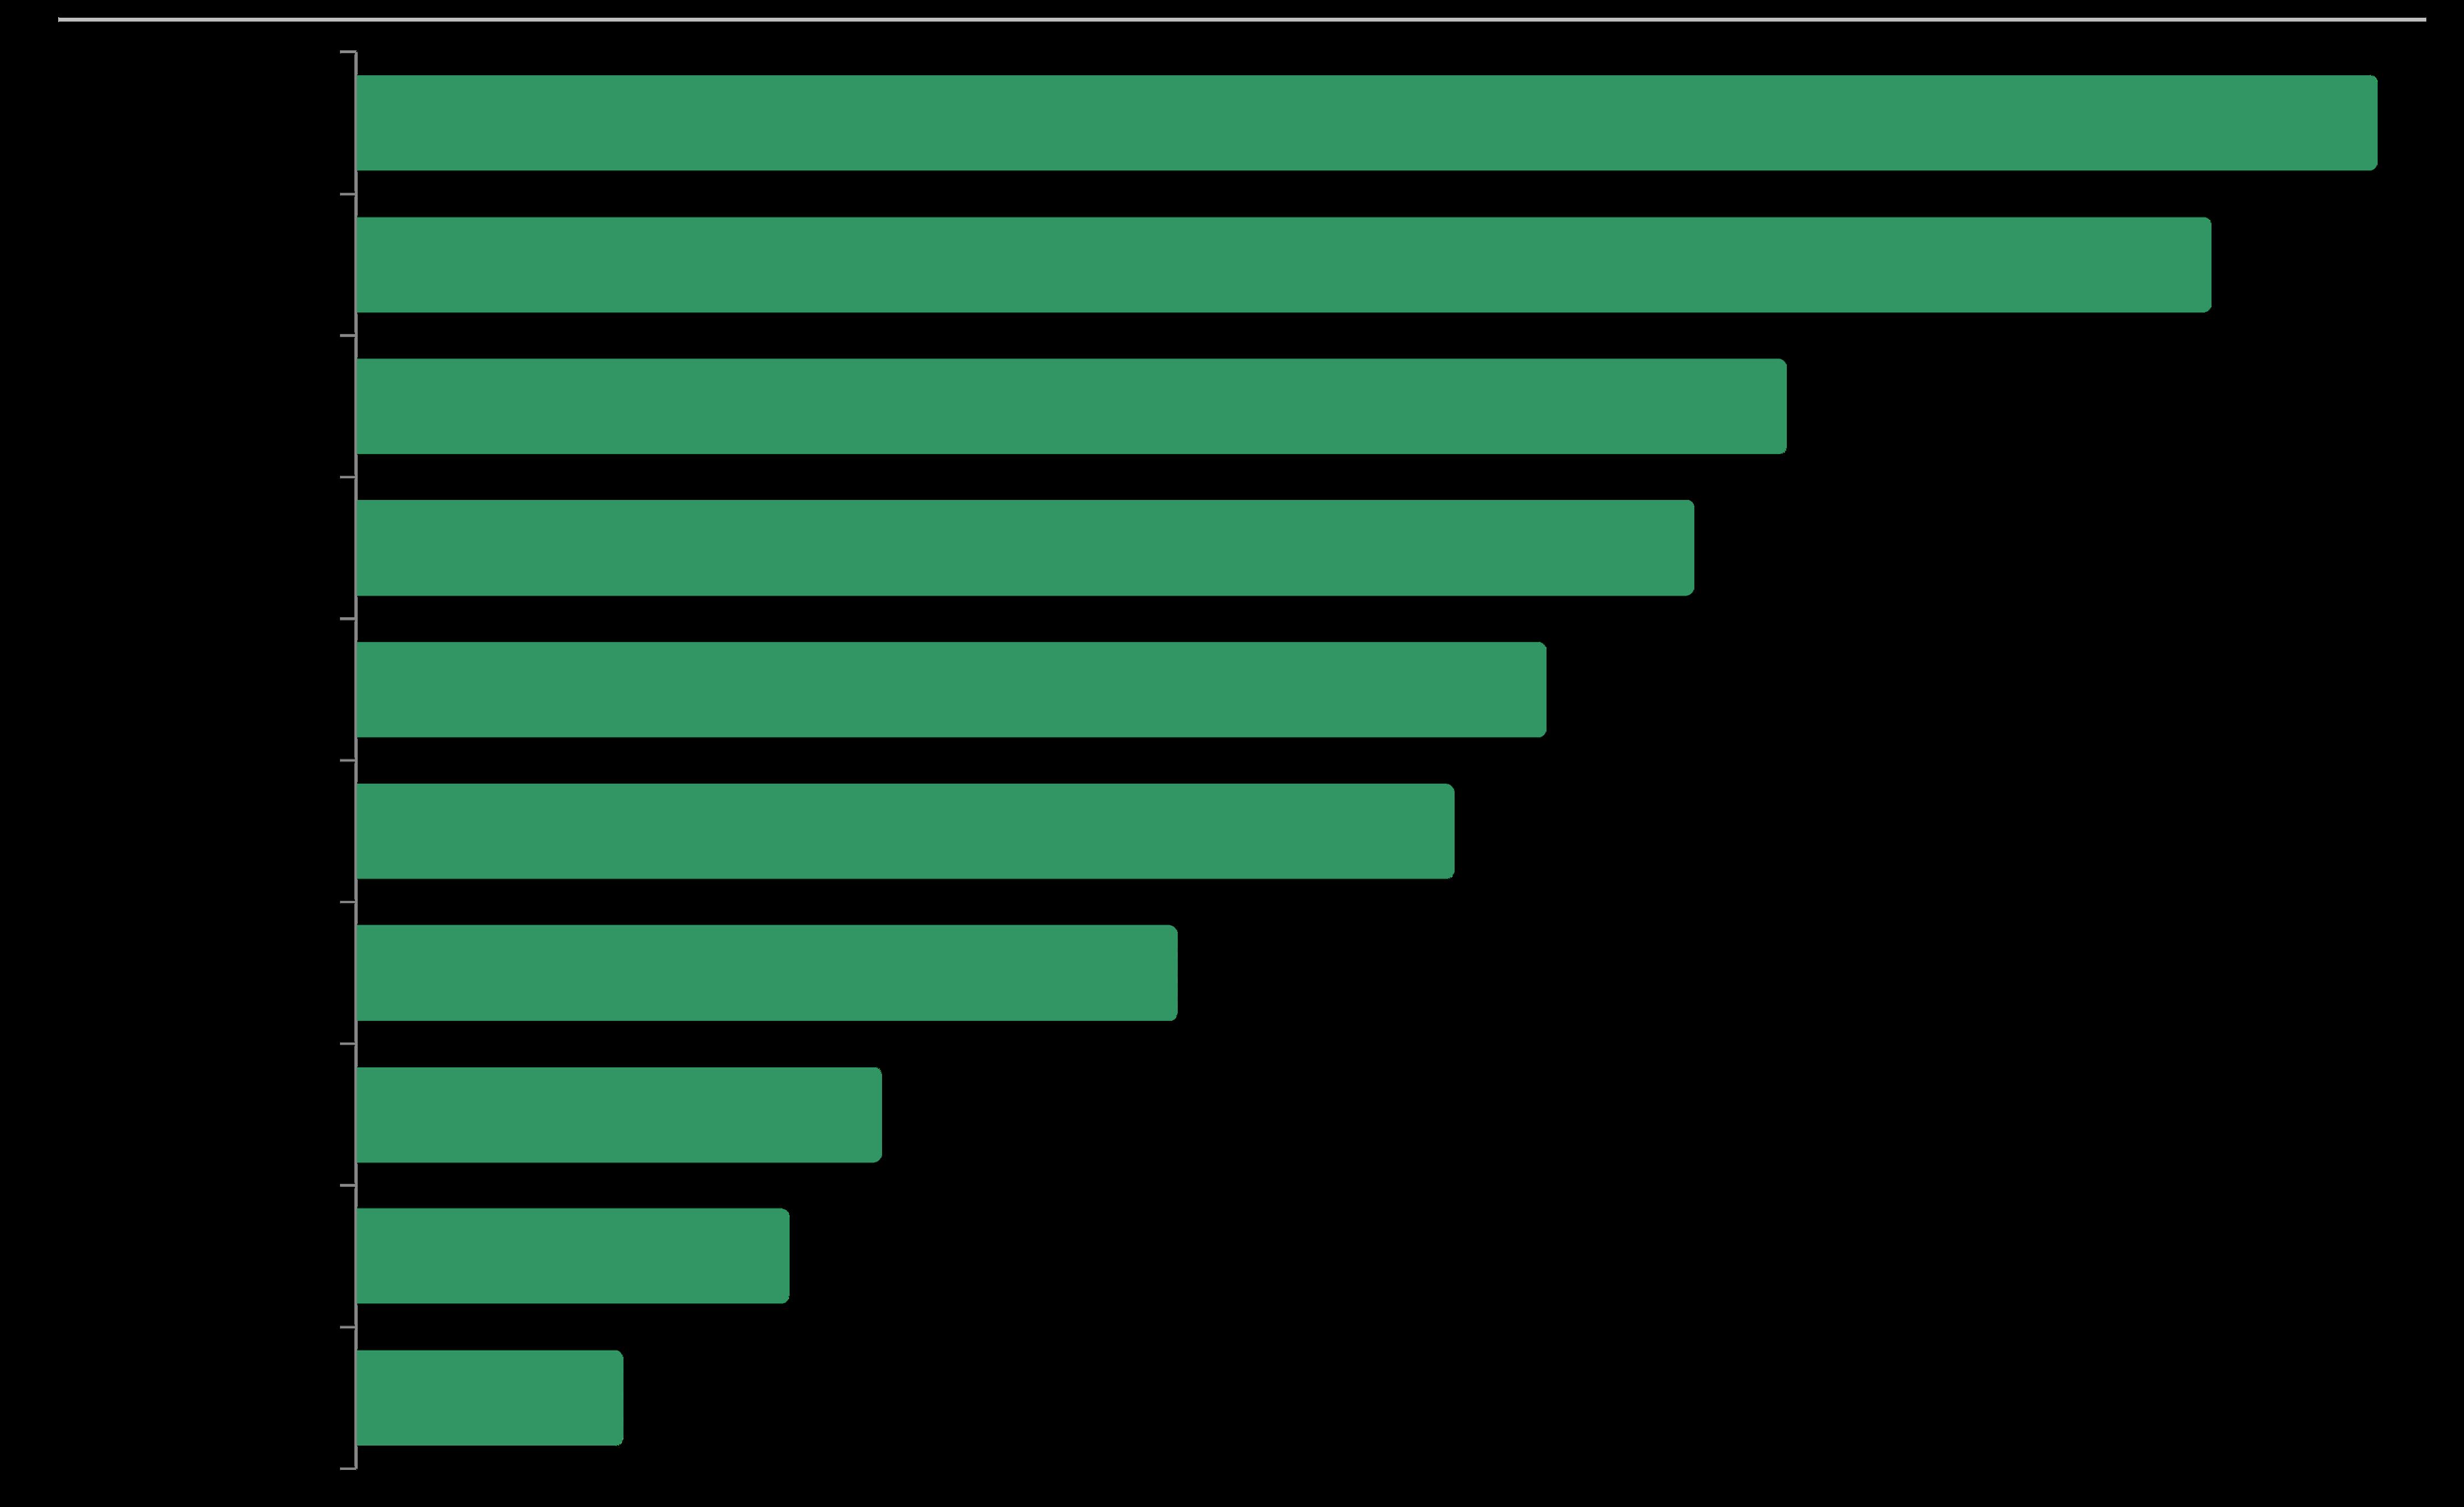
Year-over-Year % Change in Monthly Number of Home Sales
by Bay Area County, September 2025 Sales* Sales
Number of Year-to-Date Home Sales
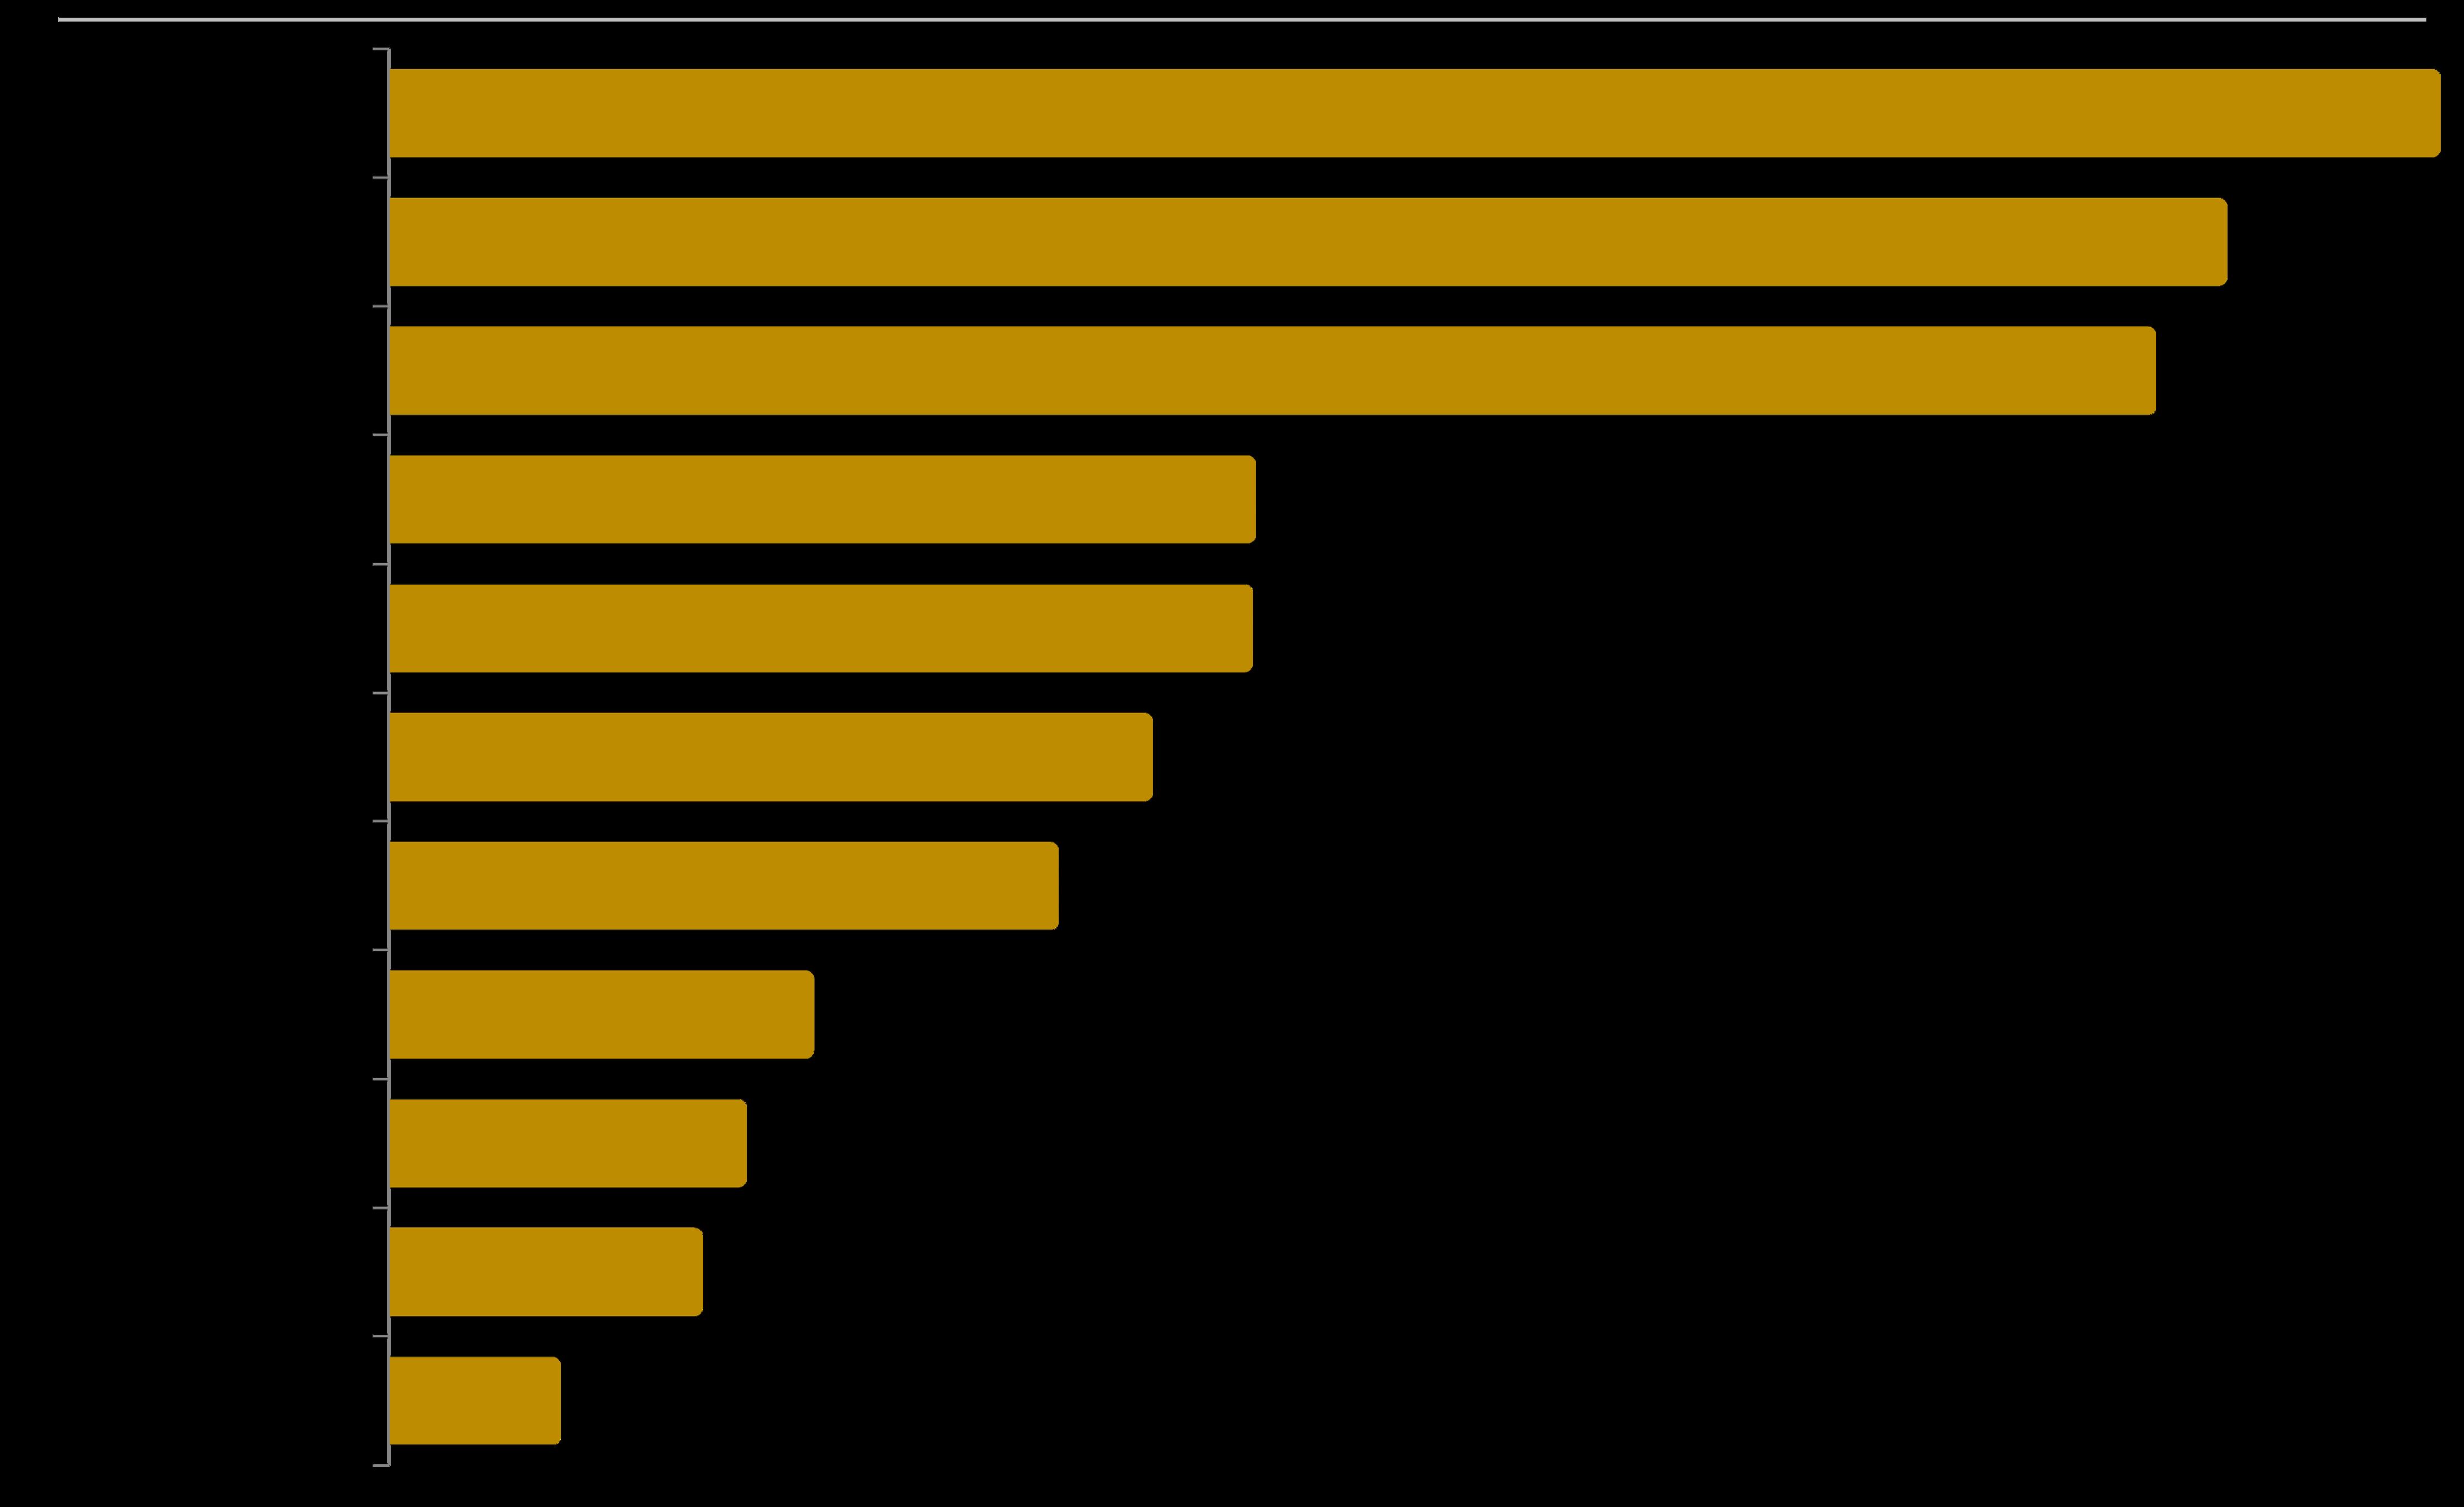
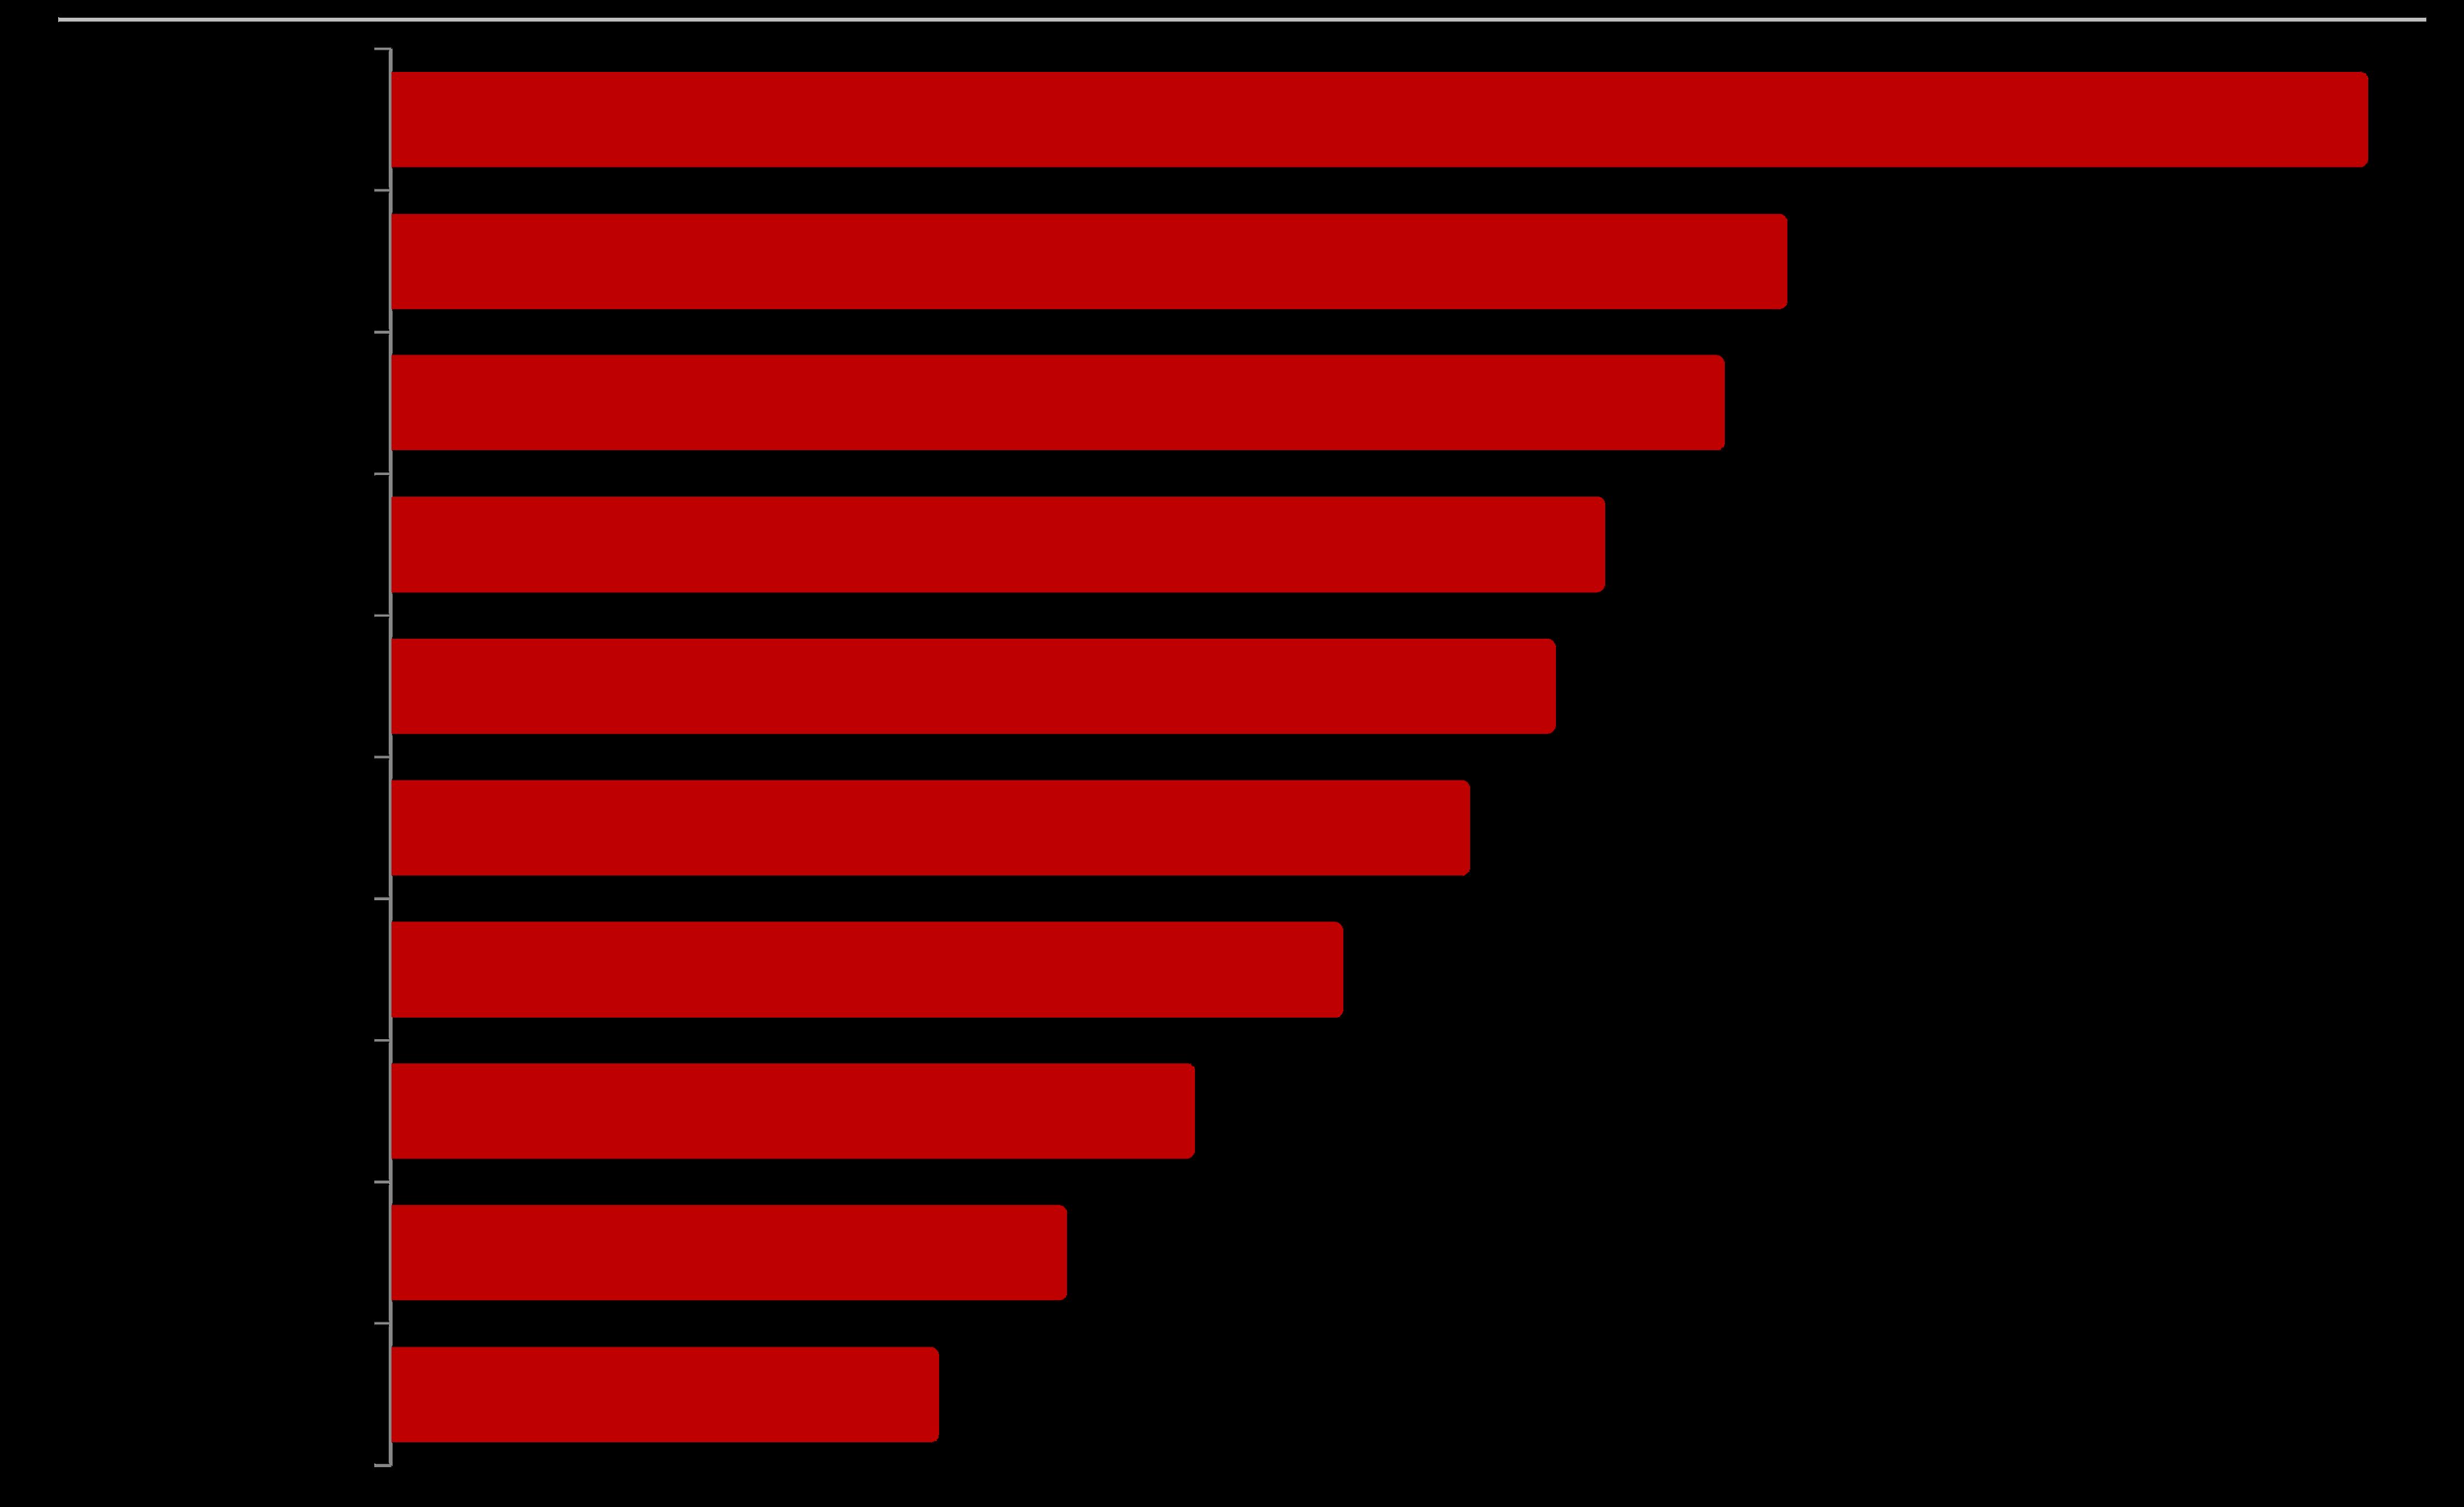
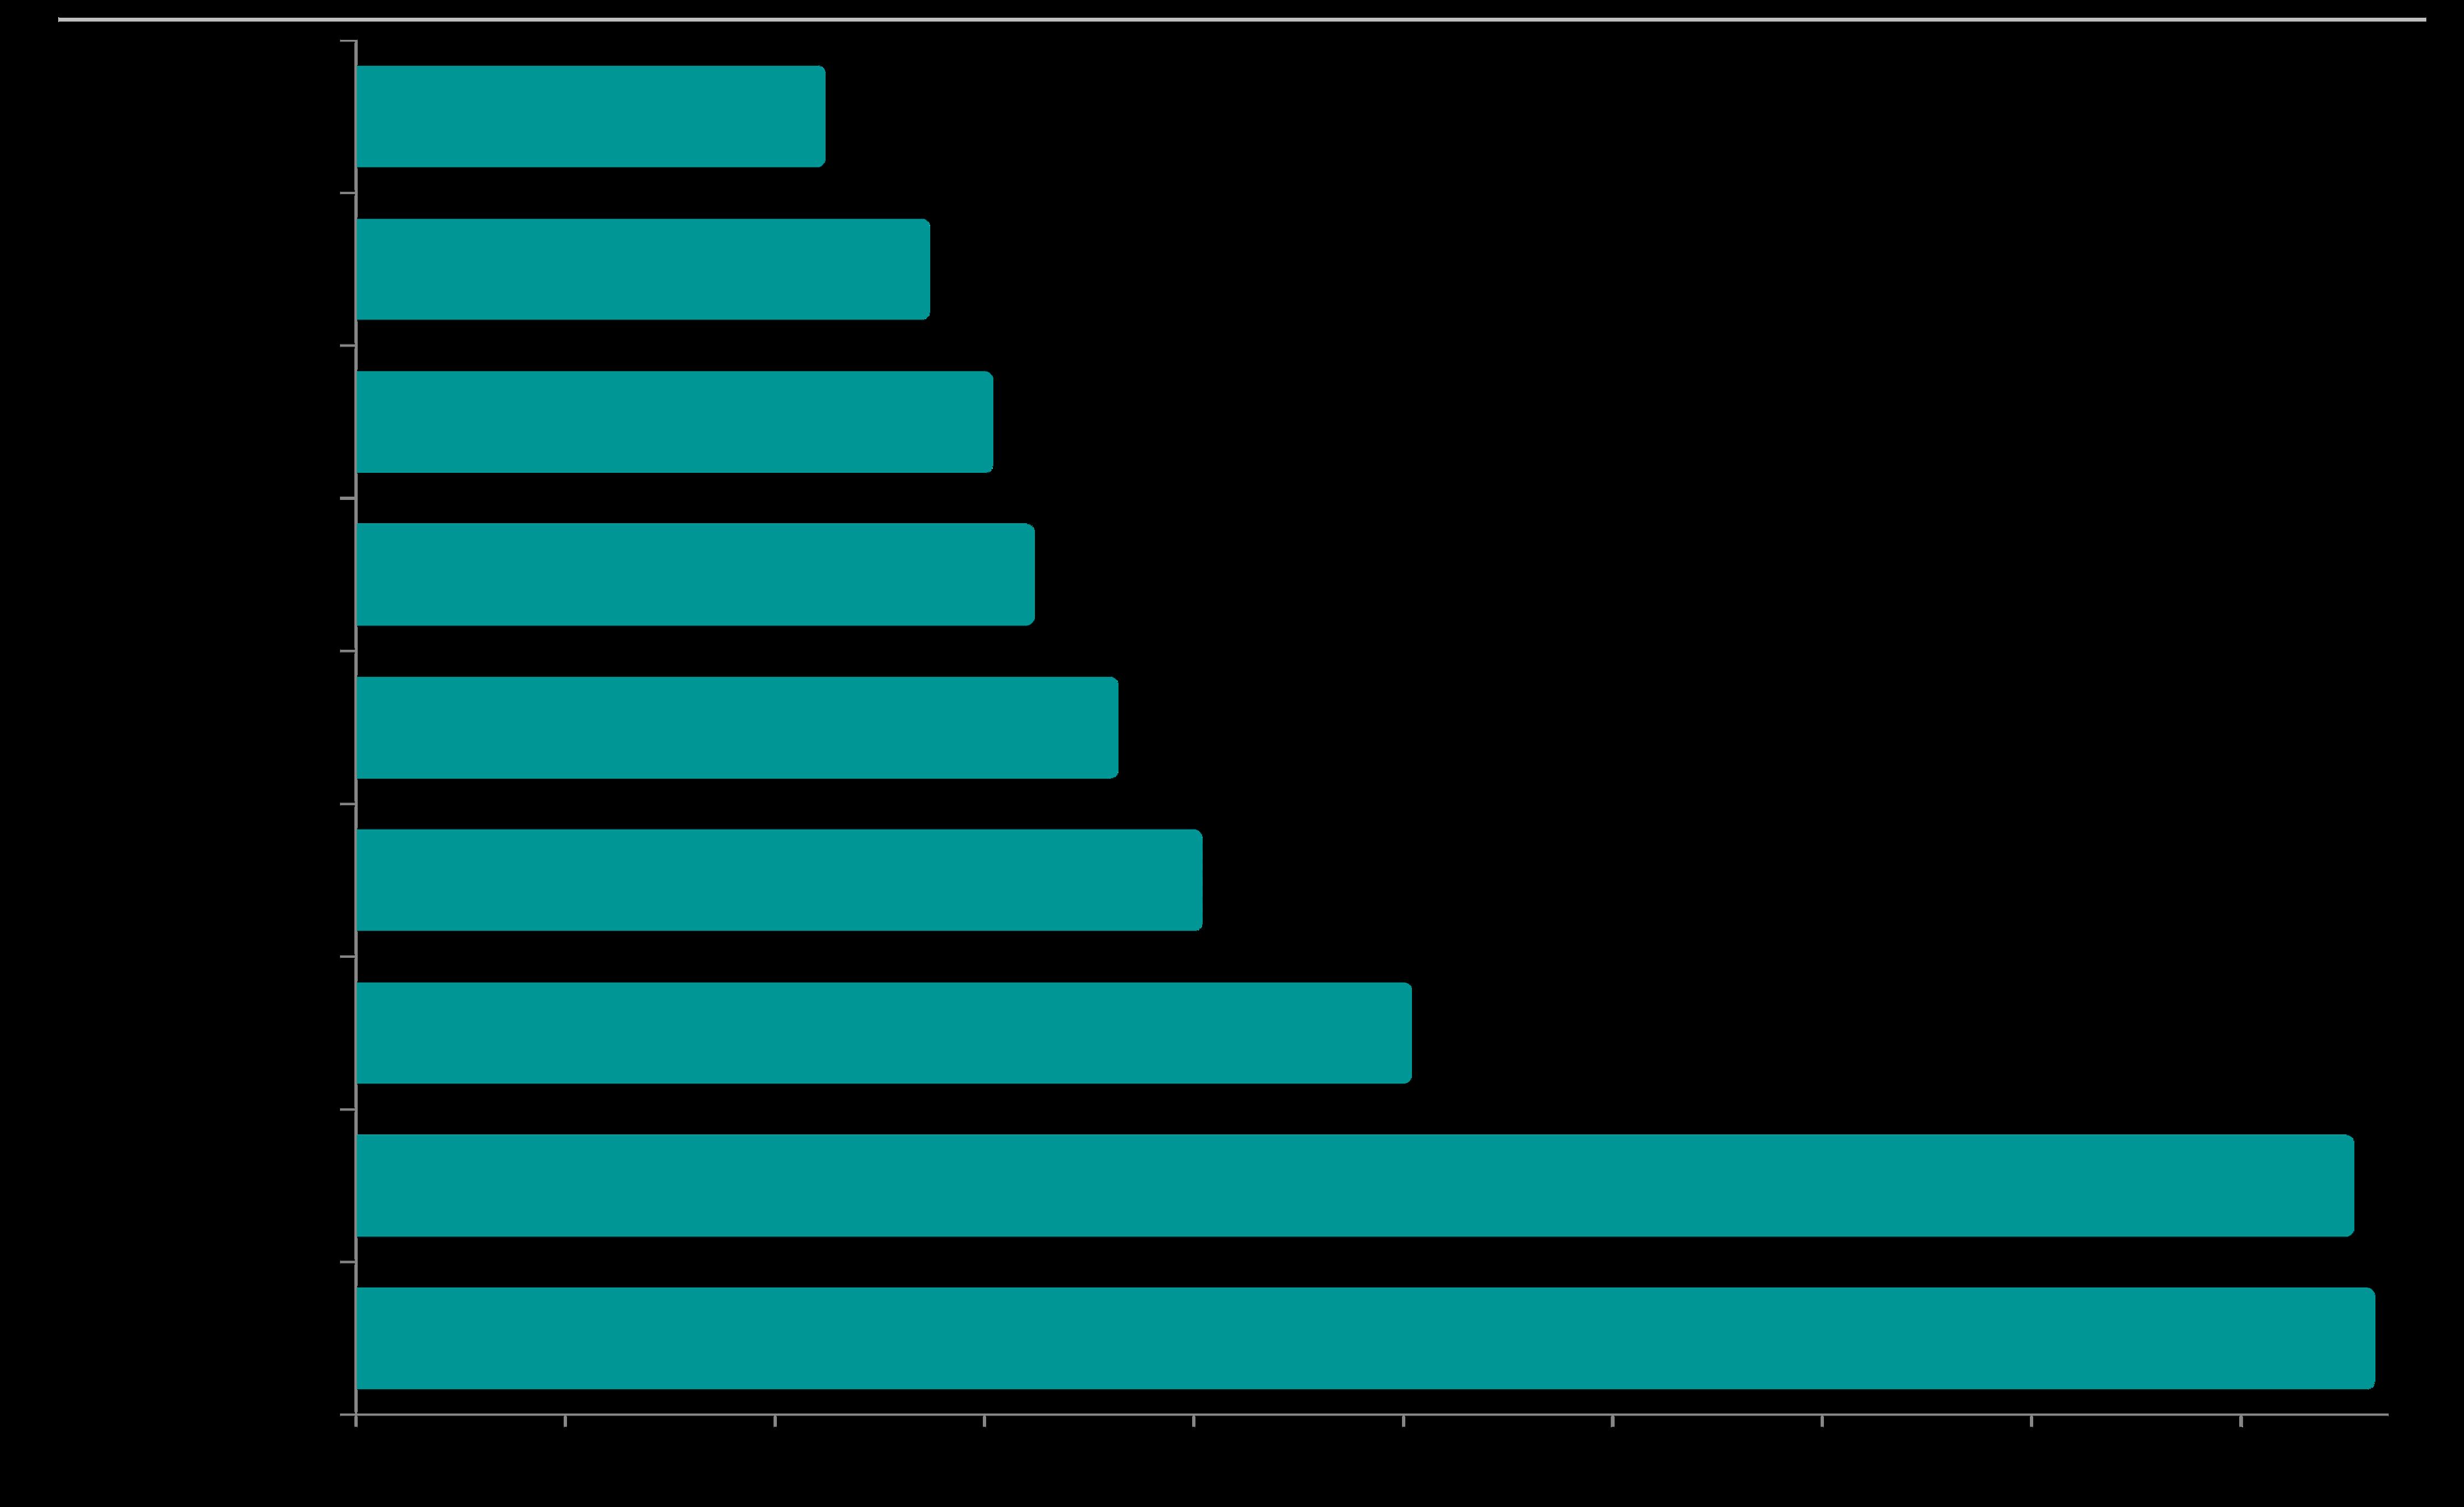
Year-over-Year % Change in Number of Active Listings on Market
by Bay Area County, as of October 1, 2025*
Comparing the number of active listings on 10/1/25 to the number on 10/1/24
Napa & Sonoma Counties have seen the largest year-overyear % increases in their number of listings on the market.
Inventory trends can vary between and submarkets, price segments
San Francisco was the only Bay Area County that saw a year-over-year decline in property types within the same county.
its number of active listings on 10/1/25 – and it was a very substantial decline. This is helping to pressurize its real estate market.
*Active/coming-soon listings posted to NorCal MLS Alliance on October 1st 2025 and 2024. Percentages rounded. Data fromsources deemed reliable,but maycontain errorsandsubjectto revision. Not all homes for sale are posted to MLS. All numbers approximate.
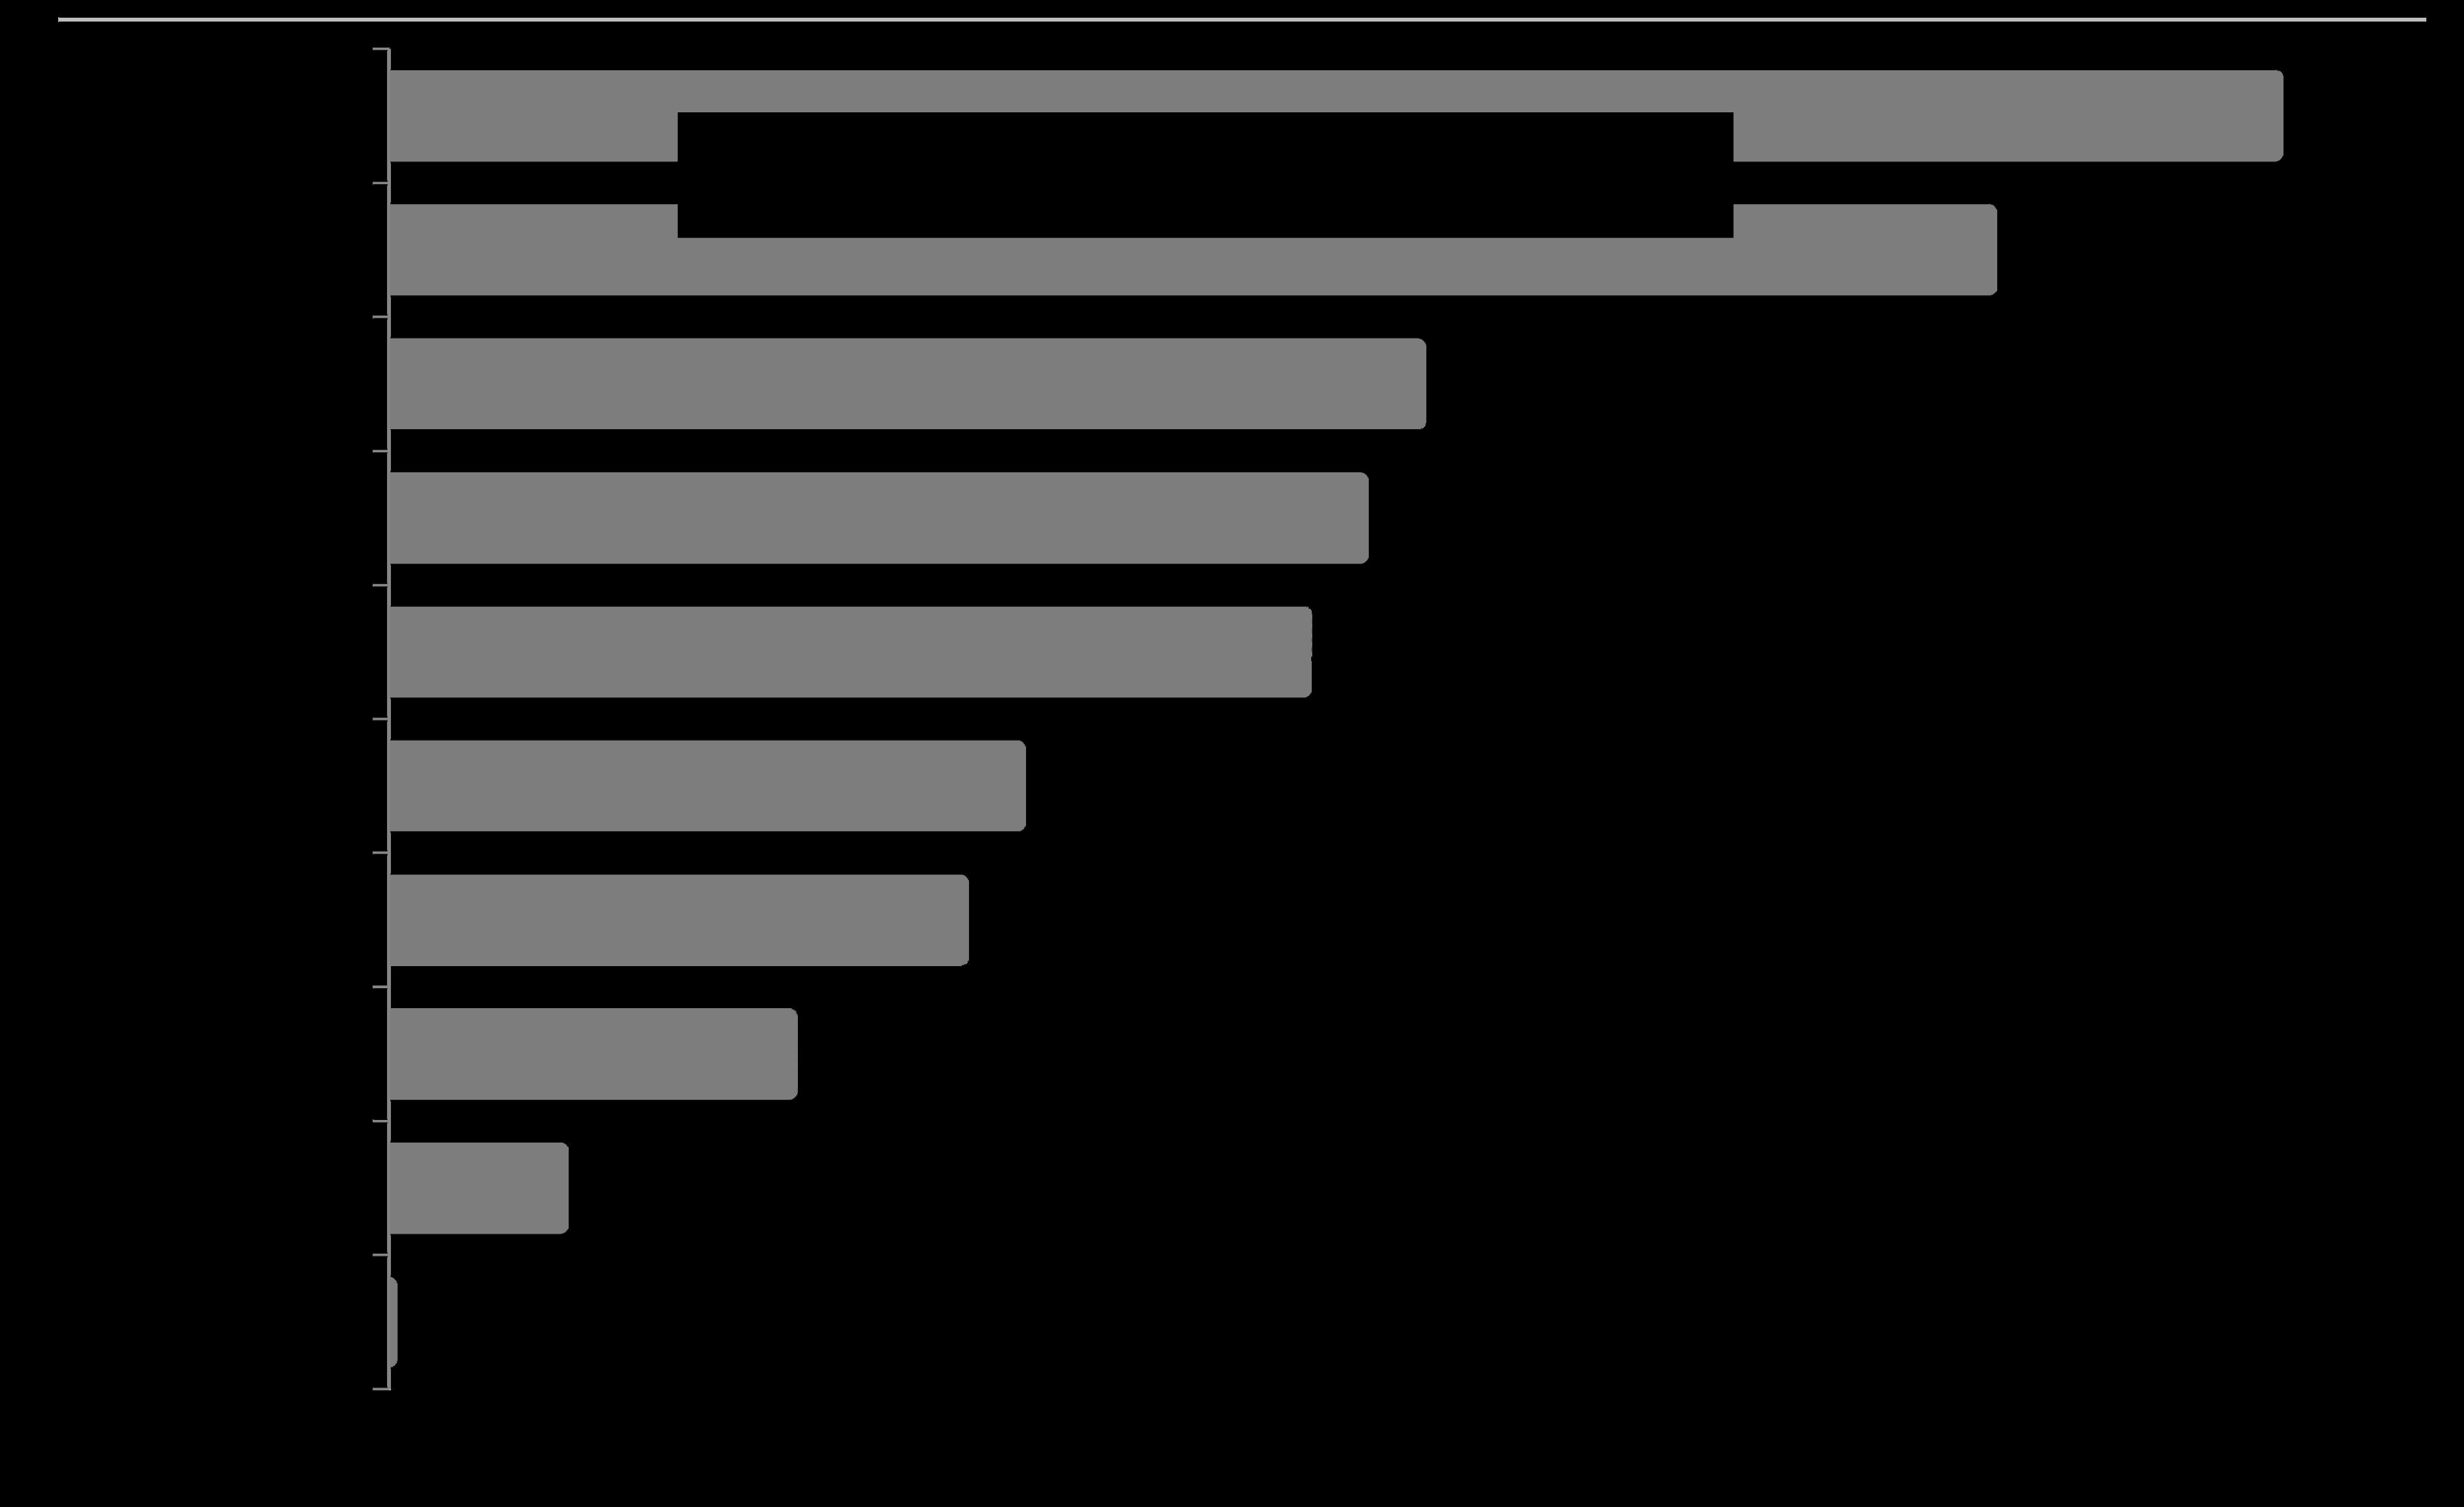
Median House Sales Prices
& Year-over-Year % Change by Bay Area County, 2025 YTD Sales*
The counties most affected by the AI boom in 2025 have been Santa Clara, San Francisco & San Mateo. Median price is that price at which half the sales occurred for more and half for less. It is a very general statistic that typically disguises an enormous range of sales prices in the individual underlying sales. It may fluctuate for reasons other than changes in fair market value. Counties contain submarkets of widely different values. How these prices apply to any particular home is unknown with a comparative market analysis.
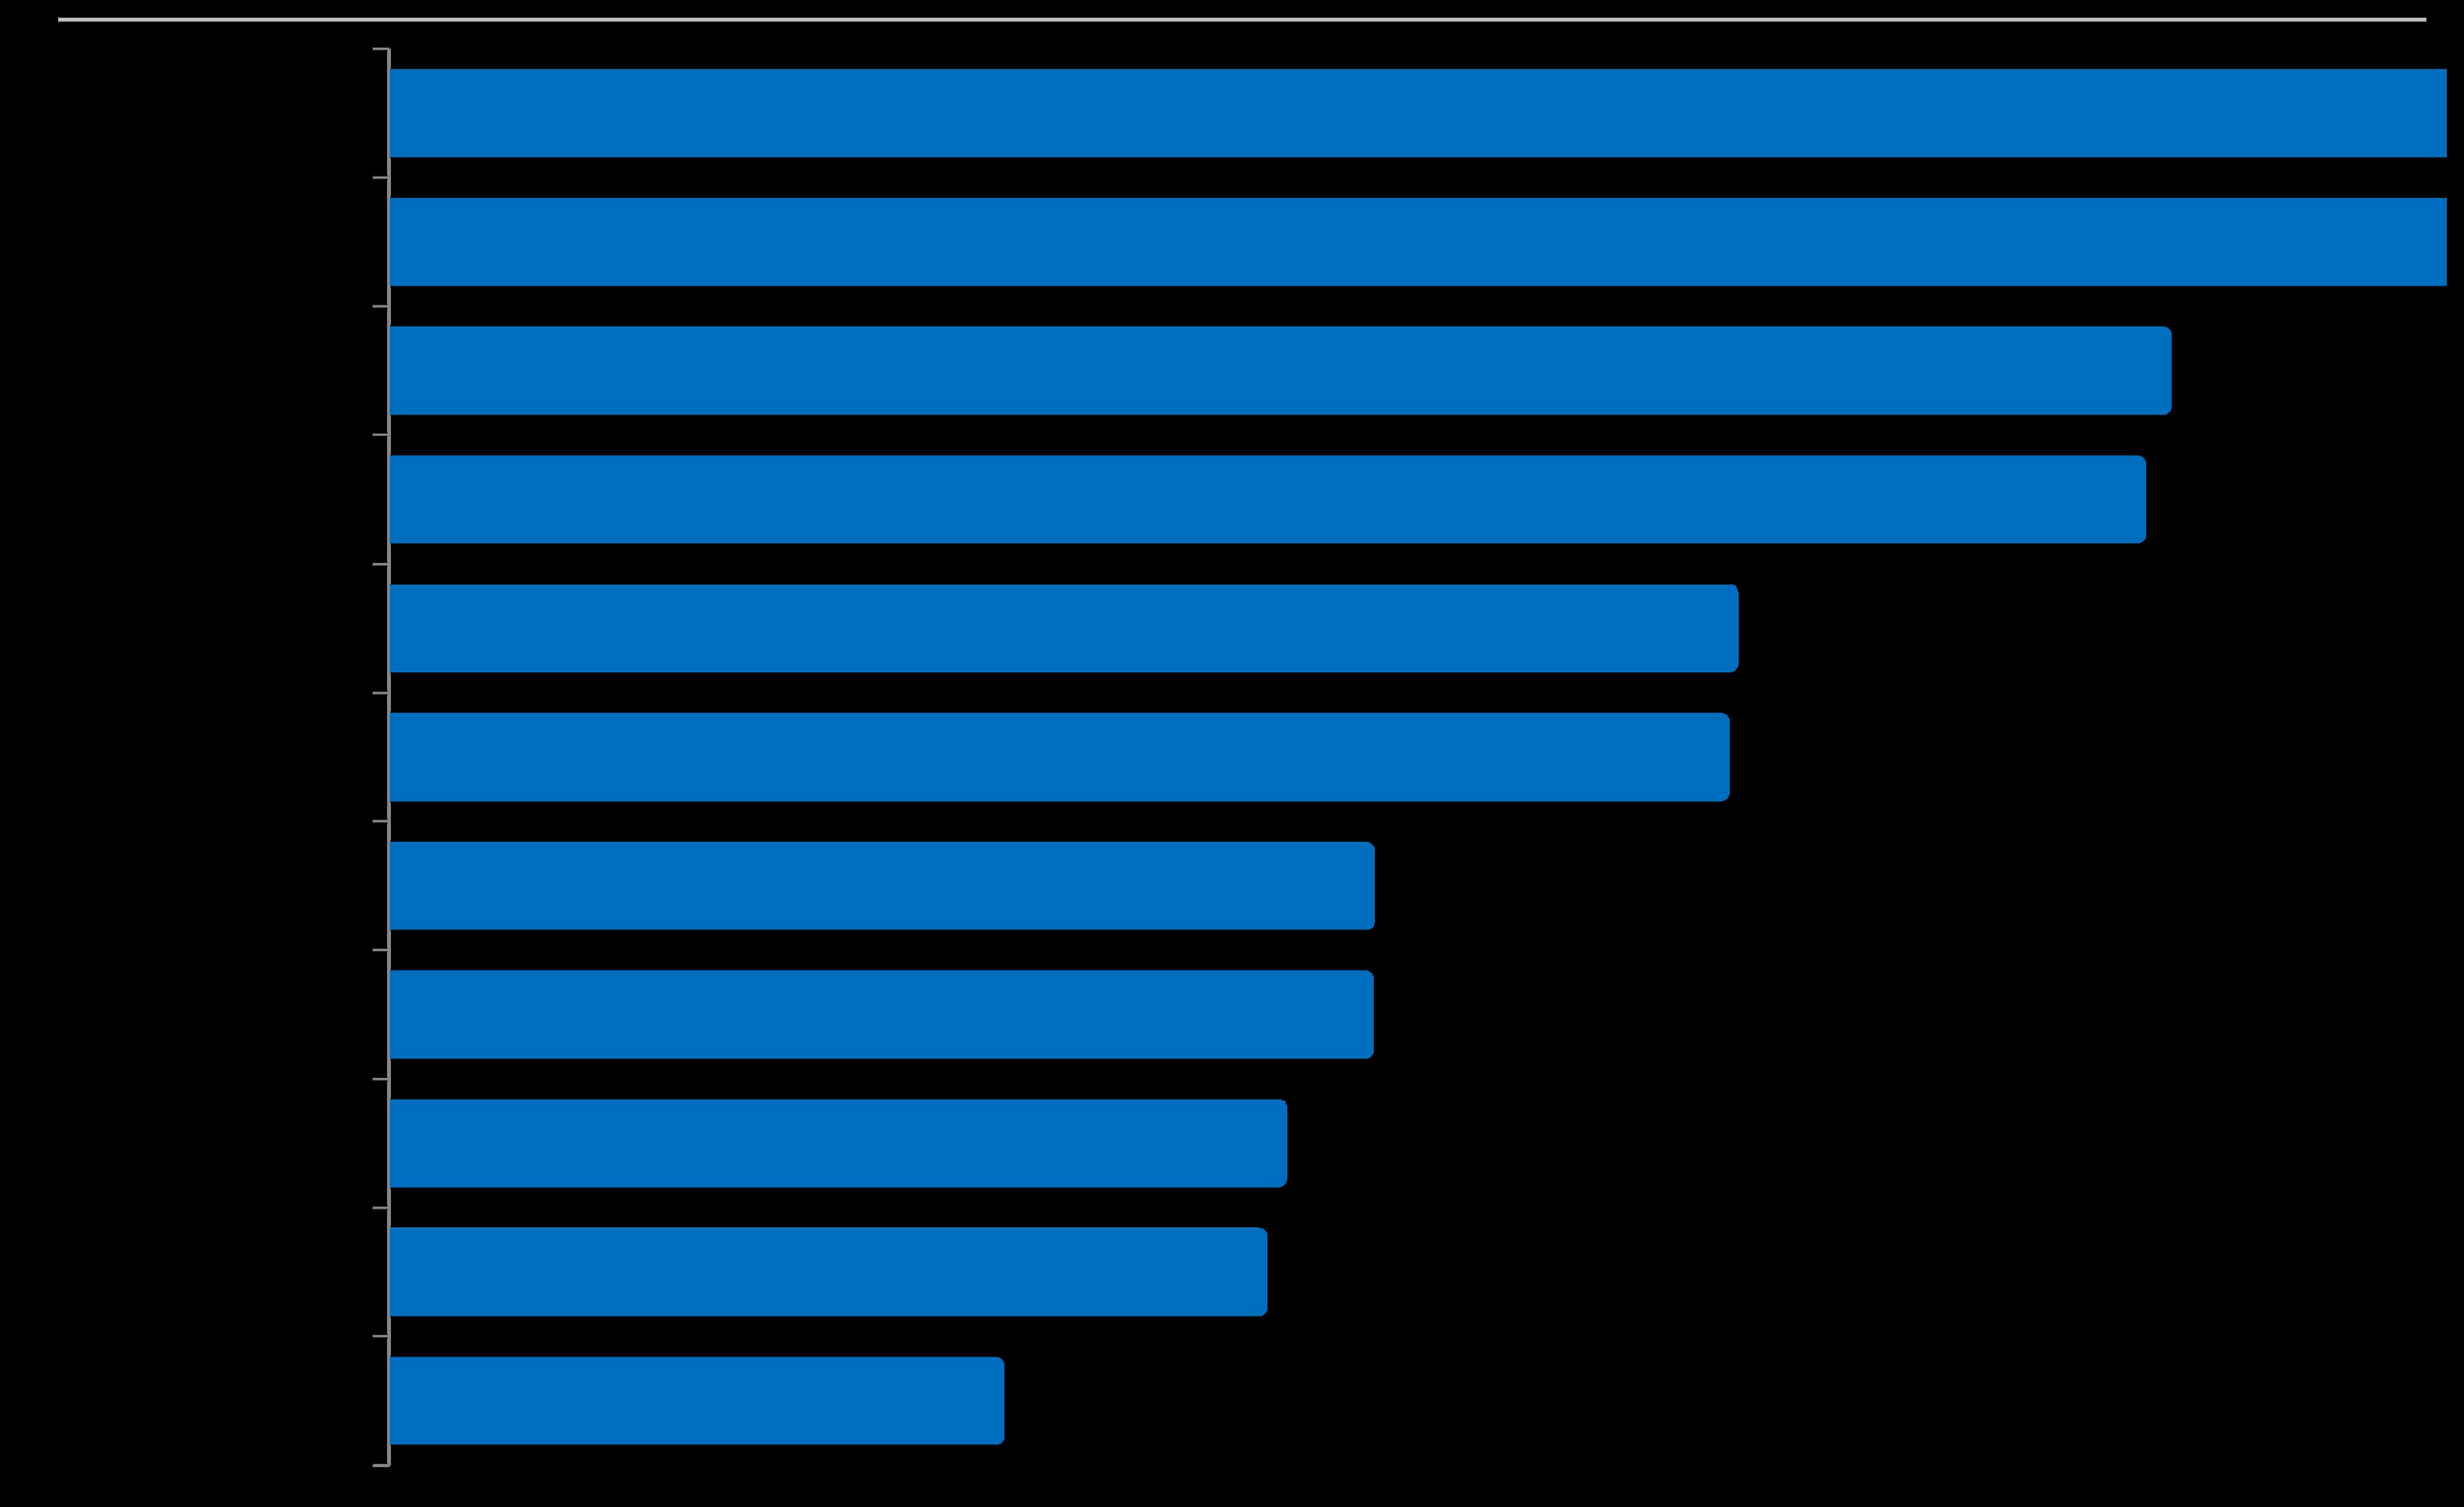
Median House Dollar per Square Foot Value
by Bay Area County, 2025 YTD Sales*
Santa Clara
Contra Costa
Sonoma
House sales reported by 9/30/25*
Dollar per square foot is calculated on interior livable space and does not include garages, attics, basements, storage rooms, rooms built without permit, patios, decks or lot size. Values are affected by location, age, quality of construction, condition, architectural style, home size, lot size, views, parking, amenities and many other factors. Counties contain submarkets of widely different values, and how these values apply to any particular home is unknown with a specific comparative market analysis.
Median 2-Bedroom Condo Sales
Prices & Year-over-Year % Change
Bay Area County, 2025 YTD Sales*
$1,241,000
$875,000
$835,500
$760,000
The big county condo markets in the greater Bay Area are Santa Clara, San Francisco, Alameda, Contra Costa and San Mateo. Because of the relatively low numbers of sales in the other counties listed here, appreciation calculations may be less reliable.
$340,000
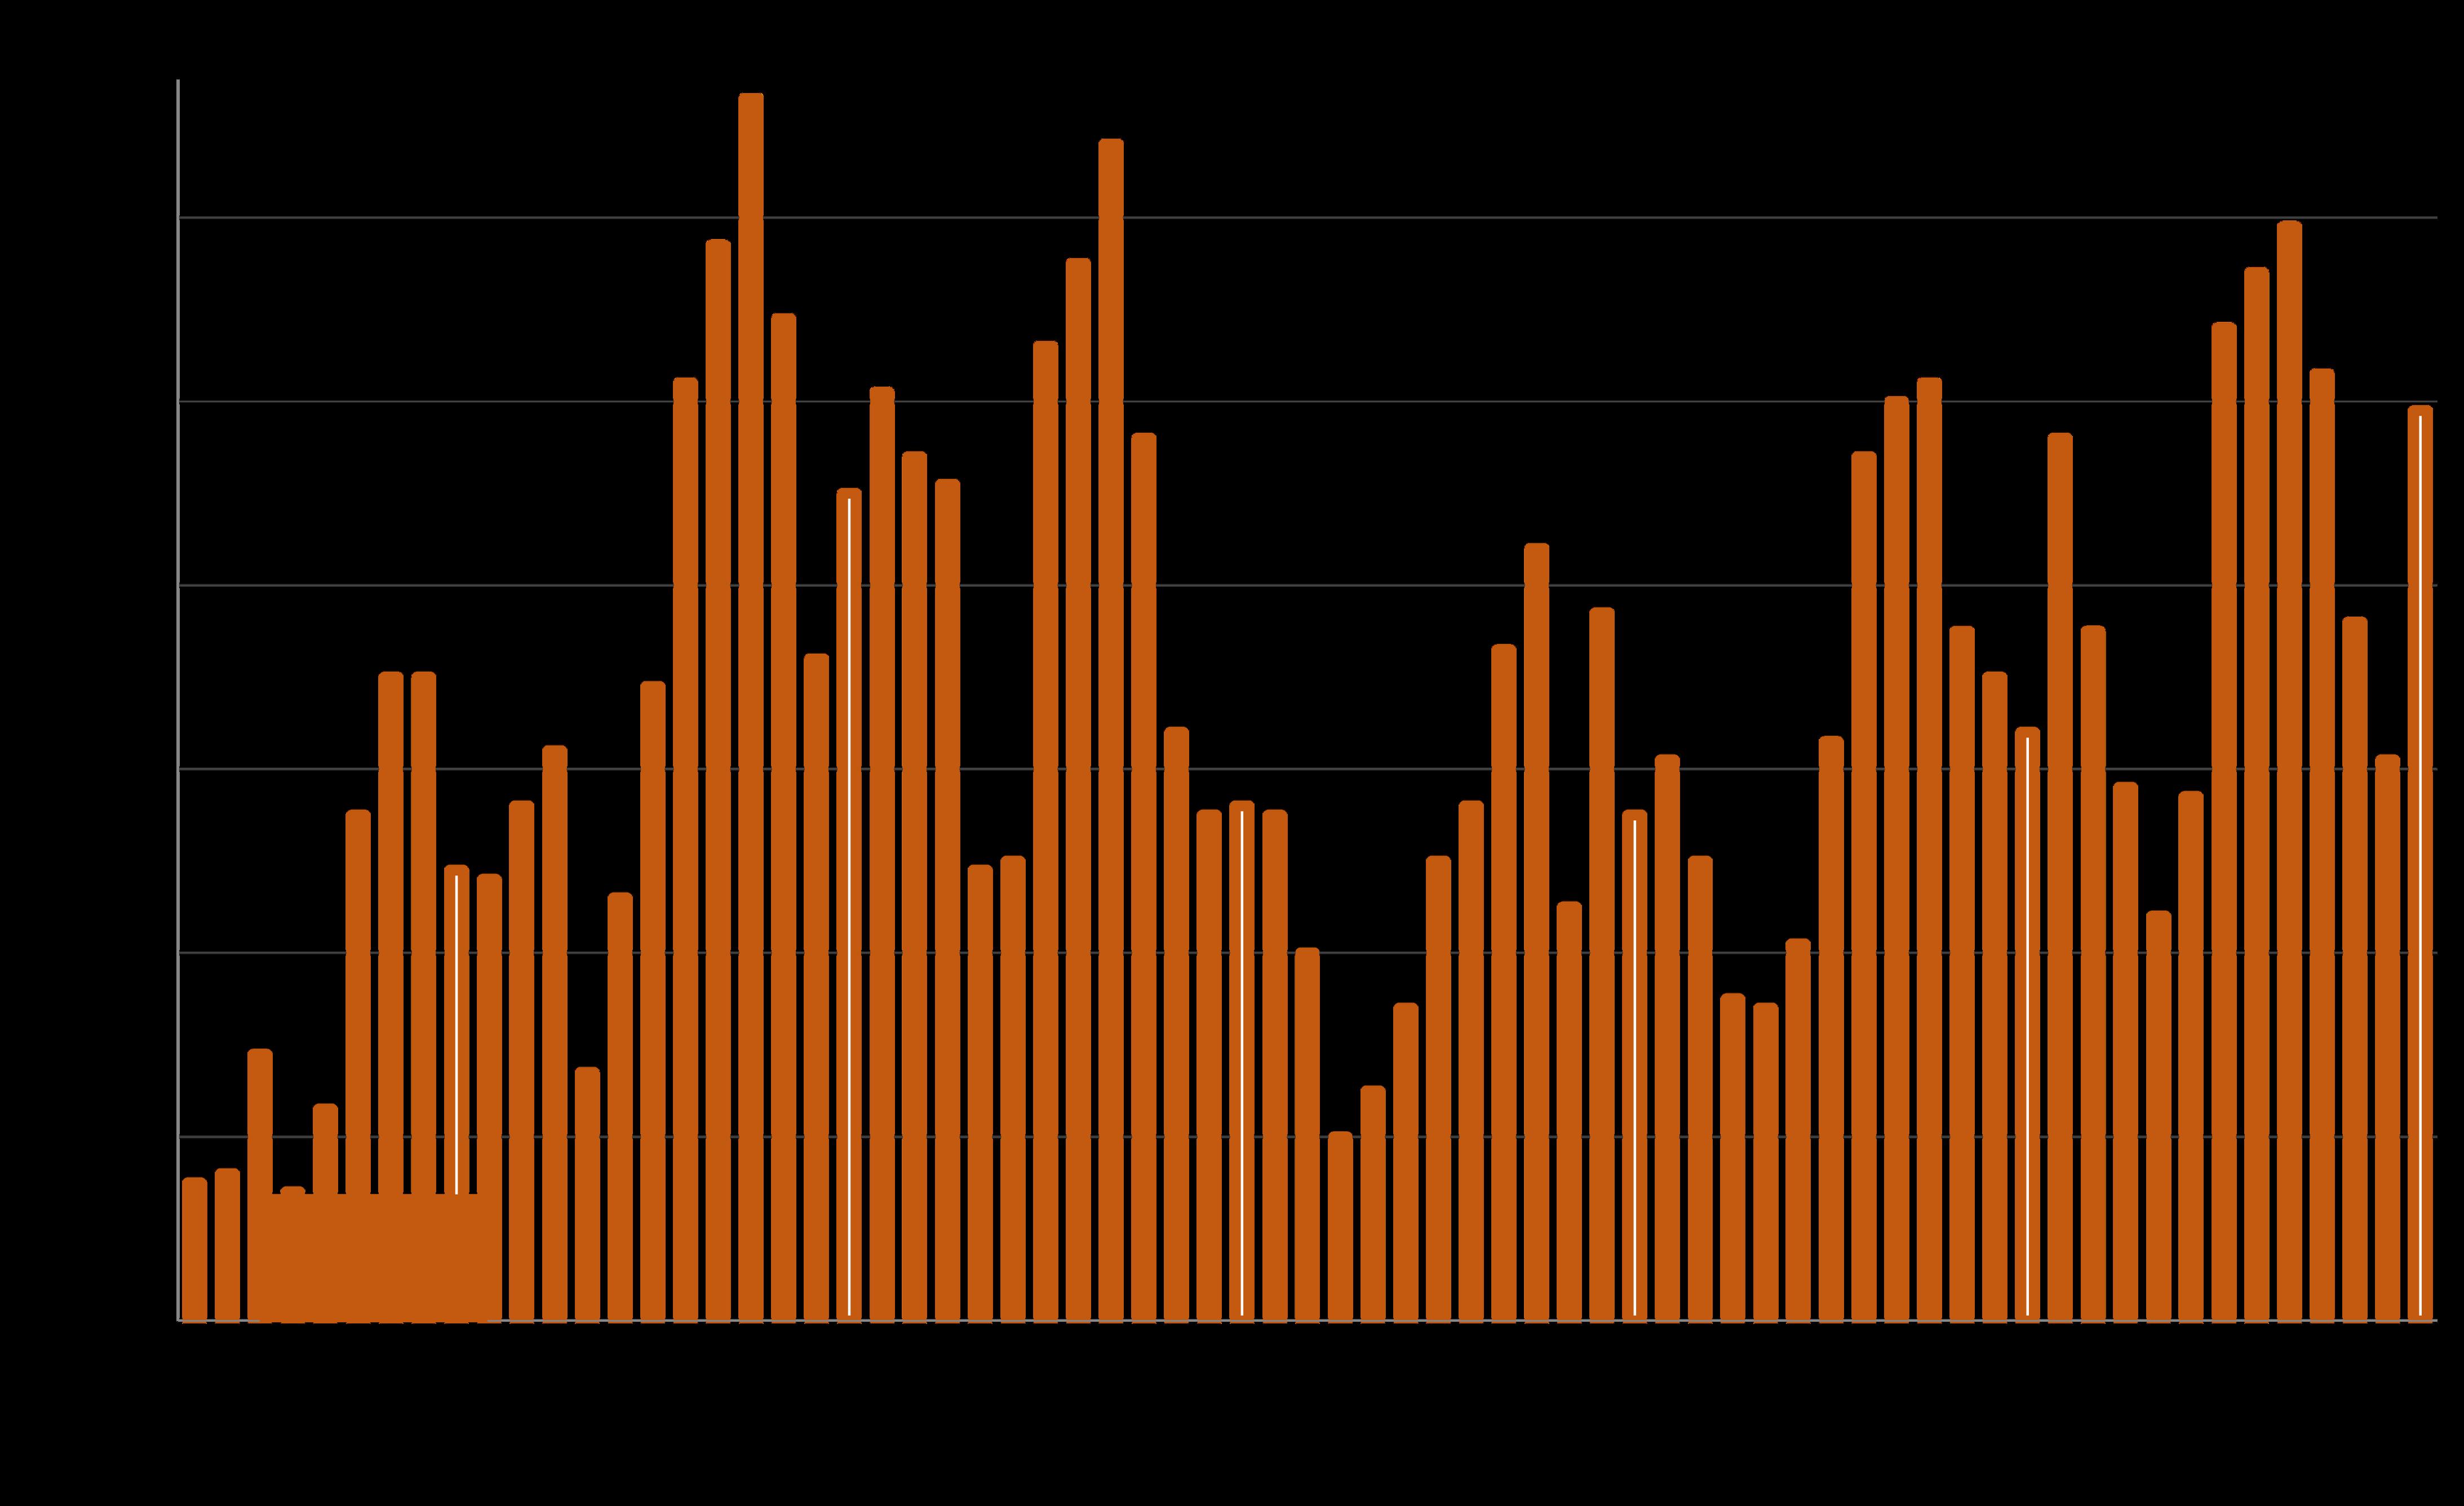
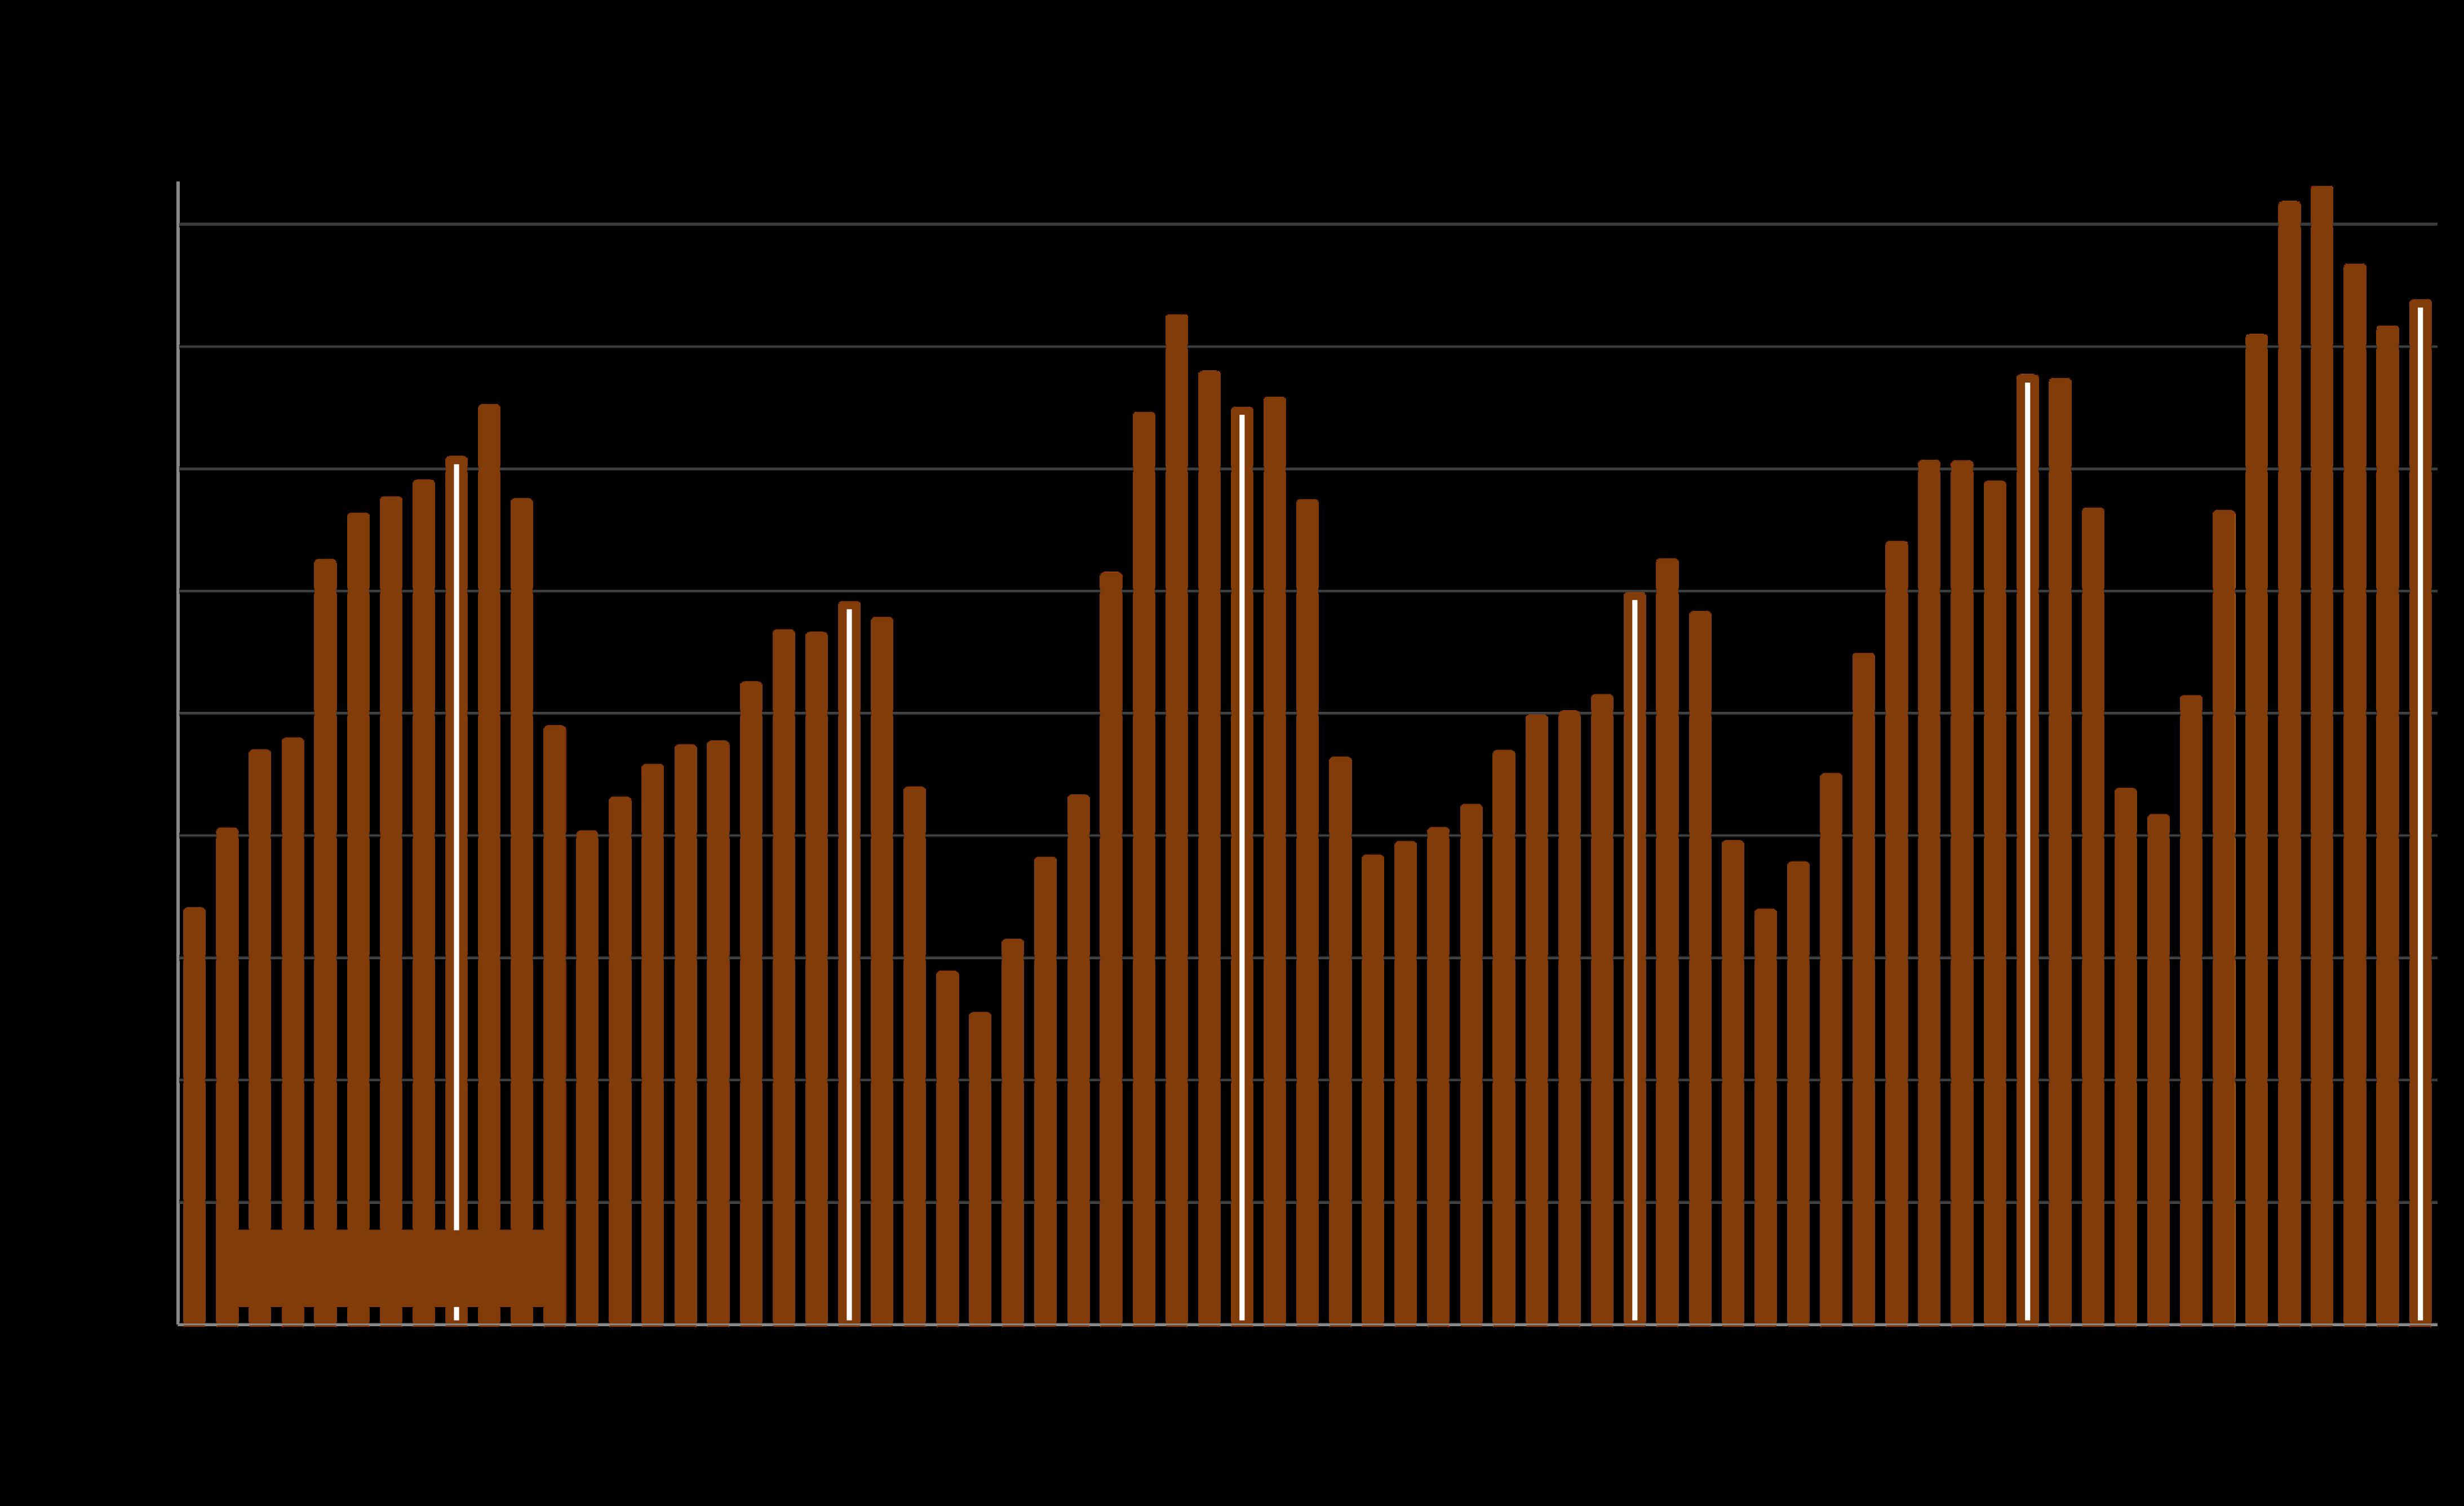
Luxury Home Sales, $5 Million+
BayAreaMarketDynamics&Seasonalitysince 2020*
The number of $5,000,000+ home sales in September 2025 surged dramatically from August (62%) and from September 2024 (55%). $5m+ sales are concentrated in Santa Clara, San Mateo, San Francisco and Marin Counties, and all saw large % year-over-year increases (39% to 60%) in September.
*Last month’s sales estimated using sales reported by early the next month. 7 Bay Area Counties in San Francisco and San Jose Metro Areas, sales reported to NorCal MLS Alliance. Data from sources deemed reliable but may contain errors and subject to revision. All numbers approximate and may change with late-reported
Powered by the explosion of AI-boom wealth, Santa Clara and San Mateo Counties have been dominating $5m+ home sales.
In 2025, SF’s luxury market has begun to see the effects of an accelerating AI start-up boom.
In San Francisco, Santa Clara, San Mateo, Marin and Monterey Counties, we use $5,000,000 as the threshold for “luxury” home sales. In the other Bay Area Counties listed, $3,000,000 is considered the luxury-home price threshold (and $5 million+ is considered “ultra-luxury”).
*$5,000,000+ home sales reported to NorCal MLS Alliance, per Infosparks through September 2025, based on data available on 10/3/25. Data from sources deemed reliable, but may contain errors and subject to revision. Not all sales are reported to MLS. All numbers approximate and may change with late-reported sales.
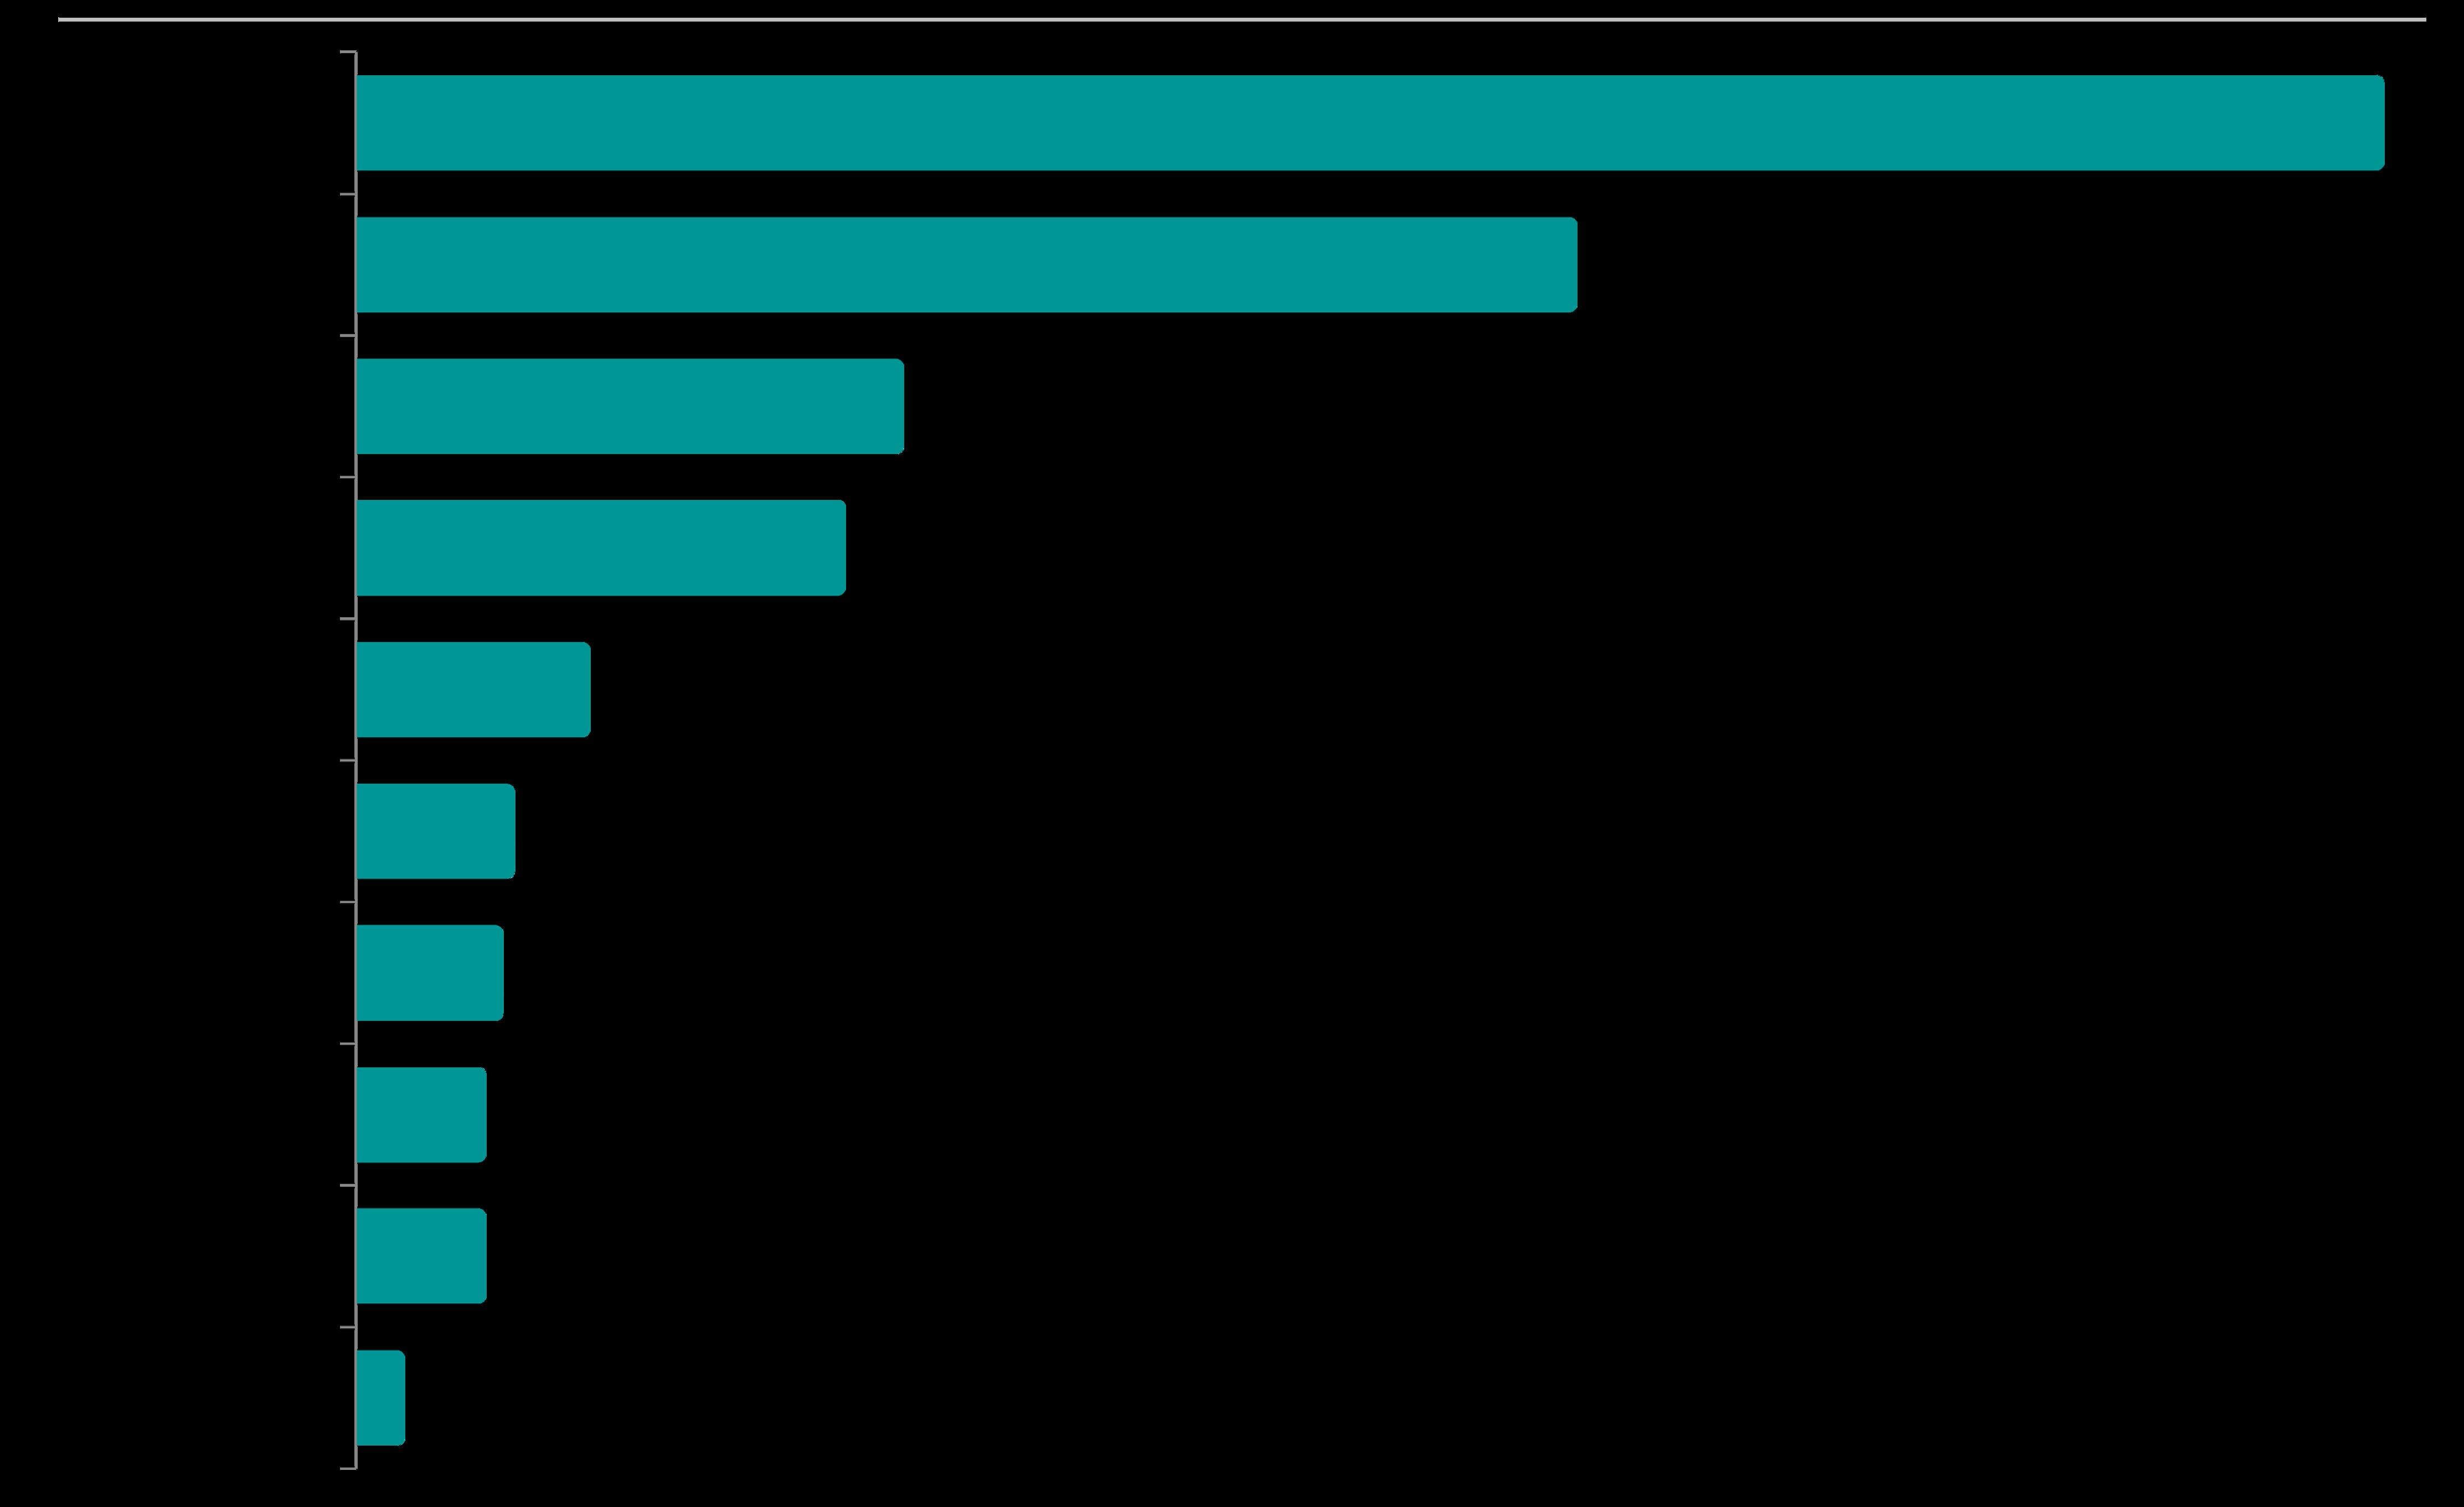
Number
of
Active $5 Million+ Home Listings
by Bay Area County, as of 10/3/25*
Comparing the number of active listings to the monthly rate of sales, Santa Clara County has the most heated market for $5m+ homes in the Bay Area, and San Mateo ranks 2nd.
Buyer’s markets: Comparing the number of active listings to the monthly rate of sales, it would take over 2 years to sell the existing supply of $5m+ homes for sale in Napa & Sonoma Counties.
Of SF’s 64 active listings priced $5m+, 38% are condos and co-ops.
In San Francisco, Santa Clara, San Mateo, Marin and Monterey Counties, we use $5,000,000 as the threshold for “luxury” home sales (and $10 million+ “ultra-luxury.” In the other Bay Area Counties listed, $3,000,000 is considered the luxury-home price threshold (and $5m+ would be considered “ultra-luxury”).
*Active/coming-soon $5,000,000+ home listings posted to NorCal MLS Alliance, as of 10/3/25. Data from sources deemed reliable, but may contain errors and subject to revision. Not all homes for sale are posted to MLS. All numbers approximate. The number of active listings changes constantly.
Of the big markets for homes in this price segment, Santa Clara County sees, on average, the fastest sales.
Alameda and Contra Costa Counties don’t have large markets for homes in this price range, but they often sell quite quickly.
One measure of the heat of demand for these very expensive home sales is how long, on average, it takes the homes that sell to go into contract. The lower the average days-onmarket reading, the faster buyers are snapping up new listings. (This won’t include homes that don’t sell but instead end up being withdrawn from the market.)
SF luxury houses have an average DOM of 36 days, and sell much faster than condos and co-ops in this price segment.
Owner & Tenant Occupancy
PercentageofHousingUnits,byBayArea County
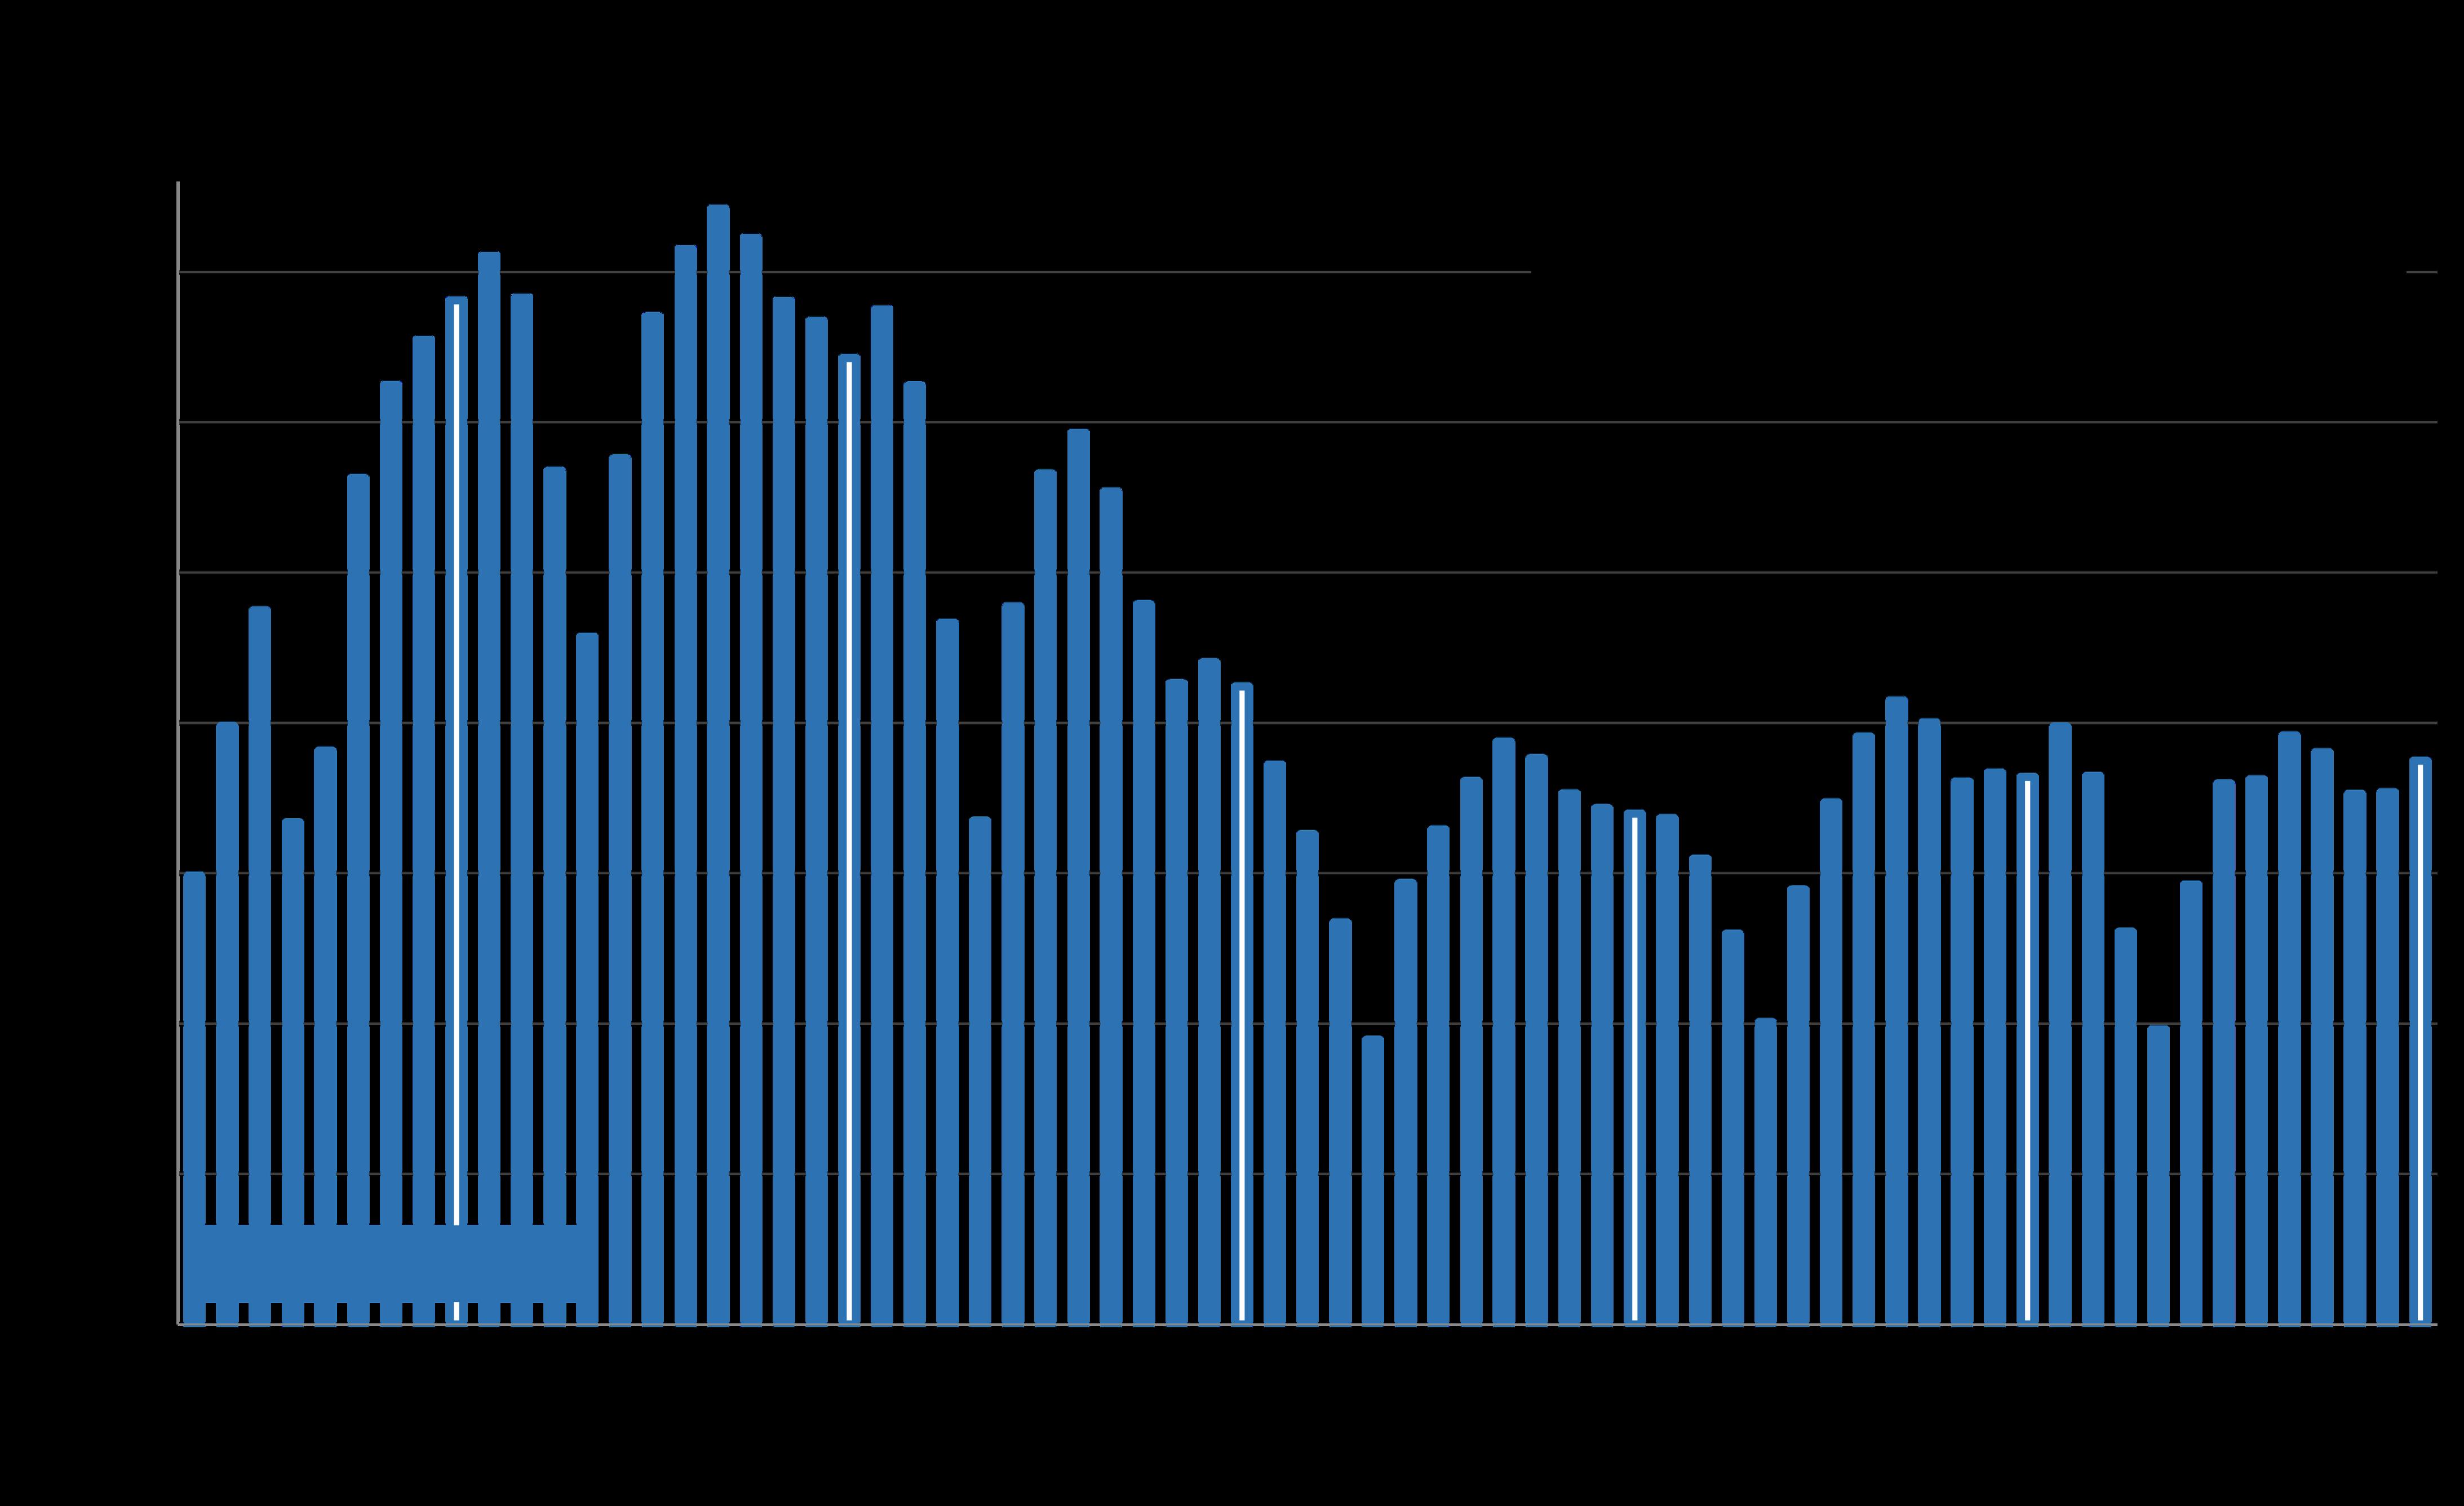
New Listings Coming on Market
BayAreaMarketDynamics&Seasonality since 2020*
Month of September highlighted: The number of new listings coming on market in September rebounded substantially from August, as is the typical seasonal dynamic, but declined about 2.5% year over year.* *7 Bay Area Counties in the San Francisco and San Jose Metro Areas, per Realtor.com Research, https://www.realtor.com/research/data/ - residential listings posted to site. Data from sources deemed reliable butmaycontainerrorsandsubjectto revision.Will notinclude coming-soon listings. All numbersapproximate.
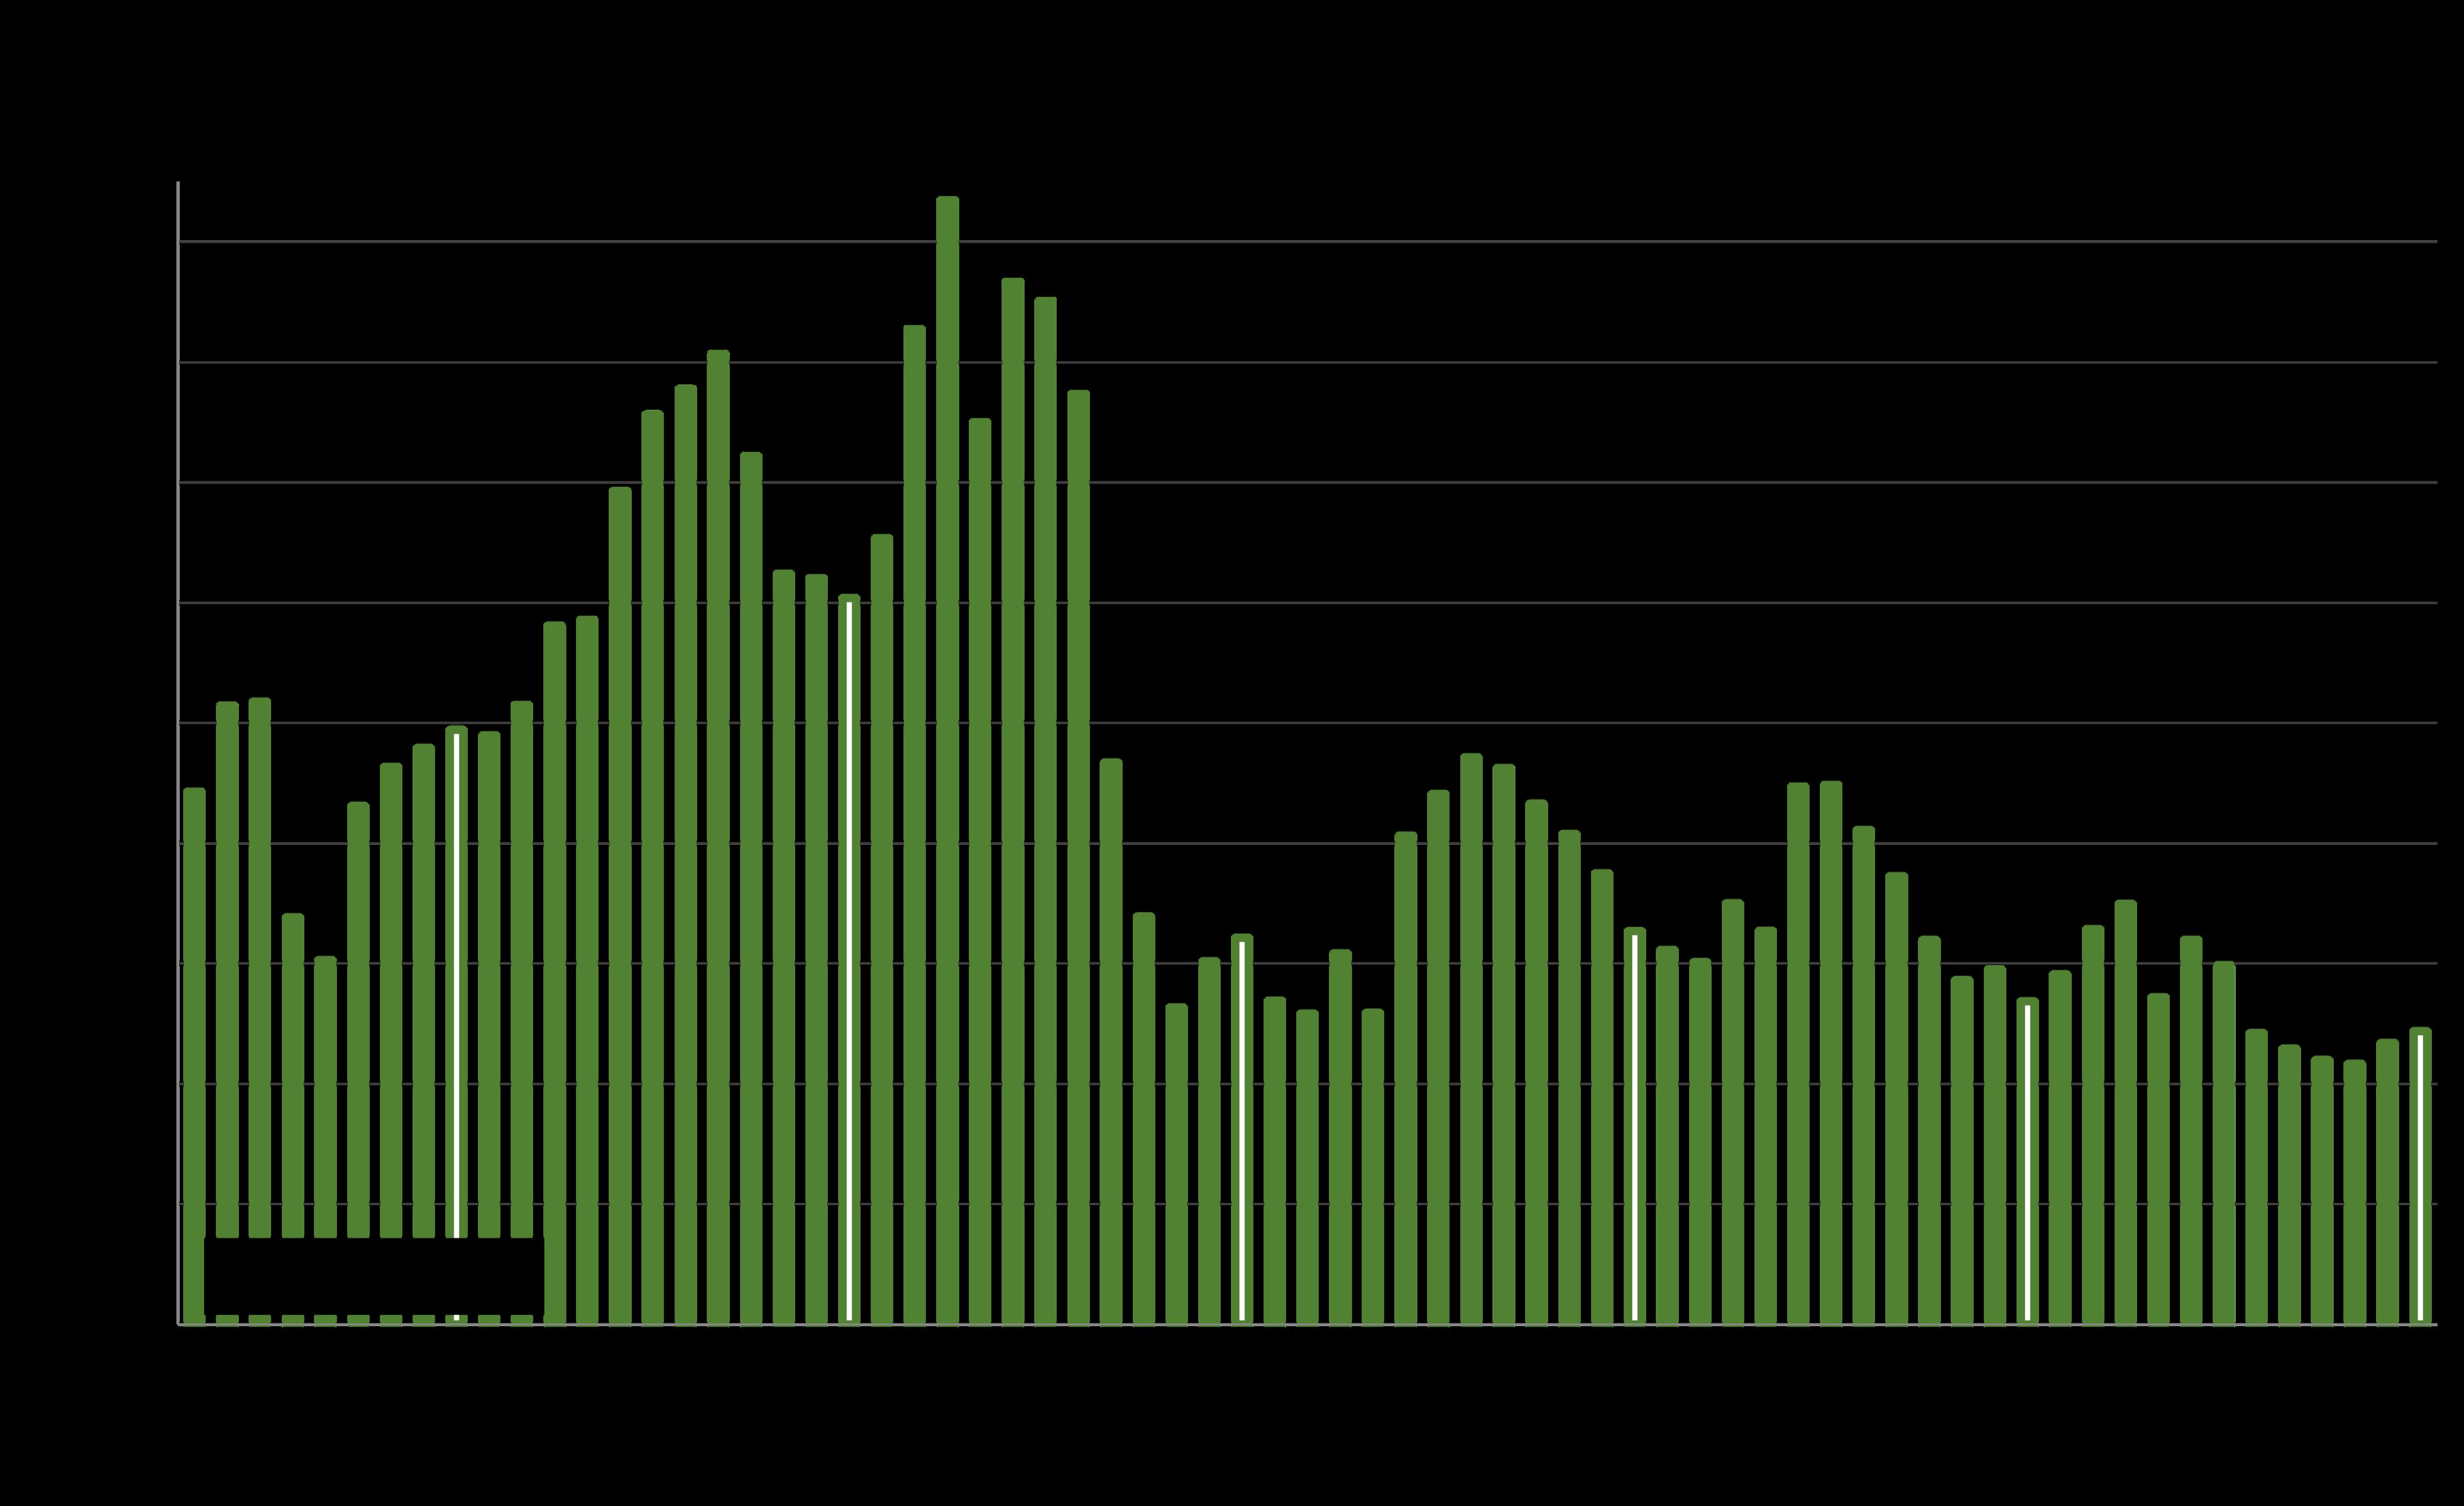
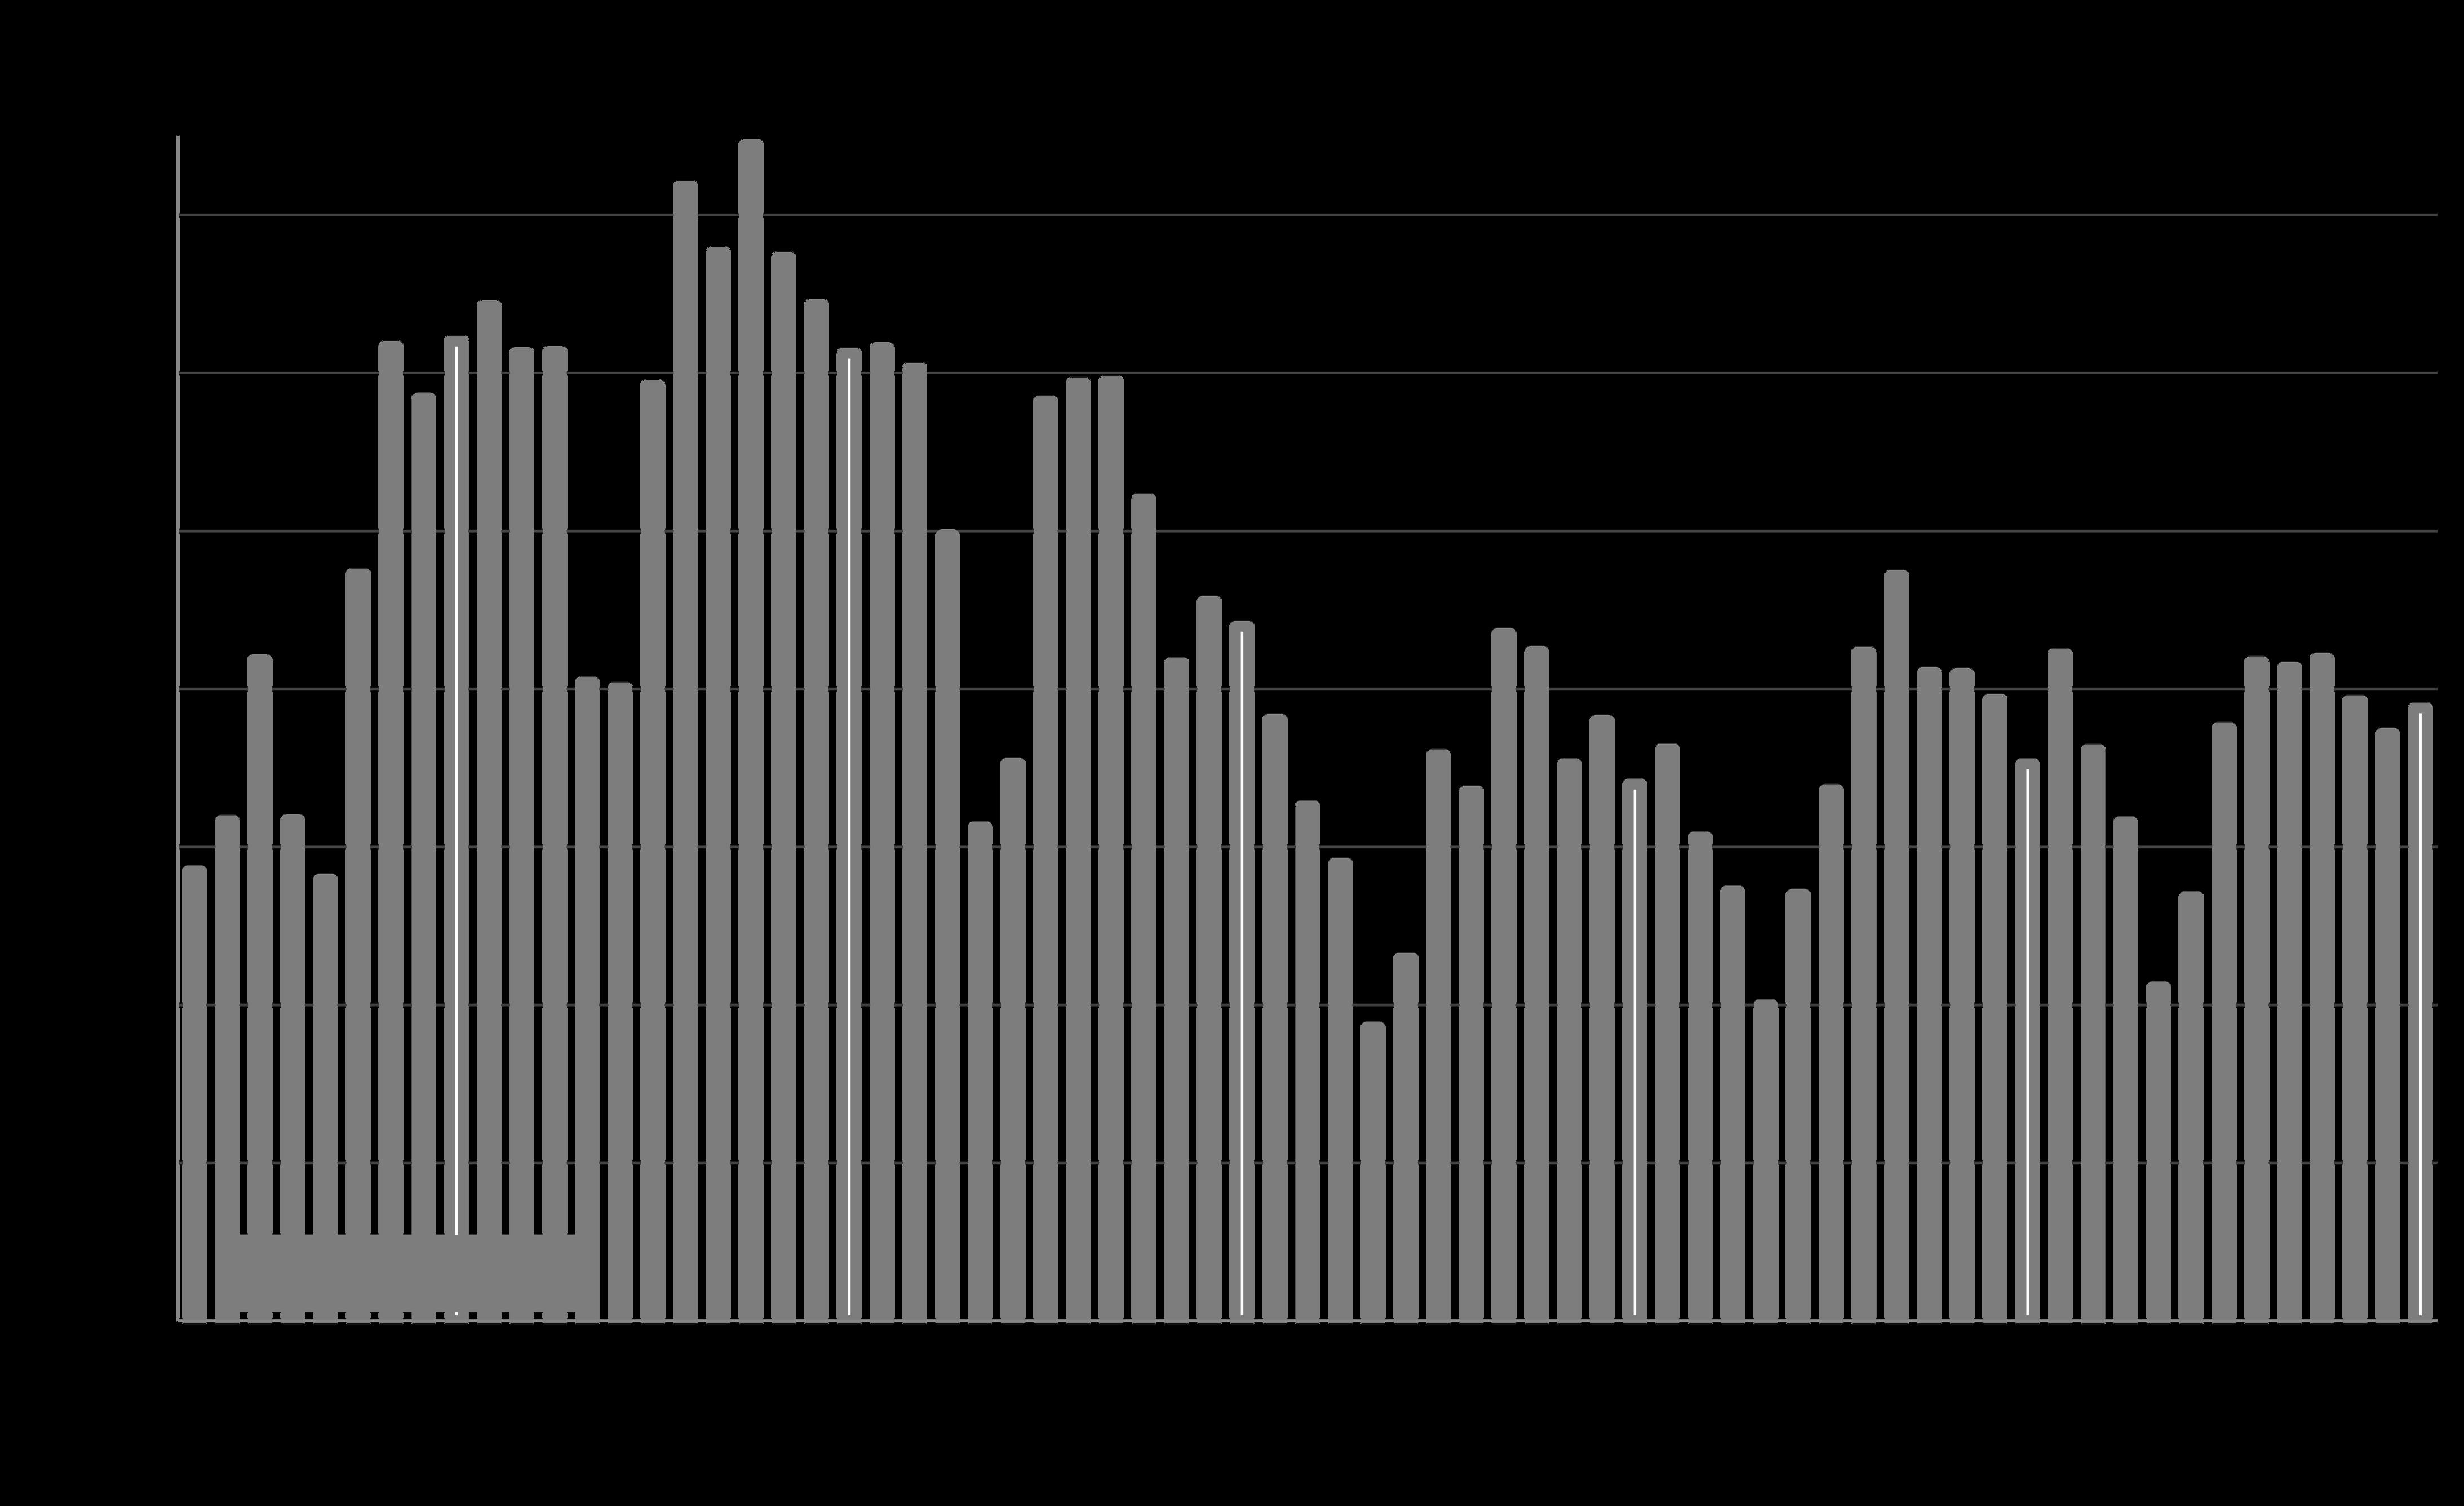
Active Listings on Market on Any Given Day
Thisisa snapshot measure of howmany activelistings canbe expected to be on market on any given day of the specified month.
Bay Area Market Dynamics & Seasonality since 2020* The number of active listings on any given day in September 2025 ticked up slightly from August, and rose 8% year over year. Monthly year-over-year percentage increases have significantly slowed from the much larger jumps earlier in 2025.*
The # of active listings on a given day is affected by 1) the # of new listings coming on market, 2) how quickly buyers snap them up, 3) the sustained heat of the market over time, and 4) sellers pulling their homes off the market without selling.
*7 Bay Area Counties in San Francisco and San Jose Metro Areas, per Realtor.com Research, https://www.realtor.com/research/data/ - residential listings posted to site. Data from sources deemed reliable but may contain errors and subject to revision. All numbers approximate.
Listings Pending Sale (in Contract)
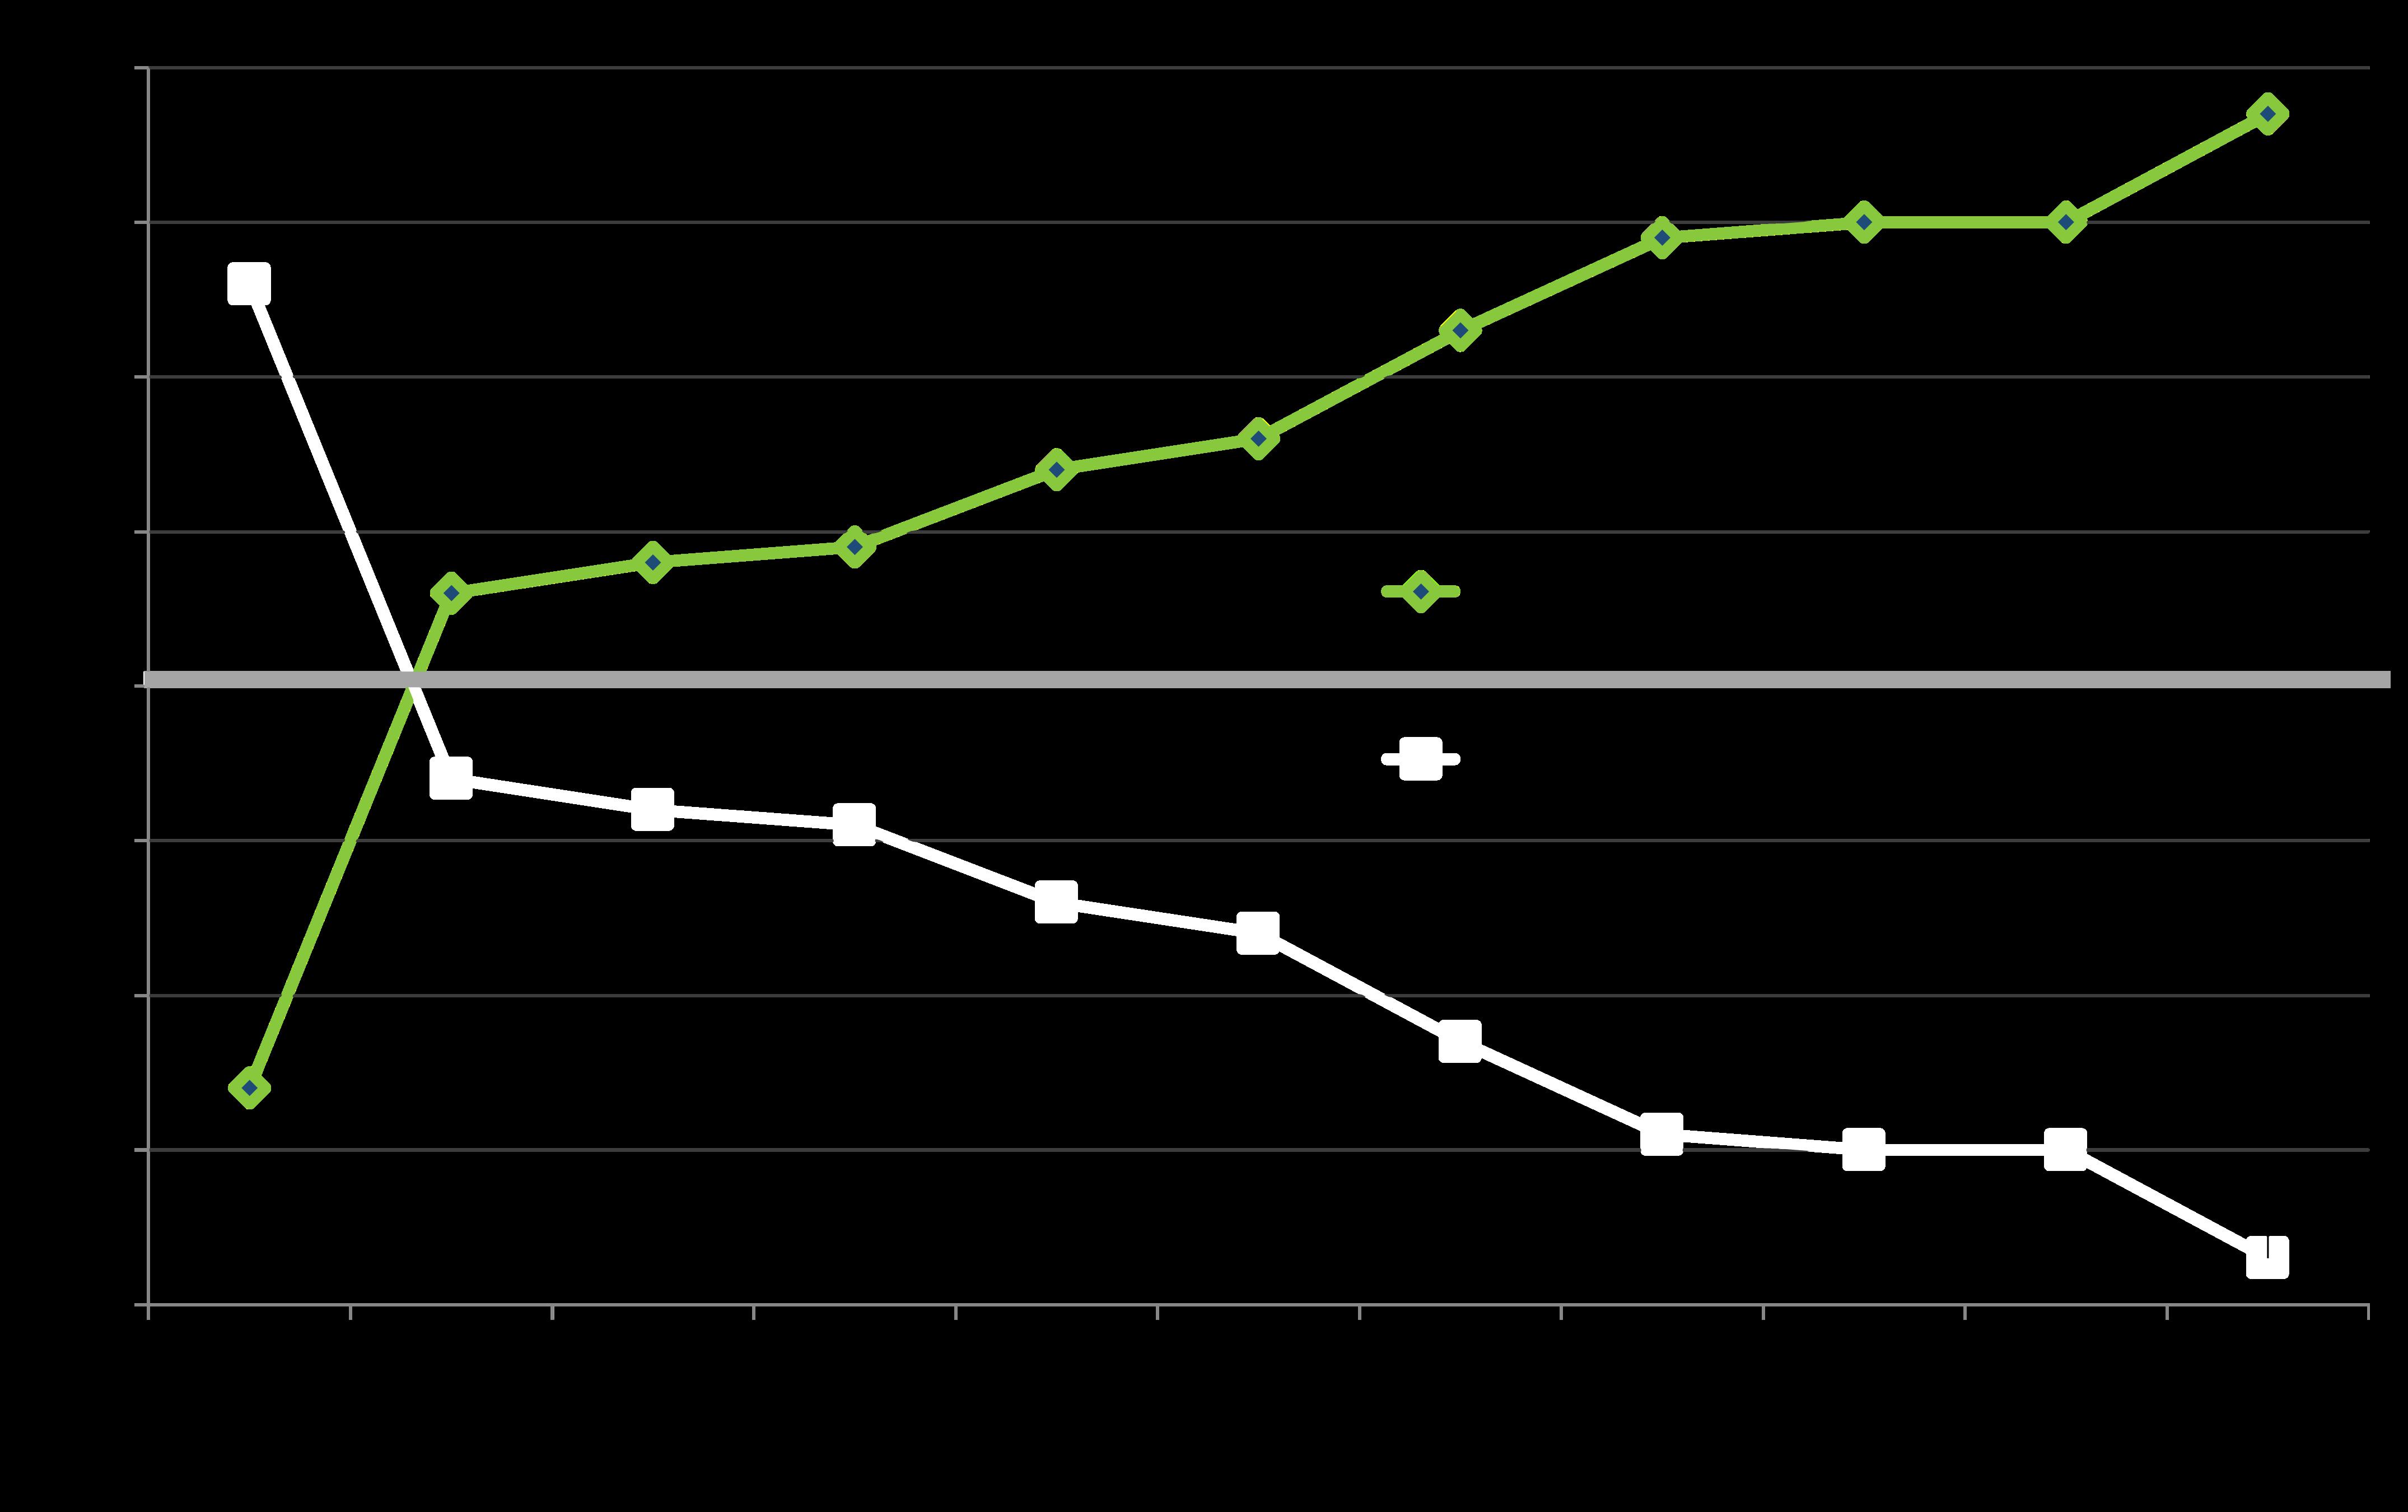
Pending-Sale Ratio: Demand vs. Supply
Bay Area Market Dynamics & Seasonality since 2020* This chart illustrates the ratio of the pending listing count to the active listing count during the specified month. It is a general measurement of demand vs. supply: Higher percentages reflect stronger buyer demand as compared to the supply of listings available to purchase.*
An AVERAGE of the 2 major Bay Area Metro-Area readings. Dec. 2021
The September 2025 pending sale ratio rose slightly from August, but dropped 5 percentage points year over year. The only Bay Area County with a year-over-year increase was San Francisco, whose pending ratio jumped 15 percentage points.
*7 Bay Area Counties in San Francisco and San Jose Metro Areas, average of the 2 metro area readings, per Realtor.com Research, https://www.realtor.com/research/data/ - residential listings posted to site. Data from sources deemed reliable but may contain errors and subject to revision. All numbers approximate.
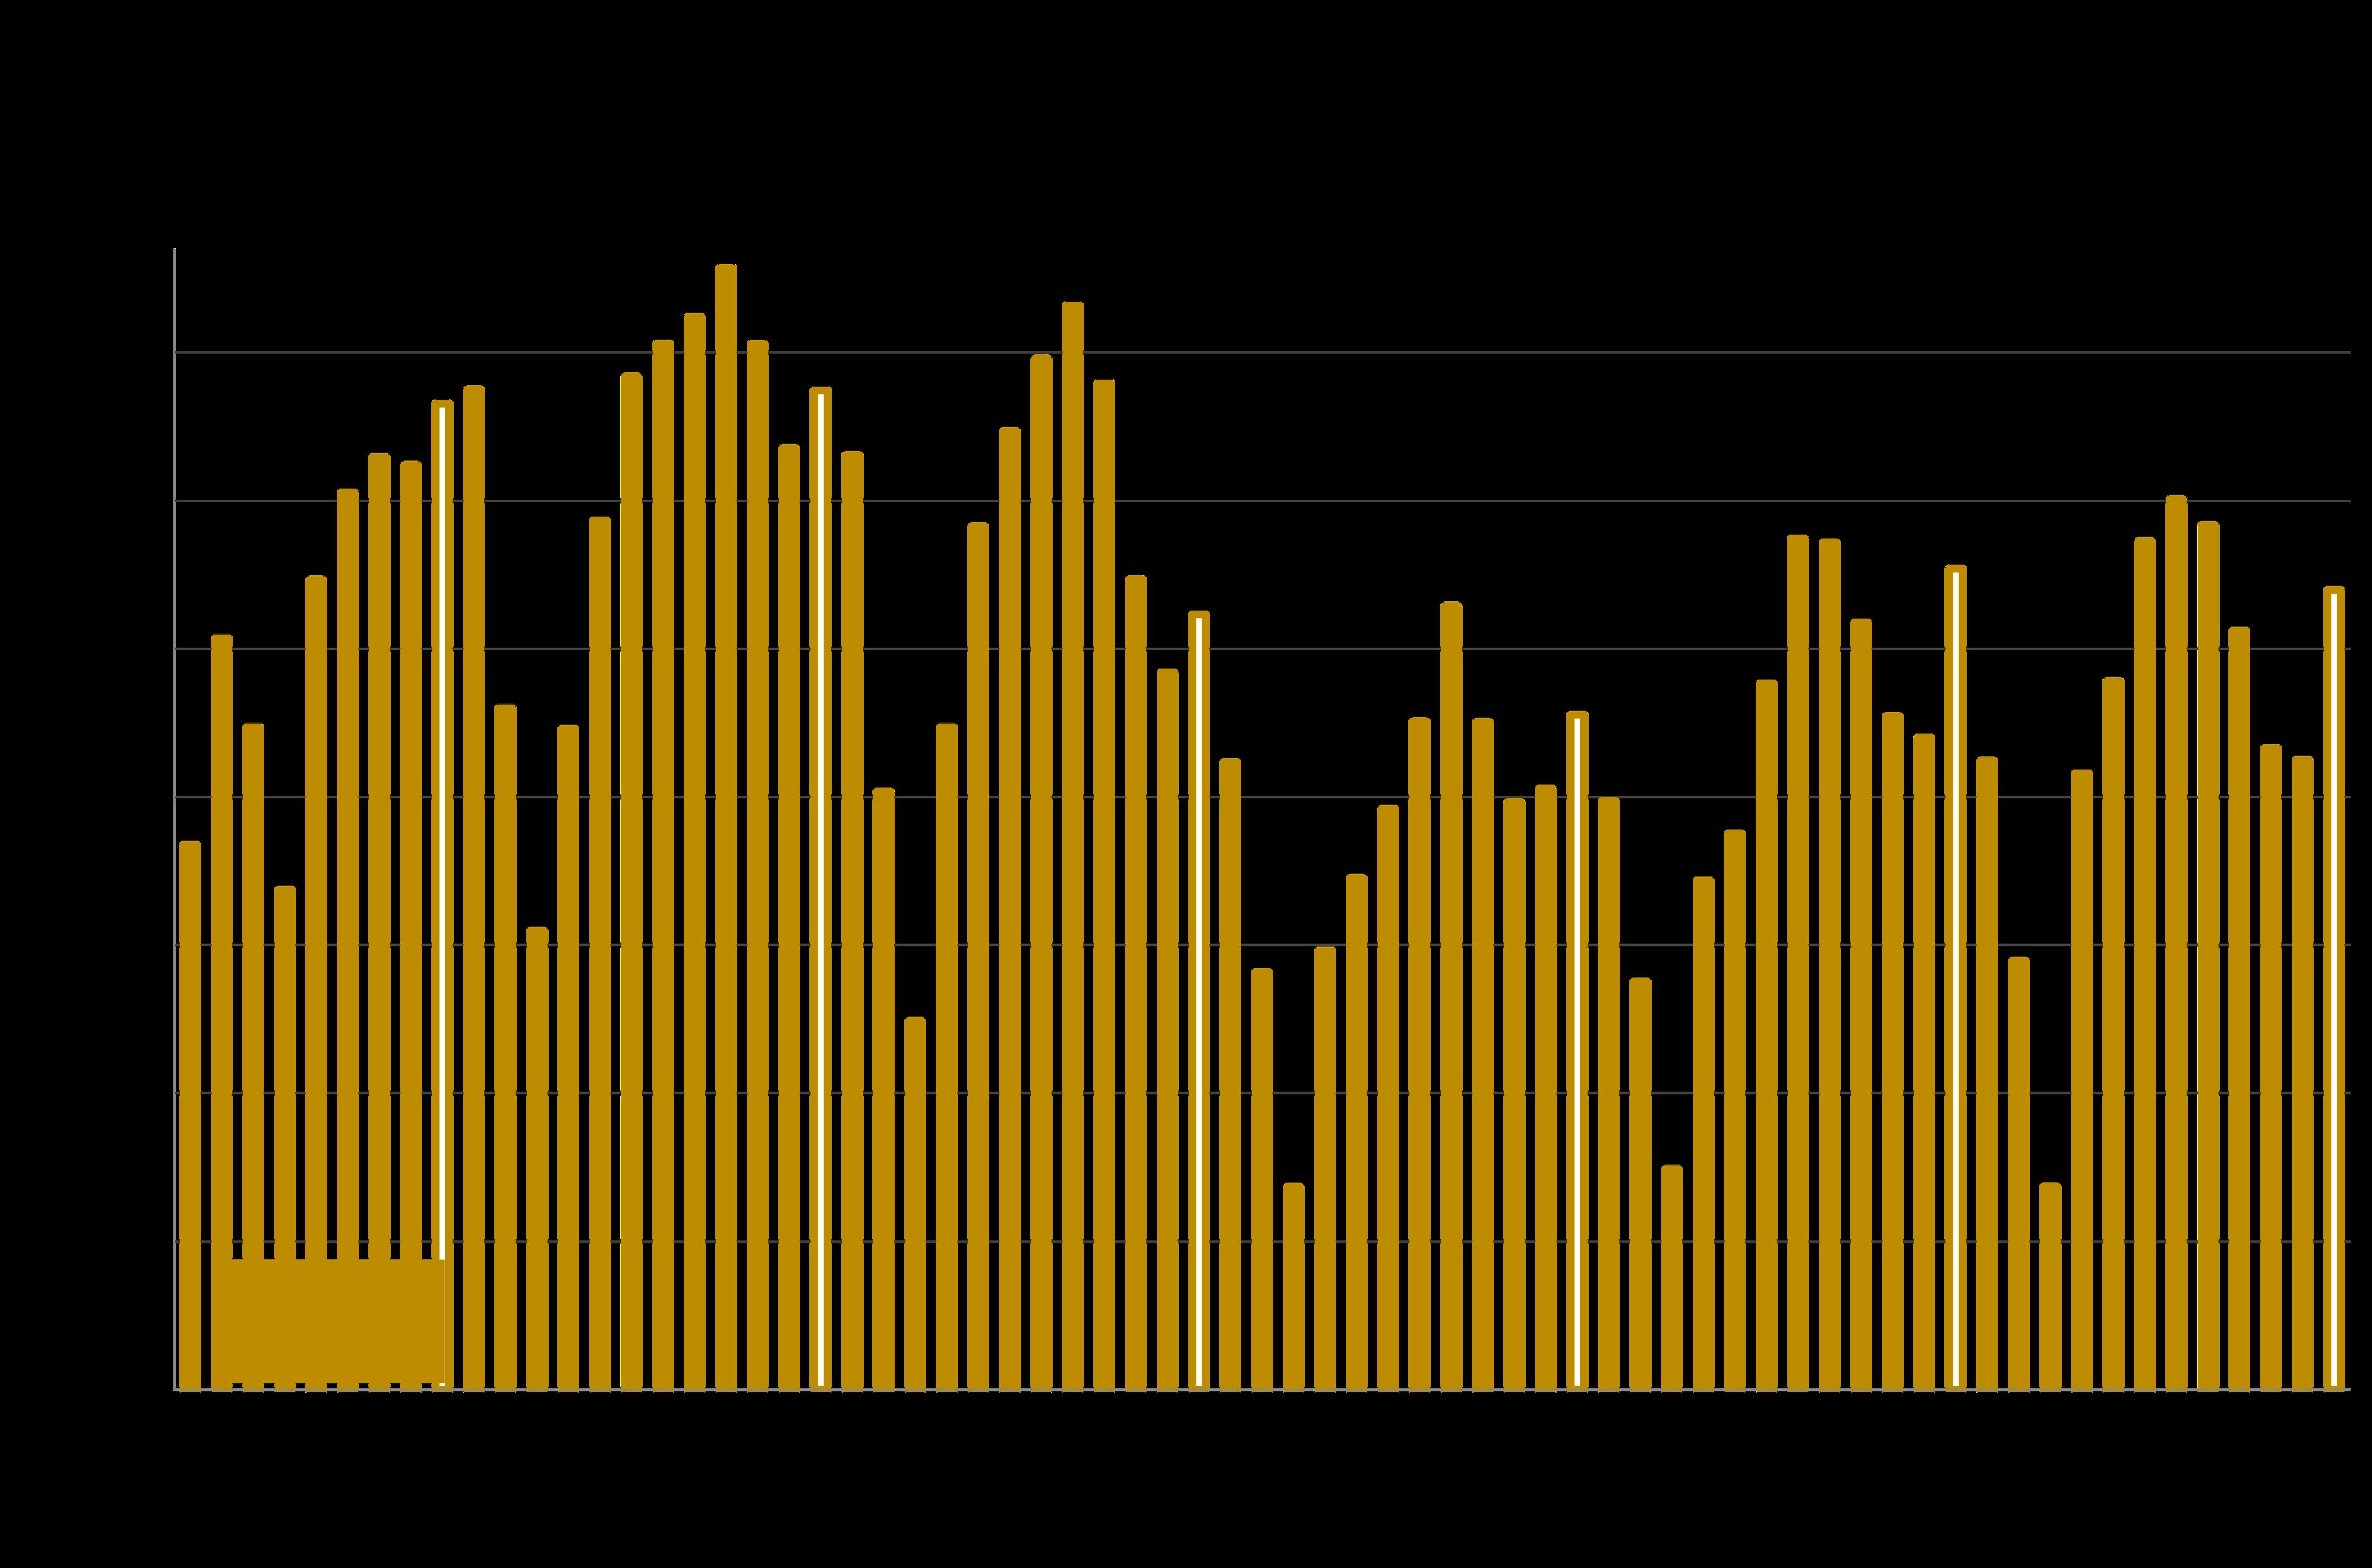
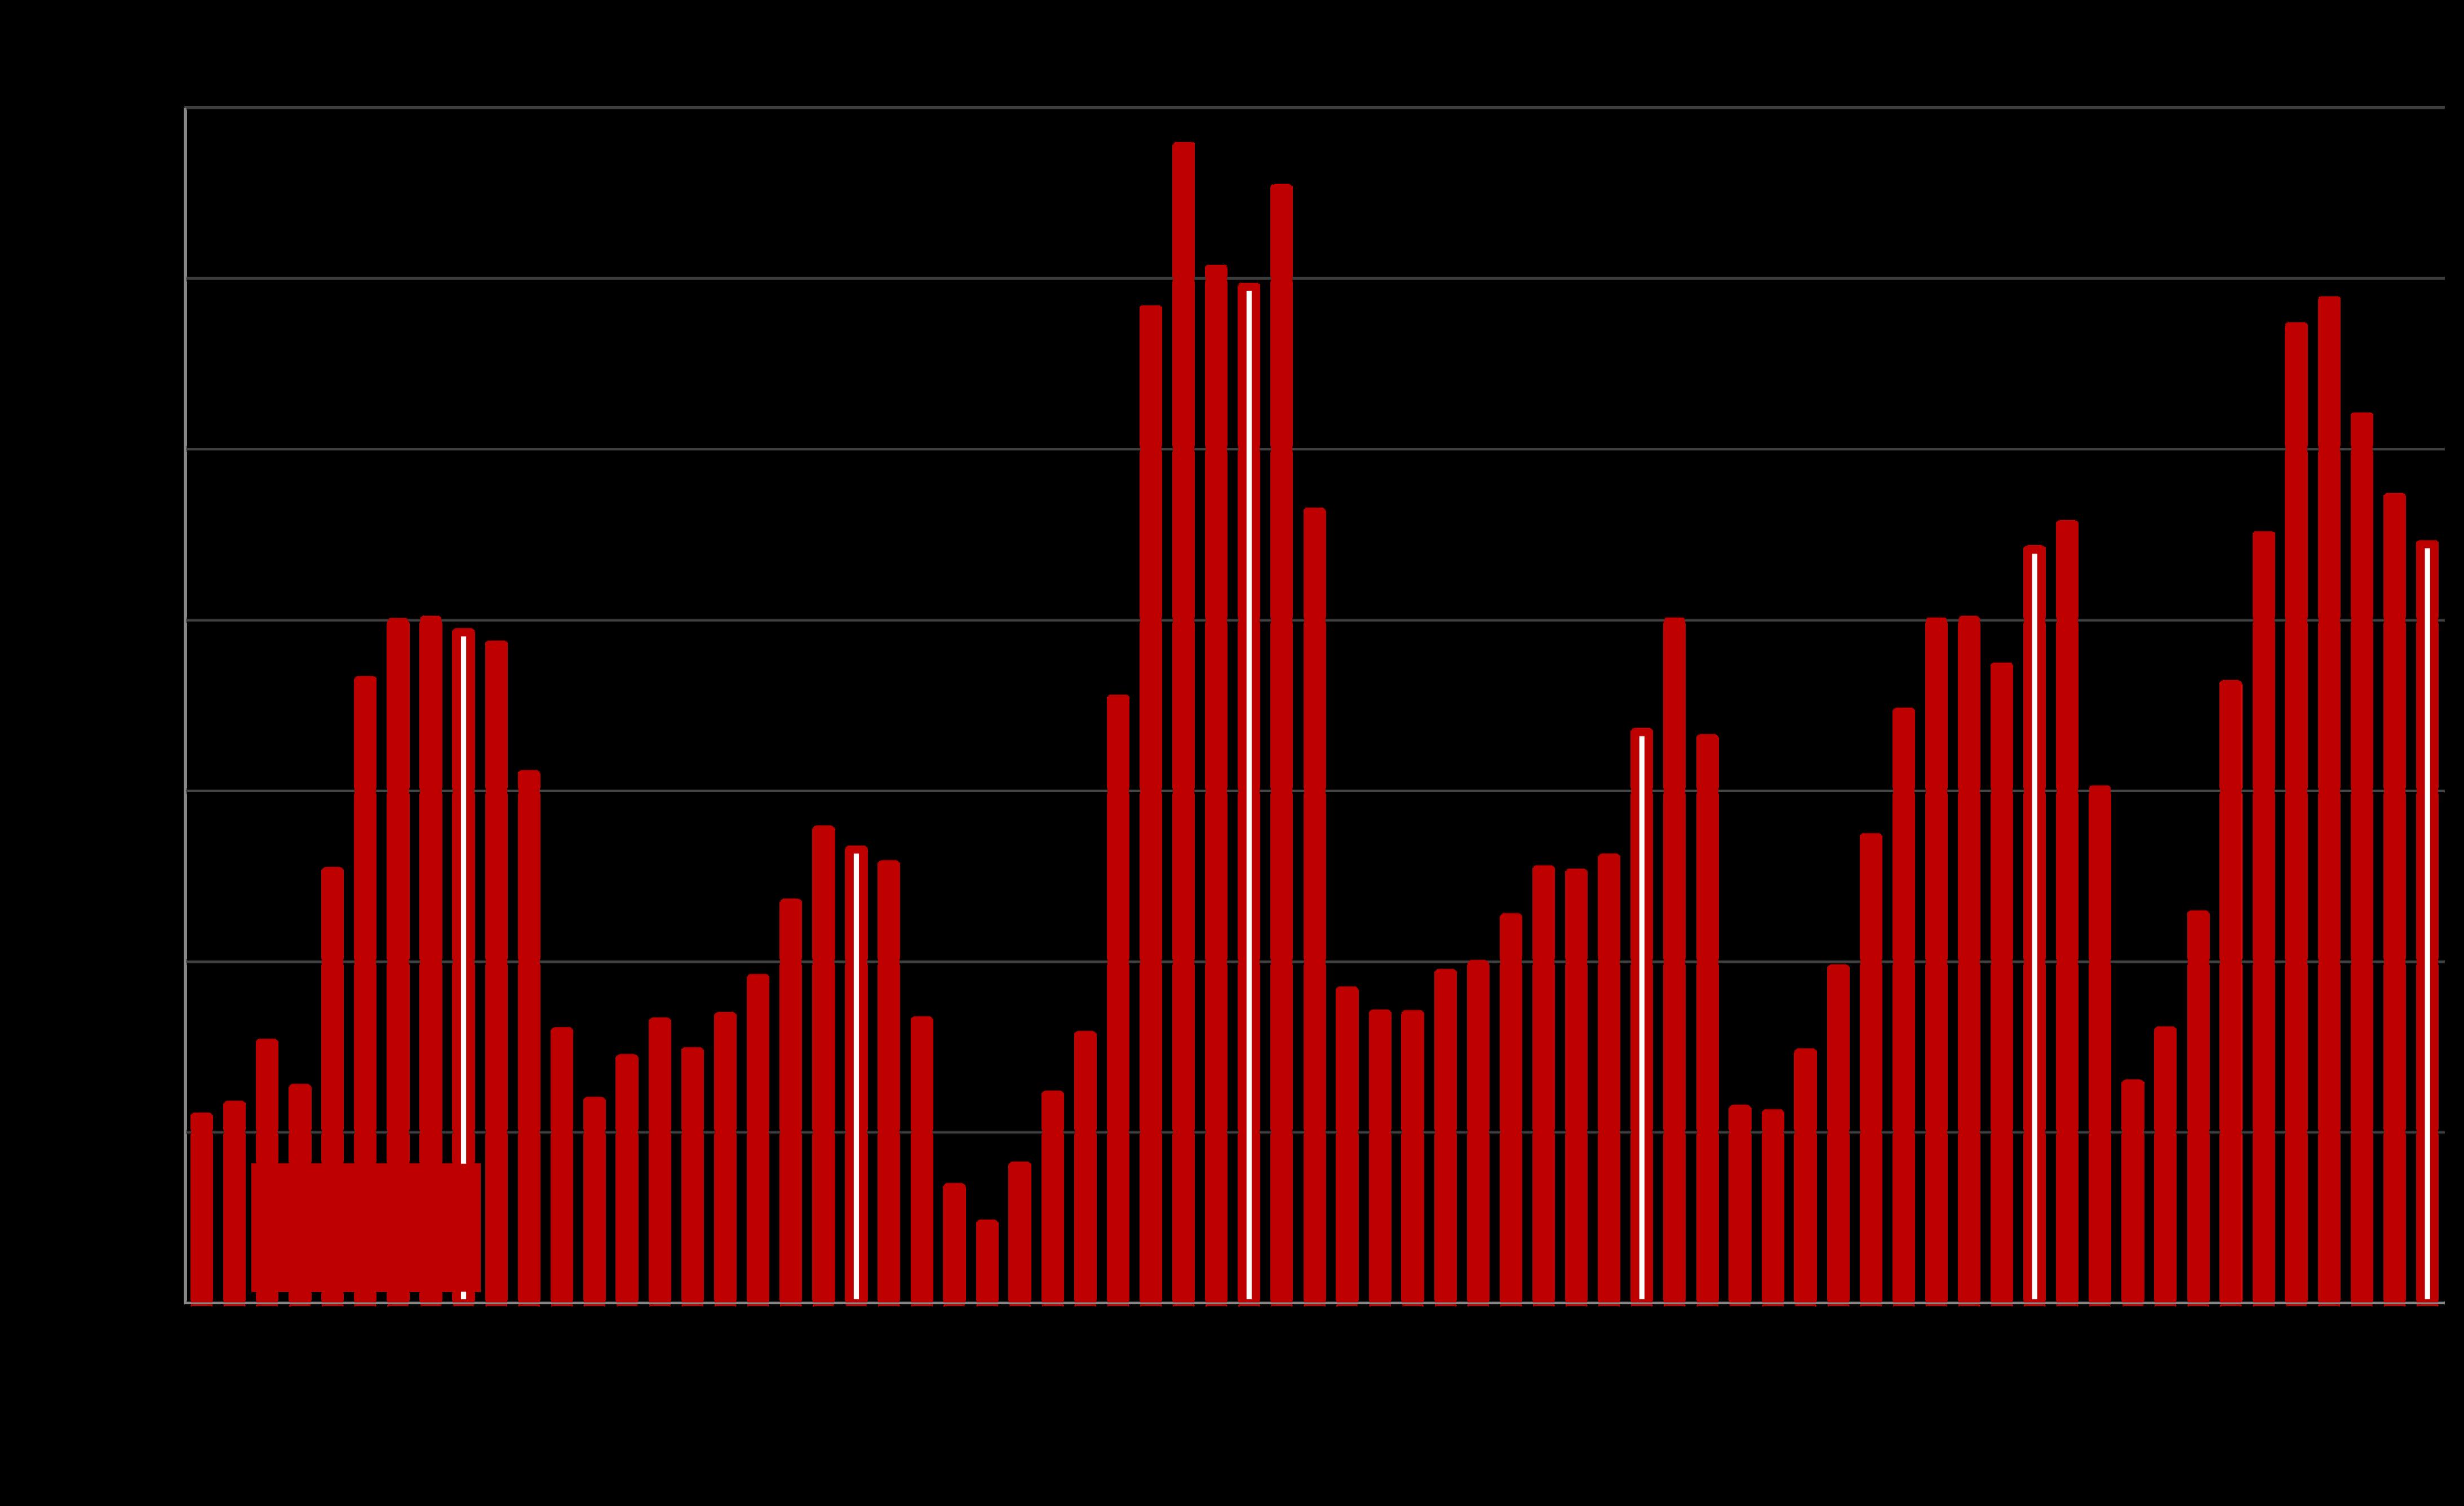
Price Reductions in Month
BayAreaMarketDynamics&Seasonality since 2020
The number of price reductions in September 2025 continued to drop from June, and – after months of very large year-over-year increases earlier in the year – was essentially unchanged from September 2024.
Number of Home Sales
BayAreaMarketDynamics&Seasonality since 2020*
Sales in one month mostly reflect accepted offers in the previous month.
The total number of home sales in the 7-county San Francisco and San Jose metro areas in September 2025 rose modestly from August and increased about 10% year over year.*
May
Statistics are generalities, essentially summaries of widely disparate data generated by dozens, hundreds or thousands of unique, individual sales occurring within different time periods. They are best seen not as precise measurements, but as broad, comparative indicators, with reasonable margins of error. Anomalous fluctuations in statistics are not uncommon, especially in smaller, expensive market segments. Last period data should be considered estimates that may change with late-reported data. Different analytics programs sometimes define statistics – such as “active listings,” “days on market,” and “months supply of inventory” – differently: what is most meaningful are not specific calculations but the trends they illustrate. Most listing and sales data derives from the local or regional multi-listing service (MLS) of the area specified in the analysis, but not all listings or sales are reported to MLS and these won’t be reflected in the data. “Homes” signifies real-property, single-household housing units: houses, condos, co-ops, townhouses, duets and TICs (but not mobile homes), as applicable to each market. City/town names refer specifically to the named cities and towns, unless otherwise delineated. Multi-county metro areas will be specified as such. Data from sources deemed reliable, but may contain errors and subject to revision. All numbers to be considered approximate.
Many aspects of value cannot be adequately reflected in median and average statistics: curb appeal, age, condition, amenities,
views, lot size, quality of outdoor space, “bonus” rooms, additional parking, quality of location within the neighborhood, and so on. How any of these statistics apply to any particular home is unknown without a specific comparative market analysis.
Median Sales Price is that price at which half the properties sold for more and half for less. It may be affected by seasonality, “unusual” events, or changes in inventory and buying trends, as well as by changes in fair market value. The median sales price for an area will often conceal an enormous variety of sales prices in the underlying individual sales.
Dollar per Square Foot is based upon the home’s interior living space and does not include garages, unfinished attics and basements, rooms built without permit, patios, decks or yards (though all those can add value to a home). These figures are usually derived from appraisals or tax records, but are sometimes unreliable (especially for older homes) or unreported altogether. The calculation can only be made on those home sales that reported square footage.
Photo use under the Creative Commons License: https://creativecommons.org/licenses/by-sa/2.0/
Compass is a real estate broker licensed by the State of California, DRE 01527235. Equal Housing Opportunity. This report has been prepared solely for information purposes. The information herein is based on or derived from information generally available to the public and/or from sources believed to be reliable. No representation or warranty can be given with respect to the accuracy or completeness of the information. Compass disclaims any and all liability relating to this report, including without limitation any express or implied representations or warranties for statements contained in, and omissions from, the report. Nothing contained herein is intended to be or should be read as any regulatory, legal, tax, accounting or other advice and Compass does not provide such advice. All opinions are subject to change without notice. Compass makes no representation regarding the accuracy of any statements regarding any references to the laws, statutes or regulations of any state are those of the author(s). Past performance is no guarantee of future results.