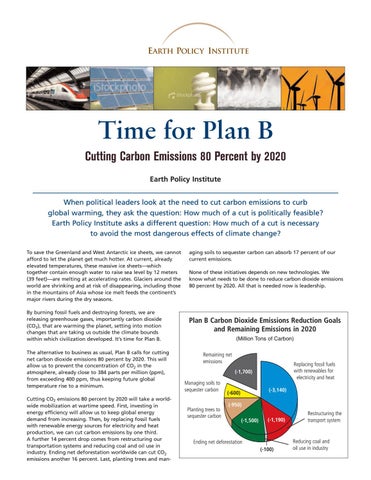
Time for Plan B Cutting Carbon Emissions 80 Percent by 2020 Earth Policy Institute When political leaders look at the need to cut carbon emissions to curb global warming, they ask the question: How much of a cut is politically feasible? Earth Policy Institute asks a different question: How much of a cut is necessary to avoid the most dangerous effects of climate change? To save the Greenland and West Antarctic ice sheets, we cannot afford to let the planet get much hotter. At current, already elevated temperatures, these massive ice sheets—which together contain enough water to raise sea level by 12 meters (39 feet)—are melting at accelerating rates. Glaciers around the world are shrinking and at risk of disappearing, including those in the mountains of Asia whose ice melt feeds the continent’s major rivers during the dry seasons. By burning fossil fuels and destroying forests, we are releasing greenhouse gases, importantly carbon dioxide (CO2), that are warming the planet, setting into motion changes that are taking us outside the climate bounds within which civilization developed. It’s time for Plan B. The alternative to business as usual, Plan B calls for cutting net carbon dioxide emissions 80 percent by 2020. This will allow us to prevent the concentration of CO2 in the atmosphere, already close to 384 parts per million (ppm), from exceeding 400 ppm, thus keeping future global temperature rise to a minimum. Cutting CO2 emissions 80 percent by 2020 will take a worldwide mobilization at wartime speed. First, investing in energy efficiency will allow us to keep global energy demand from increasing. Then, by replacing fossil fuels with renewable energy sources for electricity and heat production, we can cut carbon emissions by one third. A further 14 percent drop comes from restructuring our transportation systems and reducing coal and oil use in industry. Ending net deforestation worldwide can cut CO2 emissions another 16 percent. Last, planting trees and man-
aging soils to sequester carbon can absorb 17 percent of our current emissions. None of these initiatives depends on new technologies. We know what needs to be done to reduce carbon dioxide emissions 80 percent by 2020. All that is needed now is leadership.
Plan B Carbon Dioxide Emissions Reduction Goals and Remaining Emissions in 2020 (Million Tons of Carbon) Remaining net emissions
Replacing fossil fuels with renewables for electricity and heat
(-1,700)
Managing soils to sequester carbon
Planting trees to sequester carbon
(-3,140)
(-600) (-950) (-1,500)
(-1,190)
Ending net deforestation (-100)
Restructuring the transport system
Reducing coal and oil use in industry
2
Time for Plan B
Efficiency and Conservation Saving Energy Saves Money Projections from the International Energy Agency show global energy demand growing by close to 30 percent by 2020. But dramatically ramping up energy efficiency would allow the world to not only avoid growth in energy demand but actually reduce global demand to below 2006 levels by 2020.
■ Improving energy efficiency is a win-win situation, reducing energy
consumption while saving money. Taking such simple measures as switching to compact fluorescent lighting, unplugging electronics when not in use to reduce standby power consumption, using a programmable thermostat to moderate heating or air conditioning when you are asleep or away, properly insulating your home, and replacing an older refrigerator with an ENERGY STAR model could save the average U.S. homeowner up to $300 on energy bills every year.
We can reduce the amount of energy we use by preventing the waste of heat and electricity in buildings and industrial processes and by switching to efficient lighting and appliances. We can also save an enormous amount of energy by restructuring the transportation sector. Many of the needed energy efficiency measures can be enacted relatively quickly and pay for themselves.
Buildings A large share of global electricity consumption and raw materials use is in the buildings sector. In the United States, buildings use 70 percent of electricity and account for close to 40 percent of total CO2 emissions. Retrofitting existing buildings with better insulation and more-efficient
appliances can cut energy use by 20 to 50 percent. A U.S.-based group of forward-thinking architects and engineers have set forth the Architecture 2030 Challenge with the goal of reducing fossil fuel use in new buildings 80 percent by 2020, on the way to going entirely carbon-neutral by 2030.
Ban the Bulb
Lighting Much of the energy we use for lighting today is wasted as heat rather than used for illumination, so switching to more-efficient lighting can have a quick payback. Swapping out conventional light bulbs for energyefficient compact fluorescent lamps (CFLs), for example, can cut energy use by 75 percent, saving money on electric bills. And CFLs last several times as long. The energy saved by replacing one conventional incandescent 100 watt bulb with a CFL over its lifetime is enough to drive a Toyota Prius hybrid from New York to San Francisco. If everyone around the world made the switch and turned to high-efficiency home, office, industrial, and traffic lighting, total world electricity use would fall by 12 percent, equivalent to the output of 705 coal-fired power plants.
■
A movement to phase out incandescent light bulbs in favor of more-efficient lighting is sweeping the globe. Some countries that have announced target phase-out years for the inefficient bulbs include: Ireland Australia, Argentina, Philippines United Kingdom Canada, Taiwan United States China
2009 2010 2011 2012 2014 2017
Appliances Similar efficiency gains can be realized with household appliances. Take refrigerators, for instance. The average refrigerator in Europe uses about half the electricity of one in the United States. Beyond that, the most efficient refrigerators on the market use one fourth as much electricity as the European average. Japan’s Top Runner Program takes the most efficient appliances on the market today and uses them to set the efficiency standards for tomorrow. Between 1997–98 and 2004–05, this program helped Japan to boost the efficiency of refrigerators
by 55 percent, air conditioners by close to 68 percent, and computers by 99 percent. This sort of program, which continuously encourages technology advancements, can serve as a model for the rest of the world. Even the electricity drawn by appliances in “standby” mode, when they are not actively turned on, currently adds up to as much as 10 percent of total electricity consumption. Industry standards like South Korea’s 1-watt standby limit for many appliances that will go into effect by 2010 push manufacturers toward energy-efficient design. Consumers can eliminate unnecessary electricity drain by unplugging electronics when not in use or by using improved “smart” power strips that can stop electricity flow to appliances not in use.
Time for Plan B
3
Industry Within the industrial sector, retooling the manufacture of the carbon emission heavyweights—chemicals and petrochemicals (including plastics, fertilizers, and detergents), steel, and cement—offers major opportunities to curb energy demand. Recycling plastics and producing them more efficiently could cut petrochemical energy use by close to one third. More than 1 billion tons of steel are produced each year to be used in automobiles, household appliances, construction, and other
products. Adopting the most-efficient blast furnaces and boosting recycling can cut energy use in this industry by close to 40 percent. For cement, the biggest gains can come from China, which produces close to half of the world’s 2.3 billion ton output—more than the next 20 countries combined. Just shifting to the most efficient dry kiln technologies, as used in Japan, could cut global energy use in the cement sector by more than 40 percent.
Plugging in to Drive with the Wind
Transportation Well-designed transportation systems provide mobility for all. The car-dominated systems that at first offered mobility now more frequently yield congestion and pollution. Restructuring urban transportation systems around rail, light rail, and bus rapid transit (with designated lanes for buses), while making safety and accessibility for pedestrians and bicyclists a priority, not only deals with the problems created by the “car-is-king” mentality, it also saves energy.
■
Much of the energy savings in the transport sector come from electrifying rail systems and short-distance road travel, while turning away from petroleum products and toward renewable sources of energy. Mass transit is a priority. Intercity high-speed rail lines, as seen in Japan and Europe, can move people quickly and energy-efficiently, reducing car and air travel. For individual vehicles, improved fuel economy is key. Plug-in hybrid electric vehicles that run primarily on batteries charged with emissions-free electricity generated by the wind and the sun would allow for low-carbon short-distance car trips.
With peak oil on our doorstep and the reality of escalating gasoline prices, the market is ripe for plug-in hybrid electric vehicles (PHEVs). These cars enable drivers to do most commuting, grocery shopping, and other short-distance travel solely with electricity, but they have a backup fuel tank for longer trips. Among the companies planning to come to market with a PHEV in the next several years are Toyota, General Motors, Ford, and Nissan. Combining a shift to PHEVs with the widespread construction of wind farms to supply the electricity they need would greatly reduce oil consumption and carbon emissions and allow drivers to recharge batteries with renewable electricity at a cost equivalent of less than $1 per gallon of gasoline.
Firing the Internal Combustion Engine ■
The internal combustion engine that dominates transportation today is an incredibly inefficient nineteenth-century technology. Only 20 percent or so of the energy in gasoline and diesel is used to move the vehicle. The remaining 80 percent is wasted as heat. In vehicles powered by electric motors, 65 percent of the energy stored in the battery is used to move the vehicle. Thus, simply switching from internal combustion engines to electric motors would sharply reduce energy demand.
Plan B Efficiency Measures Used to Offset IEA Projected Growth in Energy Demand to 2020 Percent Change in Demand from 2006 100
IEA-Projected Energy Consumption Growth 80
Improving Building Insulation (-6%) Improving Appliance Efficiency (-15%)
60
Food for Thought ■
They say you are what you eat, but people rarely consider the climate impacts of their daily bread. For Americans whose diets are heavy in red meat, for instance, moving down the food chain to a plant-based diet can cut as much greenhouse gas emissions as shifting from driving a Chevrolet Suburban SUV to a Toyota Prius. And the neartripling in the number of local farmers’ markets across the United States since the early 1990s indicates that Americans are gravitating toward local food, which
Improving Industrial Efficiency (-15%)
40
20
0 2006
Transportation Restructruing (-59%) EPI Projected Growth
2020
4
Time for Plan B
Renewable Energy While capitalizing on energy efficiency measures allows us to offset the projected increase in energy demand, switching to renewable sources of energy puts us on the path to slashing net carbon dioxide emissions 80 percent by 2020. The first priority is to replace all coal- and oil-fired electricity generation with renewable energy sources. Just as the nineteenth century belonged to coal and the twentieth century to oil, the twenty-first century will belong to the sun, the wind, and energy from within the earth.
will become clear over the next 10 years that coal-fired power plants that do not capture and sequester CO2 are going to have to be bulldozed.”
■ “It
Dr. James Hansen Director, NASA Goddard Institute for Space Studies
Phasing Out Coal ■
Growing grassroots opposition to coal-fired power plants in the United States may be an early tipping point in the effort to stabilize climate. In early 2007, a total of 151 coal-fired power plants were in the planning stages, but by the end of the year 59 proposed plants were either refused licenses by state governments or quietly abandoned. Of the remaining plants, close to 50 are being contested in the courts and the remainder will likely be challenged when they reach the permitting stage. What began as a few local ripples of resistance to coal has quickly evolved into a national tidal wave of opposition from environmental, health, farm, and
community organizations, as well as leading climate scientists and state governments. Wall Street investment banks Merrill Lynch, Citi, Morgan Stanley, and J.P. Morgan Chase have recently downgraded coal stocks or have made future lending to coal utilities contingent on demonstrating that the plants would be economically viable with a future cost on carbon emissions. Even without a legislative mandate prohibiting the construction of new coal-fired power plants, this contraction in popular and financial support is leading toward a de facto moratorium.
Texas Turning To the Wind
Wind Wind is the centerpiece of the Plan B energy economy. Wind is abundant, widely distributed, clean, climate-neutral, inexpensive, and inexhaustible. Oil wells run dry and coal seams run out, but the wind keeps on blowing. World wind electricity generating capacity has expanded from 17,000 megawatts in 2000 to over 100,000 megawatts in 2008. At the country level, Germany has installed the most wind power, with 22,000 megawatts supplying 7 percent of its electricity. Next come the United States, Spain, India, China, and Denmark. Denmark leads the world in the national share of electricity from wind, now at 20 percent. Its goal is to push that to 50 percent, with most of the additional power coming from offshore wind farms. For the United States, a 1991 inventory by the U.S. Department of Energy estimated that North Dakota, Kansas, and Texas
Megawatts
■ Texas,
together had enough harnessable wind energy to satisfy national electricity needs. Using today’s wind turbines, which are twice as tall and convert wind into electricity more efficiently than those at the time of the survey, the wind resources from these three states would enable us to meet not only national electricity needs, but national energy needs. Add to that the U.S. offshore wind energy potential, which alone equals some 70 percent of national electricity use, and wind’s promise is
the state that has long led the United States in crude oil production, is now the leader in producing electricity from the wind. In 2006, Governor Rick Perry announced a public-private collaboration between the Texas Public Utility Commission and wind farm developers and transmission line builders to link wind-rich west Texas to the state’s population centers. The initiative could lead to the development of 23,000 megawatts of wind generating capacity, enough to satisfy the residential needs of more than half the state’s 24 million residents.
clear.
100,000 90,000 80,000
World Cumulative Installed Wind Power Capacity, 1980–2007
Plan B involves a crash program to develop 3 million megawatts of wind power capacity by 2020. To get there we need 1.5 million turbines of 2 megawatts each over the next 12 years. This sounds like a large number until it is compared with the 65 million cars the world produces each year. In fact, wind turbines could be mass-produced in the United States on idled automotive assembly lines, reinvigorating manufacturing capacity and creating jobs.
70,000 60,000 50,000 40,000 30,000
At $3 million per installed turbine, this would involve investing $4.5 trillion over the next dozen years, or $375 billion per year. This compares with world oil and gas capital expenditures that are projected to reach $1 trillion per year by 2016.
20,000 10,000
Source: GWEC; Worldwatch
0
1980
1985
1990
1995
2000
2005
2010
Time for Plan B
5
Solar We can harness the sun’s energy for both heat and electricity generation. One Plan B goal is to multiply the number of rooftop solar electric systems so that cumulative installed capacity in 2020 exceeds 1 million megawatts. Solar electric power plants and solar thermal power plants could add another 300,000 megawatts to that tally. Production of solar cells that directly convert sunlight into electricity is doubling every two years. Worldwide, cumulative production now tops 12,400 megawatts. While many of the initial installations were off the electrical grid, utilities are now beginning to capitalize on the enormous otherwise-unused area of rooftops as a ready source for distributed power generation.
government aims to more than double the current 124 million square meters of rooftop solar water heaters to 300 million square meters by 2020. The European Solar Thermal Industry Federation’s goal is even higher: by 2020 they are calling for 500 million square meters of solar water and space heaters, or one square meter for every European. (Israel now leads the world on a per person basis, at 0.74 square meters.) Achieving China’s and Europe’s goals, while ramping up installations in the United States, Japan, and the rest of the world, would capture enough solar energy to equal the output of 690 coal-fired power plants.
Concentrated solar power projects, which capture heat from sunlight to generate steam that drives a turbine, show that producing electricity from the sun on a large scale can be profitable. Algeria, now a leading oil exporter, has plans to develop 6,000 megawatts of solar thermal electric generating capacity to export to Europe via undersea cable. A project on that scale could meet the household electricity demand of a country the size of Portugal.
14,000
Solar rooftop water and space heaters will also play a major role in cutting CO2 emissions in the Plan B economy, with a 2020 installation goal of more than 1 million thermal megawatts. In China, some 40 million rooftop solar water heaters have been installed in recent years, both in cities and in villages, for as little as $200 each. The energy they harness is equal to the output of 54 coal-fired power plants. The Chinese
4,000
Megawatts
12,000
World Cumulative Photovoltaic Production, 1975–2007
10,000 8,000 6,000
2,000
Source: Worldwatch; Prometheus Institute, REN21
0 1975
Geothermal It is widely known within the energy community that there is enough solar energy reaching the earth each hour to power the world economy for one year, but few people know that the heat in the upper six miles of the earth’s crust contains 50,000 times as much energy as found in all the world’s oil and gas reserves combined. The potential of geothermal energy to provide electricity, to heat homes and greenhouses, and to supply process heat for industry is vast. Yet despite this abundance, only 9,300 megawatts of geothermal generating capacity have been harnessed worldwide. Iceland currently heats close to 90 percent of its homes with energy from the earth. In the Philippines, 25 percent of electricity comes from geothermal power plants. In El Salvador the figure is 22 percent. Other countries rich in geothermal energy are those bordering the Pacific in the so-called Ring of Fire, including Chile, Peru, Mexico, the United States, Canada, Russia, China, Japan, Indonesia, and Australia, as well as the countries along the Great Rift Valley of Africa and those around the Eastern Mediterranean. A 2006 interdisciplinary Massachusetts Institute of Technology study found that for the United States, an investment of $1 billion in geothermal research and development—roughly the cost of one coal-fired power plant—could yield 100,000 megawatts of electricity generating capacity from enhanced geothermal systems by 2050, the equivalent of 250 coalfired power plants. The Plan B goals for the world involve increasing geothermal heat capture by a factor of five and geothermal electricity production 22-fold, allowing us to shut down even more coal-fired power plants around the globe.
1980
1985
1990
1995
2000
2005
2010
Share of World Electricity Generation by Energy Source in 2006 and the Plan B Economy of 2020 (Share of Energy Generation))
100
Percent 3.4%
Non-hydro Renewables
15.8% Hydropower 80
5.8% 6.5%
Biomass Geothermal
11.4%
Solar
15% Nuclear Wind 60
40
19.7%
Gas
6.2%
Oil
38.8%
21.5% Hydropower 20
39.9%
Coal 11.5% Nuclear 4.6%
0 2006
2020
Gas
6
Time for Plan B
Completing the Energy Picture “Smart” Meters In addition to wind, solar, and geothermal sources of energy, gains in biomass energy and low-carbon hydropower, including tidal and wave energy, round out the Plan B energy portfolio. We project that the 850 gigawatts (850,000 megawatts) of hydroelectric power in operation worldwide in 2006 will expand to 1,350 gigawatts by 2020. The additional capacity from large dams already being built in China and the scattering of large dams still being built in countries like Brazil and Turkey will be augmented by a large number of small hydro facilities, a fast-growing number of tidal projects (some of them in the multi-gigawatt range), and numerous smaller wave power projects. If the interest in tidal and wave power continues to escalate, the additional capacity from hydro, tidal, and wave power by 2020 could easily exceed the 500 gigawatts needed to reach the Plan B goal. Plan B does not count on a buildup in nuclear power. If we use full-cost pricing—requiring utilities to absorb the costs of disposing of nuclear waste, of decomWorld Energy from Renewables in 2006 missioning wornand Plan B Goals for 2020 out plants, and of insuring reacGoal for Source 2006 2020 tors against possible accidents and Electricity Generating Capacity terrorist attacks— (electrical gigawatts) building nuclear plants in a comWind 74 3,000 Rooftop solar electric systems 9 1,090 petitive electricity Solar electric power plants 0 100 market is simply Solar thermal power plants 0 200 not economical. Geothermal 9 200 All together, the Biomass 45 200 Hydropower 850 1,350 development of 5,000 gigawatts Total 987 6,140 (5 million Thermal Energy Capacity (thermal gigawatts) megawatts) of Solar rooftop water new renewable 1,100 and space heaters 100 generating Geothermal 100 500 Biomass 220 350 capacity by 2020, over half of it Total 420 1,950 from wind, would be more than enough to replace all the coal and oil and 70 percent of the natural gas now used to generate electricity. The addition of 1,530 gigawatts of renewable thermal capacity by 2020 will reduce the use of both oil and gas for heating buildings and
water. Roughly two thirds of this growth will come from rooftop solar water and space heaters.
■
Smart meters are devices that can be installed in homes or businesses to enable a two-way flow of information between a utility and its electricity customers. By exchanging real-time information on electricity usage and rates, smart meters give consumers a choice, for example, between running a dishwasher during peak demand and paying 9¢ per kilowatt-hour for electricity and using an automatic timer to run it at 3 a.m. using 5¢ electricity. Giving consumers options like this can shrink their electricity bills and benefit utilities by reducing peak demand and the need for building new power plants. Combining smart meters with smarter appliances yields even greater savings. In a U.S. demonstration project, smart meters were installed in 112 homes along with sophisticated water and space heaters programmed to respond to electricity price signals and clothes dryers that alerted users when prices were high. Between March 2006 and March 2007, participants paying demand-variable prices saved close to 30 percent on their monthly electricity bills.
In looking at the broad shifts to the Plan B energy economy of 2020, fossil fuel–generated electricity drops by 90 percent. This is more than offset by the fivefold growth in renewably generated electricity. In the transportation sector, energy use from fossil fuels drops by some 70 percent. This comes from shifting to highly efficient plug-in hybrid vehicles running largely on electricity produced from renewable energy sources. It also comes from switching to electric trains, which are much more efficient than diesel-powered trains. In the new economy, many buildings will be heated, cooled, and illuminated entirely with carbon-free renewable energy.
Under the Plan B energy economy, our current aging, inefficient, and overloaded electric infrastructure will be replaced by stronger, smarter grids. Stronger national or international electrical grids that integrate the current regional grids can help utilities manage electrical supply and demand and help deal with intermittent sources of energy, like wind. These grids will use digital electricity routing and employ “smart” meters to improve energy efficiency and reduce electricity consumption. For oil fields and coal mines, depletion and abandonment are inevitable. But, while wind turbines, solar cells, and solar-thermal panels will all need repair and occasional replacement, the wind and the sun are inexhaustible. This well will not go dry.
Beyond Beyond the Plan B measures outlined above are some improvements that are harder to quantify. For instance, an enormous amount of energy is used in drilling, mining, and moving fossil resources. In the United States, close to 40 percent of freight-rail movement is for transporting coal that is mostly used to produce electricity. As we switch to widely distributed renewable energy sources, like wind, solar, and geothermal, we are returning to a more localized and more efficient energy economy.
The restructuring of the energy economy outlined here will not only dramatically reduce CO2 emissions, helping to stabilize climate, but it will also eliminate much of the air pollution that we know today. The idea of a pollution-free environment is difficult for us to even imagine, simply because none of us has ever known an energy economy that was not highly polluting. Working in coal mines will be history. Black lung disease will eventually disappear. So too will “code red” alerts warning of health threats from extreme air pollution.
Time for Plan B
7
Planting Trees and Stabilizing Soils UNEP Mobilizes Tree Planting In addition to curbing fossil fuel burning, the Plan B goals are to end net deforestation around the globe and to sequester carbon by planting trees and improving agricultural land management practices. Deforestation has already been banned in some areas to moderate flooding, stabilize soils, and prevent erosion. Now, because the world’s remaining forests store massive amounts of carbon, the impetus for forest protection goes beyond local environmental protection to global climate protection. Stopping forest destruction will involve reducing wood and paper consumption, boosting recycling, and curbing the pressures to deforest that come from population growth and the expansion of agriculture and rangelands. By ending net deforestation, we can cut 2020 carbon dioxide emissions by 1.5 billion tons of carbon. Beyond halting deforestation, Plan B aims to increase the
number of trees on Around the World the earth in order to sequester carbon. A ■ In late 2006, the U.N. Environment newly planted tree Programme, inspired by Nobel Peace Prize winner Wangari Maathai, announced plans for in the tropics can a worldwide effort to plant 1 billion trees in remove 50 kilograms one year. This initial target was easily exceedof CO2 from the ed and by May 2008, over 2 billion trees have atmosphere each been planted in more than 150 countries. year during its Leaders include Ethiopia with 700 million growth period of trees, Turkey with 400 million, and Mexico 20–50 years; a tree with 250 million. The state of Uttar Pradesh in in the temperate India mobilized the planting of 10.5 million regions can take in trees in a single day. The campaign now aims 13 kilograms. to catalyze the planting of 7 billion trees by Planting new trees the end of 2009—just over one tree for every on the 171 million person on the planet. hectares of degraded land that can be profitably reclaimed at a carbon price of $210 per ton could, in 2020, take up over 950 million tons of carbon. Additional carbon can be sequestered through improved agricultural land management. This includes expanding the area of minimum- or no-till cropland, planting more cover crops during the off-season, and using more perennials instead of annuals in cropping patterns. These carbon-sensitive farming and land management practices can take in an estimated 600 million tons of carbon per year, while also improving soil quality and reducing topsoil erosion.
Putting a Price on Carbon Emissions When Sir Nicholas Stern, former chief economist at the World Bank, released his ground-breaking study in late 2006 on the future costs of climate change, he talked about a massive market failure. He was referring to the failure of the market to incorporate the climate change costs into the price of fossil fuels. The costs, he said, would be measured in the trillions of dollars. With this current market failure, society at large rather than the polluters is left bearing the burden of global warming emissions. The difference between the market prices for fossil fuels and the prices that also incorporate their environmental costs to society is huge. One policy instrument for putting a price on carbon is to tax emissions and offset the tax with a reduction in income tax. Another is a cap-and-trade system, where the government imposes a cap or limit on carbon emissions and lets the market trade carbon credits or polluting permits up to that limit. While corporations typically prefer cap-and-trade, economists overwhelmingly favor tax restructuring. Restructuring taxes is more efficient, easily understood, and transparent, and it can be implemented quickly, economy-wide, rather than zeroing in on specific industries. A carbon tax offset with a reduction in income taxes would permeate the entire fossil fuel energy economy. The tax on coal
would be almost double that on natural gas simply because coal has a much higher carbon content.
“Socialism collapsed because it did not allow the market to tell the economic truth. Capitalism may collapse because it does not allow the market to tell the ecological truth.” Øystein Dahle, former Vice President of Exxon for Norway and the North Sea
Plan B proposes a worldwide carbon tax of $240 per ton to be phased in at the rate of $20 per year between 2008 and 2020. Once a schedule for phasing in the carbon tax and reducing the tax on income is in place, the new prices can be used by all economic decisionmakers to make investment decisions. A carbon tax of $240 per ton by 2020 may seem steep, but it is not. If gasoline taxes in Europe, which were designed to generate revenue and to discourage excessive dependence on imported oil, were thought of as a carbon tax, the tax of $4.40 per gallon of gasoline would translate into a carbon tax of $1,815 per ton. This is a staggering number, one that goes far beyond any carbon emission tax or cap-and-trade carbon-price proposals to date. It suggests that the official discussions of carbon prices in the range of $15 to $50 a ton are clearly on the modest end of the possible range of prices. The high gasoline
8
Time for Plan B
taxes in Europe have contributed to an oil-efficient economy and to far greater investment in high-quality public transportation over the decades, making the region less vulnerable to supply disruptions. Environmental tax restructuring is not new in Europe. A fouryear plan adopted in Germany in 1999 systematically shifted taxes from labor to energy. By 2003, this plan had reduced annual CO2 emissions by 20 million tons and helped to create approximately 250,000 additional jobs. It also accelerated growth in the renewable energy sector, creating some 64,000
jobs by 2006 in the wind industry alone, a number that is projected to reach 103,000 by 2010. Between 2001 and 2006, Sweden shifted an estimated $2 billion of taxes from income to environmentally destructive activities. This shift of $500 or so per household came from hikes in taxes on electricity, fuel, and CO2 emissions. The government estimates that without carbon taxes, emissions would be 20 percent higher than they are now. Other countries using tax shifting include Denmark, the Netherlands, Italy, Norway, and the United Kingdom.
A Wartime Mobilization to Stabilize Climate Cutting carbon dioxide emissions 80 percent by 2020 to stabilize climate will entail a rapid mobilization of resources and an outright restructuring of the global economy. The U.S. entry into World War II offers an inspiring case study in rapid mobilization. One month after the bombing of Pearl Harbor, President Franklin D. Roosevelt used his State of the Union address on January 6, 1942, to announce the country’s arms production goals. The United States, he said, was planning to produce 45,000 tanks, 60,000 planes, 20,000 anti-aircraft guns, and 6 million tons of merchant shipping. He added, “Let no man say it cannot be done.” From early 1942 through the end of 1944, there were essentially no cars produced in the United States. Instead, the world’s largest concentration of industrial power at the time—the U.S. automobile industry—was harnessed to meet Roosevelt’s arms production goals. In fact, by the end of the war, the United States had greatly exceeded the President’s goals. The speed of this conversion from a peacetime to a wartime
economy is stunning. The harnessing of U.S. industrial power tipped the scales decisively toward the Allied Forces, reversing the tide of war. Germany and Japan, already fully extended, could not counter this effort. Winston Churchill often quoted his foreign secretary, Sir Edward Grey: “The United States is like a giant boiler. Once the fire is lighted under it, there is no limit to the power it can generate.”
The Role of Leadership ■ In late 2007, New Zealand Prime
Minister Helen Clark announced the country’s intent to boost the renewable share of its electricity from 70 percent, mostly hydro and geothermal, to 90 percent by 2025. The country also plans to halve per capita carbon emissions from transport by 2040 and to expand its forested area by some 250,000 hectares by 2020, ultimately sequestering roughly 1 million tons of carbon per year. The challenge, Clark says, is “to dare to aspire to be carbon neutral.”
This mobilization of resources within a matter of months demonstrates that a country—and, indeed, the world—can restructure the economy extremely rapidly if convinced of the need to do so.
The Race is On Priorities can shift when a country’s way of life is at stake. Today the stakes are higher: it is the future of civilization that is at risk.
sions fast enough to prevent the earth’s temperature from spiraling out of control?
We are now in a race between tipping points in nature and tipping points in our political systems. Can we accelerate the growing movement to phase out coal-fired power plants in time to save the Greenland and West Antarctic ice sheets? Can we muster the political will to halt deforestation before the Amazon rainforest is weakened to the point that it is susceptible to fire? Will we enact Plan B to cut carbon dioxide emis-
We have the technologies to Lester R. Brown, President of Earth Policy Institute restructure the world energy economy and stabilize climate. The challenge now is to build the political will to do so. The choice is ours—yours and mine. If we decide to act now, we can be the generation that changes direction, moving the world onto a path of sustained progress.
“Saving civilization is not a spectator sport.”
© Earth Policy Institute. All rights reserved. For more details on how to get 80 percent carbon emissions cuts by 2020, as well as a plan to stabilize population, eradicate poverty, and restore the earth’s damaged ecosystems, see Plan B 3.0: Mobilizing to Save Civilization (New York: W.W. Norton & Company, 2008), by Lester R. Brown, President of Earth Policy Institute. Full text and additional data are available on-line at www.earthpolicy.org/Books/PB3/index.htm
1350 Connecticut Ave., NW Washington, DC 20036 (202) 492-9290 • www.earthpolicy.org