Analysing attitudes to waste Personal behaviour and choices in daily life, from what we eat to how we get to work or heat our homes, have a significant – and growing – effect on the environment. But why are some households greener than others? And what factors motivate green household choices? Answering these questions is vital for helping governments design and target policies that promote “greener” behaviour. The OECD’s Environmental Policy and Individual Behaviour Change (EPIC) survey is designed to do just that. Drawing on observations from over 12 000 respondents in 11 OECD countries (Australia, Canada, Chile, France, Israel, Japan, Korea, the Netherlands, Spain, Sweden and Switzerland), this large-scale household survey conducted in 2011 explores what drives household environmental behaviour and how policies may affect household decisions. It focuses on five areas in which households have significant environmental impact: energy, food, transport, waste and water. This flyer points decision makers towards ways to design well-targeted and effective policies to green household waste management.
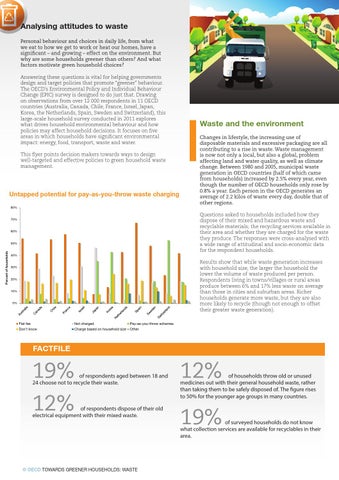
Untapped potential for pay-as-you-throw waste charging 80%
Changes in lifestyle, the increasing use of disposable materials and excessive packaging are all contributing to a rise in waste. Waste management is now not only a local, but also a global, problem affecting land and water quality, as well as climate change. Between 1980 and 2005, municipal waste generation in OECD countries (half of which came from households) increased by 2.5% every year, even though the number of OECD households only rose by 0.8% a year. Each person in the OECD generates an average of 2.2 kilos of waste every day, double that of other regions. Questions asked to households included how they dispose of their mixed and hazardous waste and recyclable materials; the recycling services available in their area and whether they are charged for the waste they produce. The responses were cross-analysed with a wide range of attitudinal and socio-economic data for the respondent households.
70%
60%
50% Percent of households
Waste and the environment
40%
Results show that while waste generation increases with household size, the larger the household the lower the volume of waste produced per person. Respondents living in towns/villages or rural areas produce between 6% and 17% less waste on average than those in cities and suburban areas. Richer households generate more waste, but they are also more likely to recycle (though not enough to offset their greater waste generation).
30%
20%
10%
0%
Flat fee
Not charged
Pay-as-you-throw schemes
Don't know
Charge based on household size
Other
FACTFILE
19%
of respondents aged between 18 and 24 choose not to recycle their waste.
12%
of respondents dispose of their old electrical equipment with their mixed waste.
© OECD TOWARDS GREENER HOUSEHOLDS: WASTE
12%
of households throw old or unused medicines out with their general household waste, rather than taking them to be safely disposed of. The figure rises to 50% for the younger age groups in many countries.
19%
of surveyed households do not know what collection services are available for recyclables in their area.