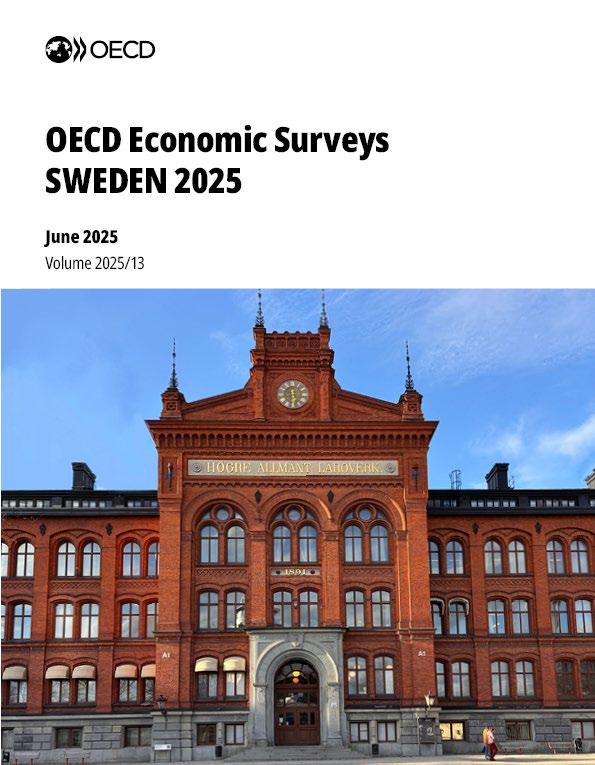


Stockholm 5 June 2025


Stockholm 5 June 2025

Note: Seasonally adjusted annualised quarter-to-quarter
Source:

Direct exports to the United States Exports as a share of GDP, 2023
Note: Trade shares based on the OECD’s Balanced International Merchandise Trade dataset for 2023. Proportions of trade are scaled to proportions of nominal goods exports to nominal GDP, based on national accounts data.
Source: OECD Economic Outlook database; OECD Balanced International Merchandise Trade (2023); and OECD calculations.

1. Based on the consumer price index with a fixed mortgage rate.
Source: OECD Economic Outlook database.

Supporting a more resilient economic recovery


Source: Sveriges Riksbank.

General government fiscal balance
Fiscal balance (% of GDP) Structural balance (% of potential GDP)
Note: The structural balance is the fiscal balance adjusted for the economic cycle and one-off measures.
Source: OECD Economic Outlook database.

Note: The baseline scenario assumes no policy changes, with age-related costs estimated using the OECD long-term model baseline. The structural reforms scenario incorporates key policy recommendations on pensions, taxes and the labour market, as outlined in the Survey. These include increasing the relative importance of earnings-related pensions, phasing out mortgage interest deductibility, closing the gap in property tax revenues against the OECD average by one-third by 2030, closing the gap in the labour tax wedge against the OECD average by half by 2030, easing rental regulations, and strengthening active labour market policies. The fiscal rule scenario also assumes that fiscal policy complies with a balanced budget target. The model parameters rely on simplified assumptions standardised across OECD countries.
Source: OECD calculations based on the OECD long-term model; Guillemette and Château (2023), “Long-Term Scenarios: Incorporating the Energy Transition”, OECD Economic Policy Papers, No. 33.

Source: Sveriges Riksbank.


Population growth and residential construction
Population increase (left axis)
Dwelling completions (right axis)
Source: Statistics Sweden.

Costs of dwellings, land and construction compared with overall inflation
Note: The value of land and dwellings comes from the national wealth statistics (variables AN2111A and AN111 respectively). For construction cost, the construction cost index excluding wage drift for multi-dwelling buildings has been used.
Source: Statistics Sweden.

Rent control
Index from 0 (least restrictive) to 1 (most restrictive)
Note: The rent control index ranges from 0 (no restrictions) to 1 (all types of restrictions) according to answers to the 2019 OECD Questionnaire on Affordable and Social Housing.
Source: OECD (2021), Brick by Brick.


Adult literacy skills by age group, 2023 PIAAC1 score points
1. Programme for the International Assessment of Adult Competencies.
Source: Pareliussen, J. (forthcoming), “Adult skills, labour market outcomes and social cohesion in Sweden”, OECD Economics Department Working Papers.

1. Programme for the International Assessment of Adult Competencies. Controlling for background variables including age, gender, parental education and immigrant status.
Source: Pareliussen, J. (forthcoming), “Adult skills, labour market outcomes and social cohesion in Sweden”, OECD Economics Department Working Papers.

Population 16-64 not in employment or full-time education by risk category, 2023
1. Includes permanently disabled and unemployed aged 55 and over.
Source: OECD Survey of Adult Skills.

Spending by active labour market policy programme
Spending per unemployed as a share of GDP per capita, 2022
1. Spending on public employment services and administration, direct job creation and employment and start-up incentives.
Source: OECD, Social Expenditure database.


Note: Higher values indicate greater private sector adaptation. ‘Strategy’ refers to firms adopting an adaptation strategy for physical risks. ‘Investments’ denotes investments in solutions to avoid or reduce exposure. ‘Insurance’ indicates the purchase of insurance products to offset climate-related losses. Data is sourced from the European Investment Bank Group Survey on Investment and Investment Finance. The survey covers approximately 12 000 firms across the
and 800 firms in the United States.
Source: Costa, H. et al. (2024), “The Heat is On: Heat Stress, Productivity and Adaptation among Firms”. Indicator of private sector adaptation, 2024

Source: Ministry of Finance budgets; Swedish National Financial Management Authority. Public funding for climate change adaptation
Note: Numbers come from government budgets, expense category (“utgiftsområde”) 20, 1:10, climate adaptation, 1:19 measures preventing landslides along the Göta älv river valley and allocation to the Civil Contingencies Agency’s fund for preventive measures against natural disasters.

Fiscal
Housing
Support the recovery by maintaining a slightly expansionary fiscal stance. Stand ready to adjust monetary policy to incoming data.
Skills Climate
Improve housing supply and affordability by streamlining zoning, permitting and construction and phasing out rent controls.
Further improve performance of schools and universities and of labour market matching with adapted measures for those with weak education and skills.
Bolster climate resilience by accelerating market-based adaptation measures and improving coordination across levels of government.


https://oe.cd/sweden
Disclaimers:
The statistical data for Israel are supplied by and under the responsibility of the relevant Israeli authorities. The use of such data by the OECD is without prejudice to the status of the Golan Heights, East Jerusalem and Israeli settlements in the West Bank under the terms of international law. This document and any map included herein are without prejudice to the status of or sovereignty over any territory, to the delimitation of international frontiers and boundaries and to the name of any territory, city or area.