HIGHLIGHTS
unfavourable conservation status. About 29% of the Spanish land area and 8.4% of the territorial waters are under some form of nature protection (see page 12). zz
Forest covers one-third of the country. Forest area grew by 8% over 2000-11, but the growing stock is among the lowest in the OECD. Tree fellings increased by almost 20% between 2000-11, partly due to preventative measures and damage from water shortages.
zz
Only 2% of total land is covered by artificial surfaces, well below the EU average of 4.6%. Artificial areas increased, in particular between 2009-12 (by 12%), mostly due to the expansion of transport infrastructure and construction sites. In the first part of the 2000s, Spain had the highest annual rate of urban land take among OECD member countries.
zz
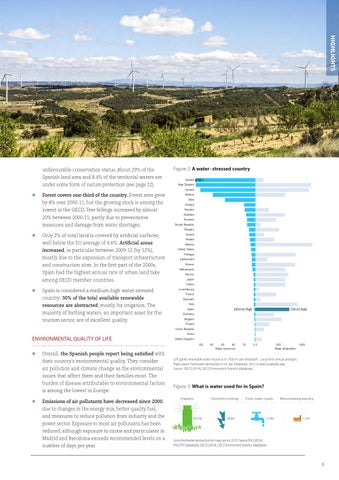
Spain is considered a medium-high water-stressed country: 30% of the total available renewable resources are abstracted, mostly for irrigation. The majority of bathing waters, an important asset for the tourism sector, are of excellent quality.
Spain is 2: a water-stressed country. Figure A water - stressed country
Country (group
Country Iceland
Spain
530.1
Other
New Zealand Canada
Measure Name
Norway
Total renewa
Chile Finland Sweden Australia Slovenia Slovak Republic Hungary Ireland Austria Estonia United States Portugal Switzerland Greece Netherlands Mexico Japan Turkey Luxembourg France Denmark Italy
2410 m3/hab
Spain
730 m3/hab
Germany Belgium Poland Czech Republic
ENVIRONMENTAL QUALITY OF LIFE
Korea United Kingdom 100
zz
Overall, the Spanish people report being satisfied with their country’s environmental quality. They consider air pollution and climate change as the environmental issues that affect them and their families most. The burden of disease attributable to environmental factors is among the lowest in Europe.
zz
80
60 40 Water resources
20
00
500 Water abstraction
1000
Total renewable water resources per capita (1000m3/hab) and sum of Total freshwater abstraction per capita for each Country. For pane Sum m of3Total freshwater Long-term abstractionannual per capita (m3/hab): Color Left(m3/hab) panel: renewable water resources in 1000 per inhabitant. averages. shows details about Country (group) 1. For pane Sum of Total renewable water resources per capita Right panel: Freshwater abstraction in m3 Total per inhabitant. orresources latest available year. (1000m3/hab). The (1000m3/hab): Color shows details about renewable2012 water per capita data is filtered Action (Country), which Statistics keeps 33(database). members. The view is filtered on sum of Total freshwaSource: OECDon (2014), OECD Environment ter abstraction per capita (m3/hab), which keeps all values.
Figure 3: What is water used for in Spain?
Emissions of air pollutants have decreased since 2000, due to changes in the energy mix, better quality fuel, and measures to reduce pollution from industry and the power sector. Exposure to most air pollutants has been reduced, although exposure to ozone and particulates in Madrid and Barcelona exceeds recommended levels on a number of days per year.
Gross freshwater abstraction by major sector, 2010. Source: FAO (2014), FAOSTAT (database); OECD (2014), OECD Environment Statistics (database)
5