OECD Economic Survey of the European Union and the Euro Area 2025
Strengthening productivity and the Single Market
Paris
3 July 2025, 10am
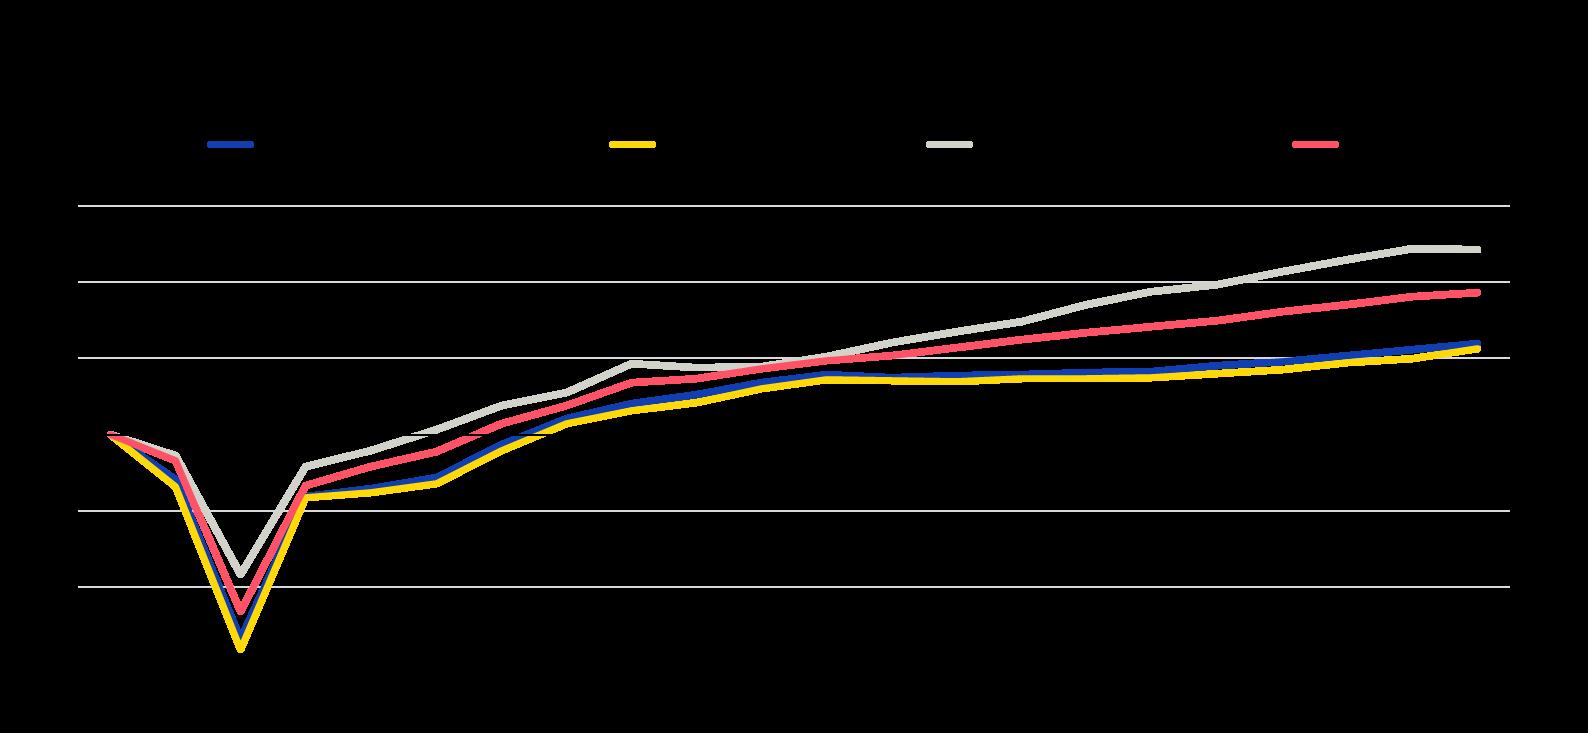
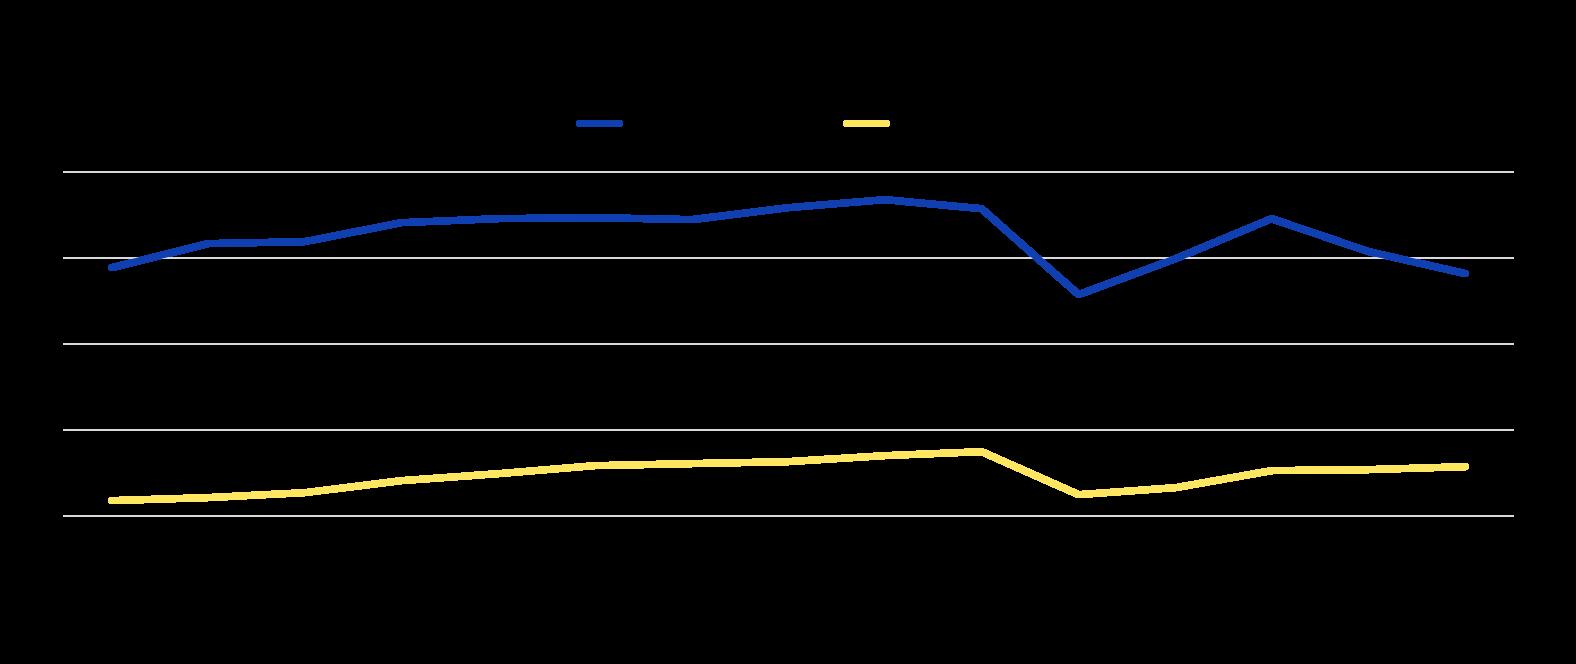
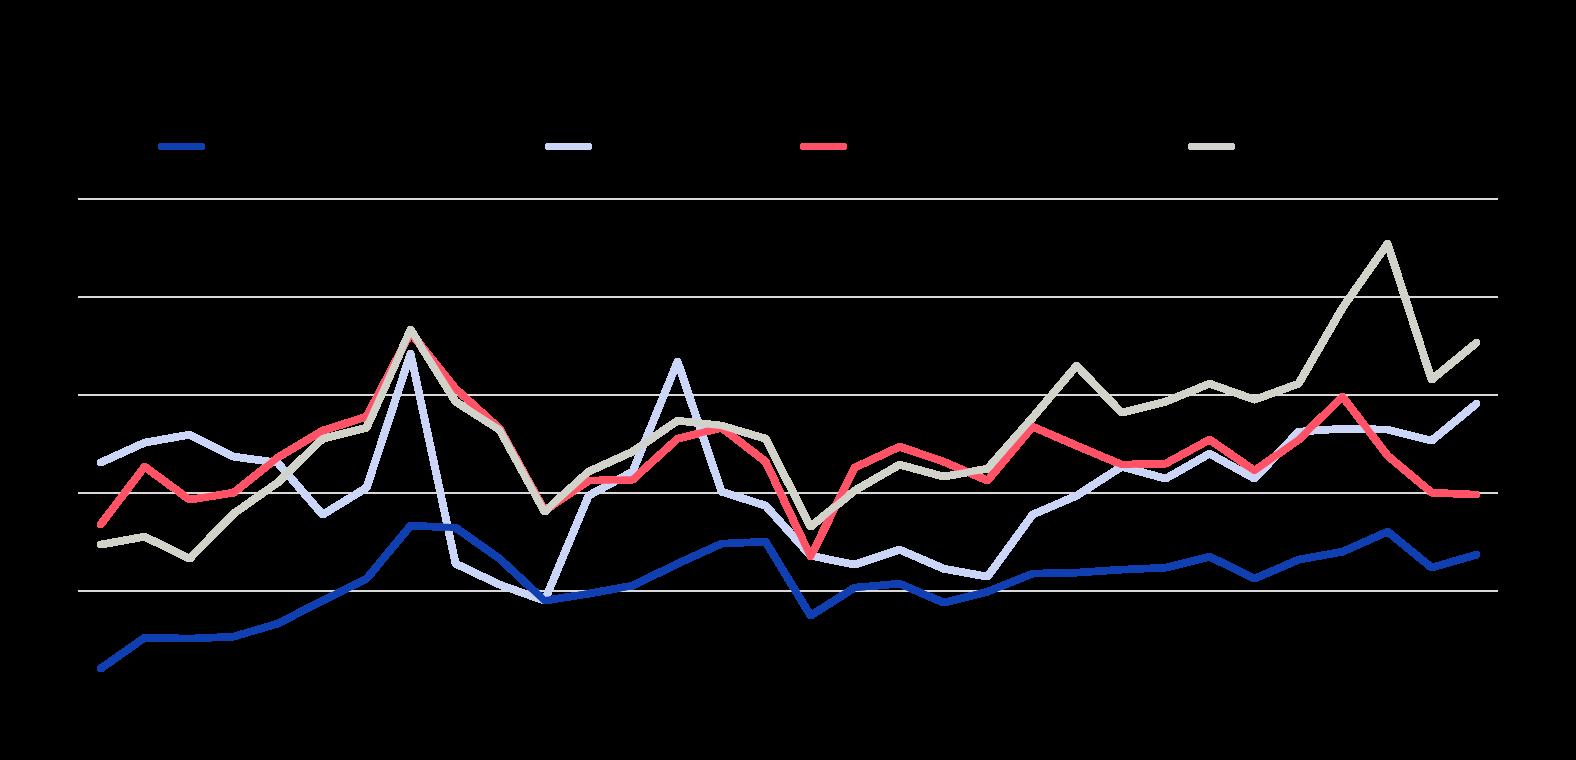
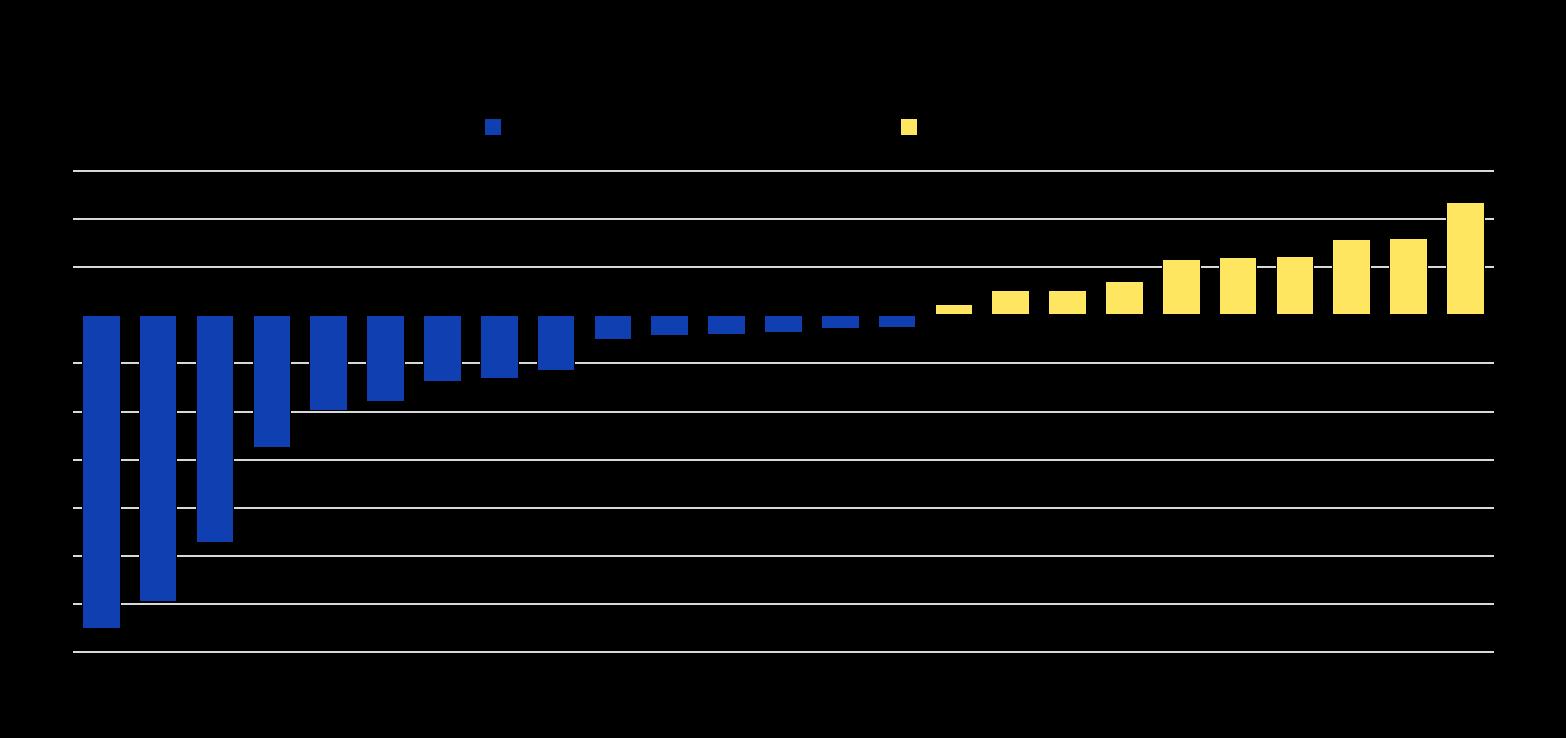
Growth has been slow, and needs to be reinvigorated
Note: Data refer to the euro area member countries that are also members of the OECD (17 countries).
Source: OECD Economic Outlook: Statistics and Projections database.
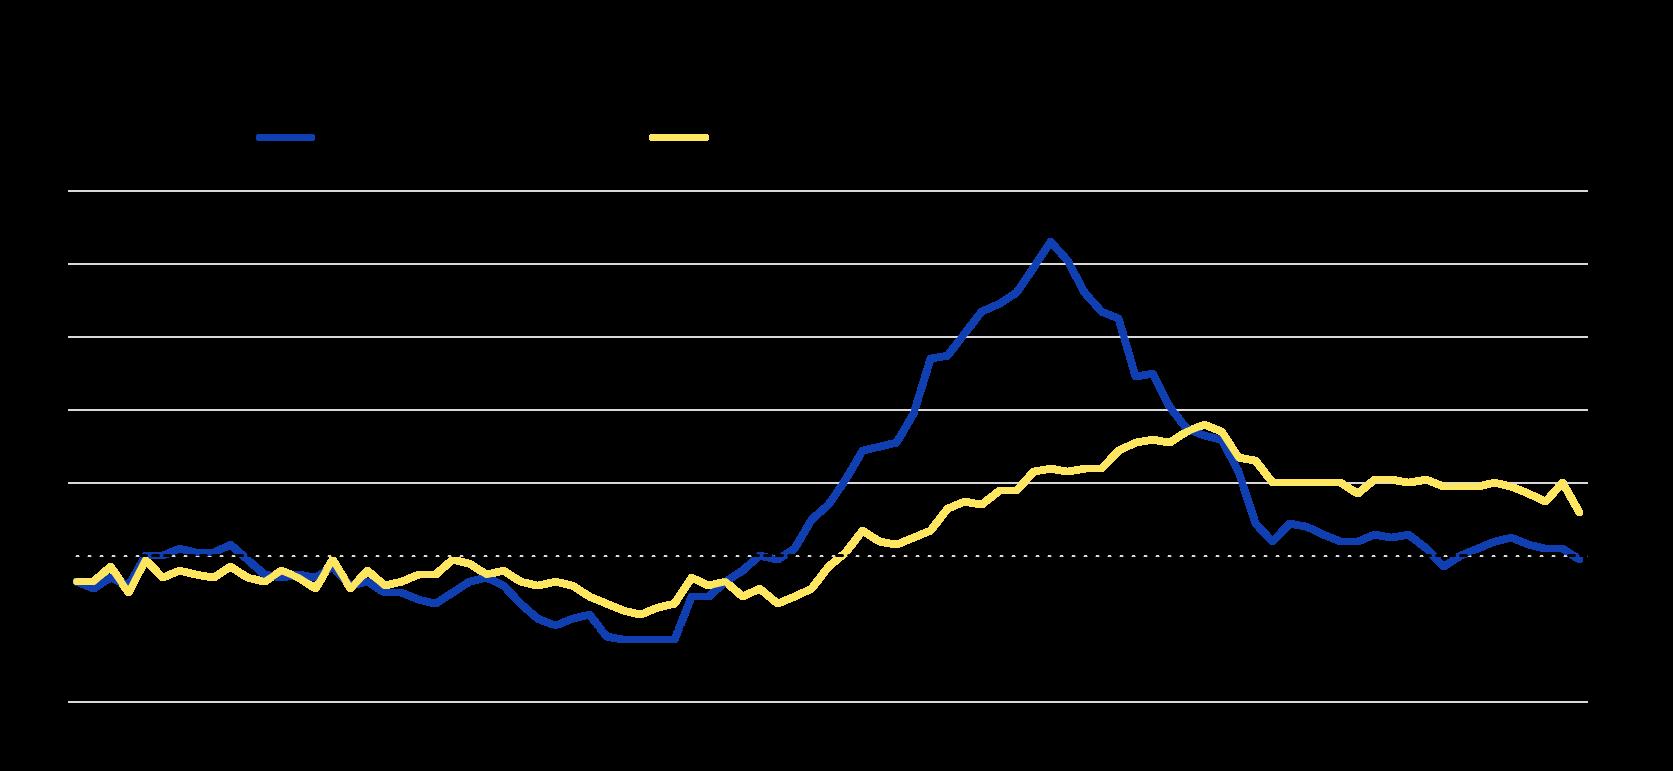
Inflation in the euro area has been easing
Note: ECB stands for European Central Bank.
Source: Eurostat.
Growth in the euro area is projected to strengthen gradually
Note: Data refer to the euro area member countries that are also members of the OECD (17 countries).
Source: OECD Economic Outlook 117 database.
Pursuing prudent macroeconomic policies
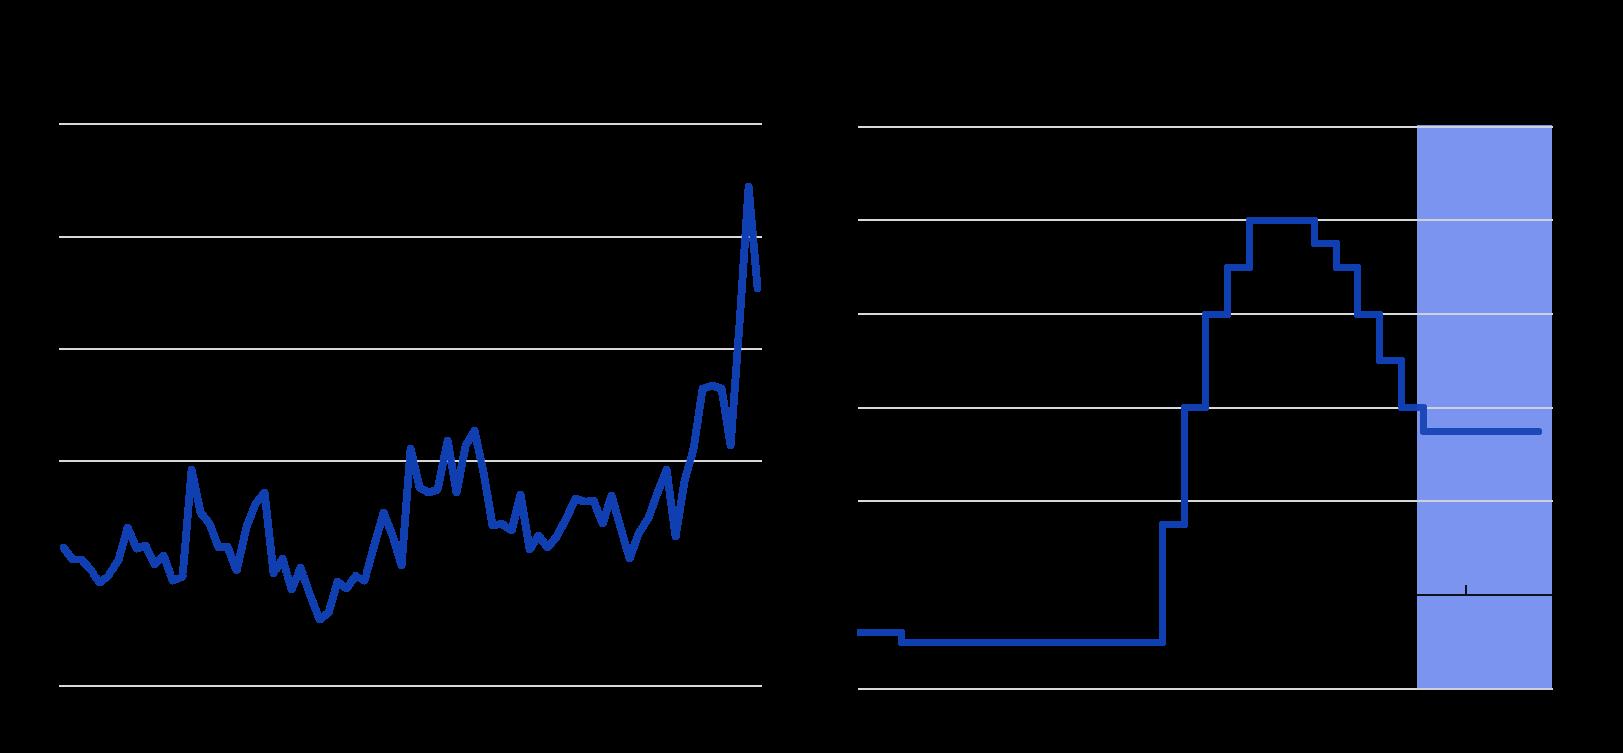
High uncertainty calls for prudent monetary policy
Note: Left panel: The Economic policy uncertainty index for Europe, developed by Baker, Bloom and Davis (2016), measures policy-related uncertainty by tracking print media coverage of economic policy-related uncertainty for 5 European economies (France, Germany, Italy, Spain, the United Kingdom). The indicators are standardised to show the number of standard deviations above or below their average value over the period 2007-2024. A positive (negative) value indicates high (low) systemic stress in the financial markets. Data are shown up to May 2025. Right panel: The shaded area refers to projections.
Source: OECD Economic Outlook: Statistics and Projections database; Refinitiv; and OECD calculations.
Fiscal policy needs to make space for defence spending and long-term challenges
Note: Data refer to the European Union and the euro area member countries that are also members of the OECD (22 and 17 countries respectively).
Source: OECD Economic Outlook: Statistics and Projections database.
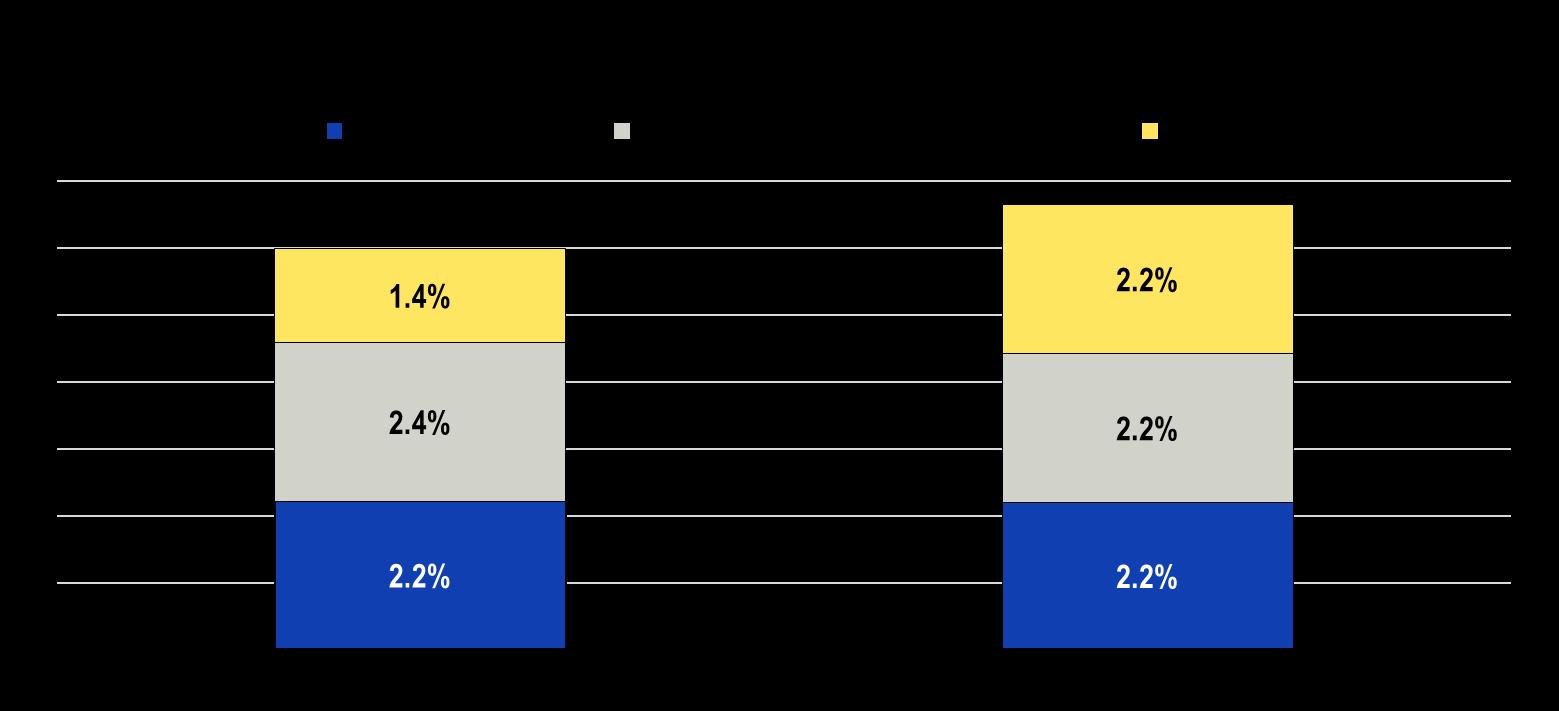
Repurposing the EU budget for new challenges
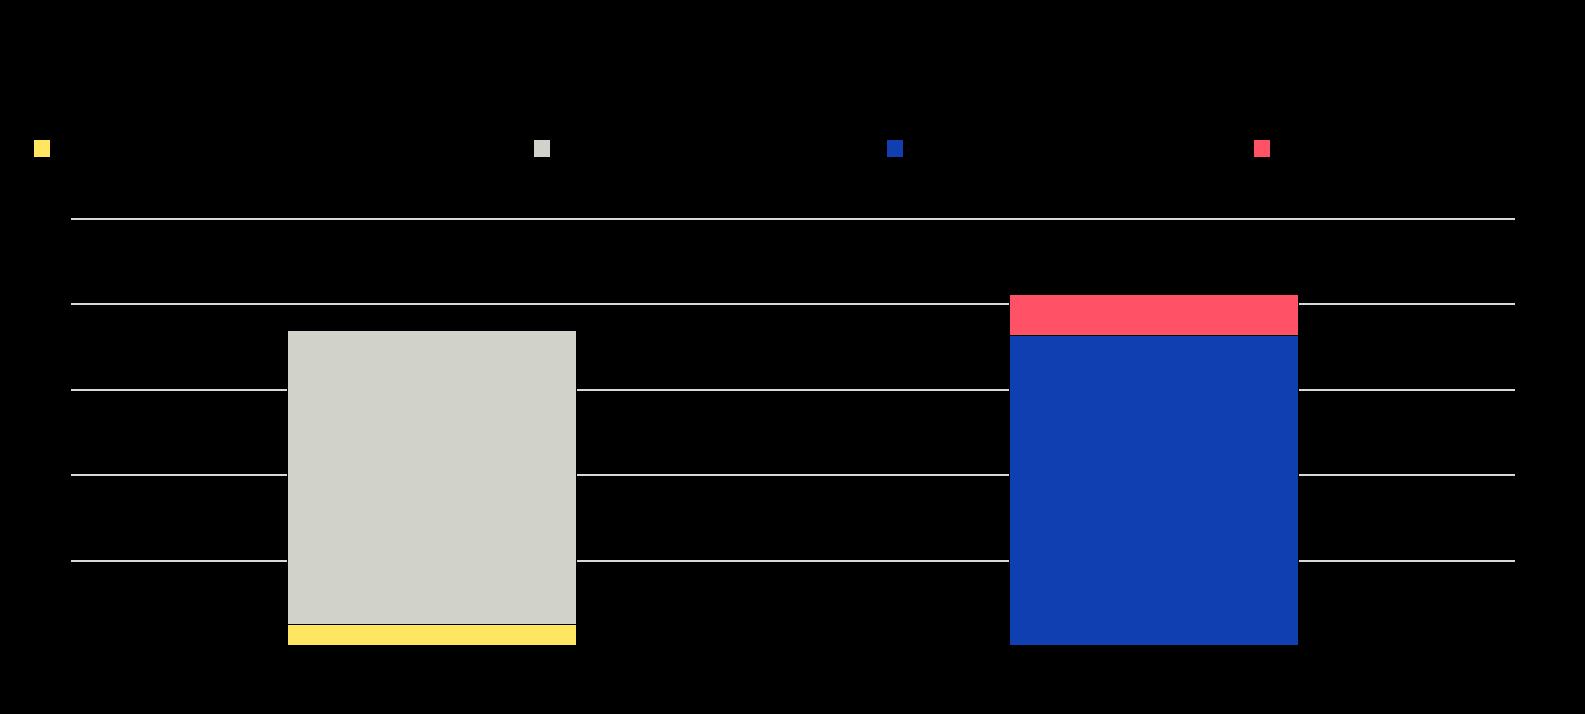
A greater share of public investment could be co-ordinated and financed at the EU level
Note: Data exclude Next Generation EU and European public administration costs and refer to the whole 7-year Multiannual Financial Framework (MFF). The EU’s annual budget amounted to 0.89% of EU gross national income in 2023. In the MFF 2021-2027, the category “Other” refers to “New and Reinforced Priorities”, mainly including the “Neighbourhood, Development and International Cooperation Instrument”, “Horizon Europe”, “Just Transition Fund”, “Connecting Europe Facility”, “Single Market Programme”, “InvestEU” and “Humanitarian Aid”. In the MFF 2014-2020, the category “Other” refers mainly to funds related to “Competitiveness for Growth and Jobs”, “Global Europe” and “Security and Citizenship”. Source: European Commission; and OECD calculations.
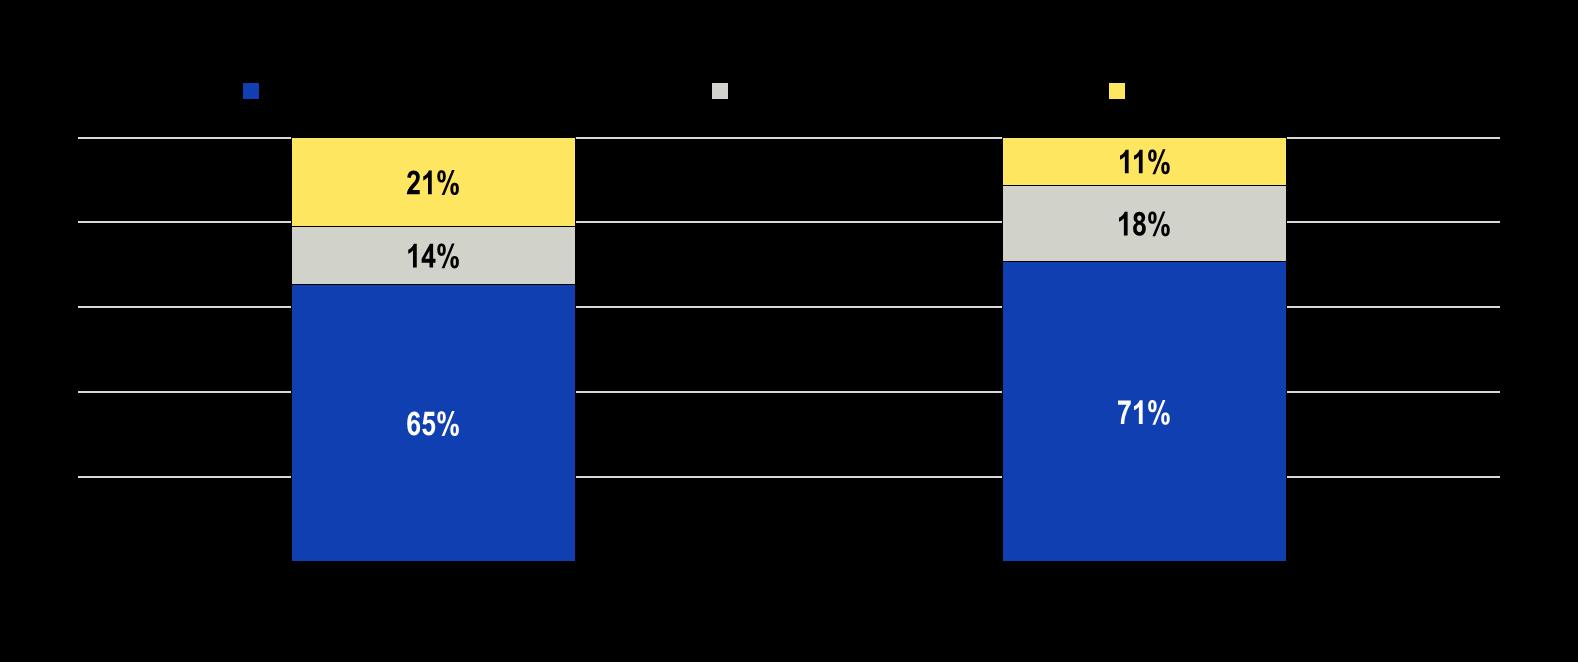
Targeting of cohesion spending to less developed regions could be further strengthened
Note: Data refer to EU financing only (excluding national co-financing). Regions are defined as “less developed” when GDP per capita is less than 75% of the EU average, as “transition” when GDP per capita is between 75% and 100% of the EU average, and as “more developed” when GDP per capita is greater than 100% of the EU average. 2021-2027 data refer to planned allocations over the whole budgetary period for the European Regional Development Fund and the European Social Fund plus. Data do not include payments to Outermost or northern sparsely populated regions and payments of Interregional funds, which form part of the European Regional Development Fund. 2014-2020 data refer to allocations over the whole budgetary period for the European Regional Development Fund and the European Social Fund.
Source: Open Data Platform for the European Structural and Investment Funds; Eurostat; and OECD calculations.
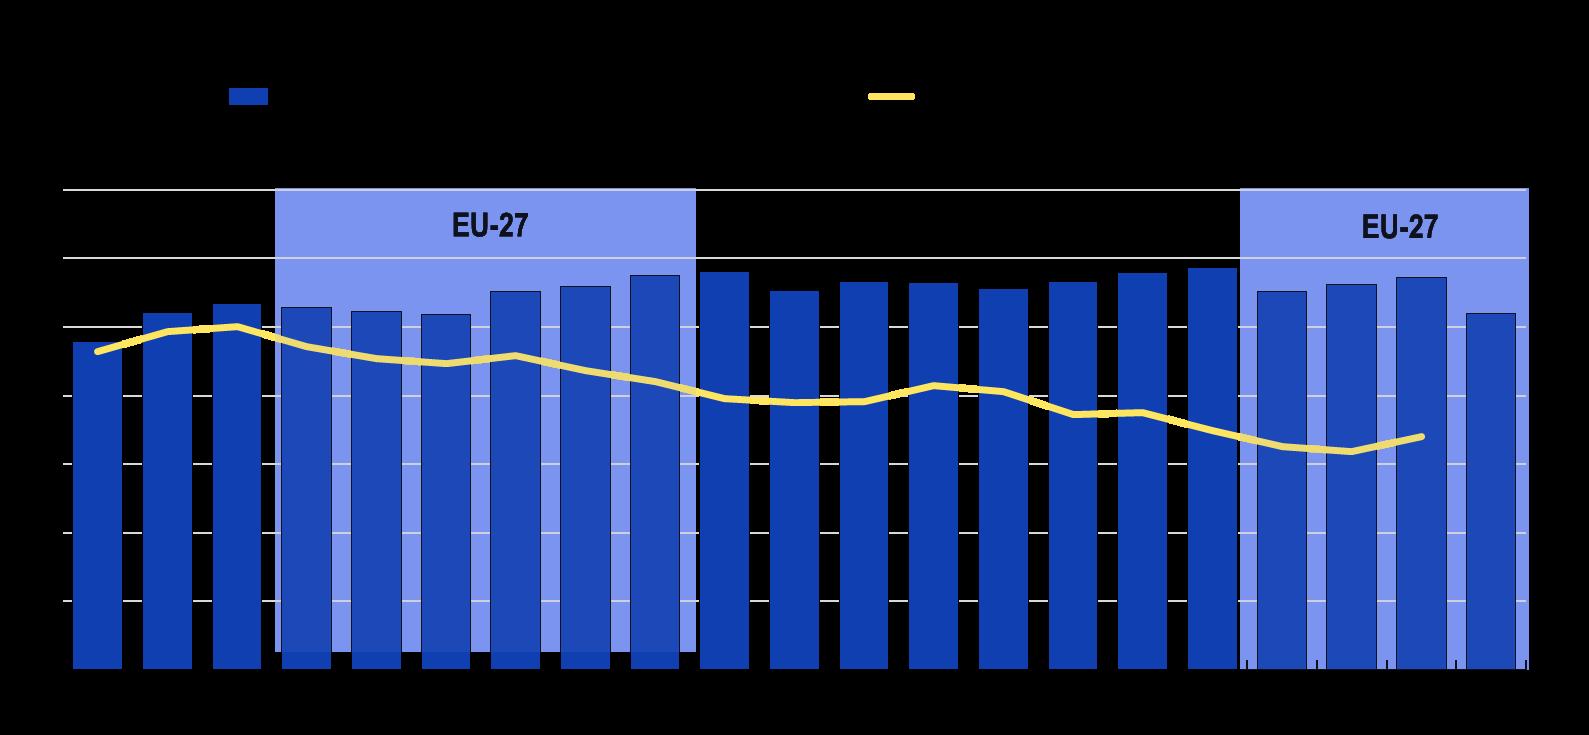
Common Agricultural Policy spending should be rationalised to free resources
Note: Next Generation EU funds are excluded when calculating the Common Agricultural Policy’s (CAP’s) share in the EU budget.
Source: European Commission, CAP expenditure database (accessed on 28 January 2025).
Boosting productivity through a stronger Single Market
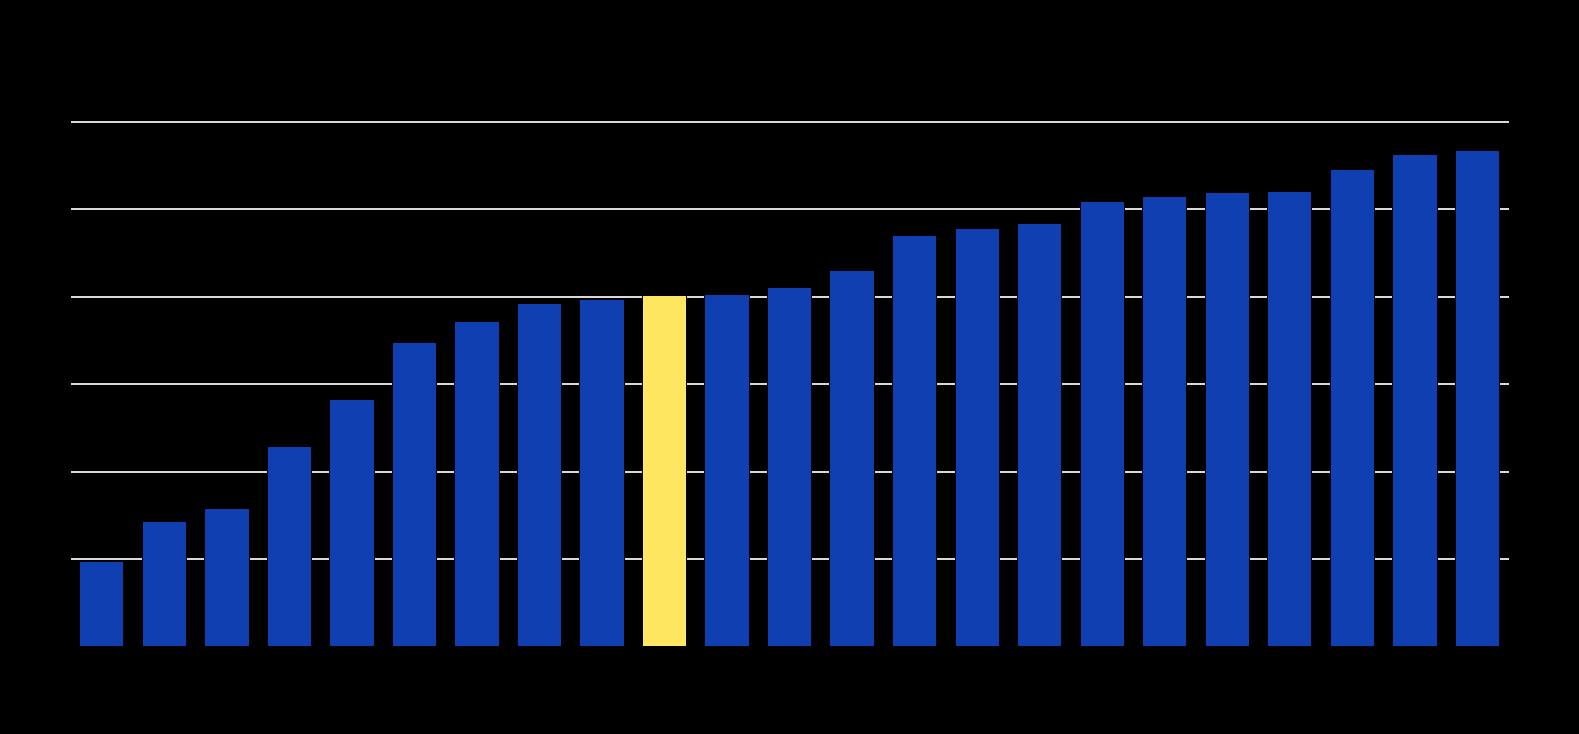
Productivity growth has been significantly slower than in the United States
Note: Labour productivity is measured as real value added per employee.
Source: Eurostat; Bureau of Economic Analysis of the United States; and OECD calculations.
A more integrated Single Market for services would strengthen business dynamism and productivity
Note: Intra-EU trade integration refers to import and export volumes as a share of GDP. Data refer to the EU changing members’ composition, EU27 from 2010 to 2012, EU28 from 2013 to 2019, and EU27 from 2020 to 2023.
Source: Eurostat; and OECD calculations.
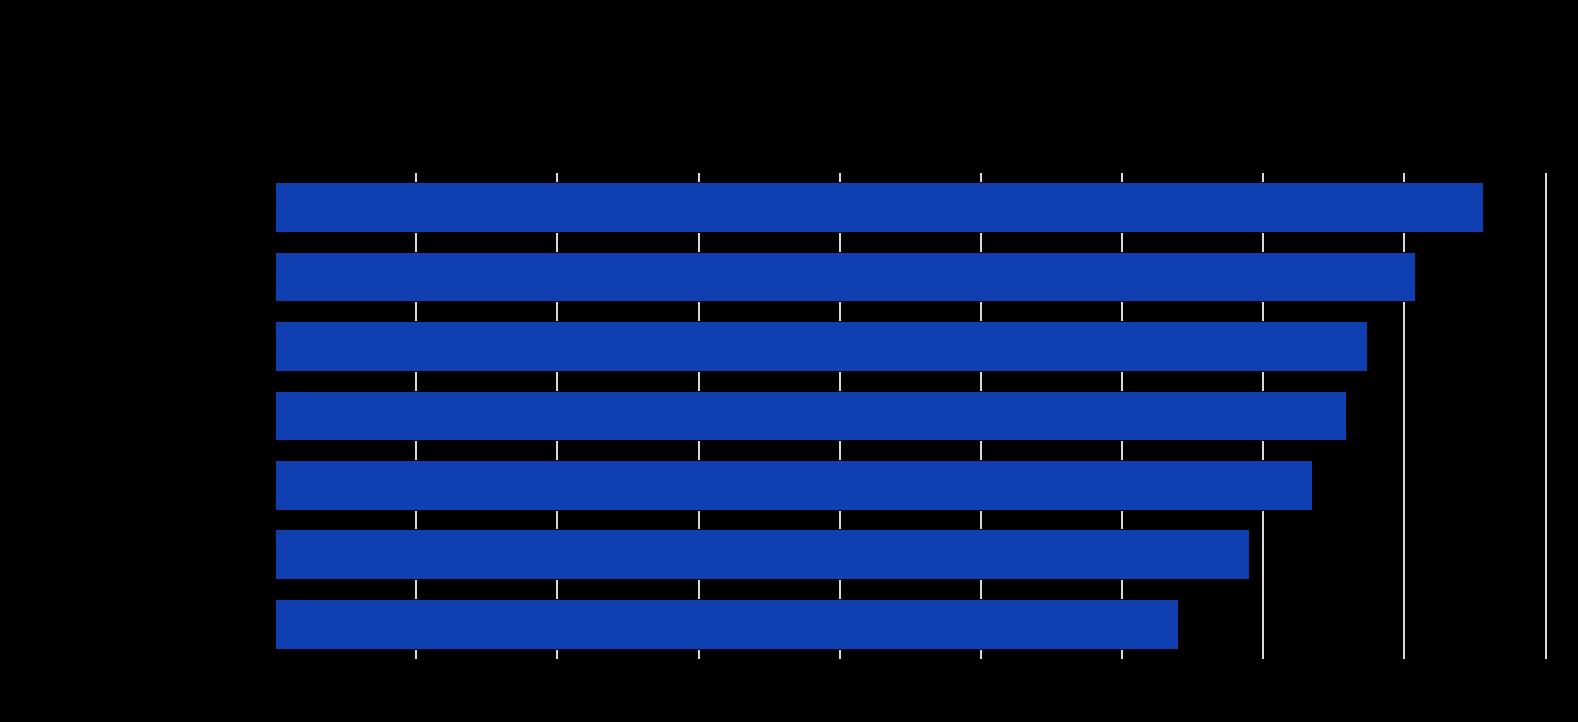
Reducing regulatory burdens would support market integration
Note: The Product Market Regulation indicator is a composite index that encompasses a set of indicators that measure the degree to which policies inhibit competition in areas of the product market where competition is viable.
Source: OECD Product Market Regulation database.
Improving mutual recognition of qualifications would enable greater labour mobility
Source: European Commission Single Market Enforcement Taskforce Report 2022-2023; and European Commission Single Market Scoreboard.
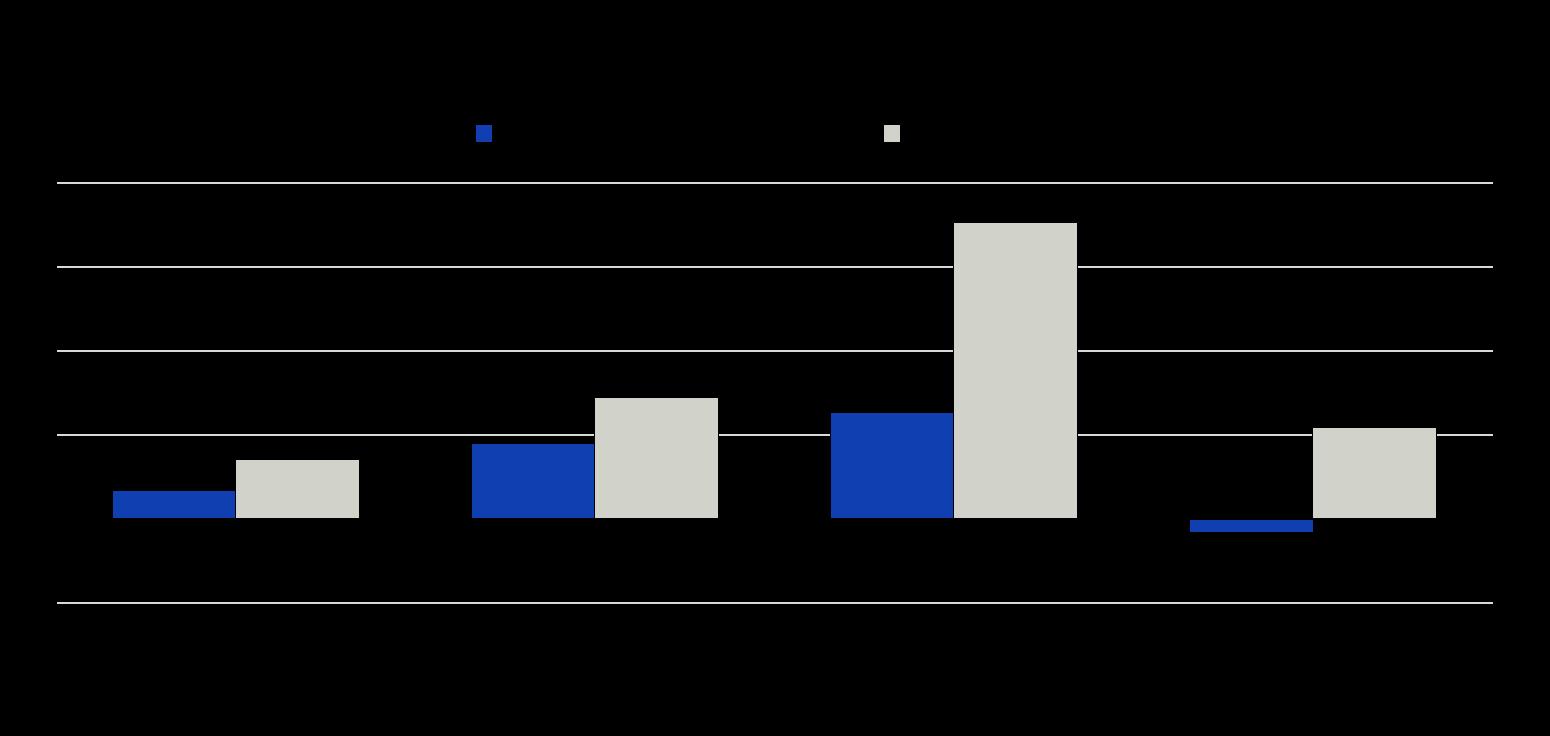
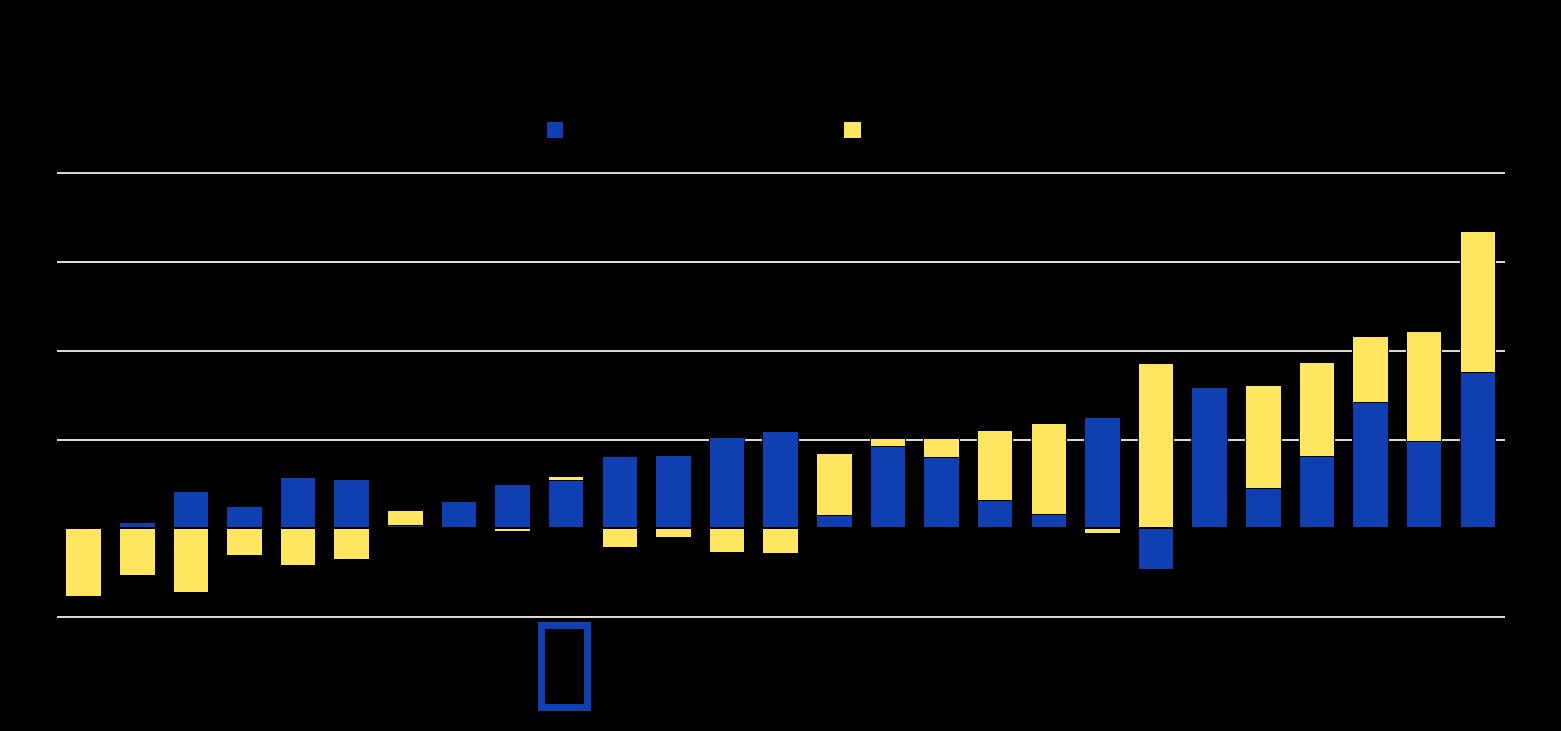
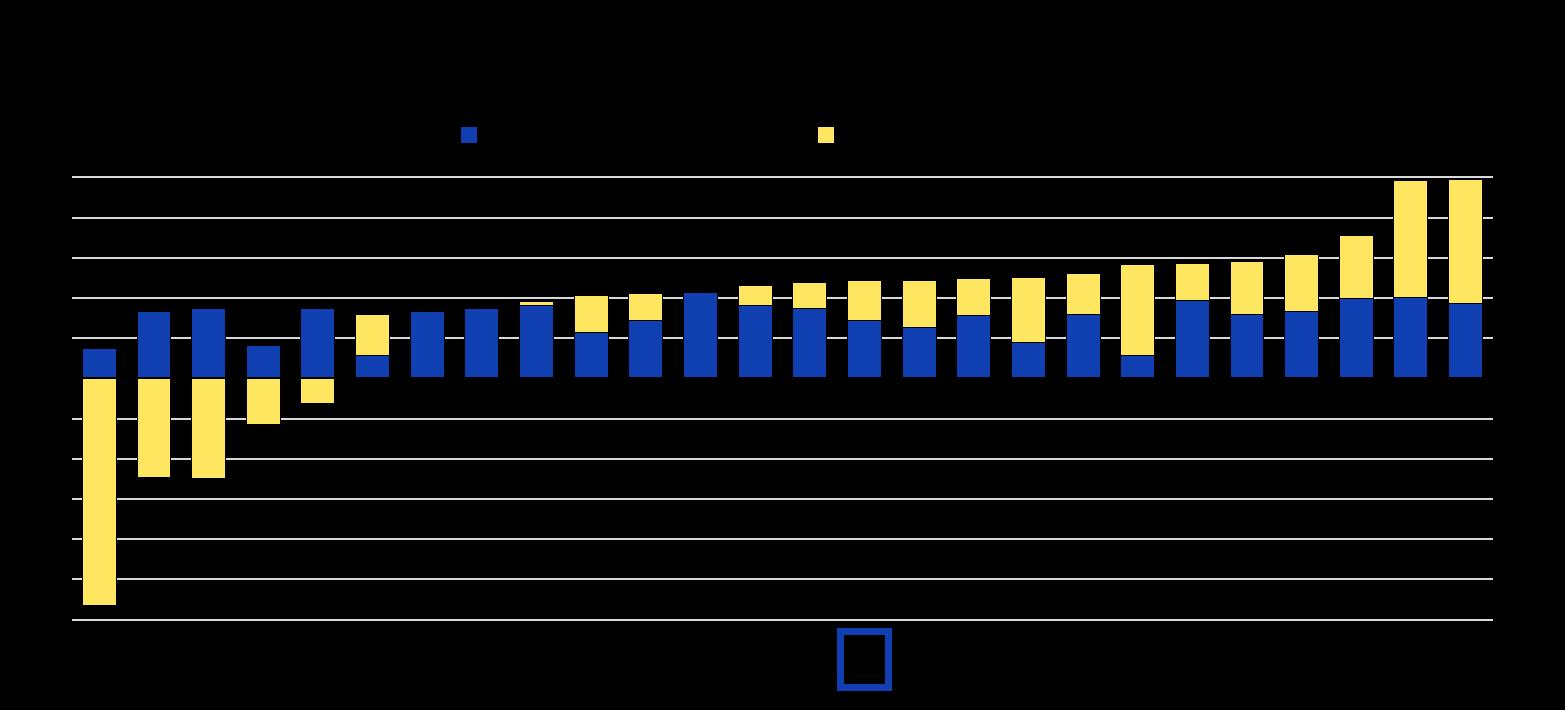
Attracting more skilled workers would help address labour shortages
Note: Foreign (native) born contribution indicates the absolute change in the number of foreign (native) individuals in the labour force, divided by the absolute change in the total number of individuals in the labour force. The sum of the foreign and native components equals the total labour force growth. Data refer to the labour force aged 15 and over for all countries except the United Kingdom and the United States for which data refer to the age group 16 and over.
Source:
Eurostat Labour Force Statistics (EU); Australian Bureau of Statistics Labour Force Statistics (AUS); Statistics Canada Labor Force Statistics (CAN); Office for National Statistics Labour Force Survey (GBR); US Bureau of Labor Statistics Current Population Survey (USA); and OECD calculations.
Deeper and more integrated capital markets would support innovation and productivity growth
Source: European Capital Markets Institute.
Limited EU-level research and development spending needs to be better targeted to boost innovation
Source: Draghi (2024), The future of European competitiveness; Bureau of Economic Analysis of the United States; and OECD calculations.
Strengthening electricity markets
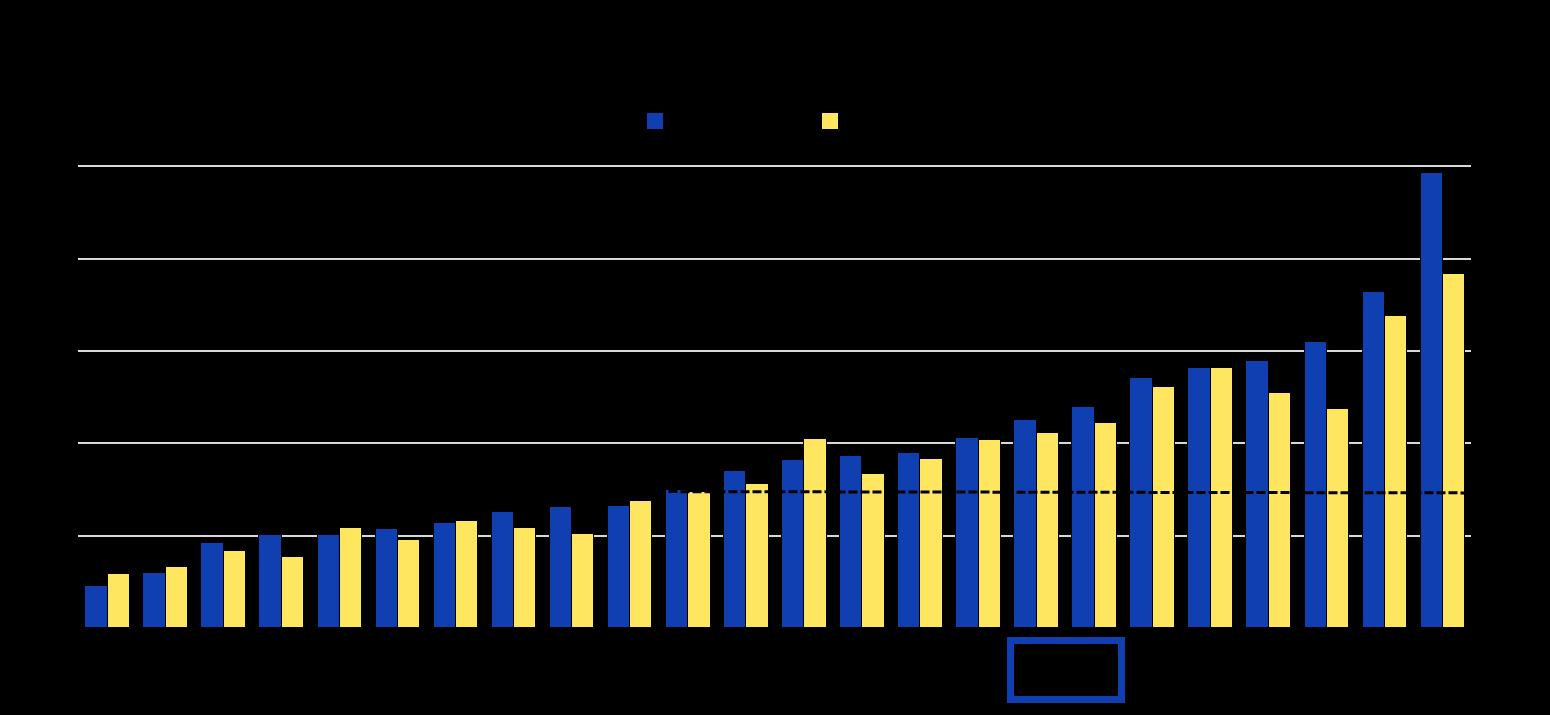
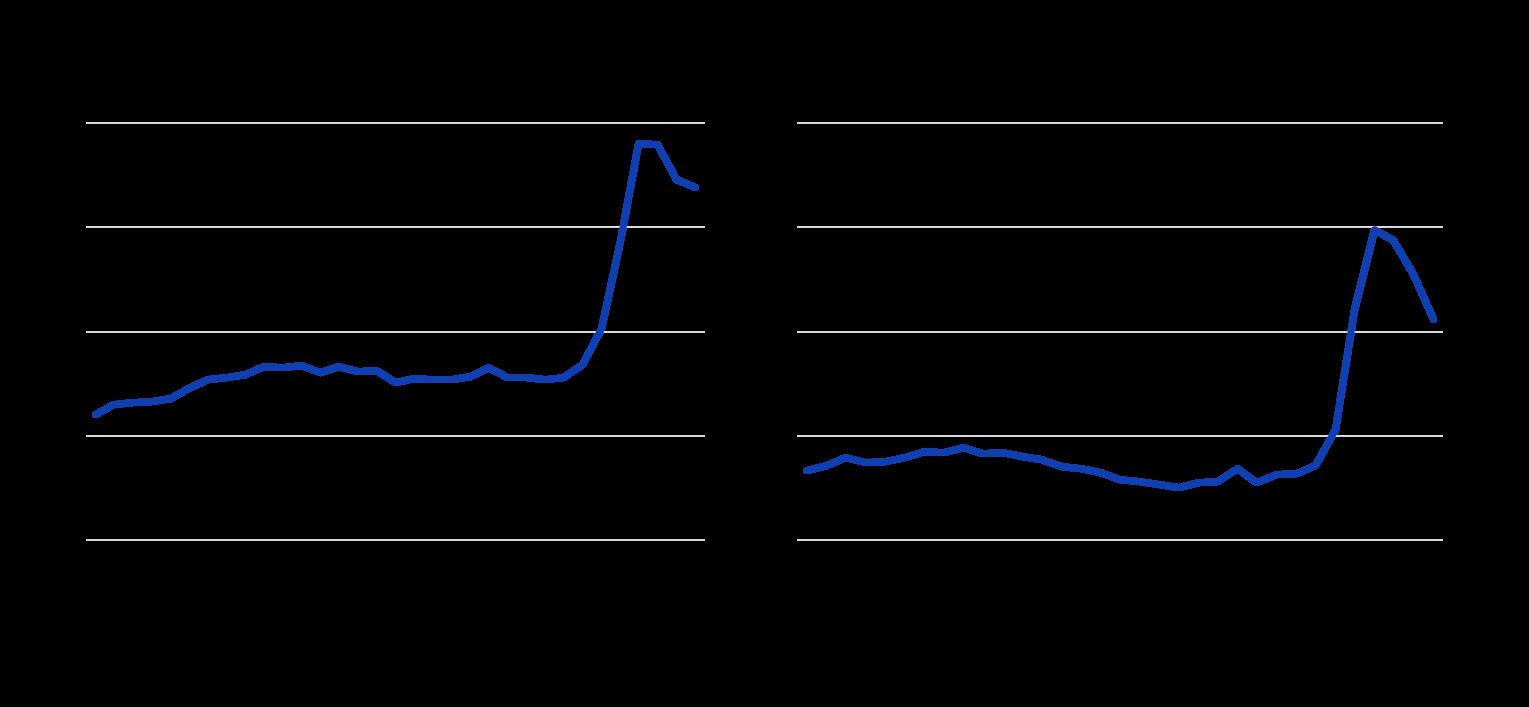
Electricity prices remain relatively high
Note: Semi-annual data. Left panel: Consumption from 2 500 to 4 999 kilowatt-hour. Right panel: Consumption from 500 to 1 999 megawatt-hour.
Source: Eurostat Electricity prices components for household consumers database; and Electricity prices for non-household consumers database.
Reducing electricity taxation would encourage electrification and decarbonisation
Note: Consumption from 2 500 kilowatt-hour to 4 999 kilowatt-hour (band DC). “Other taxes and levies” is negative when the tax allowance’s amount is higher than the amount of the tax itself, and includes price support provided to electricity consumers to address the energy price crisis.
Source: Eurostat Electricity prices components for household consumers database.
Improved cross-border grid connections are needed to boost electricity trade
Source: Fraunhofer Institute for Solar Energy Systems; and OECD calculations.
Main messages
Macro
Fiscal
Budget
Economic policy should better support growth and make space for new spending needs, such as defence. Monetary policy should ensure price stability.
Productivity
Reprioritising and optimising EU budget spending is needed to ensure key cross-border public investment and effective support for less developed regions.
Electricity
Reducing regulatory burdens and removing internal market barriers is key to enhance innovation, business dynamism and productivity.
A more integrated market for electricity would help lower electricity costs and improve competitiveness.
Youth
Green
Disclaimers:
The statistical data for Israel are supplied by and under the responsibility of the relevant Israeli authorities. The use of such data by the OECD is without prejudice to the status of the Golan Heights, East Jerusalem and Israeli settlements in the West Bank under the terms of international law. This document and any map included herein are without prejudice to the status of or sovereignty over any territory, to the delimitation of international frontiers and boundaries and to the name of any territory, city or area.