

Vilnius 28 March 2025
https://oe.cd/LTU


Growth is gathering momentum, after a slowdown in 2022-23
Gross Domestic Product Volume, 2019Q4 = 100

Note: Seasonally and calendar adjusted data.
Source: Statistics Lithuania, OECD.

Vilnius 28 March 2025
https://oe.cd/LTU
Gross Domestic Product Volume, 2019Q4 = 100
Note: Seasonally and calendar adjusted data.
Source: Statistics Lithuania, OECD.
Real GDP growth, %
Headline inflation, %
Fiscal balance, % of GDP
Note: Headline inflation measured using the Harmonised Index of Consumer Prices (HICP). Fiscal balance of the general government.
Source: Statistics Lithuania, OECD.


% of GDP, 2023

Note: General government gross debt.
Source: OECD Government at a Glance.
Change in ageing-related expenditure % of GDP, 2022-2045

Note: In addition to pensions, total public expenditure related to ageing includes healthcare, long-term care and education.
Source: European Commission - Ageing Report (2024).
Gap between life expectancy at birth and legal retirement age Men, 2022

Note: OECD is an unweighted cross-country average.
Source: OECD Income distribution database
Poverty rate
Share of people earning less than 50% of the median disposable income, 2022

Government debt (Maastricht definition)
% of GDP

Note: Ageing-related costs cover public expenditure related to pensions, healthcare, long-term care and education. Pension costs are net of social contributions. Cost estimates are those of the baseline scenario in the 2024 EC Ageing Report.
Source: EC Ageing Report (2024); OECD calculations
Number of public sector employees per 1000 inhabitants 2022 or latest

Note: The public sector is defined as general government in the national accounts. Source: OECD Databases on National accounts and Population
Structure of tax revenues % of GDP, 2023

Note: OECD is an unweighted cross-country average. Source: OECD Database on Revenue Statistics
VAT compliance gap
% of total tax liability, 2013 and 2022

Source: European Commission – VAT Gap in the EU (2024)

Change in the working-age population
Population aged 20 64 years, 2022 2050, %

Skills-related employment gap
2023, %

Note: Difference between the employment rate of workers with tertiary education and workers with lower secondary education or below.
Source: Eurostat
Absences from work due to illness
Number of days lost per person per year, 2022 or latest

Note: Absences from work due to illness are self-reported by survey respondents. Their rating of their health is subjective and can be affected by cultural factors.
Source: OECD Health at a Glance (2023)
Share of job vacancies over total employment %, 2023

Source: Statistics Lithuania, OECD
Labour productivity in market
Germany = 100

Note: Labour productivity is defined as value-added divided by hours worked by employees and self-employed workers. Market sectors correspond to the total economy less real-estate, public administration, education and health activities. Comparison based on chain-linked value added at 2017 prices and 2017 industrylevel purchasing power parities (PPPs).
Source: OECD Databases on National Accounts, Inklaar et al. (2023) for PPPs
of financially constrained firms %, 2023

Note: Credit constrained firms include those dissatisfied with the amount of finance obtained, those that sought external finance but did not receive it, and those that did not seek external finance because they thought borrowing costs would be too high, or they would be turned down.
Source: European Investment Bank Investment Survey (2024)
Gross expenditure on research and development % of GDP, 2022

Note: R&D stands for Research and Development. Source: OECD
Share of individuals with basic or above basic digital skills %, 2023

Source: Eurostat Database on Digital Economy and Society
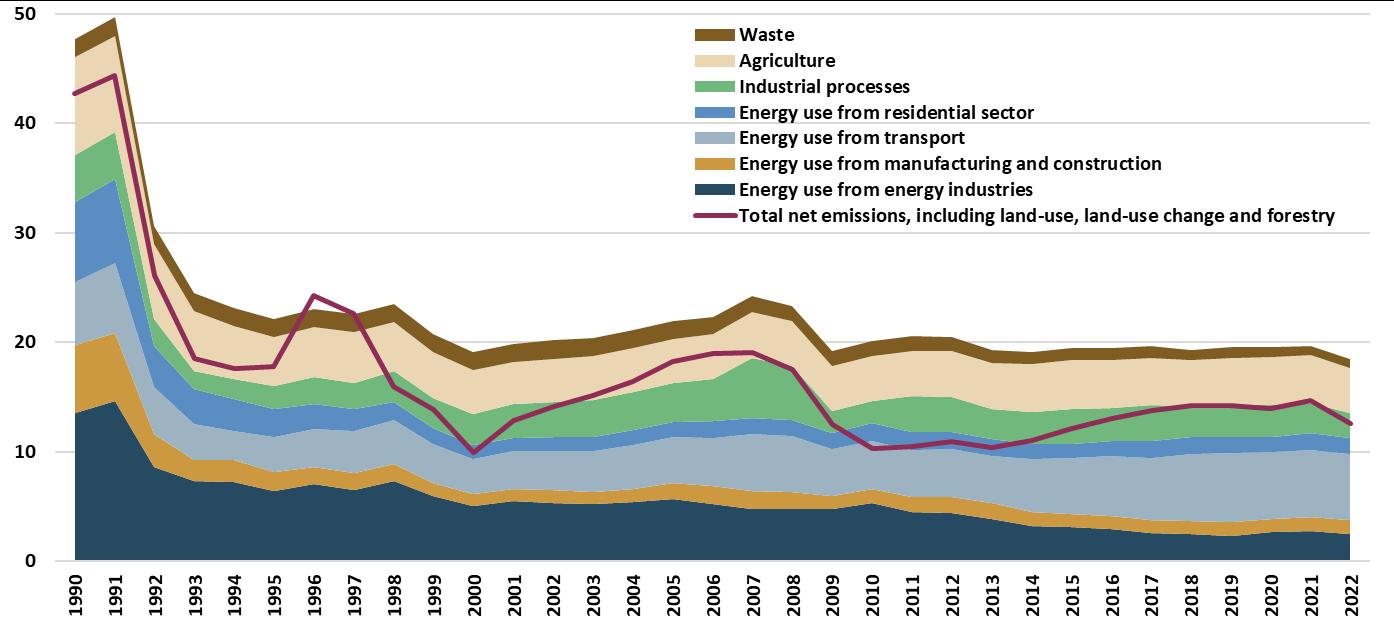
Developing renewable energy sources and curbing greenhouse gas emissions

Gross greenhouse gas (GHG) emissions
Million tonnes of CO2 equivalent
Required capital expenditure for electricity and heat generation plants % of GDP

Note: The capital expenditure considered here covers the construction of wind, solar, hydro, biomass, waste, hydrogen and nuclear power plants. EU and state budget projections are not available beyond 2027.
Source: “Roadmap scenario” in DNV EPSO-G (2023) Lithuania Energy System Transformation to 2050
Net effective carbon rates in energy use sectors EUR per ton of CO2 equivalent, 2023

Note: Net effective carbon rates measure carbon prices resulting from fuel excise duties, carbon taxed and emission trading systems, net of pre-tax fossil fuel support. OECD and EU are unweighted averages.
Source: OECD
Fiscal
Ageing
Rising ageing-related costs will require improving public spending efficiency, broadening the tax base and encouraging formal economic activity to ensure future fiscal sustainability.
The demographic shock calls for fostering the employment of older workers, improving health conditions, and immigration.
Productivity
Productivity
Green
transition
Deeper domestic capital markets, larger spending on research and development, and improved digital skills would bolster productivity.
Sufficient financing for renewable energy investments and lower transport emissions will be key to reach emission targets and improve energy security.
Disclaimers:


The statistical data for Israel are supplied by and under the responsibility of the relevant Israeli authorities. The use of such data by the OECD is without prejudice to the status of the Golan Heights, East Jerusalem and Israeli settlements in the West Bank under the terms of international law. This document and any map included herein are without prejudice to the status of or sovereignty over any territory, to the delimitation of international frontiers and boundaries and to the name of any territory, city or area.