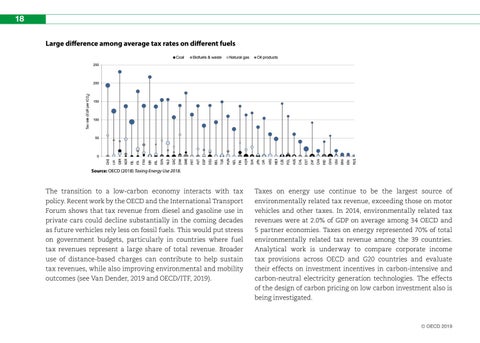
18 Large difference among average tax rates on different fuels Coal
Biofuels & waste
Natural gas
Oil products
250
Tax rate (EUR per tCO2)
200
150
100
IDN
RUS
BRA
USA
IND
CHN
CAN
ZAF
CHL
EST
AUS
CZE
MEX
POL
LVA
ARG
JPN
KOR
SVK
FIN
TUR
HUN
NZL
DEU
BEL
AUT
ESP
SWE
PRT
GRC
DNK
NLD
IRL
SVN
FRA
ITA
ISR
ISL
GBR
LUX
CHE
0
NOR
50
Source: OECD (2018) Taxing Energy Use 2018.
The transition to a low-carbon economy interacts with tax policy. Recent work by the OECD and the International Transport Forum shows that tax revenue from diesel and gasoline use in private cars could decline substantially in the coming decades as future verhicles rely less on fossil fuels. This would put stress on government budgets, particularly in countries where fuel tax revenues represent a large share of total revenue. Broader use of distance-based charges can contribute to help sustain tax revenues, while also improving environmental and mobility outcomes (see Van Dender, 2019 and OECD/ITF, 2019).
Taxes on energy use continue to be the largest source of environmentally related tax revenue, exceeding those on motor vehicles and other taxes. In 2014, environmentally related tax revenues were at 2.0% of GDP on average among 34 OECD and 5 partner economies. Taxes on energy represented 70% of total environmentally related tax revenue among the 39 countries. Analytical work is underway to compare corporate income tax provisions across OECD and G20 countries and evaluate their effects on investment incentives in carbon-intensive and carbon-neutral electricity generation technologies. The effects of the design of carbon pricing on low carbon investment also is being investigated.
Š OECD 2019