Science Highlights

1
Credit: Sheri White © WHOI
Researchers from around the globe are using OOI data to identify shortterm changes and long-term trends in the changing global ocean.

The Science Highlights included in this report were compiled from quarterly reports submitted by the Ocean Observatories Initiative to the National Science Foundation (NSF) from 20202022. They represent only a fraction of the scientific findings that are based on OOI data. A complete list of peerreviewed publications based on OOI data can be found here: https://ooipublications.whoi.edu/biblio
The images were taken during expeditions of the Ocean Observatories Initiative, a major facility fully funded by the NSF.
2
Credit: Sawyer Newman © WHOI
Table of Contents
Page 6: Southern Ocean Sea Ice Predictability
Page 9: Particle trajectories in an eastern boundary current using a regional ocean model at two horizontal resolutions
Page 12: An overview of ambient sound using Ocean Observatories Initiative hydrophones
Page 14: Collaborative Inter-Agency Mooring Expeditions
Page 16: Chlorophyll Enhancement at the Shelfbreak
Page 19: More Than Two Decades of Mooring and Ship-Based Observations from the Newport Hydrographic Line
Page 21: VISIONS'22 - Changing Students Lives
Page 23: Atlantic Water Influence on Glacier Retreat
Page 26: pH and pCO2 Time Series from Endurance Array
Page 28: RCA External Funding Since 2016
Page 31: Initiation of a Marine Heat Wave
Page 35: Observations of Cross-shelf Nitrate-Fluxes over the Oregon Continental Shelf

Page 37: Axial Seamount Continues to Reveal Its Secrets
Page 39: Evolution of a phytoplankton bloom
Page 42: Relationship between ocean ecosystem indicators and year class strength of an invasive European green crab
Page 44: The Eyes of an Artist Through the Eyes of an ROV
Page 47: A Case Study for Open Data Collaboration
Page 50: Open Source Jupyter Notebook Produces Quality Flags for pH Data
Page 53: A visualization tool to bring RCA data into the classroom
Page 55: Assimilative Model Assessment of Pioneer Array Data
Page 58: Bottom Boundary Layer Oxygen Fluxes During Winter on the Oregon Shelf
Page 60: Lava Explosions Nearly a Mile Beneath the Oceans’ Surface: Axial Seamount
Page 65: Multi-year Records of In-situ CO2 Flux from the OOI Coastal Arrays
Page 67: Low Dissolved Oxygen off Washington and Oregon Coast Impacted by Upwelling
Page 70: Real-Time Sonar Measurements of Hydrothermal Plume Emissions
Page 72: Buoy Wave Height Improves SAR Estimates
Page 79: Irminger Sea Intermediate Water Formation and Transport
Page 81: Event and Seasonal Scale Variability of Surface Heat and Momentum Fluxes
Page 84: One of the Longest Records for Tsunami Research in the Ocean
Page 86: Heat Flux and Water Mass Formation in the Southern Ocean
Page 88: Protocol for the Assessment and Correction of Surface Water and Air pCO2 Measurements
Page 91: Discovery of the Roots of Axial Seamount
Page 95: New Estimate of Boundary Current Transport
Page 97: Coastal and Global Profiler Mooring Analysis
Page 100: Understanding the Life of a Submarine Volcano: Axial Seamount
Page 104: Shelf Water Subduction and Cross-Shelf Exchange
Page 107: A Data Assimilative Reanalysis at the New England Shelf Pioneer Array
Page 110: Discovery of Axial Seamount Deep Melt-Mush Feeder Conduit
Page 76: Understanding Factors Controlling Seismic Activity Along the Cascadia Margin
Page 114: Long-Term Monitoring of Gas Emissions at Southern Hydrate Ridge
Page 117: A Three Stream Ocean Optics Model
Page 119: The Great Salinity Anomaly of 2015-2020
Page 122: Soundscape Ecology Through Automated Acoustic-Based Biodiversity Indices
Image Credit: M. Elend, University of Washington, V20.
CGSN: Southern Ocean Sea Ice Predictability
Forecasting Antarctic sea ice conditions, including specifics such as the position of the ice edge in the Southern Ocean, are substantial challenges. As a part of the Polar Prediction Project (https://www.polarprediction.net), there is a focus on improving coupled air-sea-ice prediction models and determining key sources of forecast errors. In a recent study, Cerovecki et al. (2022) show that sea ice forecast skill is linked to the accuracy of the surface forcing, and in particular, the net surface radiation. The goal of the study was to quantify errors that degrade the skill of Southern Ocean sea ice forecasts during the freezing season. They conclude that accurately modeling the surface downward longwave radiation (DLW) component of the net surface radiation is critical to sea ice prediction over the Southern Ocean.
The authors review prior results indicating that climate models have different behaviors in different seasons relative to ground truth. In spring and summer, the models overestimate the net surface radiation whereas in winter the models under-estimate the net longwave radiation. Recognizing that these issues relate to representations of cloud cover, which can be diagnosed using DLW, the authors also note that some models showed DLW biases of up to 100 W/m2 compared to ground truth. These results were based on comparisons at McMurdo Station, Antarctica, whereas the authors were interested in processes occurring near the ice edge where few direct observations are available.
7
The OOI Southern Ocean surface mooring provided a rare source of in-situ air-sea flux data for comparison. The study used DLW from the METBK instrument package on the OOI Southern Ocean buoy to compare with results from the ECMWF Interim reanalysis (ERAI), the ERA fifth-generation reanalysis (ERA5), and the NOAA National Centers for Environmental Prediction reanalysis (NCEP1). Despite some data gaps, the 1 min OOI METBK observations for Jan 2016 –Jan 2020, were critical to determining
The OOI Southern Ocean surface mooring provided a rare source of in-situ air-sea flux data for comparison. The study used DLW from the METBK instrument package on the OOI Southern Ocean buoy to compare with results from the ECMWF Interim reanalysis (ERAI), the ERA fifth-generation reanalysis (ERA5), and the NOAA National Centers for Environmental Prediction reanalysis (NCEP1). Despite some data gaps, the 1 min OOI METBK observations for Jan 2016 –Jan 2020, were critical to determining model biases. Hourly mean DLW data from the two METBK packages were averaged together to create the observational record.
Comparison of the observed monthly mean DLW with reanalysis output showed systematic underestimates by the models relative to the observations. The nature of the offsets is shown in Figure 28 – the reanalysis models do a relatively good job of capturing month to month
8
variability, but with a consistent low bias. The mean offsets range from -13 W/m2 for ERAI to -28 W/m2 for NCEP1. These biases are comparable to those diagnosed at McMurdo Station, and suggest that the ERA5 DLW radiation underestimate is of the order of 20–50 W/m2. This is consistent with the finding that coupled model forecast systems over-estimate sea ice growth. The authors conclude that a significant deficit in reanalysis DLW, related to the accuracy of cloud representation in the models, is a common problem over the Southern Ocean and impacts the skill of sea ice cover prediction. In particular, the ERA5 reanalysis may underestimate DLW by up to 50 W/m^2 during the during the freezing season. The OOI Southern Ocean data, from the furthest south sustained air-sea flux mooring, proved uniquely valuable in codifying these results.
Cerovecki, I, R. Sun, D.H. Bromwich, X. Zou, M.R. Mazloff and S -H.Wang (2022). Impact of downward longwave radiative deficits on Antarctic sea-ice extent predictability during the sea ice growth period. Environ. Res. Lett. 17 084008. DOI: /10.1088/1748-9326/ac7d66

9
EA: Particle trajectories in an eastern boundary current using a regional ocean model
To study the transport and dispersal of marine organisms during spawning, Wong-Ala et al. developed and applied a Lagrangian particle tracking (LPT) model to compare and contrast particle drift patterns during the spring transition off the Oregon coast. The studied the Oregon coast as it has distinct upwelling and downwelling regimes and variable shelf width. They contrasted years (2016–18) using Regional Ocean Modeling System (ROMS) with different horizontal spatial resolutions (2 km, 250 m). They found the finer spatial resolution model significantly increased retention along the Oregon coast. Particles in the 250 m ROMS were advected to depth at specific times and locations for each simulated year, coinciding with the location and timing of a strong and shallow alongshore undercurrent that is not present in the 2 km ROMS. Additionally, ageostrophic dynamics close to shore, in the bottom boundary layer, and around headlands not present in the coarser model emerged in the 250 m resolution model. They concluded that the higher horizontal model resolution and bathymetry generated well-resolved mesoscale and submesoscale features (e.g., surface, subsurface, and nearshore jet) that vary annually. These results have implications for modeling the dispersal, growth, and development of coastal organisms with dispersing early life stages.
10
*Wong-Ala is a PhD student at Oregon State University. She is a Pacific Islander.
J. A. T. K. Wong-Ala, Ciannelli, L., Durski, S. M., and Spitz, Y., Particle trajectories in an eastern boundary current using a regional ocean model at two horizontal resolutions, Journal of Marine Systems, vol. 233, p. 103757, 2022. https://doi.org/10.1016/j.jmarsys.2022.103757.

11
The model applied by Wong Ala assimilates satellite sea surface temperature and along-track altimetry. Model atmospheric forcing is from the NOAA North American Mesoscale Model (NAM). To validate their model, Wong-Ala et al., used OOI Endurance Array time series data from 2016 to 2018 from the Oregon inshore and shelf moorings (CE01ISSM and CE02SHSM).
They compared available OOI zonal and meridional velocities, temperature, and salinity to model output of these parameters for the month of April in each year when they ran their model (Figure 29). They found the modeled currents and temperature from the 250 m ROMS model closely follow the observed data from inshore and shelf moorings compared to the 2 km ROMS. The 250 m ROMS modeled currents and observed currents at the inshore mooring are similar for all three years (Figure 29). They also found that the 250 m ROMS modeled temperature and observed data are similar in 2017 at the inshore and shelf location. In April 2017 and 2018, the modeled temperature from the 250 m ROMS is about 1 °C cooler than the observed temperatures.
12
RCA: An overview of ambient sound using Ocean Observatories Initiative hydrophones

13
Ragland et al., (2022) provides a wonderful overview of the unique opportunities for data and experimentally driven advancements in acoustics that are provided by (long-term) ambient sound recordings streamed live from hydrophones on the Regional Cabled Array. Figure 30, above (after Figure 5, Ragland et al., 2022), highlights acoustic features from the five low frequency (Fs=200Hz) and six broadband (Fs = 64 kHz) hydrophones on the RCA. Areas of research span the rare ability to conduct offshore monitoring of Fin whale migration, and the seasonal fluctuations and decade-long evolution of their calls, in situ offshore meteorological measurements with high temporal resolution to study wind and rain noise in the NE Pacific, the sound from commercial ships with impacts on the oceanic environment and marine life, ambient noise interferometry, volcanic eruptions, and both local and far-field earthquakes. As the authors note, the RCA-OOI data also provide significant opportunities for the development of machine learning tools for ocean acoustics. This work was supported by an award from the Office of Navy Research. The authors developed a public Python package (OOIPy) to access and explore the hydrophone data more easily (Schwock et al., 2021). OOIPy is also accessible through the OOI website tab, Community Tools and Datasets.
Ragland, J., F. Schwock, M. Munson, and S. Abadi (2022) Journal of the Acoustic Society of America, 151, 2085-2100, https://doiorg/10.1121/10.0009836.
Schwock, F., J. Ragland, L. Setiawan, M. Munson, D. Volodin, and S., Abadi (2021). OOIPY v1.1.3: A Python toolbox designed to aid in the scientific analysis of Ocean Observatories Initiative data, https://doi:10.581/zenodo.5165389.
14
Station Papa: Collaborative InterAgency Mooring Expeditions
The Global Station Papa Array is located in the Gulf of Alaska next to the NOAA Pacific Marine Environmental Laboratory (PMEL) Surface Buoy. The region is extremely vulnerable to ocean acidification, has a productive fishery, and low eddy variability. It is impacted by the Pacific Decadal Oscillation and adds to a broader suite of OOI and other observatory sites in the Northeast Pacific.
NOAA’s surface mooring at Station Papa contributes yearround data to one of the oldest oceanic time series records dating from 1949-1981. Beginning in 2014, OOI has enhanced Station Papa with an array of subsurface moorings and glider measurements.
During the latest operation and maintenance expedition ( Station Papa 9) to OOI’s Global Station Papa, a team of ten scientists and engineers from the Coastal and Global Scale Nodes deployed six moorings – three for OOI, two for the National Oceanic and Atmospheric Administration, and one for the University of Washington. This type of inter-agency collaboration has strengthened since the beginning of OOI and will continue as a means to best share and use resources and expertise to enhance efficiencies in global ocean observations.
15

16
CGSN: Chlorophyll Enhancement at the Shelfbreak
The enhancement of chlorophyll due to phytoplankton blooms is recognized to occur near the frontal boundary of the New England Shelf, but the blooms are ephemeral and not consistently found in satellite remote sensing of ocean color. In a recent study, Oliver et al., (2021) show that enhanced surface chlorophyll concentrations at the shelfbreak are short lived events, and are associated with periods when a surface layer of lighter shelf water moves over denser slope water at the shelfbreak front. Both data and a computational model show that eastward, upwellingfavorable winds are the primary driver of the frontal restratification and localized enhanced surface chlorophyll.
The study used a variety of data sources, including MODIS satellite chlorophyll estimates, shipboard CTD casts from a Shelf-break Productivity Interdisciplinary Research Operation at the Pioneer Array (SPIROPA) cruise and a Pioneer mooring turn cruise, Pioneer glider density and chlorophyll, and atmospheric reanalysis winds after comparison with Pioneer surface mooring winds. A two-dimensional configuration of the Regional Ocean Model System (ROMS) coupled to a nitrogen-phytoplankton-zooplankton-detritus (NPZD) model was used to simulate the wind-driven response.
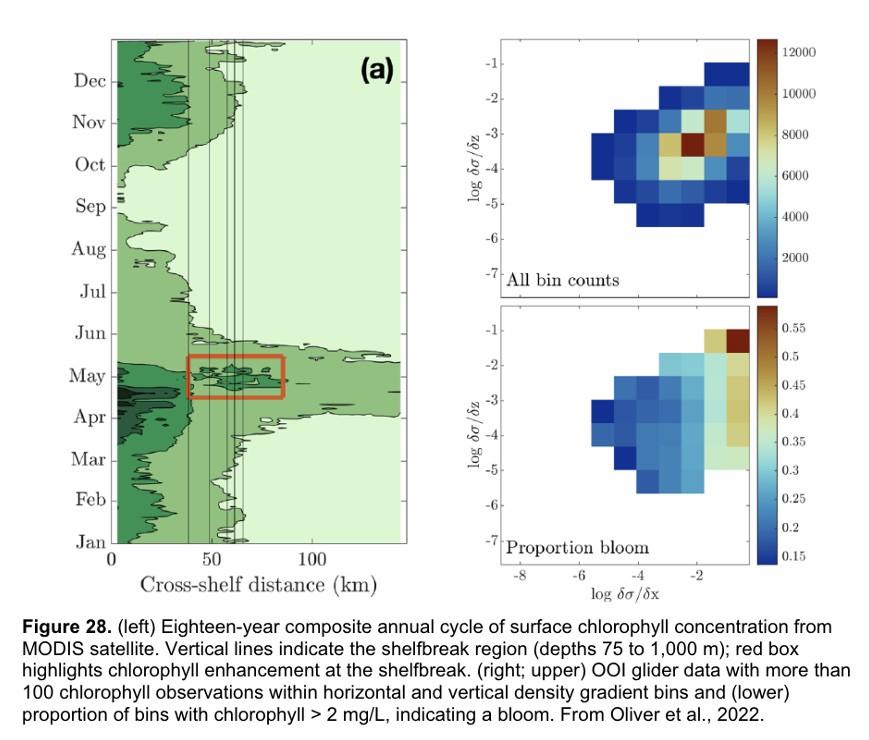
The eighteen-year time-evolution of the cross-shelf distribution of surface chlorophyll concentration from MODIS showed that shelf-break chlorophyll enhancements were
17
Oliver, H., Zhang, W.G., Archibald, K.M., Hirzel, A.J., Smith, W.O. Jr, Sosik, H.M., Stanley, R.H.F and D.J. McGillicuddy Jr (2022). Ephemeral surface chlorophyll enhancement at the New England shelf break driven by Ekman restratification. Journal of Geophysical Research: Oceans, 127, e2021JC017715. https://doi.org/10.1029/2021JC017715.
18
evident in most years, followed an inshore spring bloom in April, and were typically seen during a short period in the spring (mid-April – mid-May; Figure 28). For individual years, the shelf-break chlorophyll enhancements were short-lived, typically lasting less than a week. Pioneer Array glider data were used to explore the relationship between enhanced chlorophyll concentrations and both horizonal (assumed to be associated with the shelfbreak front) and vertical density gradients. Near surface (upper 30 m) chlorophyll concentrations were collected in logtransformed density gradient bins and then displayed according to the proportion of bins with chlorophyll > 2 mg/L, indicating a bloom. The “bloom bins” were associated with high horizontal density gradients and a range of vertical density gradients, indicating that frontal restratification is associated with enhanced chlorophyll at the shelfbreak (Figure 28).
The study concludes that enhanced surface chlorophyll events at the New England shelfbreak occur consistently in the spring, but are transient, lasting only a few days to a week, and thus not discernible in seasonal climatologies. Periods of enhanced chlorophyll are associated with strong horizontal density gradients and appear to be triggered by the increase in stratification resulting from wind-driven cross-shelf advection of less dense shelf water over denser slope water. This process creates a shallow mixed layer at the front which alleviates light limitation and supports transient surface enhancements of chlorophyll.
19
EA: More Than Two Decades of Observations from the Newport Hydrographic Line
In the Northern California Current System (NCCS), during spring and summer months, equatorward winds drive the upwelling of cold, nutrient-rich, and oxygen-poor waters from depth onto the shelf, fueling a highly productive marine ecosystem that supports valuable commercial fisheries. Oceanographic conditions in the NCCS vary on temporal scales from hours to decades. In contrast, grantfunded research typically consists of shorter-term studies (3-5 years). While such studies resolve intra-annual and perhaps inter-annual variability, they do not capture decadal scale variability that is critical for climate studies. Risien et al.(2022), present two new decadal-scale data products. The first is ~550 gridded, cross-shelf hydrographic sections of temperature, salinity, potential density, spiciness, and dissolved oxygen from data collected biweekly to monthly from March 1997 to present along the Newport Hydrographic Line (NHL; 44.6°N, 124.1–124.65°W) off Newport, Oregon, USA, mostly by NOAA programs. They also present monthly climatologies derived from these observations.
The second data product is 23 years (1999–2021) of mooring temperature, salinity and velocity data — collected by five programs (OSU-NOPP, GLOBEC, OrCOOS, NANOOS/CMOP, OOI) at NH-10 (44.6°N, 124.3°W), 10 nautical miles west of Newport, Oregon along the NHL — that they stitched together into one coherent, qualitycontrolled data set (see Figure 29).
20
Making available such multi-decadal data sets, which they plan to release via public repositories, is essential to enable scientists to characterize natural and anthropogenicallyforced variability; resolve cause-and-effect relationships in Earth’s climate and marine ecosystems at intra-seasonal, seasonal, inter-annual and decadal time scales; and verify climate models. These new gridded and concatenated data products show that long-term ocean observing efforts require multi-generational teams with a wide range of skills and a shared vision that is motivated by science and ocean monitoring needs.
Risien CM,. Fewings MR, Fisher JL, Cervantes BT,. Morgan CA, Barth JA, Kosro PM, Peterson JO, Peterson WT, and Levine MD (2022). Making Available More Than Two Decades of Mooring and Ship-Based Observations from the Newport Hydrographic Line, OT06-01, presented at Ocean Sciences Meeting,, 2022, Honolulu, HI (virtual), 4 Mar.

21
RCA: VISIONS'22 - Changing Students Lives

22
This year, 25 undergraduate students and three graduate students will participate on the Regional Cabled Array Operations and Maintenance cruise as part of the VISIONS'22 at-sea experiential learning program. They include students from the US, India, Saudi Arabia, France, and Kazakhstan. They represent a breadth of disciplines spanning Oceanography (11), Engineering (9: Mechanical, Industrial, Bioengineering, Environmental, and Aeronautics and Astronautics), Biology (6: Biology, Marine Biology, and Microbiology), Geology (1), and Policy Studies focused on ocean equity and the United Nations Convention (1). They will stand 4 hr on, 8 hr off watches in the ROPOS control center, learn how to conduct CTD casts and collect and process fluid samples, and work on deck. Three additional undergraduate student ambassadors, who have participated in past VISIONS' expeditions (1-3 years), will help mentor the students.
All will complete cruise blogs on the Interactiveoceans VISIONS'22 Expedition site, and science-engineering and/or engagement projects lasting 1 quarter to several years. Two students have already chosen projects involving advanced genetic analyses of vent animals and protists for their Senior Thesis in Oceanography. Based on discussions with past students and their blogs, for many this is a life changing experience. Note: two past VISIONS students are now APL engineers as part of the RCA team.
23
CGSN: Atlantic Water Influence on Glacier Retreat
The warming of Atlantic Water along Greenland’s southeast coast has been considered a potential driver of glacier retreat in recent decades. In particular, changes in Atlantic Water circulation may be related to periods of more rapid glacier retreat. Further investigation requires an understanding of the regional circulation. The nearshore East Greenland Coastal Current and the Irminger Current over the continental slope are relatively well studied, but their interactions with circulation further offshore are not clear, in part due to relatively sparse observations prior to establishing the OOI Irminger Sea Array and the Overturning in the Subpolar North Atlantic Program (OSNAP).
In a recent study (Snow et al., 2021) use in-situ mooring data to validate satellite SST records and then use the 19year satellite record to investigate relationships between glacier melt and Atlantic Water variability. In order to use the satellite records for this purpose, several adjustments must be made, including accounting for cloud and sea ice contamination, eliminating seasonally-varying diurnal biases, and removing the influence of air temperature. This adjusted satellite SST can be compared to in-situ mooring data during a portion of the record. A coastal mooring near the Sermilik Fjord mouth and the OOI Irminger Sea Array provide useful records during 2009-2013 and 2014-2018, respectively (Figure 24). An interesting aspect is that the temperature record from OOI Flanking Mooring A (FLMA) is
24
Snow, T., Straneo, F., Holte, J., Grigsby, S., Abdalati, W., & Scambos, T. (2021). More than skin deep: Sea surface temperature as a means of inferring
Atlantic Water variability on the southeast Greenland continental shelf near Helheim Glacier. J. Geophys. Res: Oceans, 126, e2020JC016509. https://doi.org/10.1029/2020JC016509.

25
useful for this purpose even though the measurements are at 180 m depth. This is because the upper ocean is relatively homogeneous in this region, and the mixed layer is deeper than 180 m during much of the year. The authors find that the adjusted satellite SST is consistent with the insitu records on monthly to interannual time scales (Figure 24). This provided the motivation to investigate relationships between the 19-year satellite record and glacier discharge rates.
The study concludes that warmer upper ocean temperatures as far offshore as the OOI Irminger Sea Array were concurrent with increased glacier retreat in the early 2000s, in support of the idea that Atlantic Water circulation plays a role. However, they also note that this influence is not direct, because of substantial variation in how Atlantic Water is diluted as it flows across the shelf towards Sermilik Fjord. The idea that time-varying dilution of Atlantic Water governs the temperature of water reaching the glacier was not previously understood, and resolving such small-scale, time-varying processes is a challenge for models. The authors conclude that with appropriate adjustments, “[satellite] SSTs show promise in application to a wide range of polar oceanography and glaciology questions” and that the method can be generalized to other glacier outflow systems in southeast Greenland to complement relatively sparse in-situ records.
26
EA: pH and pCO2 Time Series from the OOI Coastal Endurance Array
The Ocean Observatories Initiative (OOI) Endurance Array makes extensive measurements of collocated physical and biogeochemical parameters throughout the water column. At the recent Ocean Sciences meeting, we reported on moored measurements from 2015 to the present off Washington and Oregon. We focused on spatial and temporal variability of pH and pCO2 and compared the measurements to published values in the region. This information was also presented in a seminar at UC, Santa Cruz on 14 Jan 2022.
The quality-controlled biogeochemical time series are selfconsistent and in line with other regional measurements. For example, pH and pCO2 have significant onshoreoffshore variation and along-shelf differences north and south of the Columbia River. This variability is related to the Columbia River plume, the strength of local upwelling, and mixing with offshore waters. On a seasonal scale, pH and pCO2 is also driven by summer upwelling and winter river inputs. Variability is highest in spring and summer. pCO2 values greatly exceed atmospheric values (~400 μatm) at times in the summer (Figure 25). The highest monthly pCO2 averages are seen at the Oregon shelf site.
27
Dever et al. (2022), pH and pC02 Time Series from the Ocean Observatories Initiative Endurance Array, CBP05, presented at Ocean Sciences Meeting 2022, Honolulu, HI (virtual), 01 Mar 2022.
Fassbender et al. (2018), Earth Syst. Sci. Data, 10, 1367–1401, 2018 https://doi.org/10.5194/essd-10-1367-2018.

28
RCA: External Funding Since 2016
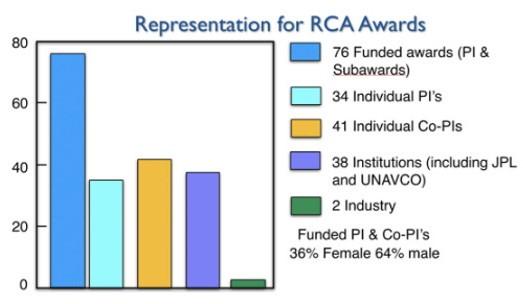
The National Science Foundation, in 2016, began to allow external users to submit proposals to add infrastructure onto the OOI arrays, as well as data research, and education-focused efforts. Since that time, 76 awards have been made to Principal Investigators (PI’s) (N=44) and CoPI’s (N=32) centered on the Regional Cabled Array, including numerous field programs. Regional Cabled Array externally funded programs are from a diverse portfolio that includes the NSF, the Office of Navy Research, the National Aeronautics and Space Administration, the Bureau of Ocean Energy Management, and a several year international award from Germany through the Federal Ministry of Education

29
and Research. The recipient scientists, engineers, and educators include 34 individual PI’s and 41 Co-Pi’s from 38 institutions, including the Jet Propulsion Lab and the University NAVSTAR Consortium (UNAVCO).
NSF awards have been through OCE Geology, Biology, Chemistry, and Education and Ocean Technology and Interdisciplinary Coordination, as well as Earth Cube and include EAGER, RAPID, and Early Career awards. Three awards involve industry partnerships. Representation includes 64% male and 36% female awardees.
30
Two recent NSF awards are the first of their kind: 1) The first community Distributed Acoustic Sensing (DAS) ocean experiment using this emergent transformational technology (OCE 214107) “RAPID: A Community Test of Distributed Acoustic Sensing on the Ocean Observatories Initiative Regional Cabled Array;” and 2) the first cabled and uncabled acoustic array on an active volcano (Axial Seamount) (OCE 2130060) “An Acoustic Array at Axial Seamount for Geodesy and Autonomous Vehicle Support”. This array includes a four-station acoustic network with temperature, pressure, and velocimeter instruments to be installed this summer inside the caldera and on top of the caldera walls, as well as a smart cable connected to a RCA junction box hosting an internal pressure sensor for transmission of data live to shore. The horizontal strain measurements enabled by the acoustic network will aide in determining the relative roles of magma chamber inflation and deflation and motion on buried faults beneath the caldera walls. This network forms the foundation to demonstrate and optimize remote communication and navigation of AUVs, an essential step toward the deployment of remotely operated AUVs that can capture future eruptions.
31
CGSN: Initiation of a Marine Heat Wave
Marine heat waves are sustained, anomalous ocean warming events with significant regional extent. In some cases, these heat waves are driven by heating from the atmosphere (doi:10.1002/2014JC010547). In new work (Chen et al. 2022), it is shown that ocean processes can also be responsible for marine heat waves. In this case, the presence of anomalously high temperatures on the New England shelf was detected by CTD observations made by commercial fishing vessels (doi:10.1146/annurev-marine010318-095201). The fishing vessel CTD data indicated that the heat wave was a “compound event”, i.e. one with large anomalies in both temperature and salinity. Because atmospheric heating would drive only a temperature anomaly, and because the Gulf Stream derived slope water offshore of the New England shelf is high in both temperature and salinity, it was surmised that this heat wave was driven by ocean advection.
The authors used data from Pioneer Array profiler moorings (PMUI and PMCI) to support this ocean advection hypothesis. Salinity records (Figure 22) show high salinity events in Nov/Dec 2016 and Jan 2017. The salinity anomalies are indicative of slope water (S > 34.5), are most intense at the bottom, and are more pronounced further offshore. This is consistent with a bottom intensified intrusion of warm, salty slope water onto the shelf to initiate the heat wave observed by the fishing fleet CTDs in January of 2017.
32
Further investigation was done to understand the crossshelf exchange process, which presumably originated at the shelfbreak and penetrated large distances onshore as a bottom intrusion. The principal tool for the additional analysis was a new high-resolution regional model. The model was able to reproduce major features including shelf water properties, the shelf break front, and warm-core rings in the slope sea. Critically, the model showed the presence of cyclonic eddies (opposite in rotation, thinner and smaller than the warm core rings) that were responsible for shelf break front, and warm-core rings in the slope sea. Critically, the model showed the presence of cyclonic eddies (opposite in rotation, thinner and smaller than the warm core rings) that were responsible for driving cross-shelf flow and intensifying the front. The authors argue that these processes precondition the outer shelf by bringing warm salty water to the shelf break, i.e. roughly the 100 m isobath.
Another step is necessary to produce the dramatic, bottom intensified intrusion of warm salty water to ~50 m depth, as seen in January 2017. Further examination of the model, including runs with and without wind forcing, indicated that persistent upwelling-favorable winds along with topographic effects were the additional ingredients necessary to cause the dramatic intrusion. Although some onshore penetration results from the standard “two-dimensional” wind-driven upwelling, the authors found that details of the threedimensional regional topography were critical to extensive slope water penetration in the form of a warm, salty, bottom-intensified tongue.
33
Identifying the unusually strong intrusion and finding the hints to a slope-sea origin shows the importance of sustained observing, in this case from both the Pioneer Array and the fishing fleet.
Unraveling this remarkable, multi-step process, with preconditioning by small-scale cyclonic eddies followed by a topographically-controlled, wind driven response, is a testament to the power of high-resolution models to fill in dynamical gaps in the observing systems.

34
Chen, K., Gawarkiewicz, G., & Yang, J. (2022). Mesoscale and submesoscale shelf-ocean exchanges initialize an advective Marine Heatwave. Journal of Geophysical Research: Oceans, 127, e2021JC017927.
https://doi.org/10.1029/2021JC017927.
Snow, T., Straneo, F., Holte, J., Grigsby, S., Abdalati, W., & Scambos, T. (2021). More than skin deep: Sea surface temperature as a means of inferring Atlantic Water variability on the southeast Greenland continental shelf near Helheim Glacier. J. Geophys. Res: Oceans, 126, e2020JC016509.
https://doi.org/10.1029/2020JC016509.
35
The authors note that “this study provides dynamical explanations of the observed water mass 62 anomalies across the shelf, offers new insights about cross-shelf exchange... and lays the ground work for future studies.”
EA: Observations of Cross-shelf Nitrate Fluxes over the Oregon Continental Shelf
Andrew Scherer is an undergraduate physics student at Cleveland State Univ. In the summer 2021, he performed the following research with Prof. Tom Connolly (MLML, SJSU) on an NSF REU and presented it at the Eastern Pacific Ocean Conference (EPOC) Stanford Sierra Center, Fallen Leaf Lake, California 26-29 Sep 2021.
The US Pacific Northwest coastal ecosystems are primarily limited in growth from nitrate supply. The nitrate supply that drives the highly productive marine growth in this region is primarily a result of wind driven coastal upwelling. This work seeks to investigate cross-shelf nitrate fluxes over the continental shelf off the coast of Oregon following the installation of new nitrate and Acoustic Doppler current profilers (ADCPs) in the Ocean Observatories Initiative (OOI) Endurance Array. The primary onshore flow of nitrate-rich water over the continental shelf is found to originate at the middle depths, consistent with previous research in the region. However, the upwelling and cross-shelf nitrate fluxes on the continental shelf are found to be in poor agreement with common upwelling indices, e.g., coastal upwelling transport index (CUTI) and biologically effective upwelling transport index (BEUTI).
36
Several factors for this disagreement are proposed, including the focus of the indices on dynamics farther offshore of the continental shelf. Observed coastal wind stress, calculated on a weekly rolling average, is found to be a potential alternative for predicting nearshore nitrate concentrations. Farther offshore at the mid-shelf, only a weak correlation between observed wind stress and observed surface transport is found, suggesting the need for additional dynamics to fully explain the observed surface transport and nitrate fluxes. Correctly modelling the nitrate supply for coastal ecosystems is essential for predicting phytoplankton blooms that are vital to the production of fisheries on the coast. Thus, understanding these limitations is of great importance for ocean-driven coastal economies.
Andrew Scherer, California State University, Monterey Bay and Cleveland State University; Thomas Connolly, Moss Landing Marine Laboratories, San José State University

37
RCA: Axial Seamount Continues to Reveal Its Secrets
Axial Seamount is the longest monitored mid-ocean ridge volcano, providing new insights into the relationships among magma supply, uplift-deflation behavior, and seismicity leading to and follow eruptions. Results are as summarized here from a new comprehensive publication by Chadwick et al., 2021. The magma supply rate changes significantly over periods of months to years. Since the 2015 eruption, the summit of the volcano has been slowly inflating at a decreasing rate. This slow rate is punctuated by eight discrete short-term deflation events occurring over 1-3 weeks, approximately every 4-6 months from August 2016 to May 2019. These events are co-registered with an abrupt decrease in seismic activity: seismic activity does not pick up until reinflation resumed.
In contrast, the long-term monitoring indicates there was a significant increase in magma supply between 2011 and 2015, resulting in the two eruptions. Although the summit of the volcano has inflated 85%-90% of its pre 2015 eruption level, geodetic monitoring with coupled seismometers and cabled and uncabled pressure sensors suggests that the magma supply rate has been waning since the 2015, pushing the forecast for the next eruption out 4-9 years. Deformation and seismic activity are tightly coupled, showing an exponential increase in seismic activity per unit of
38
uplift since the 2015 eruption. A significant conclusion from this study is that the transition from an exponential to linear increase in seismic activity to total uplift may indicate impending crustal failure between the shallow magma chamber and the seafloor. In concert, these results will lead to more refined forecasting of this highly active volcano and testing of hypotheses concerning short-term deflation events.

Geodetic Monitoring at Axial Seamount Since Its 2015 Eruption
Reveals a Waning Magma Supply and Tightly Linked Rates of Deformation and Seismicity. Geochemistry, Geophysics, Geosystems, 23, e2021GC010153. https://doi.org/10.1029/2021GC010153
.
39
Chadwick, WW, Jr., Wilcock WSD, Nooner SL, Beeson JW, Sawyer AM, Lau, T-K ((2021).
CGSN: Evolution of a phytoplankton bloom
A phytoplankton bloom dominated by the species Phaeocystis pouchetii was detected on the New England Shelf during the first Shelfbreak Productivity
Interdisciplinary Research Operation at the Pioneer Array (SPIROPA) cruise in April 2018. Phaeocystis blooms are of interest because they alter water column chemistry (by releasing dimethyl sulfide into the surface layer) and influence food web dynamics (due to interactions with zooplankton grazers). The extent to which Phaeocystis is important to annual primary production on the New England Shelf is not well known, and there are relatively few case studies from which the interplay between physical conditions and the phytoplankton bloom can be determined.
The authors used in-situ data from the SPIROPA cruise and from the New England Shelf Long-Term Ecological Research (NES-LTER) project, both conducted in the vicinity of the Pioneer Array. The LTER data were collected as an ancillary activity during the Pioneer-10 mooring service cruise. Insitu measurement products included phytoplankton abundance, net primary productivity, net community production, zooplankton abundance, microzooplankton grazing, and particulate matter concentrations. Long term records of Phaeocystis abundance from the Martha’s Vineyard Coastal Observatory (MVCO) were used to provide historical context.
40
Satellite imagery showed that during February and March of 2018 the surface manifestation of the bloom was concentrated in Vineyard Sound and over Nantucket Shoals (Figure 27b-c). During late April, a dramatic surface filament of enhanced chlorophyll was seen extending to the southwest, intersecting the Pioneer Array and the SPIROPA cruise sampling region (Figure 27d). By mid-May the surface signature of the bloom was gone (Figure 27f). SPIROPA shipboard data indicated high concentration of Phaeocystis throughout the water column on 23-24 April but confined to a near-bottom layer by 27-28 April.

41
The authors used meteorological data from the Pioneer Offshore surface mooring to develop a hypothesis for bloom evolution: During February and March, the bloom was enhanced over Nantucket Shoals while being held there by the persistent tidal mixing front. A period of sustained northwesterly winds during 18-22 April caused the surface layer, and the phytoplankton within it, to be advected to the southwest. Once the surface layer was detached from the vigorous tidal mixing over the shoals, nutrients were depleted. Particles then sank into the bottom boundary layer where they were detected in late April.
This fascinating case study draws on data from three long-term observing systems (OOI, LTER and MVCO) to enhance the analysis of, and provide context for, a process study focused on primary productivity over the New England continental shelf. It is gratifying to see the convergence of these efforts and will be exciting to see such work continue.
Smith, W.O., W.G. Zhang, A. Hirzel, R.M. Stanley, M.G. Meyer, H. Sosik, et al, 2021. A regional, early spring bloom of Phaeocystis pouchetii on the New England continental shelf. J. Geophys Res., Oceans, 126, e2020JC016856. https://doi.org/10.1029/2020JC016856.
42
EA:
Relationship between
ocean
ecosystem indicators and year class strength of an invasive European green crab
The annual abundance of the non-native European green crab, Carcinus maenas, in Oregon estuaries varies greatly with ocean conditions. Behrens Yamada et al. (2021) find the year class strength of young crabs is strongly linked to ocean indicators during their planktonic larval development. Among the best indicators for green crab year class strength are winter water temperatures, the sign of the Pacific Decadal Oscillation index, the day of physical and biological spring transitions, and negative biomass anomalies of northern copepods.
These correlations suggest that green crabs need (1) warm winters (temperature > 10°C), which enable larvae to complete their development in the nearshore, (2) strong northward flow of coastal waters during winter, which allows larvae to be transported from established populations to the south and (3) coastal circulation patterns that keep larvae close to shore, where they can be carried by wind and tidal currents into estuaries to settle. Behrens Yamada et al., analyzed data over 22 years from 1998-2019.
43
A key to their analysis was long-term records maintained over the Oregon shelf by a variety of programs including the Ocean Observatories Initiative (OOI). Over their analysis years, exceptionally strong year class strength was reported in 2018-2019. During these years, most of the ocean conditions described above were moderate, yet green crab recruitment was very high. The factor most strongly related to the high recruitment was stronger than average northward flow as observed at the OOI Endurance Array Oregon shelf mooring (CE02SHSM) (Figure 28).
Behrens Yamada, S, JL Fisher, and PM Kosro (2021) Relationship between ocean ecosystem indicators and year class strength of the invasive European green crab (Carcinus maenas). Prog. Ocean. 196 (2021) 102618. https://doi.org/10.1016/j.pocean.2021.102618.

44
RCA: The Eyes of an Artist Through the Eyes of an ROV: VISIONS’21
Catherine Gill

45
Only the most fortunate of artists get to participate in such a unique and exciting experience, that of creating artwork aboard a research vessel. As a student member of the science party aboard the R/V Thompson during this year’s University of Washington (UW) VISIONS’21 cruise, I was able not only to learn ocean science alongside research scientists and engineers, but to paint and sketch for Legs 3 & 4 of the 37-day cruise.
My own artist eyes, those of an outdoor painter of land-based Northwest landscape, were introduced to a striking array of new shapes, colors, and textures. As an Oceanography student at the UW, I learned how to work with research scientists, to work in the labs conducting analysis of samples collected from the seafloor and to be part of this new community. The ROV Jason, with its many cameras, served as my new set of remote eyes on the seafloor and introduced me to a new type of landscape: that of the deep ocean, hydrothermal vents, deep sea biology, lava flowsshapes and colors that I have never even dreamed of.
I spent my shipboard time participating in two daily four-hour shifts in the control van that monitors all the ROVs cameras and activities. I became acquainted with the engineering necessary to get the ROV
46
off the ship and lowered down to the seafloor to depths in excess of 2500 meters. I was awed by how many engineers and crew were needed to do this, at all hours of the day and night, and all weather.
Jason was not just my new eyes, but also a transport, and a scientific tool. The ocean floor astounded me with its color and texture and mystery. Aside from the data, and the actual shapes of what was before my eyes, there was an atmosphere of such silence and tranquility in this deep-down environment. What I felt was as important as what I saw. A feeling of reverence, respect, and awe for this beautiful, unique, and complex world - this feeling was always what I came away with, and what steered all the marks that I made as I sketched and painted. What is the role of all this unknown, extreme, and ancient world so far down from my human world? And how much of our world community has yet to know of it, be excited and awed by it, and contemplate how it relates to our planet and other worlds?
I am now excited and inspired by this new expanded version of landscape, that of the deep sea, as well as by the science of it. I’m eager to share this way of seeing and feeling about new worlds. In my own role as artist and educator, I am energized to create new artwork that will communicate both the visual world of shapes, colors, and textures, as well as the emotional world of this deep-sea environment, and its impact to inspire and involve our community.
47
CGSN: A Case Study for Open Data Collaboration
Recognizing that freely accessible ocean observatory data has the potential to democratize interdisciplinary science for early career researchers, Levine et al. (2020) set out to demonstrate this capability using the Ocean Observatories Initiative. Publicly available data from the OOI Pioneer Array moorings were used, and members of the OOI Early Career Scientist Community of Practice (OOI-ECS) collaborated in the study.

48
A case study was constructed to evaluate the impact of strong surface forcing events on surface and subsurface oceanographic conditions over the New England Shelf. Data from meteorological sensors on the Pioneer surface moorings, along with data from interdisciplinary sensors on the Pioneer profiler moorings, were used. Strong surface forcing was defined by anomalously low sea level pressure – less than three times the standard deviation of data from May 2015 – August 2018. Twenty-eight events were identified in the full record. Eight events in 2018 were selected for further analysis, and two of those were reported in the study (Figure 24).
The impact of surface forcing on subsurface conditions was evaluated using profile data near local noon on the day of the event, as well as 48 hr before and after (Figure 24). Subsurface data revealed a shallow (40-60 m) salinity intrusion prior to the 16 November event, which dissipated during the event, presumably by vertical mixing and concurrent with increases in dissolved oxygen and decreases in colored dissolved organic matter (CDOM). At the onset of the 27 November event, nearly constant temperature, salinity, dissolved oxygen and CDOM to depths of 60 m were seen, suggesting strong vertical mixing. Data from multiple moorings allowed the investigators to determine that the response to the first event was spatially variable, with indications of slope water of Gulf Stream origin impinging on the shelf. The response to the second event was more spatially-uniform, and was influenced by the advection of colder, fresher and more oxygenated water from the north.
49
The authors note that the case study shows the potential to address various interdisciplinary oceanographic processes, including across- and alongshelf dynamics, biochemical interactions, and air-sea interactions resulting from strong storms. They also note that long-term coastal datasets with multidisciplinary observations are relatively few, so that the Pioneer Array data allows hypothesis-driven research into topics such as the climatology of the shelfbreak region, seasonal variability of Gulf Stream meanders and warm-core rings, the influence of extreme events on shelf biogeochemical response, and the influence of a warming climate on shelf exchange.
In the context of the OOI-ECS, the authors note that the study was successfully completed using open-source data across institutional and geographic boundaries, within a resource-limited environment. Interpretation of results required multiple subject matter experts in different disciplines, and the OOI-ECS was seen as wellsuited to “team science” using an integrative, collaborative and interdisciplinary approach.
Levine, RM, KE Fogaren, JE Rudzin, CJ Russoniello, DC Soule, and JM Whitaker (2020) Open Data, Collaborative Working Platforms, and Interdisciplinary Collaboration: Building an Early Career Scientist Community of Practice to Leverage Ocean Observatories Initiative Data to Address Critical Questions in Marine Science. Front. Mar. Sci. 7:593512. doi : 10.3389/fmars.2020.593512.
50
EA: Open Source Jupyter Notebook
Produces Quality Flags for pH Data
OOI uses the SAMI2-pH sensor from Sunburst Sensors, LLC to measure seawater pH throughout the different arrays. Assessing the data quality from this instrument is an involved process as there are multiple parameters produced by the instrument that are then used to calculate the seawater pH. These measurements are subject to different sources of error, and those errors can propagate through the calculations to create an erroneous seawater pH value. Based upon the vendor documentation and MATLAB code Sunburst provides to convert the raw measurements, OOI data team members have created a set of rules from those different measurements to flag the pH data as either pass, suspect or fail.
The resulting flags can be used to remove failed data from further analysis. They can also be used to help generate annotations for further Human in the Loop (HITL) QC checks of the data to help refine quality metrics for the data. OOI team member, Chris Wingard (OSU), has written up the QC process as a Python Jupyter notebook. This notebook and other example notebooks are freely available to the scientific community via the OOI GitHub site (within the OOI Data Team Python toolbox accessed from https://oceanobservatories.org/community-tools/).
51
In this notebook, Wingard shows how the quality rules can be used to remove bad pH data from a time series, and how they can be used to then create annotations. The impact of using these flags is shown with a set of before and after plots of the seawater pH as a function of temperature. The quality-controlled data can then be used to estimate the seasonal cycle of pH to set climatological quality control flags.
Here an example is shown using data from a pH sensor on the Oregon Inshore Surface Mooring (CE01ISSM) near surface instrument frame (NSIF), deployed at 7 m depth (site depth is 25 m).

52
Evans, W., B. Hales, and P. G. Strutton (2011), Seasonal cycle of surface ocean pCO2on the Oregon shelf, J. Geophys. Res., 116, C05012, doi:10.1029/2010JC006625.

53
RCA: Seismic Hazards Around the Globe: A visualization tool to bring RCA

data into the classroom
As part of the continuing UW engagement effort, and in preparation for the new NSF K12 education award focused on bringing OOI data into the classroom, Kelley collaborated with the Center for Environmental Visualization within the School of Oceanography to generate an earthquake exploration tool focused on seismic events within the global oceans from 1970 to present. We anticipate that one of the curriculum modules developed for the K12 program will be
54
will be focused on geohazards, with an emphasis on the Cascadia Subduction Zone within the context of the “ring of fire.” A video of this animation is hosted on interactive oceans and a direct link to the developmental site is provided above. The animation will be used in a Queens College physical geology class this next year that has 150 students (Dr. Dax Soule). This effort is also in preparation for completing a similar visualization focused on Axial Seamount and Regional Cabled Array seismic data.
The data sets used for this effort include a map centered on the Pacific Ocean that shows the distribution of earthquakes of magnitude ≥6 in the U.S. Geological Survey catalog from 1970 through 2021. The topographic dataset is licensed under Creative Commons CC BY-4.0. The data were formatted to match the JSON format recommended for use of global visualization using the ‘Cesium’ interactive virtual earth viewer promoted within its 3D geospatial visualization for the web toolset. The Cesium JavaScript API was utilized to implement algorithms for procedural color determination based on magnitude and hypocenter point radius animation based on the date-time of the earthquake event. The resultant animation is highly interactive, allowing the user to choose a 3D global view or a flat view, and viewing speeds of 1-8 times. In addition, the field of view can be changed to move to a specific area of interest and includes zoom capabilities. A sliding time bar allows the user to focus in on particular items of interest.
55
CGSN: Assimilative Model Assessment of Pioneer Array Data
Among the goals of the Pioneer Array were to improve understanding of shelf-slope exchange processes and to inform ocean modeling efforts. Recent work by Julia Levin and colleagues (2020; 2021) explored the impact of Pioneer Array observations on high-resolution modeling, with several interesting conclusions.
The Regional Ocean Modeling System (ROMS) was used in conjunction with a data assimilation scheme known as 4-dimensional variation (4D-Var) – a method of minimizing the error between the output of the model and the observations which the model is meant to predict. ROMS was run for three nested grids (Figure 22) and constrained at the outermost boundaries by data from a global ocean analysis with regional adjustments. Atmospheric forcing was from the NCEP North American Mesoscale model.
Among the detailed analyses undertaken in this two-part study was quantification of the impact of observations on the reduction of RMS error for estimates of the volume transport across an along-front transect (Figure 22). Temperature and salinity data from moorings and gliders were impactful for the larger grids (G1, G2). As the grid resolution was increased (G3), submesoscale motions were resolved and velocity data from the moorings
56
Levin J., H.G. Arango, B. Laughlin, E. Hunter, J. Wilkin, and A.M. Moore, 2020. Observation impacts on the Mid-Atlantic Bight front and cross-shelf transport in 4D-Var ocean state estimates: Part I – Multiplatform analysis, Ocean Modeling, 156, 101721, 1-17, doi 10.1016/j.ocemod.2020.101721.
Levin J., H.G. Arango, B. Laughlin, E. Hunter, J. Wilkin, and A.M. Moore, 2021. Observation impacts on the Mid-Atlantic Bight front and cross-shelf transport in 4D-Var ocean stateestimates: Part II – The Pioneer Array, Ocean Modeling, 157, 101731, 1-17, doi 10.1016/j.ocemod.2020.101731.

57
became more important for reduction of error variance. An analysis of the sensitivity of shelf-slope exchange indices (e.g. volume transport) to removal of an observation, compared to the direct impact of the observation, showed that the majority of observed variables (e.g., SST, SSH, T, S, U, V) were “synergistic” –providing value to the assimilation through their connection with other variables as represented in the model dynamics.
For the highest resolution estimates (G3 grid), the Pioneer Array observing assets were more impactful than other observations (e.g., remote sensing, NDBC and IOOS buoys) in reducing uncertainty, with velocity data being the major contributor. This is not a complete surprise, since the Pioneer Array was “tuned” to these scales. Still, it is gratifying to see that the impact on model fidelity is quantifiable.
The two-part study undertaken by Levin et al. provides a wealth of additional information about the performance of assimilative models as well as the utility of in-situ observations for modeling and prediction. As the authors state, they have “just begun to scratch the surface” of approaches that can be applied to the assessment of model performance as well as the management of observing systems.
58
EA: Bottom Boundary Layer
Oxygen Fluxes During Winter on the Oregon Shelf
The oceanic bottom boundary layer (BBL) is the portion of the water column close to the seafloor where water motions and properties are influenced significantly by the seabed. This study examines conditions in the BBL in winter on the Oregon shelf. Dynamic rates of sediment oxygen consumption (explicitly oxygen fluxes) are derived from high-frequency, near-seafloor measurements made at water depths of 30 and 80m. The strong back-and-forth motions of waves, which in winter form sand ripples, pump oxygen into surface sediments, and contribute to the generation of turbulence in the BBL, were found to have primed the seabed for higher oxygen uptake rates than observed previously, in summer.
Since oxygen is used primarily in biological reactions that also consume organic matter, the winter rates of oxygen utilization indicate that sources of organic matter are retained in, or introduced to, the BBL throughout the year. These findings counter former descriptions of this ecosystem as one where organic matter is largely transported off the shelf during winter. This new understanding highlights the importance of adding variable rates of local seafloor oxygen consumption and organic carbon retention, with circulation and stratification conditions, into model predictions of the seasonal cycle of oxygen.
59
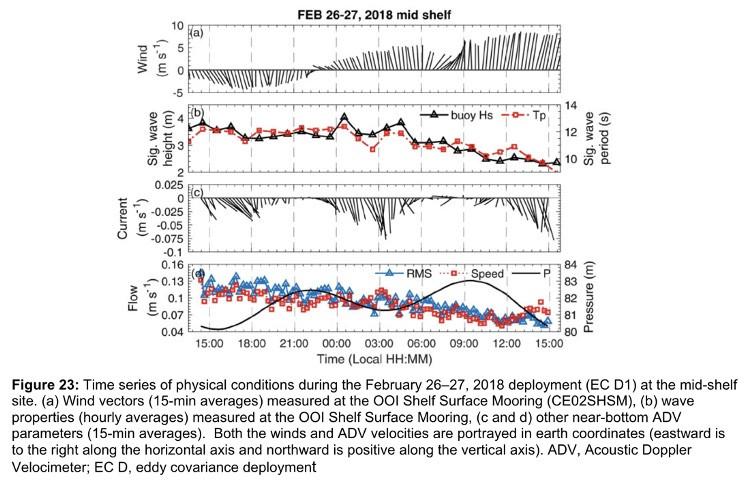
Supporting observations, which give environmental context for the benthic eddy covariance (EC) oxygen flux measurements, include data from instruments contained in OOI’s Benthic Experiment Package and Shelf Surface Moorings. Specifically, velocity profile time-series are drawn from records of a 300-kHz Velocity Profiler (Teledyne RDI-Workhorse Monitor), near-seabed water properties from CTD (SBE 16plusV2) and oxygen (Aanderaa-Optode 4831) sensors, winds from the surface buoy’s bulk meteorological package, and surface-wave data products from a directional wave sensor (AXYS Technologies) (see e.g., Figure 23 below).
Reimers, C. E., & Fogaren, K. E. (2021). Bottom boundary layer oxygen fluxes during winter on the Oregon shelf. Journal of Geophysical Research: Oceans, 126, e2020JC016828. https://doi.org/10.1029/2020JC016828.

60
.
RCA: Lava Explosions Nearly a Mile Beneath the Oceans’ Surface
Axial Seamount is a rare, “well-behaved” submarine volcano yielding the ability to forecast the next eruption based on inflation and seismicity relationships [1]. The April 24, 2015 eruption of Axial (Figure 24) was a spectacular event marked by a seismic crisis of >8000 earthquakes over a 24-hour period (Figure 24B) [2], coincident with a drop in the seafloor of 2.45 m [1]. The resultant lava flow on the northern rift reached 127 m in thickness (Figure 24A & D), the summit of which was covered by acres of microbes supported by nutrient-rich fluids emanating from the cooling lava flow [3-5]. I n total, 1.48 X 10 m3 of lava was erupted onto the seafloor [4].
Figure 24: A) Summit and northern rift zone on Axial Seamount showing location of the 2011 (purple-brown colored flow with delineating thickness) and 2015 flows that extend along the northern rift zone (red outline). Also shown is the location of RCA infrastructure.
Bathymetry courtesy of D. Caress and D. Clague, MBARI. B) location of earthquakes (blue dots) and water born impulsive events interpreted to result from explosions on April 26, 2015 (Courtesy W. Wilcock) and location of seismometers (yellow-orange dots) and Primary node PN1B. C) Diffusive broadband and punctuated signals recorded by the RCA hydrophone at the Central Caldera site on May 2, 2015 [6, Figure 9].
61
D) Breached pillow basalt on the toe of the 127 m thick northern flow (UW/NSF-OOI/CSSF V15). E) Ash deposit on the bottom pressure-tilt instrument at Central Caldera three months after the eruption (UW/NSF-OOI/CSSF V15).
F) Fountaining of lava during an eruption of Kilauea volcano, Hawaii (courtesy of USGS). Perhaps, one of the most stunning events, however - if one could have witnessed the eruption live - may have been the fountaining of lava near the eastern caldera wall [6].

62
Caplan-Auerbach et al., [6], postulate that a submarine eruption similar in style to a Hawaiian ash eruption occurred during the 2015 event based on analyses of continuous Regional Cabled Array hydrophone data (Figure 35C). Unlike the punctuated, water-borne impulsive acoustic signals that delineated >30,000 explosive events (Figure 24B &C) [2], prolonged diffusive broadband signals were detected over an ~ 20day period in May (Figure 24C) [6]. Caplan-Auerbach notes that these signals are reminiscent of those recorded during degassing and tephra production at the NW Rota-1 and West Mata submarine volcanoes in the Marianas and Lau Basin systems, respectively.
The authors propose that the eruption of lava within the caldera and along the northern rift, resulted in the decompression of deeper-sourced, gas-rich magma and exsolution of gasses that had collected beneath the magma chamber roof. Primary magmas beneath Axial Seamount contain extremely high concentrations of CO2 [7] and have been linked to pyroclastic (ash) deposits at Axial containing Pele’s hair and limu o Pele [8].
These deposits have been attributed to implosion of gas-rich bubbles causing fragmentation and phreatic eruptions with transport of ash into eruption plumes [8]. The prolonged diffusive signals correlate well with a uniform increase in water temperature within the caldera that lasted for 40 days [6 & 9]. This increase has been hypothesized to
63
reflect the release of heat during Hawaiian style explosive activity [6] or effusion of dense, warm brines stored in the subsurface [9]. Three months after the 2015 eruption, an ash deposit was observed on an RCA bottom-pressure tilt recorder at the Central Caldera site (Figure 24A & E), ~ 1 km away from the single flow in the caldera that reached a thickness of 13 m [10].
The addition of three NSF-funded CTD’s (PI W. Chadwick, OSU) within the caldera are providing new information about near bottom fluids with a focus on the next eruption. NSF funding (PI’s Manalang and Kelley, UW) directed at testing of a recently developed ADCP, at the Central Caldera site in 2021, through an RCA-Teledyne Marine partnership, with full water column imaging capabilities, may provide a new technology for the community to quantify syn-eruptive plume behavior [10] (e.g. enhanced hydrothermal flow and megaplume development), energy flux, and ash dispersion processes [11].
[1] Nooner, S.L., and Chadwick, W.W., Jr. (2016) Inflation-predictable behavior and co-eruption deformation at Axial Seamount. Science, 354, 1399-1403.
[2] Wilcock, W.S.D., Tolstoy, M., Waldhouser, F., Garcia, C., Tan Y.J, Bohnenstiehl, D.R., Caplan-Auerbach, J., Dziak, R.P., Arnulf, A.F., and Mann, M.E. (2016) Seismic constraints on caldera dynamics from the 2015 Axial Seamount eruption. Science, 354, 1395-1899.
[3] Kelley, D.S., Delaney, J.R., Chadwick, W., Philip, B.T., and Merle, S.G. (2015) Axial Seamount eruption: A 127 m thick, microbially-covered lava flow. American Geophysical Union, Fall Meeting, 2015, OS41B-08.
[4] Chadwick, W.W., Jr., Paduan, J.B., Clague, D.A., Dryer, B.M., Merle, S.G., Bobbitt, A.M., Caress, D.W., Philip, B.T. and Nooner, S.L. (2016) Voluminous eruption from a zoned magma body after an increase in supply rate at Axial Seamount. Geophysical Research Letters, 43, 12,063-12,070.
64
[5] Spietz, R.L., Butterfield, D.A., Buck, N.J., Larson, B.I., Chadwick, W.W., Jr., Walker, S.L., Kelley, D.S., and Morris, R.M, (2018) Deep-sea volcanic eruptions create unique chemical and biological linkages between the subsurface lithosphere and the oceanic hydrosphere. Oceanography, 31, 129-135.
[6] Caplan-Auerbach, J., Dziak, R.P., Haxel, J., Bohnenstiehl, D.R., and Garcia, S. (2017) Explosive processes during the 2015 eruption of Axial Seamount, as recorded by seafloor hydrophones. Geochemistry, Geophysics, Geosystems, 18, 1761-1774.
[7] Helo, C., Longpre, M-A., Schmizu, N., Clague, D.A. and Stix, J. (2011) Explosive eruptions at mid-ocean ridges driven by CO2-rich magmas. Nature Geoscience, 4, 260-263.
[8] Portner, R.A., Clague, D.A., Helo, C., Dreyer, B.M., and Pauduan, J.B. (2015) Contrasting styles of deep-marine pyroclastic eruptions revealed from Axial Seamount push core records. Earth and Planetary Science Letters, 423, 2015-2019.
[9] Xu. G. Chadwick, W.W. Jr., Wilcock, W.S.D., Bemis, K.G., and Delaney, J. (2018) Observation and modeling of hydrothermal response to the eruption at Axial Seamount, Northeast Pacific. Geochemistry, Geophysics, Geosystems, 19, 2780-2797.
[10] Baker, E.T., Walker, S.L., Chadwick, W.W., Jr., Butterfield, D.A., Buck, N.J., and Resing, J.A. (2018) Post-eruption enhancement of hydrothermal activity: A 33-year, multi-eruption time series at Axial Seamount (Juan de Fuca Ridge). Geochemistry, Geophysics, Geosystems, 20, 814-828.
[11] Pleger, S.S. and Ferguson, D.J. (2021) Rapid heat discharge during deep-sea eruptions generates megaplumes and disperses tephra. Nature preprint in review, https://doi.org/10.31223/osf.io/hy9ej.
65
CGSN: Multi-year Records of Insitu CO2 Flux from the OOI Coastal Arrays
In the summer of 2020 the Rutgers University Ocean Data Labs project https://datalab.marine.rutgers.edu/ worked with the Rutgers Research Internships in Ocean Science (RIOS) to support ten undergraduate students in a virtual Research Experiences for Undergraduates (REU) program. Two weeks of research methods training and Python coding instruction was followed by six weeks of independent study with a research mentor.
A poster by Velasco, Eveleth and Thorson (ED004-0045) analyzed pCO2 data from the Endurance Array offshore mooring. Three years of nearly continuous data were available during 2016-2018. The seasonal cycle showed that the pCO2 concentration in water was relatively stable and near equilibrium with the air in winter, decreasing in late spring and summer (Figure 23. Shortterm minima in summer were as low as 150 uatm. Like the east coast, the mean air-sea CO2 flux was consistently negative, meaning the coastal ocean acts as a carbon sink. The annual means at the 58 Washington Offshore mooring for 2016, 2017 were -1.9 and -2.1 mol C/(m2 yr), respectively. The seasonal cycle appears to be strongly driven by non-thermal factors (on short time scales), presumably upwelling events and algal blooms.
66
These studies, although preliminary, are among the first to use multi-year records of in-situ CO2 flux from the OOI coastal arrays, and to our knowledge the first to compare such records between the east and west coast. Dr. Eveleth’s team intends to use the rich, complementary data set available from the OOI coastal arrays to investigate the mechanisms controlling variability and role of biological vs physical drivers.

67
EA: Low Dissolved Oxygen off
Washington and Oregon Coast Impacted by Upwelling
In the summer of 2020, the Rutgers University Ocean Data Labs project https://datalab.marine.rutgers.edu/ worked with the Rutgers Research Internships in Ocean Science (RIOS) to support ten undergraduate students in a virtual Research Experiences for Undergraduates (REU) program. Rutgers led two weeks of research methods training and Python coding instruction. This was followed by six weeks of independent study with one of 13 research mentors.
Dr. Tom Connolly (Moss Landing Marine Labs, San Jose State Univ.) advised Andrea Selkow from Austin College (TX) on her study of dissolved oxygen (DO) off the Washington and Oregon coasts using the OOI Endurance Array.
Selkow evaluated DO data from Endurance Array Surface Moorings during 2017 and 2018. She presented this work as a poster at the conclusion of her summer REU. Selkow focused on the question: Are there similarities in the dissolved oxygen concentrations off the coast of Oregon and Washington during a known low oxygen event? She also considered why there might exist differences based on the spatial variability of wind stress forcing, i.e., do the strong Oregon winds cause dissolved oxygen concentrations to be lower at the Oregon mooring compared to the Washington moorings. Finally, she reviewed the data and tried to answer whether the oxygen data were accurate or affected by biofouling.
68
She used datasets from the OR and WA Inshore Shelf Mooring timeseries and WA Shelf Mooring timeseries from Endurance Array. Her focus was on the seafloor data because that is where the lowest oxygen concentrations were expected to be observed. Selkow focused her attention on low DO observed in the summer of 2017. While Barth et al. (2018) presented a report on these data for one event in July 2017, she expanded the analysis to include the Washington shelf and inshore moorings. She plotted time series data and used cruise data to validate these time series. While overall seasonal trends in DO were similar, she found dissolved oxygen is routinely more quickly depleted off the coast of Oregon than Washington

69
during a low oxygen event (Figure 24). She also looked at the cross-shelf variability in DO time series and found dissolved oxygen is more quickly depleted at the shelf mooring than at the inshore shelf mooring. Upwelling is known to drive the low oxygen events and she inferred that the weaker southward winds over the Washington shelf may be why DO decreases at a slower rate off Washington than Oregon.
While overall seasonal trends in DO were similar, she found dissolved oxygen is routinely more quickly depleted off the coast of Oregon than Washington during a low oxygen event (Figure 24). She also looked at the crossshelf variability in DO time series and found dissolved oxygen is more quickly depleted at the shelf mooring than at the inshore shelf mooring. Upwelling is known to drive the low oxygen events and she inferred that the weaker southward winds over the Washington shelf may be why DO decreases at a slower rate off Washington than Oregon.
Barth, J.A., J.P. Fram, E.P. Dever, C.M. Risien, C.E. Wingard, R.W. Collier, and T.D. Kearney. 2018. Warm blobs, low-oxygen events, and an eclipse: The Ocean Observatories Initiative Endurance Array captures them all. Oceanography 31(1):90–97, https://doi.org/10.5670/oceanog.2018.114.
Selkow, A. and T. Connelly. Low Dissolved Oxygen off Washington and Oregon Coast Impacted by Upwelling in 2017, https://datalab.marine.rutgers.edu/wp-content/uploads/2020/07/AndreaREU2020-P oster.pdf
, Accessed 13 Jan 2021.
70

Seamount
71
RCA: First Science Results from PI Cabled Instruments at Axial
Real-Time Sonar Measurements of Hydrothermal Plume Emissions
The Cabled Observatory Vent Imaging Sonar (COVIS) was installed on the OOI RCA in the ASHES hydrothermal field (Figure 25 a-c) at the summit of Axial Seamount in 2018, resulting in the first long-term, quantitative monitoring of plume emissions (Xu et al., 2020). The sonar provides 3dimensional backscatter images of buoyant plumes above the actively venting ‘Inferno’ and ‘Mushroom’ edifices, and two-dimensional maps of diffuse flow at temporal frequencies of 15 and 2 minutes, respectively. Sonar data coupled with in-situ thermal measurements document significant changes in plume variations (Figure 25 d-f) and modeling results indicate a heat flux of 10 MW for the Inferno plume (Xu et al., 2020). COVIS will provide key data to the community investigating the impacts of eruptions on hydrothermal flow at this highly active volcano.
[1] Xu, G., Bemis, K., Jackson, D., and Ivakin, A., (2020) Acoustic and in-situ observations of deep seafloor hydrothermal discharge: OOI Cabled Array ASHES vent field case study. Earth and Space Science, doi: 10.1029/2020EA001269. Note: This project was funded by the National Science Foundation through an award to PI Dr. K. Bemis, Rutgers University - “Collaborative Research: Heat flow mapping and quantification at ASHES hydrothermal vent field using an observatory imaging sonar (#1736702). COVIS data are available through oceanobservatories.org.
72
CGSN: Buoy Wave Height
Improves SAR Estimates
Synthetic Aperture Radar (SAR) sensors on satellites measure backscatter from the ocean surface and can be used to estimate wave height at very high spatial resolution (~10 m) relative to satellite altimetry. Two Sentinel-1 satellites of the European Space Agency (ESA) collected SAR measurements of the ocean surface from 2015-2018, together covering the entire globe every six days. Data-driven approaches to predicting significant wave height (Hs) from SAR have either used relatively limited in-situ data sets or used a wave model (e.g. WaveWatch-3) as the “training” data for a deep learning approach. Quach et al. (2020, doi : 10.1109/TGRS.2020.3003839) improve on previous approaches to

73
estimation of Hs from SAR by creating a comprehensive insitu observational record. They compiled data from the US National Data Buoy Center and Coastal Data Information Program, Canadian Marine Environmental Data Services, the international OceanSITES project, and the OOI. Surface wave data sets from the OOI Irminger Sea, Argentine Basin and Southern Ocean surface buoys were used. The authors note the importance of the Southern Ocean Array, where “many of the largest wave heights are recorded... [from] an under sampled region of the ocean”.
The comprehensive in-situ data set is split into separate training and validation segments. When SAR Hs from training data are compared to altimeter Hs from the validation segment, the deep learning algorithm shows rootmean-square (RMS) error of 0.3 m, a 50% improvement relative to prior approaches. Comparison with the buoy validation segment (Fig. 18) shows RMS error of 0.5 m. The authors attribute the increased error to the larger number of extreme sea states in the observations and the relative paucity of extremes in the training data.
Observational sea state information is critical for understanding surface wave phenomena (generation, propagation and decay), predicting wave amplitudes, and estimating extreme sea states. Thus, the improvement in RMS error using the deep learning technique notable. The availability of in-situ data from extreme environments such as those sampled by the OOI Irminger Sea and Southern Ocean Arrays are key to validation of these new approaches.
74
EA: Five Years of Offshore Profiler
Mooring Data
Risien et al. (2020) presented over five years of observations from the OOI Washington offshore profiling mooring. First deployed in 2014, the Washington offshore profiler mooring is on the continental slope about 65 km west of Westport, WA. Its wire Following Profiler samples the water column from 30 m depth down to 500 m, ascending and descending three to four times per day. Traveling at approximately 25 cm/s, the profiler carries physical (temperature, salinity, pressure, and velocity) and biochemical (photosynthetically active radiation, chlorophyll, colored dissolved organic matter fluorescence, optical backscatter, and dissolved oxygen) sensors. The data presented included more than 12,000 profiles. These data were processed using a newly developed Matlab toolbox.
The observations resolve biochemical processes such as carbon export and dissolved oxygen variability in the deep source waters of the Northern California Upwelling System. Within the Northern California Current System, over the slope there is a large-scale north-south variation in temperature and salinity (T/S). Regional T/S variability can be understood as a mixing between warmer, more saline Pacific Equatorial Water (PEW) to the south, and fresher, colder Pacific Subarctic Upper Water (PSUW) to the north. Preliminary results show significant interannual variability of
75
T/S water properties between 100-250 meters. In summer, interannual T/S variability is larger than the mean seasonal cycle (see Fig. 19). While summer T/S variability is greatest on the interannual scale, T/S does covary on a seasonal scale with dissolved Oxygen (DO), spiciness and Particulate Organic Carbon (POC). In particular, warmer, more saline water is associated with lower DO in fall and winter.
Risien, C.M., R.A. Desiderio, L.W. Juranek, and J.P. Fram (2020), Sustained, High-Resolution Profiler Observations from the Washington Continental Slope , Abstract [IS43A-05] presented at Ocean Sciences Meeting 2020, San Diego, CA, 17-21 Feb.
Thomson, R. E., and Krassovski, M. V. (2010), Poleward reach of the California Undercurrent extension, J. Geophys. Res., 115, C09027, doi:10.1029/2010JC006280.

76
RCA: Understanding Factors Controlling Seismic Activity Along the Cascadia Margin
The Cascadia Subduction Zone extends from northern California to British Columbia. It has experienced magnitude 9 megathrust events with a reoccurrence rate of every ~500 years over the past 10,000 years [5] and large earthquakes at intervals of ~ 200-1200 years [6] . The last Cascadia megathrust rupture occurred on January 26, 1700 [5]. When the next event occurs, it is estimated that financial losses would be ~ $60 billion USD with substantial loss of life. Hence, there is significant research focused on understanding seismic processes along this ~ 1100 km subduction zone, the generation of slow earthquakes, and causes of variation in seismicity along strike.
Understanding the factors that control seismic events was/is a major driver in the siting of OOI-RCA core geophysical instrumentation on the southern line of the Regional Cabled Array: the RCA is one of the few places in the world where seismic-focused instrumentation occurs on both the down-going tectonic plate and on the overlying margin. The offshore network is especially valuable in determining earthquake source depths that inform on interpolate dynamics [1]. The central section of the Cascadia Margin is the only area that experiences repeat, measurable shallow crustal earthquakes [1-3]. RCA data flowing from the seismic
77
network at Slope Base and Southern Hydrate Ridge, and from the Cascadia Initiative are providing new insights into factors controlling seismicity along this portion of the margin [1,4] (note because the RCA broadband seismometers are buried, they have lower noise levels at higher frequencies than the Cascadia Initiative instruments [1]).

78
Most recently, Morton et al., [4] examined data from the Cascadia Initiative [7] and the RCA. Shallow earthquakes are focused in the area of a subducted seamount [1-3] and another cluster to the north (Fig. 20b and c). Based on earthquake locations, they suggest that subduction of the seamount produces stress heterogeneities, faulting, fracturing of the overriding Siletz terrane (old oceanic crust) (Fig. 20b), and fluid movement promoting seismic swarms. Because this area is the only seismically active area along the Cascadia margin, it is an optimal area to examine the impacts of local earthquakes on, for example, gas hydrate deposits and fluid expulsion.
[1] Tréhu, A.M., Wilcock, W.S.D., Hilmo, R., Bodin, P., Connolly, J., Roland, E.C., and Braunmiller, R., (2018) The role of the Ocean Observatories Initiative in Monitoring the offshore earthquake activity of the Cascadia Subduction Zone. Oceanography, 31, 104-113.
[2] Tréhu, A.M., Blakely, R.J., and Williams, M., (2012) Subducted seamounts and recent earthquakes beneath the central Cascadia Forearc. Geology, 40, 103-106.
[3] Tréhu, A.M., Braunmiller, J., and Davis, E., (2015) Seismicity of the Central Cascadia Continental Margin near 44.5° N: a decadal view. Seismological Research Letters, 86, 819829.
[4] Morton, Bilek, S.L., and Rowe, C.A. (2018) Newly detected earthquakes in the Cascadia subduction zone linked to seamount subduction and deformed upper plate. Geology, 46, 943-946.
[5] Satake, K.Shimazaki, K., Tsuji, Y., and Ueda, K., (1996) Time and size of a giant earthquake in Cascadia inferred from Japanese tsunami records of January 1700. Nature, 379, 246-249.
[6] Goldfinger, C., Nelson, C.H., Eriksson, E., et al., (2012) Turbidite event history: Methods and implications for Holocene paleoseismicity of the Cascadia Subduction Zone. US Geological Survey Professional Paper (1661-F), 184 pp.
[7] Toomey, D.R., Allen, R.M., Barclay, A.H., Bell, S.W., Bromirski, P.D. et al., (2014) The Cascadia Initiative: A sea change in seismological studies of subduction zones. Oceanography, 27, 138-150.
79
58
CGSN: Irminger Sea Intermediate Water Formation and Transport
A two-year record from moorings in the Irminger Sea allowed researchers (Le Bras et al., 2020, doi: 10.1029/2019GL085989) to investigate both deep convection and transport of water masses associated with the Atlantic overturning circulation. Using mooring data from the OOI Irminger Sea Array and the Overturning in the Subpolar North Atlantic

80
(OSNAP) array, the authors were able to identify two types of Irminger Sea Intermediate Water (ISIW) formed by deep convection. Upper ISIW is found near the edge of the Irminger Sea western boundary current, whereas Deep ISIW is formed in the basin interior. Water masses were diagnosed using temperature-salinity properties and the planetary potential vorticity (PPV), . Figure 19 shows PPV for three different locations, in the boundary current, at its edge, and in the Irminger Sea gyre. Black lines in the figure indicate the isopycnals that bound upper and deep ISIW as defined by the authors, the red contours enclose water with low PPV (indicative of convection) and the green lines indicate the mixed layer depth.
Seasonal pulses of low PPV water in the boundary current occurring below the mixed layer (Figure 19a) suggest subduction from a non-local source offshore. In contrast, low PPV water in the gyre interior is accompanied by a deep winter mixed layer and appears related to local convection. Further analysis by the authors indicates that waters formed by convection in the interior gyre are entrained into the boundary current within a few months of formation. Importantly, it appears that eddy dynamics are responsible for this transport of ventilated water from the interior to the boundary, and that the upper ISIW in the boundary current is a significant component of the Atlantic overturning circulation.
81
EA: Event and Seasonal Scale
Variability of Surface Heat and Momentum Fluxes
As part of the NSF-funded Ocean Observatories Initiative (OOI) Coastal and Global Scale Arrays, surface buoy meteorological measurements are made using the Air-Sea Interaction Meteorology (ASIMET) package (Figure 20). These measurements are reported on in Dever, E.P, J.P. Fram, C.M. Risien, R.A. Desiderio, C.E. Wingard (2020), Event and Seasonal Scale Variability of Surface Heat and Momentum Fluxes off Oregon and Washington, Abstract [A144A-2411] presented at Ocean Sciences Meeting 2020, San Diego, CA, 17-21 Feb.
Radiative and bulk surface fluxes calculated from these measurements are provided as OOI data products. Both the measurements and the estimated fluxes are available through the OOI Data Portal as are all the metadata required to produce these fluxes (raw data, calibration coefficients, data product specifications, data product algorithms etc.).
82
Monthly averages of OOI Endurance Array flux data compare well with one another. Both the Oregon and Washington shelves are subject to heating on an annually averaged basis. The Oregon Shelf mooring (Figure 21) is typical. Late fall and winter show net fluxes from the ocean to the atmosphere. All other months show heat flux into the ocean due to insolation.


83
On the Endurance Array, ASIMET measurements are made at four locations over the Oregon and Washington shelf and slope. These locations lie within the northern California Current Marine Ecosystem. Here upwelling favorable wind forcing and atmospheric conditions occur in spring and summer months with forcing in other months driven by passing low pressure systems. The timing of both the spring transition to upwelling and the fall transition to storm forcing varies from year to year as does the strength of individual events within each season. Upwelling events are associated with strong net shortwave and latent heat fluxes. Storm events are associated with weak net shortwave fluxes and latent fluxes that vary in strength.
Machine to machine (M2M) calls were used to read in hourly bulk surface fluxes from OOI Endurance Array moorings from their initial deployments in April 2015 through February 2020. OOI data product fluxes are calculated with TOGA-COARE and other community standard algorithms.
84
RCA: One of the Longest Records for Tsunami Research in the Ocean
This study by Fine et al., [1] examines a 32-year record of high resolution bottom pressure recorder (BPR) measurements made by cabled instruments installed on Axial Seamount in 2014, and uncabled instruments at Axial, the Cleft Segment of the Juan de Fuca Ridge, DART buoys, and an IODP cored observatory (Hole 1026): most of the measurements in this study are from Axial (Figure 22). A total of 41 tsunamis were documented from 1986-2018 with all events associated with tsunamigenic earthquakes with magnitudes of 7.0 or greater. In contrast to coastal tide gauge observations, open ocean measurements by BPRs are advantageous because of the high signal-to-noise ratio. Based on this study, it is possible to forecast the effect of a tsunami originating from a source near a historical source, not only for Axial, but also for locations along the British Columbia-Washington-Oregon coast. These results allow a size-frequency model world-wide. The RCA cabled bottom pressure-tilt instruments, with 20 Hz sampling rates and with resolutions of 2 mm of seawater depth, provide especially high-resolution measurements.

85
[1] Fine, I.V., Thomson, R.E., Chadwick, W.W., Jr., and Fox, C.G., (2020) Toward a universal frequency occurrence distribution for tsunamis: statistical analyses of a 32-year bottom pressure record at Axial Seamount. Geophysical Research Letter, https://doi.org/10.1029/2020GL087372
86
CGSN: Heat Flux and Water Mass Formation in the Southern Ocean
A recent study (Tamsitt et al., 2020, doi: 10.1175/JCLI-D19-0653.1) compares surface heat fluxes from the OOI Southern Ocean surface mooring and the Southern Ocean Flux Station (SOFS) in the southeast Indian Ocean. Wintertime surface heat loss is the primary driver for Subantarctic Mode Water (SAMW) formation, but there are few direct observations of heat fluxes. These two moorings provide the first concurrent, multiyear time series of air–sea fluxes from two key SAMW formation regions. It is found that both sites are dominated by transient heat loss events in austral winter, and those events tend to be stronger at the SOFS site than at OOI. There is large interannual variability in the cumulative ocean heat loss at both locations.
The study also highlights the importance of sustained observations. It is found that heat loss events at the OOI site are associated with a single atmospheric regime (cold air from the south), whereas the SOFS site is impacted by two regimes. This differs from early results, using just the first year of observations from SOFS, which found only one atmospheric regime, analogous to that at the OOI site, dominated heat loss. It is suggested that the proximity of the SOFS site to the
87
Australian continent leads to frequent strong latent heat loss events when drier air is advected over the region from the northwest, whereas at the OOI site air from the northwest is warm and moist, rarely leading to ocean heat loss. This result has implications for the role of episodic heat loss and SAMW formation on longer time scales, as different heat loss regimes may respond differently to climate variability.

88
EA: Protocol for the Assessment and Correction of Surface Water and Air pCO2 Measurements
As part of the Endurance Array, surface buoy partial pressure CO2 (pCO2) measurements are made using the Pro-Oceanus CO2-Pro Atmosphere pCO2 sensor. This sensor measures the partial pressure of CO2 gas in both surface water and air, allowing for surface flux calculations. Both the air and water measurements, and the flux estimates, are available through the OOI Data Portal (https:// ooinet.oceanobservatories.org).
Wingard et al. (2020) reported on the surface water and air pCO2 data returned for the first four years of Endurance Array operations and described a protocol based on cross-comparisons to independent, shipboard (both CTD samples and underway flow-thru systems) pCO2 measurements, data available from the LamontDoherty Earth Observatory (LDEO) V2018 pCO2 database (Takahashi et al., 2019), data from the NOAA Earth System Research Laboratory (ESRL) Global Monitoring Division (GMD) Carbon Cycle Greenhouse Gases (CCGG) data repositories (NOAA ESRL Global Monitoring Division, 2016), and a high-resolution monthly pCO2 climatology for the coastal ocean (Laruelle et al., 2017).
89

90
Use of independent sources of pCO2 data, such as the discrete sample data and the LDEO V2018 database, are critical to validating the surface water pCO2 measurements. The overlapping deployment structure employed by OOI (newly refurbished and calibrated instruments deployed next to older instruments) provides an additional means to validate the surface water and air pCO2 measurements (see Fig 13).
The comparison shows overall quality of the surface water pCO2 measurements collected by the OOI Endurance Array is very high. Beyond a simple smoothing filter and application of human in the loop flags, no further corrections are required to the data. OOI Endurance Array data provide a novel source of high-resolution (hourly), near-continuous surface water pCO2 measurements in the coastal regions off the Oregon and Washington coasts. While there are multiple gaps in the air pCO2 measurements (greater than 33% of the total record), the potential exists for the creation of a common, combined daily averaged air pCO2 record that could help to address these gaps.
This assessment gives confidence to the data on the portal as well as the export of OOI Endurance Array data via the NANOOS Visualization System (NVS, http://nvs.nanoos.org/) and the Global Ocean Acidification Observing System Data Portal (GOA-ON, http://portal.goa-on.org/).
91
RCA: Discovery of the Roots of Axial
Two- and 3D-imaging of Axial Seamount, coupled with realtime monitoring of seismicity and seafloor deformation, is providing unprecedented insights into submarine volcanism, the nature of melt transport, and caldera dynamics (Figure 14) [1-15]. Recently acquired 3D imaging of the volcano [2] and analyses of 1999 and 2002 multichannel seismic data [4-7] have led to the remarkable discovery of a root zone 6 km beneath the volcano [2,5]. Carbotte et al., [5] describe a 3-to-5 km wide conduit that is interpreted to be comprised of numerous quasi-horizontal melt lenses spaced 400-500 m apart. The conduit is located beneath a 14-km-long magma reservoir

92
Seamount
(MMR) that spans the caldera of Axial Seamount and a secondary, smaller magma chamber (SMR) located beneath the eastern flank of the volcano [1,3]. This smaller reservoir presumably Dymond hydrothermal field hosting up to 60 m-tall actively venting chimneys, which was discovered on a 2011 RCA cruise.
Seismicity prior to, during and subsequent to the 2015 eruption delineates outward dipping normal faults in the southern half of the caldera that extend from near the seafloor to 3-3.25 km depth [3,8-9]. In contrast, a conjugate set of inward dipping faults in the northern portion of the caldera extend to depths of ~ 2.25 km. The outward dipping ring faults were active during inflation and syn-eruptive deformation [[3,8-9]. Source fissures for the 1998, 2011, and 2015 eruptions are located within ± 1 km of where the MMR roof is shallowest (<1.6 km beneath the seafloor) and skewed toward the eastern caldera wall [3]. In concert, these studies are changing long-held views of magma chamber geometry and the deep-rooted feeder systems in mid-ocean ridge environments [2,5].
93
[1] Arnulf, A. F., Harding, A. J., Kent, G. M., Carbotte, S. M., Canales, J. P., and Nedimovic, M. R. (2014) Anatomy of an active submarine volcano. Geology, 42(8), 655–658. https://doi.org/10.1130/G35629.1.
[2] Arnulf, A.F., Harding, A.J., Saustrup, S., Kell, A.M., Kent, G.M., Carbott, S.M., Canales, J.P., Nedimovic, M.R., Bellucci M., Brandt, S., Cap, A., Eischen, T.E., Goulin, M., Griffiths, M., Lee, M., Lucas, V., Mitchell, S.J., and Oller, B. (2019) Imaging the internal workings of Axial Seamount on the Juan de Fuca Ridge. American Geophysical Union, Fall Meeting 2019, OS51B-1483.
[3] Arnulf, A.F., Harding, A.J., Kent, G.M., and Wilcock, W.S.D. (2018) Structure, seismicity and accretionary processes at the hot-spot influenced Axial Seamount on the Juan de Fuca Ridge. Journal of Geophysical Research, 10.1029/2017JB015131.
[4] Carbotte, S. M., Nedimovic, M. R., Canales, J. P., Kent, G. M., Harding, A. J., and Marjanovic, M. (2008) Variable crustal structure along the Juan de Fuca Ridge: Influence of on-axis hot spots and absolute plate motions. Geochemistry, Geophysics, Geosystems, 9, Q08001. doi.org/10.1029/2007GC001922..
[5] Carbotte, S.M., Arnulf, A.F., Spiegelman, M.W., Harding, A.J., Kent, G.M., Canales, J.P., and Nedimovic, M.R. (2019) Seismic images of a deep melt-mush feeder conduit beneath Axial Volcano. American Geophysical Union, Fall Meeting 2019, OS51B-1484.
[6] West, M., Menke, W., and Tolstoy, M. (2003) Focused magma supply at the intersection of the Cobb hotspot and the Juan de Fuca ridge. Geophysical Research Letters, 30(14), 1724. https://doi.org/10.1029/2003GL017104.
[7] West, M., Menke, W., Tolstoy, M., Webb, S., and Sohn, R. (2001). Magma storage beneath Axial volcano on the Juan de Fuca mid-ocean ridge. Nature, 413(6858), 833–836. doi.org/10.1038/35101581
[8] Wilcock, W.S.D., Tolstoy, M., Waldhauser, F., Garcia, C., Tan, Y.J., Bohnenstiehl, D.R., Caplan-Auerbach, J., Dziak, R., Arnulf, A.F., and Mann, M.E. (2016) Seismic constraints on caldera dynamics from the 2015 Axial Seamount eruption. Science, 354, 1395399; https:// doi .org/10.1126 /science.aah5563.
94
[9] Wilcock, W.S.D., Dziak, R.P., Tolstoy, M., Chadwick, W.W., Jr., Nooner, S.L., Bohnenstiehl, D.R., Caplan-Auerbach, J., Waldhauser, F., Arnulf, A.F., Baillard, C., Lau, T., Haxel, J.H., Tan, Y.J, Garcia, C., Levy, S., and Mann, M.E. (2018) The recent volcanic history of Axial Seamount: Geophysical insights into past eruption dynamics with an eye toward enhanced observations of future eruptions. Oceanography, 31, (1), 114-123. https://doi.org/10.5670/oceanog.2018.117
[10] Chadwick, W.W., Jr., Nooner, S.L., and Lau, T.K.A. (2019) Forecasting the next eruption at Axial Seamount based on an inflation-predictable pattern of deformation. American Geophysical Union, Fall Meeting 2019, OS51B-1489.
[11] Chadwick, W.W., Jr., Paduan, J.B., Clague, D.A., Dreyer, B.M., Merle, S.G. Bobbitt, A.M. Bobbitt, Caress, D.W. Caress, Philip, B.T., Kelley, D.S., and Nooner, S. (2016) Voluminous eruption from a zoned magma body after an increase in supply rate at Axial Seamount. Geophysical Research Letters, 43, 12,063-12,070;
https://doi. org/10.1002/2016GL071327.
[12] Nooner, S.L., and Chadwick, W.W. Jr. (2016) Inflation- predictable behavior and co-eruption deformation at Axial Seamount. Science, 354, 1399-1403; https://doi.org/10.1126/ science.aah4666.
[13] Nooner, S.L., and Chadwick, W.W. Jr. (2016) Inflation- predictable behavior and co-eruption deformation at Axial Seamount. Science, 354, 1399-1403; https://doi.org/10.1126/ science.aah4666.
[14] Hefner, W.L., Nooner, S.L., Chadwick, W.W., Jr., and Bohnenstiehl, D.R. (2020) Magmatic deformation models including caldera-ring faulting for the 2015 eruption of Axial Seamount. Journal of Geophysical Research, https://doi.org/10.1029/2020JB019356.
[15] Levy, S., Bohnenstiehl, D.R., Sprinkle, R., Boettcher, M.S., Wilcock, W.S.D., Tolstoy, M., and Waldhouser, F. (2018) Mechanics of fault reactivation before, during, and after the 2015 eruption of Axial Seamount. Geology, 46(5), 447-450; https://doi.org/10.1130/G39978.1.
95
CGSN: New Estimate of Boundary
Current Transport
Hopkins et al. (2019), https://doi.org/10.1029/2018JC014730 use data from the OOI Irminger Sea flanking moorings to create the longest continuous record to date of Deep Western Boundary Current (DWBC) volume transport in the region. This study, part of the Overturning in the Subpolar North Atlantic Program (OSNAP), used data from two OOI flanking moorings, along with three U.S. OSNAP moorings, and five U.K. OSNAP moorings to determine the 22-month mean DWBC volume transport, and its spatial structure off the southeast coast of Greenland (Figure 12).
Figure 12. Mean velocity vectors (sticks; scale to upper right) and variance ellipses for Deep Western Boundary Current velocities southeast of Greenland in 2014 (gray) and 2015 (black). From Hopkins et al., (2019).

96
Determining DWBC properties is critical to understanding the transport of heat, salt, nutrients, and carbon by the Atlantic Meridional Overturning Circulation (AMOC), part of a system of currents that form the global thermohaline circulation. The combined OSNAP/OOI mooring array deployed at 60°N in the Irminger Sea during 2014 - 2015 provides the longest continuous record of DWBC volume transport at this latitude. This enables not only the most reliable estimate available of the mean transport, but the ability to investigate temporal variability.
Several key points are made by the authors. First, the average volume transport of deep water was 10.8 ± 4.9 Sv (mean ± 1 std) to the south. Of the total transport, North East Atlantic Deep Water accounted for about 6.5 Sv while about 4.1 Sv was associated with the Denmark Strait Overflow. Second, the long record allows the first systematic investigation of DWBC variability. The observed transport shows a shift from high to low frequency fluctuations with increasing distance from the East Greenland coast. High‐frequency fluctuations (2–8 days) dominate close to the continental slope, likely associated with topographic Rossby waves and/or cyclonic eddies. In deeper water, transport variance at 55 days dominates. Finally, the results indicate a modest (1.8 Sv) increase in total transport since 2005–2006, but this difference can be accounted for by a range of methodological and data limitation biases. This is of interest because although AMOC variability related to climate change is expected to be reflected in DWBC transport and properties, conclusive observational evidence of transport change has been elusive.
97
Endurance Array: Coastal and Global Profiler Mooring Analysis
Figure 13. Temperature anomaly (°C) as a function of time and depth from the OOI Endurance Array Washington Offshore wirefollowing profiler. The gap in late 2016/early 2017 is when the wire-following profiler broke loose from its anchor as a result of an intense winter storm. From October 2014 through July 2019, this mooring has made over 10,000 profiles. Adapted from Barth et al., 2018.
The McLane Moored Profiler is used on the Global profiler moorings, Pioneer and Endurance coastal profiler moorings, and, as a modified McLane Profiler, on the Regional Cabled Cable Array deep profiler moorings. Its water column measurements contribute to the OOI science goals of Climate Variability, Ocean Circulation, and Ecosystems;

98
Turbulent Mixing and Biophysical Interactions; and Coastal Ocean Dynamics and Ecosystems. For example, Barth et al., 2018
(https://doi.org/10.5670/oceanog.2018.114) used the Endurance Washington offshore profiler moorings to characterize the subsurface temperature response to the recent warm blob event (Figure 13).
While profiler mooring data are available via the OOI Data Portal, the Data Portal does not provide a tool to easily analyze and visualize profiler data. In response to this need and to user requests for profiler analysis tools, Endurance Array staff have developed a MATLAB-based toolbox called radMMP. This toolbox allows users to easily import and visualize a WFP data set. It has been thoroughly tested with Endurance and Pioneer profiler mooring data and has been uploaded to the publicly available CGSN Bitbucket website
(https://bitbucket.org/ooicgsn/mmp_toolbox/src/master/) along with comprehensive tutorial information. Using this toolbox, the Endurance Array data team has completed annotations for all Endurance Array profiler mooring since the initial deployment. While the toolbox was initially developed for the coastal profiler mooring, it is being extended to the global profiler mooring and should be adaptable to the Regional Cabled Array deep profiler moorings.
99
RCA: Understanding the Life of a Submarine Volcano
Axial Seamount continues to be an exceptional research site for the community. A 5-year NSF award (2019-2023) was made to Chadwick (OSU) “Phase 2 of Enhancements to the OOI Cabled Array at Axial Seamount”. An extensive 3D multichannel seismic survey is now underway on the R/V Langseth as part of a multi-institution award to Arnulf and others (University of Texas) “Collaborative Research: Axial 3-D - Exploring the linkages between complex magma chamber structure, caldera dynamics, fluid pathways and hydrothermal venting.” An Early Career biologicallyfocused proposal was submitted to NSF in Q4. The IODP Axial drilling proposal with cabled corked observatories was given the go ahead for a full proposal “SEP considers the sciences objectives as exciting and timely. The proposed drilling and sub-seafloor monitoring are a logical extension of the Regional Cabled Array already in place at Axial Seamount. Both projects will significantly support and augment each other scientifically. The science plan is robust and extensive...” Note that the panel realizes, as with young crustal drilling, that there are risks, which the proponents will be addressing. Engineering and outreach planning for the 4-year NASA InVader award is in high gear; the program includes cutting edge visualization of the ASHES hydrothermal field, vents, fluid data and raman spectroscopic and imaging data to be obtained during the 2020-2022 field programs.
10 0
The multidisciplinary cabled array at Axial Seamount, continues to promote intense interest into process linkages and what they may tell us about the life of this (and others) dynamic submarine volcano. Here, the 4+ years of RCA data show a pattern of inflation due to magmatic input > 2 km beneath the seafloor that is strongly linked with seismic activity (Figure 14 a-c). Brief, hiatuses in inflation are correlated to a significant decrease is seismic activity, presumably reflecting a decrease in strain (Figure 14c). Vent fluid temperatures in the International District Hydrothermal Field have increased since the 2015 eruption (Figure 14d-e, perhaps reflecting increased fracturing of hot rock, perhaps associated with migration of melt in the subsurface.
The ongoing Arnulf 3D experiment will provide information on the temporal-spatial distribution of melt and if melt concentrations/depth have changed beneath the International District field since 2015.
101
Figure 14 https://www.pmel.noaa.gov/eoi/rsn/diffs.html- W. Chadwick (OSU). Data products from bottom pressure tilt instruments b) and c) Histograms of earthquakes
http://axial.ocean.washington.edu/W. Wilcock (UW). d) Temperature measurements in the Escargot vent showing a 30°C increase since the 2015 eruption. e) A 1-day old, ~ 1 m tall sulfide-anhydrite chimney formed following emplacement of the 2019 instrument.

102
Pioneer: Shelf Water Subduction and Cross-Shelf Exchange
The Mid-Atlantic Bight (MAB) continental shelf off the US northeast coast is a region of high biological productivity and economic importance (Sherman et al., 1996). A persistent shelfbreak front separates the cold fresh shelf water from the waters in the Slope Sea (Linder and Gawarkiewicz, 1998) and helps maintain the shelf biological productivity. Gulf Stream warm-core rings can break the shelfbreak front and induce major water exchange across the shelfbreak. A warm-core ring impinging on the shelfbreak could draw a substantial amount of shelf water offshore, forming a shelf water streamer a filament of shelf water moving into the Slope Sea (e.g., Joyce et al., 1992). Shelf water streamers, characterized by low surface temperature, can be distinctively identified in satellite data. The streamers carry salt, nutrients, and carbon across the shelf edge and affect water characteristics and biological production in the continental shelf and Slope Sea (Vaillancourt et al., 2005). In recent years, the Gulf Stream in the Northwest Atlantic has become increasingly unstable (Andres, 2016) and sheds more rings in the Slope Sea (Gangopadhyay et al., 2019). It is thus imperative to study how warm-core rings are affecting cross-shelf exchange at the MAB shelfbreak and modifying the water properties and biological productivity on the continental shelf.
Studies of shelf water streamers in the past had focused on their surface expression, and their subsurface structure
103
was largely unknown, due to the lack of in situ
shelf water in the Slope Sea on the ring periphery, separated from surface- visible shelf-water streamers (e.g., Kupferman and Garfield, 1977). Thus, warm-core rings might have induced subsurface offshore transport of the shelf water with no surface expression. The dynamics of the possible subsurface transport and its connection to the surface-visible shelf water streamer were unclear. To quantify the total offshore transport of the shelf water induced by rings, information on the vertical structure of the transport is crucial.
The OOI Pioneer Array (Gawarkiewicz and Plueddemann, 2018) at the MAB shelf edge provides a unique opportunity for studying subsurface offshore transport of the shelf water. One example is that Pioneer Array moored profilers and gliders captured clear signals of frontal subduction of the shelf water on the edge of an impinging warm- core ring in June 2014 (Zhang and Partida, 2018). The data showed a layer of cold, lesssaline, high- oxygen and high-CDOM shelf water moving downward underneath a surface layer of ring water, as highlighted by the striped black lines in Figure to the right. The subducted shelf water is carried offshore by the anticyclonic ring flow underneath a surface layer of ring water and is invisible on the ocean surface. It represents a form of offshore transport of the shelf water that had not been realized previously. The water mass characteristics captured by Pioneer Array allowed the development of an ocean model to study the dynamics of the frontal subduction and to quantify the surface-invisible part of the shelf-water offshore transport.
Through combining Pioneer Array data, satellite data, and an ocean model, we revealed that the
104
Figure 15: (a) Sea surface temperature on June 8, 2014, showing a warm core ring impinging on the shelfbreak near the Pioneer Array moorings (diamonds). Time series of (b) temperature, (c) salinity, (d) DO, and (e) CDOM from the Offshore mooring (black in (a)). Grey contours in (b–e) are isopycnals, with a contour interval of 0.25 kg m–3 and the 26.5 kg m–3 isopycnal bold.

explains historical observations of isolated subsurface packets of shelf water in the Slope Sea. Model- based estimates suggest that the surface-invisible transport could be a major part of the overall shelf-water offshore transport induced by warm-core rings. The offshore transport of the subducted shelf water directly affects the distribution of heat, salt, nutrients and oxygen across the shelf edge. Future analysis of the Pioneer Array data should focus on providing a more robust quantification of the cross-shelf exchanges at the shelfbreak and the influence of warm-core rings on the physical and biological properties of the MAB continental shelf.
Weifeng
Hole
105
Oceanographic Institution,
from OOI Science
(Gordon) Zhang, Applied Ocean Physics & Engineering, Woods
Woods Hole, MA, USA. Extracted
Plan,
Pioneer: A Data Assimilative Reanalysis at the New England Shelf Pioneer Array
In the atmospheric sciences so-called reanalysis products are widely used for scientific discovery. These are the merger of observations with a dynamical model through a formal data assimilation process. In oceanography, due to novel observing technologies and burgeoning networks in which OOI is a key component, we are witnessing the emergence of high-resolution ocean reanalysis and forecast products that can support collaborative research in much the same way as in meteorology. Founded on Bayesian maximum likelihood principles, data assimilation balances a model with inaccuracies with data that incompletely sample the ocean to deliver an analysis that satisfies mass and tracer conservation principles and kinematic controls exerted by topography, while also being consistent with available knowledge of the true ocean state. Arguably, a skillful reanalysis offers the best possible estimate of the time varying ocean state from which to infer such quantities as across- shelf transport of mass, heat and salt.
Using 4-Dimensional Variational (4D-Var) Data Assimilation (DA) (Moore et al., 2011) and the Regional Ocean Modeling System (ROMS), (Levin et al., 2020a, b) have undertaken a 4-year retrospective reanalysis (2014- 2017) of ocean circulation at the Pioneer Coastal Array site. Starting from a 7-km resolution model identical to the MARACOOS real-time ocean forecast system (Wilkin et al., 2018), a hierarchy of two further
106
1-way nested grids refined the model resolution by a
Applying 4D-Var DA within each successive grid, with appropriate background error covariance scales and data thinning etc., the system captures circulation features that range from Gulf Stream rings and meanders through an energetic mesoscale eddy field down to o(1) Rossby number flows that characterize the inhomogeneous, rapidly evolvingand ephemeral submesoscale circulation. As an example, Figure to the right shows surface temperature and relative vorticity during an across-shelf intrusion event studied by Zhang and Gawarkiewicz (2015) that was an early application of OOI data.
Beyond computing ocean circulation reanalyses, which is mostly straightforward though at this resolution very computationally intensive (a 2-year simulation of the 700-m grid with 4D-Var DA took two months on 144 cores of a high-performance cluster computer), the DA system can be used to gain insight as to the information content of the observing network itself.
One approach to this is Observation Impact Analysis (Langland and Baker, 2004), which deduces the contribution that each individual observation makes to some chosen scalar index that characterizes an important feature of the circulation; here, some 100,000 observations are assimilated each day from in situ platforms and satellites. Defining flow indices that quantify the net fluxes of mass, heat and salt across a transect following the 200-m isobath through the center of the Pioneer Array, (Levin et al., 2020a,b) applied Observation Impact Analysis to each successive nested grid data assimilation reanalysis. Despite being an order of magnitude fewer in number, in situ observations of temperature and salinity from
107
resolution was refined to the extent that moored ADCP velocity data were twice as impactful as in situ T and S in the 800-m grid. This can be explained by noting that as the model resolution increases, vigorous sub-mesoscale motions spontaneously emerge with a higher ratio of kinetic to potential energy and the 4D-Var assimilation system is better able to utilize velocity data to inform a dynamically balanced analysis.
These studies have shown that it is feasible to compute sub-mesoscale resolution data assimilative ocean reanalyses, that are meaningfully constrained by dense observing networks such as Pioneer. Achieving eventwise correspondence between observed and modeled sub-mesoscale features, with a dynamically selfconsistent analysis of velocity and density throughout the full water column, can provide context to the interpretation of other Pioneer data, and opens further opportunities, such as coupling the circulation model to
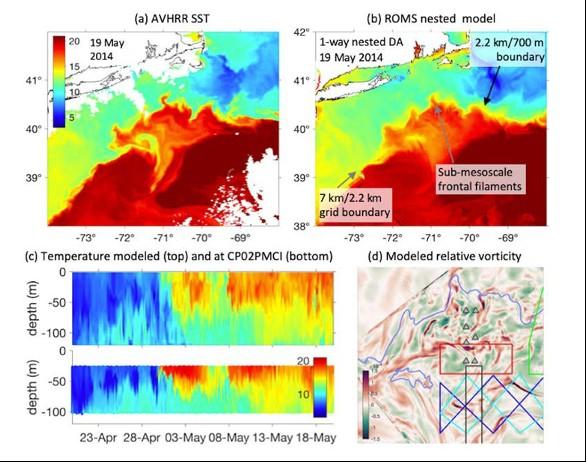
108
Figure 16: Surface temperature and relative vorticity during an across-shelf intrusion event studied by Zhang and Gawarkiewicz (2015).
RCA: Discovery of Axial Seamount
Deep Melt-Mush Feeder Conduit
Recent geophysical observations at Axial Seamount provide new seismic images of the deep magma plumbing system at this submarine volcano and reveal a stacked sill complex extending beneath the main magma reservoir that underlies the Axial summit caldera (Figure to right). This pipe-like zone of stacked sills is interpreted to be the primary locus of magma replenishment from the mantle beneath Axial and indicates localized melt accumulations are present at multiple levels in the crust (Carbotte et al., 2020). How and where melt accumulations form, how melt is transported through the lower crust to feed shallower reservoirs, and how eruptions are triggered are fundamental questions in volcanology about which little is known. The discovery of this deep melt-mush conduit at Axial, where long- term monitoring observations supported by the OOI are available, is providing new insights into these questions that are broadly relevant for understanding magmatic systems on Earth.
Background: The new observations are derived from previously acquired multi-channel seismic data reprocessed using modern techniques. The data reveal a 3-5 km wide conduit of vertically stacked quasihorizontal melt lenses, with near-regular spacing of 300450 m, extending to depths of ~ 4.5 km below seafloor into the mush zone of the mid-to-lower crust. The stacked sill conduit is roughly centered beneath the southern shallowest and melt-rich portion of the broad upper crustal melt reservoir called the Main Magma Reservoir or MMR (Arnulf et al., 2014) that, based on
109
to the initiation of all three eruptions. This melt-mush conduit also underlies the International District hydrothermal vent field at Axial Seamount and likely plays a critical role in maintaining the robust hydrothermal system at this location.
Long-term monitoring arrays of geodetic sensors and seismometers deployed at Axial Seamount as part of the OOI provide constraints on the history of seamount inflation and deformation and the nature of magma transport during pre- and syn-eruption phases at this volcano. Seafloor geodetic studies conducted since the late 1990’s document a history of steady seamount inflation during inter-eruption periods and rapid deflation associated with the three eruptions (Nooner and Chadwick, 2016; Hefner et al., 2020). From modeling of the OOI geodetic records prior to and during the 2015 event, these studies obtain a best fit pressure source that corresponds to a steeply dipping prolate spheroid centered at 3.8 km below seafloor, extending well beneath the MMR. The pressure source derived from the geodetic modeling is similar in geometry and depth extent to the quasi- vertical conduit of stacked lenses imaged in our study. Likewise, continuous seafloor compliance data derived from two OOI broadband seismometers also suggest a narrow lower-crustal conduit beneath the summit caldera (Doran and Crawford, 2020). We interpret the deep melt lens column revealed in the seismic reflection images as the inflation/deflation source for the recent eruptions, with the MCS data defining its location and revealing an internal structure composed of a series of melt lenses embedded within a more crystalline mush. Magma replenishment from the lower crust and upper mantle is interpreted to be focused within this conduit region with
110
Figure 17: Bathymetric map showing location of mid-lower crust melt-mush conduit (red line) and relationships with other magmatic features including upper-crustal Main and Secondary Magma Reservoir (MMR and SMR) identified in Arnulf et al (2014; 2018) in blue with shallowest portion (2.9 km bsl) in thinner line. Recent lava flows are color coded for eruption year as in legend and hydrothermal vent fields indicated with purple dots. Green star marks centroid of pressure source from Nooner and Chadwick (2016) and white star is revised location from Hefner et al., (2020). Black dots show seismicity detected prior and during the 2015 eruption (Arnulf et al., 2018). B. Reverse Time Migration image showing melt lens conduit beneath MMR at Axial, along lines 51. Blue line indicates interpreted top and bottom of MMR. Red lines delineate melt column region. Figure modified from Carbotte et al. (2020).

Magma replenishment sourced from the deep melt sill column may also explain the spatial patterns of microseismicity detected using the OOI prior to and during the 2015 eruption (e.g., Wilcock et al., 2016; 2018). The detected seismicity is largely confined to the shallow crust, above the MMR and is concentrated on outward facing ring faults along the south-central portion of both east and west caldera walls, as well as along a two diffuse bands of seismicity that crosses the caldera floor one of which coincides well with the interpreted northern edge of the deep melt column (Fig. 17). We interpret this distribution of inflation-related seismicity to fracturing of the shallow crust linked to inflation centered within the imaged melt column.
The origin of the conduit of quasi-horizontal melt lenses,
111
attributed in our study to processes of melt segregation from a compacting mush (Carbotte et al., 2020). This interpretation is supported by results from 1D viscoelastic modeling which, for plausible melt fractions, viscosities, and permeabilities, predict a series of porosity waves with similar quasi-regular spacings and over a similar depth range as the observed melt lenses. Other processes can contribute to melt sill formation, such as dike intrusion and formation of sills at permeability boundaries or through conversion of mush to magma with arrival of hotter magmas from depth, but the available data are inadequate to further constrain processes within this deep conduit.
Research Opportunities: At Axial Seamount, the OOI infrastructure combined with constraints on the architecture of the magma plumbing system obtained using marine active source seismic, provides the opportunity to tie dynamic volcano processes of magma recharge and eruption directly to individual magmatic structures imaged within the volcano interior. Our findings of a localized deep stacked sill-mush conduit beneath the shallow broad MMR at Axial raises important questions of how melt accumulations form at these levels, whether they are sources of erupted magmas requiring rapid magma transport from depth during eruptions, and whether there may be deep magma movements in other parts of the volcano away from the conduit region. While the detected seismicity at Axial is largely confined to the upper crust above the MMR, the aperture of the existing seismometer array is narrow and insufficient to detect deeper seismicity. Future studies of the deep magma plumbing system would require wider aperture seismometer and geodetic arrays and could be conducted at Axial leveraging the OOI. Such studies of the deep
112
RCA: Long-Term Monitoring of Gas
Emissions at Southern Hydrate
Ridge
Natural methane gas release from the seafloor is a widespread phenomenon that occurs at cold seeps along most continental margins. Since their discovery in the early 1980s, seeps have been the focus of intensive research, partly aimed at refining the global carbon budget (Judd and Hovland, 2007). The release of gaseous methane in the form of bubbles is a major vector of methane transfer from the seabed to the water column (Johansen et al., 2020), of which the magnitude remains poorly constrained. Methane bubble plumes cause strong backscattering when ensonified with echosounders, and there are several studies that have used sonars to monitor deep-sea gas bubble emissions (Heeschen et al., 2005; Greinert, 2008; Kannberg et al., 2013; Römer et al., 2016; Philip et al., 2016; Veloso‐Alarcón et al., 2019).
Most previous studies relied on repeated discrete surveys with ship-echosounders or on short-term continuous monitoring with autonomous, batterypowered hydroacoustic platforms to study the dynamics of gas emissions and concluded that the intensity of the bubble release is generally transient. However, the timescales and the reasons for the variability are still poorly known. This knowledge gap is largely due to a lack of systematic monitoring data, acquired over longer periods of time (months to years). Identifying the parameters that control or influence the seabed methane release is important in order to refine our understanding of the carbon cycle.
113
(RCA) supplies power and two-way communications to SHR, providing a unique opportunity to power long-term monitoring instruments at the summit of this highly dynamic system.
In 2018 and 2019, during the University of Washington RCA cruises, rotating multibeam and single beam sonars, a CTD instrument, and a 4K camera from the MARUM Center for Marine Environmental Sciences of the University of Bremen, Germany, were connected to the array to monitor gas emissions and seepage-related features at the SHR (Bohrmann, 2019). The sonars collected data at a much higher sampling rate than previous studies at SHR and were at the site for several months (Marcon et al., 2019). An overview sonar detects active gas emissions over the entire SHR summit every

114
Figure 18: Methane bubble emissions detected by the MARUM overview sonar over the Southern Hydrate Ridge summit. The location and size of the bubble plumes vary considerably over time.
quantification sonar monitors seafloor morphology changes and the strength of selected gas emissions at an even higher sampling rate (Ts < 30 min). A 4K camera provides ground truthing images used to facilitate the analysis of sonar observations and new information on the dynamics of seabed morphology changes. Finally, a CTD instrument measures environmental parameters to allow the possible correlation of long-term parameter changes, possibly driven by the climate.
Preliminary results show that the location and size of the bubble plumes at SHR vary considerably over time (Fig. 18) and indicate that a correlation may exist between more intense bubble release and lower bottom-water pressure. This implies that tides may partially influence methane bubble release activity at SHR. Seafloor images reveal that seepage activity triggers significant changes in seafloor morphology and biological communities, which may also explain part of the bubble plume variability.
High resolution and bandwidth ocean observing data from myriad, collocated instrument arrays, such as those provided by the RCA, are crucial to building timeseries spanning months or years that are required to quantify the flux of methane from the seafloor, possible impacts of ocean warming and seismic events, and the evolution of these highly dynamic environments. Short term or nonsystematic monitoring systems do not provide enough data to produce statistical correlations, nor detect lowfrequency cycles with high degrees of confidence. In the years to come, we plan to achieve longer time-series to detect potential non-periodic, low-amplitude influences, possibly from climatic forcing. Such influences can only be reliably inferred with the kind of long-term. systematic sampling methodology made possible by the OOI
115
EA: Three Stream Ocean Optics Model
Miles Miller used OOI data as part of this MS thesis awarded September 2022 from the Univ. California, Santa Cruz. The goal of his work was to develop the potential to estimate phytoplankton community structure from remotely sensed optical information and not direct in situ phytoplankton observations. As a step towards this goal, he estimated phytoplankton community structure using spectrally dependent optical absorption and scattering data from an AC-S on the Oregon Shelf profiler. Miller developed linear relationships between modeled phytoplankton absorption and scattering and corresponding observations and solved them by constrained least squares inversion over a field of thirteen wavelengths using six phytoplankton types. He solved the problem for independent absorption and scattering as well as coupled absorption and scattering. He estimated phytoplankton communities as a function of profile depth and for multiple profiles in time.
The model produced accurate downward irradiance fields when using observed absorption and scattering profiles obtained from the Ocean Observatories Initiative’s Oregon Shelf Surface Piercing Profiler
Mooring. Through this forward modeling-based comparison to observations it was found that the optical model can produce accurate profiles under certain conditions, making it promising for data assimilation of remote sensing reflectance as a function of wavelength. Miller identified several outstanding issues remaining to be addressed to move from using in situ measured absorption and scattering to estimates from remote
116
Figure 19 from Miller
Top: The black line shows the mean OOI absorption as a function of wavelength for OOI Endurance CSPP Oregon shelf deployment 15 (August –Sept 2019). The gray shading shows the OOI absorption extent between the 20% and 80 % quantiles. The tan shading shows the maximum and minimum extent of OOI absorption. The colored lines correspond to the modeled absorption for different single species approximations. Bottom: Same as top, but for scattering instead of absorption.
improved with enhanced phytoplankton community structure and CDOM estimations (see Figure 3.10 from Miller (2022). This figure shows that the modeled phytoplankton light attenuation agrees well with the measurements but that modeled absorption underestimates measurements. This underestimation hints that chromophoric dissolved organic matter (CDOM) is not being properly resolved as CDOM affects only total absorption and not scattering.
A

117
Three Stream Ocean Optics Model: Regional Implementation and Validation. Adapted by OOI from Miller M., 2022. Miller, M. (2022). A Three Stream Ocean Optics Model: Regional Implementation and Validation (master’s thesis). University of California, Santa Cruz. 62 pp.
(2022)
Pioneer: The Great Salinity
Anomaly 2015-2020
Unusual surface freshening episodes in the Subpolar North Atlantic have been documented since the 1960s when the term Great Salinity Anomaly (GSA) was coined to refer to the first documented event (Dickson et al., 1988). GSAs are of great importance because the reduction in surface density of North Atlantic surface waters increases vertical stratification, suppresses deep water formation, and weakens the Atlantic Meridional Overturning Circulation (AMOC). Deep (700-1000 m) wintertime convection in the Irminger and Labrador Seas creates the water mass constituting the northern portion of the AMOC’s lower limb, which transports cold water back to southern latitudes. Thus, sustained changes to deep water formation due to a GSA will impact the global climate system.
New work by Bilo et al. (2022) argues that there has been another GSA during 2015-2020, with significant salinity reduction in the upper 200 m of the Iceland Basin and Irminger Sea. The authors use hydrographic data and moored observations to document the spatial extent and propagation pathways of the GSA.
Hydrographic data come from the Argo float monthly climatology and from UK Met Office Hadley Centre “enhanced” version 4 (EN4) historical hydrography. These spatial data sets allow the basin-wide salinity changes to be diagnosed and show that between 2015 and 2020 the upper 200 m of the central Irminger Sea freshened by 0.1-0.2 PSU. The observed freshening rate of up to 0.04 PSU per year is among the fastest salinity decreases ever recorded in the region. The regional
118
Figure 20: Time series of salinity anomalies from OSNAP moorings near the Reykjanes Ridge (RR) and within the western boundary current of the Irminger Sea (CF6), and from OOI Flanking Mooring (FLB) in the Irminger Sea (FLB). The eighteen-month lowpassed anomalies are averaged between 0 and 200 m depth and computed relative to the mean of the moored data record. Error bars show 95% confidence intervals for annual salinity averages. The blue (red) triangles and diamonds represent the start and end of the freshening period in the CF6 (FLB) records, respectively.
Two OSNAP moorings are evaluated, one on the eastern side of the Irminger Sea near the Reykjanes Ridge and one on the western side within the southward-flowing boundary current. OOI Flanking Mooring B was used to represent conditions in the central Irminger Sea. The results (Figure above) show a salinity minimum near the Reykjanes Ridge in 2017 followed by a minimum at the western boundary in 2018 and finally a significant (~0.1 PSU) salinity reduction in the Irminger Sea interior in 2019. Estimated transit times from the mooring data indicate that the salinity signal is advected quickly (months) by Irminger Sea boundary currents after crossing the Reykjanes Ridge and then spreads more slowly to the interior, taking of order two years to impact the central Irminger Sea.

119
Adapted by OOI from Biló et al., 2022.
Biló, T.C., F. Straneo, J. Holte and I. Le Bras, (2022). Arrival of new Great Salinity Anomaly weakens convection in the Irminger Sea. Geophysical Research Letters, 49, e2022GL098857, doi:10.1029/2022GL098857.
Dickson, R.R., J. Meincke, S.-A. Malmberg, and A.J. Lee (1988). The great salinity anomaly in the Northern North Atlantic 1968–1982″. Progress in Oceanography, 20 (2): 103–151, doi:10.1016/0079-6611(88)90049-3.
120
The authors note that although climatologies are important to determine regional changes, these data are mostly limited to deep water. Moorings can provide data within the boundary currents, as well as well-resolved temporal evolution at multiple locations. This underscores the importance of a hybrid ocean observing system combining historical climatologies, broad spatial coverage (Argo), and time series data (OSNAP, OOI).
RCA: Soundscape Ecology Through Automated
Acoustic-Based Biodiversity Indices
Ferguson’s et al., 2003 paper explores the use of myriad biodiversity indices, generated by automated acoustic classifications, using data from three of the Regional Cabled Array (RCA) broadband hydrophones. As the authors point out, human in-the-loop evaluation of marine species and anthropogenic noise from very large data volumes generated by passive acoustic sensors is formidable. Yet, identification of marine organisms and anthropogenic noise is increasingly important for biodiversity conservation and ecosystem monitoring. Automated biodiversity indices have been utilized in terrestrial environments, but only limited studies have used machine learning to study soundscape ecology in marine systems. This study used broadband hydrophone (HYDBBA) data from Slope Base on the Shallow Profiler Mooring (200 m water depth and ~ 100 km offshore), at Oregon Offshore (580 m water depth and ~ 72 km offshore), and the Oregon Shelf site (80 m water depth and ~ 16 km offshore) (Figure 28a) to examine seven diversity indices. Note, these study sites are valuable to making progress in soundscape ecology because the Cascadia Margin is characterized by very high biological productivity impacted by the California current, it is the site of intense shipping lanes, and because of the availability of continuous, real-time acoustic data streams provide by the RCA.
In this initial study, Ferguson et al., evaluated one month of data from the three sites: January 2017 for HYBDDA 103 and 106 and April 2018 for HYBDDA 105. Five-minute files were used with 7,101 files for Slope Base, 4,725 files for Oregon Offshore, and 6,410 files for
121
mammal vocalizations and anthropogenic sounds.
Identifying the relationship between numerous acoustic indices and species characteristics is complex and requires attention to a significant number of factors and computation of multiple tests, as described in detail in this paper. The Acoustic Complexity Index (ACI, Figure 28b), is generated from an algorithm to quantify biological sounds based on intensity, it is the most commonly used index to assess acoustic indices in marine systems and has been demonstrated useful in identifying species diversity. Results from this work show that ACI measurements increased during vocalizations by dolphins and sperm whales. However, evaluation of the seven indices show that biodiversity cannot be explicitly determined from any single acoustic index. A significant finding from this study is that true assessment of large-scale ecosystem health and changes in indicator species, which may be due to differences in seasonal and interannual variability, requires co-located physical and chemical oceanographic data. The authors note that the RCA and Endurance Array instrumentation provides “an ideal scenario for accurately monitoring system health”.

122
Figure 21: a) Location of Regional Cabled Array broadband hydrophones used in this study. b) Acoustic Complexity Index associated with mammal calls, fish sounds, and anthropogenic noise. (After Ferguson et al., 2023).

123