2 THE PROBLEM: CONSUMPTION OF SINGLE-USE TAKEAWAY PACKAGING
out as much as possible. The survey also shows that Danes are predominantly positive towards measures that would ensure changing from singleuse coffee cups and other disposable packaging to reusable alternatives. At the same time, specific legislative measures are being implemented in neighbouring European countries in support of phasing out disposable products and changing to reusable alternatives. Moreover, specific reuse solutions are being developed, such as refillable coffee cup systems, indicating that switching to refillable cups and reusable packaging for takeaway is realistic. However, this requires that these solutions be supported by appropriate regulatory and policy initiatives.
Oceana recommends setting a political goal of completely phasing out the use of single-use coffee cups, with an intermediate target of having 50% of all cups on the market be refillable by 2026, and increasing to 80% by 2030. Oceana also recommends adopting specific legislation that supports reducing the use of single-use cups and shifting to multipleuse solutions, including legal requirements for takeaway outlets to offer customers a refillable option for takeaway coffee and banning single-use tableware when food and drinks are consumed ‘on-site’ in cafés and restaurants.
Danes are buying more and more takeaway food and drinks. The latest figures from Statistics Denmark’s consumer survey show a 25% increase in the average household’s annual consumption of takeaway food in the period 2016-2019.1 Rising purchases of takeaway food mean that the consumption of single-use packaging and tableware rises accordingly.
Looking at the total consumption of single-use tableware in Denmark, recent information from the Danish Environmental Protection Agency shows that Danes use 300 million plastic cups and 150 million food containers each year (Table 1) 2 Cups account for the largest quantity of these items by weight, with an estimated 3272 tonnes used annually.
Example: The single-use coffee cup
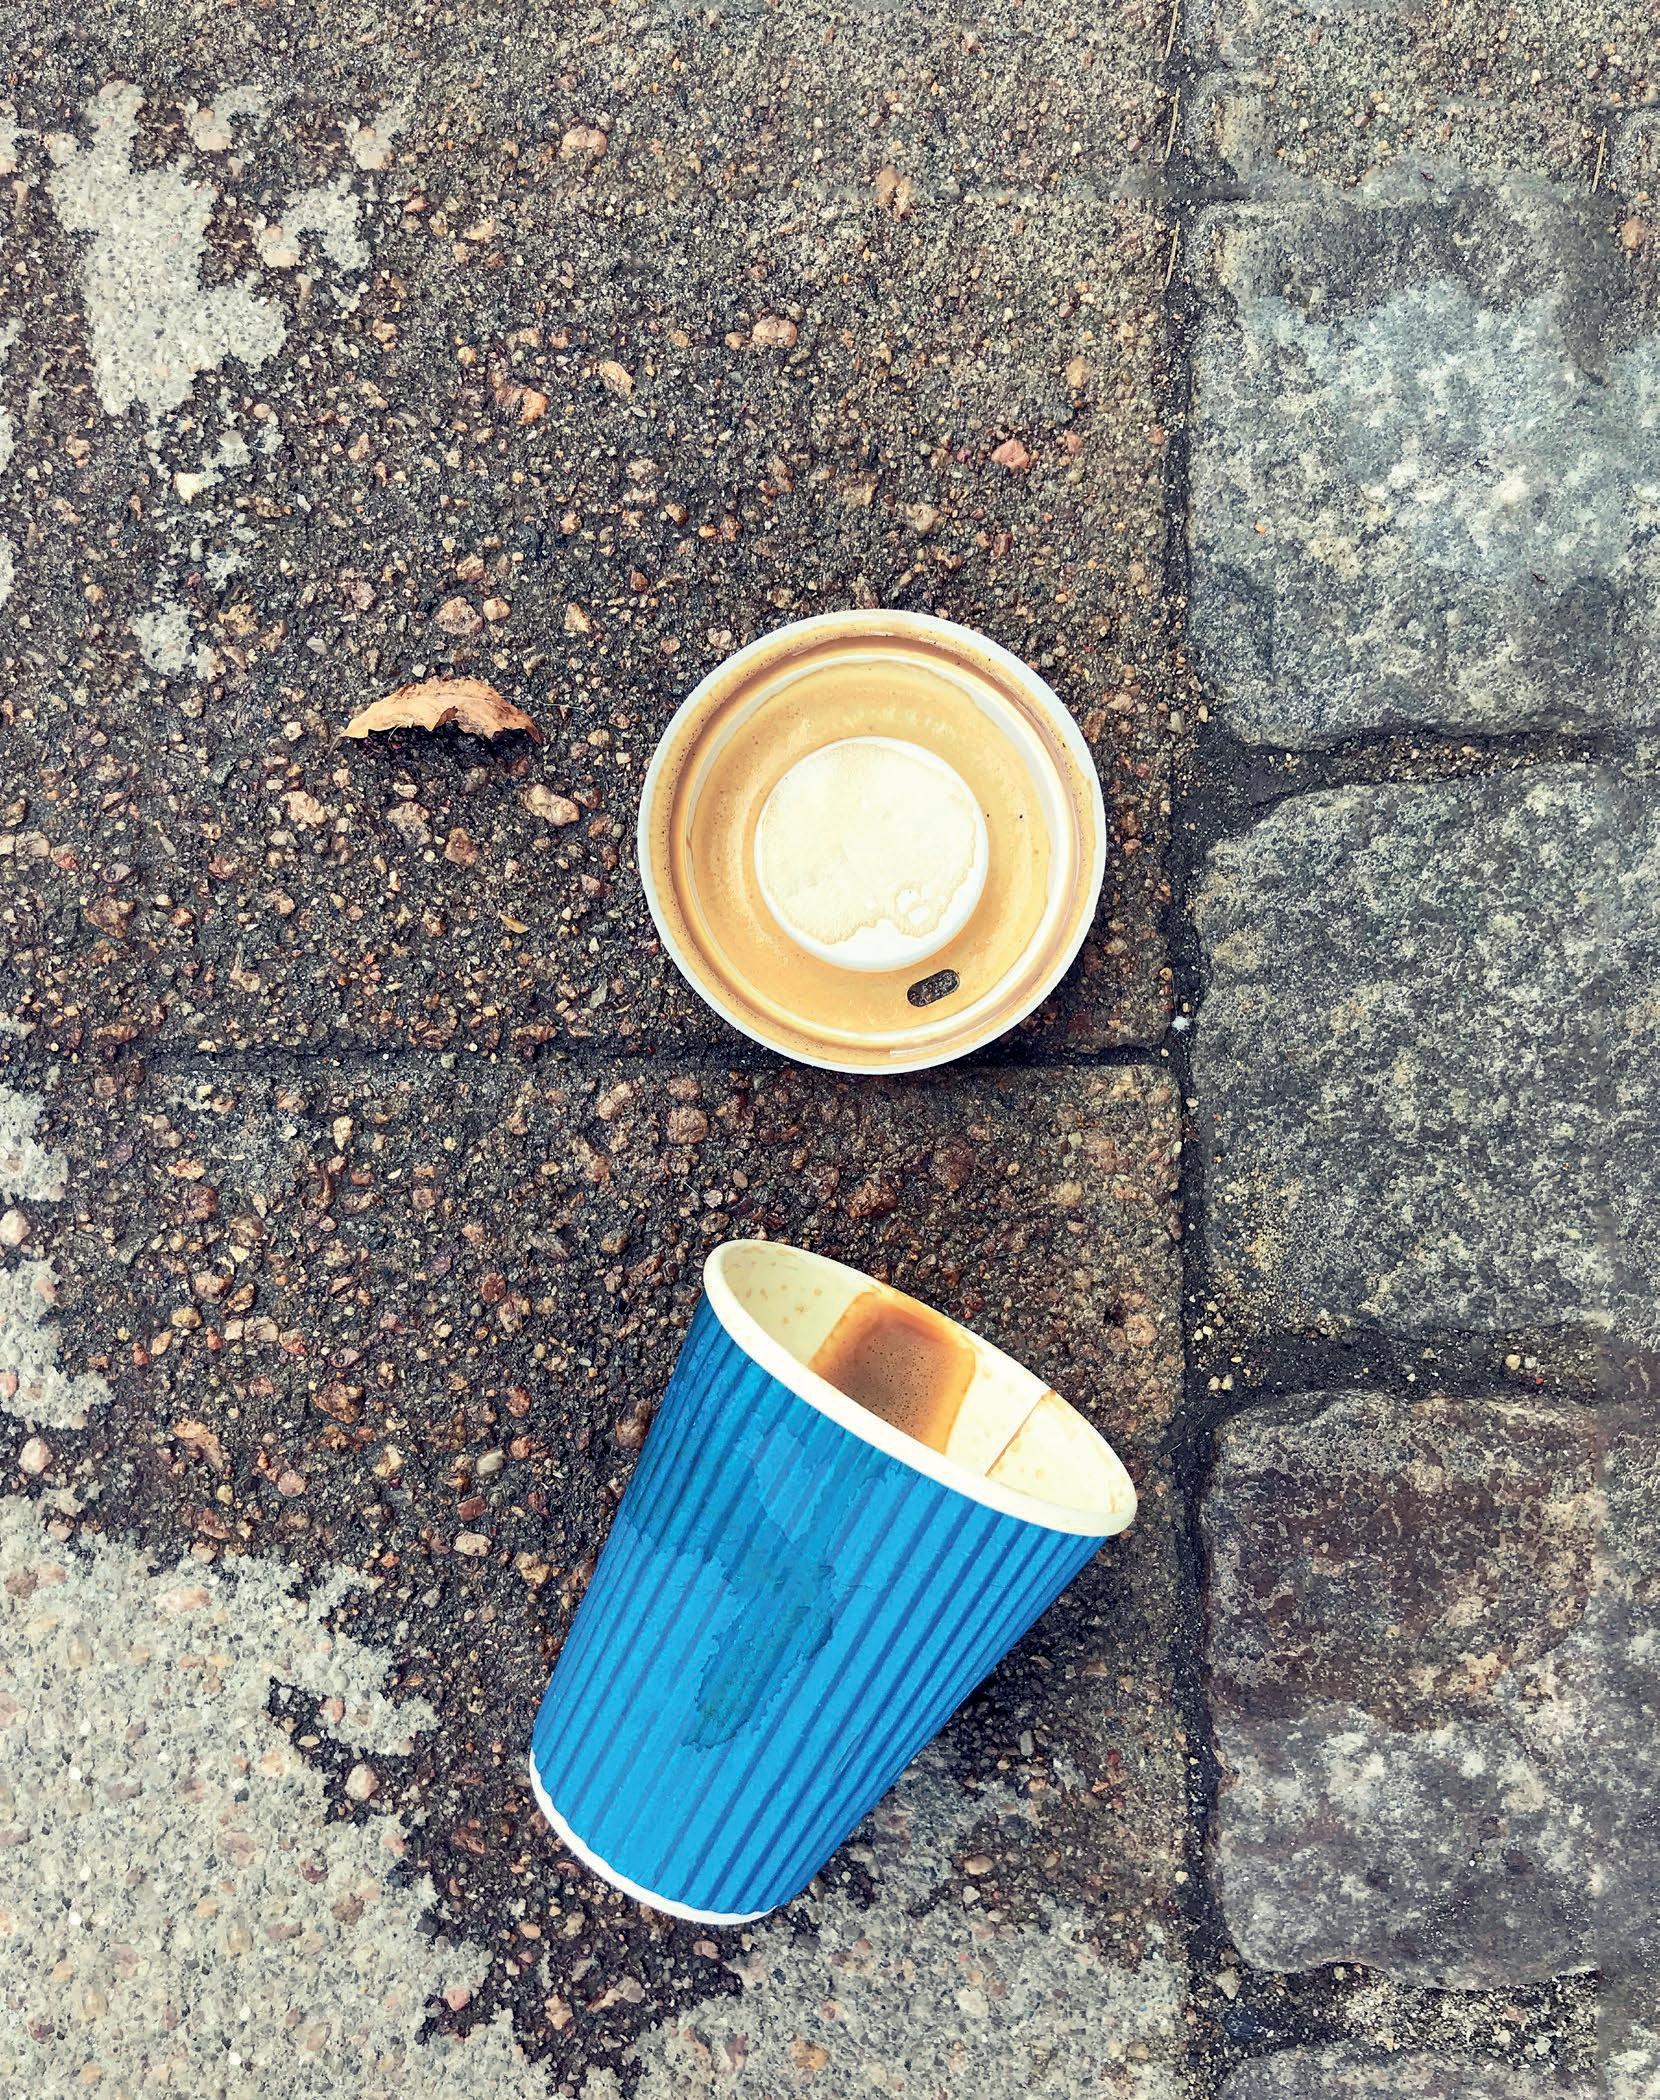
One of the best examples of our throw-away consumption is the single-use coffee cup. Most single-use coffee cups are made of plastic or of plastic-lined cardboard (which makes the cardboard waterproof) and have a plastic lid. Such cups are used for an average of 15 minutes and then discarded as litter.3 It is estimated that less than 1-3% of single-use coffee cups are recycled,4 partly because the composite nature of plastic-lined cardboard coffee cups makes them difficult to recycle.
Denmark has the fourth highest per capita consumption of coffee in the world, and every Dane drinks an average of four cups of coffee per day.5 Oceana estimates that Danes use 130 million disposable coffee cups a year.
made of expanded polystyrene, including their covers, caps and lids
a Products subject to a ban as of 3 July 2021 under the EU Single-Use Plastics Directive (EU) 2019/904. The ban applies only to certain plastic products and not, for example, single-use tableware made of wood or bamboo.
b Products covered by a requirement to reduce consumption under the EU Single-Use Plastics Directive (EU) 2019/904.
c It is not apparent from the Danish Environmental Protection Agency’s report whether this figure includes cardboard coffee cups lined with plastic or only single-use cups made entirely of plastic.
This figure is based on a survey carried out by KantarGallup for Oceana, which asked a representative sample of the population about their use of disposable coffee cups.6 If laid end-to-end, 130 million cups would stretch from Copenhagen all the way to Cape Town. Globally, over 500 billion disposable cups are consumed annually, of which between 250 and 300 billion are plastic-lined paper cups.7 million cups
130 would stretch from Copenhagen all the way to Cape Town, if laid end-to-end
1 EXECUTIVE
4
SUMMARY
Danish consumption of single-use plastic
50% of all
80%
all
the market
refillable
2026 on
market
refillable
5 © OCEANA / Naja Andersen
cups
of
cups on
should be
by
the
should be
by 2030
Single-use plastic items Tonnes Million items Single-use cutlerya 827 200 Plates a 562 44 Straws a 146 377 Stirrers a 27 52 Food containers,
a 79 16 Food containers (e.g.,
b 2998 150 Plastic beverage cups (e.g.,
soft drinks, draught beer,
b c 3272 300
beverage containers and cups for beverages
salad boxes and other takeaway food boxes)
for
etc.)
Table 1. Use of single-use plastic tableware in Denmark. Source: The Danish Environmental Protection Agency, 2020.2
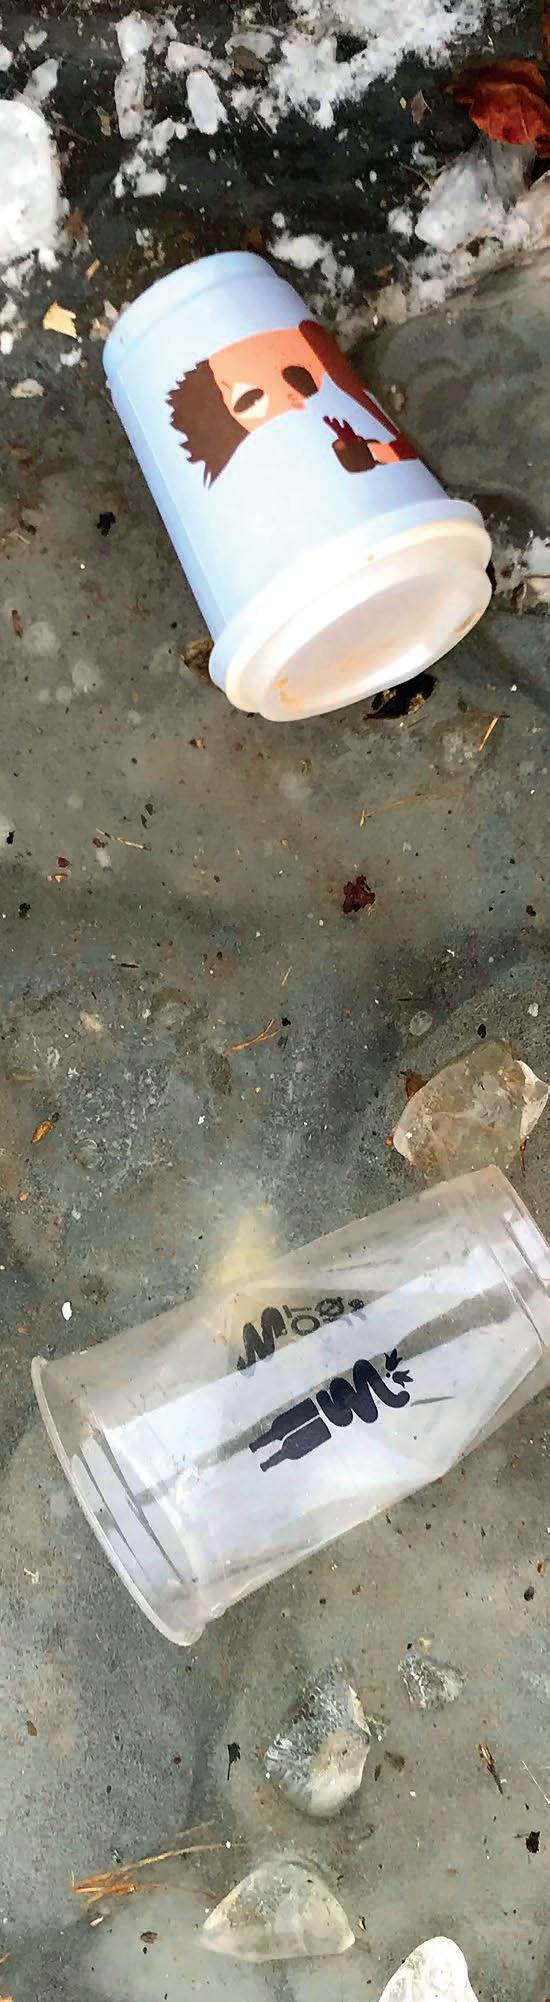
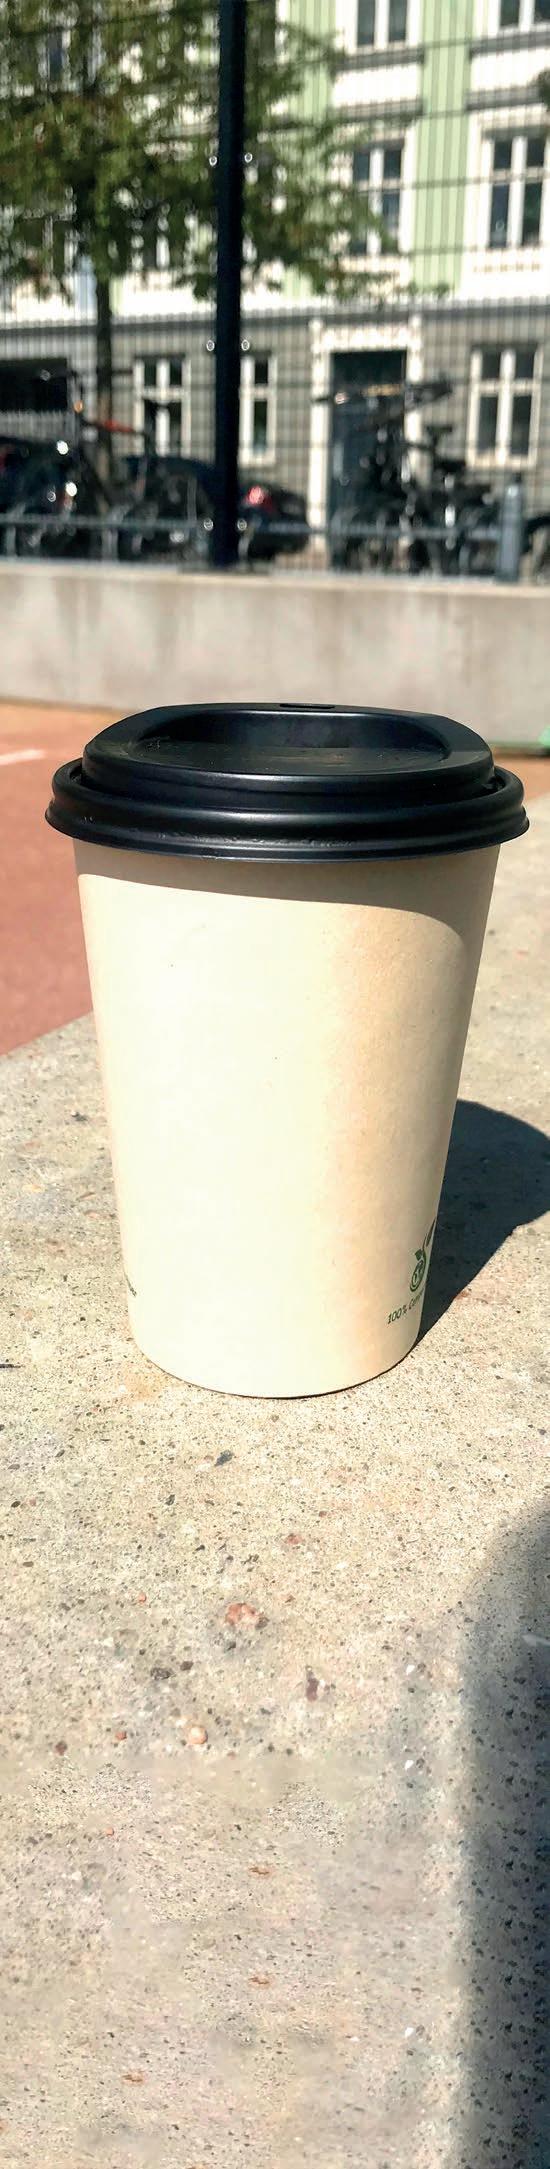
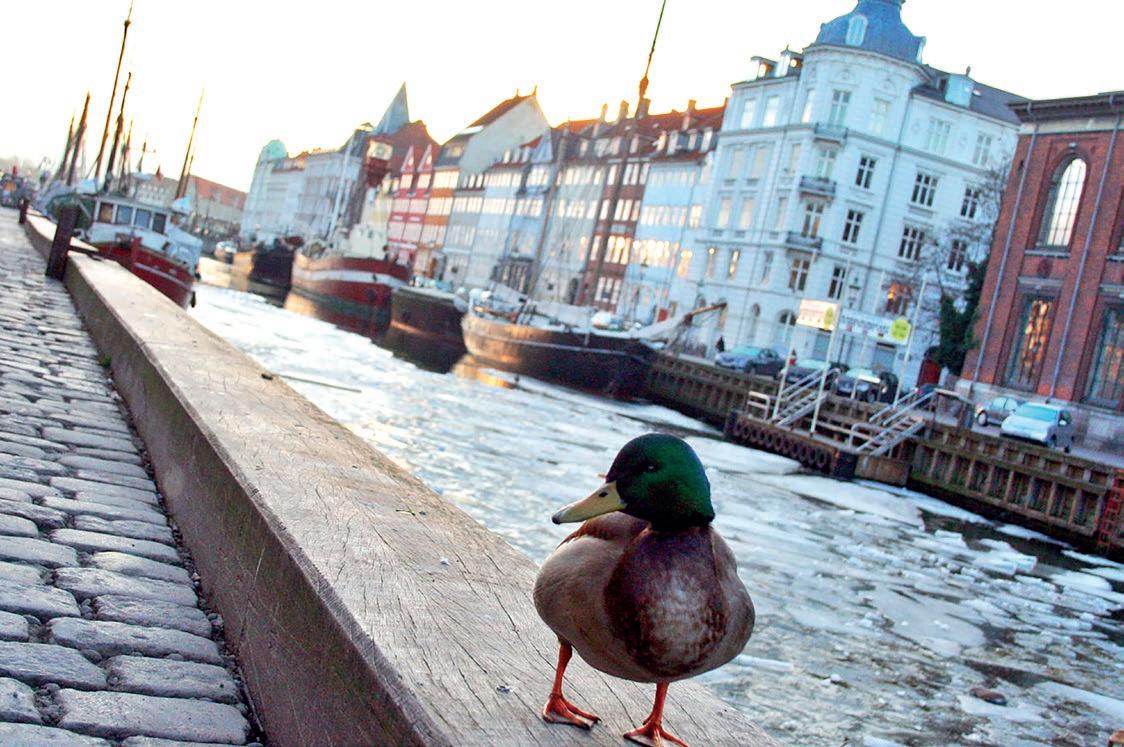
Coffee cup and plastic cup on ice. Copenhagen, Denmark.
© OCEANA / Naja Andersen
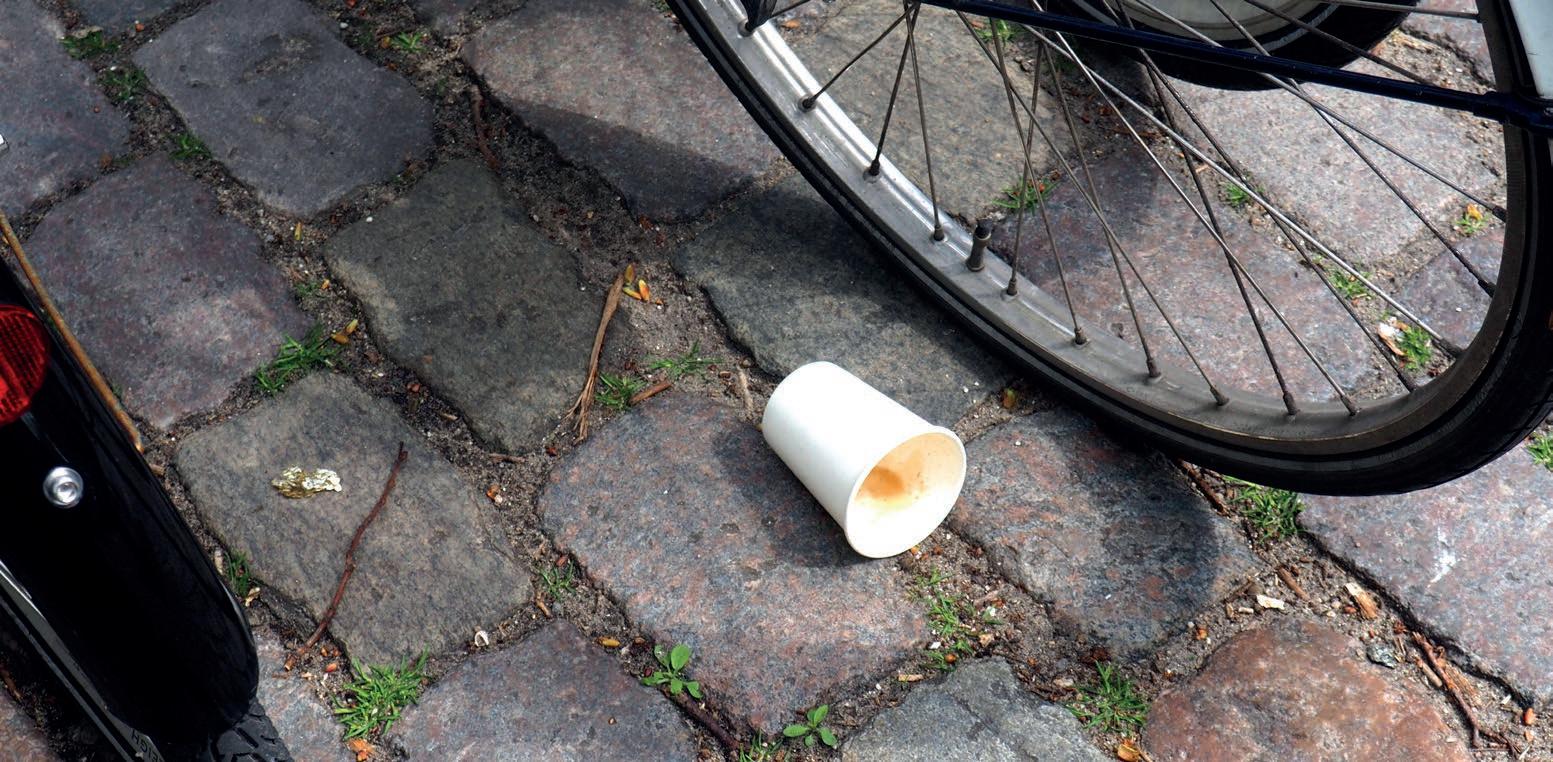
Single use coffee cup lying in the street next to a bike. Copenhagen, Denmark.
Plastics to go: The composition of a single-use coffee cup
Plastic lid:
The lid of the cup is usually made of 100% plastic, either polystyrene (PS) or polypropylene (PP).
Cardboard exterior:
Paper/cardboard exterior may be made from virgin or recycled pulp.
Plastic coating:
The inside of the cup is lined with low-density polyethylene (LDPE) plastic.
The consumption of single-use coffee cups is associated with a high consumption of resources, both for production and disposal. Life-cycle analyses show that the climate footprint from 1000 single-use plasticlined paper cups is 63 kg of CO2e, which corresponds to driving 350 km in an average car. 8 This means that the climate footprint from the consumption of single-use coffee
Rising global trend: (million tonnes)
Global plastic production is expected to increase fourfold by 2050 based on current projections.10
cups alone in Denmark is about 8000 tonnes of CO2e each year.
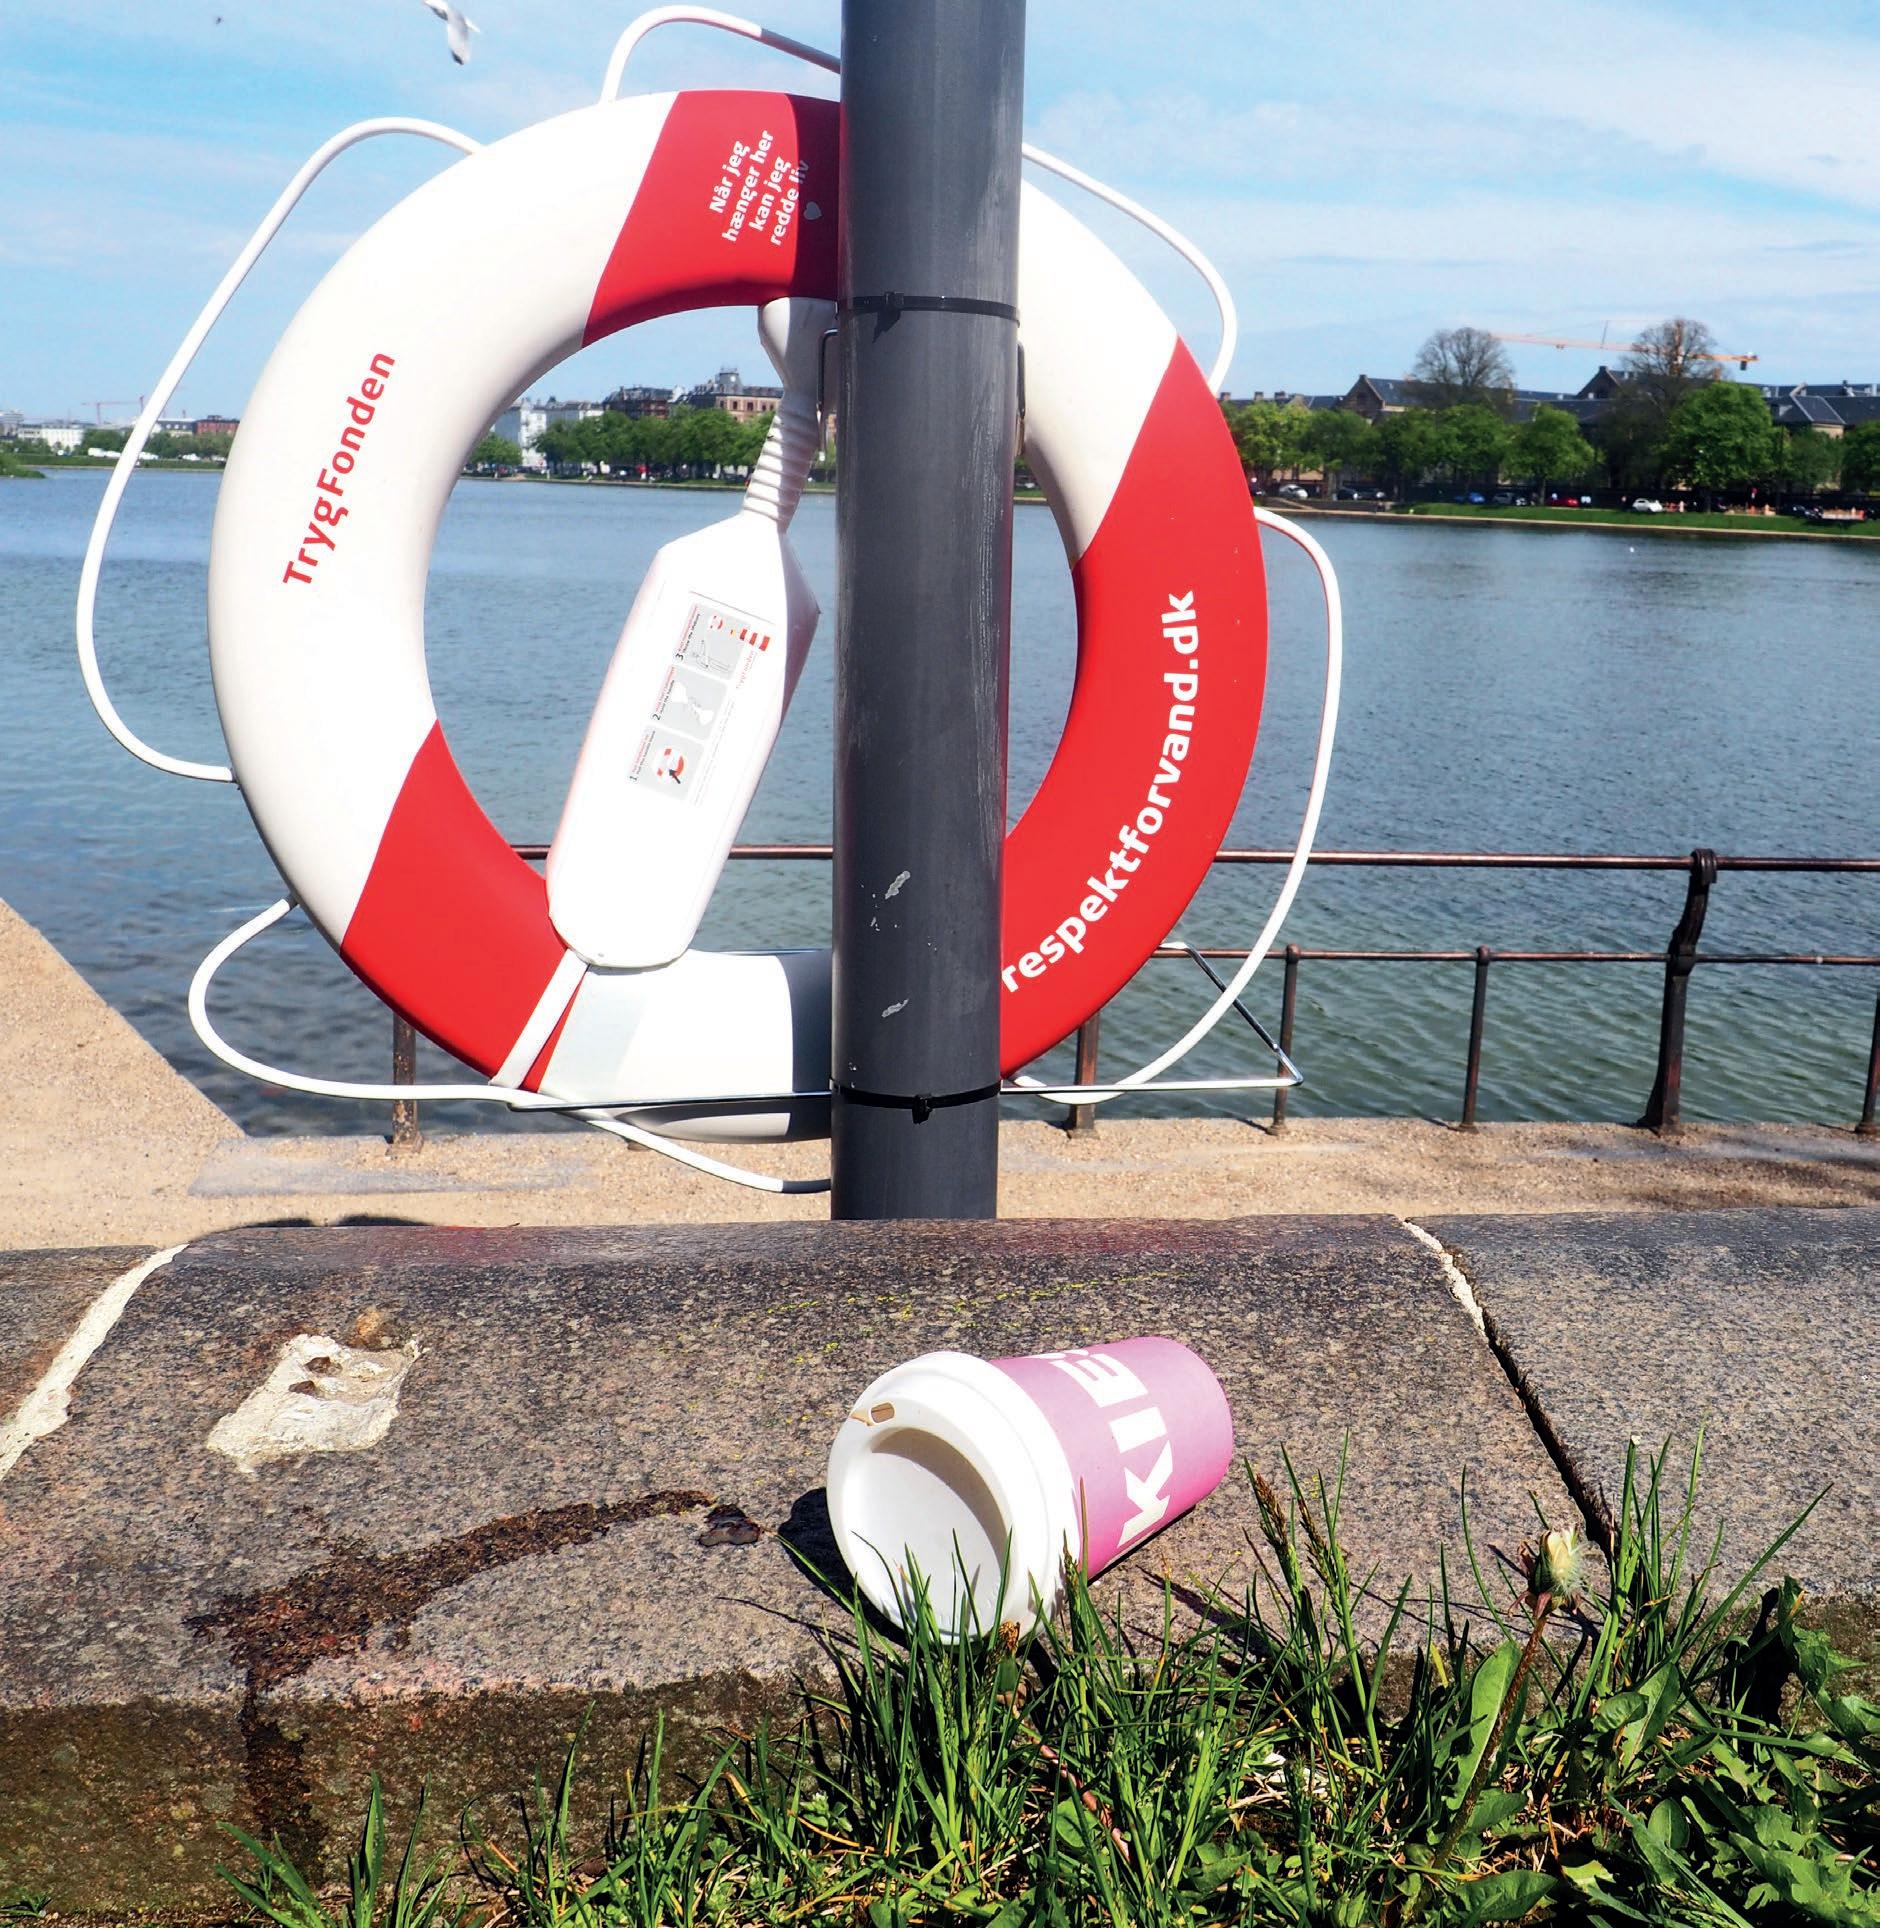
The high level of consumption of single-use coffee cups and takeaway packaging is also a major problem for our environment, particularly in the marine realm. Around the world, single-use cups are one of the most commonly found items littered on beaches.7
In Denmark specifically, single-use cups are among the 10 types of plastic that are found most frequently in nature.9 Together with other types of takeaway packaging, they pose a particular problem, precisely because they are designed to be used on-the-go and so are often made of lightweight materials that easily blow away.
3 SINGLE-USE PLASTIC IN THE MARINE ENVIRONMENT

of all plastic produced today is used for packaging
The most recent figures from the Danish Environmental Protection Agency show that the total amount of plastic packaging on the Danish market increased by almost 30% in the period 2014-2018 11
According to recent research estimates, at least 15 million tonnes of plastic end up in the ocean each year.12 This is roughly equivalent to two garbage trucks full of plastic being emptied into the ocean every minute.
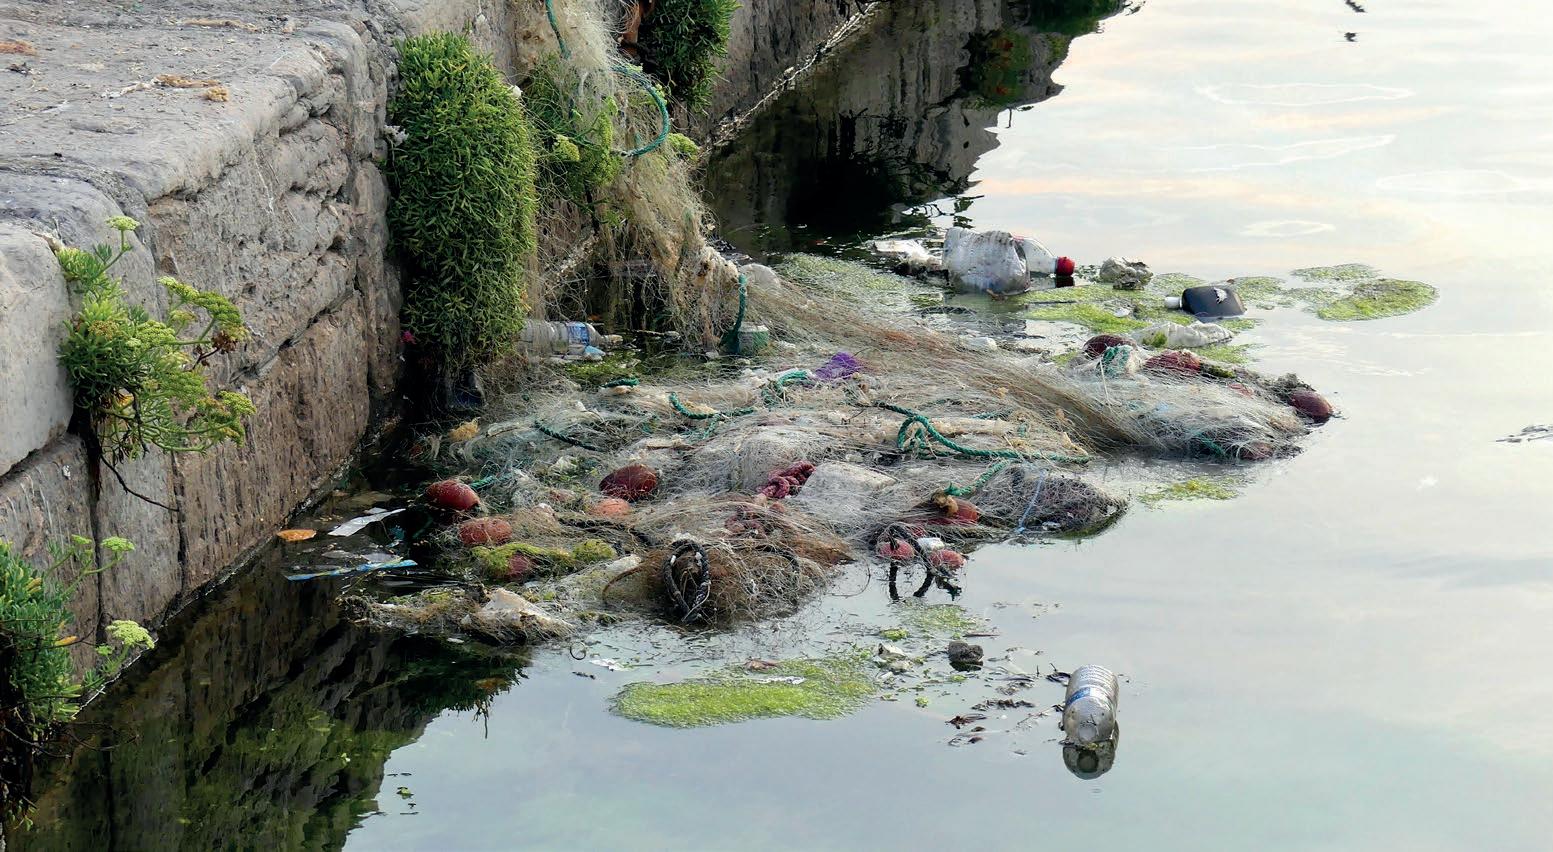
Eighty percent of the plastic that ends up in the ocean comes from land, with larger plastic litter such as drink bottles and plastic packaging being the main contributor, whereas a minor percentage comes from at-sea sources such as fishing or recreational boats.13 Most of the plastic that reaches the ocean is transported from land to coastal and marine environments by wind or storms directly from urban environments, through sewer systems or through rivers and estuaries.14,15
At least 50% of the plastic found on beaches in Europe is single-use plastic, such as disposable packaging for food and beverages.16
Plastic pollution of the Danish marine environment
The geographic characteristics of Denmark – specifically, its long coastline and the fact that nowhere in the country is more than 50 km from the coast – increase the risk that plastics and other waste from the countryside or urban environments end up in the ocean. Compared to many other countries in the world, Denmark has good waste collection. Nevertheless, plastic from Denmark still goes directly into the ocean. Even though only a small proportion of all waste is not managed in Denmark, high levels of consumption and waste production per capita mean that plastic directly pollutes the marine environment in Denmark, as in other affluent countries whose populations live near the coast.17 A peer-reviewed scientific study published in Science in 2020 estimates that, on a global scale, 19-23 million tonnes of plastic ended up in freshwater and marine ecosystems such as streams, rivers and oceans in 2016.18 This equates to 11% of all plastic worldwide. The study calculated country-specific estimates of the discharge of plastic to marine environments for 173 countries, including Denmark, for the period 2016-2030. According to this study, a total of 9125 tonnes of plastic waste were discharged directly from Denmark into its aquatic environment – both freshwater and marine – in 2020.19 This is the equivalent of around 608 garbage trucks full of plastic being emptied into the ocean from Denmark every year.
At least end up in the ocean each year
15 million tonnes of plastic
This is equivalent to being emptied into the ocean every minute
2 garbage trucks full of plastic
on the beach.
7
© OCEANA / Nicolas Fournier
Marine litter in the sea at the port. Sète, France.
© OCEANA / Silvia García Plastics
Around
1950 1970 1990 2010 2030 2050 1 000 800 600 400 200 1 500 1 800
Source: UN environment programme and GRID-Arendal (2016): Marine Litter, Vital Graphics.
6
40 30%
2014-2018
%
There are no official figures or studies about the volumes and types of single-use plastic and other plastic that pollute Denmark’s marine waters.
A study commissioned by the Norwegian Environment Agency has used literature studies, data collection, and modelling to estimate the amount of single-use plastic that becomes litter in Norway and the percentage of these products that ends up in the marine environment for a number of specific product categories, including single-use cups and their lids.4
The Norwegian estimates are considered a useful starting point for a Danish estimate, as the two countries are deemed comparable in terms of consumption, behaviour, and the general level of waste management.
An estimation based on data from Oceana’s own study suggests that a total of 390,000 single-use coffee cups end up in the marine environment in Denmark each year
This is almost equivalent to one cup every minute. If the same estimate is applied to the roughly 300,000,000 single-use plastic beverage cups (for beer, soft drinks, etc.)20 used in Denmark every year, according to the Danish Environmental Protection Agency, 2 it is estimated that approximately 900,000 plastic cups from Denmark may pollute the ocean each year.
Single-use plastic cups for hot & cold drinks
The point of departure for the Norwegian study is the assumption that a large part (~90%) of the products that are initially littered will be picked up by street cleaning and sweeping services in Norway. For the remaining 10%, it is assumed that, for most product categories, 50% will enter the marine environment (through drains, canals, rivers, or direct disposal in the ocean).4
The Norwegian study estimates that approximately 6% of all single-use cups become litter in urban areas or nature, which is slightly more than for other disposable plastic products such as straws, cutlery and food containers. 4 The study also estimates that just over 0.3% of all single-use cups used in Norway eventually enter the marine environment. 4
390,000
single-use coffee cups end up in the marine environment in Denmark each year
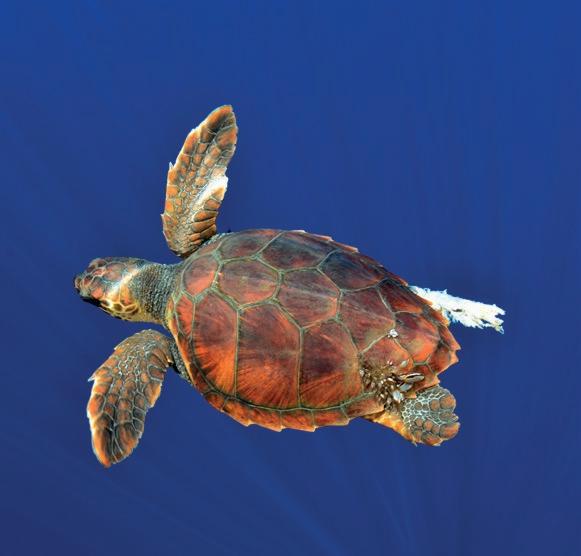
When disposable packaging such as single-use cups and other types of single-use plastic products enter the ocean, the plastic can last for hundreds of years and will never fully disappear. Plastic has many directly harmful effects on the marine environment, where it poses a threat to a wide range of animal species that can be entangled or suffocated by pieces of plastic, or ingest plastic waste either by accident or because they mistake plastic for food. When plastic is ingested, animals die slowly of starvation because their stomachs are eventually filled with plastic and therefore have no room for food, or because the plastic causes other injuries such as blockage, perforation, or rupture of the stomach and intestines. About 700 marine species and more than 50 freshwater species are known to have ingested or become entangled in macroplastic. 21,22 Flexible plastic (such as the film-like plastic coating from coffee cups) is responsible for the largest share of deaths related to waste in the marine environment, primarily because of gastrointestinal problems. Objects such as plastic bags, films, and packaging have proven lethal and especially dangerous for whales and sea turtles. Pieces of hard polystyrene (PS), polypropylene (PP), or polyethylene terephthalate plastic (PET), which are used for cup lids and single-use cups for cold beverages, are particularly dangerous
False solutions
to seabirds, as these plastic pieces can float at the sea surface where the birds mistake them for food. 23
Plastic is found everywhere in our ocean, from the remotest beaches to Arctic sea ice and the deepest seabeds. An estimated 94% of all plastic in the ocean is found on the seabed, while 5% is on beaches and only 1% at the sea surface.13,24 The plastic degrades slowly into microplastics that never disappear completely. Microplastics may act as small sponges in the sea, attracting harmful chemicals. When eaten by fish and shellfish, the microplastics find their way into the food chain. 25,26,27 The full extent of the related long-term consequences for humans and animals is still unknown.
Oceana has documented the impacts of plastic in European waters during numerous at-sea expeditions over the past 15 years. These expeditions have recorded the widespread occurrence of plastic waste in the marine environment, including at previously unexplored depths of up to 1000 metres, confirming that plastic has already travelled further than humans and that we are facing a grave environmental crisis. Oceana has highlighted how plastic accumulates and becomes trapped on the seabed and in underwater hollows and canyons, which are often important habitats for fish and other marine animals. Once on the seabed, plastics are difficult and costly
to clean up, and in many cases (such as in deep waters) are effectively impossible to remove. 24
Detailed information on the distribution of plastics in the Danish marine environment is lacking, particularly in relation to the seabed. Available data on plastic waste accumulation are limited and primarily from open waters. 28 Further studies and research are needed to be able to assess the distribution of plastic on the Danish seabed, particularly in coastal areas, and how it affects Danish marine ecosystems, including the impacts of plastic on specific habitats and species.
Plastic cup for juice or ice tea/ ice-coffee (with lids and straw):
Often made of 100 % polyethylene terephthalate (PET).
Plastic cup for soda and beer:
Often made of 100 % polyethylene terephthalate (PET), polypropylene (PP) or expanded polystyrene (EPS).
The latter will be banned as of 3 July 2021.
Plastic cup used e.g. for water fountains in public and private institutions/offices:
Most often made of 100 % polypropylene (PP).
They don’t degrade in the natural environment: Single-use plastic made of ‘biodegradable’, ‘compostable’ or ‘bio-based’ plastic does not solve the problems, as their complete degradation in the marine environment is not guaranteed. 29 ‘Bio-based’ plastic is made of plant-based material such as grain or corn, but does not necessarily biodegrade in nature and may persist in the environment in the same way as ‘conventional’ fossil-based plastic. ‘Biodegradable’ or ‘compostable’ plastic can be fossil or plant-based and may in theory be degraded by micro-organisms, but most such materials can only be degraded in industrial facilities where plastic is exposed to conditions not found in the natural environment (e.g., high temperatures). These materials may not degrade by themselves in a natural land-based or marine environment and thus constitute a threat to biodiversity and the environment on a par with other plastic products.

They contain toxic chemicals: New research also shows that many of these materials contain hundreds of toxic chemicals, including endocrine disruptors.30 These chemicals likely come from the same additives as the ones used in ’conventional’ plastic to give them their properties, such as plasticisers and stabilisers.
They discourage more sustainable solutions: Promotion of cups made of ‘bio-plastic’ or ’biodegradable’ plastic may give consumers, businesses, and decision-makers a false sense of sustainability, preventing the use of more sustainable solutions such as refillable containers and packaging. Moreover, some research indicates that consumers perceive ‘biodegradable’ packaging to be less harmful to nature, and therefore will be more prone to discard it improperly.31,32
8 9
An estimate of single-use cups entering the marine environment
Adverse impacts of plastic in the ocean
Marín
© OCEANA / Pilar
Plastic cup lid in the sand.
Loggerhead turtle Caretta caretta with a seriously injured back leg caused by a piece of plastic that was entangled.
© OCEANA / Carlos Minguell
Key reasons why “bio-based”, “biodegradable” and “compostable” plastics are harmful to the marine environment
Plastic use drives climate change
Emissions throughout the plastic life-cycle: The production and consumption of plastic contributes directly to climate change. Most plastics are produced from fossil fuels and greenhouse gases are emitted at each stage of the plastic life-cycle, including fossil fuel extraction and transport, plastic refinement and manufacture, plastic waste management, and potential ongoing emissions from plastics once they reach our landscape, waterways, and ocean.17 Many of these emissions also apply to plastics made from other raw materials (such as bio-plastics).
Growing share of the limited global carbon budget: The production of plastic currently accounts for 3.8% of global CO2 emissions, which is higher than the contribution of the aviation sector to global emissions.33 If plastic production and use grow as currently expected, these emissions could reach 1.34 gigatonnes per year by 2030 – equivalent to the emissions released by more than 295 new 500-megawatt coal-fired power stations. By 2050, plastic will be responsible for 10-13% of the carbon budget we must maintain in order to avoid increasing global average temperature beyond 1.5°C (as per the Paris Agreement).17
Bigger climate gain from prevention than recycling: The prevention of 1 tonne of virgin plastic waste results in a global reduction of approximately 4.9 tonnes of CO2e, whereas the recycling of 1 tonne of plastic waste results in a global reduction of approximately 0.8 tonnes of CO2e.34
4 SOLUTIONS: REFUSE, REDUCE, REUSE
Recycling does not solve the problem
Existing policy measures: What has been done so far?
A number of measures have been taken at EU and national level to address the challenges posed by plastic pollution. One of the most significant ones is the EU Single-Use Plastics Directive, 35 adopted in 2019, which aims to reduce the amount of plastic litter in the ocean. The Directive focuses on the single-use plastic items that are found most commonly on European beaches. The Directive directly bans several single-use plastic products, including straws, cutlery, and plates, as well as cups and food containers made of expanded polystyrene. While the Directive does not prohibit other single-use cups for hot and cold beverages or containers for takeaway food, it requires Member States to reduce the consumption of these products. To implement the consumption reduction requirements for cups and food containers under the EU Single-Use Plastics Directive, Denmark has set a target to reduce “certain takeaway packaging” by 50% in 2026, as laid out in “The Climate Plan for a Green Waste Sector and Circular Economy” of June 2020. 36 The specific items covered by this target are not specified in the plan nor are the measures to achieve it. According to the plan, the reduction target is to be achieved through voluntary sector cooperation, which means that it is still unclear what actions will be taken and whether this 50% reduction can in principle be obtained by replacing some single-
Why reuse and refill?
use plastic products with single-use products in other materials.
Denmark also recently introduced a tripling of the tax on single-use items for disposable tableware, as well as a tax on carrier bags, with the aim of changing consumption habits.
Existing measures are a small step in the right direction, but more action is urgently needed to achieve significant reductions in the consumption of single-use plastic. Simultaneously, it is important to avoid merely replacing single-use products made of ‘conventional’ plastic with disposable products made of other kinds of plastic or materials that also draw heavily on natural resources, or that may have adverse effects when they end up in the environment, in the same way as ‘conventional’ plastic products.
On a global scale, only around
9 30
% %
is estimated to have been recycled in
In Denmark, only approximately
of all plastic ever produced of all plastic packaging was recycled
On a global scale, only around 9% of all plastic ever produced is estimated to have been recycled.10 In Denmark, only approximately 30% of all plastic packaging was recycled in 2018.11 However, the recycling process is almost always a ‘down-cycling’ process in which the quality of the material gradually worsens. This is clearly the case for many single-use coffee cups, since they are often contaminated with organic material (e.g., coffee, milk) and the composite structure of many such cups makes it difficult to separate the plastic from the cardboard. Even if we recycle more plastic, it will not address
the challenges associated with the high consumption of resources required for their production and for recycling processes, nor will recycling fully address the plastic pollution caused by our widespread use of plastic products.
Research shows that the volumes of new plastic put on the market are so immense that clean-up activities or increased recycling cannot address the challenges associated with plastic pollution in general, and with plastic contamination of the ocean.18
Consumption must be reduced.
The most effective – and the only truly sustainable – solution is to reduce the production and consumption of plastic markedly: phasing out singleuse plastic (and other disposable products), avoiding the use of plastic and single-use packaging wherever possible, and switching to refillable and reusable alternatives when packaging or containers cannot be entirely avoided, such as for takeaway coffee.
Coffee cups designed for refill do not tend to end up as litter to the same extent as single-use cups, not least because they have a higher economic value and are designed to be kept or returned to the service provider by consumers. Reusable cups may be either consumers’ own cups or refillable cups that are part of a deposit return system, in which consumers
A report from the Pew Charitable Trusts from 2020 underlines the need to adopt a vastly greater number of new measures. The report estimates that even if all current and planned plastic policy measures were implemented globally, it would only reduce the volume of plastic in the ocean by 7% by 2040, compared to a businessas-usual scenario. In the meantime, new investments will be made in new plastic production facilities and the price of virgin plastic is therefore expected to remain unchanged, which is expected to maintain the current high level of consumption. 37 pay a deposit that is reimbursed when they return the cup to be washed and reused. Whereas an estimated 6% of single-use cups end up as litter, the corresponding estimate for reusable cups is next to zero.4 Research also shows that deposit return systems effectively prevent plastic from ending up in nature, including the marine environment.9 The same effects are seen when packaging is subject to a tax, as in the case of plastic carrier bags.9
At the same time, environmental and climate benefits have been demonstrated for reusable packaging in comparison to single-use alternatives, for cases where the same packaging is used in a number of cycles without any treatment other than washing.7,38,39
10 11
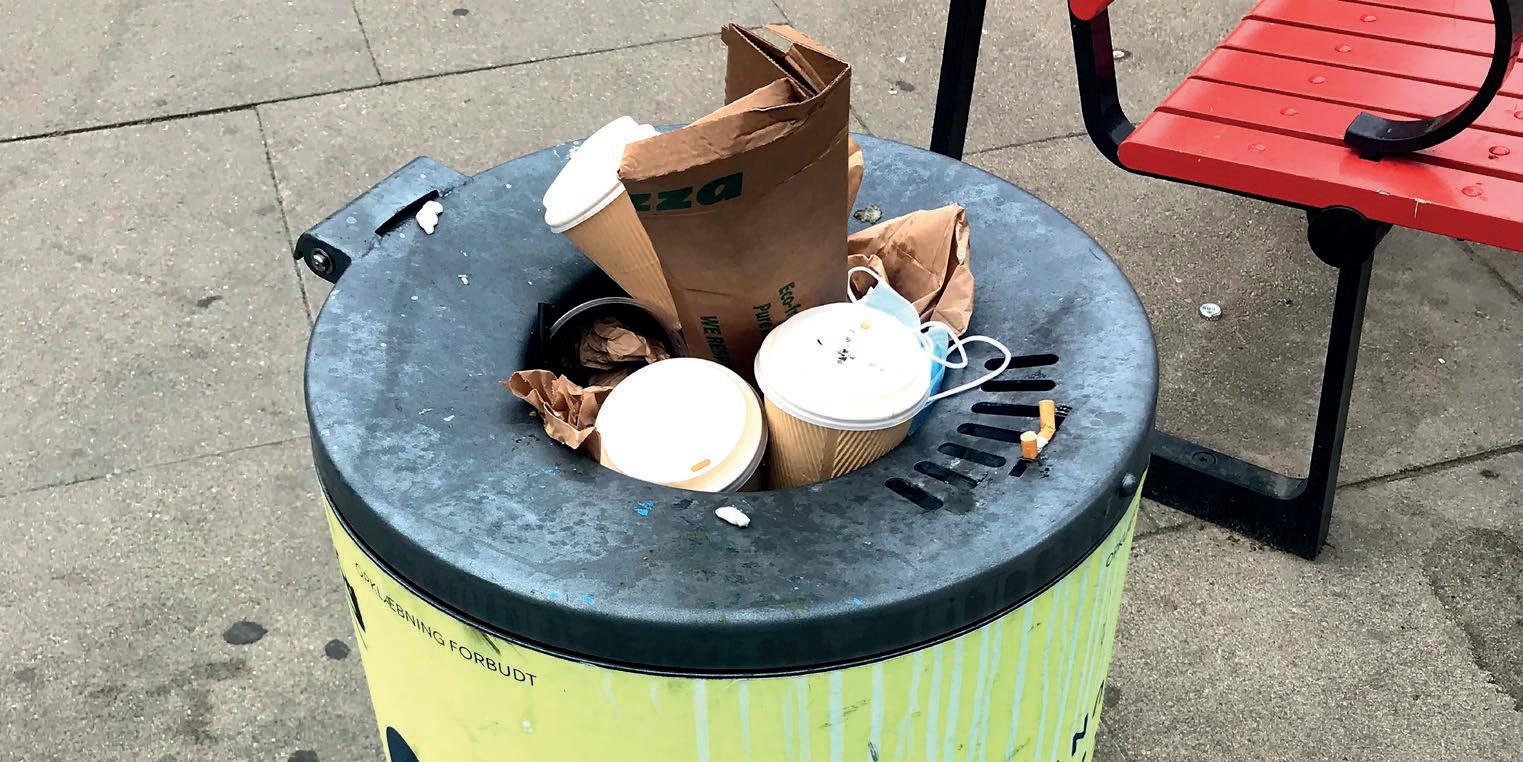
© OCEANA / Naja Andersen
Single use coffee cups in a crowded bin. Copenhagen, Denmark.
© OCEANA / Naja Andersen
Single use coffee cup left in the street.
Research shows that deposit return schemes effectively prevent plastic from ending up in nature.
Legislative measures in other countries and reuse solutions for coffee cups
Several European countries have already adopted legislative measures to support the phasing out of single-use products and promote reuse. France has prohibited the serving of food and beverages in disposable tableware for ‘on-site’ consumption from 1 January 2023.40 Ireland plans to implement the same measure and is also introducing a ‘latte levy’ on single-use cups, alongside an ambition to ban single-use coffee cups completely.41 Germany recently adopted a requirement that all cafés and restaurants serving takeaway food and beverages must, from 2023, offer customers a reusable alternative for their takeaway tableware.42
Solutions for return systems for refillable coffee cups and other takeaway packaging are seen in both Denmark and abroad. In most cases, these systems are still operating at a local scale. One of the most widely used systems is the ‘Freiburg Cup’ in the German city of Freiburg where more than 100 cafés (about 60–70% of all cafés in the city) are part of the system and use the reusable cup for their customers.43 Specific solutions have also been launched in Denmark, and some coffee shops have decided to introduce a DKK 4 tax on single-use cups and/or to stop the use of single-use cups for coffee consumed in the café.
Danes support the phasing-out of single-use plastic and changing over to reusable alternatives
The KantarGallup poll conducted for Oceana in March 2021 shows that Danes predominantly support measures aimed at phasing out single-use plastic and changing to reusable solutions. Ninety percent of Danes surveyed find that single-use plastic should be phased out as much as possible and 80% of respondents agree or mostly agree that disposable plastic such as single-use cups is problematic for the environment.4 At the same time, 75% of respondents
support cafés and takeaway venues being compelled to offer their customers a reusable solution for takeaway food and beverages. Around 60% of respondents agree that a return system for refillable coffee cups should be introduced and that they would use such a system if it existed. The survey also shows that half of the Danes surveyed would support an actual ban on single-use coffee cups.
5 RECOMMENDATIONS
We cannot recycle our way out of plastic pollution problems. As described above, it is virtually impossible to effectively recycle takeaway packaging such as coffee cups. Even if recycling rates went up, this would not prevent single-use cups and other takeaway packaging from polluting natural environments, including our ocean. To solve the problems in earnest, we must get to the heart of the problem: the production and consumption of singleuse plastic must be reduced.
A good place to start is by eliminating single-use plastic at takeaway venues, as these products are a major source of plastic pollution and are essentially unnecessary, because viable refillable alternatives exist. If reuse solutions are to be scaled up and become widespread, a much more ambitious approach is needed, with policy measures to promote the phasing-out of disposable packaging and support reuse and refill solutions.
The study shows that the support for these necessary changes generally cuts across age groups, geography, and political affiliation, although with some variation. The results also show support for reducing the use of single-use coffee cups among those Danes who frequently use disposable coffee cups themselves.
Oceana recommends setting ambitious national targets and establishing concrete policy measures to reduce the use of single-use cups, and thus the volume of single-use cups and other takeaway packaging that end up in the ocean around Denmark.
Oceana recommends:
Denmark should set a national goal to fully phase out single-use coffee cups, with an intermediate target of having at least 50% of all cups on the market be refillable by 2026, and increasing to 80% by 2030.
Denmark could support a changeover to multiple-use products through the introduction of the following national legislative measures:
Prohibit single-use tableware for food and beverages consumed ‘on-site’. Make it mandatory for reusable tableware to be used whenever food and beverages are consumed on-site at cafés and restaurants (including fast food restaurants). The purpose is to support the phase-out of single-use tableware in general and to avoid substituting disposable plastic with single-use products made of other materials that may also be harmful from a climate or environmental perspective, such as single-use ‘bio-plastic’ items.
Make reusable options mandatory at takeaway venues. Make it mandatory for all venues selling takeaway food and beverages to give consumers a reusable packaging option for takeaway food or beverages.
Make reusable tableware mandatory at major events. Make reusable tableware (cups, food containers, etc.) obligatory at major events such as festivals and sports events.
Introduce taxes on disposable takeaway packaging. Introduce a tax on takeaway coffee cups and food containers that can be avoided if the consumer brings his/her own container or uses a refillable cup or container through a deposit return system. The purpose is to regulate consumer behaviour on a par with the tax on carrier bags.
Set up deposit return systems. Support the development and establishment of new reuse and refill systems –such as large-scale deposit systems – for coffee cups and other takeaway containers.
12 13
No disposable tableware Tax on single-use cups No single use-cups Reusable alternatives
AGREE MOSTLY AGREE MOSTLY DISAGREE DON’T KNOW 42 % DISAGREE Single-use
large
like
and
A tax
single
coffee cups should be introduced A deposit return system for reusable coffee cups should be implemented Single-use coffee cups should be banned 33 % 7 % 7 % 11 % 24 % 25 % 21 % 19 % 11 % 28 % 31 % 15 % 18 % 8 % 9 % 9 % 36 % 26 % 10 % 19 % 19 % 33 % 23 % 16 %
To-go outlets should offer costumers reusable solutions for take-away food and drink
cups should be banned at
events
festivals
sport events
on
use
Turn off the plastic tap
A national target to fully phase out single-use coffee cups
1 3 4 5
Five initiatives that could promote reusable solutions and the phasing out of single-use products
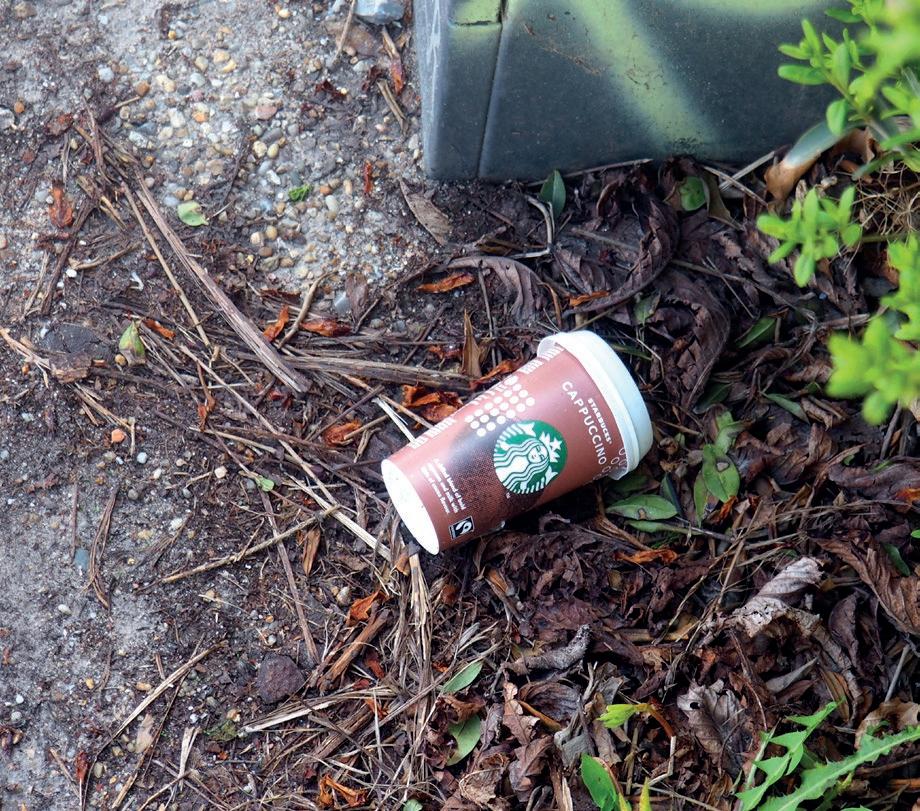
Single use coffee cup from Starbucks lying in the street. Copenhagen, Denmark.
© OCEANA / Naja Andersen
2
REFERENCES
Statistics Denmark. Data retrieved in April 2021. Prices and consumption Survey FU02: Household average consumption by group of consumption and price unit. Available at: www.statistikbanken.dk/FU02
Note: Changes in consumption patterns due to COVID-19 are not included here, as Statistics Denmark’s most recent summary includes statistics from 2019.
Danish Environmental Protection Agency. 2020. Market analysis and charting of disposable plastic products and their alternatives. Odense. 166 pp. Available at: https://www2.mst.dk/Udgiv/publikationer/2020/06/978-87-7038-199-4.pdf
Miller, S., Bolger, M. & Copello, L. 2019. Reusable solutions: how governments can help stop single-use plastic pollution. A study by Rethink Plastic alliance and the Break Free From Plastic movement. Oxford. 20 pp. Available at: https://zerowasteeurope.eu/wp-content/uploads/2019/10/reusable_solutions_report_bffp_rpa.pdf
Norwegian Environment Agency. 2019. Reduced Littering of Single-Use Plastics. Eunomia and Mepex. Trondheim. 128 pp. Available at: https://www.eunomia.co.uk/reports-tools/reducing-littering-of-single-use-plastics/
Dansk Kaffeinformation. 2021. Coffee in numbers. Available at: https://kaffeinfo.dk/kaffeital/
The survey was carried out by KantarGallup for Oceana for the purpose of analysing Danes’ views of single-use plastic, particularly singleuse coffee cups. 1020 Danes aged 18 or older were interviewed. The data material was weighted according to gender, age, region, level of education, and party voted for in the 2019 Danish general election. Survey interviews were carried out online during the period 22-29 March 2021. The survey has a confidence level of 95%.
United Nations Environment Programme. 2021. Single-use beverage cups and their alternatives. Recommendations for life cycle assessments. Paris. 51 pp. Available at: https://www.lifecycleinitiative.org/wp-content/uploads/2021/03/UNEP-D002-Beverage-Cups-Report_lowres.pdf
CupClub. 2018. LCA of CupClub versus alternative coffee cups. Sustainability Report 2018. London. 55 pp.
Available at: https://cupclub.com/news/sustainability-report
Syberg, K., Palmqvist, A., Khan, F.R., Strand, J., Vollertsen, J., Westergaard Clausen, L.P, Feld, L., Hartmann, N.B., Oturai, N., Møller, S., Gissel Nielsen, T., Shashoua, Y. & Foss Hansen, S. 2020. A nationwide assessment of plastic pollution in the Danish realm using citizen science. Scientific Reports 10(1), 1-11. doi: 10.1038/s41598-020-74768-5.
Geyer, R., Jambeck, J. & Lavender Law, K. 2017. Production, use, and fate of all plastics ever made. Science Advances 3(7). doi:10.1126/sciadv.1700782.
Danish Environmental Protection Agency. 2020. Statistics for packaging supply and collection of packaging waste 2018. Packaging statistics 2018 . Odense. 37 pp. Available at: https://www2.mst.dk/Udgiv/publikationer/2020/12/978-87-7038-246-5.pdf
Forrest, A., Giacovazzi, L., Dunlop, S., Reisser, J., Tickler, D., Jamieson, A. & Meeuwig, J.J. 2019. Eliminating plastic pollution: how a voluntary contribution from industry will drive the circular plastics economy. Frontiers in Marine Science, 6, 627. doi: 10.3389/fmars.2019.00627.
Sherrington, C. 2016. Plastics in the Marine Environment. Eunomia. Bristol. 13 pp. Available at: https://www.eunomia.co.uk/reports-tools/plastics-in-the-marine-environment/
Schmidt, C., Krauth, T. & Wagner, S. 2017. Export of plastic debris by rivers into the sea. Environmental Science and Technology , 51(21), 12246–12253. doi: 10.1021/acs.est.7b02368.
Schwarz, A. E., Ligthart, T. N., Boukris, E. & Van Harmelen, T. 2019. Sources, transport, and accumulation of different types of plastic litter in aquatic environments: a review study. Marine Pollution Bulletin 143, 92-100. doi: 10.1016/j.marpolbul.2019.04.029.
European Commission. 2018. Reducing marine litter: action on single use plastics and fishing gear. Commission staff working document. Impact assessment. Brussels. 76 pp.
Available at: https://eur-lex.europa.eu/legal-content/EN/TXT/?uri=CELEX%3A52018SC0254
CIEL. 2019. Plastic & Climate: The Hidden Costs of a Plastic Planet. Washington. 108 pp. Available at: www.ciel.org/plasticandclimate
Borrelle, S.B., Ringma, J., Law, K.L., Monnahan, C.C., Lebreton, L., McGivern, A., Murphy, E., Jambeck, J., Leonard, G.H., Hilleary, M.A., Eriksen, M., Possingham, H.P., De Frond, H., Gerber, L.R., Polidoro, B., Tahir, A., Bernard, M., Mallos, N., Barnes, M. & Rochman, C.M. 2020. Predicted growth in plastic waste exceeds efforts to mitigate plastic pollution. Science 369(6510), 1515-1518. doi: 10.1126/science.aba3656.
Oceana has used the intermediate estimate of Borrelle et al (2020) on the amount of plastic waste discharged from Denmark into its aquatic environment according to the business as usual scenario for 2020. The lower estimate is 7685 tonnes and the upper estimate is 10583 tonnes.
Plastic cups for takeaway cold liquids such as juice, soft drinks, ice-coffee and beer are often made of 100 % polypropylene (PP), expanded polystyrene (EPS) or polyethylene terephthalate (PET).
Gall, S. C. R. & Thompson, C. 2015. The impact of debris on marine life. Marine Pollution Bulletin 92, 170-179. doi: 10.1016/j.marpolbul.2014.12.041.
Rochman, C. M., Browne, M. A., Underwood, A. J., van Franeker, J. A., Thompson, R. C. & Amaral-Zettler, L. A. 2016. The ecological impacts of marine debris: unraveling the demonstrated evidence from what is perceived. Ecology, 97, 302-312. doi: 10.1890/14-2070.1.
Roman, L., Schuyler, Q., Wilcox, C. & Hardesty, B. D. 2020. Plastic pollution is killing marine megafauna, but how do we prioritize policies to reduce mortality?. Conservation Letters e12781. doi: 10.1111/conl.12781.
Aguilar, R., Sánchez, N., Marín, P., Álvarez, H. & Blanco, J. 2020. Plastic in the deep: an invisible problem. Oceana. Madrid. 24 pp. Available at: https://europe.oceana.org/en/publications/reports/plastic-deep-invisible-problem
Hermabessiere, L., Dehaut, A., Paul-Pont, I. Lacroix, C., Jezequel, R., Soudant, P. & Duflos, G. 2017. Occurrence and effects of plastic additives on marine environments and organisms: a review. Chemosphere 182, 781-793. doi: 10.1016/j.chemosphere.2017.05.096.
Rochman, C., Hoh, E., Kurobe, T. & Teh, S.J. 2013. Ingested plastic transfers hazardous chemicals to fish and induces hepatic stress. Scientific Reports 3(1), 1-7. doi: 10.1038/srep03263.
Rochman, C., Tahir, A., Williams, S., Baxa, D.V., Lam, R., Miller, J.F., The, F., Werorilangi, S. & Teh, S. J. 2015. Anthropogenic debris in seafood: plastic debris and fibers from textiles in fish and bivalves sold for human consumption. Scientific Reports, 5(1), 1-10. doi: 10.1038/srep14340.
Available at: https://www.nature. com/articles/srep14340 . Accessed Sep 20, 2020.
Petersen, J. K (ed.), Holm, A. P. S., Christensen, A., Krekoutiotis, D., Jakobsen, H., Sanderson, H., Andreasen, H., Gislason, H., Strand, J., Behrens, J., Hansen, J. W., Svendsen, J. C., Timmermann, K., Møller, L. F., Bach, L., Larsen, M. M., Zrust, M. O., Nielsen, M. M., Eigaard, O. R., Nielsen, P., Stæhr, P. A., Høgslund, S. & Nielsen, T. G. 2018. Man-made impacts on the ocean. Pressure factors other than nutrients and climate change. DTU Aqua-report, no. 336-2018, Department of Aquatic Resources, Technical University of Denmark. Nykøbing Mors. 200 pp. Available at: http://dce.au.dk/fileadmin/dce.au.dk/DCE_foto/Nyhedsfoto/336-2018-Andre-presfaktorer-end-kvaelstof-og-klimaforandringer__3_.pdf
29
Shen, M., Song, B., Zeng, G., Zhang, Y., Huang, W., Wen, X. & Tang W. 2020. Are biodegradable plastics a promising solution to solve the global plastic pollution? Environmental Pollution 263, 114469. doi: 10.1016/j.envpol.2020.114469.
Zimmermann, L., Dombrowski, A., Völker, C. & Wagner, M. 2020. Are bioplastics and plant-based materials safer than conventional plastics? In vitro toxicity and chemical composition. Environment International 145, 106066. doi: 10.1016/j.envint.2020.106066.
31
Taufik, D., Reinders, M. J., Molenveld, K. & Onwezena, M. C. 2020. The paradox between the environmental appeal of bio-based plastic packaging for consumers and their disposal behaviour. Science of The Total Environment,705, 135820. doi: 10.1016/j.scitotenv.2019.135820
32 33 Danish Ministry of Environment. 2020. Action plan for a circular economy. National plan for prevention and waste management 2020-2032. 181 pp. Available at: https://prodstoragehoeringspo.blob.core.windows.net/0cdb3dae-88c9-444b-a3d7283ff83fc217/H%C3%B8ringsudkast_Handlingsplan%20for%20cirkul%C3%A6r%20%C3%B8konomi_National%20plan%20for%20 forebyggelse%20og%20h%C3%A5ndtering%20af%20affald%202020-2032.pdf
Danish Environmental Protection Agency. 2020. Mapping of campaigns and studies on littered waste in neighbouring countries and study on littering behaviour. Odense. 26 pp. Available at: https://www2.mst.dk/Udgiv/publikationer/2020/03/978-87-7038-167-3.pdf
Lee, D. S., Fahey, D. W., Skowron, A., Allen, M. R., Burkhardt, U., Chen, Q., Doherty, S. J., Freeman, S., Foster, P. M., Fuglestvedt, J., Gettelman, A., De Leçopn, R. R., Lim, L. L., Lund, M. T., Millar, R. J., Owen, B., Penner, J. E., Pitari, G., Prather, M. J., Sausen, R. & Wilcox, L. J. 2021. The contribution of global aviation to anthropogenic climate forcing for 2000 to 2018. Atmospheric Environment, 244, 117834. doi: 10.1016/j.atmosenv.2020.117834.
Directive (EU) 2019/904 of the European Parliament and of the Council of 5 June 2019 on the reduction of the impact of certain plastic products on the environment. Available at: https://eur-lex.europa.eu/eli/dir/2019/904/oj
Danish Government. 2020. Agreement between the Danish government (the Social Democratic Party) and the Liberal party, the Social Liberal Party, the Socialist People’s Party, the Red-Green Party, the Conservative Party, the Liberal Alliance and the Alternative on a climate plan for a green waste sector and circular economy of June 2020. Available at: https://www.regeringen.dk/media/9591/aftaletekst.pdf
The Pew Charitable Trusts and SystemlQ. 2020. Breaking the plastic wave. A comprehensive assessment of pathways towards stopping ocean plastic pollution. 154 pp. Available at: https://www.pewtrusts.org/-/media/assets/2020/07/breakingtheplasticwave_report.pdf
Zero Waste Europe. 2020. Reusable vs. single-use packaging. A review of environmental impacts. 78 pp. Available at: https://zerowasteeurope.eu/wpcontent/uploads/2020/12/zwe_reloop_report_reusable-vs-single-use-packaging-a-review-of-environmental-impact_en.pdf.pdf_v2.pdf
Nordic Sustainability and PlanMiljø for the Danish Society for Nature Conservation Agency. 2021. From single-use packaging to reuse: How to make Denmark a leader in circular business models. 44 pp. Available at: https://www.dn.dk/media/82262/rapport_fra-engangsemballage-til-genbrug.pdf
National Assembly and Senate of France. ACT no. 2020-105 of 10 February 2020 on combating waste and the circular economy. Available at: https://www.legifrance.gouv.fr/jorf/id/JORFTEXT000041553759/
Government of Ireland. 2020. A Waste Action Plan for a Circular Economy. Ireland’s National Waste Policy 2020-2025. Available at: https://www.gov.ie/en/publication/4221c-waste-action-plan-for-a-circular-economy/
German Federal Ministry of Environment, Nature Conservation and Nuclear Safety. 2021. Bill to implement requirements of the Single-Use Plastics Directive and the Waste Framework Directive in the Act on Packaging and other acts. Available at: https://www.bmu.de/gesetz/ entwurf-eines-gesetzes-zur-umsetzung-von-vorgaben-der-einwegkunststoffrichtlinie-und-der-abfallrahme/
Zero Waste Europe. 2018. The Story of the Freiburg Cup. How a city is ditching disposable coffee cups. 8 pp. Available at: https://zerowasteeurope.eu/wp-content/uploads/2018/09/FreiburgCupfinal.pdf
Contact
Central Office - Madrid, Spain
Email: europe@oceana.org
EU Office - Brussels, Belgium
Email: brussels@oceana.org
North Sea and Baltic OfficeCopenhagen, Denmark Email: copenhagen@oceana.org
UK Office - London, UK
Email: oceanauk@oceana.org
14
1 27 2 28 3 4 5 6 7 8 9 10 11 12 13 14 15 16 17 18 19 20 22 23 24 25 26 21 © OCEANA / Eduardo de Ana
30
34 35 36 37 38 39
40 41 42 43
Follow @OceanaEurope on Facebook Instagram Twitter