Issue no. 1
Inverno | Winter 2025 isbn 978-88-90-45147-8

Issue no. 1
Inverno | Winter 2025 isbn 978-88-90-45147-8

Dopo venti edizioni dell’Annuario Scienza Tecnologia e Società, i dati e le ricerche di Observa trovano una nuova veste editoriale. Non più un volume annuale ma un magazine che uscirà con cadenza periodica, online e in formato cartaceo.
Da quest’anno cambia anche la modalità per aderire a Observa e sostenere le attività nel campo dei rapporti tra scienza, tecnologia e società. Nasce Observa Community: chi entra a farne parte riceverà a casa il magazine e le altre pubblicazioni, potrà partecipare gratuitamente a tutte le iniziative e accedere ai materiali di ricerca riservati. Tutte le informazioni per l’iscrizione sono disponibili sul sito.
Observa Science in Society è un centro di ricerca indipendente, senza fini di lucro, legalmente riconosciuto, che promuove la riflessione sui rapporti tra scienza e società, favorendo il dialogo tra ricercatori, policy makers e cittadini.
Dal 2003, con l’Osservatorio Scienza Tecnologia e Società, conduce un monitoraggio permanente sui rapporti tra cittadini e scienza. Dal 2005 ha pubblicato l’Annuario Scienza Tecnologia e Società, una raccolta ragionata di informazioni e dati provenienti dalle più autorevoli fonti nazionali e internazionali, utili per comprendere lo stato e le trasformazioni della ricerca e dell’innovazione nella nostra società.
Resta aggiornato su sito, social e newsletter Observa [ QR I ] e iscriviti alla Observa Community per ricevere inviti e pubblicazioni! Per iscriverti compila il form di iscrizione [QR II] e invia la distinta della quota di adesione a segreteria@observanet.it
Scienza Tecnologia e Società
Il magazine di Observa Science in Society Issue no. 1, Inverno | Winter 2025
Scienza Tecnologia e Società è un progetto di | is a project by Observa Science in Society
Tutte le attività di Observa sono supervisionate da un comitato scientifico internazionale e interdisciplinare. | All Observa activities are supervised by an international and interdisciplinary scientific committee.
Observa — Science in Society
Viale Fusinieri, 65 36100, Vicenza (IT) +39 0444 212525 observa@observanet.it www.observa.it
Direttivo di ricerca | Research board: Massimiano Bucchi
Giuseppe Pellegrini
Andrea Rubin
Barbara Saracino
Consiglio editoriale | Editorial board: Massimiano Bucchi
Andrea Rubin
Francesco Seganfreddo
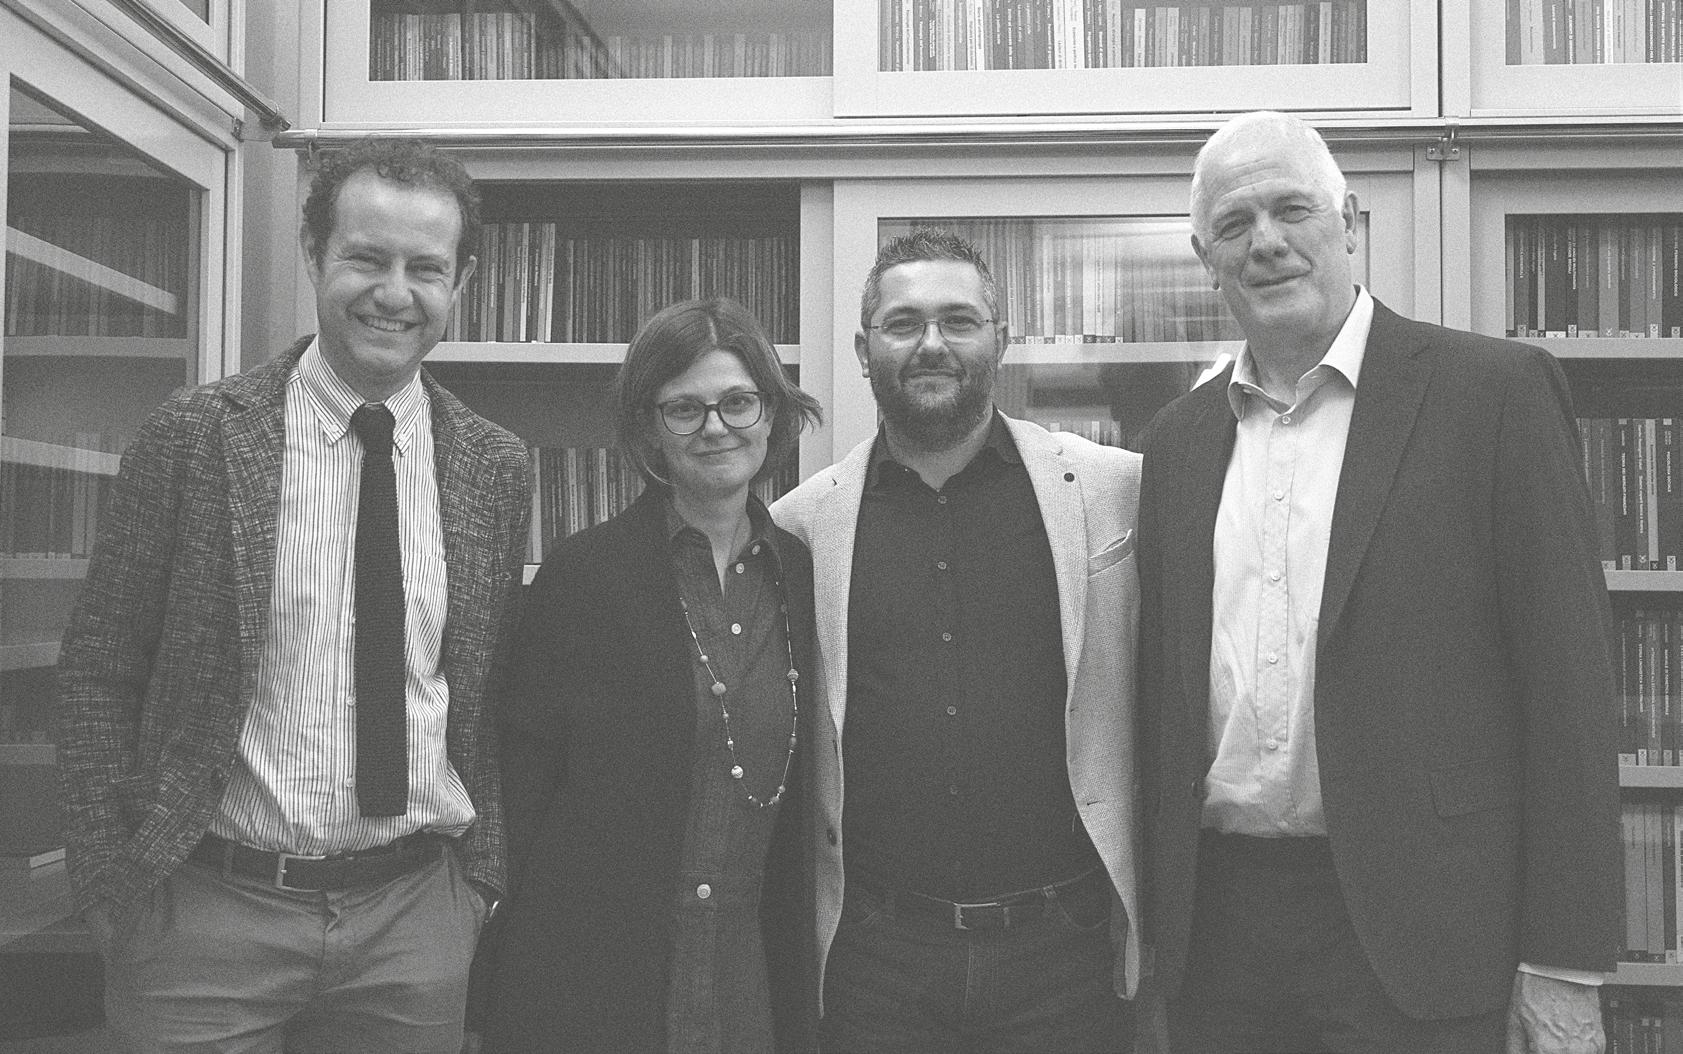
Fotografie: Observa Science in Society
Layout grafico | Graphic design: Martina Negroni
Caratteri tipografici | Typefaces: Eb Garamond, 2017 – OFL IBM Plex Sans, 2017 – OFL
Stampa | Print: Gestioni Grafiche Stocchiero
Finito di stampare nel febbraio 2025 | Finished printing on February 2025
ISBN 978-88-90-45147-8
© 2025, Observa Science in Society
Tutti i diritti sono riservati | All rights reserved.

Giuseppe

Cresce l’alfabetismo scientifico, cambia il modo di informarsi su scienza e tecnologia. Grande fiducia in scienza e scienziati, il giudizio sul loro ruolo comunicativo è spesso critico


Alfabetismo scientifico
I nuovi dati dell’Osservatorio Scienza, Tecnologia e Società mettono in luce un aumento del cosiddetto “alfabetismo scientifico”. Quest’ultimo è rilevato, come ogni anno, considerando la capacità di rispondere a cinque domande: 1 ) Gli elettroni sono più piccoli degli atomi VERO; 2 ) Gli antibiotici uccidono sia i virus che i batteri falso; 3 ) Il sole è un pianeta falso; 4 ) L’azoto è l’elemento più diffuso nell’aria Vero; 5 ) Il bit è l’unità di misura della quantità di informazione vero. I dati del 2024 mostrano un aumento di coloro che sanno rispondere correttamente a tutte e cinque le domande o almeno a quattro (42,6 %) e, al tempo stesso, una diminuzione di quanti non sono in grado di rispondere a nessuna domanda o al massimo a una sola [ Fig. 1 ]
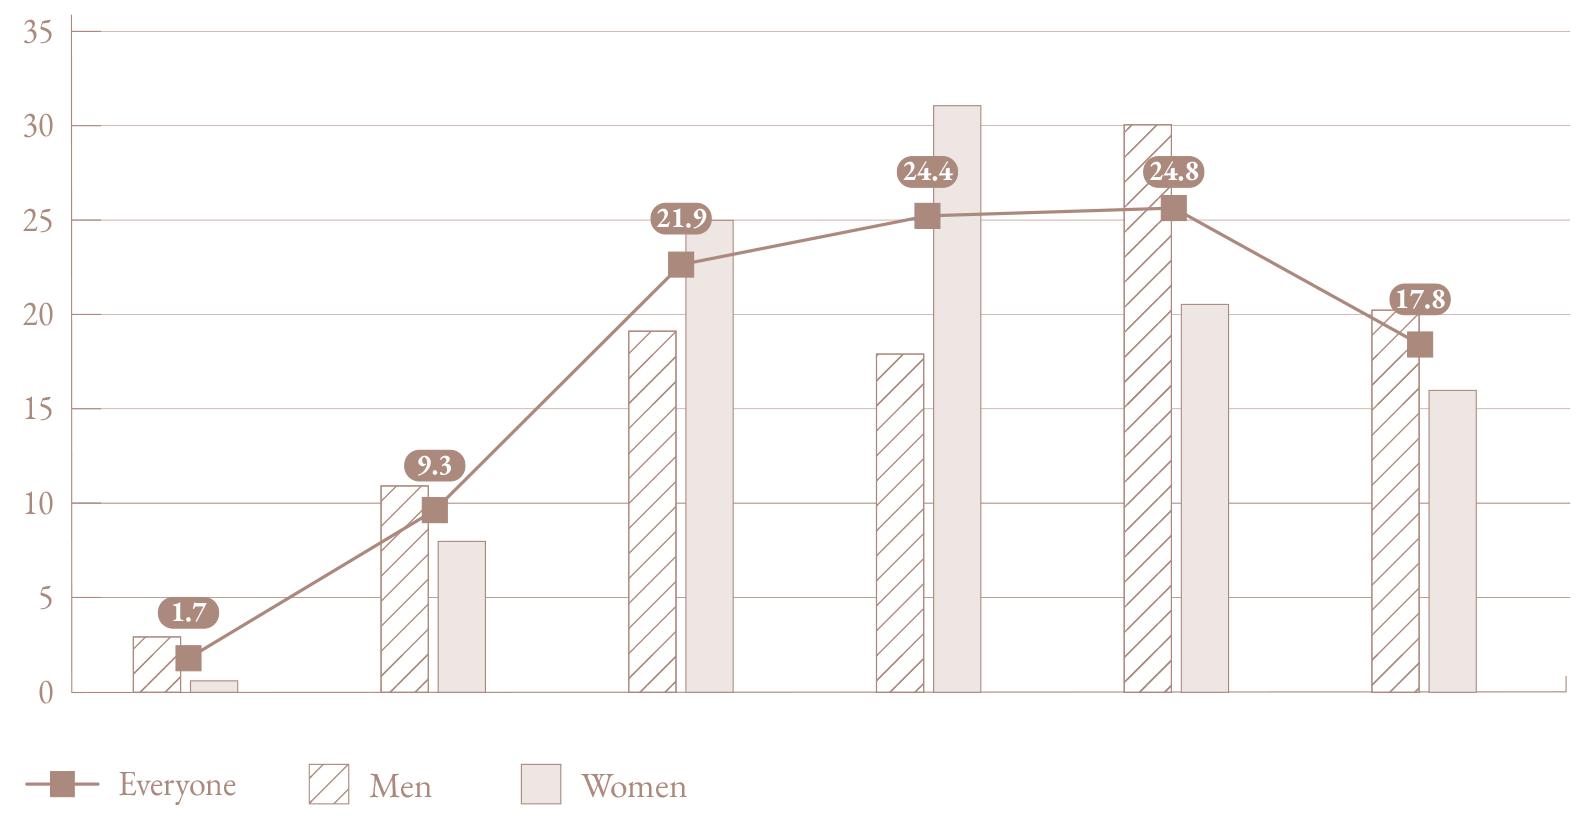
L’alfabetismo cresce con il livello di istruzione, soprattutto a vantaggio dei laureati. Vi è poi una differenza abbastanza evidente rispetto al genere [ Fig. 1I ]. Quasi la metà degli uomini, infatti, sa rispondere esattamente ad almeno quattro domande (49,7 %), contro poco più di un terzo delle donne (36,1 %).
Gli elettroni sono più piccoli degli atomi
Il sole è un pianeta Gli antibiotici uccidono sia virus sia batteri
L’azoto è l’elemento più diffuso nell’aria
Il bit è l’unità di misura della quantità di informazione
FIG. i Indice di alfabetismo scientifico ( % di risposte corrette alle cinque domande, 2018: n = 985; 2019: n = 978; 2020: n = 979, 2021: n = 977; 2022: n = 1015; 2023: n = 995; 2024: n = 998)
iI Alfabetizzazione scientifica secondo il genere (2024: n = 998)
Esposizione alla scienza fra canali tradizionali e social media
Considerando l’accesso a contenuti scientifici e tecnologici attraverso i giornali, la televisione, oppure il web, si nota come la stampa quotidiana e periodica (cartacea o online) sia sempre meno usata [ Fig. 1II ]; infatti, nel 2024 soltanto un italiano su tre (33,2 %) ha letto almeno una notizia scientifica alla settimana su un giornale, mentre è variato di poco il numero di coloro che si sono informati attraverso la televisione (55,9 %), oppure su internet (52 %). Emergono anche qui differenze di genere, in quanto gli uomini hanno fruito molto più delle donne di informazioni sulla scienza su tutti i tipi di media. Come prevedibile, differenze notevoli sussistono pure in base al titolo di studio, a vantaggio dei laureati; mentre l’età incide solo parzialmente, poiché vi è una diminuzione dopo i 45 anni, ma il livello più basso in assoluto è raggiunto tra gli under 30.
Guardare trasmissioni televisive che parlano di scienza e tecnologia
Leggere articoli che parlano di scienza su giornali quotidiani
Consultare siti web/blog su scienza e tecnologia
Fig. III Esposizione a contenuti scientifici (almeno una volta a settimana, 2011: n = 1001; 2012: n = 995; 2013: n = 1005; 2014: n = 1040; 2015 = 999; 2016: n = 1002; 2017: n = 997; 2018: n = 985; 2019: n = 978; 2020: n = 979, 2021: n = 977; 2022: n = 1015; 2023: n = 995; 2024: n = 998)
Dal momento che una quantità crescente di informazioni passa attraverso i nuovi media digitali, è interessante rilevare se gli intervistati seguano qualche scienziato o scienziata o istituzione di ricerca sui social media. Se nel 2015 lo facevano in pochi (l’11,4 %), nel 2024 tale valore è quasi quadruplicato (42,6 %), a dimostrazione di come la scienza stia diventando popolare anche sulle piattaforme social. I followers sono inoltre molto più numerosi fra quanti possiedono un titolo di studio elevato: il 56,3 % dei laureati segue almeno una scienziata o scienziato o un istituto di ricerca; fra i diplomati lo fa il 47,4 %, mentre per chi ha terminato solo la scuola dell’obbligo tale quota si ferma al 35,4 %.
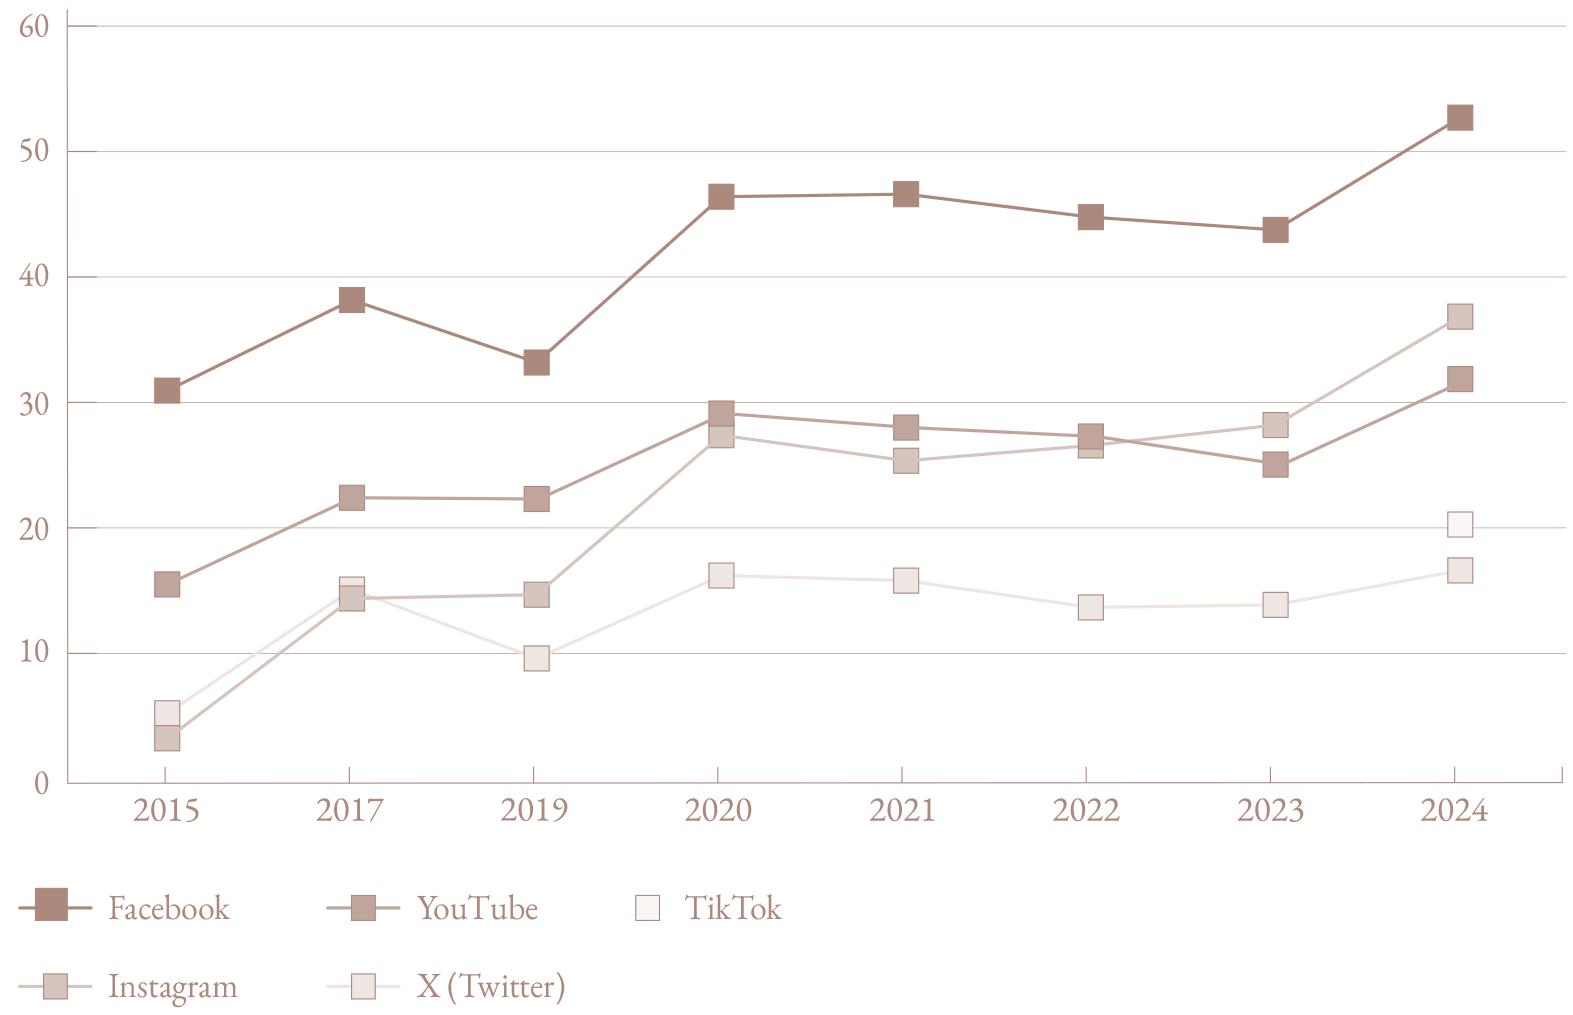
Condividere sui social un post, un video, o una notizia scientifica non è solo un modo per connettersi con gli altri, ma anche per diffondere una scoperta, un consiglio utile o una curiosità. Fra gli scienziati e gli esperti, ad esempio, vi sono ormai numerosi influencer: basti pensare alle pagine dei virologi durante la recente pandemia di COVID-19, oppure a quelle di alcuni divulgatori scientifici, come Alberto Angela, o alle pagine degli astronauti, come Samantha Cristoforetti, o degli esperti climatologi. Il 2024 registra il picco più elevato di coloro che dichiarano di aver condiviso contenuti relativi a scienza e tecnologia rispetto alle rilevazioni precedenti. Su Facebook – il social più diffuso nel nostro paese – oltre metà degli italiani ha condiviso almeno un post con contenuti scientifici nell’ultimo anno (52,4 %) [ Fig. 1V ]; meno di 10 anni fa, nel 2015, lo aveva fatto circa un terzo (31,0 %). Valori più bassi sono dichiarati per Instagram (36,8 %), YouTube (31,9 %), e per il social preferito dai giovanissimi: TikTok (20,5 %).
Fig. IV Condivisione di informazioni scientifico tecnologiche sui canali social nel corso dell’ultimo anno (qualche volta o spesso, 2015: n=999; 2017: n=997; 2019: n=978; 2020: n=979; 2021: n=977; 2022: n=1015; 2023: n=995; 2024: n=998)
La condivisione di contenuti relativi a scienza e tecnologia è distribuita in modo trasversale rispetto a genere, età e titolo di studio, a dimostrazione di come i social media e il loro uso siano ormai diffusi in tutti gli strati della popolazione. Anche il numero di coloro che hanno letto o visto contenuti relativi a scienza e tecnologia sui social è aumentato. Su Facebook e YouTube questo interesse coinvolge oltre tre italiani su quattro (77,9 % e 76,5 %, rispettivamente), quasi raddoppiando rispetto al 2015 (42,7 % e 39,9 %, rispettivamente). Molto usati sono pure Instagram (59,9 %) e TikTok (34,5 %). Ciò significa che alla minor esposizione a contenuti scientifici e tecnologici sulla stampa fa da contraltare (ovviamente in modo diverso) quella attraverso i nuovi mezzi di comunicazione. L’incontro con la scienza può avvenire
anche visitando musei o mostre, partecipando a incontri, dibattiti, festival della scienza, oppure a manifestazioni di protesta o mobilitazioni su questioni scientifiche o tecnologiche, come ad esempio per la costruzione di grandi opere.
Nel 2024 coloro che hanno preso parte a queste attività sono aumentati, soprattutto per quel che riguarda la visita a musei o mostre scientifiche: nel corso dell’ultimo anno vi hanno partecipato quasi sei italiani su dieci (59,8 %), mentre nel 2022 erano quasi la metà (39,2 %) [ Fig. v ]. In generale vi è stato un incremento per tutte le attività, comprese le mobilitazioni e le proteste che hanno coinvolto quasi un italiano su cinque (19,4 %). La partecipazione è più diffusa tra i giovani e cresce all’aumentare del titolo di studio, tranne che per le manifestazioni di protesta per cui non si registrano differenze significative.
Partecipare a incontri o dibattiti pubblici su scienza e tecnologia
Partecipare a manifestazioni di protesta su questioni scientifiche e tecnologiche
Partecipare ad un festival della scienza
Visitare musei della scienza o mostre scientifiche
Fig. V Partecipazione a eventi o manifestazioni riguardanti questioni scientifiche o tecnologiche (almeno una volta nell’ultimo anno, %, 2007: n = 998; 2009: n = 1020; 2011: n = 1001; 2013: n = 1005; 2015 = 999; 2017: n = 997; 2019: n = 978; 2022: n = 1015; 2024: n = 998)
La fiducia e le opinioni sulla scienza e sugli scienziati
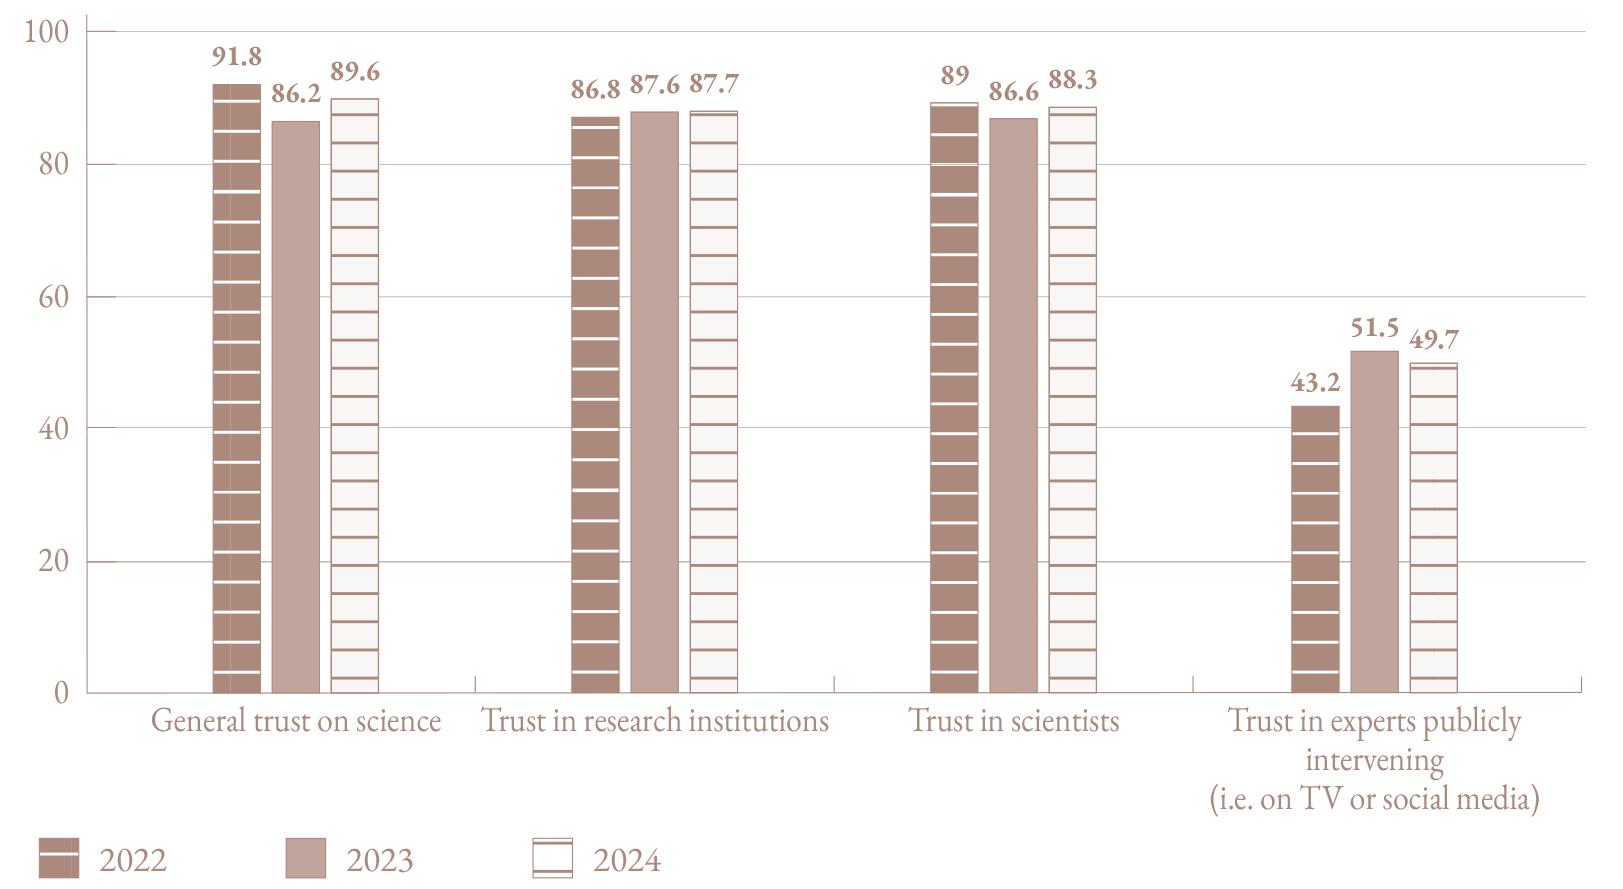
La grande maggioranza degli italiani, quasi nove su dieci, afferma di avere fiducia nella scienza, nelle istituzioni di ricerca e negli scienziati [ Fig. v1 ]. La fiducia si collega al bisogno di trovare risposte rassicuranti ad eventi altamente drammatici, come la pandemia da COVID-19, i cambiamenti del clima o le malattie più gravi, facendo aumentare le aspettative verso chi nella società è impegnato nella ricerca di mitigarne gli effetti dannosi.
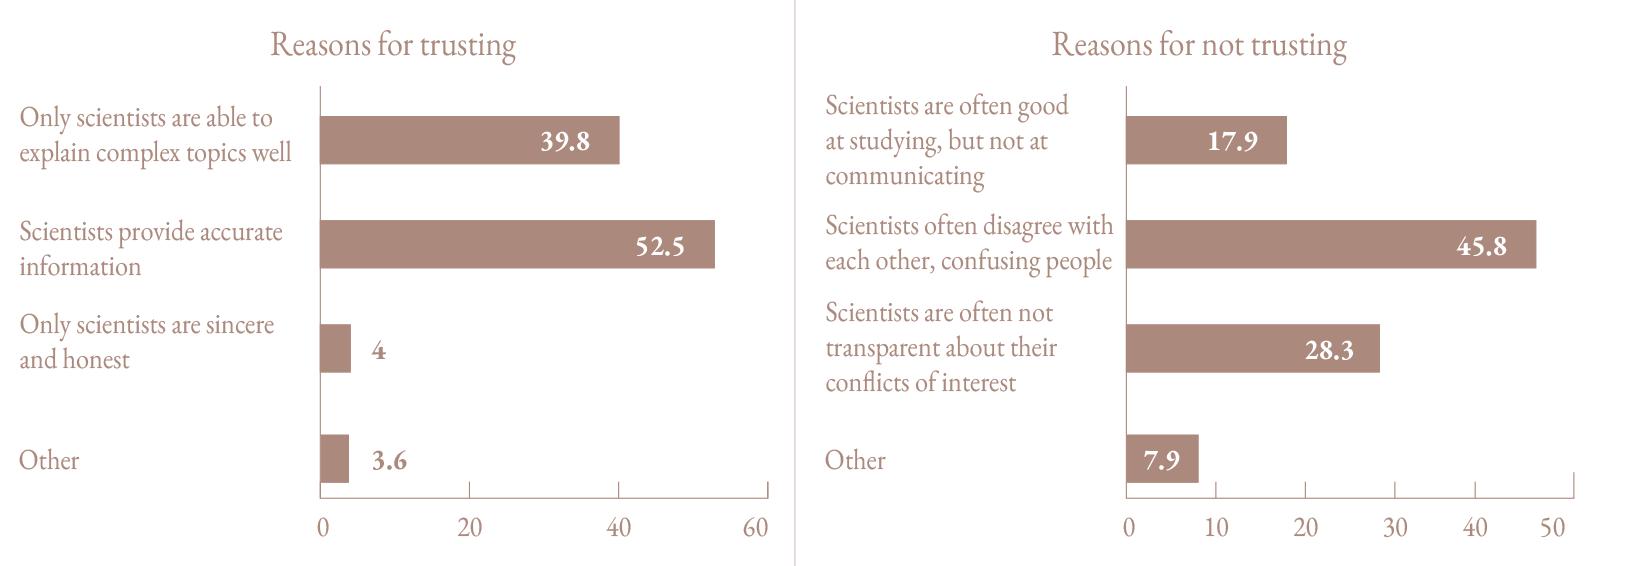
È soprattutto chi possiede un titolo di studio elevato ad avere più fiducia, così come quanti si informano più spesso di scienza e tecnologia. Minor credito viene dato invece agli esperti che intervengono pubblicamente, ad esempio in TV o sui social. Si fida di loro poco meno della metà degli italiani (49,7 %), a testimonianza di come non tutti coloro che parlano di scienza siano ritenuti adatti a farlo. Chi è diffidente lo è soprattutto perché ritiene che gli esperti esprimano opinioni in disaccordo fra di loro creando confusione (45,8 %) [ Fig. vi1 ], oppure perché sono poco trasparenti sui loro conflitti di interesse (28,3 %) o, infine, perché non sono reputati bravi a comunicare (17,9 %). Al contrario, chi si fida ne apprezza la capacità di fornire informazioni accurate (52,5 %) o li ritiene gli unici in grado di spiegare chiaramente temi complessi.
Un tema che emerge implicitamente, anche in rapporto alla diffusione dei social media e del loro uso da parte degli scienziati, è quello della personalizzazione che rischia di andare a scapito della chiarezza dei contenuti.
nella scienza, nelle istituzioni di ricerca, negli scienziati e negli esperti che intervengono pubblicamente ( % di chi ha molta o abbastanza fiducia. 2022: n = 1015; 2023: n = 995; 2024: n = 998)
Gli scienziati sono gli unici in grado di spiegare bene temi complessi
Gli scienziati forniscono informazioni accurate
Solo gli scienziati sono sinceri e onesti
Perché non ha fiducia
Spesso gli scienziati sono bravi a studiare, ma non a comunicare
Spesso gli scienziati sono in disaccordo tra loro, creando confusione alle persone
Spesso gli scienziati non sono trasparenti sui loro conflitti di interesse
L’Osservatorio registra da molti anni anche una serie di giudizi sul ruolo della scienza e della tecnologia nella società. Il primo riguarda l’accordo con l’affermazione che solo la scienza può dirci la verità sull’uomo e sul suo posto nella natura. Nel 2009 la pensavano in questo modo quasi sei italiani su dieci (59,0 %). Nel corso degli anni questa visione si è consolidata fino ad essere condivisa da oltre otto italiani su dieci nel 2024 (81,8 %).
Il secondo ritiene che la scienza e la tecnologia cambino troppo velocemente il nostro stile di vita. Tale visione ha subito un andamento altalenante nel tempo e nel 2024 è condivisa da poco meno di tre italiani su quattro (72,9 %). Vi è inoltre una certa spaccatura fra gli under 30, che mostrano minor preoccupazione, e il resto della popolazione. Fare parte dei Millennials, o comunque essere nato verso la fine del secolo scorso, porta ad affrontare le novità tecnologiche con più fiducia. I nativi digitali ritengono, infatti, molto meno che i cambiamenti siano troppo rapidi (56,3 %).
Il terzo giudizio riguarda un’eventuale limitazione della libertà degli scienziati da parte della religione. La pensa così circa metà degli italiani (50,8 %), con valori che rimangono pressoché stabili rispetto agli anni precedenti. L’età incide non poco, dato che sono gli over 60 a ritenere maggiormente che la religione non rappresenti un limite.
Infine, l’ultimo giudizio riguarda il ruolo della scienza e della tecnologia come potenziali responsabili di problemi ambientali. Nel 2024 questo giudizio perde rilevanza: a indicarlo sono, infatti, oltre uno su tre nel 2024 (37,3 %), mentre nelle rilevazioni precedenti erano sempre più della metà (52 % nel 2018). La colpevolizzazione della scienza è condivisa soprattutto da coloro che possiedono un titolo di studio molto basso (al massimo la scuola media, 43,3 %) rispetto a diplomati e laureati (30 % circa per entrambi).
In sintesi, i dati dell’Osservatorio Scienza Tecnologia e Società 2024 confermano tendenze di lungo periodo come l’aumento dell’alfabetismo scientifico e il cambiamento negli stili informativi e di accesso ai contenuti su scienza e tecnologia. Resta molto elevata la fiducia in scienza, scienziati e istituzioni di ricerca, ma non va sottovalutato il giudizio critico sul ruolo comunicativo degli esperti scientifici.
L’Osservatorio Scienza Tecnologia e Società è, dal 2003, un monitoraggio permanente dei comportamenti e delle opinioni degli italiani su questioni relative a scienza e tecnologia. L’indagine viene svolta su tutto il territorio e coinvolge, attraverso un misto di tecniche CATI (Computer Assisted Telephone Interviewing) e CAWI (Computer Assisted Web Interviewing), un campione di 1000 casi, proporzionale e rappresentativo per genere, classe d’età e provincia di residenza della popolazione con età maggiore o uguale ai 15 anni.
Considerando il titolo di studio una variabile rilevante, dopo ogni rilevazione il campione ottenuto viene pesato per rendere la sua struttura corrispondente a quella della popolazione italiana rispetto alle variabili genere, classe d’età e titolo di studio.
La rilevazione del 2024 è stata effettuata tra il 10 e il 23 aprile intervistando 1000 unità. I dati sono stati raccolti con la tecnica CATI per il 20 % del campione e con la tecnica CAWI per il restante 80 %.
In Italia cresce l’uso dell’Intelligenza Artificiale (soprattutto generativa) ma resta la preoccupazione per le implicazioni e la richiesta di regolamentazione


Da decenni l’Intelligenza Artificiale (IA) non rappresenta più un miraggio fantascientifico ma è ampiamente utilizzata in numerose applicazioni quotidiane come i social media, i siti web di e-commerce e gli assistenti vocali. Negli ultimi anni l’Intelligenza Artificiale ha visto accrescere notevolmente la propria rilevanza e sta rapidamente diventando parte integrante della vita quotidiana, trasformando il modo in cui i cittadini lavorano, trascorrono il tempo libero e ricevono servizi essenziali, dal delivery ai servizi di banking fino all’assistenza medico-sanitaria. La rilevanza pubblica di queste tecnologie ha suscitato un ampio interesse tra i ricercatori e ha prodotto un proliferare di considerazioni etiche, giuridiche, economiche e sociali. Dal novembre 2022, quando OpenAI ha reso disponibile la nuova versione di ChatGPT, l’Osservatorio Scienza Tecnologia e Società di Observa ha monitorato la conoscenza, gli atteggiamenti e l’immagine pubblica dell’IA tra i cittadini italiani. La nuova indagine condotta nel 2024 ha inteso monitorare gli sviluppi di alcuni aspetti già considerati nel 2023 (immaginario, fonti di informazione, opinioni sull’IA generativa), sviluppando parallelamente un approfondimento su nuove dimensioni connesse all’IA: dispositivi usati, fiducia, opinioni, aspettative ed emozioni.
A cosa pensano gli italiani quando sentono parlare di IA
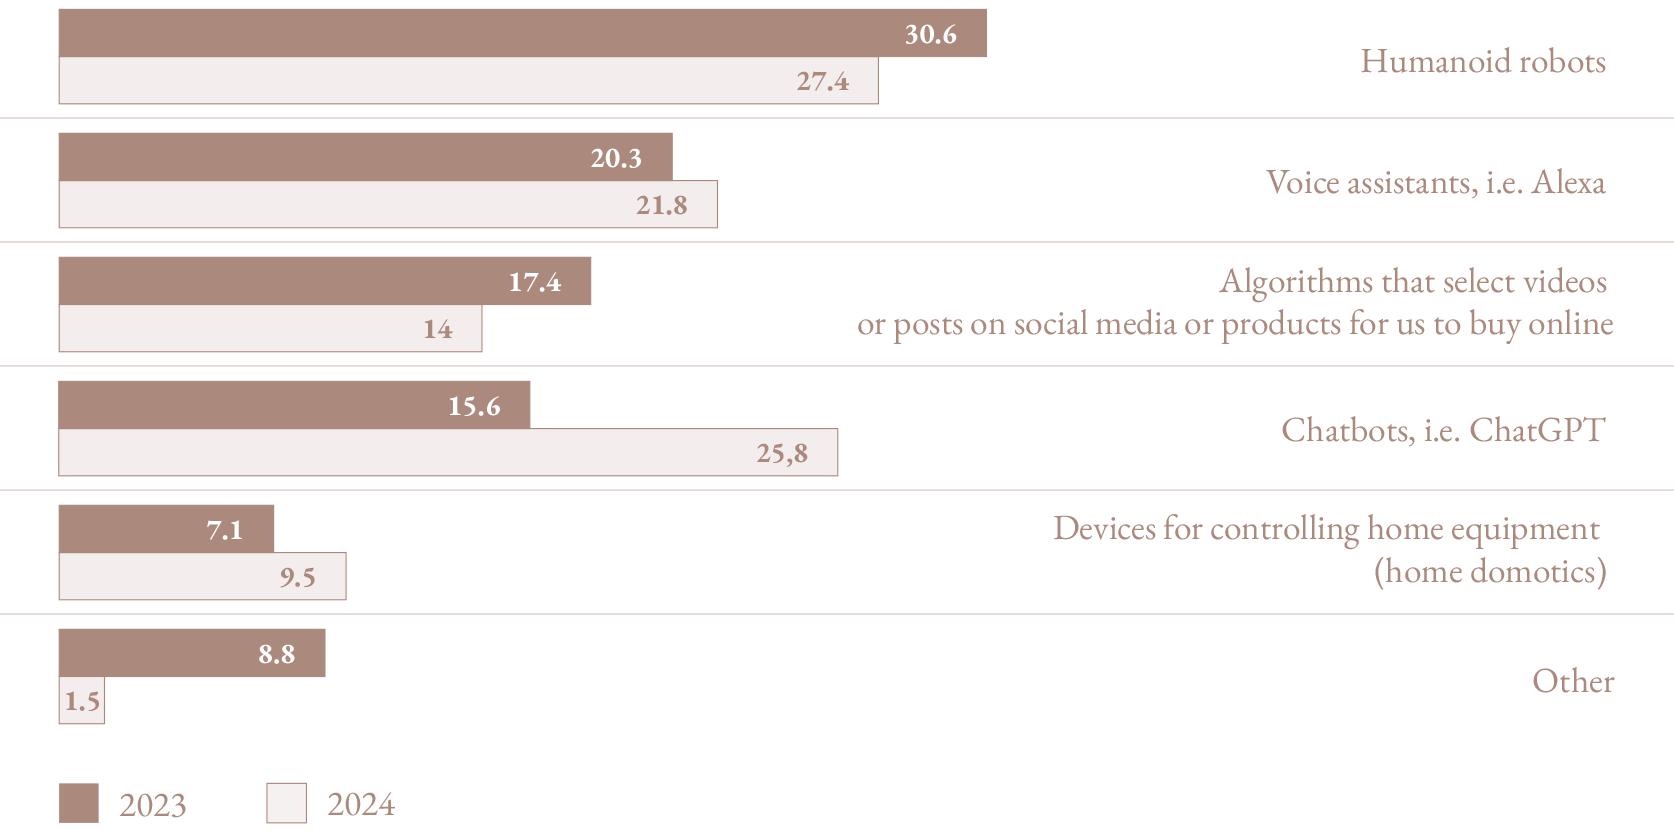
Qual è attualmente la rappresentazione sociale dell’Intelligenza Artificiale che permea l’immaginario collettivo degli italiani? Metafore, immagini e narrazioni consentono di orientarsi e classificare eventi o artefatti che sono “nuovi” (e, pertanto, non sono familiari) mettendoli in rapporto con le categorie sociali provenienti dall’esperienza e dalle conoscenze pregresse. L’Intelligenza Artificiale risente, a livello di rappresentazione pubblica, delle numerose opere letterarie e cinematografiche (per lo più ascrivibili al genere fantascientifico) che l’hanno descritta, narrata, e talvolta anticipata, per molto tempo. Anche nell’ultima rilevazione, i cittadini italiani, infatti, tendono ad associare l’espressione ‘Intelligenza Artificiale’ prevalentemente ai robot umanoidi: è il 27 % a indicarlo, leggermente inferiore alla quota del 2023 (31 %). Sebbene l’immaginario pubblico rimanga comunque ancorato a un’immagine di Intelligenza Artificiale “umanoide” [ Fig. 1 ], l’ampio dibattito sugli strumenti di Intelligenza Artificiale generativa che ha coinvolto i media negli ultimi due anni ha fatto si che nel 2024 l’IA venga associata dal 26 % dei cittadini alla piattaforma ChatGPT. Una crescita di oltre 10 punti percentuali rispetto al 2023 quando era il 16 % a indicare questa opzione. Tra le associazioni più frequenti, seguono gli assistenti vocali (come Alexa o Siri, per esempio) indicati da due cittadini su dieci sia nel 2024 che nel 2023. Rimane pressoché invariato il livello di associazione con i dispositivi per la domotica (9,5 % nel 2024, 7 % nel 2023).
Selezione e gestione dei lavoratori
Algoritmi che selezionano per noi video o post sui social o prodotti da acquistare online
Dispositivi per il controllo delle apparecchiature domestiche (domotica)
Utilizzo e giudizio dell'IA
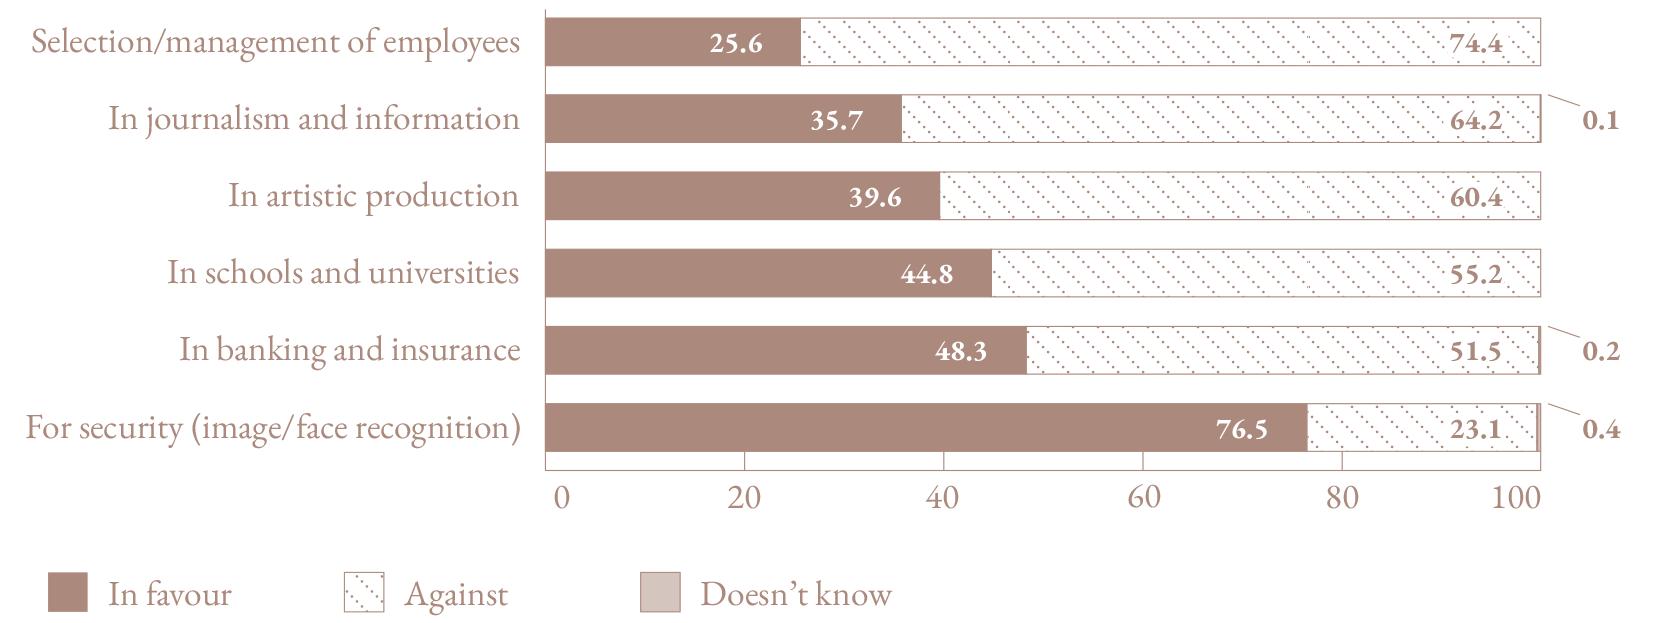
L’impiego di robot umanoidi nelle nostre case o nella nostra vita quotidiana non si è ancora affermato. Ma quali sono i dispositivi effettivamente usati? Nel 2023, tra gli strumenti che utilizzavano l’Intelligenza Artificiale, il 41 % degli italiani indicava di ricorrere soprattutto agli assistenti vocali, mentre solo l’11 % aveva usato un chatbot come ChatGPT. Nel 2024, la quota di italiani che usa gli assistenti vocali è salita al 49 % e quella di chi ha sperimentato un chatbot è pari a un cittadino su quattro. Circa tre italiani su dieci usano dispositivi per il controllo delle apparecchiature domestiche e due su dieci ha utilizzato degli algoritmi per creare immagini o video. L’Intelligenza Artificiale potrebbe essere impiegata in molti settori ma solo in pochi casi questa pratica riscontrerebbe l’approvazione da parte dei cittadini [ Fig. II ]. Il 76,5 % degli italiani è favorevole all’uso dell’IA per la sicurezza, per esempio attraverso il riconoscimento di immagini e volti, ma appare assai più cauto nel caso dell’impiego in settori come quello bancario o assicurativo e nella scuola o nelle università. I cittadini intervistati si dichiarano decisamente contrari all’impiego dell’Intelligenza Artificiale nella produzione artistica (il 60,4 % si dice contrario), nel giornalismo (64,2 %) ma soprattutto per la selezione e gestione dei lavoratori (in questo caso è ben il 74 % a dichiararsi contrario). Rimane pressoché invariato il livello di associazione con i dispositivi per la domotica (9,5 % nel 2024, 7 % nel 2023).
ChatGPT e l’IA generativa
Il crescente impiego di artefatti tecnologici è sovente indicato come sintomo di familiarità e accettazione di una tecnologia. L’idea sottesa è che una maggiore conoscenza induca a una minor diffidenza rispetto agli artefatti tecnologici. Questo assunto non trova riscontro nei dati. Sebbene sia cresciuta la quota di cittadini che si sono confrontati con chatbot come ChatGPT e con strumenti di Intelligenza Artificiale generativa, nel 2024 è cresciuta la quota di cittadini che manifestano un significativo e crescente grado di prudenza: nel 2023 era il 54 % degli intervistati a ritenere che potessero essere usati ma regolamentandoli rigidamente, mentre nel 2024 chi la pensa così arriva al 69 %. Rimane stabile la quota di chi ritiene che i sistemi autonomi di scrittura vadano incoraggiati (14 %) e quella opposta di chi crede che invece vadano proibiti (16,5 %). Proprio una maggiore familiarità con gli strumenti di IA generativa sembrano aver concorso a promuovere un atteggiamento di crescente cautela e la richiesta di regolamentazione.
Informazione e atteggiamenti sull’IA
Il diffondersi delle tecnologie basate sulle reti neurali non sembra aver inciso nemmeno sul grado di informazione percepita dai cittadini italiani. L’Intelligenza Artificiale e le tecnologie che la impiegano, infatti, rimangono ancora relativamente poco conosciute. Il 58 % degli italiani dichiara di conoscere poco i sistemi e le applicazioni basate sull’Intelligenza Artificiale. Sommando chi dichiara di non avere alcuna informazione, si superano i sei cittadini su dieci. Gli italiani, nonostante la crescita dell’uso di applicazioni basate sull’IA e l’ampia copertura mediatica riservata al tema negli ultimi due anni, non si sentono sufficientemente informati. È solo un cittadino su tre a dirsi abbastanza o molto informato.
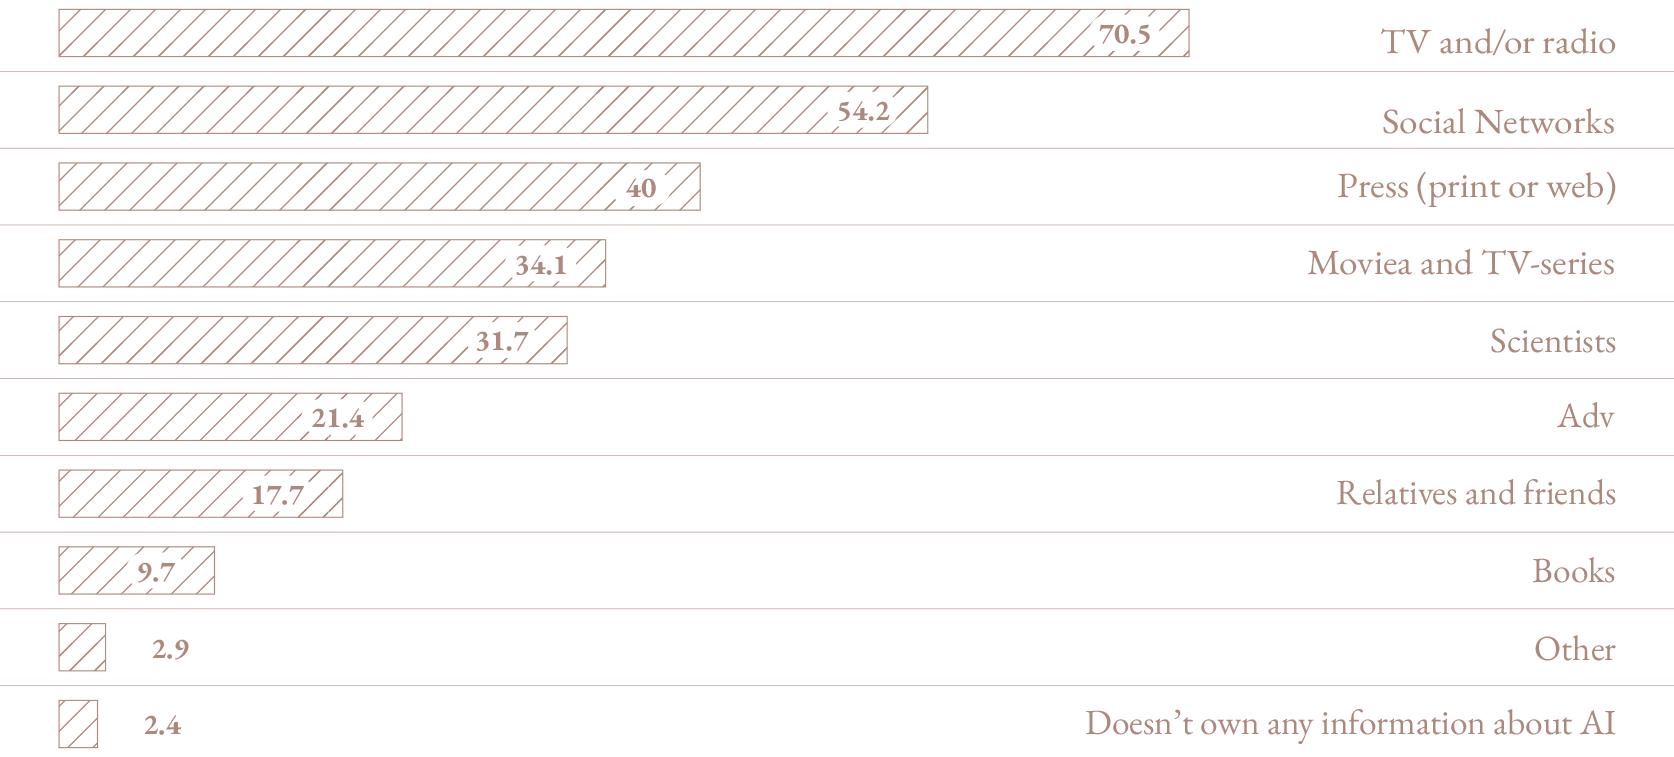
Sebbene molti si considerino poco informati, quasi tutti hanno letto o sentito parlare di Intelligenza Artificiale nell’ultimo anno. La TV e/o la radio sono i canali di informazione dove i cittadini hanno maggiormente sentito parlare di Intelligenza Artificiale (70,5 %) e più di un cittadino su due ha potuto leggere informazioni sull’IA sui social network, mentre quattro italiani su dieci hanno letto informazioni sull’IA nella stampa (cartacea o web). Quasi un terzo degli italiani ha visto contenuti associati a questo tema nei film e nelle serie TV e uno su cinque nella pubblicità. Il 32 % ne ha sentito parlare da esperti del settore e il 18 % ne ha parlato con parenti e/o amici. Solo il 2 % degli italiani nel 2024 non ha letto o sentito parlare di Intelligenza Artificiale [ Fig. III ]
TV e/o radio
Social Network
Stampa (cartacea e web)
Scienziati\ Pubblicità
Parenti o amicii
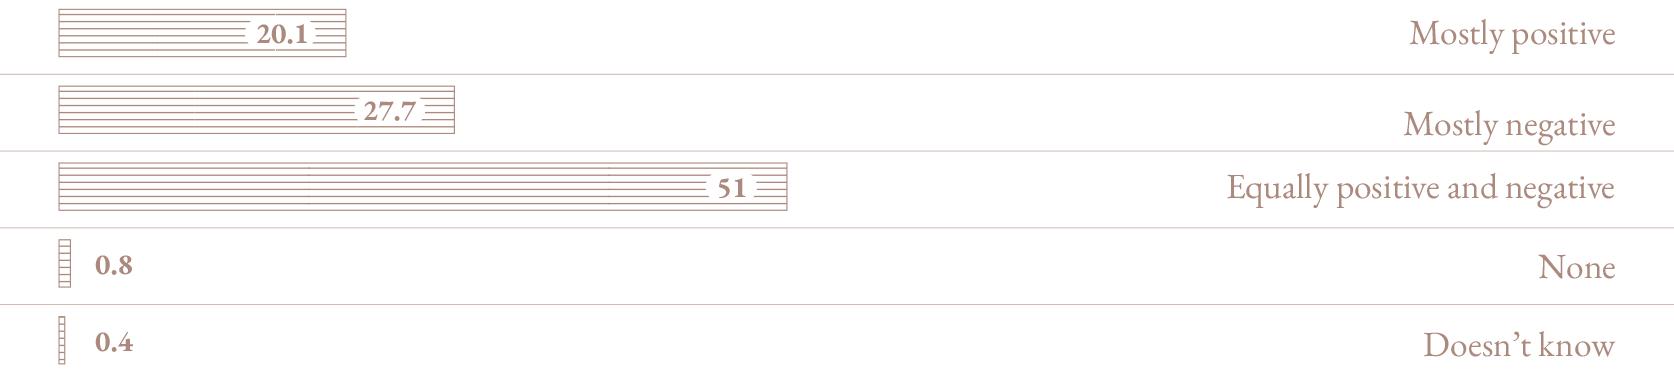
Il rapido sviluppo delle tecnologie di Intelligenza Artificiale è stato accompagnato da un dibattito sulle implicazioni e la regolamentazione. I cittadini italiani si dichiarano cauti sulle ricadute che l’Intelligenza Artificiale avrà sulla società nel lungo periodo: un cittadino su cinque ritiene che l’IA avrà “per lo più effetti positivi”, mentre il 27,7 % è più preoccupato e intravede “per lo più effetti negativi”. Il 51 % esprime una posizione equidistante tra preoccupazione e potenzialità positive. Solo una piccolissima minoranza non si esprime o ritiene che l’IA non avrà alcun effetto [ Fig. IV ]
Per lo più positivi
Per lo più negativi
Positivi e negativi in egual misura
Non sa Nessuno
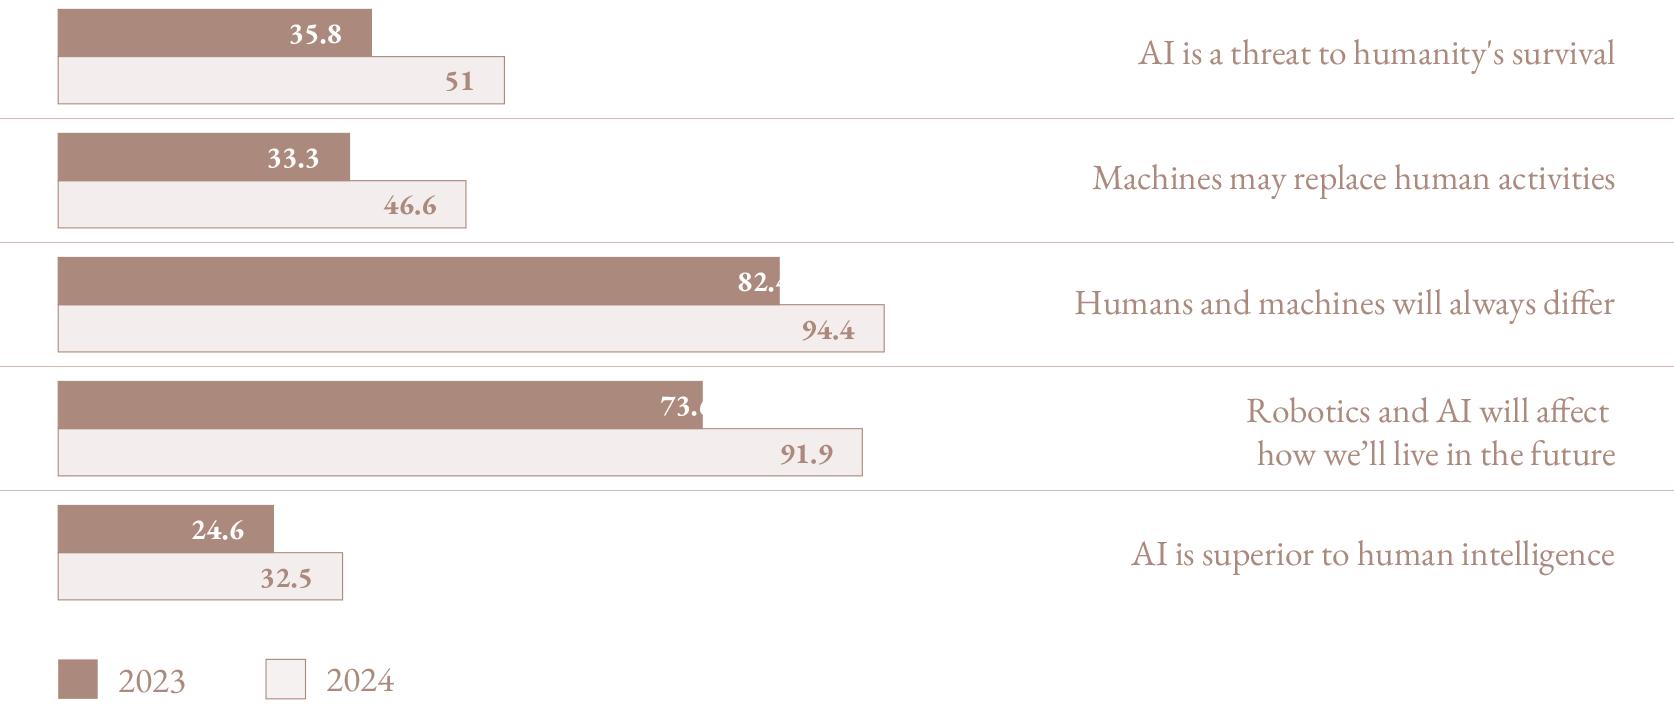
L’opinione pubblica italiana assume dunque una posizione piuttosto cauta nei confronti dell’impatto complessivo dell’Intelligenza Artificiale nella società odierna [ Fig. V ]. Il 92 % pensa che i sistemi di Intelligenza Artificiale avranno progressivamente un’influenza sempre più forte sulle attività umana. La quota di chi esprime preoccupazione è ben al di sotto di quella appena menzionata, ma in crescita rispetto alla rilevazione dell’anno scorso.
L’IA è una minaccia per la sopravvivenza dell’umanità
Le macchine prima o poi potranno sostituire tutte le attività umane
Ci saranno sempre differenze tra uomo e macchina
Robotica e IA influenzeranno il nostro modo di vivere
L’IA è superiore all’intelligenza umana
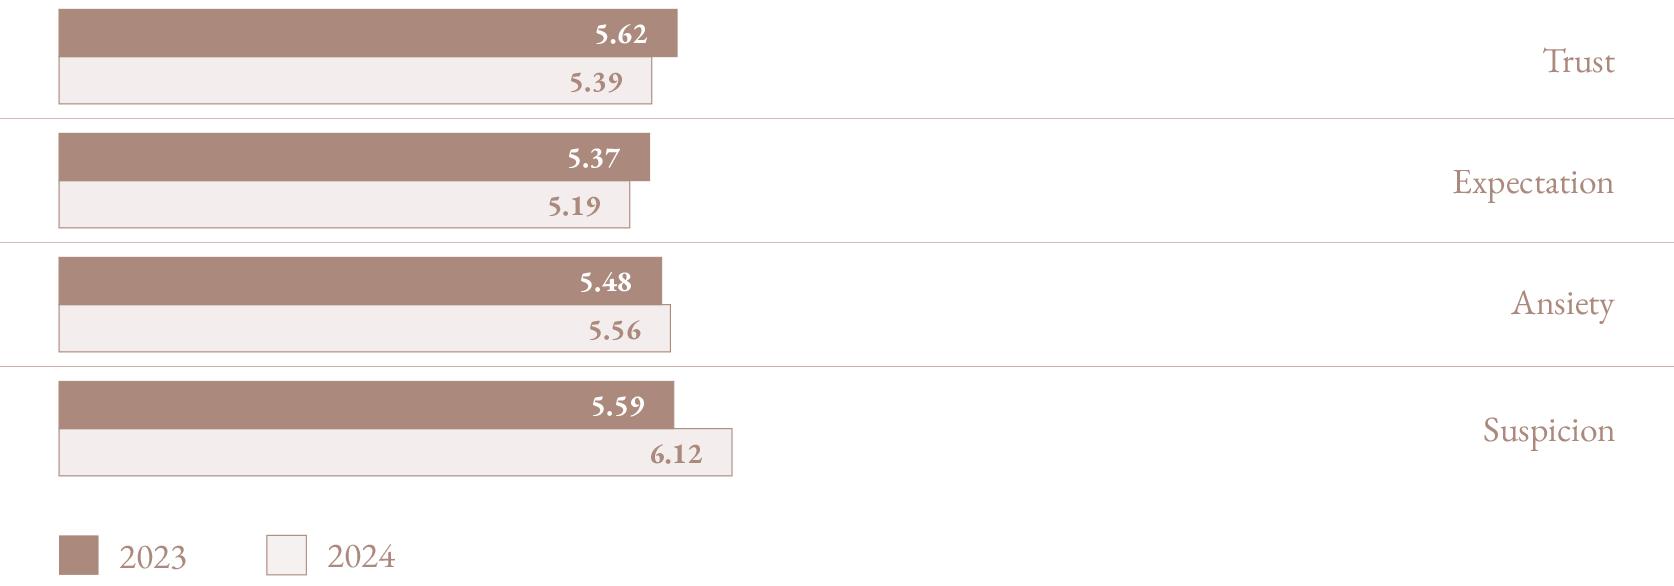
Nel 2024 il 51 % degli intervistati vede l’Intelligenza Artificiale come una minaccia per la sopravvivenza dell’umanità; il 47 % crede che le macchine in futuro potranno sostituire le attività umane e il 32,5 % pensa che già oggi l’Intelligenza Artificiale sia superiore a quella umana. Tuttavia, il 94 % dei cittadini ritiene che ci saranno sempre significative differenze tra uomo e macchina. Preoccupazione, paura, timore, entusiasmo, fiducia. Qual è il sentimento prevalente che l’Intelligenza Artificiale evoca tra i cittadini italiani? Rispetto al 2023, tra i cittadini italiani diminuisce leggermente l’indicazione di “fiducia” e “attesa”, mentre cresce l’indicazione per gli aggettivi “sospetto” e “ansia” [ Fig. VI ].
In sintesi, la percezione sociale dell’IA è piuttosto nebulosa e nel contempo carica di potenziali preoccupazioni per le implicazioni nel lungo periodo. Questo quadro di percezioni e atteggiamenti configura da un lato un ampio spazio per la divulgazione di contenuti in grado di chiarire meglio caratteristiche, potenzialità, ambiti applicativi e implicazioni. Dall’altro vi è un’evidente aspettativa di focalizzazione e valutazione normativa degli aspetti più critici, quali ad esempio la responsabilità e la gestione di contenuti rispetto alla proprietà intellettuale. Sarà interessante vedere se comunicazione e regolamentazione riusciranno a rispondere a queste due aspettative.
L’Osservatorio Scienza Tecnologia e Società è, dal 2003, un monitoraggio permanente dei comportamenti e delle opinioni degli italiani su questioni relative a scienza e tecnologia. L’indagine viene svolta su tutto il territorio e coinvolge, attraverso un misto di tecniche CATI (Computer Assisted Telephone Interviewing) e CAWI (Computer Assisted Web Interviewing), un campione di 1000 casi, proporzionale e rappresentativo per genere, classe d’età e provincia di residenza della popolazione con età maggiore o uguale ai 15 anni.
Considerando il titolo di studio una variabile rilevante, dopo ogni rilevazione il campione ottenuto viene pesato per rendere la sua struttura corrispondente a quella della popolazione italiana rispetto alle variabili genere, classe d’età e titolo di studio. La rilevazione del 2024 è stata effettuata tra il 10 e il 23 aprile intervistando 1000 unità. I dati sono stati raccolti con la tecnica CATI per il 20 % del campione e con la tecnica CAWI per il restante 80 %.
1 Il Progetto Sharper, finanziato dalla Commissione Europea, è coordinato da Psiquadro e ha coinvolto 14 città italiane in 8 delle 20 regioni nel 2023: Ancona, Cagliari, Camerino, Catania, Genova, L’Aquila, Macerata, Nuoro, Palermo, Pavia, Perugia, Sassari, Terni e Trieste.
La Notte Europea dei Ricercatori (ERN) è il più importante evento di comunicazione della ricerca e si svolge annualmente nell’ultimo fine settimana di settembre in più di trecento città europee. L’iniziativa è nata nel 2005 ed è promossa dalla Commissione Europea nell’ambito delle azioni Marie Skłodowska-Curie. La ERN coinvolge ogni anno migliaia di ricercatori e un pubblico di circa un milione e mezzo di partecipanti. L’Italia è uno dei paesi europei in cui sono attivi più progetti, dei quali attualmente nove sono finanziati dalla Commissione Europea.
L’obiettivo principale della ERN è favorire l’incontro tra ricercatrici e ricercatori con il pubblico dei non esperti attraverso dimostrazioni, mostre, incontri e presentazioni per promuovere la cultura scientifica e far conoscere il mondo della ricerca. Negli ultimi dieci anni le attività sono state organizzate in piazze, università e centri di ricerca, con modalità differenti per favorire il coinvolgimento di vari pubblici: famiglie, giovani, adulti e bambini. In questa prospettiva i luoghi scelti hanno favorito un’efficace diversificazione, permettendo la sperimentazione di vari format comunicativi più adatti ai pubblici interessati. Non si è trattato solo di aprire le porte di istituzioni scientifiche e centri di ricerca, ma di andare incontro al pubblico nei luoghi della quotidianità e negli spazi pubblici più accessibili. L’aumento di spazi e proposte ha permesso alla ERN di svilupparsi non solo nell’ultimo week end di settembre, ma di estendersi nei periodi precedenti e successivi, offrendo un’ampia gamma di attività. Dal 2018 Observa conduce il monitoraggio e la valutazione del progetto Sharper che attualmente coordina le iniziative in 14 città italiane nelle varie aree del Paese: nord, centro, sud e isole1. Grazie all’uso di strumenti della ricerca sociale (questionari, interviste e osservazioni), sono stati raccolti dati sulla percezione del pubblico, sullo svolgimento delle attività, sul ruolo dei ricercatori e sui contesti di realizzazione. Proponiamo di seguito i principali risultati raggiunti nello studio dei destinatari della ERN, del rapporto tra i ricercatori e il pubblico e una serie di indicazioni per lo sviluppo futuro delle attività.
Il pubblico della Notte Europea dei Ricercatori
Il progetto Sharper ha coinvolto quasi ottantamila persone in 200 luoghi delle 14 città italiane con 1040 eventi nel 2023. L’attività di valutazione ha raccolto informazioni sull’esito delle attività da tremila partecipanti con questionari somministrati prima e dopo gli eventi. Il campione è formato da un pubblico ben scolarizzato, con una percentuale media del trenta per cento di laureati. L’età media è di 31 anni e il 23,5 % sono giovani sotto i vent’anni. Questo effetto è dovuto alla scelta di coinvolgere un grande numero di studenti, soprattutto negli ultimi due anni di attività. Il pubblico è in media rappresentato dal 55 % di donne. Normalmente, le persone partecipano soprattutto in gruppo (49,6 %) o con la famiglia (22,6 %).
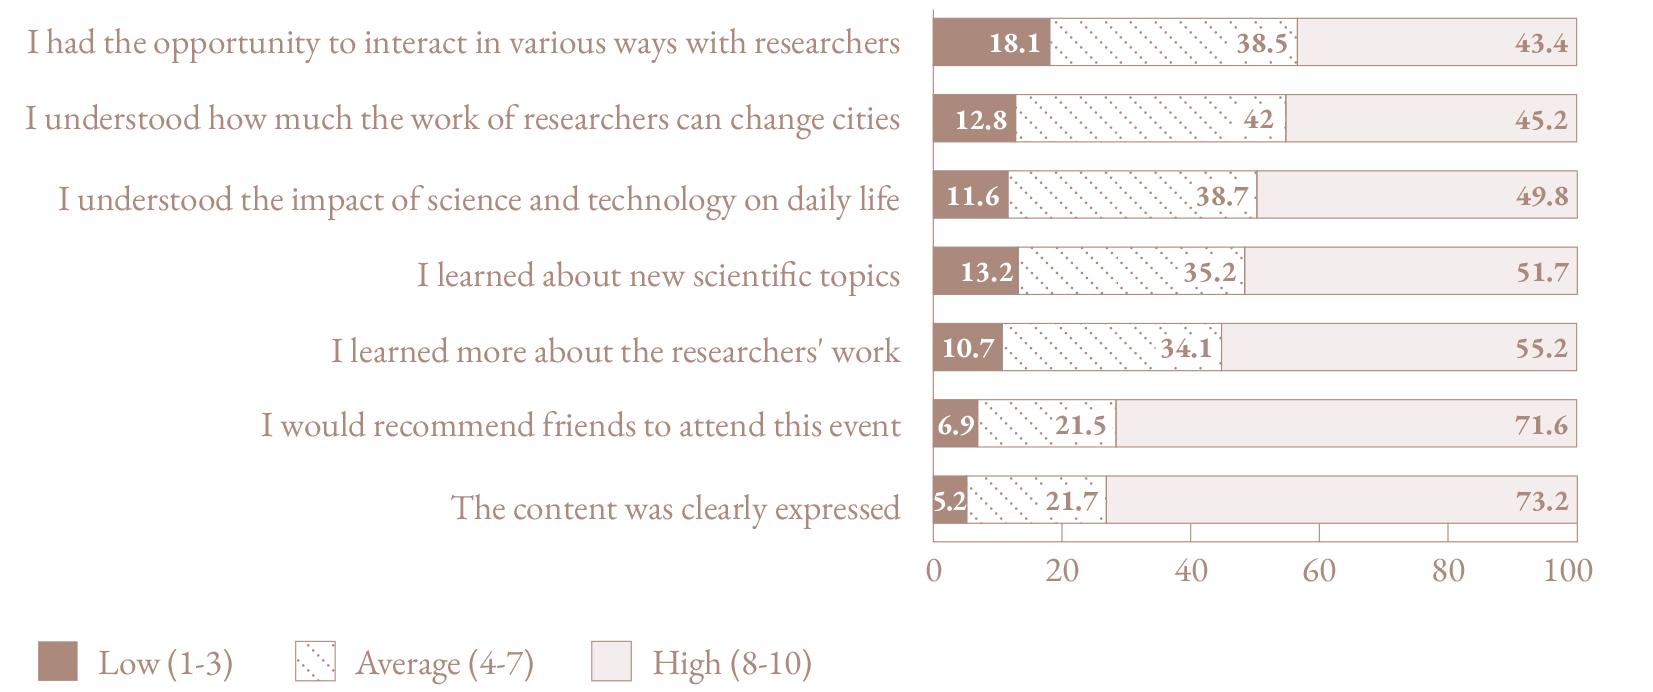
Considerando le abitudini culturali, più del 30 % dichiara di aver visitato mostre o musei scientifici. I dati raccolti hanno permesso di rilevare gli scostamenti di interesse dei partecipanti e il giudizio sulle attività. Nel periodo 2022-2023 i partecipanti hanno dichiarato per il 70 % di avere un forte interesse per la scienza. I giudizi espressi sulle attività sono più che favorevoli considerando l’esposizione dei ricercatori, la comprensione del loro lavoro e la conoscenza di nuovi temi scientifici. Più moderato il consenso sulla possibilità che il lavoro dei ricercatori possa migliorare le nostre città e le possibilità di interazione con loro. Il 71,6 % dei rispondenti consiglierebbe ai loro amici di partecipare alla ERN.
Ho avuto la possibilità di interagire in vario modo coi ricercatori
Ho capito quanto l’attività dei ricercatori può modificare le città
Ho compreso l’impatto di scienza e tecnologia sulla quotidianità
Ho conosciuto nuovi temi scientifici
Ho conosciuto meglio il lavoro dei ricercatori
Consiglierei ad amici di partecipare a questo evento
I contenuti sono stati espressi in modo chiaro
Basso (1-3) Medio (4-7)
Alto (8-10)
Chiamati a dare un giudizio complessivo dopo l’attività, l’83 % dei partecipanti ha proposto una valutazione molto positiva (giudizi tra 8 e 10 in una scala decimale nel 2023). Anche lo scostamento nel giudizio sull’attività scientifica è significativo: il 41 % dei rispondenti propone, in una scala tra 1 e 10, il punteggio massimo. Il dato è significativo perché è pressoché simile negli ultimi due anni di rilevazione.
II Valutazione complessiva delle attività (Confronto 2023-2022, scala 0-10)
Si può concludere che il pubblico della Notte Europea dei Ricercatori è selezionato e formato da persone che nutrono un buon interesse nei confronti della scienza.
Dall’osservazione realizzata da Observa nel corso degli anni si nota come progressivamente le iniziative realizzate nelle città hanno favorito il consolidarsi di una tradizione di incontro tra il mondo della ricerca e il pubblico. Molti partecipanti, infatti, dichiarano di aver già partecipato alle attività e di frequentare i luoghi conosciuti con il desiderio di scoprire nuovi argomenti e prospettive di ricerca.
Il rapporto tra ricercatori e pubblico
La comunicazione pubblica della scienza e della tecnologia si è evoluta negli ultimi anni attraverso nuovi strumenti e favorendo un maggiore ascolto del pubblico che, come abbiamo visto nei dati, ha apprezzato gli incontri e le modalità di realizzazione. I ricercatori impegnati nella ERN sono stati intervistati per studiare la loro percezione del pubblico e le modalità di comunicazione.
Nel corso degli anni è aumentato l’impegno e la partecipazione alle iniziative sin dalle fasi della formazione alla ricerca: master e dottorati. Non si tratta solo di proporre più attività, ma anche di uno sviluppo delle modalità e degli strumenti di comunicazione. Molti ricercatori e ricercatrici, infatti, si propongono al pubblico con brevi presentazioni e con uno stile colloquiale che offre spazio alle domande e alle curiosità, superando le tradizionali lezioni frontali o dimostrazioni che caratterizzavano la ERN nei primi anni.
La proposta di attività si è diversificata nel tempo in tre categorie che possiamo definire: incontri strutturati in forma di conferenza, semi-strutturati come laboratori e informali attraverso dialoghi informali e giochi. Si sono ridotti nel tempo gli incontri in forma di lezione o conferenza e sono considerevolmente aumentati i laboratori, i giochi e le dimostrazioni. Gli incontri più immediati, caratterizzati da una comunicazione aperta in forma di dialogo e scambio di impressioni, sono sperimentati in varie città con formati accattivanti e a volte imprevedibili. I cafè scientifici, la scienza al pub o gli speaker corner hanno l’obiettivo di incuriosire, divertire e sovvertire le regole di una tradizionale comunicazione scientifica basata sulla centralità del ricercatore. Questi format vanno però studiati con cura perché richiedono preparazione e capacità di affrontare pubblici molto diversi e domande a volte spiazzanti.
Interpretando un ruolo comunicativo si tende ad avere dei modelli a cui ispirarsi. I ricercatori hanno spesso indicato alcune icone mediatiche del giornalismo scientifico come loro principali punti di riferimento, tra tutti Piero e Alberto Angela. Ma negli ultimi anni sono emerse dai loro racconti altre figure presenti nella rete Internet (influencer, scienziati e comunicatori). Si considerano testimoni credibili anche queste nuove presenze rilevando che sono molto popolari tra il pubblico, in particolare tra i più giovani.
Ma qual è l’immagine del pubblico che hanno i ricercatori? In generale si percepisce il pubblico come un soggetto attivo e non solo passivo e incompetente. L’attività di valutazione ha messo in luce che si è sviluppata una maggiore capacità di cogliere le esigenze del pubblico. Negli ultimi anni, sollecitati dalle iniziative istituzionali di terza missione, i ricercatori hanno cercato di mettersi dalla parte dei non esperti studiando modalità e strumenti di comunicazione sempre più adeguati ai contesti e alle esigenze raccolte dai media. In questa prospettiva si è notato dalle interviste, ad esempio, che temi di rilevanza etica e morale vengono presi in esame e si affrontano senza particolari timori. In breve, si può dire che i ricercatori e le ricercatrici si approcciano al pubblico senza la pretesa di insegnare qualcosa ma di trasmettere il proprio lavoro cercando, ove possibile, di rispondere a interrogativi di interesse pubblico.
Negli ultimi vent’anni, la Notte Europea dei Ricercatori ha permesso a un vasto pubblico di incontrare le istituzioni scientifiche e i ricercatori stimolando attenzione e curiosità su tutti gli ambiti scientifici, dalle scienze naturali alle discipline umanistiche. Il progetto Sharper ha offerto un’ampia gamma di iniziative consentendo ai non esperti di avvicinarsi in modo diretto alla conoscenza delle attività di ricerca italiane.
Il rapporto tra pubblico e ricercatori si è evoluto nel tempo. Ciò che conta maggiormente è la capacità di coinvolgere e attivare interesse in un breve tempo offrendo alcuni spunti e favorire la curiosità. I ricercatori e le ricercatrici devono quindi essere in grado di comunicare in modo semplice e non banale aspetti essenziali del loro lavoro, pur essendo pronti a raccogliere anche il feedback dei partecipanti. Per interpretare questo ruolo è necessaria una formazione adeguata sulle modalità di comunicazione e gli strumenti da utilizzare. Questo sforzo permetterà anche di collocare i ricercatori nell’attività più adatta alle loro capacità comunicative e di migliorare il rapporto con il pubblico.
Il desiderio di essere efficaci per incuriosire e catturare l’attenzione può alle volte sminuire l’attività di ricerca e, conseguentemente, la possibilità di coinvolgimento attivo del pubblico. Il tentativo sperimentale di offrire momenti unici con effetti speciali rischia di colpire solo emozionalmente i partecipanti, oscurando elementi importanti dell’attività di ricerca come l’impegno, il metodo e le difficoltà. All’interno della comunità dei ricercatori si deve dunque mantenere un atteggiamento riflessivo sui vari format utilizzati valorizzando primariamente gli elementi di coinvolgimento come la sensibilizzazione e l’ascolto.
In un periodo in cui l’informazione scientifica è onnipresente, spesso con modalità imprecise che portano a polarizzazioni sconvenienti o a vera e propria disinformazione, il ruolo di chi lavora nella ricerca e la comunica può essere molto utile. Considerando il favore del pubblico nei confronti dei ricercatori, essi possono essere un importante veicolo di diffusione corretta di informazioni scientifiche e tecnologiche. In questo modo possono aumentare la vicinanza con il pubblico mediante il racconto del lavoro e dei risultati rendendo più accessibili le informazioni e favorendo la comprensione dei meccanismi che regolano l’impresa scientifica.
Tutte le discipline scientifiche si sono cimentate nel realizzare incontri adeguati con il pubblico mediante la ERN. I ricercatori hanno avuto così importanti occasioni per favorire un intenso e migliore rapporto tra scienze e società. Per continuare in questa direzione si dovrà continuare a superare i confini disciplinari e cogliere le domande sociali che interrogano il mondo della ricerca. Ecco allora che i ricercatori e le ricercatrici potranno affrontare le richieste del pubblico senza snaturare il ruolo di operatori della conoscenza e offrendo in modo comprensibile il loro contributo alla società.
Totale (dalla primaria alla terziaria, inclusa spesa in R&S)
Norvegia
Regno Unito
Islanda
Israele
Cile
Australia
Stati Uniti
Belgio
Danimarca
Svezia
Francia
Finlandia
Paesi Bassi
Nuova Zelanda
Canada
Corea
Portogallo
Media OECD
Austria
Spagna
Polonia
Slovenia
Germania
Repubblica Ceca
Estonia
Media EU25
Repubblica Slovacca
Turchia
Messico
Ungheria
Lettonia
Italia
Giappone
Croazia*
Lituania
Bulgaria*
Lussemburgo
Irlanda
Romania*

Il livello di istruzione di un paese è un elemento chiave nelle società contemporanee. Livelli più elevati di istruzione sono associati a risultati positivi per gli individui sul piano economico, di ingresso nel mercato del lavoro e sul piano sociale. Ad esempio, i giovani con un titolo di studio terziario, rispetto ai loro coetanei senza laurea, accedono a opportunità professionali migliori, godono di stipendi più elevati e sono più inclini a intraprendere percorsi di apprendimento continuo (lifelong learning). Analizzando i dati forniti dall’Organizzazione per la Cooperazione e lo Sviluppo Economico (OCSE), possiamo confrontare lo stato dell’istruzione a livello globale e in Italia.
Spesa in istruzione
La spesa in istruzione rispetto al prodotto interno lordo (PIL) è un fattore importante per valutare lo stato dell’istruzione di un paese. Indica normalmente quanto un paese consideri una priorità investire nel proprio sistema educativo. Una maggiore spesa si traduce infatti in investimenti che migliorano la qualità e l’accesso all’istruzione, come risorse per infrastrutture scolastiche, formazione e retribuzione degli insegnanti e sostegno a studenti con difficoltà economiche.
Nel 2021, i paesi dell’OCSE hanno destinato in media il 4,9 % del loro prodotto interno lordo (PIL) all’istruzione, per un totale di oltre 3,5 trilioni di dollari USA [ Fig. I ]. Questa spesa riguarda le istituzioni scolastiche dalla scuola primaria fino alla terziaria, compresa la ricerca a livello universitario. Paesi come Islanda, Israele, Norvegia e Regno Unito, investono oltre il 6 % del loro PIL nell’istruzione, mentre all’altro estremo troviamo Romania e Irlanda, che non arrivano al 3 %. L’Italia si attesta su una spesa del 4 % del PIL, quindi al di sotto sia della media OCSE che della media dei 25 paesi europei parte dell’OCSE (4,4 %). Altri grandi paesi europei comparabili con l’Italia presentano percentuali superiori: la Germania spende il 4,6 %, la Spagna investe il 4,9 % e la Francia il 5,4 %.
Fig.1 pagina precedente: Spesa totale in istruzione (dalla primaria alla terziaria, inclusa spesa in R&S), percentuale sul PIL (2021).
Nota: I paesi segnalati con * sono paesi “partner” dell’OCSE, ovvero non ne fanno parte ma i loro dati vengono comunque monitorati.
Confrontando la spesa totale dei paesi rispetto alla spesa per l’istruzione terziaria (incluse le spese in ricerca e sviluppo) osserviamo che nuovamente l’Italia si colloca tra gli ultimi paesi dell’OCSE, investendo solo l’1 % del PIL. Peggio dell’Italia troviamo solo l’Irlanda (0,7 %) e il Lussemburgo (0,5 %). Questo dato colloca l’Italia sotto la media OCSE (1,5 %) e molto distante dai paesi che investono di più nell’istruzione terziaria, come il Cile (2,4 %), gli Stati Uniti (2,3 %) e il Regno Unito (2,1%).
Numero di laureati
Un altro indicatore per valutare lo stato dell’istruzione di un paese è il numero di giovani adulti (25-34 anni) che conseguono un titolo d’istruzione terziaria. Nei paesi OCSE, tra il 2016 e il 2023, la quota di giovani adulti con laurea è aumentata in media di 5 punti percentuali [ Fig. II ]. Incrementi notevoli, pari a 10 punti percentuali o più, si sono registrati in Cile, Irlanda, Spagna e Turchia, evidenziando cambiamenti importanti nei sistemi educativi di questi paesi e suggerendo un passaggio verso un’economia maggiormente basata sulla conoscenza, dove sono richieste qualifiche più elevate.
Irlanda
Regno Unito
Lussemburgo
Lituania
Paesi Bassi
Svezia
Spagna
Francia
Belgio
Danimarca
Media OECD
Polonia
Grecia
Media EU25
Austria
Estonia
Slovenia
Portogallo
Repubblica Slovacca
Finlandia
Germania
Croazia*
Bulgaria*
Repubblica Ceca
Italia
Ungheria
Romania*
Nota: I paesi segnalati con * sono paesi “partner” dell’OCSE, ovvero non ne fanno parte ma i loro dati vengono comunque monitorati.
Croazia (20%)
Costa Rica (19%)
Grecia (19%)
Svezia (19%)
Israele (19%)
Portogallo (18%)
Austria (18%)
Irlanda (17%)
Corea (17%)
Finlandia (17%)
Slovenia (17%)
Colombia (17%)
Lussemburgo (16%)
Media EU25 (16%)
Svizzera (16%)
Francia (16%)
Danimarca (16%)
Media OECD (16%)
Repubblica Ceca (15%)
Perù² (15%)
Islanda (15%)
Messico (15%)
Bulgaria (13%)
Regno Unito (13%)
Spagna (13%)
Lettonia (13%)
Lituania (12%)
Repubblica Slovacca (12%)
Paesi Bassi (12%)
Norvegia (12%)
Australia (12%)
Ungheria (12%)
Polonia (12%)
Turchia (11%)
Cile (10%)
Belgio (9%)
Analizzando i singoli paesi dell’OCSE, la Corea del Sud si distingue per la percentuale di giovani adulti con un’istruzione universitaria, raggiungendo il 70 %. Seguono il Canada con il 67 % e il Giappone con il 65 %. Al contrario, l’Italia si colloca in fondo alla classifica con solo il 31 % di laureati tra i 25 e i 34 anni, insieme all’Ungheria (29 %) e al Messico (28 %), ben al di sotto della media OCSE (47 %).
Osservando i dati a livello europeo, la media dei paesi membri dell’OCSE si attesta al 44 %, cifra che sale al 45 % se consideriamo l’intero insieme dei paesi dell’Unione Europea, secondo i dati di Eurostat. Questo dato è interessante se messo a confronto con gli obiettivi fissati dall’Unione Europea nel 2021, che mirano a raggiungere entro il 2030 il 45 % di giovani europei laureati. Attualmente, 13 paesi europei hanno già raggiunto tale traguardo: Irlanda (63 %), Cipro, Lussemburgo (60 %), Lituania (57 %), Paesi Bassi (55 %), Svezia (57 %), Spagna e Francia (entrambi al 52 %), Belgio (50 %), Danimarca (49 %), Malta e Polonia (entrambi al 46 %), e Lettonia (45 %). Ancora molto distanti dall’obiettivo la Romania (22 %), l’Ungheria (29 %) e l’Italia (31%).
Per concludere, osserviamo i dati relativi al numero di donne con istruzione terziaria. Considerando ancora la categoria dei giovani adulti (25-34 anni), osserviamo che le donne continuano a superare sistematicamente i loro coetanei maschi in tutti i paesi OCSE, eccetto il Messico: in media, il 54% delle giovani donne è laureata, rispetto al 41 % degli uomini. Analizzando i dati a livello nazionale, la Corea del Sud si distingue per avere la maggiore proporzione di giovani donne laureate, pari al 77 %, seguita da Canada e Giappone, entrambi al 76 %. Tra i paesi europei, la Lituania spicca con un 68 %, ben al di sopra della media dei paesi membri dell’OCSE, che si attesta al 52 %. In fondo alla classifica troviamo ancora una volta l’Italia, con una percentuale del 37 %, seguita da Ungheria (36 %), Costa Rica (28 %) e Messico (28 %). Se includiamo anche i paesi non membri dell’OCSE, il Sudafrica registra il dato più basso, con solo l’11 % di giovani donne laureate.
Anche se le donne rappresentano la maggioranza dei giovani adulti laureati, restano sotto-rappresentate in specifiche aree disciplinari e settori di ricerca, come le discipline STEM. Questo fenomeno, definito “segregazione orizzontale”, può essere misurato attraverso il numero di nuove iscrizioni nelle diverse discipline. Se confrontiamo il numero di donne neo-iscritte a corsi STEM nel 2022, rispetto agli uomini, osserviamo che, in media, solo il 15 % delle nuove iscritte sceglie una disciplina STEM, a fronte del 41 % degli uomini [ Fig. III ]. Queste disparità si manifestano in diversi paesi, con il Cile e la Finlandia che presentano i divari più significativi, mentre i Paesi Bassi e la Turchia mostrano le differenze più contenute.
Un dato positivo per l’Italia è che il paese si colloca al primo posto tra i paesi OCSE per numero di giovani donne iscritte a materie STEM. Nel 2022, il 21,3 % delle giovani adulte ha scelto discipline tecnico-scientifiche, divise in scienze naturali, matematica e statistica (11,7 %), tecnologie dell’informazione e della comunicazione (0,7 %) e ingegneria, manifattura e costruzioni (8,9 %). Questo risultato colloca l’Italia al di sopra non solo della media OCSE, ma anche di quella dei paesi europei, che si attesta al 16,1 %. Un dato che suggerisce che gli sforzi in questa direzione da parte delle università, delle associazioni e delle singole ricercatrici che promuovono una maggior inclusione delle giovani donne nelle materie tecnico-scientifiche stiano dando i loro frutti.
Fig.III pagina successiva: Percentuale di neo-iscritte a materie STEM rispetto al totale di neo-iscritte nel 2022, indicato tra parentesi e divise per area di studi.
Giappone (7%) 0 5 10 15 20 25
Scienze naturali, matematica e statistica
Ingegneria, manifattura e costruzioni
Tecnologie dell’informazione della comunicazione (ICTs)
Italia (21%)
Estonia (21%)
Germania (21%)
Nuova Zelanda (21%)
Canada (21%)
Romania (20%)
Croazia (20%)
Costa Rica (19%)
Grecia (19%)
Svezia (19%)
Israele (19%)
Portogallo (18%)
Austria (18%)
Irlanda (17%)
Corea (17%)
Finlandia (17%)
Slovenia (17%)
Colombia (17%)
Lussemburgo (16%)
Media EU25 (16%)
Svizzera (16%)
Francia (16%)
Danimarca (16%)
Media OECD (16%)
Repubblica Ceca (15%)
Perù² (15%)
Islanda (15%)
Messico (15%)
Bulgaria (13%)
Regno Unito (13%)
Spagna (13%)
Lettonia (13%)
Lituania (12%)
Repubblica Slovacca (12%)
Paesi Bassi (12%)
Norvegia (12%)
Australia (12%)
Ungheria (12%)
Polonia (12%)
Turchia (11%)
Cile (10%)
Belgio (9%)
Giappone (7%)
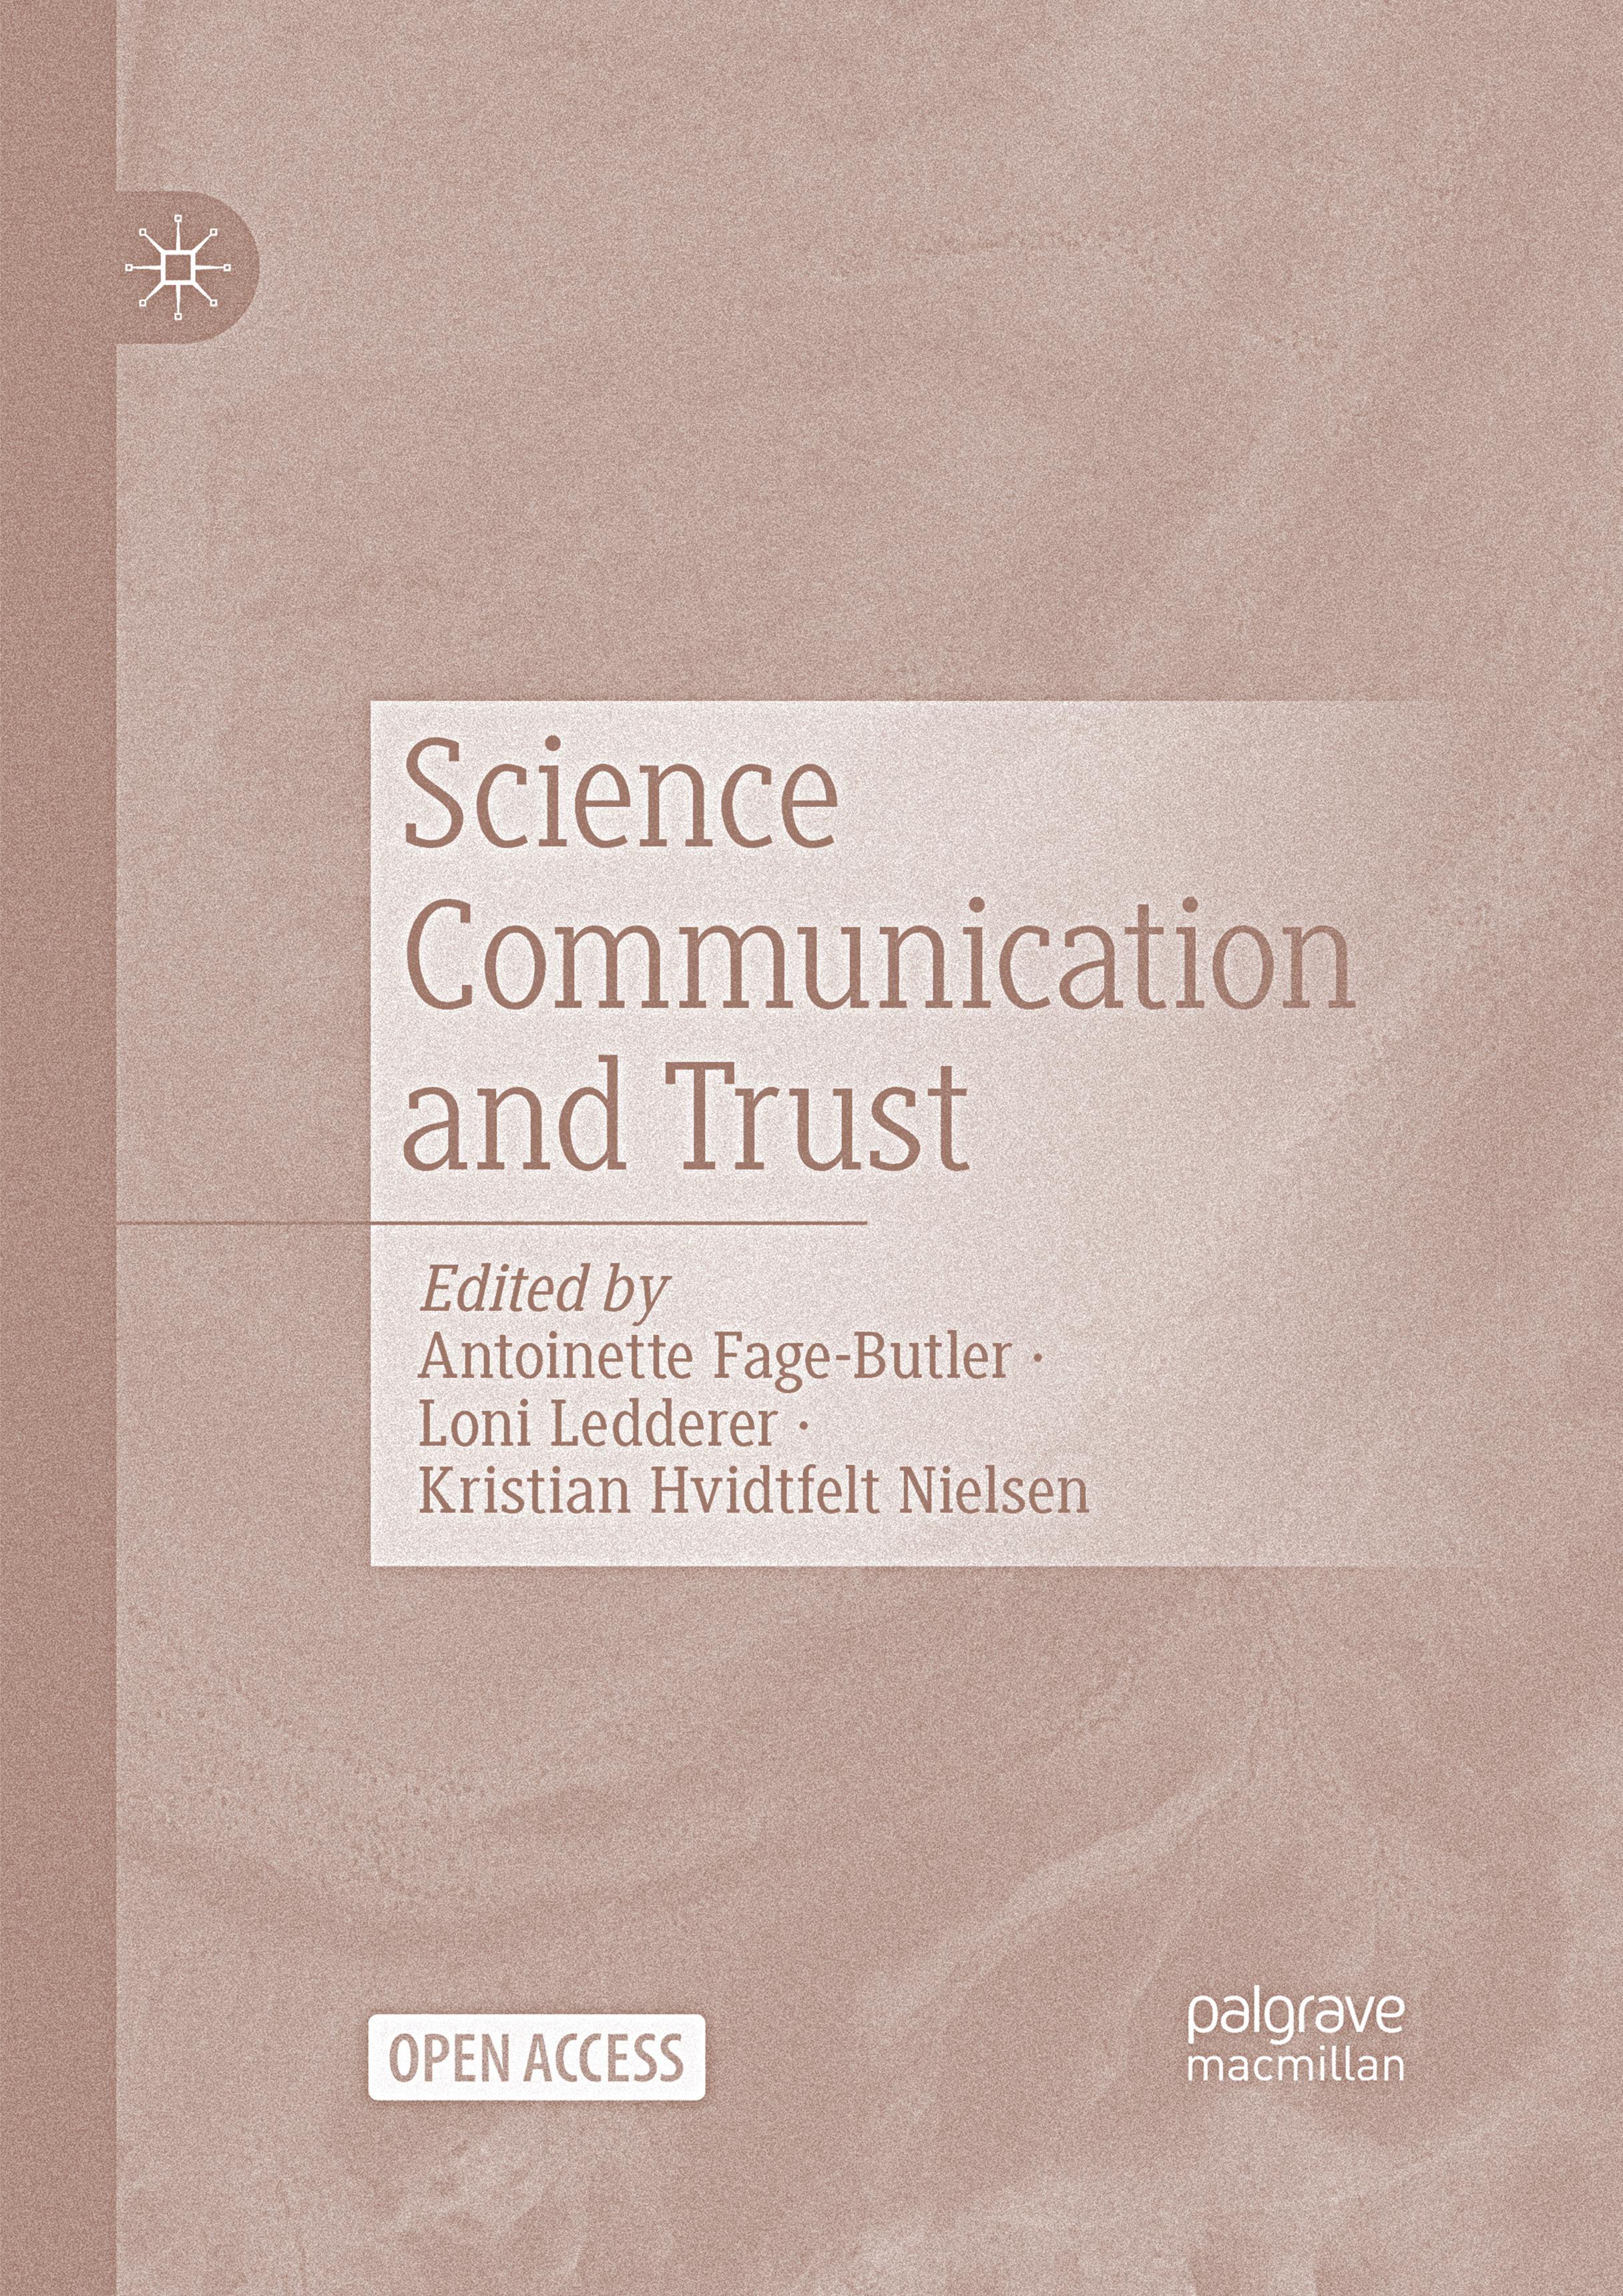


Antoinette Fage-Butler is an Associate Professor in the School of Communication and Culture at Aarhus University. She is the Principal Investigator of the research group (Mis)trust of Scientific Expertise. She co-edited the volume Perspectives on knowledge communication: Concepts and settings (Routledge, 2023) and has written a monograph, Risk and responsibilisation in public communication: The global challenges of COVID-19 and climate change (Routledge, 2024). Through Circle U., she has also worked with students on a participatory project on future narratives of sustainability.
Trust plays an impactful but often unrecognised role in our lives, functioning as an implicit premise for action. We trust in the functionality of things: that a parachute will open on our way down. We trust in the good will of people: that, overall, people around us are benevolent as we live out our lives. We trust in the repeated regularities of the physical world: that the sun will appear on the eastern horizon again tomorrow. And we trust in scientific experts’ knowledge: for example, that vaccines are safe, and that the risks of climate change are well-documented. Trust in experts provides us with a shorthand for managing at least some of the complexity of the world, bypassing a need to identify evidence and documentation at a personal level.
In an open access book that I co-edited with colleagues Loni Ledderer and Kristian H. Nielsen called Science communication and trust (Palgrave Macmillan, 2025), we explore one situation for trust – public trust as it relates to science communication. There have been concerns that societal developments such as widespread social media use and rising populist ideologies may diminish public trust in science. Potential declines in public trust in science call for our attention, particularly given the many (science-related) wicked problems that challenge policymakers – from the COVID-19 pandemic to the critical state of the natural environment. At the same time, our book engages with science communication at a point when the field of science communication is advancing the understanding that science communication is better conceived in terms of conversations than monologues.
We started the book as part of our research project called (Mis)trust of Scientific Expertise. The edited book, which includes 22 contributed chapters from scholars from around the world grapples with the question of public trust in science communication.
To our knowledge, it is the first to give extended consideration to the topic. The chapters fall into three broad areas of inquiry. The first has to do with the trustworthiness of science communicators. The second is concerned with the contexts of science communication and their role for trust. The third probes various aspects of trust in science.
Some of the chapters take specific cases and explore them. Such chapters develop understandings of how trust works, for example, in various national contexts and in online communication, including specific social media. Other chapters advance theoretical insights about trust in science communication. Different methods are also showcased – from surveys to discourse analysis.
Not surprisingly for an edited book with input from many different contributors and disciplines, the volume does not result in an overarching theory of trust in science communication. Instead, the picture that emerges reinforces the idea that trust is relational, contextual and cultural. Indeed, it is no doubt because trust is a situated phenomenon that it evades a single general theorisation. The chapters instead shed light on various aspects of trust in science communication – each chapter representing an individual excavation, as it were, that indicates some underlying tendencies.
Developments in science and technology as well as ever-evolving media forms, political and environmental situations and public cultures make it likely that trust in science communication will remain an important topic for scholarly inquiry in years to come. Our hope with this book is to provide a basis for furthering such knowledge development.
Scientific literacy is growing, the way people are informed about science and technology is changing. High trust in science and scientists but judgment of their communicative role is often critical.


Scientific literacy
New data from the Science, Technology and Society Monitor highlights an increase in so-called “scientific literacy.” The latter is measured, as it is every year, by considering the ability to answer five questions:
1 ) Electrons are smaller than atoms true; 2 ) Antibiotics kill both viruses and bacteria false;
3 ) The sun is a planet false;
4 ) Nitrogen is the most common element in the air true;
5 ) The bit is the unit of measurement of the amount of information true. The 2024 data show an increase in those who can correctly answer all five questions or at least four (42.6 percent) and, at the same time, a decrease in those who cannot answer any question or at most only one [ Fig. 1 ]
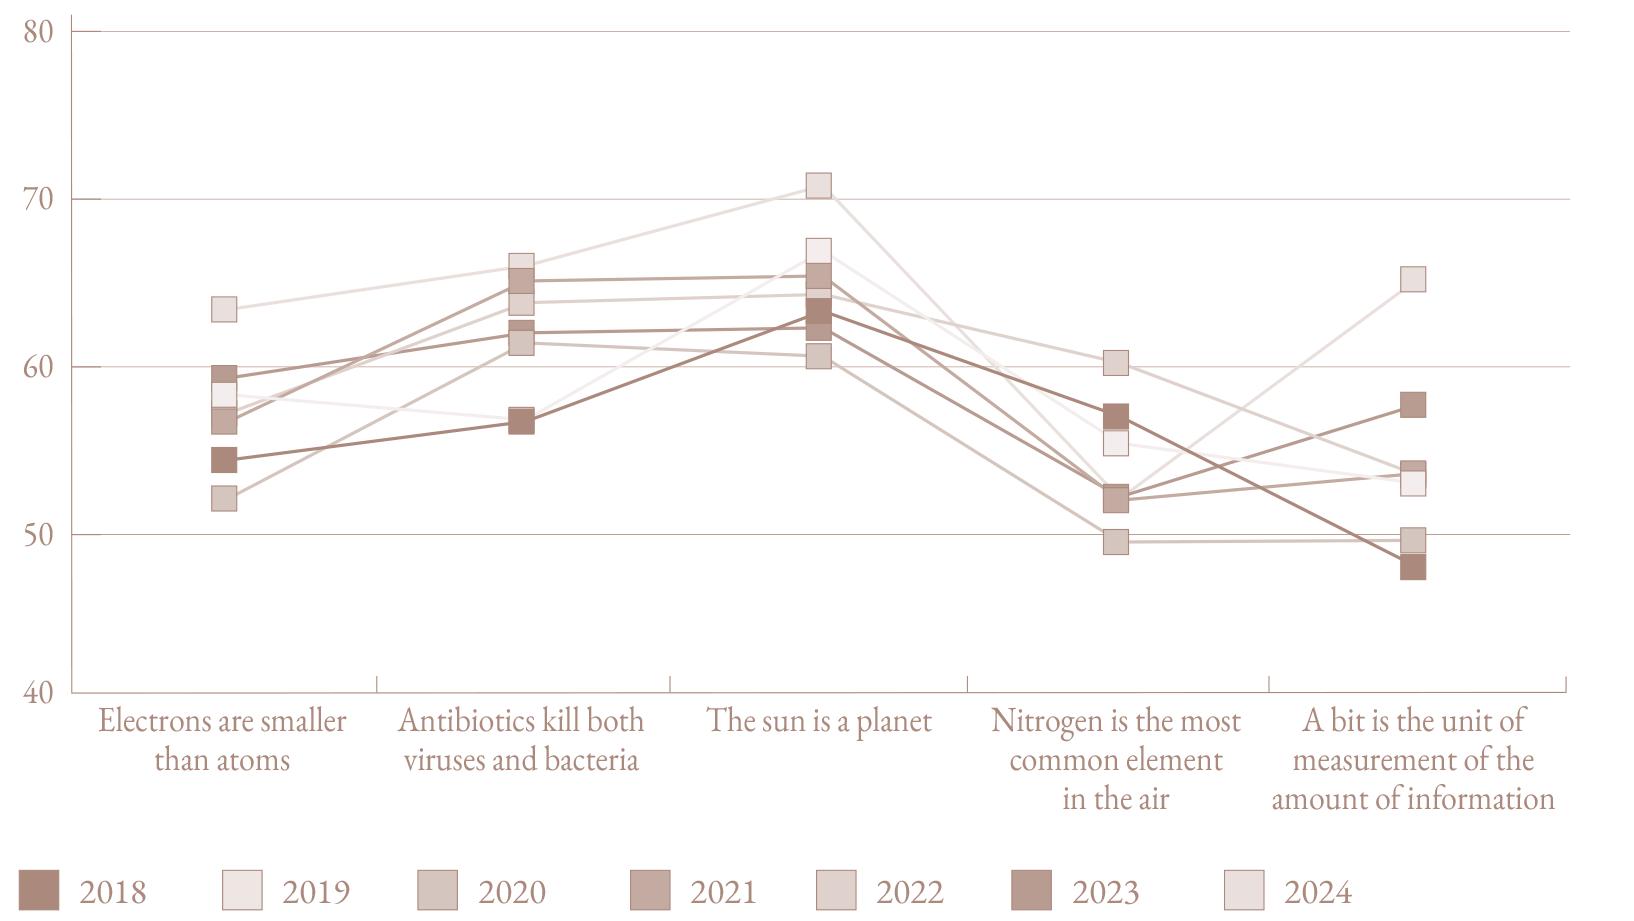
i Science literacy index (2018: n = 985; 2019: n = 978; 2020: n = 979, 2021: n = 977; 2022: n = 1015; 2023: n = 995; 2024: n = 998)
Literacy increases with educational attainment, mainly to the advantage of college graduates. There is also a fairly clear difference with respect to gender [ Fig. II ]. In fact, almost half of men can answer at least four questions exactly (49.7 %), compared with just over a third of women (36.1 %).
Considering access to science and technology content through newspapers, television, or the web, we can see that daily and periodical press (print or online) is being used less and less [ Fig. 1II ]; as a matter of fact, in 2024 only one in three Italians (33.2 %) read at least one science news item per week in a newspaper, while the number of those who got information through television (55.9 %), or on the internet (52 %) varied little. Gender differences also emerge here, in that men enjoyed information about science in all types of media much more than women. As might be expected, notable differences also exist according to educational qualification, to the advantage of college graduates; on the other hand, age only partially affects, as there is a decrease after the age of 45, but the absolute lowest level is reached among those under 30.
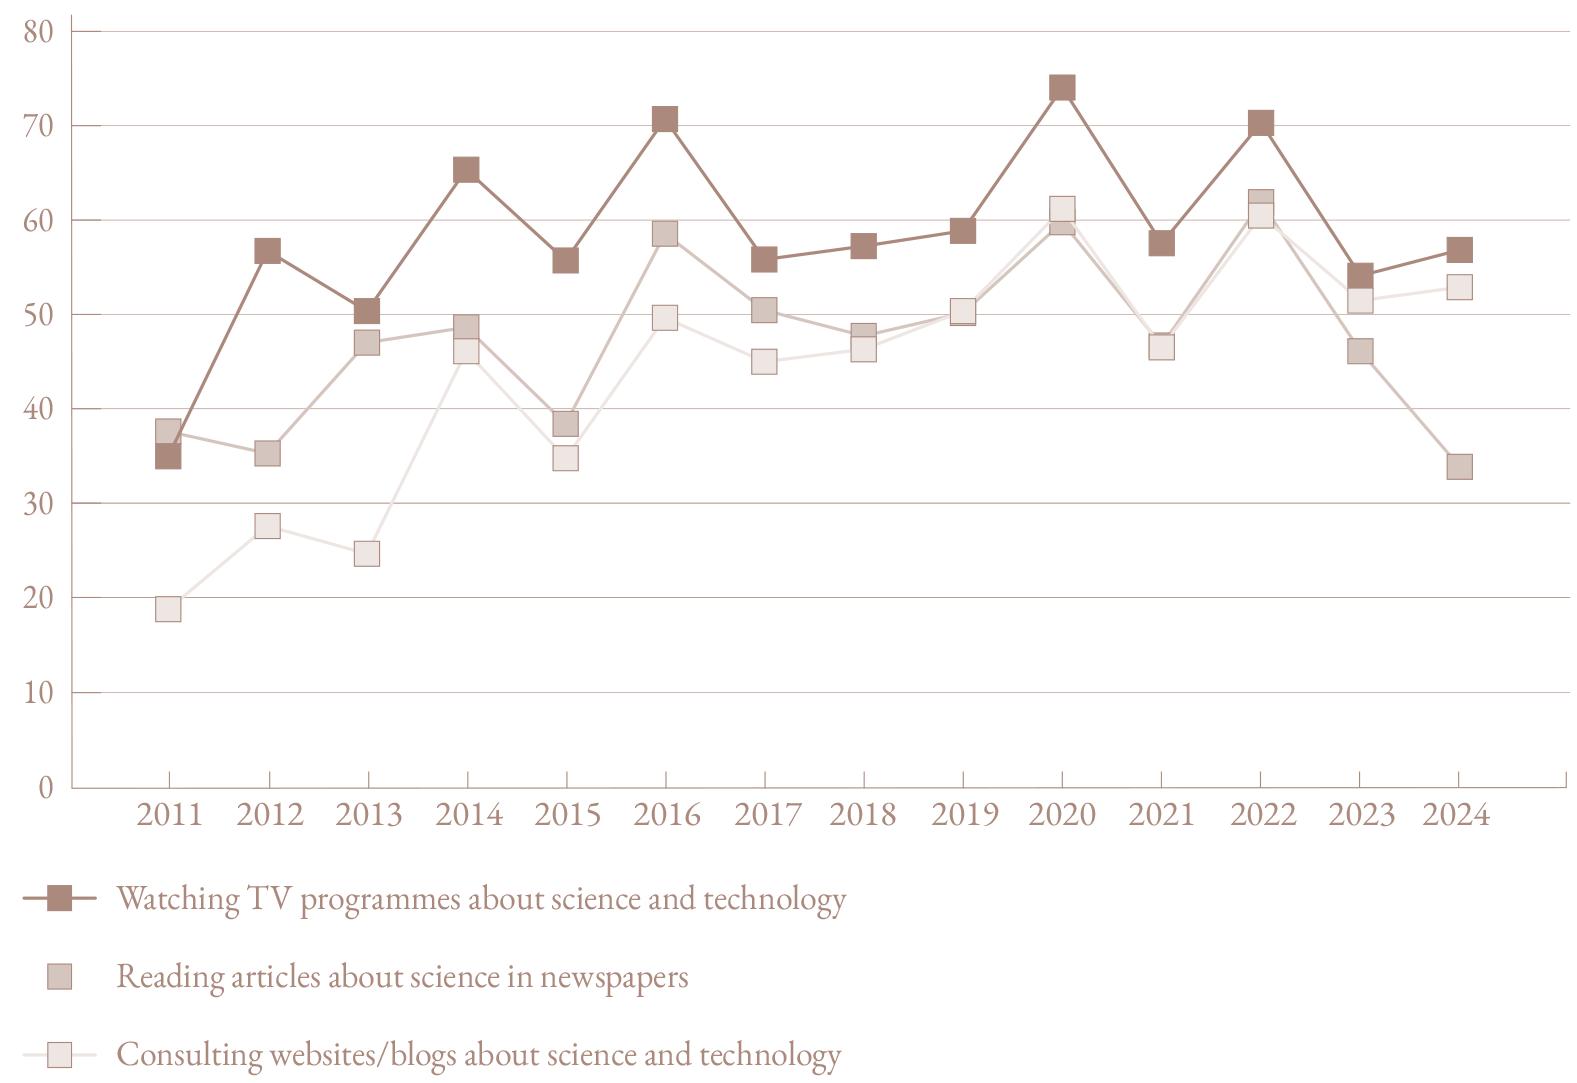
Fig. III Exposure to science content (at least once a week, 2011: n = 1001; 2012: n = 995; 2013: n = 1005; 2014: n = 1040; 2015 = 999; 2016: n = 1002; 2017: n = 997; 2018: n = 985; 2019: n = 978; 2020: n = 979, 2021: n = 977; 2022: n = 1015; 2023: n = 995; 2024: n = 998)
As an increasing amount of information passes through new digital media, it is interesting to note whether respondents follow any scientists or research institutions on social media. While few did in 2015 (11.4 %), by 2024 that figure had almost quadrupled (42.6 %), showing how popular science is becoming on social platforms as well. Followers are also much more numerous among those with high educational qualifications: 56.3 % of university graduates follow at least one female scientist or research institute; among high school graduates 47.4 % do so, while for those who only finished compulsory schooling that share stops at 35.4 %.
Sharing a post, video, or science news on a social network is not only a way to connect with others, but also to spread a discovery, useful advice, or curiosity. Among scientists and experts, for example, there are now numerous influencers: just think of the pages of virologists during the recent COVID-19 pandemic, or those of some science popularisers, such as Alberto Angela, or pages of astronauts, such as Samantha Cristoforetti, or climate scientists.
The year 2024 records the highest peak of those who say they have shared content related to science and technology compared to previous surveys. On Facebook – the most popular social network in our country – more than half of Italians have shared at least one post with science content in the past year (52.4 %) [ Fig. IV ]; less than 10 years ago, in 2015, about a third had done so (31 %). Lower values are reported for Instagram (36.8 %), YouTube (31.9 %), and for the social favorite of the very young: TikTok (20.5 %).
The sharing of content related to science and technology is distributed across gender, age, and educational qualification, demonstrating how social media and its use is now widespread across all strata of the population.
of science technology information on social channels over the past year (sometimes or often, 2015: n=999; 2017: n=997; 2019: n=978; 2020: n=979; 2021: n=977; 2022: n=1015; 2023: n=995; 2024: n=998)
The number of those who read or viewed science and technology-related content on social media also increased. On Facebook and YouTube this interest involves more than three out of four Italians (77.9 % and 76.5 %, respectively), almost doubling compared to 2015 (42.7 % and 39.9 %, respectively). Also widely used are Instagram (59.9 %) and TikTok (34.5 %). This means that the lower exposure to science and technology content in print is counterbalanced (obviously in different ways) by exposure through new media.
Engaging with science can take place by visiting museums or exhibitions, participating in meetings, debates, science festivals, or protest demonstrations or mobilisations on scientific or technological issues, such as over the construction of major works. In 2024 those who took part in these activities increased, especially in terms of visiting museums or science exhibitions: in the last year almost six out of ten Italians (59.8 %) participated, while in 2022 they were almost half (39.2 %) [ Fig. V ]. In general there was an increase for all activities, including mobilisations and protests, which involved almost one in five Italians (19.4 %).
Participation is more widespread among young people and increases as educational qualifications increase, except for protest demonstrations for which there is no significant difference.
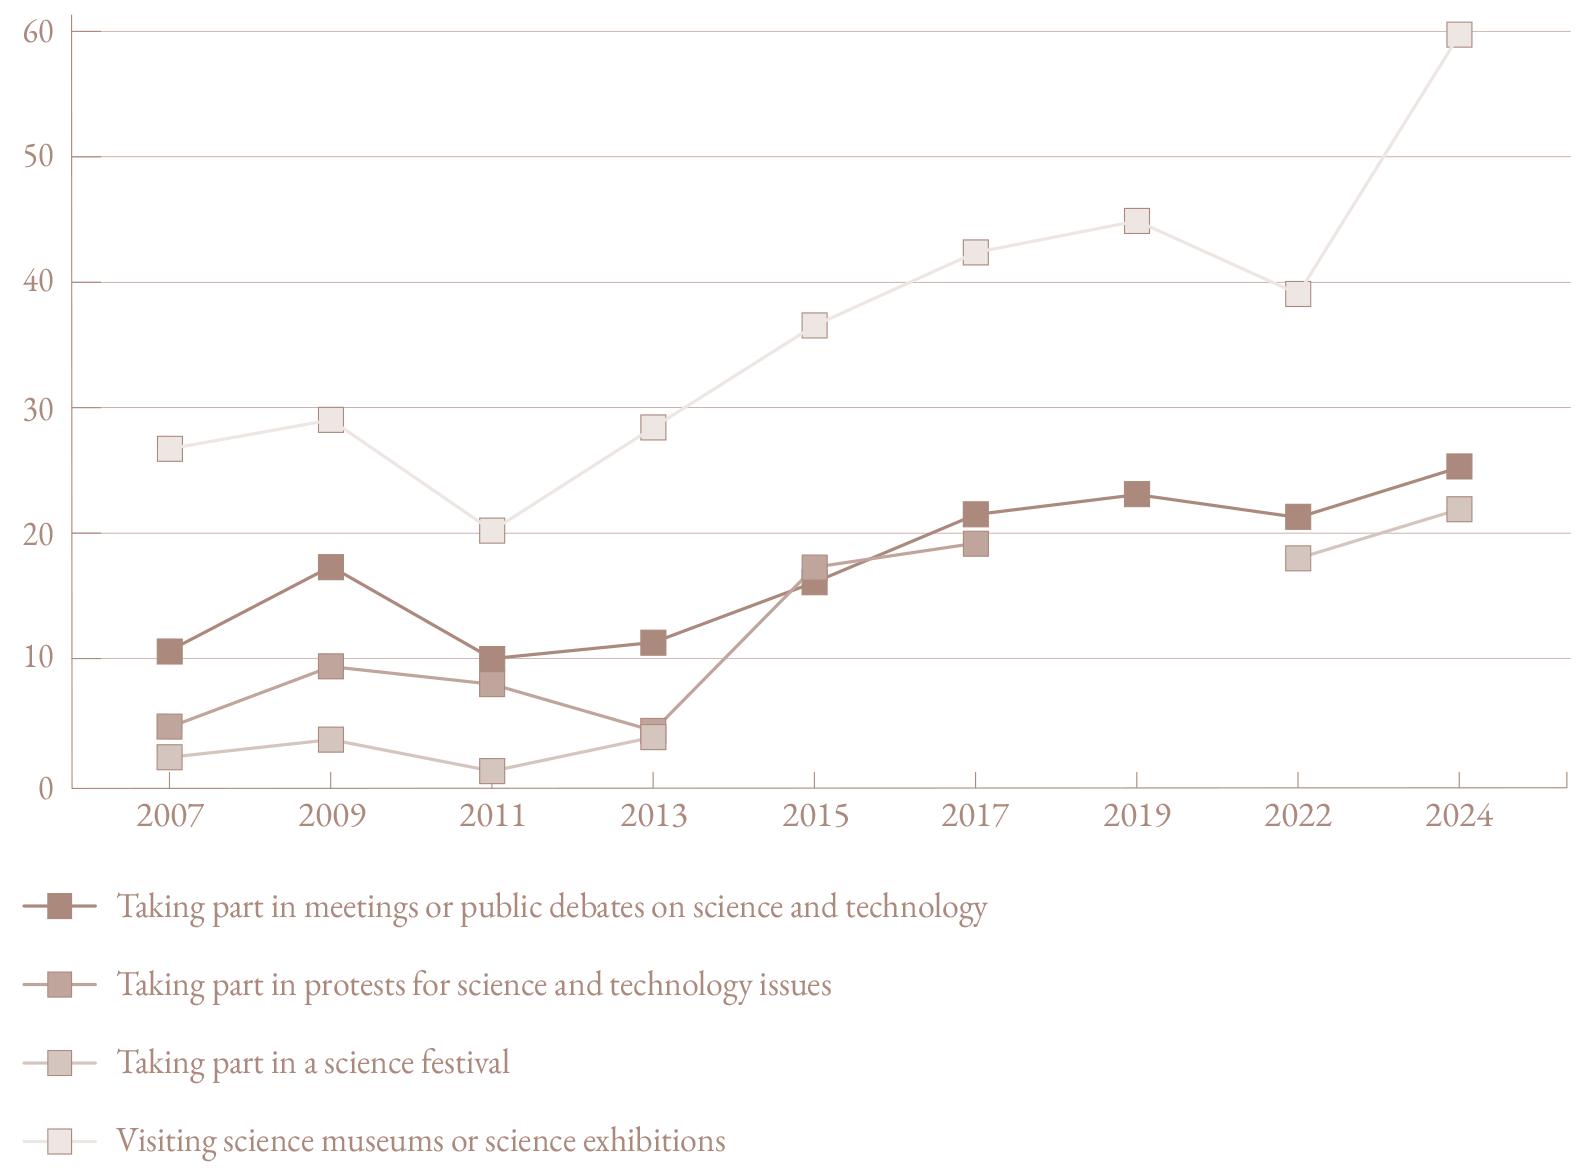
FIG. v Attendance at events or demonstrations about science or technology issues (at least once in the last year, %, 2007: n = 998; 2009: n = 1020; 2011: n = 1001; 2013: n = 1005; 2015 = 999; 2017: n = 997; 2019: n = 978; 2022: n = 1015; 2024: n = 998)
The vast majority of Italians, nearly nine in 10, say they trust science, research institutions and scientists [ Fig. VI ]. Trust is linked to the need to find reassuring answers to highly dramatic events, such as the COVID-19 pandemic, climate change or major diseases, raising expectations of those in society who are engaged in the quest to mitigate their harmful effects.
It is especially those with high educational qualifications who have more trust, as well as those who inform themselves more often about science and technology. In contrast, less credit is given to experts who speak publicly, such as on TV or social media. Slightly less than half of Italians trust them (49.7 %), reflecting the fact that not everyone who speaks about science is deemed fit to do so. Those who are distrustful are so mainly because they believe that experts express opinions that disagree with each other, creating confusion (45.8 %) [ Fig. VII ], or because they are non-transparent about their conflicts of interest (28.3 %) or, finally, because they are not reputed to be good communicators (17.9 %).
In contrast, those who trust them appreciate their ability to provide accurate information (52.5 %) or believe that they are the only ones who can clearly explain complex issues. A theme that emerges implicitly, even in relation to the spread of social media and its use by scientists, is that of personalisation, which risks being at the expense of clarity of content.
The Science and Technology in Society Monitor has also been recording a number of judgments about the role of science and technology in society for many years. The first judgment is about the agreement with the statement that only science can tell us the truth about man and his place in nature. In 2009, almost six in ten Italians (59 %) thought this way. Over the years this view has been consolidated until it is shared by more than eight in ten Italians in 2024 (81.8 %).
The second is about science and technology are changing our lifestyles too quickly. This view has fluctuated over time and in 2024 is shared by just under three out of four Italians (72.9 %). There is also a split between the under-30s, who show less concern, and the rest of the population. Being part of the Millennials, or at any rate being born towards the end of the last century, leads to facing technological novelties with more confidence. Digital natives feel much less that change is too rapid (56.3 %).
The third judgment concerns a possible restriction of scientists’ freedom by religion. About half of Italians think so (50.8 %), with values remaining almost stable compared to previous years. Age affects this in no small part, as it is the over-60s who feel most strongly that religion is not a limitation.
Finally, the last judgment concerns the role of science and technology as potentially responsible for environmental problems. In 2024, this judgment loses relevance: in fact, more than one in three indicate this in 2024 (37.3 %), while in previous surveys it was always more than half (52 % in 2018). The blaming of science is shared mostly by those with very low educational qualifications (at most middle school, 43.3 %) compared to high school graduates and college graduates (both about 30 %).
In summary, data from the Science and Technology in Society Monitor 2024 confirm long-term trends such as increasing scientific literacy and changing information styles and access to content on science and technology. Trust in science, scientists, and research institutions remains very high, but the critical judgment on the communicative role of science experts should not be underestimated.
The Science and Technology in Society Monitor is, since 2003, a permanent monitoring of Italians’ behaviours and opinions on issues related to science and technology. The survey is carried out throughout the Italian territory and involves, through a mixture of CATI (Computer Assisted Telephone Interviewing) and CAWI (Computer Assisted Web Interviewing) techniques, a sample of 1,000 cases, proportional and representative by gender, age group and province of residence of the population aged 15 years and older.
Considering educational qualification a relevant variable, after each survey the obtained sample is weighted to make its structure correspond to that of the Italian population with respect to the variables gender, age class and educational qualification.
The 2024 survey was conducted between April 10 and 23 by interviewing 1.000 units. Data were collected using the CATI technique for 20 % of the sample and the CAWI technique for the remaining 80 %.
The use of Artificial Intelligence (especially generative AI) is growing in Italy, but concern remains about the implications and the demand for regulation


Since decades, Artificial Intelligence (AI) no longer represents a science fiction mirage but is widely used in numerous everyday applications such as social media, e-commerce websites, and voice assistants. In recent years, AI has seen its relevance increase dramatically and is rapidly becoming an integral part of everyday life, transforming the way citizens work, spend their leisure time, and receive essential services, from delivery to banking services and health care. The public relevance of these technologies has sparked wide interest among researchers and produced a proliferation of ethical, legal, economic and social considerations. Since November 2022, when OpenAI made the new version of ChatGPT available, the Science and Technology in Society Monitor has been monitoring the knowledge, attitudes and public image of AI among Italian citizens. The new survey conducted in 2024 aimed at monitoring the developments of some aspects already considered in 2023 (imaginary, sources of information, opinions about generative AI), while developing in parallel an in-depth study of new dimensions related to AI: devices used, trust, opinions, expectations and emotions.
What is currently the social representation of Artificial Intelligence that permeates the collective imagination of Italians? Metaphors, images, and narratives allow for orientation and classification of events or artefacts that are “new” (and, therefore, unfamiliar) by relating them to social categories from prior experience and knowledge. Artificial Intelligence is affected, at the level of public representation, by the many literary and film works (mostly attributable to the science fiction genre) that have described, narrated, and sometimes anticipated it for a long time. Even in the latest survey, Italian citizens, in fact, tend to associate the expression ʻArtificial Intelligence’ predominantly with humanoid robots: 27 % indicate this, slightly lower than the share in 2023 (31 %). Although the public imagination remains anchored to an image of ʻhumanoid’ Artificial Intelligence [ Fig. 1 ], the extensive debate on generative AI tools that has involved the media over the past two years has meant that in 2024 AI is associated by 26 % of citizens with the ChatGPT platform. A growth of more than 10 % points compared to 2023 when it was 16 % who indicated this option. Among the most frequent associations are voice assistants (such as Alexa or Siri, for example) indicated by two out of ten citizens in both 2024 and 2023. The level of association with home automation devices remains almost unvaried (9.5 % in 2024, 7 % in 2023).
The use of humanoid robots in our homes or daily lives is not yet established. But what devices are actually being used? In 2023, among the tools that used AI, 41 % of Italians indicated that they mainly used voice assistants, while only 11 % had used a chatbot such as ChatGPT. By 2024, the share of Italians using voice assistants rose to 49 %, and the share of those who have experimented with a chatbot is one in four. About three in ten Italians use devices to control home equipment, and two in ten have used algorithms to create images or videos. Artificial Intelligence could be applied in many areas but only in few cases would this practice meet with public approval [ Fig. II ]. 76.5 % of Italians favour the use of AI for security, for example through image and face recognition, but appear much more cautious in the case of its use in sectors such as banking or insurance and in schools or universities. Citizens surveyed are decidedly against the use of AI in artistic production (60.4 % say they are against it), in journalism (64.2 %), but especially for the selection and management of workers (here as many as 74 % say they are against it). The level of association with home automation devices remains almost unchanged (9.5 % in 2024, 7 % in 2023).
The increasing use of technological artefacts is often referred to as a symptom of familiarity and acceptance of a technology. The underlying idea is that greater familiarity leads to less distrust of technological artefacts. This assumption is not supported by the data. Although the share of citizens who have been confronted with chatbots such as ChatGPT and generative AI tools has grown, in 2024 the share of citizens who express a significant and increasing degree of caution has grown: in 2023 it was 54 % of respondents who thought they could be used but strictly regulating them, while in 2024 those who think this way reaches 69 %. The share of those who believe autonomous writing systems should be encouraged (14 %) and the opposite share of those who believe they should be prohibited instead (16.5 %) remain stable. It is precisely an increased familiarity with generative AI tools that seems to have contributed to an attitude of increasing caution and the call for regulation.
The spread of neural network-based technologies also does not seem to have affected the information level of Italian citizens. Artificial Intelligence and the technologies that employ it, in fact, still remain relatively unfamiliar. 58 % percent of Italians say they know little about Artificial Intelligence-based systems and applications. Adding up those who claim to have no information at all, this exceeds six out of ten citizens. Italians, despite the growth in the use of AI-based applications and the extensive media coverage given to the topic over the past two years, do not feel sufficiently informed. Only one in three citizens say they are fairly or very well informed. Although many people consider themselves little informed, almost everyone has read or heard about Artificial Intelligence in the past year. TV and/or radio are the information channels where citizens have heard most about Artificial Intelligence (70.5 %), and more than one in two citizens have been able to read about AI on social networks, while four in ten Italians have read about AI in the press (print or web). Nearly a third of Italians have seen content associated with this topic in movies and TV series, and one in five in advertising. 32 % have heard about it from experts in the field and 18 % have talked about it with relatives and/or friends. Only 2 % of Italians in 2024 have not read or heard about Artificial Intelligence [ Fig. III ]
The rapid development of Artificial Intelligence technologies has been accompanied by a debate on implications and regulation. Italian citizens are cautious about the effects Artificial Intelligence will have on society in the long run: one in five believe
AI will have “mostly positive effects,” while 27.7 % are more concerned and see “mostly negative effects.” 51 % express an equidistant position between concern and positive potential. Only a very small minority express no opinion or believe that AI will have no effect [ Fig. IV ].
The Italian public thus takes a rather cautious stance toward the overall impact of Artificial Intelligence in today’s society [ Fig. V ]. 92 % think that Artificial Intelligence systems will progressively have an increasing influence on human activities. The share of those expressing concern is well below that just mentioned, but up from last year’s survey. In 2024, 51 % of respondents see Artificial Intelligence as a threat to humanity’s survival; 47 % believe that machines will be able to replace human activities in the future, and 32.5 % think that Artificial Intelligence is already superior to human intelligence today. However, 94 % believe that there will always be significant differences between humans and machines.
Concern, fear, awe, enthusiasm, trust. What is the prevailing sentiment that AI evokes among Italian citizens? Compared to 2023, the indication of “trust” and “expectation” slightly decreases among Italian citizens, while the indication for the adjectives “suspicion” and “anxiety” increases [ Fig. VI ]
To summarize, the social perception of AI is rather nebulous and at the same time laden with potential concerns about implications in the long run. This picture of perceptions and attitudes on the one hand configures plenty of room for the dissemination of content that can better clarify characteristics, potential, application areas, and implications. On the other, there is a clear expectation for regulatory focus and evaluation of the most critical aspects, such as accountability and management of content with respect to intellectual property. It will be interesting to see whether communication and regulation can meet these two expectations.unicazione e regolamentazione riusciranno a rispondere a queste due aspettative.
METHODOLOGICAL NOTE
The Science and Technology in Society Monitor is, since 2003, a permanent monitoring of Italians’ behaviours and opinions on issues related to science and technology. The survey is carried out throughout the Italian territory and involves, through a mixture of CATI (Computer Assisted Telephone Interviewing) and CAWI (Computer Assisted Web Interviewing) techniques, a sample of 1,000 cases, proportional and representative by gender, age group and province of residence of the population aged 15 years and older.
Considering educational qualification a relevant variable, after each survey the obtained sample is weighted to make its structure correspond to that of the Italian population with respect to the variables gender, age class and educational qualification.
The 2024 survey was conducted between April 10 and 23 by interviewing 1.000 units. Data were collected using the CATI technique for 20 % of the sample and the CAWI technique for the remaining 80 %.

Giuseppe Pellegrini
The European Researchers’ Night (ERN) is the most important research communication event held annually on the last weekend of September in more than three hundred European cities. The initiative began in 2005 and is promoted by the European Commission under the Marie Skłodowska-Curie Actions. The ERN involves thousands of researchers and an audience of about one and a half million participants each year. Italy is one of the European countries where more projects are active, of which nine are currently funded by the European Commission.
The main objective of the ERN is to foster the meeting of female researchers with the non-expert public through demonstrations, exhibitions, meetings and presentations to promote scientific culture and raise awareness of the world of research. Over the past decade, activities have been organised in town squares, universities and research centres in different ways to encourage the involvement of various audiences: families, youth, adults and children. With this perspective, the venues chosen have fostered effective diversification, allowing experimentation with various communication formats best suited to the relevant audiences. Not just a matter of opening the doors of scientific institutions and research centres, but of going out to meet the public in everyday places and in the most accessible public spaces. The increase in spaces and proposals allowed ERN to develop not only on the last weekend of September, but to extend into the periods before and after, offering a wide range of activities.
Since 2018 Observa has been conducting the monitoring and evaluation of the Sharper project, which currently coordinates initiatives in 14 Italian cities in different areas of the country: north, center, south and islands1. Through the use of social research tools (questionnaires, interviews, and observations), data have been collected on public perceptions, the progress of activities, the role of researchers, and the contexts of implementation. We propose below the main results achieved in the study of ERN target audiences, the relationship between researchers and the public, and a number of directions for future development of activities.
The Sharper project involved nearly eighty-thousand people in 200 locations in Italy’s 14 cities with 1040 events in 2023. The evaluation activity collected information on the outcome of the activities from three thousand participants with questionnaires administered before and after the events. The sample consists of a well-educated public, with an average percentage of thirty percent graduates. The average age is 31, and 23.5 % are young people under the age of twenty. This effect is due to the choice to involve a large number of students, especially in the last two years of operation. The average audience is represented by 55 % women. Normally, people mostly participate in groups (49.6 %) or with family (22.6 %).
Considering cultural habits, more than 30 % say they have visited exhibitions or science museums. The data collected revealed the variances in participants’ interest and judgment of activities. Over the period 2022-2023, 70 % of the participants reported having a strong interest in science. The judgments made about the activities are more than favourable considering the researchers’ exposure, understanding of their work, and knowledge of new scientific topics. The consensus on whether researchers’ work can improve our cities and the possibilities of interaction with them is more moderate. 71.6 % of respondents would recommend their friends to participate in ERN.
When asked to give an overall rating after the activity, 83 % of the participants proposed a very positive rating (ratings between 8 and 10 on a decimal scale in 2023). The variance in the judgment on scientific activity is also significant, with 41 % of respondents proposing, on a scale between 1 and 10, the highest rating. The figure is significant because it is almost similar in the last two survey years.
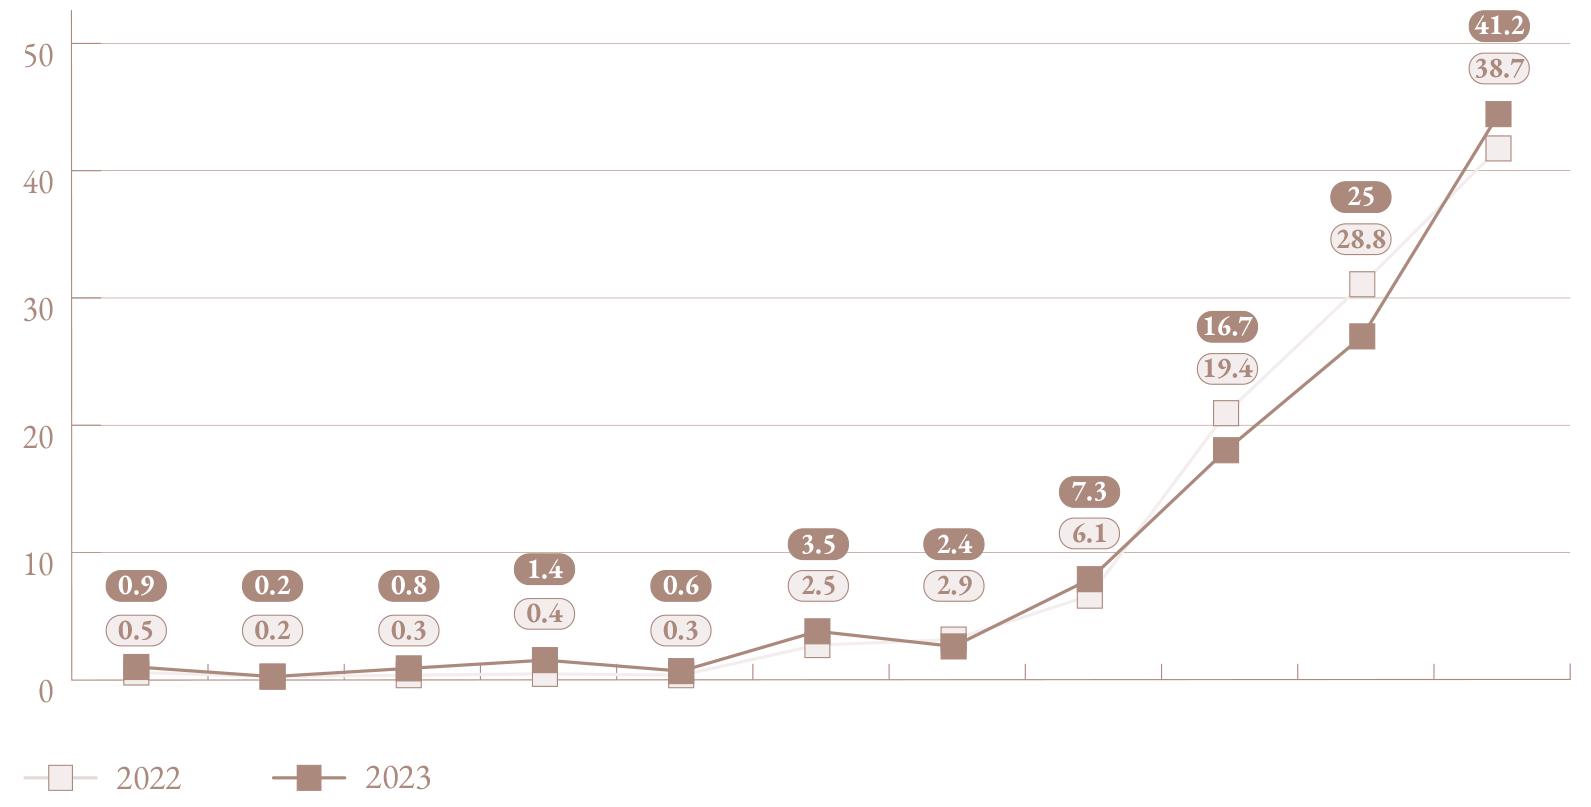
It can be concluded that the audience of the European Researchers’ Night is selected and made up of people who have a sound interest in science. From the observation carried out by Observa over the years, it can be seen that the initiatives carried out in the cities have gradually fostered the consolidation of a tradition of meeting between the world of research and the public. In fact, many participants say they have already participated in activities and attend known locations with a desire to discover new topics and research perspectives.
Public communication of science and technology has evolved in recent years through new tools and by fostering greater listening to the public, which, as we have seen in the data, appreciated the encounters and the ways in which they were carried out. Researchers involved in the ERN were interviewed to study their public perceptions and modes of communication.
Over the years, there has been increased commitment and participation in initiatives, from the training stages to research: master’s and doctoral degrees. It is not only a matter of proposing more activities, but also a development of communication modes and tools. In fact, many of the researchers approach the audience with short presentations and a conversational style that provides space for questions and curiosity, moving beyond the traditional lectures or demonstrations that characterised the ERN in its early years.
The proposed activities have diversified over time into three categories that we can define: structured meetings in the form of lectures, semi-structured as workshops, and informal through informal dialogues and games. Meetings in lecture or conference form have been reduced over time and workshops, games and demonstrations have increased considerably. More immediate encounters, characterised by open communication in the form of dialogue and exchange of impressions, are being experimented in various cities with engaging and sometimes unpredictable formats. Science cafes, science at the pub or speaker corners aim to intrigue, entertain and subvert the rules of traditional science communication based on the centrality of the researcher. However, these formats must be studied carefully as they require preparation and ability to deal with different audiences and potentially unsettling questions.
When interpreting a communicative role, one tends to have role models to look up to. Researchers have often pointed to certain media icons of science journalism as their main points of reference, among them Piero and Alberto Angela. But in recent years other figures present on the Internet (influencers, scientists and communicators) have emerged from their accounts. These new presences are also considered credible communicators by noting that they are very popular with the public, particularly the younger generation.
But what is the image of the public that researchers have? In general, the public is perceived as active and not just passive and incompetent. Evaluation activities have revealed that there has been a development of a greater ability to grasp the needs of the public. In recent years, prompted by institutional “Third Mission” initiatives, researchers have tried to get on the side of non-experts by studying ways and means of communication increasingly adapted to the contexts and needs gathered from the media. In this perspective, it has been noted from the interviews, for example, that issues of ethical and moral relevance are being examined and addressed without any special fears. In short, it can be said that male and female researchers approach the public without the pretence of teaching anything but of conveying their work by trying, where possible, to answer questions of public interest.
Over the past two decades, European Researchers’ Night enabled a wide audience to meet scientific institutions and researchers by stimulating attention and curiosity about all scientific fields, from the natural sciences to the humanities. The Sharper project offered a wide range of initiatives allowing non-experts to get a direct approach to Italian research activities.
The relationship between the public and researchers has evolved over time. What matters most is the ability to engage and activate interest in a short time by offering some insights to foster curiosity. Researchers must therefore be able to communicate essential aspects of their work in a simple and non-trivial way, while also being ready to gather feedback from participants. Interpreting this role requires adequate training in how to communicate and what tools to use. This effort will also allow researchers to be placed in the activity best suited to their communication skills and to improve their relationship with the public.
The desire to be effective in intriguing and capturing attention can sometimes detract from the research activity and, consequently, the possibility of active involvement of the audience. The experimental attempt to offer unique moments with special effects risks affecting participants only emotionally, obscuring important elements of the research activity such as commitment, method, and difficulty. Within the research community, therefore, a reflexive attitude must be maintained on the various formats used, emphasising the elements of involvement such as raising awareness and listening.
At a time when scientific information is ubiquitous, often in inaccurate ways that lead to biases that are inconvenient or outright misinformation, the role of those who work in research and communicate it can be very useful. Considering the public's favour towards researchers, they can be an important vehicle for the proper dissemination of scientific and technological information. In this way they can increase proximity to the public through the telling of work and results by making information more accessible and fostering understanding of the leading mechanisms of scientific enterprise.
All scientific disciplines have ventured into making appropriate encounters with the public though the ERN. In this way, researchers have had important opportunities to foster an intense and improved relationship between science and society. To continue in this direction, disciplinary boundaries will have to continue to be crossed and the social questions that interrogate the world of research will have to be grasped. Here, then, is where researchers will be able to address the demands of the public without distorting their role as knowledge workers and offering their contribution to the demands of society in an understandable way.
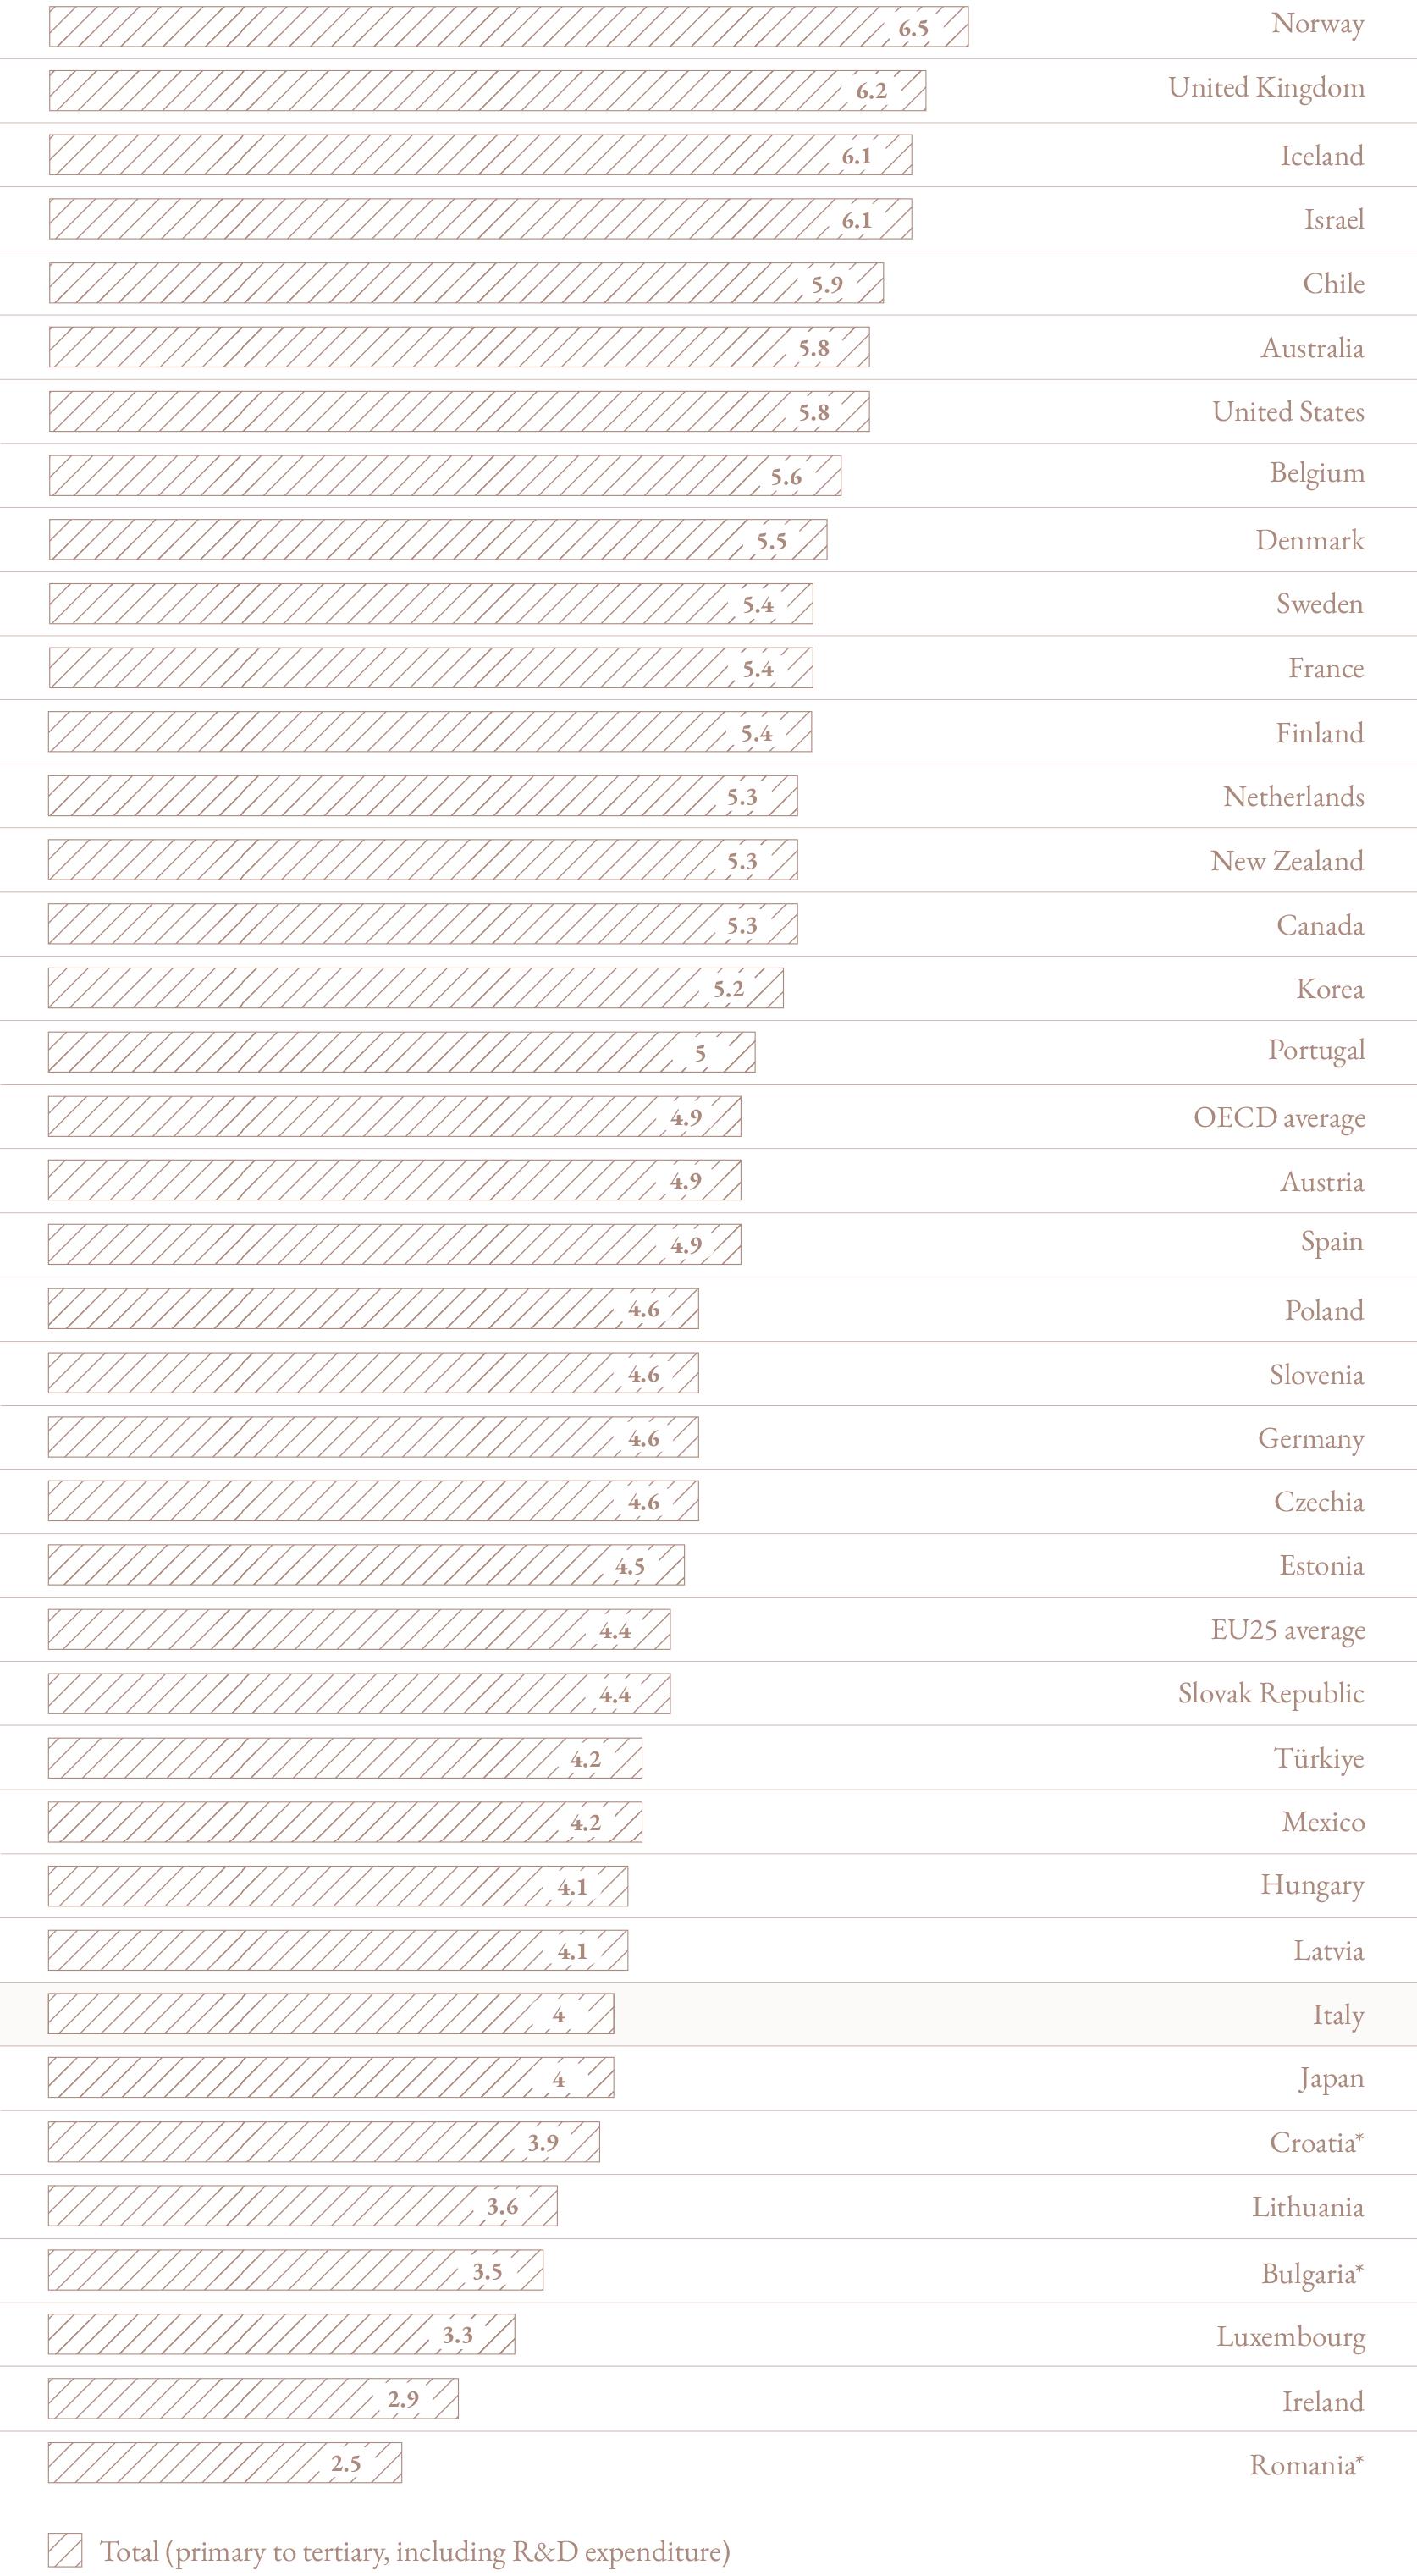
Francesco Seganfreddo
A country’s level of education is a key element in contemporary societies. Higher levels of education are associated with positive economic, labor market entry and social outcomes for individuals. For example, young people with a tertiary degree, compared to their peers without a degree, access better professional opportunities, enjoy higher wages and are more likely to engage in lifelong learning. By analysing data provided by the Organisation for Economic Co-operation and Development (OECD), we can compare the state of education globally and in Italy.
Spending on education relative to gross domestic product (GDP) is an important factor in assessing the state of a country’s overall educational status. It normally indicates how much a country considers it a priority to invest in its education system. In fact, higher spending translates into investments that improve the quality of and access to education, such as resources for school infrastructure, teacher training and remuneration, and support for students with economic difficulties.
In 2021, OECD countries allocated an average of 4.9 % of their gross domestic product (GDP) to education, totaling more than 3.5 trillion US dollars [ Fig. I ]. This spending covers educational institutions from primary through tertiary education, including research at the university level. Countries such as Iceland, Israel, Norway and the United Kingdom, invest more than 6 % of their GDP in education, while at the other extreme are Romania and Ireland, which do not reach 3 %. Italy stands at an expenditure of 4 % of GDP, thus below both the OECD average and the average of the 25 European countries that are part of the OECD (4.4 %). Other major European countries comparable with Italy have higher percentages: Germany spends 4.6 %, Spain invests 4.9 % and France 5.4%.
Fig.1 Previous page: Total expenditure on education (primary to tertiary, including R&D expenditure) as a percentage of GDP (2021).
Note: The countries marked with * are OECD “partner” countries, i.e., they are not part of the OECD but their data are still monitored.
Comparing the total spending of countries with respect to spending on tertiary education (including spending on research and development) we observe that Italy again ranks among the last OECD countries, investing only 1 % of GDP. Worse than Italy we find only Ireland (0.7 %) and Luxembourg (0.5 %). This figure places Italy below the OECD average (1.5 %) and far behind countries that invest more in tertiary education, such as Chile (2.4 %), the United States (2.3 %) and the United Kingdom (2.1 %).
Another indicator for assessing the state of a country’s education is the number of young adults (25-34 years old) earning a tertiary education degree. In OECD countries, between 2016 and 2023, the share of young adults with a tertiary degree increased by an average of 5 % points [ Fig.2 ]. Notable increases of 10 % points or more were recorded in Chile, Ireland, Spain and Turkey, highlighting important changes in these countries’ education systems and suggesting a shift toward a more knowledge-based economy where higher qualifications are required.
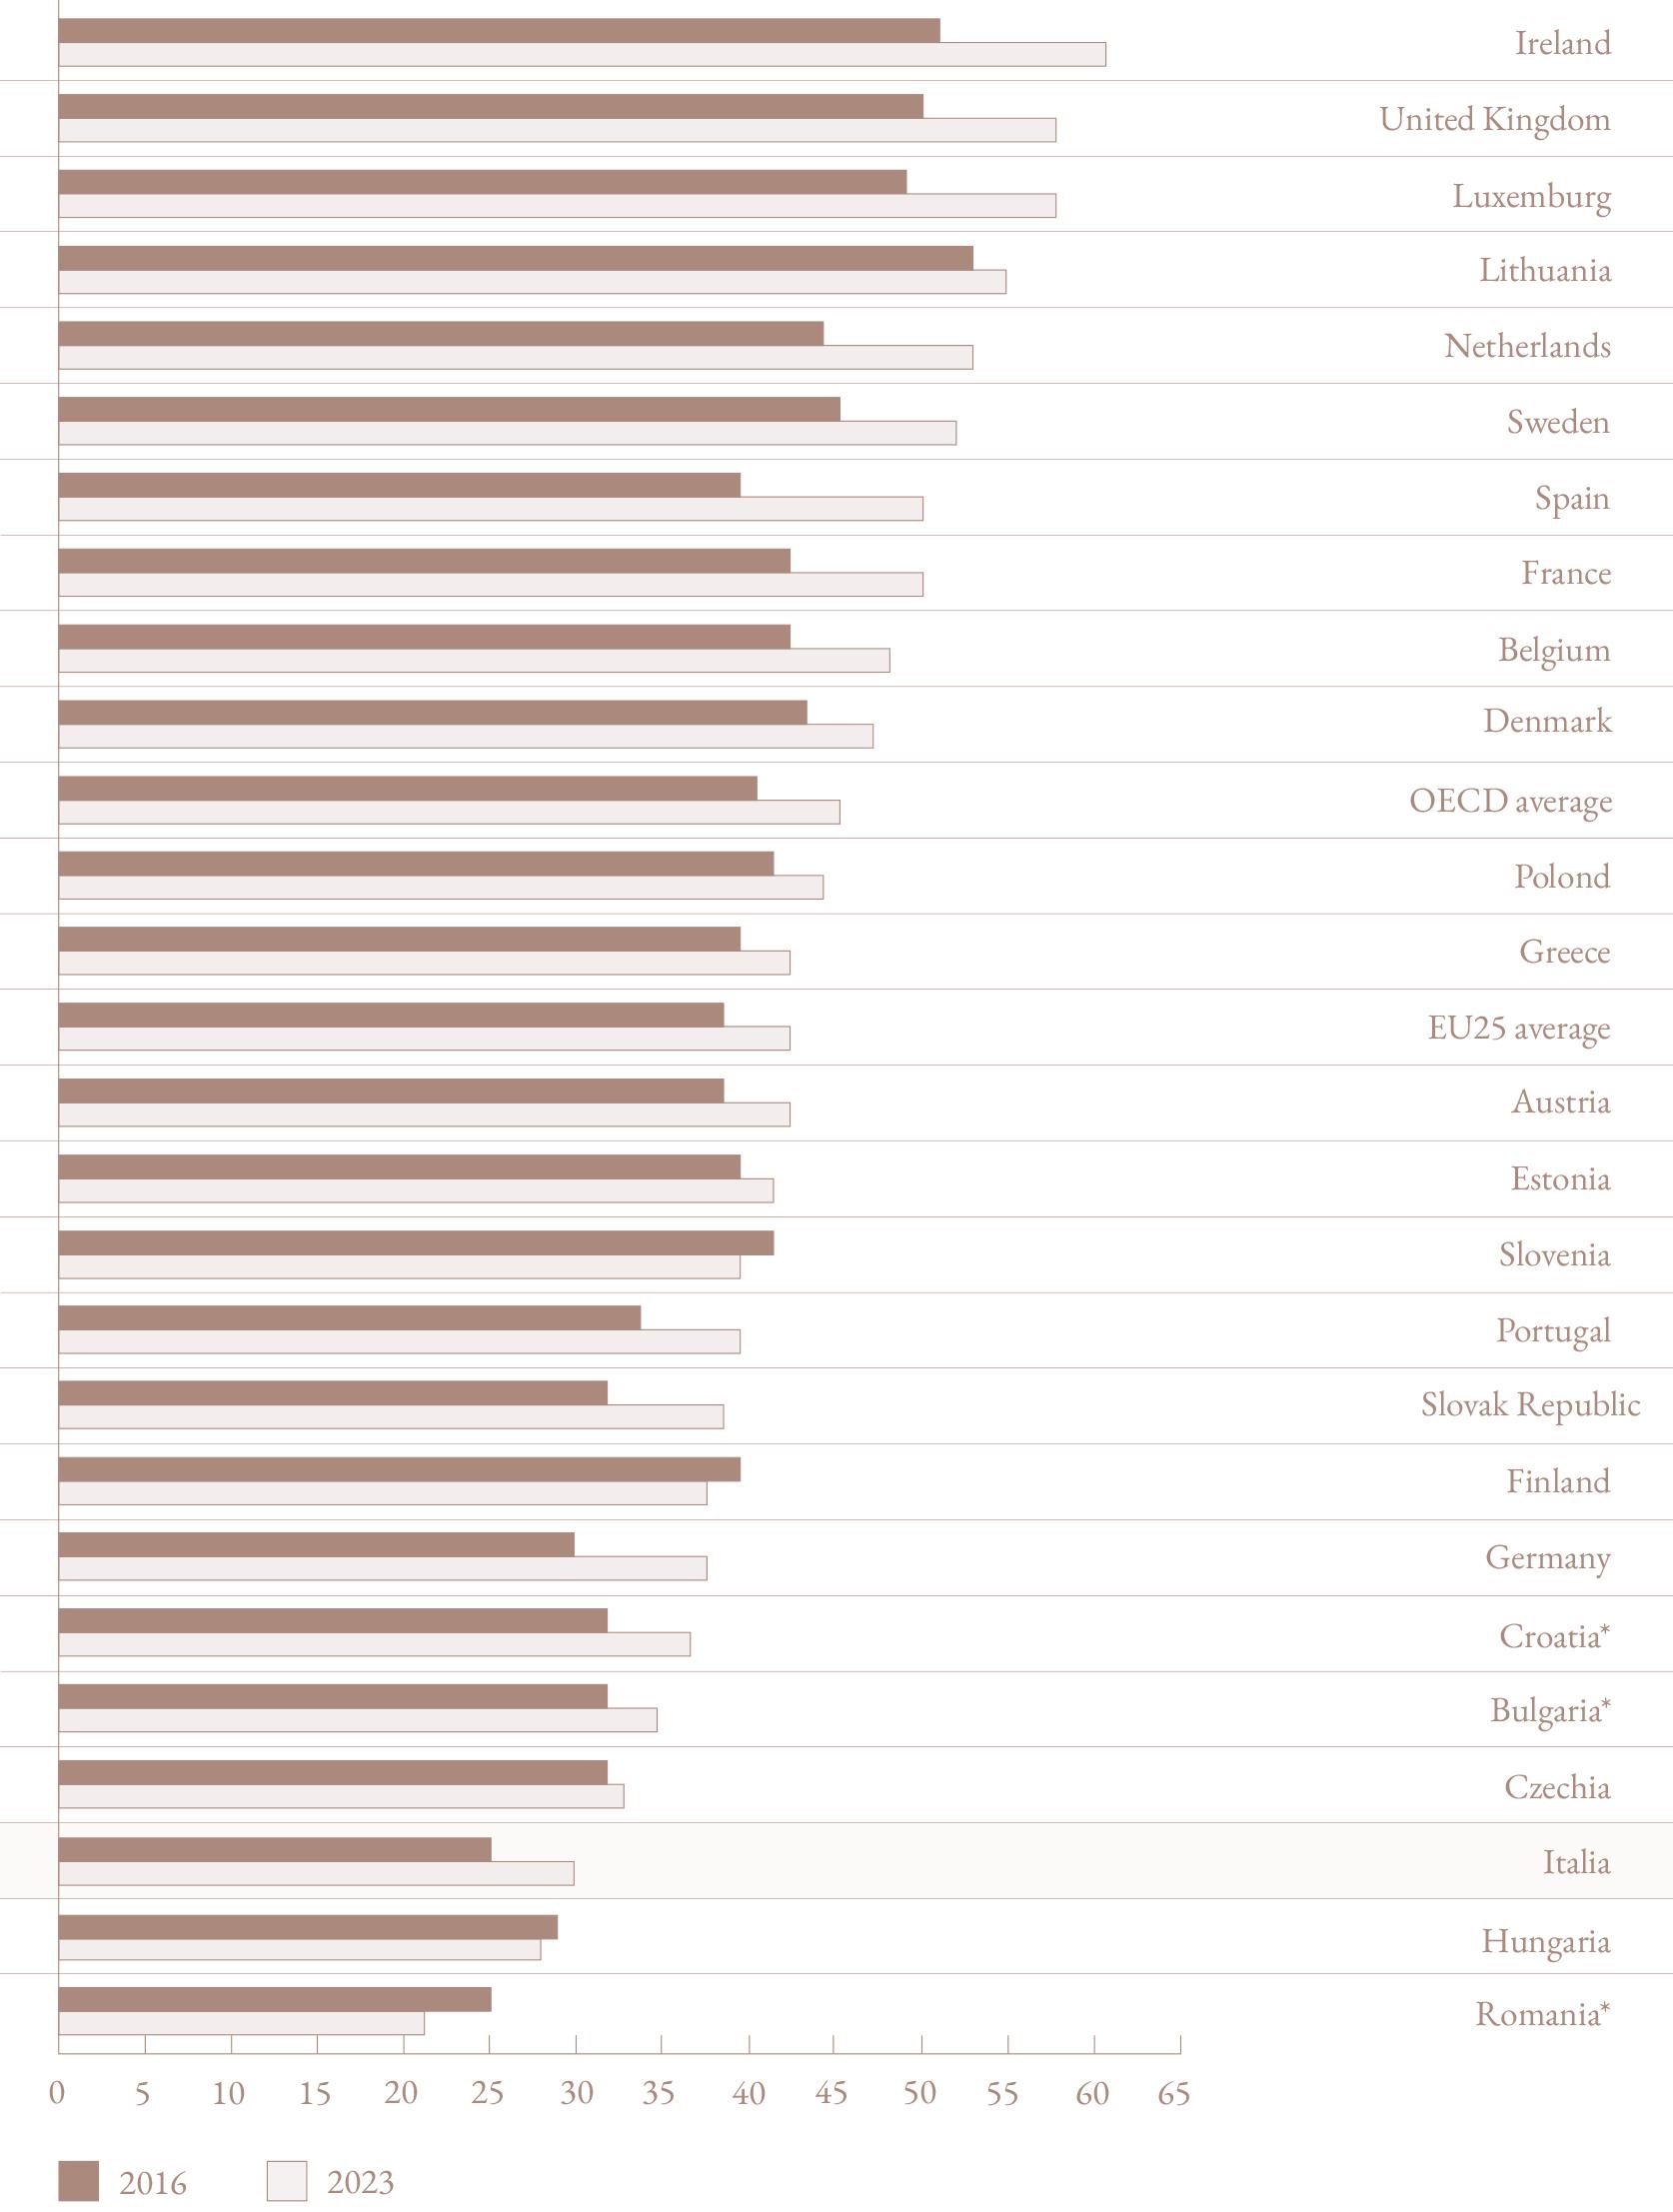
Note: Countries marked with * are OECD “partner” countries, i.e., they are not part of the OECD but their data are still monitored.
Looking at individual OECD countries, South Korea stands out for the percentage of young adults with a college education, reaching 70 %. This is followed by Canada with 67 % and Japan with 65 %. In contrast, Italy ranks at the bottom with only 31 % of college graduates between the ages of 25 and 34, along with Hungary (29 %) and Mexico (28 %), well below the OECD average (47 %).
Looking at the data at the European level, the average for OECD member countries stands at 44 %, a figure that rises to 45 % if we consider the entire set of European Union countries, according to Eurostat data. This figure is interesting when compared with the targets set by the European Union in 2021, which aim to reach 45 % of young Europeans with a university degree by 2030. Currently, 13 European countries have already reached this goal: Ireland (63 %), Cyprus, Luxembourg (60 %), Lithuania (57 %), the Netherlands (55 %), Sweden (57 %), Spain and France (both at 52 %), Belgium (50 %), Denmark (49 %), Malta and Poland (both at 46 %), and Latvia (45 %). Still far from the target Romania (22 %), Hungary (29 %), and Italy (31 %).
To conclude, we look at data on the number of women with tertiary education. When again considering the category of young adults (25-34 years old), we observe that women continue to systematically outnumber their male peers in all OECD countries except Mexico: on average, 54 % of young women are college graduates, compared to 41 % of men.
Analysing the data at the national level, South Korea stands out for having the highest proportion of young female graduates, at 77 %, followed by Canada and Japan, both at 76 %. Among European countries, Lithuania stands out with 68 %, well above the average for OECD member countries, which stands at 52 %. At the bottom of the rankings we find Italy once again, at 37 %, followed by Hungary (36 %), Costa Rica (28 %) and Mexico (28 %). If we also include non-OECD countries, South Africa records the lowest figure, with only 11 % of young female graduates.
Although women make up the majority of young adult graduates, they remain underrepresented in specific disciplines and research areas, such as STEM disciplines. This phenomenon, known as ʻhorizontal segregation’, can be measured through the number of new enrolments in different disciplines. If we compare the number of women newly enrolled in STEM courses in 2022, compared with men, we observe that, on average, only 15 % of new enrolees choose a STEM discipline, compared with 41 % of men [ Fig.3 ]. These disparities are evident in several countries, with Chile and Finland showing the most significant gaps, while the Netherlands and Turkey show the smallest differences.
A positive finding for Italy is that the country ranks first among OECD countries in the number of young women enrolled in STEM subjects. In 2022, 21.3 % of young female adults chose technical and scientific disciplines, divided into natural sciences, mathematics and statistics (11.7 %), information and communication technologies (0.7%) and engineering, manufacturing and construction (8.9%). This result places Italy above not only the OECD average, but also that of European countries, which stands at 16.1 %. A figure that suggests that efforts in this direction by universities, associations and individual female researchers who promote greater inclusion of young women in technical and scientific subjects are paying off.
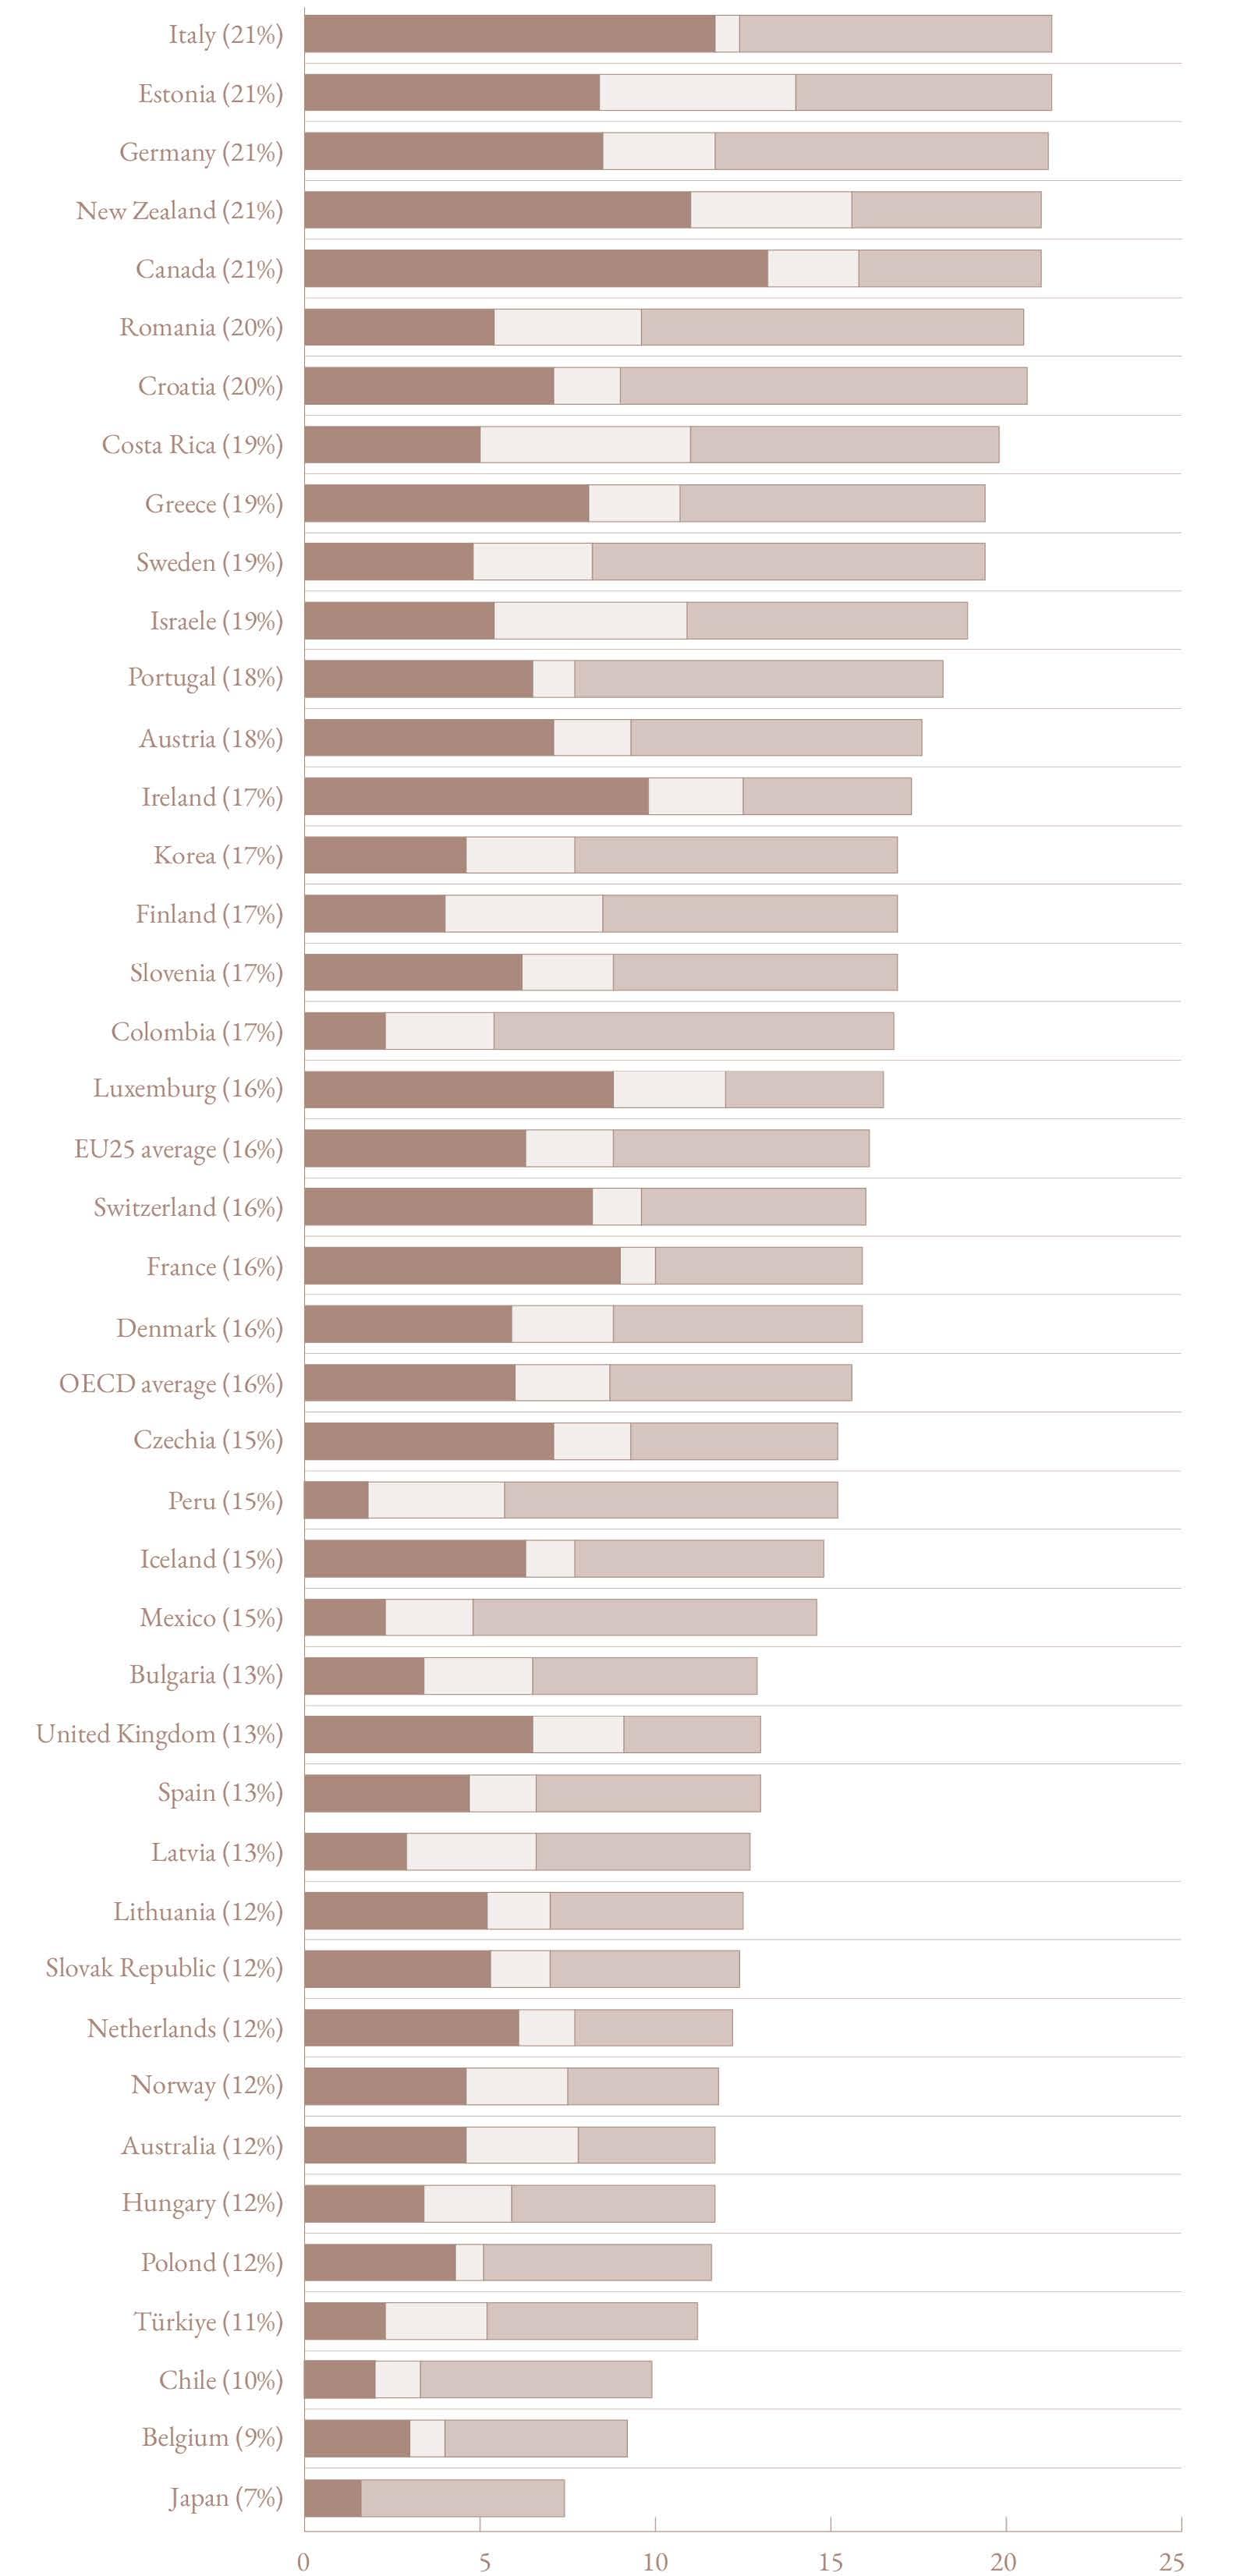
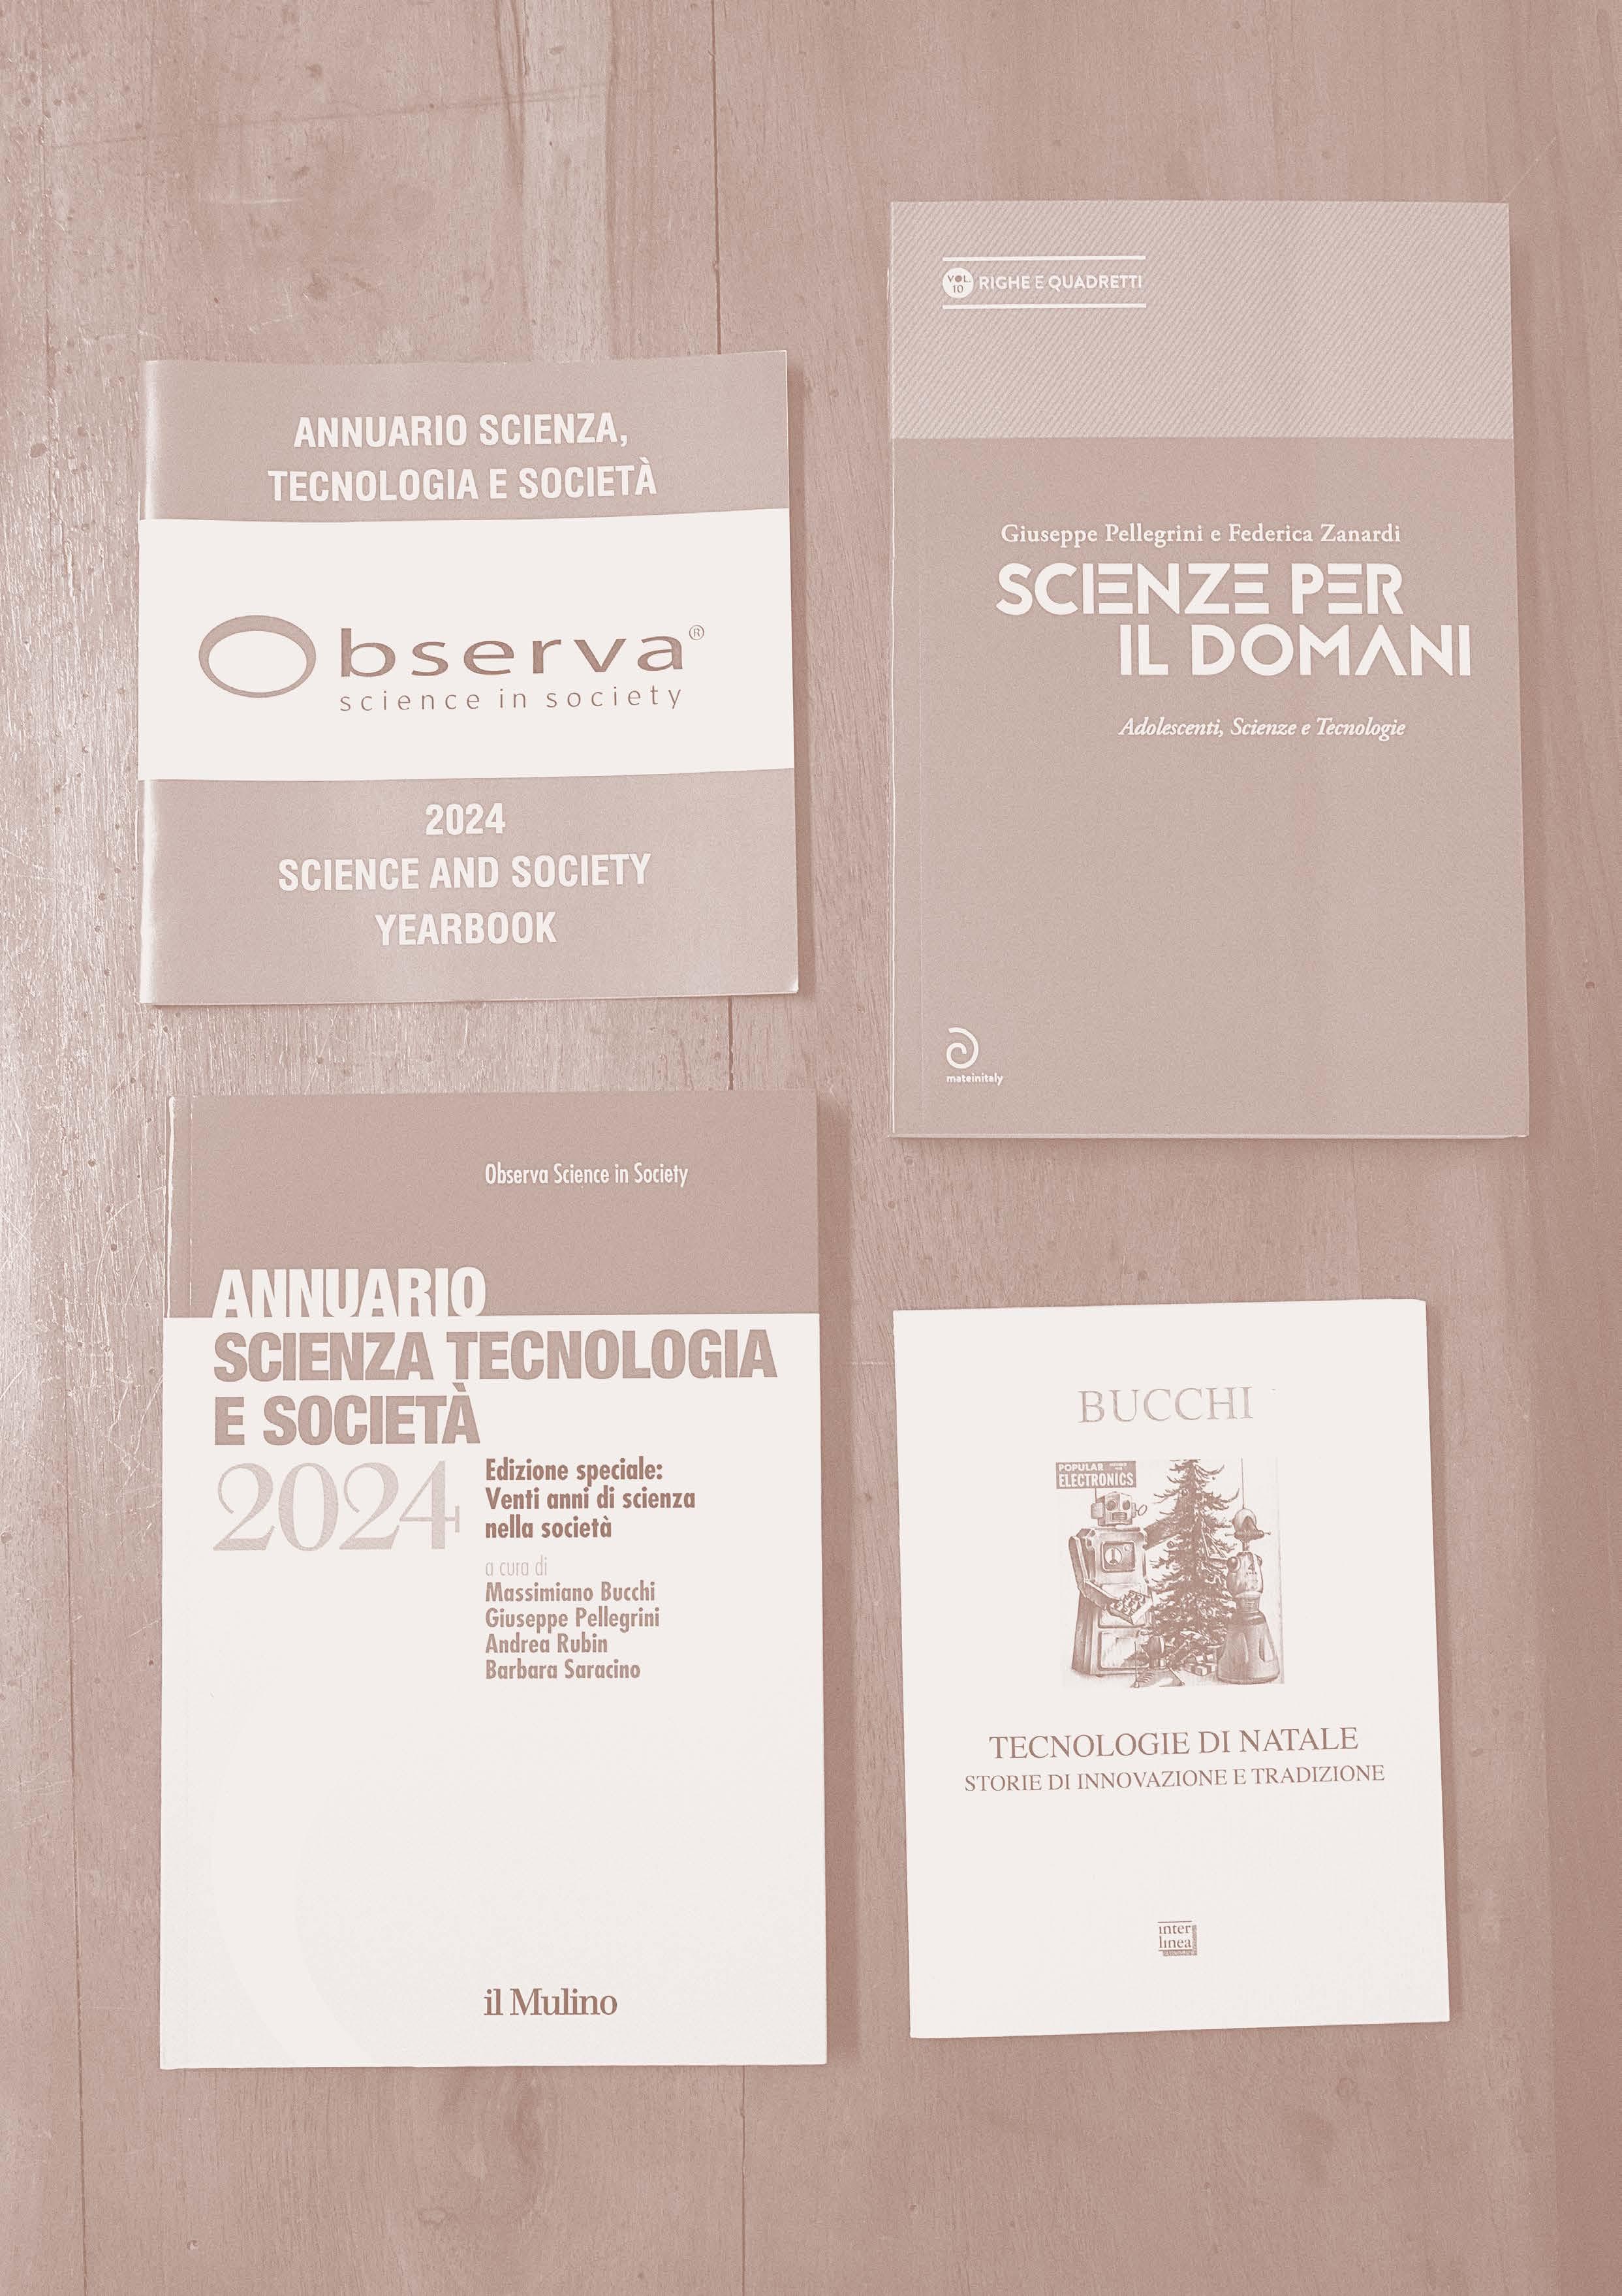
Massimiano Bucchi
J. Renck, Chernobyl, Prime Video (2019)
Kraftwerk, Autobahn, anniversary edition
C. Henderson, Cosmofonia, UTET (2024)
Giuseppe Pellegrini
Curiosity Stream, Curious Minds: Science in Society, Prime Video (2023)
Oxford University, Consciousness in Humans and in Other Things with Anil K. Seth, Podcast (2024)
Luciano Floridi, Filosofia dell'informazione, Raffaello Cortina Editore (2024)
Andrea Rubin
A. Philipson, Einstein e la bomba, Netflix (2024)
R. Kanjee, The Turing Test, podcast, Spotify
N. Cristianini, Machina sapiens, Il Mulino (2024)
Barbara Saracino
Greg Berlanti, Fly Me to the Moon (2024)
Lorenzo Baglioni, Ripassongs (2023)
Elena Cattaneo, Scienziate. Storie di vita e di ricerca, Raffaello Cortina Editore (2024)
Francesco Seganfreddo
P. Guzmán, Nostalgia della luce (2010)
L. Fridman, Aravind Srinivas: Perplexity CEO on Future of AI, Search & the Internet, Podcast #434, YouTube
M.J. Gorman, Idea colliders: the future of science museums, MIT Press (2020)
Molti i nuovi progetti di ricerca iniziati nel 2024, tra cui il progetto europeo HEREDITARY (HetERogeneous sEmantic Data integratIon for the guT-bRain interplaY) che mira a trasformare le modalità di individuazione delle malattie e le relative risposte terapeutiche. Observa coordinerà gruppi di lavoro tra diversi soggetti impegnati in questo cambiamento.
Tra le iniziative culturali del 2024 gli incontri legati alla mostra La Caduta degli Angeli Ribelli a Gallerie d’Italia di Vicenza, dove si è parlato di arte, cinema, filosofia, letteratura con Francesco Messina, Michele Fedrigotti, Alice, Alberto Brodesco, Paolo Pellegrini, Stefania Carlesso.
Tante anche le presentazioni e gli interventi in Italia e all’estero: Brasile, Germania, Canada, Danimarca, Norvegia, Cina, Giappone, Paesi Bassi, Portogallo, Stati Uniti. Sono usciti numerosi articoli, saggi e volumi di studiose e studiosi legati ad Observa, scoprili sul sito [ QR 1II ]
Tra gli appuntamenti del 2025 il convegno biennale di Comunicazione della Scienza (PCST) ad Aberdeen in maggio.
Tra le attività culturali riprenderanno anche i reading concerto di Massimiano Bucchi e Arturo Stàlteri:
1 febbraio a Gallerie d’Italia, Vicenza
20 marzo al Festival Coltivato, Torino
8 marzo a Villa Caldogno, Vicenza
7 maggio ad Aarhus, Danimarca
Il 18 marzo debutta a Torino, con la produzione del Teatro Stabile, lo spettacolo di Laura Curino su Rachel Carson La Signora degli Oceani, testo di Massimiano Bucchi.