
81 minute read
III. Managing waste as common resource


Figure 29.
Positioning of each city compared to the models studied
Advertisement
1. Waste: a “common good” that confirms the empirical analysis
Our empirical analysis of the spatial and economic dynamics at play shows that urban solid waste has the characteristics of a common good: - Economically, given that the potential revenues from recycling are substantial, dry waste appears as a rival good since its appropriation by one actor deprives others of its possible resale. - Spatially, the absence of underground waste disposal networks, as well as the multiple intermediate reloading operations (transfer points, transfer stations), makes any exclusion impractical: it is virtually impossible to prevent waste from being intercepted (both in space and time) upstream of the municipal service. In fact, the most lucrative elements of a city’s discarded waste are often skimmed off upstream by informal collectors. In light of this empirical analysis, urban waste – rival and non-excludable – appears as a resource with the characteristics of a common good (Cavé, 2015), as defined by the originator of this concept (Ostrom, 1990).
Considering stocks and flows of waste together
However, so as to avoid the conflation whereby all urban waste is assimilated to its most recoverable and lucrative part (dry waste), it is useful to reason in terms of stocks and flows: - In fact, one part of the waste generated by citizens in the global South is quite quickly recovered or purchased and never ends up in a disposal site. These fractions of waste have a sufficiently high obvious value that they are never abandoned for long. They can be equated to flows. - The other part of the waste is permanently discarded and abandoned. This fraction of waste, which has zero or even negative value, corresponds to a stock: no actor is spontaneously prompted to recover or recirculate it. Mixed together, flow and stock constitute the overall urban solid waste deposit generated. However, this contiguity leads to cross-contamination. As the individual properties of materials that come into contact with each other become degraded, it is this mixing of different types of rubbish that is partly responsible for generating waste. For instance, a sheet of paper brought into contact with a mouldy tomato will soon become wet and unusable for its original purpose. It turns into waste. In other words, mixing some materials that could have been flows end up as a stock with no value.
Flows and stocks in Ostrom’s Common Pool Resources
Here, the concept of common pool resources (CPR) (Ostrom, 1990) proves useful both from an analytical and operational perspective. In the 1980s, E. and V. Ostrom conducted important empirical research on environmental resources managed outside of governmental or market spheres (Ostrom, 1990) and developed the concept of “common pool resources”. Elinor Ostrom defines CPR as a “resource system that is sufficiently large as to make it costly (but not impossible) to exclude potential beneficiaries from obtaining benefits from its use” (Ostrom, 1990). This kind of resource generally involves fishing grounds, groundwater or pastureland. A common pool resource has the characteristics of a common good: it is rivalrous and, in most cases, its provision typically makes it difficult to exclude other beneficiaries. As with a public good, this means that players may spontaneously be tempted to take advantage of it. However, unlike a public good, a CPR is rivalrous: its use by one actor can lead to the eviction of other actors. Moreover, issues of resource overuse can arise. The main contribution of the CPR concept is precisely the distinction it makes between the resource as stock and the resource as flow. Any resource system is formed by these two interdependent elements. The resource flow corresponds to the unit withdrawal from the resource stock and the stock is equivalent to the unextracted units of the resource. However, this conception of waste as a common pool resource implies inverting the internal system dynamics: – In the common pool resources described by E. Ostrom, the stock (e.g., young fish) is required to replenish the flow (e.g., mature fish). – In the case of waste, it is the contrary: “the flow (waste-resource) goes hand in hand with a stock (waste-refuse) that is potentially harmful and which, consequently, must not grow. However, no one wants to appropriate this stock” (Cavé, 2015). In other words, the danger does not lie in the depletion of the stock, but rather in its growth and its uncontrolled disposal. The risk generated by waste recovery actors when they extract the most lucrative part of the waste is that they create a financial imbalance for the municipal service and thus endanger the controlled landfill of final waste.
A service semi-decentralised through the assignment of usage rights
Derived from a combination of private and public law, usage rights – which give privileged access to a flow of resource units – seem appropriate for managing common pool resources. Unlike property rights, usage rights define “who might have what use of which quantity of the resource, in the form of which goods and services derived from it” (Varone et al., 2008, p.7). Usage right can emanate from public policies that assign these rights to beneficiaries who may not be the legal owners. Usage rights thus refer to resource unit withdrawal rules that do not grant absolute freedom in the use of the resource. Since part of the waste is inevitably intercepted by informal recovery actors given the service’s intermediate reloadings and the value of some of the materials involved, the assignment of usage rights could be a novel way to regulate the participatory, composite and circular waste management model. In fact, the difference between assigning property rights and usage rights is that the latter would make the appropriators accountable to a regulator for the traceability of the flow circulating at the metropolitan scale. As exclusion is impossible, it is pointless to ban the diversion of flows, but it is important to recognise and regulate them in order to ensure adequate management of the stock. In fact, rejects (solid, liquid or gaseous) from the recovery chains are currently dispersed in the environment without any control. “Treating the solid waste deposit as CPR points to a unifying principle: the proper disposal of refuse (the stock) in controlled landfills. The implementation of usage rights may allow this principle to be put into practice. Non-governmental solid waste interceptions could be accepted – and even stimulated – on condition that the refuse from every collection is strictly channelled towards adequate landfill facilities” (Cavé, 2015). The inclusion both of stock (for minimisation) and flows (for maximisation) within the analytical framework of CPR suggests the idea of a multi-stakeholder, semi-decentralised solid waste management system. In such a system, non-governmental recycling initiatives would not be crowded out to the benefit of a centralised monopolistic service focused on final landfill solutions. Informal recovery actors could be integrated as local agents able to efficiently capture the largest amount of recoverable waste possible at source. However, they would only be integrated on condition that they channel their own residual waste to centralised treatment facilities so that health and environmental externalities could be suitably managed. In this way, stock management would be centralised and flow management decentralised.
2. Implementing waste management as a common good
Following on from this analytical approach, we now look at how this logic could be operationalised.
Spatial and institutional dimension: shifting to a semi-decentralised model
Rolling out some kind of primary collection organised on a sub-municipal scale (neighbourhood) allows for early-stage reloading. This is an opportune moment for sorting and diverting waste to recovery options either in situ (composting) or close by (recycling channel). This reduces quite considerably the volume/tonnage of waste to be sent for landfilling at a centralised facility.
Technical dimension: another look at the segmentation of urban waste stocks
High-value waste is easily managed by the market (informal) without intervention from public actors. Hazardous waste, on the other hand, requires strictly controlled supervision to oblige
its generators to control its decontamination. The remaining waste constitutes an “underbelly”, meaning the largest quantity of waste that neither receives any specific attention nor creates fierce conflicts over its appropriation.
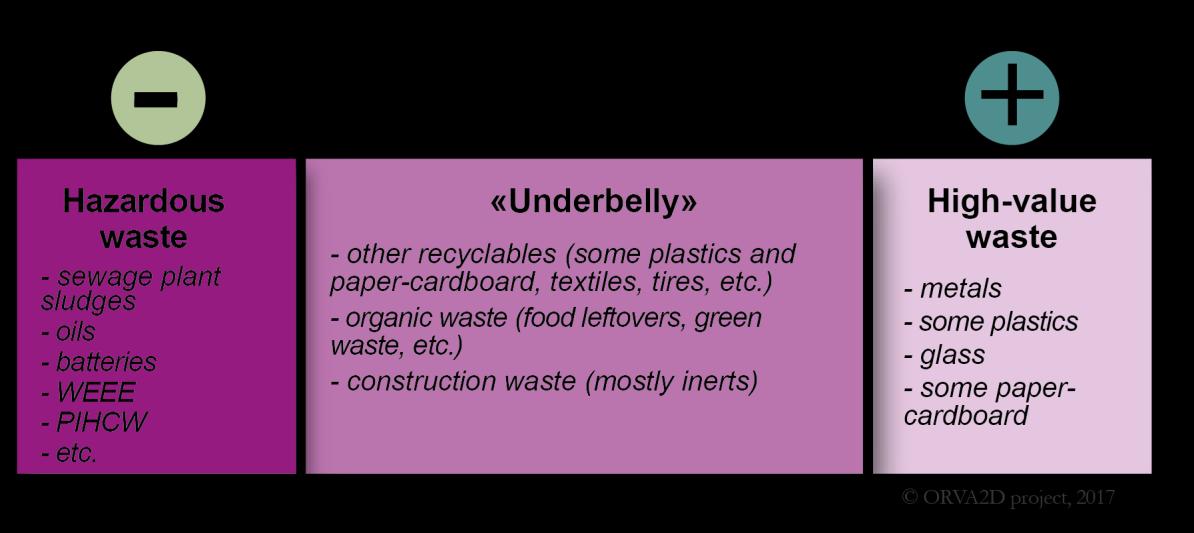
Figure 30. Economic value of different types of waste
This “underbelly” of waste corresponds to refuse that is technically recoverable, but only under certain conditions that are unfulfilled (its recovery cost exceeds its market value) as long as no specific mechanism (organisational, technical or financial) intervenes to facilitate its recovery. The waste in this “underbelly”, equivalent to residual household waste, mostly comprises: organic waste, representing from 52% to 79% of a city’s waste1 and offering the best opportunities for diversion, inert waste (from urban worksites or street cleaning), which cannot be incinerated and which, if landfilled, would greatly limit the useful life of landfill sites even though their (inert) character obviates the need for landfill. As things stand today, this waste forms a stock that no actor wants. The challenge is thus to convert it into flows: either by increasing the prices charged for landfilling this type of waste, or by encouraging recovery channels, centralised or not (composting, anaerobic digestion, use for road construction or embankments, etc.).
Economic dimension: usage rights and contractual models
How can the logic of usage rights be incorporated into contract-based models of a public service? Firstly, it would require ceasing to remunerate collection service providers on the basis of each tonne transported to a landfill facility so as not to discourage diversion to recovery chains.
1 Only Lomé has a lower share of organics, which should be viewed in light of the very high (and abnormal) presence of inert waste.
Next, for the public authorities, it means maintaining contractual control over the landfill facility so as to send a price signal to the whole sector by freely defining tipping fees. o In fact, if tipping fees are kept high, this will serve as an incentive to divert waste flows to recovery channels that, otherwise, do not seem financially lucrative. As Anne Scheinberg points out: “Municipal recycling is rare, or underperforms, because there is simply not enough of a price signal to stimulate the diversion of materials from disposal” (Scheinberg, 2015, p.984). Having the power to set tipping fees is a crucial lever for public authorities. o This kind of contractual arrangement also makes the rationale of avoided costs actionable. And, through a ripple effect, forms of incentive-based charging can be envisaged: waste sorted by residents earning them money-off vouchers on their waste collection taxes for the good reason that this practice reduces the tonnages to be landfilled. Acceptance of these logics means challenging the limits of the public service, accepting the outsourcing of certain tasks (primary collection, sorting/recycling) to other groups of population (communities or informals), as well as diversifying (with the risk of inequality) the methods of financing each stage.
3. Between low-tech and high-tech, creating a model adapted to global South cities
One of the challenges that emerged from our field observations lies in the divergence of the models implicitly promoted by waste management actors. Most global South elites consider that the only proper way to manage waste is to opt for sophisticated technologies to massively reduce nuisances and, ideally, obtain economic and environmental benefits from its valorisation. Yet the whole of this report shows that, on the contrary, even though such technologies can theoretically enable an appropriate treatment of waste, they are not suited to all contexts as they require specific technical expertise and a sound ability to pay. While some actors rely on high-tech to manage waste, others rely more on low-tech solutions (Bihouix, 2014). The latter concept is essentially based on the notions of social integration, proximity, sobriety and conviviality (Illich, 1973). Low technologies foreground alternative systems based on new principles: circular flows of water, energy and materials (recycling, circular economy), ecological performance (conservation of resources and environments) (Le Bris & Coutard, 2008), proximity and decentralisation. Some global South local authorities in charge of urban services, are testing new models that integrate these principles, spurring the emergence of a diversity of social (Bernal, 2014), organisational and technological innovations. To some extent, these techniques have the virtue of relocating a territorial metabolism1 that has been partly externalised by urban networks (Emelianoff, 2015; Barles, 2017), and thus mobilise a greater momentum for waste reduction. They do not replace large networks (centralised waste collection) but enable the emergence of composite systems (Le Bris & Coutard, 2008) and urban eco-cycles2 (Coutard & Rutherford, 2009). These autonomous systems constitute among other things a
1 In S. Barles’ work, territorial metabolism denotes all the flows of energy and materials brought into play by the functioning of a given territory. This metabolism is conceived as being produced by the interweaving of natural (or physical) processes, particularly including the natural cycles of water, carbon, nitrogen, etc., and techniques used by human societies. 2 Contrary to the model of a centralised network, the technical and ecological urban cycles depend on the principles of autonomy, porosity, circular metabolism, short cycles, demand management, resource preservation, and the principles of sobriety (Coutard & Rutherford, 2013)
technical response to the challenges of pluri-urbanity, establishing a “right to the city”1 that differs depending on the individual and social group. Low-tech systems thus seem particularly fitting for global South countries, in a context of raw materials depletion and the high availability of labour, even though there may be a cultural obstacle to promoting them. This debate is at the heart of the promotion of energy recovery. Must waste-to-energy technologies be developed in global South countries? Should waste be aggregated in large quantities for incineration, now a widely used technology in global North countries? Should anaerobic digestion of organic waste be developed when it can be easily composted? Should new types of sinks, such as refuse-derived fuel (RDF) or gasification, be promoted, without prioritising recycling, given that worldwide deployment of these technologies is in its infancy (with fragile technical and financial control)? Or, on the contrary, should global South countries rely on technologies deemed more rudimentary, yet deeply embedded in industrial globalisation, and develop them at a local level? These technologies range from waste composting, to remelting scrap metal locally, plastics-shredding or even the re-use (after washing) of packaging to avoid waste generation. It is important think through the solutions starting from the lowest rung of the hierarchy of treatment modes in order to divert as many flows as possible. The choice of which sink to use should not be made at the outset, as this will bias the structuring of the sector, which will then be organised simply to provide a stock of waste for the preferred sink. When choosing a treatment method, it is important to consider what market outlets exist for products from recovered materials (agriculture for compost / domestic market for both re-use and recycling). The choice may even be boosted by public policy measures: public procurement, subsidies for fertilisers/compost, feed-in tariffs for electricity from incinerators, etc.
1 The right to the city does not boil down to access to urban services: it was defined by the philosopher Henri
Lefebvre as a basic right, constitutive of democracy, which defines cities as common goods, accessible to all the inhabitants (Lefebvre, 1968).
General Conclusion
In a context where many global South cities are finding it very difficult to manage municipal solid waste (saturated disposal sites, impossibility of collecting all the waste generated, low recovery rates, etc.), the aim of the research programme whose findings are presented in this report was to analyse the cases of several cities that have implemented innovative solutions. These sometimes involve technical and technological innovations such as transfer points, primary collection, waste-to-energy plants, composting units, but that is not all. We also observed that the most important levers for waste recycling and recovery lay in organisational and financial innovations. On one hand, this means stimulating multi-scale and multi-stakeholder management so that the whole gamut of possible local treatment modes can be used. It also means imagining alternative financing when the residents’ have little ability to pay as , for instance, billing the waste service jointly with other public utilities, calling on corporate social responsibility, or implementing the logic of avoided costs. This last method seems to hold considerable potential. Other avenues remain to be explored as, for example, financing waste management through consumer goods purchases (Extended Producer Responsibility chains) or mobilising public procurement to stimulate the purchase of the byproducts of recovered resources. The comparison of different fields gave deeper insights into the advantages of shifting the scope of the public service’s responsibilities and of totally rethinking the service offered to the inhabitants (and the planet), so as to circumvent the traditional stumbling blocks that make it difficult for local public actors to finance their services and ensure their robustness. Primary collection, community-based management, and the use of informal actors all seem to be expanding in many cities, despite the still strong reticence of traditional waste management stakeholders. In every case, it appears that the invention of new endogenous models is the main pathway developed by local authorities seeking to solve their waste problem and transform it into social and environmental opportunities. The emerging models are “participatory, composite and circular” , each time with different characteristics depending on the territory and the society in which they operate. The global South cities have long been seen as lagging behind those in the global North when it comes to waste management. Yet, when viewed through the prism of certain criteria, it would appear that this binary relationship could is well worth reassessing. Low consumption leads to a low level of waste generation and, although relatively unclean streets are synonymous with locally negative impacts, this low production of waste also means a weaker environmental impact worldwide (in terms of raw materials extraction, GHG production, etc.). The potential of organic materials is also particularly strong in the global South countries, as these materials are easier to move around in a local circular economy seeking to promote a local territorial metabolism. All that remains to be done is to take some of these practices from the global South and transform them into solutions for the admittedly different problems in the global North.
Bibliography
ORVA2D project monographs
The present report is mainly based on 6 monographs, available online (in French) at: http://esolemans.cnrs.fr/fr/recherche/programmes-en-cours/projet-afd.html
CAVE J. (2016), Surabaya: La valorisation communautaire des déchets dans le cadre d’un service semi-décentralisé, AFD, ORVA2D research programme, Field report No.5, May, 80p. DE BERCEGOL R. (2016), Delhi: Des complémentarités à inventer, une gestion en pleine transformation, AFD, ORVA2D research programme, Field report No.4, June, 102p. GARNIER J. (2016), Valorisation des déchets à Lomé: La valorisation des déchets perçue comme un moyen de réduction des coûts du service public, AFD, ORVA2D research programme, Field report No.6, September, 113p. LECOINTRE C., R. BRESELEC, and A. PIERRAT (2015), Valorisation des déchets fermentescibles à Antananarivo: Solution et innovation pour une gestion déficiente des déchets ? Réflexion sur une capitale pauvre d’Afrique, AFD, ORVA2D research programme, Field report No.2, October, 94p. RATEAU M. (2015), Intégration des récupérateurs à Lima: Étude de trois modèles liméniens de structuration des filières de valorisation des déchets, AFD, ORVA2D research programme, Field report No.1, August, 96p. RATEAU M. and H. ESTRELLA BURGOS (2016), Valorisation des déchets à Bogotá: L’intégration des récupérateurs pour faire face à la saturation du centre d’enfouissement, AFD, ORVA2D research programme, Field report No.3, April, 69p.
Other bibliographical references
ADEME (2016), Déchets, chiffres-clés édition 2016, Angers: ADEME, 96p.
ADEME (2015a), Le compostage, fiche technique, Angers: ADEME, 20p.
ADEME (2015b), Référentiel national des coûts du service public de gestion des déchets 2015, Synthèse, Angers: ADEME, 8p.
ANNEZ P. C. (2006) ,Urban Infrastructure Finance from Private Operators: What Have We
Learned from Recent Past Experiences?, World Bank, Washington, D.C., 30p.
BARLES S. (2017), « Écologie territoriale et métabolisme urbain: quelques enjeux de la transition socioécologique », Revue d’Économie Régionale & Urbaine, December, pp. 819836. DOI: 10.3917/reru.175.0819.
BARRAQUÉ B. (1995), « Les politiques de l’eau en Europe », Revue française de science politique, No. 45-3, pp.420-453.
BARTONE C. R. (1995), The Role of the Private Sector in Municipal Solid Waste Service
Delivery in Developing Countries: Keys to Success, in ISWA Conference on Waste
Management - Role of the private sector. Singapore, p.6.
BARTONE C., R. LEITE, T. TRICHE, and R. SCHERTENLEIB (1991), “Private Sector
Participation in Municipal Solid Waste Service: Experiences in Latin America” , Waste
Management & Research, 9(1), pp.495-509.
BATLEY R. (1996), “Public-Private Relationships and Performance in Service Provision”,
Urban Studies, 33(4), pp. 723-752
BAUD I. and J. POST (2004), “Government, market and community in urban solid waste management; problems and potentials in the transition to sustainable development”, in BAUD I., J. POST and C. FUREDY (eds) Solid Waste Management and Recycling: Actors, Partnerships and Policies in Hyderabad, India and Nairobi, Kenya. Dordrecht: Kluwer Academic Publishers, pp. 259-281. BAUD I., S. GRAFAKOS, M. HORDJIK and J. POST (2001) ,“Quality of life and alliances in Solid Waste Management: Contributions to urban sustainable development”. Cities, 18(1), pp.3-12. BERDIER C. and J.-M. DELEUIL (2010), « Le système "ville-déchet", une mise en perspective historique » , in DORIER-APPRILL E., Ville et environnement, Paris: Sedes, pp 453-466. BERNAL M.E. (2014), Experiencias en innovación social, CEPAL, Fundación Kellogg, Su aporte en el avance de los Objetivos de desarrollo del milenio, Mimeo. BERNSTEIN J. (2004), Toolkit: Social Assessment and Public Participation in Municipal Solid Waste Management, No. 33781, The World Bank, Urban Environment Thematic Group, 210 p. BERTOLINI G. (1992), « Les déchets : rebuts ou ressources ? » Economie et statistique, 258(1), pp.129-134. BERTOLINI G. (1990), Le Marché des Ordures, économie et gestion des déchets ménagers, L’Harmattan, Paris. BERTOLINI G. and M. BRAKEZ (2008), « Gestion des déchets, innovations et territoires. Retours d’expériences et recherche contextuelle ». In Développement durable des territoires. Economie sociale, environnement et innovations. Marché et Organisations. Paris: L’Harmattan, pp.151-182. BERTOLINI, G. and M. BRAKEZ (1997), « Le déchet, indicateur social : le cas des ordures ménagères à Agadir (Maroc) », Géographie et cultures, (24), pp. 91-112. BERTOLINI G., B. FOULLY and B. MORVAN (1999), « Le tri des ordures ménagères dans les pays en développement : Etude de cas au Brazil » , in Sciences et Techniques, (14), pp.30-38. BIHOUIX P. (2014), L’âge des low-tech: vers une civilisation techniquement soutenable, Édition du Seuil, 330p. BINDIAR D. and S. TREMOLET (2010), La régulation des services d’eau et d’assainissement dans les PED, A Savoir, Paris: AFD. BODJONA M. B., K. A. KILI, S. TCHEGUENI, B. KENNOU, G. TCHANGBEDJI and M. EL MERAY (2012), Evaluation de la quantité des métaux lourds dans la décharge d’Agoè (Lomé-Togo). BOUTIN, J-P. (1991), « L'épidémie de choléra au Peru en 1991 », Bulletin Epidémiologique Hebdomadaire, No. 49, 9 December, pp.214-215. BREUIL L. (2004), « Renouveler le partenariat public-privé pour les services d’eau dans les pays en développement: Comment conjuguer les dimensions contractuelles, institutionnelles et participatives de la gouvernance ? », Ph.D. thesis in management, Nanterre: Paris X. C40 (2016), Waste to Resources, Good Practice Guide, C40 Cities Climate Leadership Group, February, London, 23p. CAMACHO M. (1986), Les poubelles de la survie : la décharge municipale de Tananarive, Paris: L’Harmattan.
CAVE J. (2018), “La gestion des déchets au prisme de son impact climatique » in Curvello Saavedra Avzaradel, P. and Parola G., Climate change, environmental treaties and human rights, Rio de Janeiro: Ágora21. CAVE J. (2015), “Who owns municipal solid waste? Appropriation conflicts in emerging countries”, Global Waste Management Outlook, UNEP & ISWA, p. 217. CAVE J. (2015), La ruée vers l’ordure, Presses Universitaires de Rennes, 250p. CAVE J. (2013), La gestion disputée d’un mal public impur: économie politique des ordures, Ph.D. thesis, Aménagement de l’Espace et Urbanisme, supervised by O. Coutard, Université Paris-Est. CEPLAN (Centro Nacional de Planeamiento Estratégico) (2016), Economía informal en Péru: situación actual y perspectivas, Lima: CEPLAN, 53p. CHALMIN P., and C. GAILLOCHET (2009), Du Rare à l’Infini, Panorama mondial des déchets, Economica, Paris. CHEN M. A. (2007), Rethinking the Informal Economy: Linkages with the Formal Economy and the Formal Regulatory Environment, DESA Working Paper No. 46, UN Dpt of Economic & Social Affairs, New York, 12 p. CHINTAN (2009), Cooling Agents: An Analysis of Greenhouse Gas Mitigation by the Informal Recycling Sector in India, The Advocacy Project, New Delhi, 51 p. CHINTAN and WITNESS (2010), Counterbalance, Chintan Environmental Research and Action Group. Available at: www.archive.org/details/witness_5640_E007059. CHIU A. S. F. (2010), The 3Rs and Poverty Reduction in Developing Countries: Lessons from Implementation of Ecological Solid Waste Management in the Philippines, Institute for Global Environmental Strategies, Asia Resource Circulation Policy Research, Working Paper Series, October. CIRELLI C. and B. FLORIN (2016), « Les récupérateurs de déchets: entre marginalisation et reconnaissance » in Mouvements des idées et des luttes (ISSN: 1291-6412), 2016, Où va l’homo detritus ? CIRELLI C. and B. FLORIN (2015), Sociétés urbaines et déchets: éclairages internationaux, Tours, PUFR, 452p. COAD A. (2011), Collection of Municipal Solid Waste: Key issues for Decision-makers in Developing Countries, United Nations Human Settlements Programme (UN-Habitat), Nairobi, 30 p. COFFEY M., and A. COAD (2010), Collection of Municipal Solid Waste in Developing Countries, United Nations Human Settlements Programme (UN-Habitat), Malta, 198 p. COING, H. and I. MONTAÑO (1985), Villes et Déchets dans le Tiers-Monde : Technique et Société - Tunis et Caracas, la gestion du service, Noisy-le-Grand: ENPC. COINTREAU-LEVINE S. (1994), Private sector participation in Municipal Solid Waste Services in Developing Countries, Washington, D.C.: Urban Management Programme (The World Bank). COINTREAU-LEVINE S. (1982), Environmental Management of Urban Solid Wastes in Developing Countries: A Project Guide, No. 5, World Bank, Washington, D.C., 214 p. CORVELLEC H., M.-J. ZAPATA CAMPOS and P. ZAPATA (2013), “Infrastructures, lock-in and sustainable urban development: the case of waste incineration in the Göteborg Metropolitan Area” , Journal of Cleaner Production, vol. 50, no.1, pp.32-39.
COUTARD O. and J. RUTHERFORD (2009), « Les réseaux transformés par leurs marges: développement et ambivalence des techniques "décentralisées" », Flux, 2009/2, n°76-77, p. 6-13. COUTARD O. and J. RUTHERFORD (2013), « Vers l’essor de villes post-réseau: infrastructures, innovation sociotechnique et transition urbaine en Europe » in FOREST J. and A. HAMDOUCH (eds) Quand l’innovation fait la ville durable, Presses Polytechniques Universitaires Romandes, pp.97-118. COUTINHO E. (1993), Boca de Lixo. Documentaire, Centro de Criação de Imagem Popular (CECIP). DARDOT P. and C. LAVAL (2014), Commun, Essai sur la révolution au XXIème siècle, Paris: La Découverte, 600p. DE BERCEGOL R. (2012), The emergence of municipalities. An analysis of the redistribution of power caused by the decentralization of small town governance in Uttar Pradesh, Ph.D. thesis, Paris: Université Paris-Est Marne-La-Vallée DEBOULET A. et al. (2016) Repenser les quartiers précaires, Etudes, AFD, Paris, 273p. DEBOUT L., and B. FLORIN (2011), « Chiffonniers contre entreprises privées internationales? Résistances, adaptations et négociations des acteurs formels et informels face à la réforme de la gestion des déchets au Cairo », Egypte Monde Arabe, 7, pp. 31-59. DURAND M. (2015), Residuos y desagües: una geografía limeña, Lima, IFEA, IRD, 349. DURAND M. (2012), La gestion des déchets dans les pays en développement: comment tirer profit des difficultés actuelles ?, Revue Flux n°87 « Mutation des services urbains: processus et enjeux », pp.18-28. DURAND M. (2010), Gestion des déchets et inégalités environnementales et écologiques à Lima : entre durabilité et vulnérabilité. Ph.D. thesis, Géographie et Aménagement de l’espace. Rennes: Université de Rennes 2. DURAND M. (2007), Les zones humides urbaines à Bogota, conflits d’usage et patrimonialisation, Géographie et culture nº62, Paris: l’Harmattan, pp.43-60. DURAND M., S. BECAT and M. RATEAU (2015), “La integración de los recicladores como modelo de gestión compartida de los residuos en Lima” , in BANDEIRA AMARO A., VERDUM R., Política nacional de residuos sólidos e suas interfaces com o espaço geográfico: entre conquistas e desafíos, Porto Alegre: UFRGS. DURAND M., J. CAVÉ and A. PIERRAT (2019), « Quand le low-tech fait ses preuves: la gestion des déchets dans les pays du Sud », In La ville (s)low tech, Revue Urbanités nº12, forthcoming. DURAND M., Y. DJELLOULI and C. NAOARINE (2015,) Innovations sociales et territoriales de gestion des déchets, Rennes, PUR, 302p. EMELIANOFF C. (2015), « La ville durable, une notion fossile ? », in THEYS, J., Un demisiècle d’environnement entre science politique et prospective, pp.137-144 EMELIANOFF C. (2006), « Connaître ou reconnaître les inégalités environnementales ? » ESO, Travaux et Documents, n° 25, December., pp. 35-43. ENDA (2014), Etat des lieux du secteur informel des déchets en Afrique et dans les Caraïbes: Pour une gestion inclusive et sociale, Plateforme Re-Sources, Gevalor, June. FAHMI W. and K. SUTTON (2010), “Cairo’s contested garbage: sustainable solid waste management and the Zabbaleens right to the city”. Sustainability, (2), pp.1765-1783. FLORIN B. (2012), « Dimensions spatiales d’une crise: les stratégies des zabbalîn (chiffonniers) du Cairoface à la réforme du système de gestion des déchets », eds BONNY
Y., S. OLLITRAULT, R. KEERLE and Y. LE CARO, Espaces de vie, espaces enjeux. Entre investissements ordinaires et mobilisations politiques, Presses Universitaires de Rennes. FLORIN B. (2010a), « Réforme de la gestion des déchets et reconfigurations des territoires professionnels des chiffonniers du Cairo», Géocarrefour, 2(85), pp.109-118. FLORIN B. (2010b), « La gestion des déchets au Cairo», Séminaire Served ‘Services urbains et Services publics’, May 17. FOLLEA V., F. BRUNET, N. BENRABIA, M.-P. BOURZAI and P. FAUCOMPRE (2001), Revue comparative des modes de gestion des déchets urbains adoptés dans différents pays de la ZSP, Paris: Agence Française de Développement (AFD). FORSYTH T. (2005), “”Building deliberative public–private partnerships for waste management in Asia” , Geoforum, 36(4), pp.429-439. FOULLY B. (2012), Reconstruire le projet Compostage à Agadir, après l’abandon de la décharge, ADEME, Paris, 8 p. FOULLY B. (2009), Les enjeux et opportunités partenariales de la valorisation des déchets dans les pays en développement, Presentation at the ONUDI / POLLUTEC workshop, 1 December, Parc des expositions de Villepinte. FUREDY C. (1995), “One world of waste: should countries like India solve solid waste problems through source separation?”, in Enriched by South Asia: celebrating 25 years of scholarship. Montreal: Canadian Asian Studies Association, pp. 87-107. FUREDY C. (1992), “Garbage: exploring non-conventional options in Asian cities” , Environment and Urbanization, 4(2), pp.42-61. FURTADO J. (1989), L’île aux fleurs (A ilha das flores), documentary. GERDES P. and E. GUNSILIUS (2010), The waste experts: enabling conditions for informal sector integration in solid waste management: lessons learned from Brazil, Egypt and India, GTZ (German Technical Cooperation), Eschborn, Germany. GEVALOR (2012), Identification des opportunités de recyclage et évaluation rapide du secteur de la gestion des déchets solides à Antananarivo (Madagascar), partnered with UN-Habitat, May, 147p. GEVALOR (2013), Faisabilité du potentiel de valorisation et de réduction des déchets dans la ville de Toamasina (Madagascar), with contributions from Enda OI et de Pascal Bouer, March, 90p. GIRAUD, P.-N., J. RUET, B. LEFEVRE and A. MARIA (2006), « Le financement des services essentiels dans les villes pauvres », Revue d’économie financière, (85), pp.285308. GIZ (2013), Operator Models. Respecting Diversity - Concepts for Sustainable Waste Management, 192p. GIZ (2011), Recovering resources, creating opportunities: Integrating the informal sector into solid waste management GOUHIER J. (2000), Au-delà du déchet, le territoire de qualité, Manuel de rudologie, Rouen: PURH, 240p GUPTA, S. K. (2012), « Intégrer le secteur informel pour une meilleure gestion des déchets », in Secteur Privé & Développement, n°15, Proparco, AFD, pp.12-15. GUTBERLET J. (2013), “Social facets of solid waste: insights from the global south”, Waste and Resource Management, vol. 166, issue WR3, pp.110-113. HARPET, C. (2001), Vivre sur la décharge d’Antananarivo. Regards anthropologiques, Paris: L’Harmattan.
HAYAMI, Y., A. K.DIKSHIT and S. N. MISHRA (2006), “Waste pickers and collectors in Delhi: poverty and environment in an urban informal sector”, The Journal of Development Studies, 42(1), 41-69. HERMIDA H. (2014), Plazas de mercado en Bogotá, generadoras de residuos y desarrollo, Bogotá: CONAMA, Universidad Central de Colombia, 15p. HESTIN M., V. MONIER, J. CAVÉ, I. LAUREYSENS, E. WATKINS, H. REISINGER and L. PORSCH (2014), Development of Guidance on Extended Producer Responsibility (EPR), European Commission - DG Environment, 226p. ILLICH I. (1973), La convivialité, Paris, Seuil. JAGLIN S., L. DEBOUT and I. SALENSON (2018), Du rebut à la ressource: valorisation des déchets dans les villes du Sud, AFD, Paris, 296p. KAZA S., YAO L., BHADA-TATA, P. and VAN WOERDEN F. (2018), What a Waste 2: A Global Snapshot of Solid Waste Management to 2050 Urban Development Series. Washington, DC: World Bank. KLUNDERT (van de) A., and J. ANSCHÜTZ (2001), Integrated Sustainable Waste Management – the Concept - Tools for Decision-makers, Experiences from the Urban Waste Expertise Programme (1995-2001) Gouda, The Netherlands: WASTE. 44p. LEFEBVRE H. (1968), Le Droit à la ville, 3rd edition (15 April 2009), Paris: Economica. LE BOZEC A. (2008), Mise en place de la redevance incitative du service public d’élimination des déchets, Versailles: éditions QUAE, 151p. LE BOZEC A., S. BARLES, N. BUCLET and G. KECK (2012), Que faire des déchets ménagers ?, Versailles: éditions QUAE, 231p. LE BRIS C. and O. COUTARD (2008), « Les réseaux rattrapés par l'environnement ? Développement durable et transformations de l'organisation des services urbains », Flux 2008/4, n°74, p.6-8. LORRAIN, D. (1995), Gestions Urbaines de l’Eau. Economica. LUDINGTON G., G. MORIZOT, B. FLIPO and J. DELARUE (2013), Emission reductions of greenhouse gas emissions and domestic waste composting in less advanced countries. Why new assessment tools are requested ?, Lyon: Gévalor, 5p. LUNUEA A. (2012), Le rejet de l’inciération des ordures ménagères: entre controverses sanitaires et conflits politiques, Environnement, risques et santé nº11(5), pp.397-404. MAEDA T. (2010), Enhancing public awareness and stakeholders’ empowerment and involvement in waste management – Through a case in Surabaya, Indonesia, Kitakyushu Initiative for a Clean Environment, Institute for Global Environmental Strategies (IGES), March. MARIN Ph. (2009), Partenariats public-privé pour les services d’eau urbains Bilan des expériences dans les pays en développement, Tendances et Orientations n°8, World Bank/ Public-Private Infrastructure Advisory Facility, Washington DC. MEDINA M. (2005a), “Serving the unserved: informal refuse collection in Mexico”. Waste Management and Research, 23(5), pp.390-397. MEDINA M. (2005b), “Waste Picker Cooperatives in Developing Countries”, WIEGO/Cornell/SEWA Conference on Membership-Based Organizations of the Poor. Ahmedabad, India, p.22. MIRAS (de) C. and E. DORIER-APPRILL (2002), Gestion des déchets urbains et aide à la décision municipale : Municipalité de Mopti (Mali) et Circonscription Urbaine de Porto Novo (Bénin), PDM; Ps-Eau.
NAS P.J.M. and R. JAFFE (2004), “Informal Waste Management: Shifting the focus from problem to potential”, Environment, Development and Sustainability, (6), pp.337-353. NELSON J. (1977), Cabuçu - O lixo nosso de cada dia. Documentary. NGAMBI J.R. (2015), « Déchets solides ménagers de la ville de Yaoundé (Cameroun) : de la gestion linéaire vers une économie circulaire » , Ph.D. thesis, Nantes. NGOC U.N. and H. SCHNITZER (2009), “Sustainable solutions for solid waste management in Southeast Asian countries” , Waste Management, 29(6): 1982-1985. O’BRIEN M. (1999), “Rubbish values: Reflections on the political economy of waste” , Science as Culture, 8(3), pp.269-295 . OECD (2008), OECD Environmental Outlook to 2030, Paris: OECD, 520p. OSTROM E. (1990), Governing the Commons: The Evolution of Institutions for Collective Action, Cambridge University Press, Cambridge, 280p. PIERRAT A. (2014), Les lieux de l’ordure de Dakar et d’Addis Abeba. Territoires urbains et valorisation non institutionnelle des déchets dans deux capitales africaines, Ph.D. thesis in Geography, Université Paris 1 Panthéon-Sorbonne, 559 p. PIERRAT A. (2006), La gestion des déchets à Tananarive. Etude de la valorisation des déchets en produits fertilisants. Geographical approach, Master’s 1 de l’Université Paris 1 Panthéon Sorbonne, 193p. PRADO, M. (2004), Estamira, Documentaire, Zazen Produções. RAHARINJANAHARY R. (2015), Processus d’intégration de la filière des déchets à Antananarivo: des activités informelles à un système formel ?, in DURAND M., Y. DJELLOULI and C. NAOARINE, « Gestion des déchets: innovations sociales et territoriales », Rennes: PUR, pp.53-72. RATEAU M. (2014), La formalisation des recycleurs au Peru: expériences dans les districts liméniens d’Indiapendencia et San Martín de Porres, Master’s thesis, Le Mans: Université du Maine, 285p. RIBEIRO H., and G. R. BESEN (2007), « Panorama da Coleta Seletiva no Brasil: Desafios eperspectivas a partir de três estudos de caso », Revista de Gestão Integrada em Saude do Trabalhoe Meio-Ambiente, pp.2-18. ROCHER L. (2008), « Les contradictions de la gestion intégrée des déchets urbains: l’incinération entre valorisation énergétique et refus social » in FLUX, n°74, vol. 4, pp.2229. SCHEINBERG, A. and J. ANSCHÜTZ (2006), “Slim pickin’s: Supporting wastepickers in the ecological modernization of urban waste management systems”, International Journal of Technology Management and Sustainable Development, 5(3), pp.257–270. SCHEINBERG, A., J. ANSCHÜTZ and A. KLUNDERT (van de) (2006), « Waste Pickers: Poor victims or waste management professionals? » In Solid waste, health and the Millennium Development Goals (p. 16). Presented at CWG – WASH Workshop, Kolkata, India. SCHEINBERG, A., M. H. SIMPSON, Y. GUPT, et al. (2010), Economic Aspects of the Informal Sector in Solid Waste, GTZ (German Technical Cooperation), Eschborn, Germany. SCHEINBERG A., S. SPIES, M.H. SIMPSON, and A.P.J. MOL (2011), “Assessing urban recycling in low- and middle-income countries: Building on modernized mixtures” , Habitat International, 35(2), pp.188-198.
SHARHOLY M., K. AHMAD, K., MAHMOOD, G., and TRIVEDI, R. C. (2008), “Municipal solid waste management in Indian cities – A review” , Waste Management, 28(2), pp.459467. SHEKDAR, A. V. (2009), “Sustainable solid waste management: An integrated approach for Asian countries” Waste Management, 29(4), pp.1438-1448. SIDIBE C. (2015), Le Zero waste made in New Zealand, du concept à la pratique, in DURAND M., Y. DJELLOULI and C. NAOARINE, « Gestion des déchets: innovations sociales et territoriales », Rennes: PUR, pp.271-290. SPAARGAREN G., P. OOSTERVEER, J. BUUREN (van) and A.P. MOL (2005), Mixed Modernities: towards viable environmental infrastructure development in East Africa, The Netherlands: Environmental Policy Department, Wageningen University and Research Centre. TA T.T. (1998), Pour une gestion efficiente des déchets dans les villes africaines : les mutations à conduire, Cotonou: Partenariat pour le Développement Municipal. UAESP (2015), Plan de gestion integral de residuos solidos 2016 – 2027 « Bogotá se orienta hacia el aprovechamiento total de sus residuos », Bogotá: UAESP, 1228 p. UNEP (2013), Municipal solid waste: Is it garbage or gold?, UNEP Global Environmental Alert Service. UNEP and ISWA (2015), Global Waste Management Outlook, United Nations Environment Programme & International Solid Waste Association, Osaka, 332p. UN-Habitat (2010) Solid Waste Management in the World’s Cities, London: United Nations Human Settlements Programme. VARONE F., S. NAHRATH and J.-D. GERBER (2008), « Régimes institutionnels de ressources et théorie de la régulation » in Revue de la Régulation, n°2, 26p. VÉRON J. (2007), « La moitié de la population mondiale vit en ville », Population et Société, nº435, Paris: INED, 4p. VNGI (2008), Closing the Circle: Bringing Integrated Sustainable Waste Management Home, July, The Hague, The Netherlands. WALKER L. (2009), Waste Land. Documentary, Eurozoom. WIEGO (2010), Reclaiming reusable and recyclable materials in Africa. A critical review of English Language Literature, Working Paper (Urban Policies) No.16, March. WILLERVAL S. (2014), Note sur les mécanismes financiers de la gestion des déchets, Etude de faisabilité de l’option valorisation RDF sur le SL d’Aképé, Lomé: Egis Structure et Environnement, 5p. WILSON D.C., C. VELIS and C. CHEESEMAN (2006), “Role of informal sector recycling in waste management in developing countries” , Habitat International, 30(4), pp.797-808. WILTS H. and N. VON GRIES (2015), “Europe’s waste incineration capacities in a circular economy”, in Waste and Resource Management, vol. 168, issue WR4, pp.166-176. WSP (2008), Secured Landfills: The Bucket at the End of the Solid Waste Management Chain, The World Bank, Water and Sanitation Program South Asia, New Delhi, 6p. WORLD BANK (2012), What a Waste! A Global Review of Solid Waste Management, Knowledge Papers No. 15, Washington, D.C.: The World Bank. WORLD BANK (2008), Secured Landfills: The Bucket at the End of the Solid Waste Management Chain, New Delhi: Water and Sanitation Program-South Asia. ZURBRÜGG, C. (2002), “Urban Solid Waste Management in Low-Income Countries of Asia; How to Cope with the Garbage Crisis”, Urban Solid Waste Management Review Session. Scientific Committee on Problems of the Environment (SCOPE). Durban, South Africa, p. 13.
Appendices
Appendix 1: Summary of the ORVA2D observations for each city
Innovation / objective
Recycle waste Legally integrate informal wastepickers
Modalities
Recycler’s Law and ministerial subsidies Register of informal wastepickers Decentralised roll-out by district Territorialised organisation into collection zones
Advantages
Improves recycling rate Improves work conditions for wastepickers Stabilises jobs Waste pickers raise residents’ awareness of sorting Reduces taxes for residents who sort (Bono Verde) Low municipal expenditure on low-tech Avoided collection and landfill costs via recyclable waste recovery
Potential
26% of recoverable waste in Lima (currently less than 1% of waste is officially recovered) – excluding here volumes recovered by informals
Difficulties
Convincing informals to join Structuring the whole purchasing chain Organising economic profitability for all materials
Innovation sheet 2. Bogotá: financing informal workers to avoid costs
Innovation / objective
Recycle waste Legally integrate informal wastepickers Avoid congesting the landfill space
Modalities
Court ruling in favour of organised wastepickers Registration of 14,000 wastepickers Freedom for wastepickers to collect in all neighbourhoods Municipal tonnage-based remuneration of wastepickers “Zero waste” policy
Potential
25% of recoverable waste in Bogotá (currently 12%) A cost for the municipality 2/3 lower than that for RHW collection
Advantages
Improves the recycling rate Improves wastepickers’ work conditions Improves wages Waste pickers sensitise residents to sorting Large-scale participation of wastepickers Taxes based on social strata Payments coupled with water service
Difficulties
Structuring the whole purchasing chain Controlling financing for wastepickers more effectively Organising wastepickers into service companies
Innovation sheet 3. Lomé: two-stage collection tailored to the territory
Innovation / objective
Collect waste Organise primary collection
Modalities
Municipality’s organisation of primary collection via contracting micro-enterprises Door-to-door collection in some districts, “two-stage” collection in others (primary collection + transport) Creation of transfer points
Advantages
Improves pre-existing practice of primary collection (work conditions, hygiene) Organisation of sustainable financing for the activity Avoids wild dumpsites Organisation personalised and adapted to different neighbourhoods Possibility of recycling during (informal) primary collection
Potential
64% of waste collected thanks to primary collection Cost 54% lower than door-to-door collection
Difficulties
Adapting transfer points (dysfunctions): high level of sand collected Double billing for users: collection + primary collection or THRC (tax)+ FHRC (fee) Persistence of the informal channel
Innovation sheet 4: Lomé: advantages and drawbacks of the sanitary landfill
Innovation / objective
Increase the useful life of the future sanitary landfill Divert waste flows to organic and materials recovery
Modalities
Discussions on how to increase the capacity of the composting unit - project Discussions on how to transform transfer points into sorting centres - project Highlight the avoided costs for municipal financing
Potential
24% of potentially recyclable waste and 25% of compostable waste in Lomé (currently 1%) + sand An estimated economic gain of 4% of the waste budget through avoided costs
Advantages
Improves the recycling rate Increases the useful life of the sanitary landfill Improves environmental and health conditions of recovery activities Valorises organic waste An adapted territorial coverage with transfer points
Difficulties
Organising the economic sustainability of the organics channel Municipality’s financial contribution For the associations involved, pursuing primary collection and recycling
Innovation sheet 5. Antananarivo: composting on several scales
Innovation / objective
Increase the useful life of the future sanitary landfill Divert waste flows towards organic recovery
Modalities
Decentralised composting thanks to neighbourhood organisations (RF2s) Potential to free up landfill space (screened dump waste) Potential to directly compost raw waste on site
Potential
79% of potentially compostable waste in Antananarivo Cost-sharing among several non-municipal actors (notably, the fokontany)
Advantages
Increases the useful life of the disposal site by 5 years Improves the composting rate Creates jobs Takes advantage of primary collection by RF2s by associating them with decentralised composting The long-standing practice of using dumpsite terreau
Difficulties
Compost is not competitive on the input market Lack of space at the disposal site Very few municipal resources to incentivise the RF2s Insufficient recognition of indirect costs by the municipality
Innovation / objective
Manage the enormous waste flows Stop the construction of landfills, and valorise waste Valorise waste
Advantages
Avoids landfill in a city that has run out of space for this purpose Produces energy from waste Produces compost from waste
Modalities
Construction of 3 incinerators (2 of which opened in 2017) Construction of a composting unit
Potential
69% of potentially compostable waste (currently 3%) 30% of waste with high LCV (paper, cardboard, plastics, etc.), thus easy to incinerate (currently 11%) – 100% provided waste is dried upstream
Difficulties
Incinerating waste that has excessive moisture content No energy recovery Economic sustainability of a very costly technology Selling compost at an affordable price Competition with informals for the most combustible waste stocks
Innovation sheet 7. Surabaya: community management to avoid centralising waste stocks
Innovation / objective
Have a cleaner and greener city Improve waste valorisation Optimise the useful life of the storage centre
Modalities
Cleanliness contest between neighbourhoods Very active management of urban services by the kampung’s administration body Creation of hundreds of community waste banks for sorting, with a view to recycling Distribution of 20,000 domestic composters to residents Creation by the municipality of 23 composting units citywide
Advantages
Improves urban cleanliness and city greening (using the compost) Promotes an income-generating activity in the neighbourhoods and social inclusion in the kampung Improves the waste recovery rates Voluntary community-based management Contributions from private sponsors (large companies, CSR) Use of profits from sorting decided on collectively (Small) decrease in the quantity of waste sent to landfill
Difficulties
Dependence on private companies to finance the annual contest
Potential
36% of potentially recyclable waste (currently 0.2% recycled) et 54% compostable (currently 5% composted) An economic gain from avoided costs (currently 3% of the budget for 5% of composted waste) Relative loss of momentum in social mobilisation (mainly for composting) Downstream part of the recycling channel remains unchanged / Difficulty for the “parent” waste bank to replace informal local traders Not easy to encourage participation outside the kampung (notably in vertical housing and affluent neighbourhoods)
Appendix 2: Glossary
Other frequently used terms are indicated in italics. The terms in bold have been used in this report to harmonise the vocabulary and facilitate understanding.
Anaerobic digester (biodigester, biogas reactor) – Facility for the anaerobic treatment (digestion) of organic waste and the production of biogas and digestate. Anaerobic digestion (bio-methanation) – Anaerobic digestion is a reaction that occurs spontaneously in nature in places having a large concentration of organic matter with no air supply. At the industrial level, the process is developed mainly in biogas plants for waste (agricultural waste, kitchen waste, garden waste), producing two main products: methane and solid residues from decomposition (digestates). Biogas – Gas produced by the anaerobic digestion of organic matter. Biogas is mainly composed of methane (50–60%). Brick (pellet) – Alternative fuel produced from non-carbonised waste. The types of waste used are usually paper, cardboard or green waste. Bulky waste – Voluminous waste from households, such as furniture large household appliances (white, brown and grey goods), scrap metal (two-wheelers, fencing, etc.). Carbon credit – Tradable permit aimed at reducing greenhouse gas emissions. Carbon finance – Financial activity introduced by the Kyoto Protocol, which involves monetising greenhouse gas reductions expressed as CO2 equivalent units. In the waste sector, these emissions may be due to the storage of waste in an anaerobic environment, e.g. in dumpsites. Channel (chain) – an ensemble of successive steps involved in making a product that is linked by a flow of exchanges and which includes all of the enterprises and other actors that contribute to the elaboration of a product or to the valorisation of a raw material from upstream to downstream. Characterisation – Technique used to determine the composition of a territory’s stock of waste or waste stream according to its constituents and the corresponding contents and sizegrading. Clean Development Mechanism (CDM) - An international institutional mechanism that allows industrialized countries that have targets under the Kyoto Protocol to invest in emission reductions in developing countries and count those reductions towards their own legal commitments. A CDM project is issued with certified emission reductions, which may then be traded. Collection – One of the stages in the waste disposal chain. Collection is the transport of waste from the drop-off points (door-to-door, voluntary drop-off or small transfer points) to transfer stations or waste management sinks. The collection is generally ensured by trucks, mainly container trucks and compactor trucks. Compactor truck – Vehicle equipped with a hydraulically powered compression system that reduces the volume of waste transported.
Composition - Quantitative description of the materials that are found within a particular waste stream in the form of a list of materials and their absolute quantities per day or per year, or as a percentage of total materials. Compost – Compost is an organic amendment produced by composting (cf. definition) or, in other words, a product rich in stabilised organic material that mainly acts on soil structure (role of physical fertiliser). Like all amendments, compost contains small quantities of nitrogen (N), phosphorous (P) and potassium (K). As it mineralises over time, compost also has a secondary function of organic fertiliser (role of chemical fertiliser with the addition of N-P-K and trace elements for plants). Compostable waste (Bio-waste, green waste, organic waste) – Waste composed exclusively of biodegradable organic materials. It is usually treated through composting or methanation. This includes green wastes, kitchen and garden wastes, paper and cardboard Composter (composting bin) – Equipment used for composting family (domestic) waste. Composting (Organic waste management, aerobic decomposition) – A biological process that decomposes organic materials in the presence of oxygen, producing compost that can be used in agriculture. Composting can be carried out on a “raw” (mixed) waste stream or a stream of segregated organic waste. Composting plant – A medium-sized industrial or artisanal site where organic waste is converted to compost. Construction and demolition waste (Debris, C&D, rubble, contractor waste) – Waste generated by the construction, demolition or repair of houses, commercial buildings, roads, bridges, etc. Container – Storage equipment for different sizes of waste. Household bin (dustbin, waste bin, garbage can) < 100L < communal bin < 1m3< skip container < 10m3 < container. Container truck (skip truck) – Vehicle allowing loading/unloading and transport of skips and containers. Container trucks can be equipped with the so-called Ampliroll or Marrel (registered trademarks) hooklift system. Conveyor belt – Horizontal equipment for transporting waste, which can be at the same time used for waste sorting. Dealer (merchant, trader) – Agents, legal or illegal, sedentary (stand, local shop) or itinerant. Direct collection – Waste disposal is organised in a single stage that ensures the transport of waste from its collection points (door-to-door, voluntary drop-off points) to the final sink in the waste management chain, which often involves landfill or dumpsites. Disposal site – Place where waste is deposited. This is the point of final sink in the solid waste management chain. Only ultimate waste (cf. definition) should be deposited there. This glossary proposes a classification the different non-hazardous solid waste disposal sites found in developing countries. Five categories of disposal sites are proposed, ranging from the least to the most equipped: sanitary landfill, landfill, controlled, authorised and wild dumpsites. This is in no way a regulatory classification. The criteria required for each category are listed below. If a disposal site meets more criteria than are in its own category but not all of the criteria of the following category, its specific feature may be described. For example, a “controlled dumpsite using cell-based operations”, or “engineered sanitary-type landfill with biogas capture”.
Minimum required criteria
Burial of non-hazardous waste Sanitary landfill
X
Landfill
X Waste disposal sites
Controlled dumpsite
X
Authorised dumpsite
X Wild dumpsite
X
Authorised by the relevant authority Control of incoming waste Recording of incoming waste Weighbridge on arrival Favourable geological and hydrological context Impermeability of the site Drainage and collection of leachate Treatment of liquid discharges before their release into the natural environment
Management of surface runoff both outside and inside the site
Methane capture Perimeter fencing Cell-based operations X
X
X
X
X
X
X
X
X
X
X
X X
X
X
X
X
X X
X
X X
X
X X
Recovery activities prohibited in the operating zone; authorised in areas designed for this purpose X
Cells covered as soon as the filling operation has ended X X
Monitoring after the site has ceased to operate X
* The criteria for sanitary landfills (SLs) are those of the French regulations in force, applied to facilities for storing non-hazardous waste. Diversion (recovery, avoided disposal) – The process or result of keeping materials out of a dumpsite / landfill / storage facility. Door to door (D2D) – A pre-collection or collection system whereby waste is picked up from residents’ dwellings. This system differs from voluntary drop-off. Energy recovery (waste-to-energy) – A process that uses of the calorific value of wastes by burning them and recovering the energy as heat or electricity (notably, incineration and anaerobic digestion).
Fee for household refuse collection (FHRC) – Fees that help to finance, wholly or in part, household waste management within a territory. Unlike the tax levied on taxpayers, this fee is collected from users of the service. Final waste (ultimate waste) – Preliminary remark: the definition proposed here is taken from French legislation (Article L 541-1, Environmental Code) and seems transposable to other contexts: “ultimate waste is defined as waste, either resulting or not from the treatment of waste, which is not likely to be treated under the technical and economic conditions of the moment, notably by the extraction of the reusable part or by the reduction of its pollutant or hazardous character”. Formal sector – Encompasses all activities whose income is reported to the government and that are included within a country’s gross national product; such activities are normally taxed and follow requisite rules and regulations with regards to monitoring and reporting. Formal waste sector (Solid waste system, solid waste authorities, government, materials recovery facility) – Solid waste management activities planned, sponsored, financed, carried out or regulated and/or recognised by the formal materials recovery facility, local authorities or their agents, usually through contracts, licences or concessions. Green coal (bio-coal) – Coal produced by a carbonisation process using agricultural and/or household organic wastes. The product is similar to wood charcoal in its appearance and use. Green waste – This includes garden wastes, leaves, branches, grass cuttings, waste from green spaces, etc. Hazardous waste (toxic wastes, special industrial wastes) – Materials that pose substantial or potential threats to public health or the environment and generally exhibit one or more of these characteristics: ignitable; oxidant; corrosive; radioactive; explosive; toxic; carcinogenic; disease vector. Hazardous waste includes: infectious healthcare waste (IHCW), certain WEEE (cf. definition), batteries, paints, varnishes, solvents, phytosanitary products, etc.). They can be generated by households, industry, hospitals, etc. Household and similar wastes – Wastes generated by households and wastes of a similar nature (the latter includes waste from industrial and commercial activities which can be collected together with household wastes, given their characteristics and quantities, without any specific technical constraints. This includes wastes from artisans, tradespeople, services sector, etc., collected in the same conditions as household wastes). Illegal dump (dump, fly-tip, littering) – An illegal dump is created by individuals or companies without authorisation. These are small-sized dumps where municipal waste from a neighbourhood accumulates regularly over several days. It is sometimes cleared away (unlike wild dumpsites where the waste is never removed). Incentive fee – A way of having users finance the service, which provides an incentive to reduce waste and/or encourage sorting (e.g., billing the service according to the quantity of waste thrown away by the user). Incineration (burning, combustion) – Controlled process by which wastes are burnt and converted into gases, heat and solid residues. Informal sector – Individuals or businesses whose economic activities are not accounted in a country’s gross national product (GNP); such activities are not taxed; exchange of goods or services is on a cash basis; and the activities are not monitored by the government. The most telling indication is that the activities are not registered and not regulated by the public
authorities. It is characterised notably by the small size of structures, small-scale interventions, highly labour-intensive operations and low amounts of capital used. Informal recovery sector (informal waste sector) – Individuals or enterprises who are involved in waste activities but are not sponsored, financed, recognized or allowed by the formal solid waste authorities, or who operate alongside or in competition with those set up by the formal authorities. Itinerant waste buyer (itinerant junk buyer, itinerant waste collector) – Woman, man, child, family or enterprise who purchases or barters source-separated waste materials from households usually focusing on one specific material or type of materials. Local trader – (sedentary dealer) – Small business or shop that buys, sorts, stores and sells on recyclable materials, generally with little processing. Materials recovery – Area of activities encompassing the capture, re-use and recycling of materials extracted from waste (notably: recycling and composting). Municipal solid waste (MSW) – encompasses all the wastes that the local authority is responsible for managing (household waste and wastes of a similar nature generated by commercial and industrial activities and collected in the same way as household waste, referred to as “similar wastes”). Non-hazardous waste (NHW) (general waste) – This can be generated by households, commercial premises, administrations, industry, hospitals, etc. Organic fraction of waste (OFW) (bio-waste) – The organic content of waste of whatever type. Organic fraction of household waste (OFHW) (household bio-waste) – The organic content of household waste. Organic waste (Bio-waste, green waste, organic waste, organics) – Waste composed exclusively of biodegradable organic materials. It is usually treated through composting or anaerobic digestion. This includes green wastes, kitchen and garden wastes, paper and cardboard… Prevention (waste avoidance) – All measures and actions involved in designing, producing, distributing and consuming a commodity, aimed at (i) reducing the quantity of waste generated, (ii) reducing its harmfulness, (iii) improving its potential for valorisation following the rationale of resource conservation. Primary collection (pre-collection) – Sub-stage in the waste disposal chain. Transfer of waste from the source of generation (usually households) up to a transfer point. Primary collection only exists in a two-stage scheme: primary collection + secondary collection. In single-stage schemes only the secondary collection stage is involved. Primary collection differs from secondary collection in that the vehicles used are smaller and the distances covered shorter. Primary collection + transport: – Disposal is organised into two stages. The first is primary collection, which ensures the transfer of users’ waste, collected door-to-door, up to the transit points (transfer stations). The second stage involves transporting the waste from the transfer centres to the final sinks in the waste management chain, which are often landfills or dumpsites. Recovery (scavenging, skimming-off) – Process of extracting materials from a waste stock, which can be re-used to produce economic value. An activity often carried out by informals.
Recycling (valorisation, materials recovery) – Recycling involves processing and transforming waste materials and introducing them into a value chain of equivalent or different products. Recycling also involves recovering organic waste materials as compost. Reduction at source –distributor of a product. Waste prevention actions taken by the designer, producer and
Rejects – Materials that are scrapped during a valorisation process because they cannot be recycled or composted, or because they are viewed as having no or little monetary value. Refuse-derived fuel (RDF) – non-hazardous solid wastes for use as fuel. RDFs generally comprise plastics, wood, fabrics and organic waste. RDFs are used in industry to generate energy, notably to power cement kilns or incinerators. Re-use (second-hand use) – The use of a discarded product or material with its original or different form or function, and may include a system to repair/refurbish items.
Residual household waste (RHW)
Screen – Equipment for separating waste on the basis grain size. Trommels are revolving screens. Screened dump waste – (terreau) Decomposed organic matter produced several years after the waste has been dumped. It is obtained by screening old waste. The screened dump waste is often used as an organic amendment. It has a lower organic content than compost and does not ensure stability, hygienisation or harmlessness. Separate collection (segregated collection, selective collection) Collection of a stream of waste that has been pre-sorted to keep the different types of waste separate to facilitate their specific treatment. Sink – A sink is the opposite of a source, a place where the output of a system can be accommodated. It is a man-made or natural process at the end of the material life cycle that receives material flows and stores these materials for a certain time period. Skip – (cf. container) Sorting (facility) – A medium-sized industrial facility in which machines and/or manual workers segregate the wastes collected according to their composition and the instructions issued by the relevant authorities. The activities of a sorting facility generally include some transformation (crushing, compacting) and packaging of recyclable materials in view of their resale. Source separation (segregation at source) – Actions taken to keep and store certain materials separately from mixed waste at the point of generation. (in households, administrations or enterprises). Street cleaner (street sweeper) – Person assigned by the city authority to remove litter from streets. Tax on household refuse collection (THRC) – A tax that helps to finance, wholly or in part, household waste management within a territory. Unlike the fee paid by service users, this tax is levied on taxpayers, whether or not they benefit from the service. Transfer (transit, collection point, depot) – The operation where wastes from collection vehicles are offloaded onto transport trucks. It thus enables higher volumes of waste to be aggregated in view of long-distance transport. Transfer stage often includes compacting.
Transfer point – Any place (legal or illegal) that regularly receives a load of household or similar waste and which is regularly collected by the public authorities. Transfer points are fed by waste from primary collection, which is then removed by secondary collection. Transfer station (transit station) – A place that ensures the transition between the collection stage and transport. It is often in the form of a covered ramp that enables a load to be discharged into a skip placed at a lower level. The skip may include a compacting system to optimise the loading. Transport – The last stage in the waste disposal chain, this involves transporting waste from transfer centres to the final sink in the waste management chain, often a landfill site. The transport is organised so as to optimise waste shipments over long distances. It follows on from the secondary collection stop and uses trucks with a higher-capacity than collection trucks. Treatment – Manual or mechanical methods to reduce the risk of exposure or to reduce the impacts upon the environment of toxic or hazardous materials associated with the waste stream; in some cases, can concurrently capture and increase the economic value of specific waste stream components’ value-added. Undifferentiated collection (combined stream collection) – Collection of multi-material waste. Valorisation (recovery) – The entire process of extracting, storing, collecting, or processing materials from the waste stream in order to extract and divert value and direct the material to a value-added stream.. Valorisation facility – A facility that carries out waste valorisation activities (see definition). Voluntary drop-off – A system of primary or secondary collection whereby users take their waste to a dedicated area (sometimes a transfer point). This method differs from door-to-door collection. Waste disposal (waste removal, refuse disposal, garbage disposal) – A general term denoting the transport of waste from the areas where it is generated or stored to the final sink in the waste management chain. The waste disposal process can be subdivided into several successive stages: primary collection, secondary collection, and transport. The capacity of the vehicles used increases from primary collection to the transport stage. Several types of schemes are found, the main ones are described above. Waste electrical and electronic equipment (WEEE) – WEEE includes computers, mobile phones, household appliances, etc. Wastepicker (dump-picker, street-picker, rag-picker, scavenger, recovery actor) – Often informal, they salvage various materials from waste stocks in order to reuse, process and/or (most often) sell them on. They mainly operate in the street, at transfer points and waste disposal sites. Waste stock (stock of waste) – Understood in a general sense in this report as the total quantity of waste generated in a defined territory (city, region, industrial zone, etc.). Note: In Chapter 5, section III, “Managing waste as a common resource”, the term “stock is used in the Ostromian “common pool resources” framework of “stocks” and “flows”.
Appendix 3: The actors of waste recovery and recycling
Recovery actors
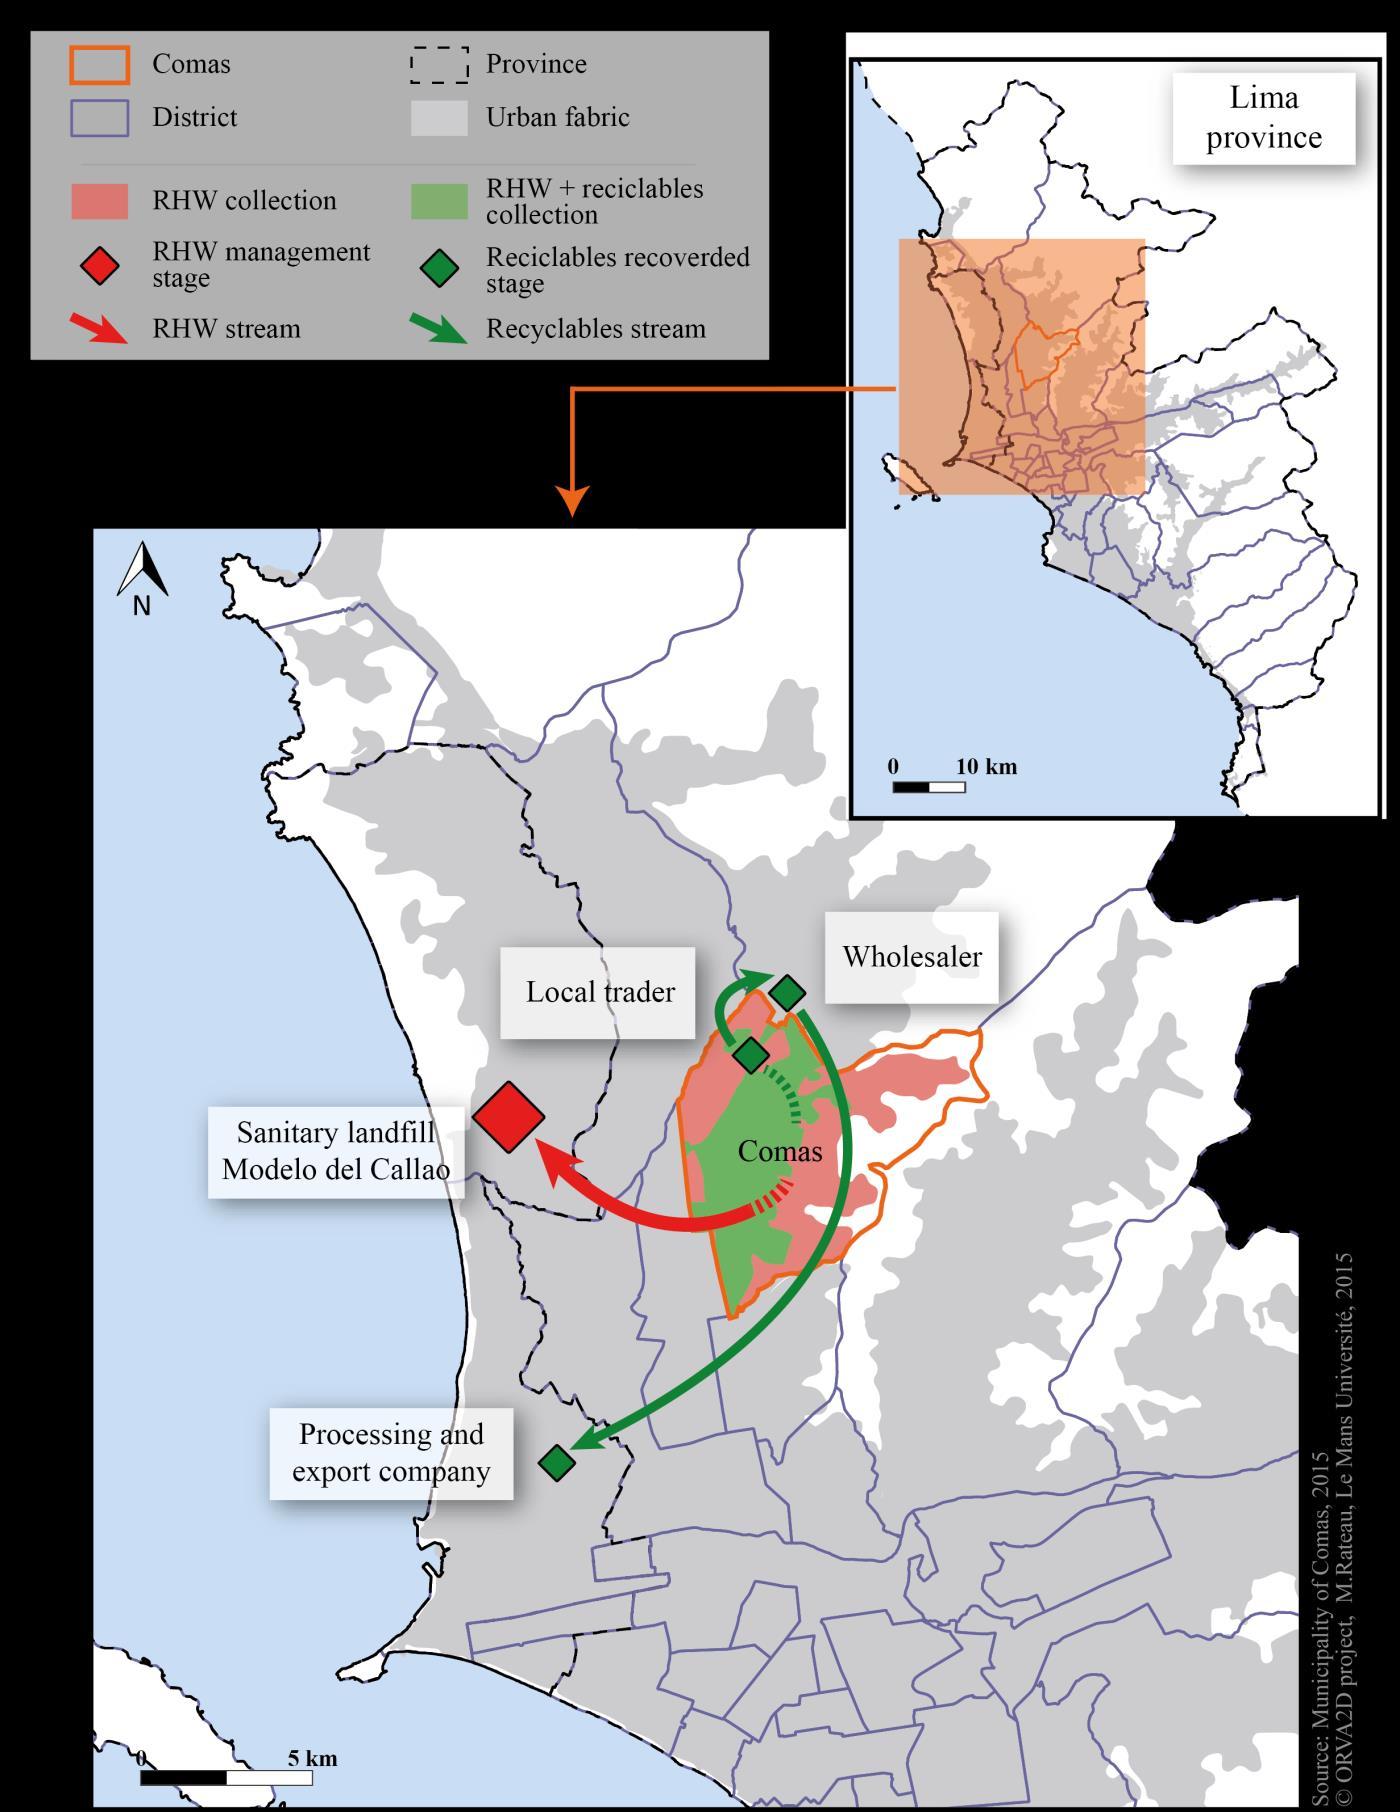
Waste loaders or street sweepers: these are municipal employees tasked with keeping public spaces clean. They generally take advantage of their street rounds to pick up waste that has market value. In Comas, waste loaders working at the rear of household refuse collection vehicles, systematically pick out the obviously recyclable materials (the largest pieces, intact or almost, visible in the bags of refuse); in Delhi, this practice is carried out more by street sweepers. Primary collectors: while paid by households to remove all refuse, they are usually the best-placed to recover recyclable waste, whether or not this has been pre-sorted by the household. They play a key role in Antananarivo, Lomé and Delhi. Dump-pickers (wastepickers): these rummage through waste stocks or transfer points (sometimes with a hook). They generally sell on to local traders, but sometimes store their own waste for resale to semi-wholesalers. Dump-pickers have almost disappeared in Lima and Bogotá, but are still very present everywhere else. They live and work in often extremely precarious conditions. In Antananarivo notably, an individual or family, dubbed “4’mis” , will stake a claim to recyclables from skips in a specific neighbourhood. Street-pickers (wastepickers): these go around the city streets, often at night-time before the municipal waste truck passes for door-to-door collection, to pick waste directly out of household dustbins. Their relations with residents may be more or less hostile. They are held in great contempt by citizens and hounded by the authorities. Itinerant waste buyers: these go around the streets buying (high-value) waste from households and businesses. They are often equipped with a small vehicle (to transport their booty) and scales (as they pay households by weight). This little-documented practice exists in all the cities in the study.
Dealers
Local traders: these actors have premises (or simply a patch of vacant land) where they buy waste from various recovery actors, store it and aggregate larger quantities before selling on to wholesalers. They may sometimes upgrade or process the waste, for example, by sorting it more finely or cleaning products. Depending on their storage capacity, they can sell the waste on to one of the actors described below. This actor, like those above, are informal. They use a third-party transporter to travel and sell their waste. Semi-wholesalers: these are generally groupings of several sedentary traders, which enables them to buy a truck or obtain larger premises. They carry out the same operations as local traders, the main difference being that they dispose of more financial resources and larger storage capacities. This allows them to assume the cost of transporting their goods to wholesalers and recycling industries (they are not exporters). As they are in a position to buy the stocks of local traders, they can handle
greater volumes of waste. Like the local trader, they can carry out finer sorting, cleaning and/or packaging of materials. They are still often informal. Wholesalers: These actors buy and recover waste from local traders or semiwholesalers. They store large quantities of waste, sort it more finely and package materials before selling them on to the recycling industries or sending them on for export. For instance, in Surabaya, wholesalers sort plastics into 12 categories, which are further sorted into 90 sub-categories by industry. At this level of operation, the activity is always formal and carried out by real waste entrepreneurs. Wholesalers most often specialise in one type of material, whereas the other buyers above deal with multiple materials.
Processors and exporters
Artisanal recyclers: these actors remain informal. They transform some materials directly into consumer goods. For example, they buy scrap metal from the above actors and melt it down using traditional methods to produce pans, or transform plastic into bags. Sometimes, they simply shred the waste into smaller items (e.g., rubber pellets) to sell on to industry (for this, they may again use the services of a wholesaler). Recycling industries: these actors buy large homogenous waste stocks for use as secondary raw materials in their industrial production processes. For these industries, the materials are simply possible substitutes for virgin materials. In Lomé and Antananarivo, this type of industry is very rare, the preference being to export them to more industrialised countries (notably, China). Exporters: these are companies, often foreign-owned, that load recovered raw materials into containers for export by land or sea.
Appendix 4: Lima: a study of three cities in one
Lima: three cities in one
Lima, the capital of Peru, comprises 50 districts1 grouped within two provinces (Lima and Callao). Each district has its own town hall, its own budget, its own public services and its own waste management service. Although each of the two provinces also has its own local authority, the latter has far fewer responsibilities and resources. The metropolitan area is characterised by extreme socio-economic segregation. The municipal budgets per capita range from 1 to 100 between the most affluent districts and the poorest districts (Durand, 2015). This characteristic strongly impacts public policies and gives each territory very different possibilities for its choice of waste management model.
The field study selected three socio-economically contrasted districts:
Surco2 is the second wealthiest district in Metropolitan Lima. Located in the immediate vicinity of the city’s business centre, it is a residential neighbourhood and home to most of the city’s affluent residents. With a high-income population that is very open to global North countries, Surco has implemented a proactive waste management policy on a par with European cities, which warranted its inclusion in the study. The district has 355,986 residents.
Comas is one of the city’s poorest districts. With 568,540 residents, it nonetheless has a proactive waste management policy. It is located on the city’s northern outskirts, in a sector of several million inhabitants who initially lived in precarious informal settlements (today, in some zones, these are being formalised).
Villa Maria del Triunfo (VMT) has relatively similar characteristics to Comas, as it is a very poor periurban district with 464,176 residents. The local authority implemented an ambitious waste management policy ahead of Comas, but it proved a failure, so much so that its mayor was removed at the height of a public health crisis. The study of the district identified other logics.
As it was not very relevant to work on the whole city, we highlighted the specificities of each of the district studied.
1 The city had only 49 districts until 2014, which accounts for the discrepancies that may appear on some location maps. 2 Officially, Santiago de Surco
Appendix 5: Data collection tools developed for a comparative study
1. The general “waste management” grid (GDS)
The Excel file contains 14 tabs. At the top of each tab, there is a reminder of the general objective targeted by the tab relative to the study as a whole. There is a progression on the grid: the further you move along the tabs from left to right, you advance from the general to the particular. In this sense, the grid is designed to guide investigators in the field by allowing them to gradually enter into greater detail. Apart from this graduated feature, the grid is intended to be all-inclusive in order to help investigators to not forget certain aspects and to collect all the readily available data. This means that the grid envisages a greater number of possible cases than those actually present in a given field. For this reason, the grid includes a colour code to distinguish between the key data that must crucially be filled in and the secondary data to be used for analysis (orange cells). The function each tab is specified in the table below.
Tab name Structure of the general survey grid
Function
Introduction
General country & city data
Legal & institutional framework
Waste generation
Waste characterisations
City’s SWM
Informal sector
Informal sector diagram
Flowchart 1
Primary and secondary collection Presentation of the grid and its manager
General characteristics of the city or country likely to influence solid waste management and recycling and recovery Identification of the environment and actors in order to assess the margin of manoeuvre available for integrating recycling and recovery channels, or to identify the enabling factors for the innovation under study Evaluation of the quantities of household and similar wastes generated at the different scales of the city, in order to identify the ”waste stock” (quantities and location) Description of household waste composition in order to identify management possibilities and the potential for recovery Overview and “salient features” of the city’s solid waste management Assessment of the field of action and the extent of informal actors’ involvement in the area of waste management in the city A standard diagram to be adapted so as to give an overview of all the actors in the informal recovery and recycling chain, and understand how they interact This diagram is to be completed/adjusted and must give an overview of the waste flows at the metropolitan scale (this is not limited to the municipal service!). The idea is that it should show: the flows, actors and type of materials involved at each stage. Description of the collection procedures in order to link the type of collection and the treatment modalities
Valorisation
Disposal facilities
Flowchart 2
Projects under development Description of the existing valorisation chains and procedures Description of the current state of disposal facilities and their cost, in order to identify the level of need to develop recycling and recovery chains The collected quantitative information must now make it possible to complete Flowchart 1 with tonnage-related data. Description of service changes envisaged in the near future in order to gauge their compatibility with existing chains
2. The socio-institutional grid
The Word document, "Socio-institutional Grid" , is designed to provide a grid for the data to be collected, as well as practical instructions on how to proceed in order to obtain a snapshot of waste management in a given city. This survey grid must be filled in in parallel with the general GDS grid: it reprises the same categories as those in the GDS grid. In addition to the quantitative/qualitative profile, the Word grid aims to help the investigator to avoid becoming bogged down in the detail of the Excel grid and is an ongoing reminder of the objective to be reached with the information collected. The question-based aspect of the matrix is designed to: facilitate the investigator’s work allow for a more qualitative analysis than that using the Excel format simplify exploitation of the data and the drafting of the final synthesis
For each theme addressed (corresponding to each of the tabs on the GDS grid), the socioinstitutional grid includes: a reminder of the overall objective practical instructions for the investigator a series of open questions, to be answered clearly and concisely
A colour code allows the questions directly related to the three study objectives to be displayed at any moment: i. characterisation of the waste streams and organisation of the municipal public service ii. granular knowledge of the recycling and recovery chains iii. understanding of their interactions, potential incompatibilities and synergies
Three topics were added (at the end of the document) to the 14 topics covered in the GDS grid: 15. 16. 17. Integration of non-municipal waste management actors Synthetic Results / Evaluation Definitions and information specific to the city
3. The service & financing budget grid
Design of the economic and financial data collection sheets
The Technical and Economic sheets for waste collection and treatment
The Technical and Economic sheets were initially designed to collect data that would be useful in calculating production costs for the activities of managing household and similar wastes. This information included, on the one hand, data relating to primary collection, secondary collection, the transfer centre and transport and, on the other hand, data related to landfill, the composting unit and the sorting centre. It also included data on knowledge of the means of production and how these are organised, as well as data on the utilisation and performance of these means and infrastructures. The economic data included investment costs and operating costs, a distinction being made between fixed and variable costs and maintenance, repair and replacement (MRR). The technical data aimed to describe the facility, the incoming waste stream and the operating conditions. The Technical and Economic sheets were designed to determine the production costs of the activities, based on the three following methods: the Full-Cost Accounting Method, the Production-factor and Unit-cost Method and the Techno-economic Modelling Method (cf. Appendix 6). They were then adapted so that they could be used empirically on the fields studied and integrate informal activities in particular.
The Service & Financing Budget sheet
This sheet has a detailed version (activities–nature of costs matrix) and a simplified version (activities–nature of waste streams matrix) showing total expenditure on the service. A tab on the different sources of financing and a specific tab on financing by users of the service. The Service & Financing Budget sheet was designed to establish both the cost of providing the service and the method used to apply pricing to service users, based on the Full-Cost Accounting Method to establish the service provision cost. This method is described in Appendix 6.
Simplification of the sheets
The team found that the original sheets were too precise and exhaustive, given the information likely to be available in developing countries, and would be too time-consuming for the study. Various items were simplified, which thus reduced the possibilities of data analysis Only the sheet for the Budget for the service and financing was kept, with the tabs for primary collection and secondary collection merged, as were those for transfer and transport, disposal and administrative expenses. The tabs for composting and sorting centre were removed. The relevance of differentiating between fixed and variable costs was no longer taken into account. To conclude, the techno-economic modelling method ceased to be applicable, especially since the data on utilisation and operating conditions and performance were inaccessible for the two cases studied.
4. Application of the tools
Relatively long field missions were conducted to implement the various evaluation tools.
Case study
Antananarivo
Lima
Bogotá
Delhi
Lomé
Surabaya
Organisation of ORVA2D field missions Duration of the mission Team work that can serve as a basis Local partner
5 months in the field, in 2015 – A. Pierrat, Clémence Lecointre and Romain Breselec
5 months in the field, in 2015 – M. Rateau
3 months in the field, in 2016, two people – M. Rateau and Heduen Estrella Burgos
3 months in the field, in November-December 2014 and January 2016, two people – R. De Bercegol and S. Gowda
4 months in the field, in 2016 – J. Garnier
2 on-site missions lasting for a total of over 3 months, OctoberNovember 2015, then March-April 2016 – J. Cavé On-site work by the NGO Gevalor Antananarivo Municipality
Previous work by M. Durand (Durand, 2010, 2015) and M. Rateau (Rateau, 2014)
Previous work by M. Durand (Durand, 2007)
Previous on-site work by R. De Bercegol sur place (De Bercegol, 2012) Instituto Francés de Estudios Andinos (IFEA); NGO Alternativa; Comas Municipality Instituto Francés de Estudios Andinos (IFEA); Universidad Nacional de Colombia; NGO Basura Cero
French Research Center Delhi (CSH); Center for Policy Research Delhi; NGO Chintan
On-site work by the NGO Gevalor
None Lomé Municipality
Institut Teknologi Sepuluh Nopember
In most of the cities, the lack of consolidated data was a major hurdle to completing the grids appropriately, especially for the large metropolitan areas. Economic data, in particular, was very difficult to obtain or reconstitute.
Appendix 6: Measuring the production cost of management service the waste
Definition of “production cost”
The concept of production cost, observed at the level of the producer of an activity (collection, transport, treatment or disposal), corresponds to the cost incurred by the use of the factors of production or, in other words, the direct costs incurred in acquiring and operating them. It could be qualified as a “technical cost”. This means that indirect costs such as financial expenses, overheads and administrative costs must be excluded. The production cost is thus the sum of the operating cost, E, and the infrastructure cost, I, for a given activity, i: CPi = Ei + Ii
The total production cost (CP) corresponds to the direct costs that the producer must pay to have the use of the factors of production. It is linked to production by the unit costs of the factors of production, as well as by the intensity of their utilisation (notion of productivity). In the short term, the total production cost has two components: fixed costs (CF) and variable costs (CV): − Fixed costs (CF) represent the costs of the irreducible factors required to ensure production, whatever the level of output (within the limits of installed production capacity). Fixed costs are thus independent from the quantities produced. − Variable costs (CV) are the costs that vary depending on the volume of output or the quantities produced. The production cost allows us to measure the technical efficiency of waste collection-transport and treatment activities using an economic performance indicator: the production cost expressed as the tonne collected/treated.
Methods for calculating the production cost
For developing countries, two ex-ante methods are possible: one based on an accounting document, such as the actual budget, known as the “fullcost accounting” method, the other based on knowledge of the equipment and its use, known as the “productionfactor and unit-cost” method.
Full-cost accounting method
For a local authority or city that has a “household waste” budget (either subsidiary or separate), the expenses are classified by nature. The methodology thus involves analysing the flow and purpose of the costs, then classifying them by activity (primary collection, secondary collection, transport, treatment, disposal). This classification of costs by activity comes from knowledge of the operations and components required for the smooth running of equipment, distinguishing equipment and infrastructure expenses from operating expenses. The matrix-based analytical approaches akin to “ComptaCoût” and “ Full-Cost Accounting” (FCA) can be applied depending on the level of detail of available data.
Applying this method requires knowledge of the costs of the activity in question and the associated revenue (sale of materials, energy, etc.) or the expenditure on a private operator’s service provision. This method was used for Lima, Bogotá and Surabaya. The difficulty lies in identifying the costs and assigning them to a single activity studied. *
Production-factor and unit-cost method
To dispose of waste, the municipality or its collection provider buys the services of the factors of production on the markets where labour, capital and raw materials are negotiated. The costs incurred constitute production costs. By combining these factors in compliance with the technical standards in force, the enterprise manufactures cleanliness. For this method, knowledge of the means of production, the conditions of their utilisation and their performance makes it possible to model the functioning of the activity and thus calculate its production cost. Applying this method depends on estimating the factors of production allocated to municipal waste management. This involves: − on the one hand, quantifying equipment, waste recipients and vehicles and their operation (consumption, maintenance, etc.) and collection personnel (drivers and waste loaders); and − on the other hand, quantifying their unit costs. The result is the evaluation of the total production cost of the service, which can then be used to compare similar situations. This method was used for Antananarivo and Lomé.
Calculating the production cost
The production cost, or direct costs (Cd), denotes the costs incurred by the acquisition and operation of the factors of production, such as vehicles and crews, independently from the indirect costs. It is expressed as: − the sum of vehicle costs and crew costs as follows: Cd = (CFV + CVV) + L − or as the sum of fixed costs and variable costs: Cd = CF + CV.
Fixed costs: CF = L + CFv where: L = ld + nc * lc : denotes personnel costs, notably: ld: annual salary cost of a driver lc : annual salary cost of a loader nc: number of waste collectors or loaders.
CFv = A + a: denotes the fixed cost of the vehicle, notably: A: depreciation for vehicle wear and tear: A = IV/d o IV: amount of investment in the vehicle o d: the vehicle lifetime a: fixed costs relating to ownership of the vehicle (insurance)
Variable costs: CVv = cvv * D denotes the variable costs for the vehicle, with: cvv: vehicle running cost per kilometre (fuel, oil, tyres and maintenance) which can be included as an energy budget item. D: the annual distance travelled.
The direct production cost is thus: Cd = L + CFv + CVv
Cd = ld + nc * lc
+ (A + a) + (cvv * D) Which costs should we include to calculate the production costs for waste management activities? Determining the costs by activity implies having knowledge about the operations and the elements required for the smooth running of equipment. The distinction between equipment/infrastructure costs and operating costs are presented below under each activity.
Identification of the components of production costs by activity
Primary collection costs
Capital expenditure. Investments are limited to: - purchase of storage equipment: bags, wheelie bins, sealed dustbins, containers - installations to stabilise waste recipients on the ground (platforms, supporting elements).
Operating expenditure includes: - distribution of waste recipients - cleaning of recipients (washing, disinfection, graffiti) - maintenance supplies (wheels, pins, lids, hinges, etc.) - recipient rental, if applicable - recipient handling (switching, entry-exit)
Secondary collection costs
Capital expenditure. Investments are limited to the acquisition of the collection vehicle: - purchase of the chassis and skip - waste recipient lifting gear (bin- or container-lifting)
Operating expenditure - Fixed components: Personnel: - direct: drivers, refuse collectors, seasonal workers, maintenance. - management: operations manager, supervisors Clothing, cleaning products, sundry supplies (office, tools) Taxes and insurance for the vehicles and other - Proportional components: Routine expenses: fuel, oil, grease, tyres, batteries Minor day-to-day maintenance - Maintenance: - vehicle servicing and repairs
Transfer–transport costs
Capital expenditure. Investments are: - Station infrastructure (engineering works, outfitting, roads and services) - Fixed equipment: compactor, loader, etc. - Mobile equipment: containers
Operating expenditure for the transfer station
Fixed components: − Staff: watchman − Other fixed expenses (insurance, taxes, cleaning, security) Proportional components: − Consumption: energy − Minor day-to-day maintenance Maintenance: maintenance of fixed equipment (compactor, containers, etc.)
Operating expenditure for the transport vehicle - Fixed components: . Personnel: drivers . Clothing, cleaning products, sundry supplies (office, tools) . Taxes and insurance for vehicles and other - Proportional components: . Routine expenses: fuel, oil, grease, tyres, batteries . Minor day-to-day maintenance - Maintenance: Vehicle servicing and repair
Illust rations
Figures
Figure 1. Urban waste generation by country income level in 2010 and 2025 (projected) ................. 9 Figure 2. Average waste generation per capita per day....................................................................... 10 Figure 3. Household waste composition by country income level ....................................................... 10 Figure 4. Actors in informal waste management.................................................................................. 15 Figure 5. The Integrated Sustainable Waste Management Model...................................................... 16 Figure 6. The two triangles of the UN-Habitat 2010 report ................................................................ 20 Figure 7. Process Flow Diagram for Cañete (Peru) ............................................................................. 21 Figure 8. Comparison of material recovery by the formal and informal sectors in six of the world’s cities 23 Figure 9. Comparison of net revenue (revenue - costs) of the formal and informal sectors in six cities of the world ................................................................................................................................................. 24 Figure 10. Synoptic overview of solid waste management in Europe ................................................... 29 Figure 11. Waste – between a public service and a market economy ................................................... 30 Figure 12. History of events that triggered waste management policies .............................................. 33 Figure 13. Characteristics of wastepickers’ integration ........................................................................ 55 Figure 14. Actors involved in waste recovery in Lima and Bogotá....................................................... 55 Figure 15. The technical levers for implementing waste recovery innovations ................................... 66 Figure 16. Synoptic diagram of waste management organisation ........................................................ 83 Figure 17. Summary of waste management expenditure....................................................................... 85 Figure 18. Quantities of treated waste by type of sink used .................................................................. 86 Figure 19. Financial levers to implement waste recovery innovations ................................................. 97 Figure 20. Avoided costs (prospective) thanks to waste composting in Lomé ................................... 105 Figure 21. The institutional levers to implement waste valorisation innovations.............................. 109 Figure 22. Responsibility for waste management in the reference cities (1/2) ................................... 111 Figure 23. Responsibility for waste management in the reference cities (2/2) ................................... 112 Figure 24. Promulgation dates for national waste-related laws or regulations ................................. 114 Figure 25. Centralised, unified and linear waste management model ................................................ 119 Figure 26. Dysfunctions of the centralised, unified and linear model................................................. 120 Figure 27. The informal, diversified and insalubrious waste management model ............................ 121 Figure 28. The participatory, composite and circular waste management model............................. 123 Figure 29. Positioning of each city compared to the models studied .................................................. 125 Figure 30. Economic value of different types of waste......................................................................... 128
Tables Table 1. Characteristics of municipal waste by country level of income 11 Table 2. Proposed segmentation of the urban waste stock 31 Table 3. Expenditure on service provision 40 Table 4. Waste collection management methods 44 Table 5. Effectiveness of Comas’ low-tech model and Surco’s high-tech model 61 Table 6. Extension of the useful life of the Antananarivo landfill through excavation and composting of incoming waste 80 Table 7. Costs of collection, transport, incineration and landfill activities 81 Table 8. Components of service provision expenditure 83 Table 9. Characteristics of municipal composting units 92 Table 10. Criteria and amount of primary collection fees 94 Table 11. Criteria for calculating household taxes or fees 94 Table 12. Financing of the service 96
Maps
Map 1. Map 2. Map 3. Map 4. Map 5. Map 6. Map 7. Map 8. Map 9. Population size of the reference cities.................................................................................... 37 Generation and collection of household and similar wastes................................................ 42 Waste collection sectors in Bogotá......................................................................................... 43 Share of primary waste collection in the African and Asian cities ..................................... 48 Composition of household waste in the six reference cities ................................................. 67 The constant race between disposal sites and urbanisation ................................................ 69 Spatial distribution of Surabaya’s composting units ........................................................... 74 Costs of collection, transport, incineration and disposal ..................................................... 82 Municipal expenditure on waste management ..................................................................... 93
Photos
Photo 1. Selective waste collection in Surco © M. Rateau, ORVA2D, 2015 ..................................... 46 Photo 2. Primary collectors at a TPS in Surabaya © Cavé, ORVA2D, 2016.................................... 47 Photo 3. A waste transfer point in Antananarivo © Pierrat, ORVA2D, 2015 .................................. 50 Photo 4. The structure of the sandal value chain in Delhi.................................................................. 54 Photo 5. Wastepicker from the Las Palmeras association in Villa Maria del Triunfo © Rateau, 2015. 57 Photo 6. An informal wastepicker (behind) is competing with a formal wastepicker (in front) in
Comas © Rateau, ORVA2D, 2015 ............................................................................................................ 60 Photo 7. A primary waste collector in Surabaya © Cavé, 2016 ......................................................... 62 Photo 8. Waste bank with weighing scales in a Surabaya neighbourhood © Cavé, 2016 ................ 62 Photo 9. Municipal composting units in Surabaya © Cavé, 2016 ...................................................... 74 Photo 10. Neighbourhood greening (left) thanks to community composting (right) in Surabaya ©
Cavé, 2016 77 Photo 11. Community composter at the Ambatomaity garden in Antananarivo (50 households) ©
Pierrat, ORVA2D, 2015 ............................................................................................................................. 78 Photo 12. Screening dump waste in Lomé © Gevalor, ORVA2D, 2015 .............................................. 79
Already published in t he collect ion
Notes techniques n°1
Panorama des inégalités hommes – femmes dans le monde (Juin 2015)
Notes techniques n°2
Notes techniques n°3
La Commission du Mékong face à un tournant –Quelle place pour l’aide française (Septembre 2015)
Quelle efficacité environnementale de la certification pêche et aquaculture « durable » ? (Septembre 2015)
Notes techniques n°4
Vérité des prix ou socialisation de la couverture des coûts ? (Octobre 2015)
Notes techniques n°5
Accompagnement technique et renforcement des capacités: leçons de l'expérience (Octobre 2015)
Technical Reports No 6
Technical Reports No.7
Notes techniques n°8
Technical Reports No.9
Actors and networks of agroecology in the Greater Mekong Subregion (October 2015)
Creating Alliances to Accelerate Commercially Viable Sanitation (November 2015)
La recherche française sur l’éducation dans les pays en développement: un état des lieux (Novembre 2015)
Facilitating green skills and jobs in developing countries
Notes techniques n°10
Notes techniques n°11
Étude sur le développement de l’entreprenariat social à Madagascar
Ecole et Santé de la reproduction Une recherche-action dans les départements du Littoral et de l’Atlantique au Bénin (nov. 2014 – juil. 2015)
Notes techniques n°12
Notes techniques n°13
Notes techniques n°14
Notes techniques n°15
Technical Reports No.16
Notes techniques n°17
Notes techniques n°18
Notes techniques n°19
Technical Reports No.20
Notes techniques n°21
Notes techniques n°22
Observation spatiale pour l’agriculture en Afrique: potentiels et défis
Améliorer la prise en compte de la nutrition dans les projets de développement rural et de santé
Villes et stratégies climatiques: cinq cas d’études
Jeunesses sahéliennes: dynamiques d’exclusion, moyen d’insertion
Supporting Access to and Retention in Employment for Women by Enhancing Child Care Services in Turkey
Méthode de suivi de l’impact climat des investissements (MRV) appliquée aux projets agricoles et forestiers des Banques Nationales de Développement
Gestion des ressources en eau souterraines comme biens communs
Eau des villes, assainissement et précarités – des réalités contrastées à Ouagadougou (Burkina Faso) et Niamey (Niger)
The effectiveness of an environmental credit line in Egypt: Synergies between market incentive and binding regulations
Développement rural à co-bénéfices - Gouvernance, suivi, certification
Dynamiques des systèmes agraires et devenirs de l’agriculture familiale en guinée
Notes techniques n°23
Notes techniques n°24
Notes techniques n°25
Technical reports No.25
Notes techniques n°26
Notes techniques n°27
Notes techniques n°28
Notes techniques n°29
Notes techniques n°30
Notes techniques n°31
Notes techniques n°32
Évaluation de la politique d’aménagement du territoire en Tunisie de 1995 à 2010
Cocoa farmers’ agricultural practices and livelihoods in Côte d’Ivoire
Vulnérabilité sociophysique aux inondations au Sénégal
Socio-physical Vulnerability to Flooding in Senegal
Revenus et trajectoires agricoles en Afrique d’ici 2050: vers un trop-plein d’agriculteurs ?
Comprendre le processus d’installation des jeunes en agriculture pour mieux l’accompagner - Grille d’analyse et premiers résultats
Les dynamiques d’inclusion / exclusion de la jeunesse en zone MED
Quelle compétitivité de la Côte d’Ivoire, du Sénégal et de la Tunisie ? - Un état des lieux à partir des nouvelles données de l’Observatoire de la Compétitivité Durable
Urgences et crises sanitaires dans les pays à ressources limitées: de la préparation à la réponse
Capitalisation des actions de formation-insertion des jeunes conduites par les organisations non gouvernementales
L’accès et le maintien des femmes à l’emploi de qualité au Maroc, en Tunisie et en Turquie
Notes techniques n°33
Technical Reports No.34
Notes techniques n°35
Technical Reports No.35
Notas Técnicas N°35
Notes techniques n°36
Notes techniques n°37
Notes techniques n°38
Technical Reports No.39
Notes techniques n°40
Notes techniques n°41
Le financement participatif et l’aide publique au développement: état des lieux et recommandations
Outlooks for flare reduction in Nigeria
Risque d’inondation et villes des pays en développement
Flood risk and cities in developing countries
El riesgo de inundación y las ciudades en los países en desarrollo
Etude de capitalisation: Impact et mise en œuvre de programmes à haute intensité de main d’œuvre (HIMO) en Afrique subsaharienne
Etude de capitalisation: Impact et mise en œuvre de programmes de soutien à l’entrepreneuriat en Afrique subsaharienne Etude prospective: quel impact des dynamiques démographiques sur l’offre sanitaire et médico-sociale de la Guyane ?
Assessing and Addressing Climate Governance Challenges in Low- and Middle-Income Countries
Réformer les per diem par le dialogue
Analyse rétrospective du secteur urbain de l’eau potable au Sénégal: un partenariat public-privé à l’épreuve du temps
Technical Reports No.41
Notes techniques n°42
Technical Reports No.42
Notes techniques n°43
Notes techniques n°44
Notes techniques n°45
Notes techniques n°46
Notes techniques n°47
Notes techniques n°48
Notes techniques n°49
Notes techniques n°50
Retrospective Analysis of the Urban Water Supply Sector in Senegal: A Public-Private Partnership Over Time
L’assainissement et ses enjeux
Challenges in Sanitation
Utiliser les indications géographiques comme outil de développement - Guide pour le choix des produits illustré par les cas du miel blanc d’Oku et du poivre de Penja, Cameroun
Vingt ans d’aménagements rizicoles dans les territoires de mangrove en Guinée maritime Quel développement agricole durable?
Territoires de l'eau et communs en Bolivie - Les cas de Hampaturí (La Paz) et de Sacaba (Cochabamba)
Gouvernance des services d’eau et d’assainissement des villes boliviennes Analyse du modèle de gestion coopérative au travers de l’exemple de SAGUAPAC (Santa Cruz de la Sierra, Bolivie) Mutations de la gouvernance des systèmes alimentaires urbains Le cas de l’agglomération de Rabat-Salé
Contribution des systèmes de distribution alimentaire à la sécurité alimentaire des villes: étude de cas sur l’agglomération de Rabat (Maroc)
Contribution des systèmes de distribution alimentaire à la sécurité alimentaire des villes: étude de cas sur l’agglomération d’Abidjan (Côte d’Ivoire)
Systèmes d’approvisionnement et de distribution alimentaires Étude de cas sur la ville de Niamey (Niger)
Notes techniques n°51
Notes techniques n°52
Notes techniques n°53
Les systèmes de distribution alimentaire dans les pays d’Afrique méditerranéenne et Sub-saharienne
Recherches africaines et rôles de l’aide internationale: le cas des sciences sociales
Les branchements sociaux: intérêt et limites de différentes stratégies de ciblage des ménages vulnérables
What is AFD?
AFD is an inclusive public institution and the main actor in France’s development policy. It makes commitments to projects that genuinely improve the everyday lives of people in developing and emerging countries and in the French overseas territories. AFD works in many sectors – energy, health, biodiversity, water, digital technologies, training – and supports the transition to a safer, more equitable and more sustainable world: a world in common. Its action is fully in line with the Sustainable Development Goals (SDGs). Through its network of 85 agencies, AFD operates in 115 countries and is currently supporting over 4,000 development projects. In 2018, it earmarked EUR 11.4bn to finance these projects.
Agence Française de Développement 5 rue Roland Barthes – 75598 Paris Cedex 12 Tel: +33 1 53 44 48 86 – www.afd.fr


