
35 minute read
II. Investigating solid waste recovery in global South cities


typically have a high organic content, landfilling this waste largely boils down to burying… water, even though this organic material could be used to replenish increasingly impoverished soils.
Hierarchy of waste treatment methods
Advertisement
The European directives on waste management have gradually established a hierarchy of treatment techniques, 1 which now serves as a global benchmark.2 It is now recommended to manage waste in the following order of priority: i) Prevention: reducing waste even before it has been generated ii) Preparing for re-use: whereby the object is not destroyed but re-used either directly or after repair iii) Recycling and composting: recovering materials by diverting the object from its original use and destroying it (energy consumption) iv) Energy recovery (incineration, anaerobic processing): recovering the energy it contains and disposal of the contaminant but also
v) Disposal: the final solution aimed at concealing waste (in the best possible conditions). Theoretically, only final waste (non-recoverable) should be landfilled.
Materials and energy recovery along with disposal are viewed as treatment methods aimed at eliminating the nuisance, if possible by obtaining an environmental and economic benefit from this process. Prevention and re-use allow for intervention even upstream of the waste management stage. These different treatment techniques foreground two logics: a) prevention (ex-ante) or disposal (ex-post) of waste, i.e., the nuisances disappear; and b) the recovery of waste as a resource. As economist G. Bertolini points out, disposal (i.e., disposal) of waste differs from the logic of recovery: one is linked to the market economy (private good: the valorisation of the resource), while the other relates to a public service (public good: the reduction of a nuisance) (Bertolini, 1992). Neither do they involve the same economy of scale.
In light of the available literature, it becomes clear that waste recovery activities fluctuate between commercial activities linked to the value of certain materials and citizens’ growing expectations that municipalities extend their basic service. Public awareness increasingly supports extending the basic service, which relies on landfill as its main final sink option, to include recycling and recovery. Today, in most global South cities, the informal sector ensures the bulk of waste materials recovery. Yet, more often than not, this recovery is operated separately from the municipal service: when recovery is carried out by informal actors, the authorities turn a blind eye, but these informal activities can even lead to clashes or conflicts with agents working for the municipal service. Yet, the informal recovery of waste materials also a priori alleviates the burden for the municipal authorities. In this case, would it not be possible to consider practices involving their
1 The Waste Framework Directive 2008/98/EC of 19 November 2008; Article 4. 2 Cf. for example: C40 2016 p.5, UNEP & ISWA 2015 p.31.
complementarity and/or integration? This line of thought underpins the approaches we have developed in the present report.
1. What public service and what waste valorisation for global South cities?
Managing waste and possibly recovering it raises several questions that are particularly salient for countries in the global South: The notion of “modernising” public SWM services is discussed in order to go beyond the purely technology-centric view. The aim here is to apprehend the question of systemic recycling (rudological approach) by cutting across the traditional formal/informal divide and adopting a metropolitan-scale approach. Lastly comes the need for greater insight into the dynamics created by the dual nature of waste (cf. Debout, Jaglin, Salenson, ed., 2018): between the necessary neutralisation of the nuisance and the valorisation of the economic and environmental resource it constitutes.
Mixed modernities: low-tech and the persistence of recycling activities
The modernisation process afoot in the field of waste management is changing not only the techniques employed, but also the perception of the field itself. It is also present in the evolution of urban societies in the global South, which have now been caught up in mass consumption. The overhaul of the sector does not automatically exclude informal actors, but they find themselves excluded by the “ideology” of modernisation (Florin, 2010a). This ideology is unanimously criticised in the literature. The UN-Habitat report has a pedagogical slant and explains that “’modernization’ does not necessarily mean ‘motorization’” (UN-Habitat, 2010, p.99), while other studies express indignation at the disappearance of some of the world’s most efficient management methods on the pretext of modernisation (Fahmi & Sutton 2010). The term “modernisation” is also employed to denote a social, political and cultural paradigm shift. The concepts of “mixed modernities” (Spaargaren et al., 2005), or “modernised mixtures” (Scheinberg et al., 2011) are useful to describe composite urban services that do not simply imitate a “modern” model applied in high-income countries but rather implement a more appropriate organisation in line with the concerns of global South cities. This view takes an interest in the socio-economic and territorial dimensions of waste management, and not merely its technical aspects. The question of mixed modernities mainly refers to social and territorial innovations that complement the technological innovations traditionally associated with waste management. It recognises usages driven by either public policies or informal practices and which constitute a step forward in waste recycling or reduction. As these practices have been banned in global North countries (for many years, recycling was reserved for the poorest, as re-use and repair were viewed as stigmatising economic misery (Berdier & Deleuil, 2010)), it is important to understand the role of these practices – here considered as innovations – in the functioning of waste management in global South countries. They are at odds with a purely technologist vision of waste management. Low-technologies are becoming social alternatives to “high-tech” (Bihouix, 2014) as they are particularly well-adapted to low-income countries. Composting and the “economy of resourcefulness” (économie de la débrouille, Ayimpam, 2014) are seen as genuine waste management tools. This change in approach is especially interesting given that these innovations are also coming back into fashion in global North countries (Durand et al., 2019).
Undoubtedly, from a historical perspective, the situation of recovery in today’s global South differs markedly from the rag-collecting found in European cities at the end of the 19th century. When rich countries began to institutionalise their waste management from the 1970s on, the informal recovery sector had ceased to exist. The sector had disappeared not only because it was prohibited by public authorities, but also due to economic and industry-related factors. The late 19th and early 20th centuries were characterised by the industrial revolution and the discovery of deposits of virgin materials planetwide: rubber, cellulose, oil, coal, etc. At the beginning of the 21st century, the situation is totally different: the virgin materials used to feed modern industry are becoming depleted. Exploiting these deposits is increasingly costly and, at the same time, global demand is growing. Due to the higher cost of virgin materials and greater environmental awareness, waste materials recovery has now become a strategic sector of intervention. And a global market for the extraction of secondary raw materials has now emerged (Cavé, 2013).
Deploying a systemic approach on the scale of territories and recovery channels
Although studies advocating the recognition of wastepickers are readily found in the grey literature, none give a precise description of the entire informal recovery and recycling channel. Clear reference is made to itinerant waste buyers, junk shops, middlemen and industry, yet nothing is said of their interactions or their operating logics. The authors of the UN-Habitat report state that “the poor are subsidizing the rest of the city” (UN-Habitat, 2010, p.138). But are all the actors in the recovery and recycling sector poor? The informal recovery and recycling sector as a whole has been amply analysed. However, no study assesses the activity of the other links in the chain. More specifically, experts show only marginal interest in the actors who buy waste from users. The GTZ reports on India and Egypt mention “itinerant buyers” (kabari) or “roamers” (sarriiha), but devote barely half a page to them. Yet, this activity is worth exploring as, in many cases, these buyers help to encourage effective waste sorting in global South cities: “In many low- and middle-income cities, itinerant waste buyers are already collecting – and paying or bartering for – source-separated materials door to door, often making a small payment based on weight; in this sense, an ‘incentive system’ to encourage separate collection already exists and could be built upon” (UN-Habitat, 2010, p.175). Finally, no report explains the precise socio-economic impact of this link, which remains vague and is dubbed “industry”. All we find is a passing mention: “Many development projects…treat picking as a disembedded phenomenon, separate from the local and global economy that produces waste” (Scheinberg & Anschütz, 2006, p.257). The impact of the national or global economy on the volume of activity in urban waste recovery has not been studied. This blind spot makes it difficult to build a dynamic view of the sector, as the reports do little more than sketch out a static picture. Published reports consistently show insufficient knowledge on what happens in the downstream sub-sectors of recycling or, in other words, the steps that follow waste recovery and recycling. Our research has thus focused on understanding these processes in order to identify the main actors and how they operate. We have drawn up a typology of the different sub-sectors, from the selective collection stage to the conversion of waste into secondary materials, whether this involves local traders, wholesalers, industry or artisans. The main difficulty is the fact that, most of the time, informal and informal actors are intermingled in the recovery and recycling chain.
For our analysis of each of the six cities, we sought to spatially delimit these sub-sectors and also quantify their waste streams whenever possible. This method allows the fraction of waste stocks diverted through recycling to be assessed, compared to landfill waste. In the literature, the term “system” is used indiscriminately as a simple synonym for “arrangements”. Management mechanisms, whether formal or informal, are all viewed as systems: “conventional engineering systems” (Furedy, 1992), “a modern waste management system” (Wilson et al., 2006), or “the Zabbaleen system” (Fahmi & Sutton, 2010). In fact, the aggregate of these arrangements, with the municipal service at its core, is also considered to be the “waste management system”: at times “official” (Furedy, 1992; Gerdes & Gunsilius, 2010), “municipal” (Baud & Post, 2004), “modern” (UN-Habitat, 2010) or “integrated” (Baud & Post, 2004; UN-Habitat, 2010). However, the use of “process-flow diagrams” (PFDs) in the UN-Habitat 2010 report helps give us an overview of the flows of post-consumption materials in an urban environment: “all parts are related to one system” (Scheinberg, Simpson, Gupt et al., 2010, p.30). 1 We thus suggest reserving the term “system” to denote all of the waste management “mechanisms” (formal and informal, public and private) at the city scale. Although the literature includes frequent references to “integrated solid waste management” (WSP, 2008; Shekdar, 2009; Coad, 2011), many studies are only interested in collection and make no mention of the downstream parts of the chain (processing, landfill) or focus on disposal without studying recovery and recycling. The concept of integrated waste management is foregrounded, yet the fundamental question of merging a “modernised” municipal service with private recovery and recycling channels is barely addressed and all too often reduced to a dichotomy between large private operators and small wastepickers. To understand the interactions between waste disposal mechanisms (official) and recovery and recycling mechanisms (often non-governmental), we chose to adopt a “systemic” perspective and observe all the links in the chain.
1For a presentation of the process-flow diagram methodology, cf. UN-Habitat, 2010, p.31–35).
Figure 10.
Synoptic overview of solid waste management in Europe
The steps of urban solid waste management in France
Figure 10 gives a simplified view by waste recovery or disposal channel:1 The waste deposited in household waste recycling centres is for the most part destined for specific channels. A large share of the waste is collected under Extended Producer Responsibility schemes (cf. below), i.e., financed by the producers of the product that creates the waste. Organic wastes from selective collection channels are recycled through biogas recovery or composting. Bio-mechanical treatment allows the composting of the organic fraction of non-segregated household waste, or the sorting of organic material in view of biogas production. Dry wastes from selective collection are valorised by recycling, i.e., after transformation, reintroduced as inputs into industrial value chains. Mixed waste (residual household waste) is either incinerated or landfilled. In the case of incineration, the furnace residues consist of fumes (requiring treatment), clinker and MSWIR2 (requiring landfill). All the channels thus ultimately depend on the final disposal facility. Landfills produce leachate (residual liquid requiring treatment) and biogas (to be flared or converted into usable energy).
Waste: a valuable resource or a cost?
1 A channel (or chain) can be defined as “an ensemble constituted by the successive steps involved in making a product that is linked by a flow of exchanges…and [which] includes all of the enterprises and other actors that contribute to the elaboration of a product or to the valorisation of a raw material, from upstream to downstream” (Plauchu, 2007 in Bahers, 2012). 2 MSWIR: municipal solid waste incinerator flue gas cleaning residuals result from the neutralisation of polluting acidic gases using reagents such as lime or soda. MSWIR are highly toxic and require a specific treatment process.
As underlined by Gérard Bertolini, one of the first social science researchers to take an interest in waste, collection is connected to the waste disposal function and a public service, whereas recovery and recycling correspond to the objective of valorising waste and to industrial and commercial value chains (Bertolini, 1992). Public authorities very often find it difficult to combine these two aspects of waste management (UNEP, 2013). Likewise, experts often recommend integrating organised wastepickers into the municipal service but very seldom specify how to formalise them. The linkage between recovery and disposal stems from the fact that what is not recovered must be suitably disposed of. Yet, as G. Bertolini points out: “recovery is selective and extensive (it skims off the best of the waste stock), whereas collection-evacuation needs to be exhaustive” (Bertolini, 1990, p.96). As these two logics exploit the waste stock in different ways, fostering their complementarity is no easy task. In the case of selective collection, it is even less easy to demarcate the frontier between the two. In the global North, the waste sector was originally approached from the angle of a public service operating in the general interest. A change has now intervened that leads us to pay increasing attention to the other side of the coin, the commodity side (profitable service), as the sanitation expert, T.T. Ta, explains: “Today, waste management is going through a period of transition between former practices based on the concept of public service and future developments more tightly linked to industrial constraints” (Ta 1998, p.12). In global South cities, the linkage between waste recovery and industrial activity is often taken for granted, whereas the public service side struggles to operate effectively. Above all, the articulation between the two raises problems: “while the commodity value of materials is taken for granted, the service aspect of recycling is relatively new everywhere” (UN-Habitat, 2010, p.2). In other words, given the cost that secure landfilling now incurs, it seems economically opportune to divert part of the waste stream into recycling and recovery channels. Figure 11 below shows this methodological choice which assigns a dual-entry to waste depending on the value it may have in certain cases, or on the cost that its removal and disposal incur in other cases.
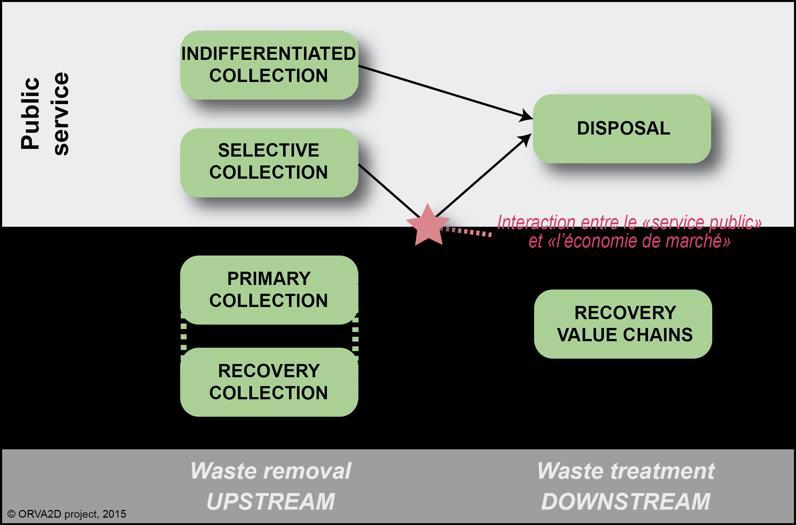
Figure 11. Waste – between a public service and a market economy
This figure can be read in both directions:
On the vertical axis: the public waste management service is generally structured around mixed waste collection upstream and the controlled disposal of final waste downstream. Market economy mechanisms come into play, ranging from the recovery of recyclables upstream to waste valorisation chains downstream. On the horizontal axis: recovery mechanisms are deployed at source, that is, further upstream than mixed waste collection. Downstream, controlled landfill is the terminus of the management system. The landfill site is intended to receive the rejects from the waste valorisation chains. In this diagram, the position of selective collection is unclear as it removes waste as a public service while at the same time giving it value through the market economy. It is thus the link between both approaches. Although implemented as a public service, it needs to be deployed upstream, like commercial recovery mechanisms. The situation is the same for primary collection, which removes household waste for a fee whilst also getting rid of the collected waste, thereby fulfilling a public cleanliness service (albeit a very limited one, as it is restricted to the neighbourhood paying for the waste removal). The challenge of reconfiguring the sector could be, first, to encourage service providers to develop efficient recovery and recycling mechanisms; then, to incentivise informal private recovery actors to adopt a service-provision approach. This is the approach advocated by international experts to integrate the informal sector into the municipal solid waste management services (cf. below). Our analysis will pay careful attention to this issue.
Segmentation of the urban waste stock
The dual nature of waste – i.e., waste that requires setting-up a public service (rubbish) and waste that can be diverted into the market economy (recyclables) – can be shown in more detail depending on the different types of material. Some materials have a certain value and these values have been summarised in the 2010 UN-Habitat report. The authors attempt to characterise the urban waste stock according to the potential valorisation of the different categories. For this, they drew on a previous report (VNGI 2008).
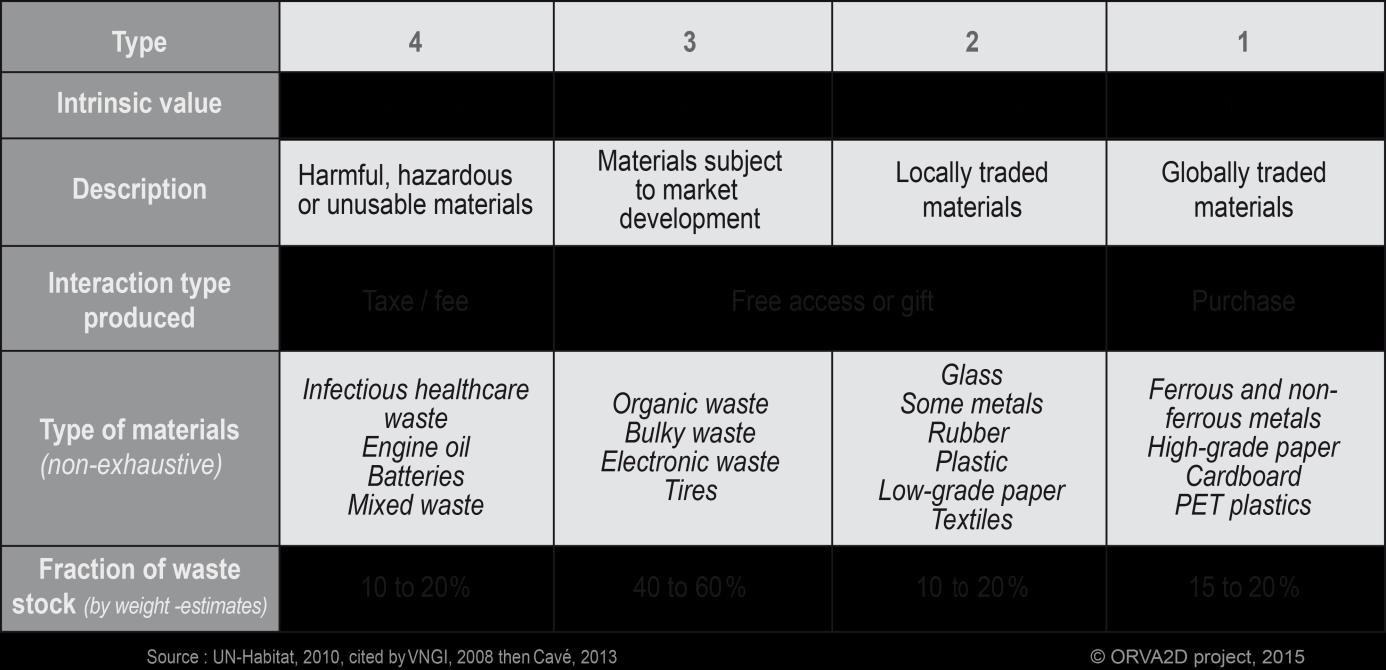
Table 2. Proposed segmentation of the urban waste stock
This typology goes beyond the binary distinction between “refuse” and “resources”. The urban waste stock is split into four types of materials with more or less similar characteristics. Type 1 designates the most lucrative materials, which account for 15–20% of the waste stock and are already segregated by actors in the recycling chain. At the other end, Type 4 waste corresponds to materials with a negative value. In addition to toxic waste, the mixture of heterogenous materials also produces a mass of unusable waste (“mixed general waste”). In between these poles are two intermediate types of waste that seem less well defined: the related activities have no clear connection to market transactions or to a public service. They involve a variety of recycling channels that could be developed in order to reduce the amount of landfilling. In fact, despite the high level of informal recycling activities, many types of waste that could be valorised are not recovered by anyone. This “underbelly” (50–80%) of urban waste stocks corresponds to waste that is technically recyclable, but only under certain conditions, which are clearly unfulfilled. Currently, the cost of recycling this waste exceeds its market value and, without help from support mechanisms, only a small fraction of the waste streams can acquire a positive economic value (Le Bozec et al., 2012). The percentage of compostable waste in Type 3 has a particularly high potential for valorisation. In a recent study of six cities in the global South, organics are identified as offering the best opportunity for diversion, representing on average 45% of the waste stock (Scheinberg, Simpson, Gupt et al., 2010). However, the (agricultural) outlets are far from urban centres and farmers are rarely willing to pay for an organic amendment of uncertain purity to spread on their fields.
The value of materials in the waste stock is in no way intrinsic. The value of a material, its status between rubbish and resource is dynamic, variable and contingent. It chiefly depends on the prevailing technical and economic conditions: if a treatment process is developed for any item in Category 4, the item will then move up the hierarchy. And its integration into the market or industrial value chain is not a lasting certainty: a material can attain the status of commodity, then be demoted – at least temporarily. Conversely, it is not easy to predict which material will move up the hierarchy, or when. All depends on the industrial outlets available, but these can spring up or disappear within a short period of time. Here, the value of objects appears as a contingent – not intrinsic or constant – property. The dynamic of the sector causes the value to fluctuate: “this is why what is waste today will not be waste tomorrow and why what was, common-sensically, waste yesterday is now incorporated as an economic ‘sector’” (O’Brien, 1999, p. 278).
2. Crisis-driven innovations
Innovations often stem from the initiatives of local NGOs – sometimes dating back 10 or 20 years – to provide direct support to a neighbourhood or village. What is totally new, however, is that since 2010 these initiatives have been adopted by (local or national) public authorities with a view to mainstreaming them, be it the integration of informal recyclers in Latin America, primary collection and composting in Africa or community-based management in South-East Asia. Crises and disasters are often what kick-start changes to the waste management model chosen by municipal authorities . These exceptional events are vectors of change given their human, material and/or financial impacts. They create (or reveal) new sensitives in public opinion and in the eyes of policy makers. As a result, the often high (financial, cultural, political) costs incurred by a change of model suddenly appear more acceptable.
Figure 12.
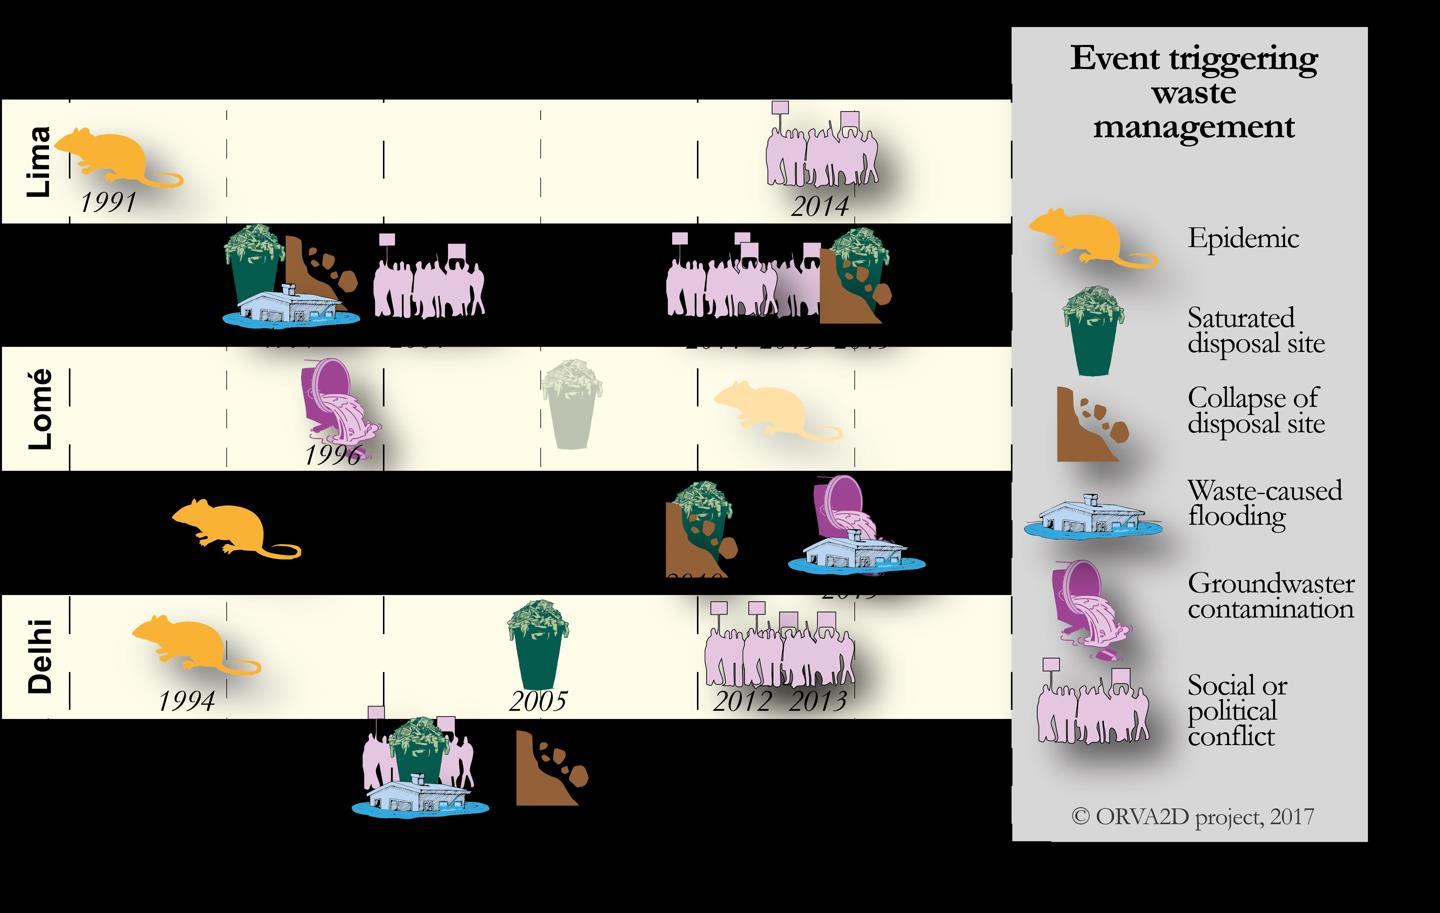
History of events that triggered waste management policies
Recurrent epidemics justify the priority set on health
Health crises linked to waste are frequent occurrences. Some are recurrent and small-scale, others are dramatic and short-lived. Peru experienced a major cholera epidemic in 1991 that affected 1% of the country’s population (Boutin, 1991). In its wake, the country rolled out a major policy on sanitation which led to the law that launched the first waste management actions in 2000. Plague epidemics broke out in 1994 in India and in 1995 in Madagascar, but it was not until 1999 (Madagascar) and 2000 (India) that these catastrophes gave rise to laws designed to resolve the problem. Other smaller-scale epidemics occur in the vicinity of wild dumps and disposal sites. Every unsupervised dumpsite is a source of respiratory, skin or gastric infections. A case in point is in Lomé, where the Agoé landfill, which opened in 1996 (closed down in 2018), is today in the heart of the urban zone. It directly contaminates the Agbetekpé and Sorad neighbourhoods located between the municipal disposal site and a swampy area that serves as an illegal dump. The residents regularly contract diseases such as “cholera and diarrhoea”1 (Bodjona et al., 2012). This medium-scale but chronic contamination is mainly due to the proximity of the groundwater aquifer used to supply water to nearby districts. In Madagascar, the neighbourhoods bordering the Andralanitra dumpsite, particularly the informal villages built by
1 Information confirmed by the residents during the ORVA2D research project surveys. What is termed “cholera” are in reality very severe gastric illnesses.
Father Pedro1 as well as the textile factories in the free zone, are severely impacted by uncollected methane emissions and by the wastepickers’ practice of burning rubbish to reduce the volume of waste unsuitable for resale. Moreover, the site’s leachates are drained off into the surrounding rice fields.
Saturated dumpsites causing landslides and flooding
The second type of event that strongly influences public opinion is the saturation of disposal sites and its consequences. Almost all sites in the reference cities have reached the end of their useful life and now face the problem of available space. Also, mounting social pressure, even from the poorest communities, now opposes siting or maintaining this type of infrastructure close to residential areas. The most emblematic case of saturation is at Doña Juana in Bogotá. This controlled landfill built in 1988 to centralise all the municipal dumpsites partly collapsed in 1997. Other landslides followed, the last in 2015, each time obstructing and contaminating Tunjuelito River (which also receives some of the city’s wastewater) and causing flooding. The riparian communities are largely affected by these events. The landfill site, initially designed for 47 million m3 of waste, now exceeds 200 million m3 spread over 594 hectares. 2 It is equipped with leachate and biogas recovery systems, but the facilities regularly malfunction. However, Bogotá municipality has little leeway regarding the construction of a new site as the neighbouring municipalities refuse to accept waste from the capital.3 In 2012, the city hall thus rolled out a proactive waste policy dubbed “Bogotá zero-waste”.4 The policy aimed to divert certain waste streams but, as will be seen later, the “zero-waste’ concept is only superficially grasped. Other disposal sites have not collapsed but simply spilled over for want of space, blocking nearby waterways. Wild dumpsites are often found along waterways as their banks are often unbuilt and part of the waste is flushed into the river during high-flow periods. In addition to severely contaminating water resources, these obstructions also cause flooding with potentially serious impacts. This was the case, for example, in Surabaya in 2001 and Antananarivo in 2014 and 2015. In Antananarivo, the city authorities focused on the problem of urban cleanliness, sometimes neglecting the issue of the municipal dumpsite as a final sink. A retaining wall built in 2010 helped to curb the sprawl of the dumpsite but failed to solve the problem of saturation. It actually caused a build-up of waste that spilled over the wall (destroyed by a landslide) towards the nearby waterway. As in other situations, the establishment of a sanitary landfill has encountered opposition from adjacent municipalities. In Surabaya, this problem was solved by the construction of a new landfill site in 2001. This was the year that the city experienced a major crisis. Following complaints from residents in the area, the court decided to suddenly close the Keputih disposal site, with no fallback solution. In no time, the city and its waterways were strewn with enormous “floods of waste”.5 The new Benowo landfill was hurriedly opened three weeks later and gradually brought up to standard. This event had a strong impact on public opinion and laid the ground for a highly proactive and participatory waste management policy.
1 Father Pedro Opeka, a Catholic priest, founded the Akamasoa Charity in 1989 and is known for his fight against poverty in Madagascar. 2 Visit of 18 February 2016 accompanied by Igor Dimitri Guarinan, an officer from the UAESP (Unidad Administrativa
Especial de Servicios Públicos – Special Administrative Unit for Public Services). 3 Field survey conducted under the ORVA2D research project (Rateau & Estrella Burgos, 2016). 4 The term “zero-waste” disappeared in 2016 with the arrival of a new mayor, but the main lines of the scheme are still in place. 5 Term used by the local press.
In Delhi, as existing dumpsites were saturated, a fourth (controlled) site was opened in 2012. However, instead of the 600 hectares required for the site, only 60 hectares were found to landfill the waste. This new infrastructure thus failed to solve the problem of the first three dumpsites, which should have been closed down in 2005, 2006 and 2008 respectively. In Lomé, a new landfill was opened in 2017. Sited 23 km from the city centre on sparsely populated land purchased by Lomé municipality, it will face the challenge of tackling exploding service production costs due to the haul distance to the disposal site and the remuneration of the private operator.
Social and political conflicts: a new driver to improve waste management
Epidemics and the saturation of disposal sites are recurrent problems in all cities of the global South. But another type of event increasingly acts as a trigger for the renewal of waste management policies: social protests. These protests mobilise residents, environmental movements or waste management workers, demanding the shutdown of a disposal site or incinerator, or access to a waste stock. These movements are intensifying not only because the public is becoming more aware of the harmful impacts of waste, but also because powerful economic stakes are crystallising around waste as a commodity. A case in point is Surabaya in 2001 when residents living near the existing disposal site obtained a court ruling that forced its closure. The shutdown caused a health crisis over several weeks but, more importantly, it spurred the crafting of a new public waste management policy. In Delhi, complaints were filed after the construction of a new landfill site that was too small to absorb the city’s waste streams. The Supreme Court then ruled in 2013 that it was crucial to identify new sites for the construction of other landfill facilities.1 Although this court ruling has not yet been enforced, it has exerted pressure on the municipalities to find alternative solutions to divert waste streams. A last example of citizen mobilisation that led to a significant change in waste management is the Colombian experience. Propelled by the energy of their representative Nora Padilla, Bogotá’s informal waste collectors, who had long been self-organised, successfully spearheaded a change in the municipality’s service provision policy. 2 After protracted legal proceedings from 2003 to 2011, the municipality was ordered to oblige the companies providing waste collection services in six defined city sectors to work together with informal actors Political conflicts also frequently arise, notably when municipal governments change. New mayors sometimes question the contracts signed by their predecessors, which leads to conflict between the city hall and the provider. The unpaid company thus ceases all collection services, generally without prior notification, as in Bogotá in 20133 or in Comas and Villa-Maria-delTriunfo (Lima) in 2014. 4 This may have long-lasting repercussions – going as far as the removal of Bogotá’s mayor.
1 http://www.dailypioneer.com/city/ddas-new-landfill-sites-rejected.html 2 Rulings of the Constitutional Court no. 268 of 2010 and no. 275 of 2011. 3 http://www.semana.com/nacion/articulo/cronologia-de-la-destitucion-de-gustavo-petro/380872-3 (page consulted
March 2016). 4 Resolution 141-2014/DIGESA/SA, of 12 December 2014, signed by the General Directorate of Environmental
Health, Ministry of Health, Peru.
3. Comparing the socio-technical innovations of six global South cities
Our reflection was conducted with respect to how public waste management services have evolved, taking into account socio-environmental crises on the one hand, and the acceptance of budgetary constraints on the other hand.1 The objective is to analyse how innovations –generally spurred by informal practices – become integrated into municipal management in six cities in the global South. Having ascertained that mimetically reproducing the management policies of North countries leads to an impasse (cf. Chapter 1), the authorities often decide to rely on local dynamics, even when these are informal and a priori illegal. This leads to innovative experiences and is clearly the case in the cities studied: Lima and Bogotá (Latin America), Lomé and Antananarivo (Africa), and Delhi and Surabaya (Asia).
Cities with diverse public policies
The reference cities were chosen firstly on account of the innovations they have prioritised for managing their waste, and secondly due to their different profiles (size, level of resources, etc.). Their sizes vary but all of them have over a million inhabitants in their metropolitan area, with varying levels of wealth and contrasted modes of local governance. This sample of cities is justified as some 40% of city dwellers live in cities with over one million inhabitants (Véron, 2007) and most of the world’s city dwellers live in global South cities. The processes studied are thus relatively representative at a global scale. However, the metropolises selected vary in size in order to allow for an assessment of their different realities in terms of waste management. We thus find three medium-sized cities (Lomé, Antananarivo and Surabaya), two metropolises (Lima and Bogotá) and one of the world’s largest cities (Delhi), with different constraints to manage the whole of the metropolitan area.
1 This report is the result of the research project, ORVA2D (Organisation de la Valorisation des Déchets dans les villes en Développement), funded by the Research department of AFD (Agence Française de Développement), headed Le Mans University (UMR ESO CNRS) and implemented with the support of Gevalor association and consultants from Urbanalyse and ALBWaste between 2014 and 2018. http://esolemans.cnrs.fr/fr/recherche/programmes-en-cours/projet-afd.html
Map 1.

Population size of the reference cities
All of these cities are the political and economic capitals of the countries concerned, except for Surabaya, which is Indonesia’s second largest city. In Peru, Togo and Madagascar, the capital is by far the most populated and most dynamic city, concentrating most of the country’s economic activities and thus producing most waste. In Colombia and India, although the capital is dominant, other large cities populate the urban landscape, as is the case in many emerging countries.
A comparative research methodology
The ORVA2D research project, which undergirds this report, aims to collect and analyse information on the specific features of solid waste management in global South countries. While the technical and environmental aspects were considered, the main thrust focused on the organisational, economic and financial aspects so as to understand the conditions that enable the functioning of SWM in each case study. In line with this objective, the methodological work involved designing an original investigation kit to ensure the parallel alignment of data collection in the six fields so that restitution would be complete and homogenous. The investigation comprises information collection files on i) solid waste management, ii) the budget for the service provision and its financing, and iii) socio-institutional data. Collecting data directly in the field, in close collaboration with local stakeholders (municipalities, NGOs, universities), meant that the empirical data was often heterogeneous, incomplete and sometimes the result of secondary estimates that needed to be relativized (e.g., when calculating the waste collection rate – cf. Box 1). We thus only kept data judged to be sufficiently reliable for use in comparative analyses.
Methodology – Measuring collection rates
The waste collection rate is estimated on the basis of figures provided by the municipalities. It gives the ratio between the estimated generation of waste per capita and the quantities of collected waste. These figures involve a significant degree of uncertainty.
Waste collection figures are estimated by volume, but the waste is not really weighed. In several cities, there is no weighbridge at the entrance of the disposal site. The estimate is based on the number of trucks and thus the incoming volume.
Waste generation figures are highly uncertain. The age of the waste sample and the place where the characterisations are made call for caution regarding the estimated waste tonnages generated by residents. The number of inhabitants in the city is not always known with certainty. Finally, the greatest uncertainty lies in the fact that household waste is mixed with wastes “of a similar nature”. Although we are able to know what waste an average consumer generates (relativized depending on the district’s level of affluence), it is much more difficult to know what is discarded by enterprises (commerce, artisans, industries). 1 Enterprises may use a private operator to manage their waste, call on informal recyclers for some materials, or discard their waste on the street for kerbside collection by the municipal service, but which of these three methods they choose is not monitored.
Likewise, it is difficult to estimate the share of waste generated by the inhabitants of peripheral municipalities who spend part of their day in the urban centre.
A distinction should also be made between the collection rate for waste collected2 by the municipal service and the coverage rate3 of the population served by the same household waste collection service. The latter is generally higher since almost all the inhabitants of the urban areas have access to a collection service, even though waste-burning practices and wild dumpsites impair the service’s performance in terms of the waste collected. In addition, it is difficult to obtain information on the effectiveness, frequency and proximity of this collection service, which can also adversely impact the rate of waste actually collected.
Economic analysis: estimating the costs of the different steps
The data analysed in this report are largely based on an economic and financial analysis of the six case studies. The economic analysis rests on the concept of production cost (operating and capital expenditure), determined for each stage of the waste management chain: collection, transport, and processing (Le Bozec, 2008). This production cost corresponds to the cost of the technical production factors involved in performing a service (collection, transport and/or disposal). It is calculated using a method that allows for its replication in different contexts and for a crosscomparison by activity for the reference cities (cf. detailed presentation of this methodology in Appendix 6). An estimation of production costs enables the cost drivers to be identified and thus the possible levers to control these costs. Depending on the context, two separate methods were applied. For Lima, Bogotá and Surabaya, thanks to the availability of municipal budget data, the fullcost accounting method was used. For Lomé and Antananarivo, the costs were reconstituted
1 The same difficulty exists to a lesser extent in France. 2 The quantity of waste collected compared to the quantity of waste generated. 3 The number of inhabitants served by the service compared to the total number of inhabitants.
using the production-factor and unit-cost method, trucks, premises, etc.1 on the basis of in-situ observations: staff,
The expenditures on waste management in the reference cities were collected using an economic–financial sheet and the data were exploited using the method described below. The waste taken into account by the municipal authorities varies depending on the city. The common designation “municipal waste” encompasses not only commercial, industrial and institutional waste, but also (with almost no detail on the volume collected) waste from households and street sweeping or cleaning. Waste from green spaces and even construction debris are sometimes deposited at the same disposal site. Public health concerns are a priority for decision-makers as long as they do not directly affect the smooth running of the processing facilities. The scale of the service provided also depends on the role accorded to the informal sector: the municipal authorities either tolerate it or take a proactive approach to integrate it. This is particularly the case for waste collection from households in neighbourhoods difficult to access and where door-to-door removal is not provided. The scope of the service thus varies with the context. The objective of the data collection in the six case studies was to find out the service provision costs and the financing method, notably the charges applied to service users. Accessing the data proved complicated (in Lima, Bogotá, Surabaya), difficult (in Antananarivo, Lomé) and impossible (in Delhi). This was for several reasons: the absence of technical and financial monitoring of the service activities managed by the municipality, service performance by companies reluctant to show their accounts, the absence of a separate waste budget and the lack of transparency on public accounts. Data collection relied on two different approaches: - The cost accounting method for budget analysis. Depending on the information available, the expenditures recognised for service performance are recorded by category of management activity (collection, transport, treatment) in application of the Full-Cost Accounting (FCA) method in the United States or “Comptacoût” in France. This method was chosen for the cities Bogotá, Lima and Surabaya. - The production-factor and unit-cost method. When no budget or available data exist, this method allows the costs to be reconstituted on the basis of known factors (staff, vehicles, waste recipients, etc.) and their respective unit prices. This method was used for Antananarivo and Lomé. 2
Finally, the cost of service provision is an accounting cost determined by the authority that organises the waste management service (generally, the municipality), which records expenditure on service provision in an administrative account or profit/loss account. The cost of service provision includes production costs for the different activities of collection, transport and treatment, the financial cost of loans and the organising authority’s general administration costs. The latter costs include all the expenses for accounting, communication, meetings, billing and debt recovery.
Comparative analysis of municipal expenditure on service provision
1 In Delhi, we were unable to strictly apply any method due to a lack of systematic information. The scant economic data concerning Delhi are thus very imprecise estimates based on the small amount of data available at city scale. 2 The absence of structured data in Delhi precluded the reliable application of either method. Here, only fragments of the scattered information will be reported.
To compare the amounts of expenditure on service provision across the different cities, we show the per capita expenditure for service provision and the gross national income (GNI) per capita, both expressed in the countries’ local currency. These expenditures on service provision are then expressed in €/cap./year (Table 3). As a point of comparison, the expenditures on municipal waste management and cleaning in France represent 0.54% of gross national income per capita (ADEME, 2016).
City
Bogotá Lima (Surco) Lima (Comas) Lima (VMT) Delhi Surabaya Antananarivo Lomé
Expenditure on service provision per capita (local curr.)
61 305 64 17 16 511 74 612 1 935 3 784
Country’s GNI per capita (local curr.)
10 784 633 14 843 14 843 14 843 80 517 33 734 010 810 628 188 399
Expenditure/GNI (%) Human Development Index 2015
0.57 0.43 0.11 0.10 0.63 0.22 0.23 2.00 0.720 0.734 0.734 0.734 0.609 0.684 0.510 0.484
Table 3. Expenditure on service provision
Source: Data collected from the municipalities between 2015 and 2016, World Bank, 2015
In the city of Bogotá and the affluent district of Surco in Lima, the cost of waste management is relatively close to that in France (0.57 and 0.43 respectively). This figure is higher in Delhi due to the high cost of waste incineration and the inclusion of expenditure on wastewater disposal and treatment in the waste budget. In the other districts of Lima, in Antananarivo and Surabaya, waste management expenditures are lower (from 0.10 to 0.23). This should be viewed in the context of the population’s lower level of development and a lower GNI, which only accentuates the difference in absolute value. Most of these cities thus have to ensure effective waste management even though they sorely lack funds. The case of Lomé raises most questions as the financial burden of waste is four to eight times higher than for the other cities. We had already taken note of the high budgets in Lomé, particularly the very elevated collection costs. Yet, this cost does not signify that the collection is more efficient, given that the collection and recovery rates are no better than elsewhere.


