SURVEYING SPATIAL
PROJECTS, PLANS AND DEVELOPMENTS

HEALTH NZ CENTRAL
PLANT & TUNNEL
MAPPING THE PLASTIC WHAT MAKES A GOOD STREET?

HEALTH NZ CENTRAL
PLANT & TUNNEL
MAPPING THE PLASTIC WHAT MAKES A GOOD STREET?
From regional developments to urban infrastructure projects, New Zealand has some significant developments underway at the moment with some forward-thinking concepts that are shaping the communities we live in and the future development landscape.
From transportation services to housing developments, flood protection and stormwater management systems, environmental protection projects and planning urban infrastructure for future growth, our surveyors and spatial specialists are contributing to critical plans, regulations and developments around the country that strengthen our resilience and ensure we are better placed to weather the future challenges of climate, population and environmental changes.
In this Autumn edition we’re focussing on projects, plans and developments, taking a look at some
of the new developments, projects and updates, underway in New Zealand and on the international stage right now.
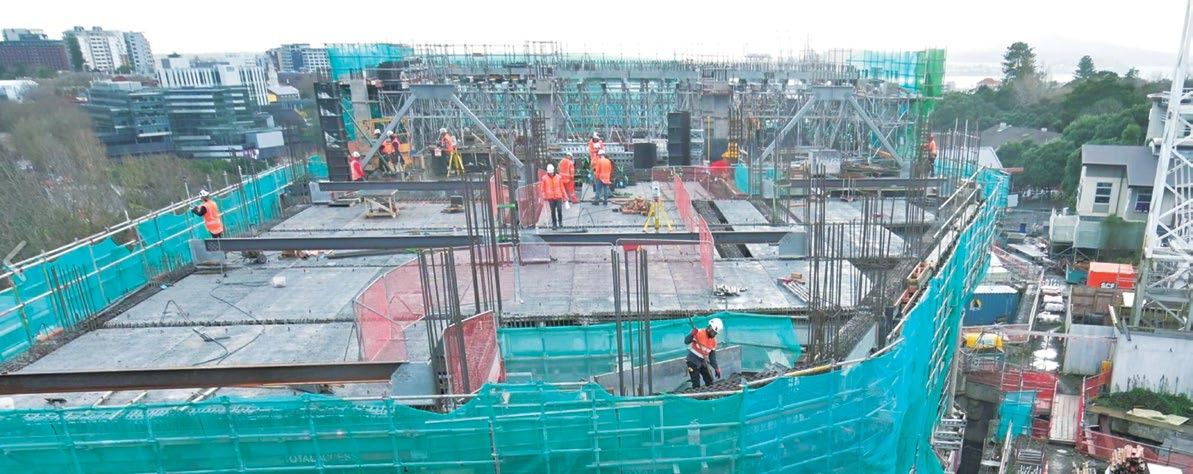
From McConnell Dowell, Survey Manager Daniel Wiederkehr examines the challenges of the construction and development of Auckland City Hospital’s A40 Central Plant and Tunnel Project, with its 240m-long service tunnel connected to a five-storey superstructure, this essential service development is scheduled for completion later this year.
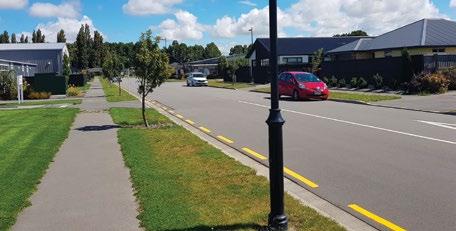
Abley’s Technical Director of Transportation Engineering, Jeanette Ward outlines the concepts and design processes of what makes a good street from practical considerations, functions to frameworks that ensure better assessment and design.
Following on from 2019’s initial Survey +Spatial article on Mapping the Plastic, FIG (International Federa-

tion of Surveyors) Working Group 4.3 members Simon Ironside, Gordana Jakovljevic and Naa Dedei Tagoe present an updated account on this significant international project. The complexities of unit title developments and its communities is the topic of this edition’s legal column. And finally in our Uni Happenings column, Richard Hemi discusses the next generation of surveyors as the graduation recruitment programme approaches. •


SURVEYING+SPATIAL
ISSUE 119 AUTUMN 2025
A publication of Survey and Spatial New Zealand, Tātai Whenua. ISSN 2382-1604
www.surveyspatialnz.org
EDITOR
Rachel Harris surveyingspatial@gmail.com
All rights reserved. Abstracts and brief quotations may be made, providing reference is credited to Surveying +Spatial. Complete papers or large extracts of text may not be printed or reproduced without the permission of the editor.
Correspondence relating to literary items in Surveying+Spatial may be addressed to the editor. Papers, articles and letters to the editor, suitable for publication, are welcome. Papers published in Surveying+Spatial are not refereed. All correspondence relating to business aspects, including subscriptions, should be addressed to:
The Chief Executive
Survey and Spatial New Zealand PO Box 5304
Lambton Quay Wellington 6140
New Zealand
Phone: 04 471 1774
Fax: 04 471 1907
Web address: www.surveyspatialnz.org
Email: admin@surveyspatialnz.org
Distributed free to members of S+SNZ. Published in March, June, September and December by S+SNZ.
DESIGN & PRINT MANAGEMENT
GOODHERE – www.goodhere.nz hello@goodhere.nz TO ADVERTISE
Email: admin@surveyspatialnz.org or contact Tara Ranchhod
+64 4 471 1774
119 Autumn 2025
The A40 Central Plant and Tunnel Project will provide essential services to Auckland City Hospital via a 240m-long services tunnel from the five-storey superstructure.
Daniel Wiederkehr, Survey Manager, NZ and Pacific, McConnell Dowell Constructors Ltd
This project encompasses many facets of modern and traditional surveying. Starting with the establishment of an accurate survey control network followed by a traditional total stations set out and as-built surveys, this project provides many survey challenges, above and below the existing ground level.
Auckland City Hospital is a complex stakeholder environment with patients, staff, specialist service providers, emergency vehicles, and a helicopter landing pad all intersecting within a small footprint of Auckland. The project team has taken into
consideration the 24/7 live hospital environment and the wellbeing of stakeholders and have implemented the least intrusive construction methodology on this project. The purpose is a new plant building that will provide and ensure the continuity of essential services including power, water, chilled water, medical gas, diesel, etc.
This is a concrete framed building with precast concrete and glass cladding. The five-storey structure is a building that must be operational immediately after an earthquake or oth-
er disastrous events. The construction is standard apart from the bespoke triple friction pendulum bearings (base isolators) which increases the building’s seismic resilience. The building has deep piled foundations ranging from 7.5m to 26m and includes double-height spaces for the large chiller and generator halls, plus a roof level double-height cooling tower enclosure.
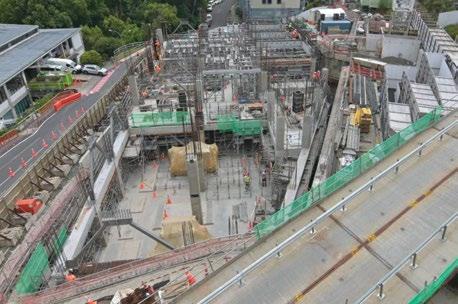
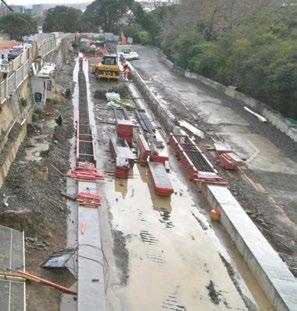
The cut and cover services tunnel has 4m x 3.5m internal dimensions and connects the existing Support Building (Building A01) to Building

A40 and has a short stub extending to the west of Building A40 for future extension. The end state of the stub will provide a services tunnel ring main through the campus. The works include large-diameter retaining piling, bracing, deep excavation, and large in-situ reinforced concrete sections.
We are very fortunate that Auckland City Hospital requested that an accurate survey control network be established back in 2018, being SO 528276, well before we took over the site for construction. This network is of high accuracy and critical precision. It has enabled us to adopt the network as is, after we perform a few checks, confirming the integrity and suitability for this project.
An interesting discovery on our initial research led to even less time spent on the survey control set-up. While the LINZ Geodetic Database website officially issues the height of
3rd order mark details in centimetres only, the signing surveyor in 2018, Malcolm Archbold (RIP), was able to publish his millimetre-accurate reduced levels with a note adjacent to the site photographs.
From these ground control points, we performed countless re-sections (least squares) incorporating new control points, predominantly reflective targets, allowing us to perform the requested set outs and capture all as-built data as required from them.
Currently we have more than 680 survey control points on our Control File. Needless to say, survey control points are regularly destroyed, and new ones have to be re-established.
Sites like this, where risk with detail and accuracy is highly critical, demand constant and precise communications among all teams. On this large project, on a very small footprint, we had up to 180 workers performing their tasks on different levels of the A40 building and cut and cover
tunnel, below ground level each day. The onsite survey team, up to three at a time, were having to make sure that the survey control network is maintained, with the ever-changing demands and the uninterrupted build of temporary and new structures.
In typical fashion, all design data was provided as IFC pdf files. For the spatial location of both, the A40 building and the tunnel, key coordinates of gridlines and chainages were provided.
For the complex set out of the internal details, a tremendous amount of data was provided through the various IFC pdf files, including the civil land and utilities, civil structures, building structures and central plant and tunnel services. As requested, a lot of it is meticulously modelled by the onsite survey team and marked out on site. Unique file and naming conventions are necessary, ensuring that each dataset has its exclusive name, making it easy to correctly identify and find, during this 3.5-year build.
An interesting discovery on our initial research led to even less time spent on the survey control set-up. While the LINZ Geodetic Database website officially issues the height of 3rd order mark details in centimetres only, the signing surveyor in 2018, Malcolm Archbold (RIP), was able to publish his millimetre-accurate reduced levels with a note adjacent to the site photographs.
A large infrastructure project like this comes with a lot of as-built requirements, balances and checks. For most of this project, the typical engineering surveying as-builts are made up of the permanent works only. After the initial post-check of the set-out data, these as-builts document the second survey check that a surveyor performs, comparing it against the design data.
On this project, as part of a supplementary check, we also provided the captured as-built models to the hospital’s BIM modeller company, via a monthly updated dwg file. They then triple checked our captured as-built information against the BIM model.
Due to the complex nature of the internal services throughout the building and tunnel, the hospital’s BIM modeller company will scan the interiors of both structures, modelling all new assets, thus creating a digital as-built model (twin).
At the busiest time of the project, we had five automated total stations permanently placed on site, measuring up to 178 prisms at 1-hour intervals 24/7. This was supported by six inclinometers going up to15 deep, also measuring 24/7.
The instructions from the engineer
On this large infrastructure projects, we had the pleasure of utilising other tools. These were predominantly used by the site engineers, not the engineering surveyors, and included:

Revizto, an integrated BIM collaboration software platform connecting architecture, engineering and construction throughout the entire project life cycle.

Site Hive, a real-time environmental monitoring and management system which delivers an innovative approach to monitoring the onsite controls.

OpenSpace is another tool we use on this site. It provides next-generation 360° reality capture, powerful integrations, and the smartest analytics tools in the industry. One can compare progress between different dates for any location, compare actual footage against BIM model and is excellent for historical records, planning sessions, insurance claims and commercial arguments.
were to observe each prism and or inclinometer up to three times per week. However, due to the complexity of the site, we chose to automate this task. This allowed us to eliminate having surveyors on site three times a week, exposing themselves to the dangers such a site brings with it. It also allowed the site surveyors to focus on data management and the actual field work required. Thirdly, it allowed us to capture and record countless observations, providing us with a much, much denser dataset to identify if any trends were occurring. It also allowed us to disregard any erroneous readings, which we had plenty of due to construction obstructions, with ease.
I am pleased to report that we never had any unexpected alarms, with each prism experiencing displacements within the expected ranges.
I am confident that we will complete this project within budget and on time. The A40 Central Plant and Tunnel teams are the most delightful bunch of professionals I have ever worked with. No matter how tough it gets at times; working long days or elaborating complex tasks, everybody always keeps calm, and no compromises have ever been made regarding health and safety.
Engineering surveyors play a critical role in making sure all the different components and services fit together under the ever-changing conditions. The diverse teams on and off-site work splendidly with each other, fulfilling McConnell Dowell's and Built Environs’ purpose of 'Providing a Better Life'. I am proud to be part of this project and look forward to its completion at the end of 2025. •
Jeanette Ward, Technical Director at Abley
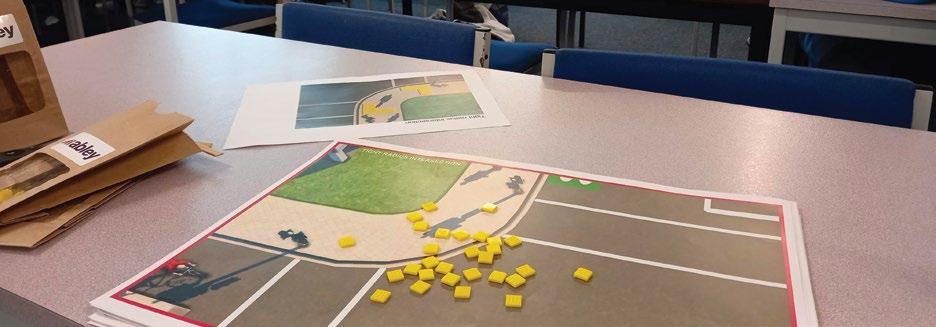
Designing a street involves a multi-disciplinary approach, and surveyors are often part of that process, particularly in the greenfield context. Last year I had the pleasure of talking about this at the University of Otago Survey School as part of a Lunchtime Seminar series. Later that day I joined the 400 Level Urban Design class and talked to them about Universal and Inclusive Street Design, guiding them through several hands-on group design exercises.
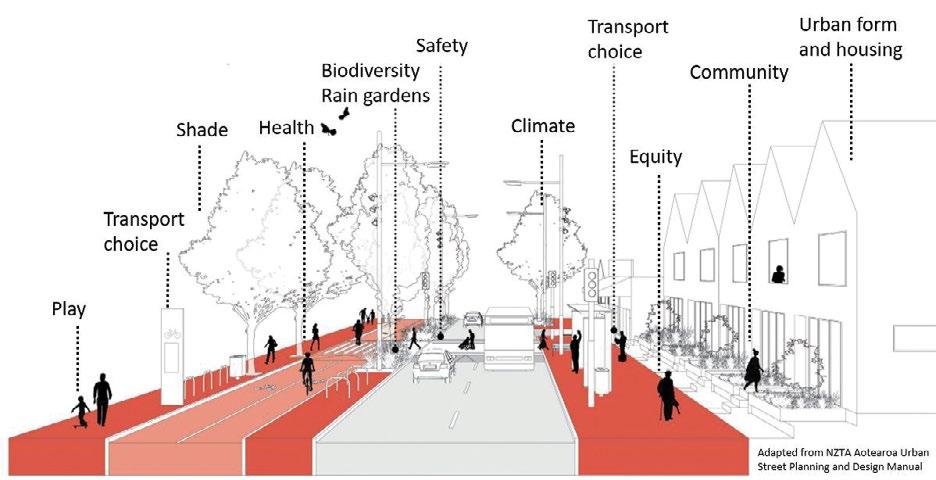
My lunchtime talk focused on what a good design process looks like and ultimately what a good street is. I started by outlining why streets matter. Streets are a public space and fundamentally they allow us to move about. The design of a street gives us the opportunity to create safe, accessible and attractive places that offer transport choice. They also provide other opportunities such as expanding biodiversity, sustainable management of stormwater and improving health outcomes.
I explained the Healthy Streets framework that was developed in London some years ago. The framework promotes 10 Healthy Streets Indicators that can be used to design or assess either existing streets or proposed designs throughout the design process. I like this framework as it encourages us to think about aspects of the street that we don't traditionally think about when creating streets. For example, making people feel welcome and relaxed.
When we think about the function of a street, it can be broadly considered in terms of a ‘movement’ function and a ‘place’ function. In New Zealand, the One Network Framework (ONF) sets out a Movement and Place framework made up of ‘street families’, which have different levels of movement and place characteristics. For example, a Transit Corridor has a higher movement function than a Local Street that has a higher place function than a Transit Corridor. The higher the place function the more people you can expect to be walking, cycling and spending time in the street.
NZS 4404:2010 (Land development and subdivision infrastructure) uses a similar concept, referring to it as Link and Place. Each existing street in New Zealand has been given an ONF classification. Referring to the ONF guidance on expectations for each type of street can inform the design process. For greenfield streets, you will need to work with the local council to determine the street classifications developed under the District Plan road hierarchy or a master plan process, and how these align with the ONF. Before setting out to design a street, it is important to
think about all the people who will be using the street. Start with the people who will be walking or using mobility aids to help them move around. The footpaths, pedestrian crossings and areas for seating are the key street components you need to think about for these street users.


On higher volume streets you will need to provide some priority pedestrian crossings. When there are low traffic volumes and a low-speed environment, not all pedestrian crossings will need to be priority crossings, although when there are land uses such as schools present, you will need to think about how people will be able to safely cross the street, especially during busy times. In the case of schools, children require special consideration for aspects such as their height, making sure they are visible to drivers. Designing for children and mobility impaired people means you are ultimately designing for everyone.
How you design the street for drivers also impacts walking. For example, if you create a large radius corner to cater for the rubbish/recycling trucks, which only visit the street once a week, you will get high-speed turning for other drivers. Instead, a tighter radius corner allows you to create a shorter crossing distance for pedestrians. The rubbish truck tracking across the opposing traffic lane at a slow speed once a week is acceptable in a low volume street given the benefits gained for the rest of the time.
People will also be cycling on streets. Even if you have cycle paths or shared paths through a green network within a subdivision, people still need to get to and from their
houses and other destinations on the street. For streets that provide a cycle route function or have high traffic volumes, you will need to think about a specific facility for cycling. Low volume and low speed streets generally have traffic lanes that can shared by drivers and cyclists, but you need to make sure there are no pinch points created by on-street parking or medians or pedestrian refuge islands.
The width of traffic lanes can impact driver speeds, the wider the street, the faster you are likely to drive. So, when you are allocating space within the given road reserve width, it is important to make sure that traffic lanes are not excessively wide. District Plans often include road design standards; it is important to logically think through the appropriateness of the requirements for the type of street from the start. How you integrate on-street parking in a street’s design is important. If you provide space for kerbside parking along the street and that space is underutilised, it contributes to making the street very wide and hence driver speeds will be higher. Designing parking bays with

1. Aotearoa Urban Street Planning and Design Guide – Provides context and the consideration of movement and place.
2. Pedestrian Network Guidance – Helps with aspects such as footpath widths and crossings.
3. Cycling Network Guidance – Outlines appropriate provision for cyclists.
4. Public Transport Design Guide – Essential for streets with existing or future bus routes.
landscaping between them can help keep the travel speeds down while adding greening to the street, making it more attractive.
There are generally three types of street design projects: rebuilding an existing street (e.g. George Street in Dunedin), retrofitting an existing street (e.g. Gloucester Street), or
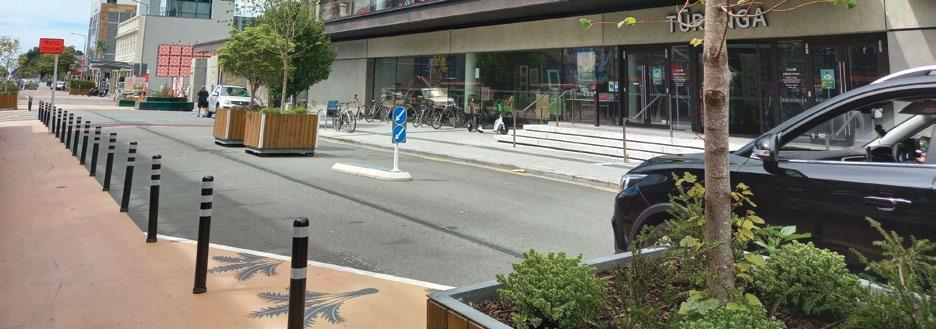
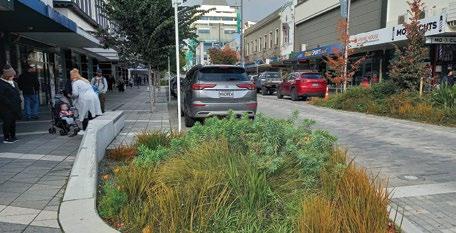
designing a brand-new street in the greenfield context. All three require a multidisciplinary approach and come with different opportunities and constraints. The way we deliver streets – especially in rebuild or retrofit projects – can vary depending on funding available or maybe even the community acceptance of a design. Testing a layout before committing to the permanent design by working with the community, a practice known as adaptive urbanism, can be a valuable approach.
Streets in new subdivisions typically have fewer surrounding physical constraints than rebuilding or retrofitting existing streets. They provide an opportunity to create something that will work well for the community through balancing the movement and place functions and ultimately
creating a Healthy Street.
If you are looking for guidance on street design, some councils will have their own guide or they will refer you to NZS 4404:2010 (Land development and subdivision infrastructure). The NZ Transport Agency Waka Kotahi also has helpful street design resources that are not just for state highways; they are for all streets.
I enjoyed sharing ideas and working with the students that day. I challenged them to think about what makes a good street from a range of perspectives and to apply that thinking in practice. Creating healthy streets for people is both important and rewarding, and I wish them well on that journey. Ultimately all of us should take up that challenge and deliver good streets for our communities. •
By Simon Ironside – sironside@xtra.co.nz

Introduction
Is the threat from plastic really apocalyptic? Surely it doesn’t compare to climate change or a worldwide pandemic. The answer, unfortunately is yes, and it does (Campbell, 2022).
Plastic is everywhere! It affects the daily lives of almost everyone on the planet, in all corners of the globe, and is overwhelming us. The effects of plastic pollution on the Earth’s oceans are well documented, potentially catastrophic and increasing exponentially year on year. The effects on our waterways and coastal environments are equally devastating.
The International Federation of Surveyors (FIG) has formed the Mapping the Plastic Working Group
(WG 4.3) as the international surveying and spatial sciences community’s response to this huge global problem, focusing on the plastic waste transported in waterways and along coastlines, dealing with the problem before it reaches the ocean.
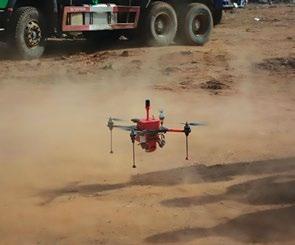
WG 4.3 has successfully developed a method to detect, extract and classify floating and land-based plastic from unmanned aerial vehicles (UAV) captured imagery using deep learning algorithms. Research has determined the optimum relationship between spatial resolution and detectable plastic size, enabling detection of plastic pieces as small as 0.01m² to meet internationally recognised litter
assessment frameworks.
This represents a significant breakthrough, offering a cost-effective technological solution to countries and regions which suffer from plastic pollution to better understand the extent of their problem but due to competing demands on relatively scarce resources have been unable to do so. Accurate knowledge of the problem is a necessary prerequisite to finding its solution, a concept that surveyors, spatial professionals and engineers are well accustomed to.
The WG 4.3 plastic mapping solution is currently being used in Ghana where several communities are severely impacted by the effects of plastic pollution. As part of a programme of remediation work along the country’s coastline, UAV captured imagery is used to classify the type and extent of the plastic and other waste at pre-determined locations. The baseline
pollution loading is assessed from the initial UAV surveys and subsequent monitoring surveys determine the success (or not) of the remediation works. The scientific rigour of the capture and data processing has gained the confidence of all participants, fostering a concerted effort for change.
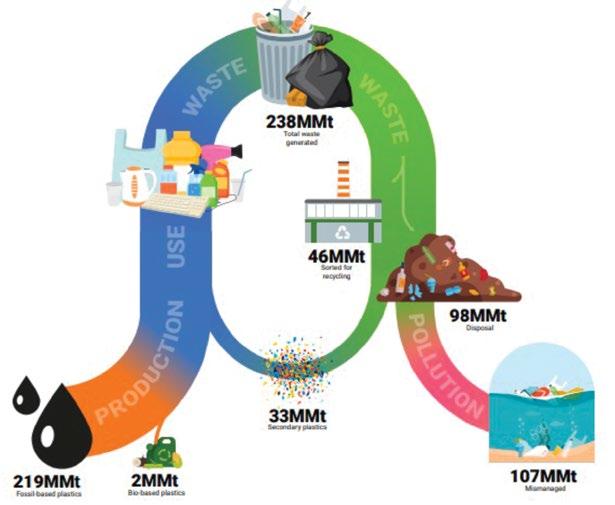
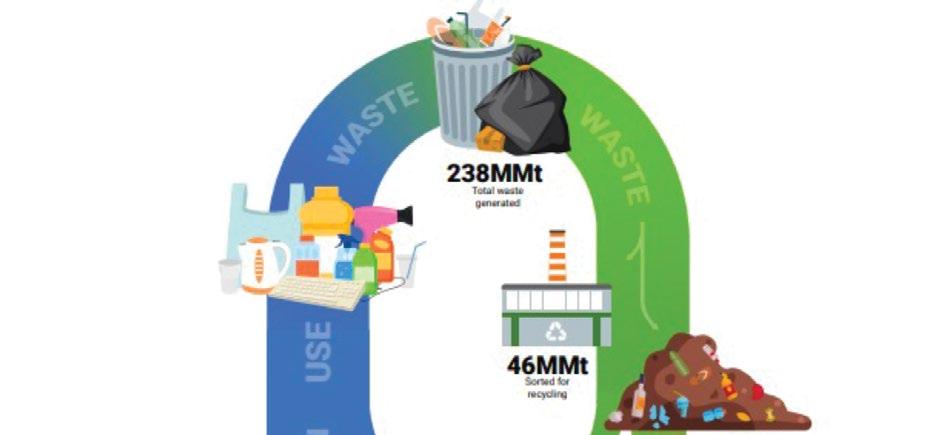
The statistics are confronting. Almost every piece of plastic ever made is still on our planet in one form or another, and 75% of it is now waste, with most of it discarded into landfills or dumped into marine environments (Fava, 2022). The United Nations Environment Programme estimates that only 9% of the nine billion tonnes of plastic produced globally has been recycled, and each year more than 8 million tonnes of plastic end up in our oceans, which equates to around 15 tonnes of plastic entering our oceans every minute (UNEP, 2024). Eighty per cent of all litter in our oceans is now made of plastic. Without action, the World Wide Fund for Nature (WWF) estimates that by 2050, there will be more plastic in the sea than fish by weight (WWF, 2022).
Plastic is difficult to recycle, slow to decay, expensive and polluting to burn, and it breaks down into microplastics, particles smaller than 4.75mm in diameter, which enter the food chain and cause harm to animals and potentially humans (McVeigh, 2022). The ubiquitous images of fish and sea-birds choking on, or trapped by, plastic are only the tip of the iceberg. Microplastics are present in the clothes we wear, the water we drink and throughout the food chain. An estimated 14 million tonnes are residing on the sea floor (Barrett et al., 2020).
Rivers are a recognised contributor to the ocean plastic problem. Plastic litter is predominantly concentrated on banks, coastal beaches and in the
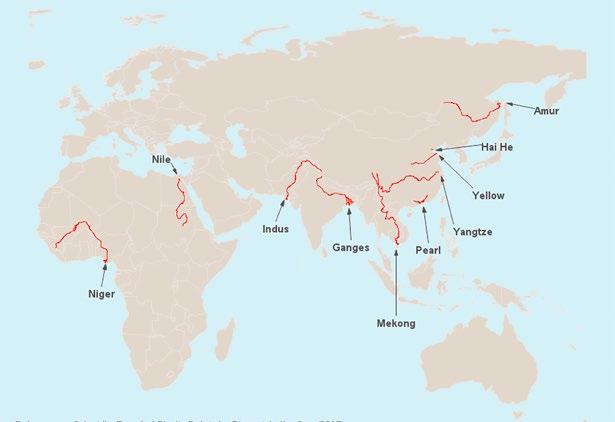
upper limits of surface water bodies during the transportation process. Researchers estimate that 10 major river systems carry more than 80% of the plastic waste that ends up in the Earth’s oceans, with eight of them in Asia (Fig. 2) (Schmidt et al., 2017).
It must stop! Formation of WG 4.3
Plastic pollution is an intolerable situation that needs immediate and
far-reaching action. Eric Solheim, former head of UN Environment, speaking at the launch of the #CleanSeas campaign in 2017, argued that it was past time to tackle the plastic problem that blights our oceans. “We’ve stood by too long as the problem has gotten worse,” he said. “It must stop.”
The International Federation of Surveyors (FIG) and the international surveying and spatial sciences professions agree. Representing
The global estimations of plastic debris entering oceans annually, although numerous, are typically based on local or regional scale surveys, and vary from 250,000 tons (Erikson et al., 2014) to 4.8 to 12.7 million tons of plastic (Jambeck et al., 2015).
the interests of surveyors in more than 120 countries, FIG has formed Working Group 4.3, Mapping the Plastic (WG 4.3) to help combat the global plastic waste crisis. It is a combined initiative of the FIG Young Surveyors Network and Commission 4 (Hydrography).
Given the GIS, remote sensing, hydrographic surveying, project management and overall measurement science skill sets within the group, the WG 4.3 focus has been on the plastic waste transported in waterways, dealing with the problem before it reaches the ocean. Accurate, repeatable and cost-effective plastic waste data at specific ‘hot spot’ locations assists local communities, regulators and policy makers to inform remediation and land-use control decisions.
Much of the plastic waste data currently has been obtained from large-scale empirical estimates or from detailed plastic litter surveys, which are confined to relatively small areas.
The global estimations of plastic debris entering oceans annually, although numerous, are typically based on local or regional scale surveys, and vary from 250,000 tons (Erikson et al., 2014) to 4.8 to 12.7 million tons of plastic (Jambeck et al., 2015). Therefore, the amount of plastic in the global oceans remains poorly understood with a knowledge gap
in terms of the temporal and spatial distribution of plastics, degradation, and beach processes.
Several efforts have been made to establish a standardised monitoring methodology, such as Oslo and Paris Conventions (OSPAR) (OSPAR, 2020), the Commonwealth Scientific and Industrial Research Organisation (CSIRO) (Hardesty et al., 2016), National Oceanic and Atmospheric Administration (NOAA) (Opfer et al., 2012) and United Nations Environment Programme/Intergovernmental Oceanographic Commission (UNEP/ IOC) (Cheshire et al., 2009). Those methodologies are based on traditional beach monitoring by visual counting of plastic pieces along transects.
The accuracy of the beach survey results is dependent upon the skill of the observer and the differences in these protocols make the integration and comparison of beach litter survey data difficult. They are also time and labour intensive and do not measure the amount of plastic being conveyed within a river system, only those items discarded during transportation.
However, new research using remote sensing data from satellites and airborne platforms has shown that this can be a reliable source of information over large geographic areas. Assessment of the spatial extent and variability of plastic is possible due to the unique spectral signature of polymers in the near-infrared part
of the electromagnetic spectrum. Research by WG 4.3 members at the University of Banja Luka in Bosnia and Herzegovina and the University of Novi Sad in Serbia has, therefore, concentrated on distinguishing plastics from surrounding litter/debris classes using remote sensing techniques.
Initial research focused on the analysis of satellite imagery. An object-pixel based algorithm for mapping plastic distribution in (fresh) surface water using red, green, blue and multi spectral images from high resolution WorldView2 satellite images was developed with the paper published and presented at the FIG Working Week held in Hanoi, Vietnam, in May 2019 (Jakovljevic et al., 2019). This research was subsequently refined to focus on higher accuracy plastic detection over smaller geographic areas (Fig. 3) using UAV captured imagery to successfully develop a surveying and mapping solution to accurately detect, extract and classify floating and land-based plastic as small as 0.01 metres (Jakovljevic et al., 2020).
The solution captures floating and land-based plastic waste data relatively easily at ‘hot spot’ locations using UAV imagery with the data processed using deep learning algorithms. The extent of each survey is limited only by the operational parameters of the UAV, and the only field personnel required are a suitably qualified pilot and spotters. The orthophotos are processed remotely but can be processed locally depending on the availability of the processing infrastructure.
The results inform remediation and ongoing monitoring campaigns. The initial baseline is established from the first survey and the effectiveness of the remediation response evaluated against the subsequent monitoring surveys.
The solution uses deep learning algorithms to extract floating and landbased plastic from high-resolution UAV images. Customisable flight routes at low-level altitudes in combination with new algorithms, such as the Structure from Motion (SfM) algorithm, for photogrammetric processing provide a cost-effective solution for the acquisition of geospatial data with high spatial and temporal resolution. UAVs provide the appropriate spatial and temporal resolution to produce suitable data for mapping plastic, however, to date, the methods developed are largely based on visual interpretation and manual labelling of plastic pieces, which is time-consuming and labour-intensive.
The WG 4.3 solution instead uses U-Net architecture (the ResUNet50 algorithm) with an encoder-decoder structure to undertake image classification, including automatic classification, object detection and semantic segmentation. The encoder generates feature maps with high-level semantic but low resolution and the decoder up-samples the low-resolution
encoder feature maps, retrieving the location information and obtaining fine-scaled segmentation results (Jakovljevic et al., 2020).
Orthophotos are generated from the captured aerial imagery of each UAV survey. The pixel classes are delineated and labelled and then merged using multi resolution segmentation algorithms to create non-overlapping polygons.
As this research is the first attempt to map floating plastic data from UAV imagery, previous ground truthed data is not available and the delineation, classification and labelling is done manually. It is expected that the pre-processing time will reduce as the polymer ‘libraries’ grow, and this process becomes increasingly automated.
An end-to-end semantic segmentation model is used for floating and land-based plastic classification based on the U-Net deep learning architecture (Fig. 3). The model consists of an
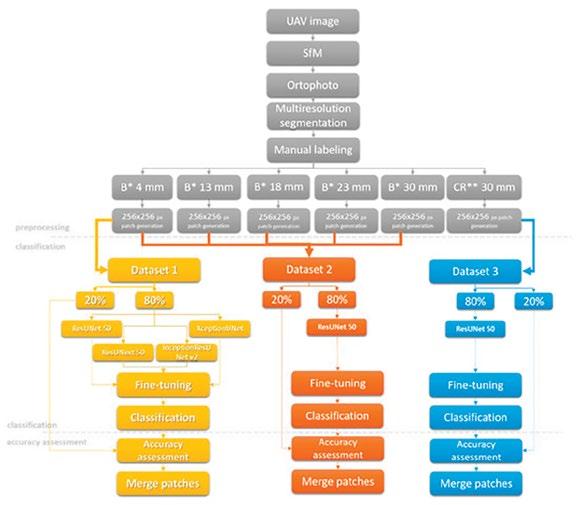
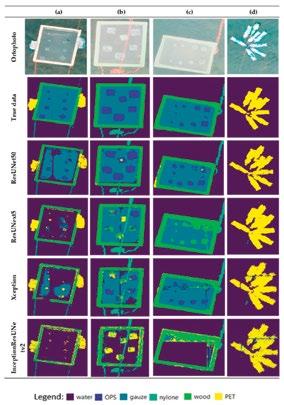
encoder and a decoder. The encoder extracts and abstracts the image pixel information and the decoder extracts the plastic from the orthophotos.
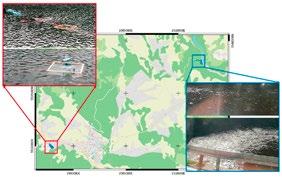
Testing and refinement of the plastic mapping solution has involved the processing of UAV imagery from two sites in Bosnia and Herzegovina (Fig. 6). One, at the confluence of the Crna Rijeka and Drina rivers, was chosen because it is inundated with plastic and other waste, and the other, at Lake Balkana, a pristine deep-water lake. They were chosen to test the algorithm’s ability to differentiate floating and submerged plastic from the surrounding water body and to test its ability to differentiate floating and land-based plastic from other litter (Fig. 5).

The algorithm detected plastic accurately in shallow water, which is a challenging environment for mapping plastic because the presence of the river bed increases water reflectance. Unexpectedly, the algorithm accurately extracted the plastic pieces that were omitted from the training data, showing good generalisation abilities. The model also demonstrated its ability to detect plastic not just in water but also on land.
An example of this plastic mapping solution in action is in Ghana, where plastic pollution is severely impacting communities. The government has committed to addressing the problem and has implemented a National Plastic Action Partnership between the government, experts, civil society, community organisations and the private sector. The Ministry of Environment, Science, Technology & Innovation (MESTI) plays a key role in its implementation.

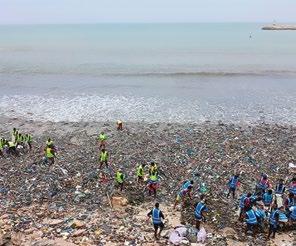
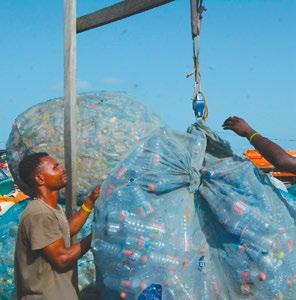
Ghana’s coastline is, unfortunately, impacted with plastic and other litter, in some places quite severely (Fig. 7 & 8). There is infrastructure available to recycle selected plastic waste, and, currently, informal recyclers scour the beaches and other locations for items of value, such as plastic bottles (Fig. 8). Payment is on a per-weight basis; however, the waste that has no value is left behind.

Based on the evaluation of preliminary UAV surveys undertaken at Korle Gonno Beach in Accra by students from the University of Mines and Technology, Takoradi, under the supervision of Dr Naa Dedei Tagoe and processed by WG 4.3, MESTI is implementing the ‘Plastic Not Seen’ initiative.
Korle Gonno Beach is one of many coastal locations throughout the country where informal settlements of indigent people eke out a subsistence living, part of which is recycling plastic waste (Fig. 10). The ‘Plastic Not Seen’ initiative is an expansion of the current informal recycling process, whereby local people are assigned a portion of coastline adjacent to their settlement and paid to clean it and keep it clean.

The work programme is currently being finalised. Initial UAV surveys at each location will establish the baseline waste levels with subsequent monitoring surveys undertaken to determine the level of compliance with the agreed clean-up plan. The baseline and monitoring surveys will be undertaken locally with the captured imagery processed remotely, at least initially, by WG 4.3. This approach has been chosen largely because the imagery and processed results accurately depict the situation at each location at any given time and there is no basis for misunderstanding or dispute about the amount of plastic seen or not seen by any of the parties involved. Although not directly addressing the root causes of coastal pollution, it is an innovative and sophisticated step towards plastic waste eradication at a community level using this technology.
This mapping solution is relatively inexpensive, requiring only a survey-specific UAV and a qualified pilot to capture the required data. The algorithms can be modified to identify other features, and the data can be processed remotely or locally depending on the available
infrastructure. It can be used to inform policy changes in other areas.
Floating plastic and other litter are predominantly concentrated on the surface or within the upper limits of a water body. The deep learning algorithms have been trained to extract plastic and other litter from the surrounding water (salt or fresh) by differentiating the spectral signatures of the plastic and the water body. This methodology can be used to map plastic waste in marine environments, including the so-called ocean gyre ‘garbage patches’, with UAVs deployed from a support vessel and the survey results processed on-board or remotely.
The WG 4.3 solution can also be used in coastal environments as the algorithm can detect plastic waste and other litter deposited on beaches and riverbanks. It is ideal for beach litter surveys (plastics and other debris), with the algorithms able to detect and classify plastic as small as 1.0cm² to meet international litter assessment standards. The orthophotos from subsequent UAV surveys can be used to monitor the effects of restoration works over time. If required, the algorithm can be trained to differentiate and classify specific features as required. The only limitations are those that would impede UAV data capture, such as overhanging trees.
UAV captured imagery and the processed data enable the communities in small island developing states
(SIDS) to better understand the extent of the problems they face. It can also inform cases for equity and economic justice in international forums, and ongoing monitoring ensures adherence to international agreements.
Accurate knowledge of the quantum of plastic waste and other litter in waterways and coastal areas assists in the formulation of action to eradicate their discharge into them. The captured imagery defines the baseline and informs policy and regulation. Ongoing monitoring provides accurate and quantifiable information against which adherence can be determined.
UAV captured imagery is an effective way of monitoring land-use patterns over time, and the algorithm can be adapted to interrogate specific items of interest. The data informs policy and regulator decision-making and provides affected communities, including indigenous communities and those living in SIDS, accurate information on critical climate change indicators such as sea-level rise or deforestation.
Although initially developed to map floating plastic in rivers and waterways to stop it adding to the huge amount of waste already in our oceans and so begin to ease their degradation, this mapping solution has also proven effective in mapping land-based plastic, thus broadening its scope. This cost-effective, sophisticated and accurate data capture and AI-based processing methodology provides the spatial information needed for effective land-use control decisions and a monitoring tool to ensure the required outcomes are being achieved. •
Some people leave their mark on the land, not just by shaping it but by weaving their own story into the very fabric of the places they touch. David Fox, the founder of Fox & Associates, is one such individual. Over a career spanning six decades, David has been a trailblazer, an adventurer and a community advocate, transforming land into legacies across Canterbury and beyond.
Born in New Plymouth in 1941 and raised in Christchurch, David Fox showed an early love for the outdoors. Growing up near Rapaki Track on the Port Hills, he spent his boyhood chasing rabbits and exploring nature, a lifestyle that would foreshadow his future as a surveyor. His father, the deputy editor at The Press, dubbed him the ‘Wild Man from Borneo’ – a nickname that would prove prophetic.
David’s path to surveying began at Waitaki Boys’ High School, where he experienced the rigorous discipline of spartan boarding school life. It was there that he decided on a career that would combine technical expertise, outdoor work and the chance to see the world. He qualified as a professional surveyor (MNZIS) in 1964, ready to embark on a journey that would take him to the far corners of the globe.
In 1966, David and his wife Yvonne moved to
Sarawak, Borneo, where he joined the Land and Survey Department under British Overseas Aid. For the next eight years, he mapped remote jungle areas, oversaw urban development and organised titles for landless squatters.
Whether navigating rivers, sleeping in the jungle, sleeping in Iban longhouses, or fighting off bloodthirsty leeches, David embraced the challenges of surveying in Borneo with gusto. His work included producing the last four 1/50,000 maps along the remote Sarawak-Indonesian border. This was a two-year eff ort that required regular one to three-week trips upriver and into the dense interior. It was an adventure like no other: experiencing Borneo between the ages of 25 to 40 was wonderful and marked the start of a lifelong passion for exploration and travel.
In 1981, after stints with Christchurch Estates and then 18 months back in Borneo working for the Sabah Government under New Zealand Foreign Aid, David founded Fox and Associates. From the outset, the firm was built on a simple yet profound belief: every piece of land has the potential to create a legacy.

Over the past 45 years, the company has earned a reputation for its innovative and thoughtful approach to land development, particularly on the challenging terrains of the Port Hills. One of David’s standout projects is the award-winning Broad Oaks development. This 35-hectare, 300-section hillside residential subdivision showcased his ability to balance functionality with aesthetics, earning him the prestigious Award of Merit from the New Zealand Institute of Surveyors.
Over the years, his company has developed a reputation for creating well-designed residential communities across the Port Hills, delivering over 1200 hillside sections in areas such as Longhurst Terrace, Kennedys Bush Road and Redmond Spur. These projects reflect David’s belief in creating spaces and places that enhance both the land and the lives of those who call it home.
David’s passion extends far beyond surveying. A senior cricketer in the 1960s and a financial supporter of Burnside West for many years, he was one of the drivers for the establishment of Hagley Oval, which has clearly become an iconic venue for international cricket.
His advocacy for community spaces is evident in a project like Upshot Coffee. This iconic rugged-rural-style cafe attached to a riding school opened in 2011 after the earthquakes.
David personally organised and financed the planning objections to the Christchurch City Council’s proposal to shut down the cafe because it was a commercial activity in an agricultural zone and then roasting coffee was an industrial activity! The new council planner dealing with this case was finally convinced that the effects were less than minor.
With Upshot Coffee now saved, David has a unique honour in having one of ponies named after him by the riding school; a wild Kaimanawa pony, now trained, called Foxy Muna.
Fox and Associates has always been ahead of the curve. The company embraced technologies like UAV (drone)
surveying and 3D laser scanning, becoming one of the first land surveying firms in New Zealand to achieve Civil Aviation Authority Part 102 Certification for UAV operations. This forward -thinking approach has expanded the firm’s capabilities across air, land and water surveying, ensuring that Fox and Associates remain industry leaders.
Equally important has been the company’s commitment to the environment and community. From farm-estate planning to establishing covenants that protect native bush and significant landscapes, David’s work reflects a deep respect for the land and its legacy. Fox and Associate’s support of the Banks Peninsula Conservation Trust highlights this dedication to preserving the natural beauty of Canterbury.
David and Yvonne continue to embrace the things they love most. Travel has been a passion. Their family – their children Carl and Nicoli and four grandchildren –continue to be central to their lives, bringing joy and inspiration.
David’s contributions to the Institute, to surveying, land development and his community are immense. Whether through the meticulously designed residential subdivisions on the Port Hills, his advocacy for urban design or his leadership in innovation, David’s work has shaped not only the land but also the lives of countless people.
As the ‘Wild Man from Borneo’ reflects on a career and life rich with adventure, challenge, achievement and purpose, it is clear that his legacy will endure for generations to come.
David congratulates his partners on their contribution to both the running of the NZ Institute of Surveyors, and Survey and Spatial, but even more so thanks them for their guidance, their energy and their support of Fox and Associates over the years. •

know it
By Nick Stillwell
After a massive feaw years of progress, the Modernising Landonline project is wrapping up and transitioning to a business-as-usual mode of operations. However, the work won’t end when Legacy Landonline retires, we'll continue to employ in-house software development expertise to keep Landonline world-leading and avoid the need to do this again in 20 years.
But, before wrapping up, there are some very important features to deliver...
New Landonline Plan Generation is on its way
The feature most regularly requested by surveyors for New Landonline is on the way – Plan Generation.
We have been fortunate to have a handful of survey firms volunteer to pilot the New Landonline – Plan Generation functionality since the 4th of February 2025. The invaluable feedback we’re receiving from pilot users has already identified opportunities to improve the system. We want to be confident any issues raised by the pilot users are resolved and the system is running smoothly before launch.
We currently expect to have New Landonline – Plan Generation available to all survey users by the end of May. We’ll keep all users updated via email of the progress and we’ll also host a webinar before release to showcase the new functionality.
As we have been busy delivering Web Search functionality, some Survey firms have opted to exclusively use New Landonline – Web Search and switch off their access to Legacy Search. Web Search has some great new features –it’s accessible on any computer or mobile device and has a visual map view and aerial imagery to find the information you’re looking for.
Upcoming features to be released:
Display survey work
Territorial Authorities layer
Filter Vector
Search for survey number by surveyor
Search for user contact details
Please see Coming soon to New Landonline for the latest updates.
If you would like to switch-off your firms access to Legacy search, please email Landonlinefeedback@linz.govt.nz
The first phase of updating personal contact details was released on 14 March. From the My Work page, you can click the ‘hamburger’ (three horizontal lines) button in the top right, then click ‘My Profile’ to edit some of your details. Further functionality will be incrementally released until the work is completed in June 2025.
In the interim, if there are notice preferences or privileges that you need to have changed after Legacy is removed, give the contact centre a call on 0800 665 463 and they’ll be happy to help.
We aim to switch off Legacy Landonline for all surveyors by mid-year, however this is dependent on our progress of the improvements identified by our Plan Generation pilot group. Keep an eye out for progress update emails from us over the coming months.
After we complete Plan Generation and remove Legacy access, our focus will shift to replacing the internal functionality for our staff and upgrading the Landonline database. This work is expected to take 18 months and during this time you'll see fewer releases from us as we shift into business-as-usual.
Throughout the build phase we have referred to the original Landonline as Legacy Landonline and the modernised platform as New Landonline. At the completion of the final switch off, the official name we will be referring to our current platform as, will simply be, Landonline. •

Nick Stillwell is Toitū Te Whenua Land Information New Zealand’s Sector Engagement Relationship Partner working with surveyors. We asked Nick for his reflections on the development of the new Landonline as the switch-off date for the legacy Landonline looms closer (early 2025).
Stephanie Harris and Anthea Coombes, Glaister Ennor
Unit title developments are by their very nature complex communities.
In a unit title development, the community is made up of the unit owners, and also the unit occupiers. All sit alongside and under the body corporate. This disparate group of individuals is a community because they have all chosen to live, work or invest in the same unit title development.
Within the community of a unit title development, there are any number of interest groups (they are sometimes referred to as sub-communities). These interest groups are likely to be familiar to anyone who has lived in or worked in or worked with a unit title development, because these groups are often the source of friction
leading to conflict and disputes. Some typical interest groups are listed here, but this list is not exhaustive:
majority – minority
owner-occupier – investor-owner
residential – non-residential
owner – occupier
pro-pet – anti-pet
smoker – non-smoker
One of the primary drivers of conflict and disputes within a unit title development is the dynamic between majority and minority. That dynamic comes into play throughout every facet of body corporate decision-making and has particular implications for the operational rules that are imposed and how they are enforced, and for the levies that are raised.

Disputes that arise in this context can be difficult to resolve because the decision-making framework in the Unit Titles Act 2010 provides for all decisions to be based on a majority vote (whether a simple majority or at least 75%). But, the guidance provided by the High Court in Landmark Property Holdings Ltd v Shen Empire Ltd [2020] NZHC 893 is instructive: “…Subject to any permitted discrimination, the body corporate is required in… [the] performance or exercise [of its powers and duties]“ to be even-handed. It cannot prefer some owners to other owners. In that sense the body corporate [is] under a fiduciary duty.
The relationship between unit owners or the body corporate and unit occupiers can give rise to a

complicated series of issues. Unit occupiers have a direct relationship with their unit owner landlord under a lease or tenancy agreement, but they are also (independent of the lease or tenancy agreement) obliged to comply with the operational rules. Let’s not forget the unit occupiers can be a plaintiff or a defendant in unit title disputes just like a unit owner but without the benefit of voting rights. This is another example of the different property rights attached to ownership compared with other lesser bundles of rights.
How operational rules are framed and enforced can influence how cohesive a unit title development community is. Where operational
rules are clearly drafted, the expected conduct and behaviour can be readily ascertained and frequently communicated; therefore, the risk of repeated non-compliance is reduced. Difficulties can arise where operational rules rely on subjective standards or interpretation. For example, different people have different ideas about what an unreasonable noise is, and behaviour that causes annoyance to one person may be acceptable to their neighbour.
Further, the one thing all members of a unit title development community have in common (or should have in common) is a strong interest in the integrity of the physical structures and infrastructure in the develop-
ment, because all owners and all occupiers benefit from a building that is in a good state of repair –whether it contributes to the value of an investment, the amenity or the comfort of a home or a business premises.
Once these and other common interests can be identified and articulated, it may be possible for long-term sustainable arrangements for the governance and management of a unit title development to be implemented; therefore, parties avoid the need for the intervention of the Tenancy Tribunal or courts.
For advice on body corporate governance, operational rules and unit title disputes, please contact •

Edward O’Leary, Abtrac
At Abtrac we are super-serious about data security. We should all be.
We’ve all heard of viruses and malware. We often read about people who have been unwittingly scammed. Some of you might have been hit with ransomware or other calamities. We all know about multi-factor authentication.
But still, too many of us are pretty relaxed about online security. Indeed, business surveys show CFOs and other management are more concerned about IT cost than IT security.
How often do you think a bot tries to hack into your business web site or your home computer? The answer may scare you and surprise you.
How often do you think it happens? The answer is continually and repetitively, throughout the day, every day for as long as the machine is turned on.
It depends on how long you’re online at home and of course the sites you’re visiting, where you click and other things. At work it’s the same for your local machine albeit with network security that should be better than at home. And there’s also your web site. Bots hitting that depend on a site’s popularity, how often it flags up in searches, PPC etc. plus the type of business and other factors.

But an average small business web site will have dozens of penetration attempts every day. Fifty to somewhere in the hundreds is the norm.
A bank may have millions or indeed billions of attempts in one day. Bots running through millions of combinations and permutations trying to find your credentials. They’re random, but they occasionally work.
Imagine millions of monkeys randomly banging away on millions of keyboards. Statistics tells us one of those monkeys will accidentally knock out a deeply meaningful sequence of words or even a whole Shakespearean sonnet, albeit after maybe hundreds of years of trying. It will be a pretty old monkey by then. But one of them might fluke it tomorrow. (Don’t tell animal welfare, this is just imaginary!)
It’s no different with bots hitting your web site, your internal IT environment at work, or from something you’ve clicked on your home computer. Bots aren’t as smart as monkeys. But they never sleep.
So make sure you’re 110 per cent firewalled and up to date with antivirus etc. Use your web host’s protection as well. Abtrac is behind Microsoft’s security, ranking as high as we can get. AWS and other players have comparable defences.
You could go to the next step and hire someone to try to crack into your system or your web site. Don’t choose some “Ethical Hacker” from the other side of the world. Find a well-known and well referenced local penetration tester. If possible, enable logging and monitoring. Obviously run backups. Keep up to date with all recommended updates. Don’t click on suspicious looking emails. Duh! It sounds common sense, but entire businesses have been brought to their knees because of one email that one person opens without thinking. There are probably several instances you can recall that have been made public and many others kept quiet.
And please turn on multi-factor authentication on every piece of software you use, including Abtrac. This one simple step on its own will reduce current penetration attempts by 90 per cent. Do it! •
By the time this article appears in the autumn edition, the School of Surveying will be preparing for its annual graduate recruitment programme in July and August. This programme provides opportunities for employers to advertise graduate positions and provide company presentations at the school if desired. At the time of writing, the country is experiencing an economic recession albeit with the current Reserve Bank’s Monetary Policy Statement predicting that economic activity is expected to improve.
I hope that this bodes well for employers and graduates alike in terms of an upturn in surveying business confidence and a need for graduate recruitment. The certainty of employment for Otago surveying grads over many years has become a distinctive feature that is recognised and used by Otago University marketing staff. It has helped us maintain good entry numbers, and even a positive increase of new students this year.
However, what will be different about the next generation of surveying graduates and young people entering the profession? Will these ‘Generation Z’ (born between the mid-to-late 1990s and 2012) surveyors have different demands, needs or expectations in their workplace, will they think differently, and will they have different skills? It is very likely that the answer to all of
the above will be a resounding yes.
At the recent CSNZ workshop, a number of speakers, including myself provided some insights into the topic.
As I am not part of this generation, I reached out to a number of recent graduates, as well as my 4th year class, and asked them to provide comments on their expectations and hopes as they enter graduate employment. As one might expect with a large sample of students, there was a wide variety of responses but some common themes were made clear; and these agree with commonly accepted views on the topic.
This generation has grown up in a digital world and been shaped by technology far more than their predecessors were. They are likely to be highly adaptive with software applications, automation and digital tools, as well as being comfortable in using new tools and methodologies. Many students stated a desire to work with the latest surveying equipment and software, and an expectation that employers would have the latest tools.
This generation’s digital upbringing, where it is easier to text or message someone than talk to them by phone or face to face, can lead to a degree of shyness and graduates may initially struggle with in-person professional interaction. Some may also lack confidence in decision-making and problem solving although this
is something that surveyors typically pride themselves on. The University of Otago lists ‘problem solving’ as one of its desired graduate attributes and the School of Surveying endeavours to promote this in its teaching. Having students undertake large design or cadastral projects hopefully enhances these skills through the gathering of various levels of information and determining an appropriate design solution or cadastral definition. Students also overwhelming identified a desire for professional development and training. This aligns with common perceptions about ‘Gen Z’ – that they are eager for continuous learning and career advancement, they seek structured mentorship, hands-on training and clear pathways for progression. Employers should certainly include them in company professional development programmes from the outset, including webinars, workshops and perhaps even conferences. Encouraging involvement in industry events and professional networks can also help keep young surveyors engaged. A number of student expressed the hope of being involved in a variety of projects, and learning from people with different skills within their company. As the Bachelor of Surveying degree covers a broad range of theory from cadastral, planning, engineering and spatial papers, students expect that their

work will ultimately entail some, if not most, of these fields. In fact, some students expressed the fear that they may end up only in a narrow field of work, and of being pigeonholed.
It is well documented that this generation has a strong social conscience and will be motivated to work for companies with high environmental values and sustainable practices. As students are educated about a range of environmental and sustainable principles as part of their university studies, and combined with their own values, it is likely they will be attracted to companies that can demonstrate ethical environmental behaviour and act sustainably. One example mentioned would be a company having an electric vehicle fleet.
Students have high hopes for a structured and positive mentoring experience. Most understand that the postgraduate years will involve working toward a professional qualification, licensing and/or certification, and this leads to the desire for promotion and advancement. The CSNZ has put a large amount of effort into a structured graduate programme and, together with the new CSLB assessment framework, graduate surveyors will expect that these pathways will be well catered for by all firms and employers.
Finally, it is apparent that graduates need some care and attention as they start out. They are likely to want

to have people around them who are easy to approach and ask for help, people they can ‘buddy up’ with and hopefully even socialise with. Because of this, it is more likely that graduates will be attracted to companies that have recent graduates who they can relate to and where there is a positive social environment. Graduates may also favour bigger cities for their first professional position because of the expectation of greater social opportunities. This outcome has been seen in those recruitment
years where there has been a lot of choice and the regional or perceived ‘small-town’ firms have often missed out on securing a graduate. While the new breed of young surveyors may certainly be different in various respects to the older generation of surveyors, there is no reason why, with the usual investment of time and care from the profession, this new generation of surveyors will not develop and evolve into the professionals needed to meet the demands of the future. •
Endnote: I expect none of the above will really come as a surprise to readers. I believe many of these qualities will have applied to the current surveying employers when they too started out.
University of Canterbury

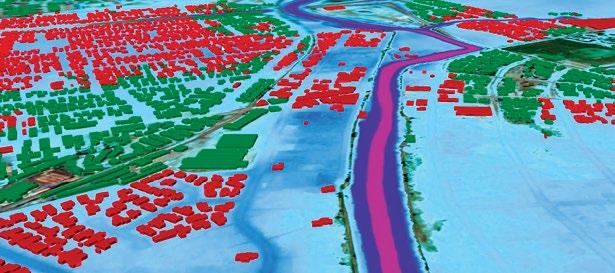
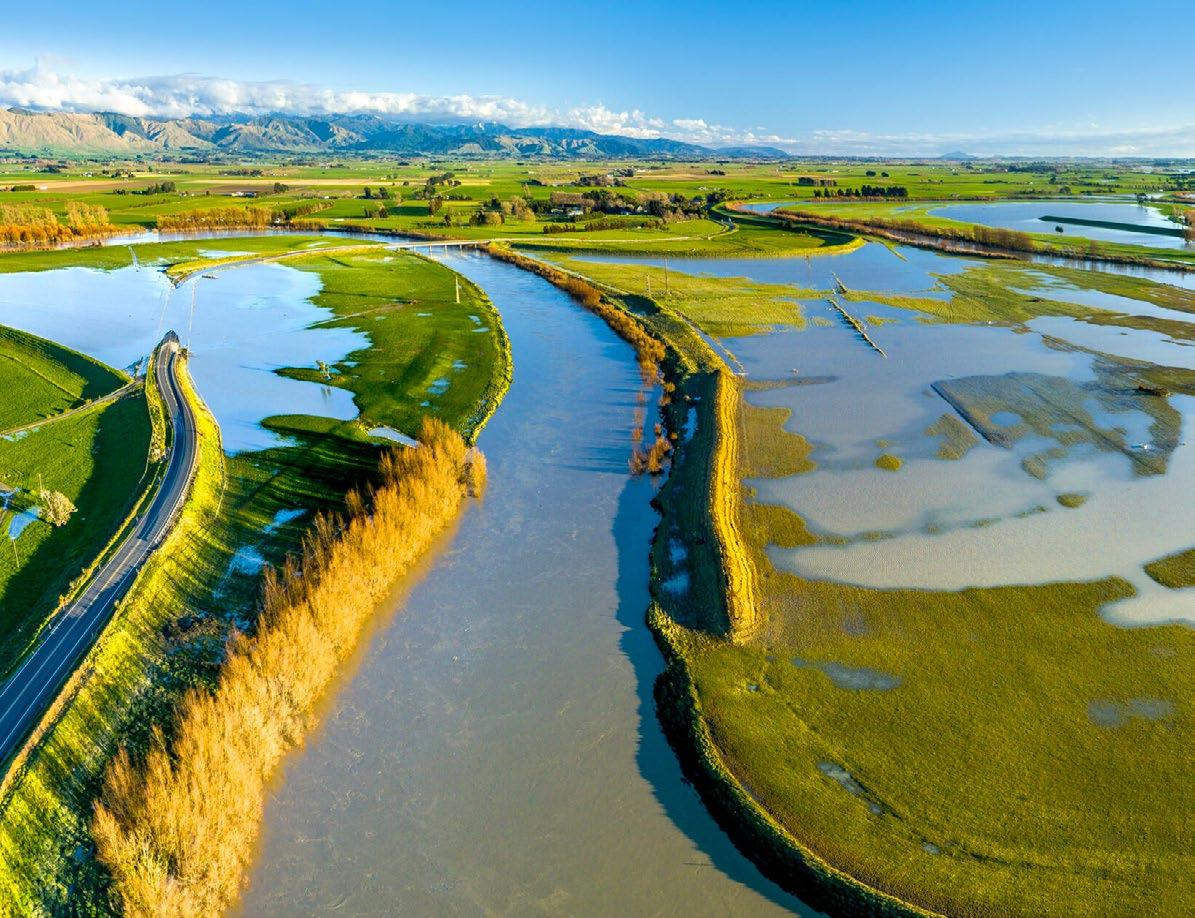
Ucloud computing—to model and visualise floods and their potential impacts." Professor Wilson, Director of the Geospatial Research Institute | Toi Hangarau says.
The models predict the effects of extreme rainfall, considering climate change and urban growth, and offer insights for disaster response and planning.
"Obviously, we know the areas that flood regularly because of past experience, but our system allows assessment of less frequent or more extreme events that might occur—par-
solutions such as wetland restoration and native forest planting.
“These approaches not only reduce flood risk but also provide additional environmental benefits, which the model will quantify and compare to other scenarios such as hard engineering infrastructure.”
The next step for the team—scaling the technology to enable implementation anywhere globally—presents significant challenges. However, a Fellowship provides a valuable opportunity to advance this work.
Professor Wilson, one of four recip-
“Our goal is to provide accessible, scalable tools that help communities to visualise and make informed decisions about flood risks and mitigation strategies."
– Professor Wilson Professor Wilson
C research is advancing geospatial technologies to improve flood risk assessment and mitigation, tackling critical global challenges.
Led by Te Whare Wānanga o Waitaha | University of Canterbury (UC) Professor Matthew Wilson, UC researchers are developing tools to enhance the accuracy and efficiency of flood modelling.
"The work focuses on flood risk assessment and hydrology using digital twins—computer simulations powered by geospatial data and
ticularly with climate change. It can also be used to consider how future flood risk could change with additional urban development," he says.
A successful prototype has already been developed in New Zealand, and the team is working to implement the model on a cloud computing system, enabling faster and more efficient flood risk assessments across the country.
As part of new MBIE-funded research, the model is currently being extended to explore flood mitigation scenarios, including nature-based
ients of the 2024 inaugural IIT Delhi India-New Zealand Centre Fellowships, will head to India in March to collaborate with water resource researchers in the Department of Civil Engineering at IIT-Delhi.
“My fellowship at IIT Delhi will support this work, providing a valuable opportunity to collaborate with researchers in India. With opensource data and software, we can share ideas, technology, and insights while applying the technology in an Indian context. Given the scale of India, successfully implementing it there would be a significant step towards global adoption.
“Our goal is to provide accessible, scalable tools that help communities to visualise and make informed decisions about flood risks and mitigation strategies,” says Professor Wilson. “Through collaboration and technology, we can make a real difference in addressing one of the most pressing challenges of our time,” he says. •
A new UC study uncovers hidden melt beneath Antarctica’s Ross Ice Shelf, shedding new light on climate change impacts and rising sea levels.
Led by Dr Daniel Price of Te Whare Wānanga o Waitaha | University of Canterbury (UC’s) School of Earth and Environment, the research team spent five summer seasons between 2015 and 2020 collecting detailed radar measurements across 1,000 km of the Ross Ice Shelf, the largest ice shelf in Antarctica.
The research aimed to measure changes in ice thickness and basal melt—melting that occurs at the base of a glacier or ice shelf—to establish a precise baseline to support future climate predictions.
“Using ground-based radar, we can measure really small changes in ice thickness over time. It tells us where melting is happening at the base of the ice shelf, providing valuable insight to help refine future climate and sea-level rise predictions,” Dr Price says.

The new research shows that melt rates vary across the ice shelf which could be vulnerable to a warming Southern Ocean.
“It’s the first time we’ve really got a good sense of just how far warm water is penetrating,” Dr Price explains. “We’re talking about 150 to 170 kilometres under the front of the ice shelf in some cases.”
By providing a baseline, the research can help inform ocean and ice sheet models used to predict future change, and in turn sea-level rise, and supports international efforts to understand climate-related changes in polar regions, contributing to a broader international effort to better understand a complex system.
“You have to think about these measurements as a piece of the puzzle,” he says. “All of our work contributes to building a better understanding of a very complicated system that is changing.
“For the Ross Ice Shelf, at the moment things are stable, but as we heat the planet things can change quickly.”
The project was carried out with the support of Antarctica New Zealand, whose logistical support was essential.
“Without that traverse capability

provided by Antarctica New Zealand, we wouldn’t have been able to do this,” Dr Price says. “They do a huge amount of work to facilitate this kind of science.”
He adds that understanding Antarctic ice shelf dynamics is not just a scientific goal — it has global significance.
“The climate crisis is a threat to civilisation. We have built a global society with static infrastructure that assumes no change, but we are now interfering with that system.
Sea levels are rising, and we need to improve forecasts so we can effectively plan,” he says.
“There’s still a lot of uncertainty around how Antarctica will respond to climate change, and what happens there will have large ramifications not just for New Zealand, but for the rest of the planet.”
The research strengthens New Zealand’s contribution to Antarctic science and offers a new dataset to inform sea-level rise models and long-term global climate planning.
NIWA
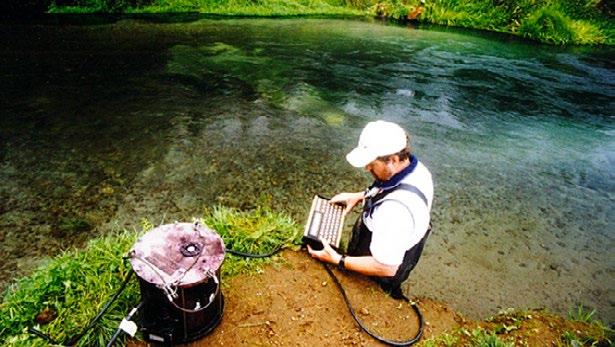
NIWA freshwater scientists have launched a groundbreaking initiative that is transforming mapping of freshwater environments.
The team of hydro-ecological modellers have developed digital networks (DNs) that map connections between river and lake systems for multiple purposes. These networks provide essential data that supports policymaking, environmental planning, and scientific research. The data can be used in classifications, models, and simulations, helping to shape more effective water management strategies.
Unlike traditional networks that primarily focus on large rivers, the innovative approach can incorporate smaller streams, ditches,
and ephemeral channels—water pathways that only flow temporarily. The level of detail in a DN is essential; while biophysical modelling may require intricate flow pathways inside and outside river channels, policy initiatives may only need key river segments. This flexibility means that different DN characteristics—such as density, alignment, and coverage—can be tailored to suit various applications.
NIWA Programme Leader, Doug Booker said, “We have been developing automated methods to generate version-controlled, spatially consistent,

and functionally precise DNs using high-resolution Digital Elevation Models (DEMs), including those derived from LiDAR, which is increasingly available across New Zealand.” said NIWA Environmental Flows Programme Leader, Doug Booker.
“By integrating mapped features such as headwater locations, sinkhole locations, and lake polygons from Land Information New Zealand (LINZ) TopoMaps, we have improved DN accuracy and applicability,” he said.
Traditionally each segment of a DN has been labelled according to its position using the Strahler ordering system. This system starts at one for headwaters segments and increases by one in the downstream direction when two segments of the same order meet. Major innovations of this research include introduction of a multi-coloured labelling system and extending Strahler ordering to use non-positive numbers to recognise ephemeral flow pathways upstream
By integrating mapped features such as headwater locations, sinkhole locations, and lake polygons from Land Information New Zealand (LINZ) TopoMaps, we have improved DN accuracy and applicability.
of river channels. The new labelling system helps freshwater managers by showing where water flows over land into which rivers and will also ensure comparability of networks regardless of location or resolution.
The NIWA team recently presented their findings to the Regional Council Geospatial Special Interest Group, receiving strong interest. Users particularly liked the new system because it allows users to dynamically adjust DN density, ensuring a single DN can serve multiple purposes with consistency and efficiency.
Above is an example of a generated network showing more detail as the image is increasingly magnified from left to right:
Blue lines resembling river channels seen on 1:50k cartographic maps but generated using LiDAR-derived DEMs for greater accuracy.
Purple lines indicate ephemeral channels downstream or river sinkholes.
Red lines highlight ephemeral flow pathways upstream of river channels on an 8m resolution grid.
This pioneering work marks a significant advancement in freshwater management, ensuring that digital networks remain adaptable, precise, and fit for a range of environmental and policy needs. •


On the 14 September 2023, the former Head of the School of Surveying and Fellow of Survey and Spatial New Zealand, Emeritus Professor Basil Jones, died peacefully at his home in Dunedin.
At Basil’s request, his passing was not published at that time to the wider surveying community. However, after consultation with Basil’s family, the Coastal Otago Branch of S+SNZ would like to recognise Basil’s life and his significant contribution to the surveying profession in New Zealand, particularly to the education of surveyors at the University of Otago’s School of Surveying.
The Coastal Otago Branch would like to thank Allan Blaikie for compiling and writing this obituary and acknowledge the help that Basil’s daughters, Helen Smith and Susan Jones, gave to Allan during this process.
Basil Maurice Jones was born in Johannesburg, South Africa, on 30 September 1932. He was the only child of his Afrikaans mother and British father. He attended the Technical High School in Durban, South Africa, from where he matriculated in 1950. In 1953 he graduated with a Bachelor of Science degree in Surveying from the University of Natal in Durban. In1954 he was articled to the surveying firm of Gibson, Sneddon and Barnes in Durban where he gained his practical surveying experience.
He was a keen rugby player, and was a hooker for the University of Natal Rugby Club from 1952 to 1956 when the club won the Wylie Cup. It was rare for the club to win such a significant trophy. One of his contemporaries Michael Antelme (also a surveying graduate) went on to represent the Springboks, playing four tests against the All Blacks in South Africa in 1960, while another, Nelie Smith, captained the Springboks (1964-65) and was the Springbok coach in 1980-81.
This included the controversial 1981 tour of New Zealand. Basil and Nelie Smith met in Dunedin following the Otago game against the Springboks on 11 August 1981. They had both been selected for the South African Universities rugby team while at the University of Natal.
From 1955 to 1957 Basil was a Research Fellow with the Natal Town and Planning Commission attached to the University of Natal. He also enrolled in a master’s programme from which he graduated with a Master of Science in Surveying in 1957.
His next role was as a surveyor based in Blantyre in Nyasaland (now Malawi) and from 1958 to 1960 Basil was engaged in multiple roles in Great Britain, Iraq, Iran, Saudia Arabia and Kuwait. After this, he returned to Durban and the University of Natal where he was appointed a lecturer in the Department of Surveying. He
Basil Maurice Jones enrolled for Doctoral Studies at the University of Natal while a lecturer/senior lecturer (1960-63) and was awarded a Doctor of Philosophy in 1964. His topic was Land Tenure in South Africa – Past Present and Future.

spent the next 17 years there and became a senior lecturer (1962-73) and then Professor of Cadastral and Geodetic Surveying and the Head of Department of Land Surveying (1973-77).
He enrolled for Doctoral Studies at the University of Natal while a lecturer/senior lecturer (1960-63) and was awarded a Doctor of Philosophy in 1964. His topic was Land Tenure in South Africa – Past Present and Future. In 1966-67 Basil read Geodesy at the Department of Surveying and Geodesy at the University of Oxford where his supervisor was Brigadier Guy Bomford.
In 1973 he succeeded Professor Harry Biesheuvel who had retired from the position of Professor and Head of Department of Surveying at Natal. (Incidentally, Professor Biesheuvel visited the University of Otago in 1965 to review and comment on the then fledgling Department of Surveying)
In late1976 Basil travelled to Dunedin to be interviewed for the newly created permanent Chair of Surveying and Head of the Department of Surveying at Otago. (Profes-
sor Mackie, who had recently retired, held a Personal Chair.) After a week in the city and a full interview process, Basil was offered the position which he accepted.
On his return to South Africa, it took six months to complete the process of resigning from his position there and arranging to travel to New Zealand with his wife Jane (they married in 1962), three young children (Helen, Susan and William) and his widowed mother.
Arriving in Dunedin in July 1977 and adjusting to a temperate climate in mid-winter from a sub-tropical climate was not easy, but the family was uncomplaining in making that adjustment.
Basil quickly settled into his new role and soon had the confidence and support of his staff. He was elected a Corporate Member of the New Zealand Institute of Surveyors in October 1977
and a Fellow of the Institute in 1986. He took an active interest in the New Zealand Institute of Surveyors and, as Head of the Department of Surveying, had a seat on the NZIS Council and regularly attended Council meetings and NZIS Annual Conferences. 1977 was the first year in which students could complete the new four-year BSurv degree at Otago. This replaced the previous three-year DipSurv/BSc option, which meant Basil oversaw the transition to the new degree.
Basil’s ability as an administrator was soon identified by the university and he was appointed Dean of the Faculty of Science from 1983-85. This involved some oversight of the science-related departments in the university, while retaining administrative and teaching responsibilities in the Department of Surveying. He was granted a year of study leave in 1989 and returned to his role of Head of
Department in 1990.
In the late 1980s the university’s Vice-Chancellor, Sir Robin Irvine, introduced a revised administrative structure. This included four academic divisions, each headed by an assistant vice-chancellor (AVC). In 1991
Basil was appointed AVC Division of Sciences for 1991-92, this later being extended to include 1993.
This prestigious appointment was indicative of the stature held by him within the university. He subsequently advised the university he wished to retire at the end of his AVC Sciences term, and in September 1993, he was replaced as Chair of Surveying by Dr John Hannah.
Basil had made a significant contribution to surveying in general (both in South Africa and New Zealand) and in particular to the University of Otago. His retirement was well earned and he had the satisfaction of
During 1995-2002 Basil was engaged periodically by the Australian organisation BHP Group, as an adviser on Australian aid projects involving land tenure, and on similar projects sponsored by the World Bank.

leaving the Department of Surveying as a thriving unit. He was suitably farewelled by his colleagues at the end of 1993. He and Jane were destined to spend the next 30 years based in Dunedin.
Initially during this period Basil eased into retirement and developed various interests including tramping, playing bowls, practising his culinary skills and membership of the Dunedin Club at Fernhill. He also dabbled in farming briefly when he acquired a few hectares of land on Mount Cargill on which he fattened a small herd of Murray Grey cattle.
During 1995-2002 Basil was engaged periodically by the Australian organisation BHP Group, as an adviser on Australian aid projects involving land tenure, and on similar projects sponsored by the World Bank. These were in Indonesia (based in Jakarta), Laos (based in Vientiane) and Ghana.
Between 1977 and 2014 Basil and Jane lived at three locations in Dunedin: Leith Street, North Road and Pioneer Crescent. In 2014 they moved to an apartment in the newly established Summerset at Bishopscourt Retirement Village where they spent their last 10 years. In his later years as he became less active, Basil derived great pleasure listening to his collection of classical music CDs.
He died peacefully in his 91st year at home on 14 September 2023 followed by Jane 23 days later, who died, aged 87, on 7 October. It is fitting their ashes have been scattered on Mount Cargill. They are survived by their three children Helen and Duncan Smith (Wellington), Susan and John (Auckland), and William and Fiona (Singapore) and grandchildren Nina and Bruno, and Emma and Matthew. •
Compiled by Allan Blaikie FNZIS