thenyhc.org | @thenyhc

Prepared by

Unlocking Housing Access: Transit Oriented Development and the New York Housing Compact
March 2023
What is the "New York Housing Compact"?
• Growth Targets

• Transit Oriented Development zoning
• Tax exemptions and infrastructure funding
• Fast-track approval process
Why is Transit Oriented Development Needed?
• Housing supply shortage
• Many New Yorkers are rent burdened
• Of these New Yorkers, people of color are disproportionately at a disadvantage
How did we get here?
• Single-family and auto - oriented zoning
• Explicitly discriminatory loan practices and land use tools
What are other States doing about housing affordability and Transit Oriented Development?
• Preemption of local zoning to limit future single family home development
• Incentives to developers to construct multifamily TOD
Who will benefit the most from higher density development and TOD?
What might TOD look like in New York’s suburbs?
Outline 1 Policy 2 Context 3 History 5 Policy in Practice
Case Studies
4
2
"New York Housing Compact" key elements
800k homes over 10 years
• 3-year production targets for all local jurisdictions: 1% Upstate / 3% Downstate (region served by the MTA and a portion by NJT in NY)
• $250m State assistance for infrastructure unlocking growth, including sewer/water, new structured parking, public realm improvements, and potentially schools
TOD Rezoning
• Municipalities must rezone ½ mile area from MTA stations for minimum average densities, with distributions within that area up to local discretion
• Density requirements based on distance from NYC, and range from 15 – 50 dwelling units
per acre
Tax Incentives
• $5m in Low Income Housing Tax Credits
• New tax incentives for affordable multifamily housing outside NYC
• Expanded incentives for homeowners who build ADUs
• Work with legislature to develop a new tax incentive program for rental housing to replace 421(a)
New Options for Development in NYC
• Removes State imposed cap of 12 FAR for development in NYC
• Expands the number of commercial buildings eligible for residential conversion, and creates tax exemptions to incentive inclusion of affordable housing
• Legalizing basement apartments meeting health and safety requirements
Fast-track approvals

• Creates a builder's remedy for multifamily/mixed income property developments
• Applies only to municipalities that fail to meet permitting targets and fail to adopt pro -housing policies
• Developers would be able to receive expedited review and approval from State, even when a proposal would not comply with local zoning
1. Policy 2. Context 3. History 4. Case Studies 5. Policy in Practice 3
Establishing housing growth goals
Achieving 800,000 New Housing Units
• MTA projects significant regional growth over the next decade:
• 1.4 million people

• 700k new jobs
• DHCR projects that New York State will then need to add 800k units over the next decade
• Baseline growth will deliver only half the required housing
• This gap can only be filled by accelerating delivery of new homes and by adding density through TOD
• TOD could account for approximately 175K of new housing construction
* Baseline growth projections assume replacement of 421(a) legislation.
0 100 200 300 400 500 600 700 800 900 Baseline Growth
421(a) Replacement New Home Targets Transit Oriented Development Commercial Conversions Basement Apartment Legalization Total
Assuming
1.
2. Context 3. History 4. Case Studies
Practice
Policy
5. Policy in
Source: Achieving the New York Dream: State of the State, 2023
* 4
Targeting growth
Contextual local growth targets

• Percentage-based targets
• While most localities in New York State are permitting housing at or near their target rates, many are lagging behind
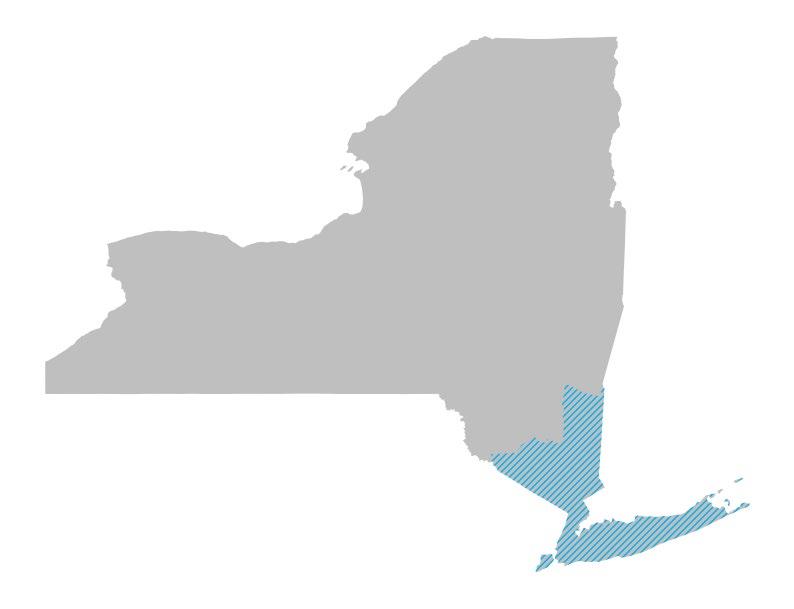
• More growth is directed for the transit-rich, economically booming NYC region – where housing is needed the most
• In communities which do not meet the housing targets, builders will be able to take advantage of a "fast track" approval process
3-year
1%
3%
Upstate Downstate (MTA Region)
Production Targets
1. Policy 2. Context 3. History 4. Case Studies
Policy in Practice
5.
5
Source: Achieving the New York Dream: State of the State, 2023
Promoting transit-oriented development
Creating denser, vibrant, mixed-use communities around rail Municipalities will need to zone for minimum average densities within ½ mile of a train station with regular service
• Local land use policy can still determine the distribution of that density
• Applies to areas within New York served by MTA agencies and New Jersey Transit
Density requirements are a function of distance from NYC:
• Tier 1 (15 miles): 50 du / acre
• Tier 2 (30 miles): 30 du / acre
• Tier 3 (50 miles): 20 du / acre
• Tier 4 (>50 miles): 15 du / acre
Proposes expedited environmental reviews for rezonings, recognizing the clear environmental benefits of smart growth promoting low- emissions mobility
Source: Achieving the New York Dream: State of the State, 2023
 1. Policy
2. Context
3. History
4. Case Studies
5. Policy in Practice
6
Proposed density allowances within the region

Locations and density requirements
Indicative based on distance from NYC. Final stations in each tier subject to confirmation.

Tier 1 50 du / acre
Tier 2 30 du / acre
Tier 3 20 du / acre
Tier 4 15 du / acre
1. Policy 2. Context 3. History 4. Case Studies 5. Policy in Practice 7
Linking housing to ongoing transit investment
Large investment in suburban rail infrastructure demands action on housing to fully realize the benefits of transit spending
Cost of the LIRR Modernization project: $17.7
billion

• Tens of billions of dollars have been invested over the past decades in the MTA’s regional rail systems to accommodate this growth
• High profile, big-budget projects like East Side Access and Penn Access mean commuter rail riders have better access than ever

• Long Island has the slowest housing growth in the region despite this extraordinary transit investment
That’s more than $6,000 per Long Island resident.
Includes total costs for all modernization projects, including the Mainline 3rd Track, Double Track, East Side Access , Penn Station concourse improvements, and other associated projects Source: MTA Capital Program 2015-2019, 2020-2024, All Aboard: Governor Hochul Celebrates Completion of LIRR Main Line Third Track on Time and Under Budget (2022)
1. Policy 2. Context 3. History 4. Case Studies 5. Policy in Practice 8
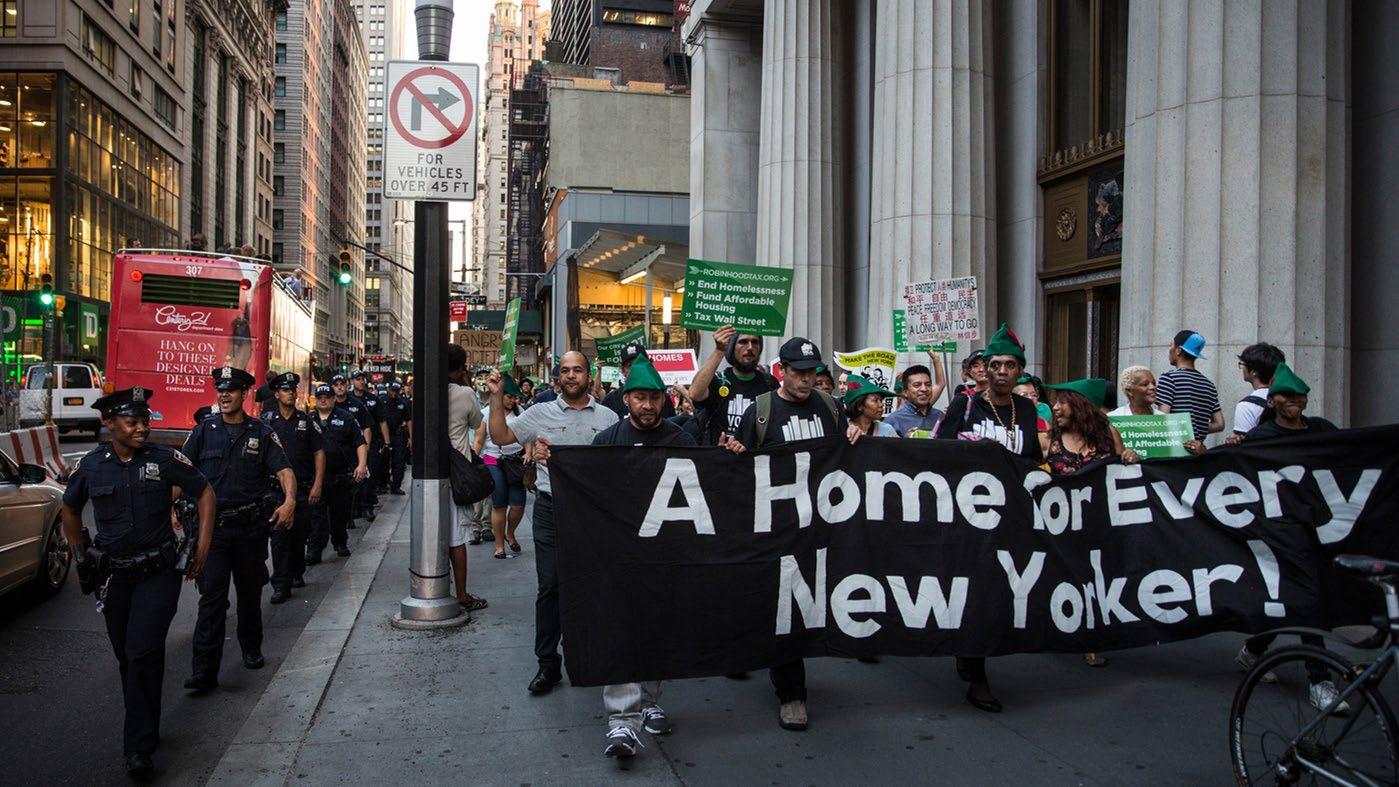
Housing activists march to City Hall to demand more affordable housing options for the homeless and poor on Sept. 17 (NPR, 2017)
2 Context

9
Housing costs have been increasing

Wages have not kept pace with rents
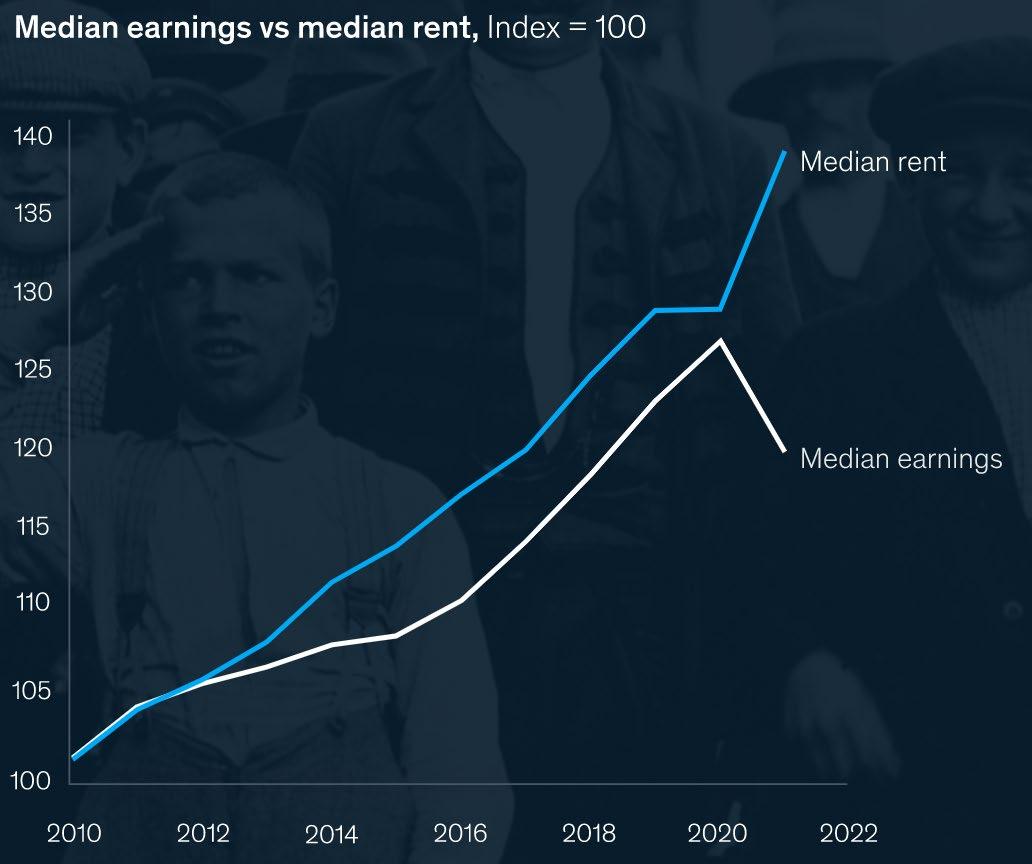
• Even as the regional economy booms, wage growth lags behind housing costs
• New Yorkers are spending more of their income on rent each year
• Covid has helped to create an even more urgent housing crisis
1. Policy 2. Context 3. History 4. Case Studies
Policy in Practice
5.
10
Source: McKinsey, New York Metro Area Workforce: Challenges and opportunities for growth
Lagging the country in housing production
New York’s suburbs are especially behind
New York has added more than 1.2 million jobs over the past decade, but just 400,000 new homes.
• Long Island and the Lower Hudson Valley are adding fewer homes per resident compared to both New York City as well as peer growth regions.
A lack of new of new housing is exacerbating the already high cost of living in the NYC Metro Area:
• Home prices have increased 50% since 2015
• Rents have increased by 30% since 2015

More housing is needed to allow the New York City metro region to grow and prosper.
Source: Achieving the New York Dream: State of the State, 2023

1. Policy 2. Context 3. History 4. Case Studies 5. Policy in Practice
11
Housing cost burden has worsened
Housing costs are too high relative to income
High rental costs limit savings and economic mobility:
• Half of all renters are rent burdened (paying more than 30% of their income)
• Nearly 3 out of 10 renters are severely rent burdened (paying more than 50% of their income)
Most households who can afford to buy pay significantly less relative to their income.
However, home ownership is too expensive for the bottom half of the income bracket:
• 3 out of 5 lower income households who own their home are severely cost burdened
*Analysis includes those counties in Long Island and Lower Hudson Valley served by regional rail: Dutchess, Nassau, Orange, Putnam, Rockland, Suffolk, Westchester
Percent of Households
Source: HUD Comprehensive Housing Affordability Strategy, ACS 2015-19

0% 10% 20% 30% 40% 50% 60% 70% 80% 90% All Households Below Median All Households Below Median Owner Renter
Burdened
Severely Burdened
Percent of Households, By Income Level*
1. Policy 2. Context 3. History 4. Case Studies 5. Policy in Practice
12
Market rents are even higher
Rents are out of reach for renters
• Zillow data from January 2023 provides an updated picture of recent markets
• To afford a typical rental, households would need to earn:
• Over $135k per year in Nassau County
• Over $108k per year in Westchester County

• Median income for household that rent is just $60-70k annually
• To pay less than 30% of income on rent, you’d need to make nearly double that amount
Based on most recent ZORI data provided by Zillow. Data for Suffolk County unavailable due to large number of listings for vacation rentals
$$500.00 $1,000.00 $1,500.00 $2,000.00 $2,500.00 $3,000.00 $3,500.00
Nassau County Westchester County
Zillow Observed Rent Index
1. Policy 2. Context 3. History 4. Case Studies 5. Policy in Practice 13
Racial disparities in housing affordability have persisted
In the suburbs, non-white households are more likely to rent in multifamily housing.
• On average, 31% of Black/African American residents and 22% of Hispanic/Latino residents rent multifamily housing, versus 14% of White residents.

• According to the Black Homeownership Project, "On average, Black homebuyers paid $7,000 more in closing costs than White homebuyers in New York City. That discrepancy cannot be explained by differences in lending products; the pattern holds true among both conventional mortgage borrowers and those with Federal Housing Administration (FHA) mortgage loans (federally-insured loans originated by approved lenders).
Source: ACS 2021 5-Year Estimates
1. Policy 2. Context 3. History 4. Case Studies 5. Policy in Practice
14
Racial disparities in home ownership have persisted
Across the US, white households are much more likely to own than non-white households.
• Chart indicates gap by race compared to white homeownership in NY State and the US. Eg in NY, 38% more whites own homes than Latinos
• New York’s racial and ethnic homeownership gaps are larger than the nation’s.
• In 2021, homeownership rates in NY were:
• 67% for White households
• 52% for Asian households

• 34%for Black households, and 29% for Latino/Hispanic households.
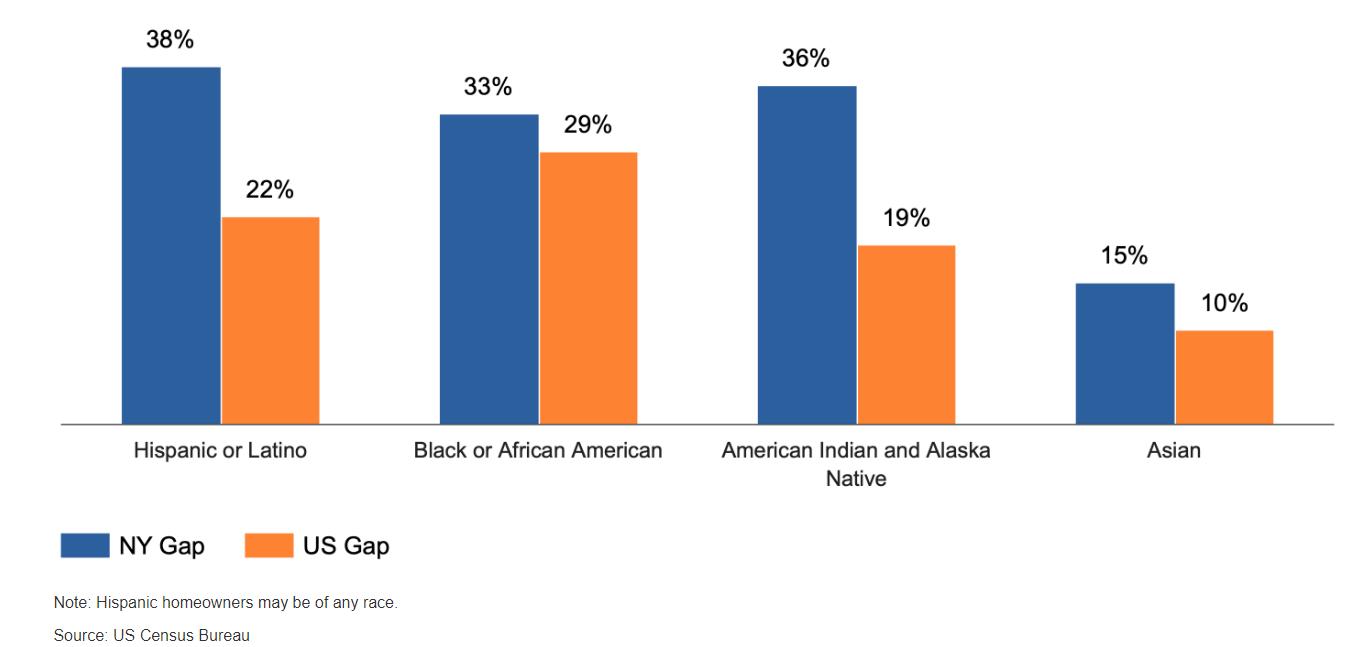
Gap in Homeownership Rates by Race, NY & US
Source: Homeownership Rates in New York | Office of the New York State Comptroller
1. Policy 2. Context 3. History 4. Case Studies 5. Policy in Practice
15
Single vs. multifamily housing opportunities
• Low density, single-family homes are by far the dominant typology in the New York suburbs
• Westchester County is an exception, with half of all units in multifamily buildings
• In Long Island, 83% of housing is single family
• More multifamily home options are needed to effectively increase the housing supply and provide the choice and economic stability that New Yorkers need.

New York City Department of City Planning, NYC Metro 2020 Housing Production Snapshot 0% 10% 20% 30% 40% 50% 60% 70% 80% 90% 100% Westchester Lower Hudson (Except Westchester) Long Island Single Family 2-4 Units 5-9 Units 10+ Units
Policy
Context
History
Case Studies
Policy in Practice Source: ACS 2021 1-Year Estimates 16
There are plenty of single-family homes
1.
2.
3.
4.
5.
Multifamily housing is missing in the suburbs

A lack of multifamily housing limits options and contributes to high costs
This especially impacts:
• Lower income households
• Young people/first time home buyers

• Seniors
Stations
LIRR/MNR
1. Policy 2. Context 3. History 4. Case Studies 5. Policy in Practice
There aren’t enough multi-family homes
Parking over housing
Too much parking and low -density housing
Many rail stations lack transitfriendly development patterns
• Surface parking lots (shown in orange)
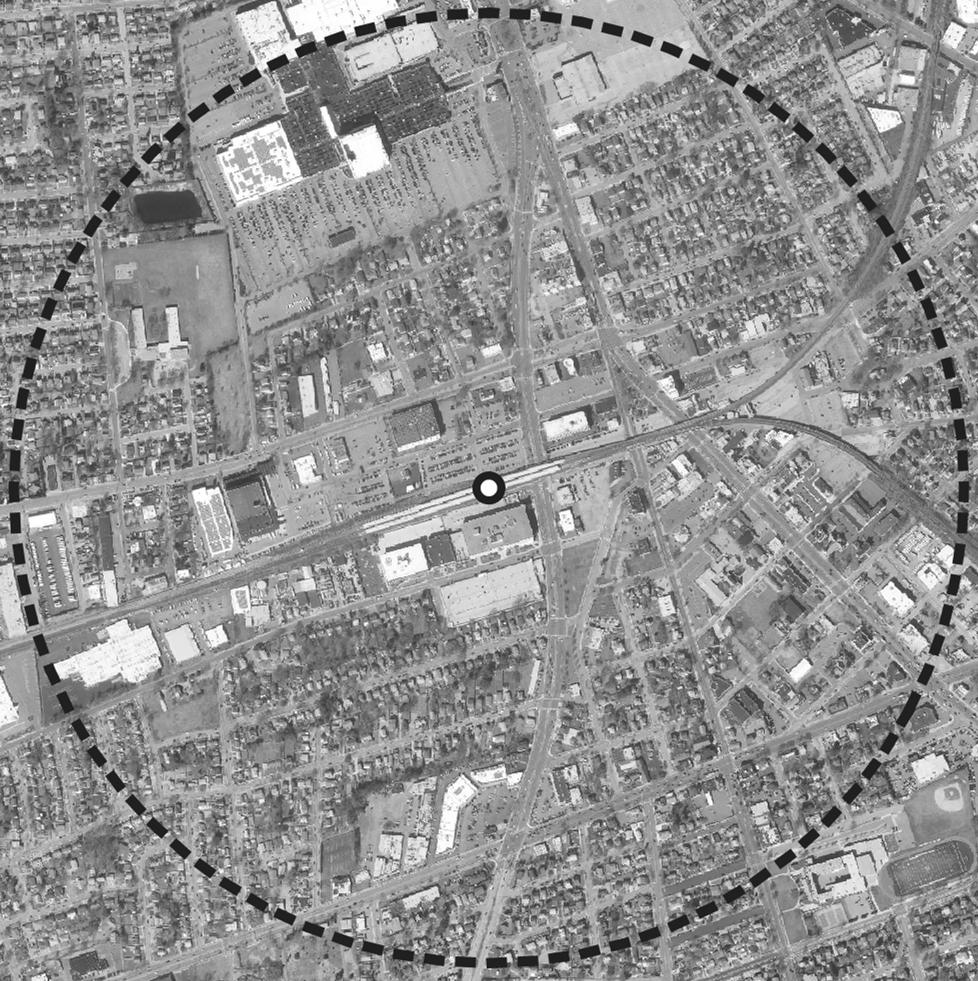
• Low density, detached housing
TOD can improve neighborhood design while maximizing ridership potential while also addressing parking needs

1. Policy 2. Context 3. History 4. Case Studies
5. Policy in Practice
3 History


A
19
digitized Homeowners Loan Corporation Map (NYC Urbanism, 2020)
Restrictive zoning underpins unaffordability

Single-family zoning contributed to housing scarcity and an urban form that reinforced car dependence.
• Zoning that limits density, whether directly (single family land use) or indirectly (large minimum lot size, large building setbacks, high parking minimums) leads to housing scarcity and a transit-unfriendly environment.
• “New York’s suburbs are failing to build any significant amount of housing…While many City residents prefer to live in a more urban environment, many would happily move to the suburbs, if housing were more available and affordable, perhaps particularly if more walkable, transit- oriented housing was available. Thus, new development in Westchester and Long Island would free up housing in the City as well, easing competition for existing units and helping to keep down price increases
Source: Ending Exclusionary Zoning in New York City's Suburbs, Furman Center, 2020

. ”
2.
Aerial image of a village in Suffolk County
1. Policy
Context 3. History 4. Case Studies 5. Policy in Practice
20
Discrimination designed racial disparities
Racist loan practices and land use tools led to nonwhite communities having less opportunities for increasing generational wealth and access to housing.
• Historic redlining and HOLC maps resulted in Black and Brown people being denied loans or having to take them with exceedingly high interest rates.

• Zoning and covenants also discriminated. Example: Penfield, NY’s records show town officials discussing how adopting its zoning code would help prevent racial “integration” and keep “colored people” out of town.
• Discrimination also happens without explicit language. The Furman Center @ NYU has concluded that New York’s suburbs often fall short of their obligations under the Fair Housing Act.
• Recent reporting by Newsday and others continues to show significant racial discrimination in the housing marketplace
Source: Ending Exclusionary Zoning in New York City's Suburbs, Furman Center, 2020

1. Policy 2. Context 3. History 4. Case Studies 5. Policy in Practice
21
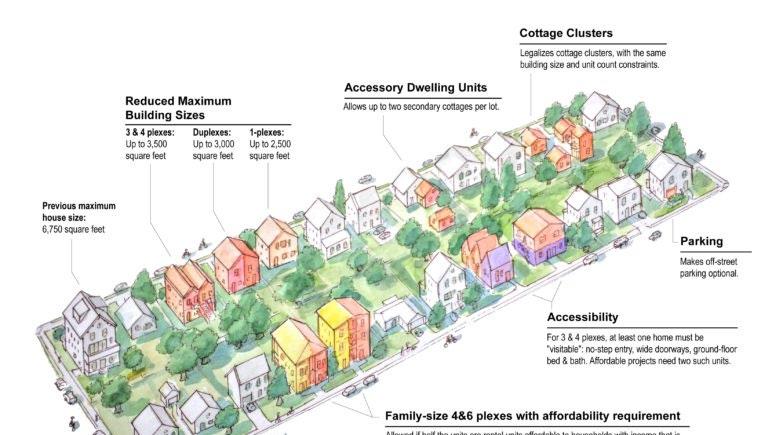
A rendering of the housing options Portland’s residential infill project would legalize (Sightline Institute, 2020)
4 Case Studies
22
Oregon’s preemption of local zoning
Residential Infill Project – requirement of housing type

• Oregon abolished single-family zoning in all cities of more than 10,000 people and in the Portland metropolitan area, and on every parcel of residentially-zoned land, it now must be permissible to build a two -unit building.
• In cities of more than 25,000 people and in the Portland region, up to four-unit buildings must be allowed in residential zones in which the min. lot area and other requirements (utilities, setbacks, parking, etc.) are met. Min. lot area ranges from 1500 sf –12000 sf.
• A fourplex on a 5,000 sf lot (0.11 acre) is equivalent to a density of 36 units per acre, which is comparable to the Housing Compact for Tiers 2 and 3.
• Other pro -housing zoning reform includes increased maximum building size and reduced parking requirements A four-plex on a 5.014 square-foot lot on 9426 N Edison St in Portland, OR.

Sources: Redfin, The Oregonian, City of Portland
Services, City of Portland Office of Assessments, Finance, and Foreclosure
1. Policy 2. Context 3. History 4. Case Studies 5. Policy in Practice
Development
23
Comparable to Tiers 2 and 3
Massachusetts’ preemption of local zoning

Section 3A – requirement of density
• Section 3A of MGL c. 40A is a law passed in 2022 that requires a community with MBTA service to have at least one zoning district of reasonable size in which multi-family housing is permitted as of right: minimum gross density of 15 units per acre and located no more than 0.5 miles from a transit station
• This is comparable to the Housing Compact for Tier 4.
• MBTA communities that are not compliant are ineligible for funding from certain funding sources provided by the Commonwealth. There are two forms of compliance: full and interim. Deadlines for compliance essentially depends on how urbanized the community is, and range from December 2023 to December 2025, the latter being for adjacent small towns.
Map showing communities with MBTA service that are subject to the new law. All areas shaded yellow, green, and teal are suburban in form.

Studies
in
1. Policy 2. Context 3. History 4. Case
5. Policy
Practice
Source: Massachusetts Executive Office of Housing and Economic Development
24
Comparable to Tier 4
California’s preemption of local zoning & TOD incentives
SB9 – requirement of housing type


• Allows lots to be split and as of right have a duplex on them. Lot splits create two parcels of similar size that are at least 1,200 square feet.
• A 2,400 sf lot could be subdivided into two 1200 sf lots. Each lot could have a duplex (that fits into a building envelope created by setback and height requirements of the municipality). 4 units/1200 sf is equivalent to 72 units/acre, which is similar to the Housing Compact for Tier 1.
• The state’s Housing and Community Development Department administers the TOD Housing Program, which is intended to encourage higher density affordable housing within 1/4 mile of transit stations. Low-interest loans are available as gap financing for rental housing developments near transit that include affordable units, or infrastructure improvements necessary for housing development
Infographic explaining SB9, CA YIMBY
1. Policy 2. Context 3. History 4. Case Studies 5. Policy in Practice Sources: California Yimby
25
Comparable to Tier1
New Jersey’s funding incentives

Transit Village Initiative – incentive for housing type

The New Jersey Department of Transportation (NJDOT) and New Jersey Transit administer the Transit Village Initiative, an incentive program for municipalities to plan and redevelop areas around transit stations using TOD standards.
• Communities create a TOD plan that satisfies Transit Village Initiative criteria, which gives the community access to staff assistance and funding opportunities
• Criteria are not density-specific, but require “transit-supportive architectural design and parking regulation” and include affordable housing
• There are currently 34 designated Transit Villages, including Morristown, Newark, Rutherford, South Amboy, and South Orange
Sources: NJ.com, New Jersey Department of Transportation
2. Context 3. History 4. Case Studies
Policy in Practice
Jocelyn Merced, a resident of The Highlands at Morristown Station, an apartment building next to the Morristown train station, walking her dog Madison. Merced, originally from Queens, N.Y., moved into the apartment building because it is so close to the train station.
1. Policy
5.
26
5 Policy in Practice


27
Sketch of TOD districts (Arup, 2023)
Huntington Station, Suffolk County
1046 New York Ave
• Construction is complete
• Abutting bus route #110
• Upstairs housing, downstairs commercial

• Parking behind the building, away from pedestrian activity
• Meets Tier 3 (20 du/acre)

Stories 1 residential
Units 12
Lot Size 0.6 acres
Density 20 du / acre
1. Policy 2. Context 3. History 4. Case Studies 5. Policy in Practice
28
Comparable to Tier 3
Exceeds Tier 1
Tuckahoe, Westchester County
64 Midland Plaza
• Construction is complete
• 7-min walk to Tuckahoe Station
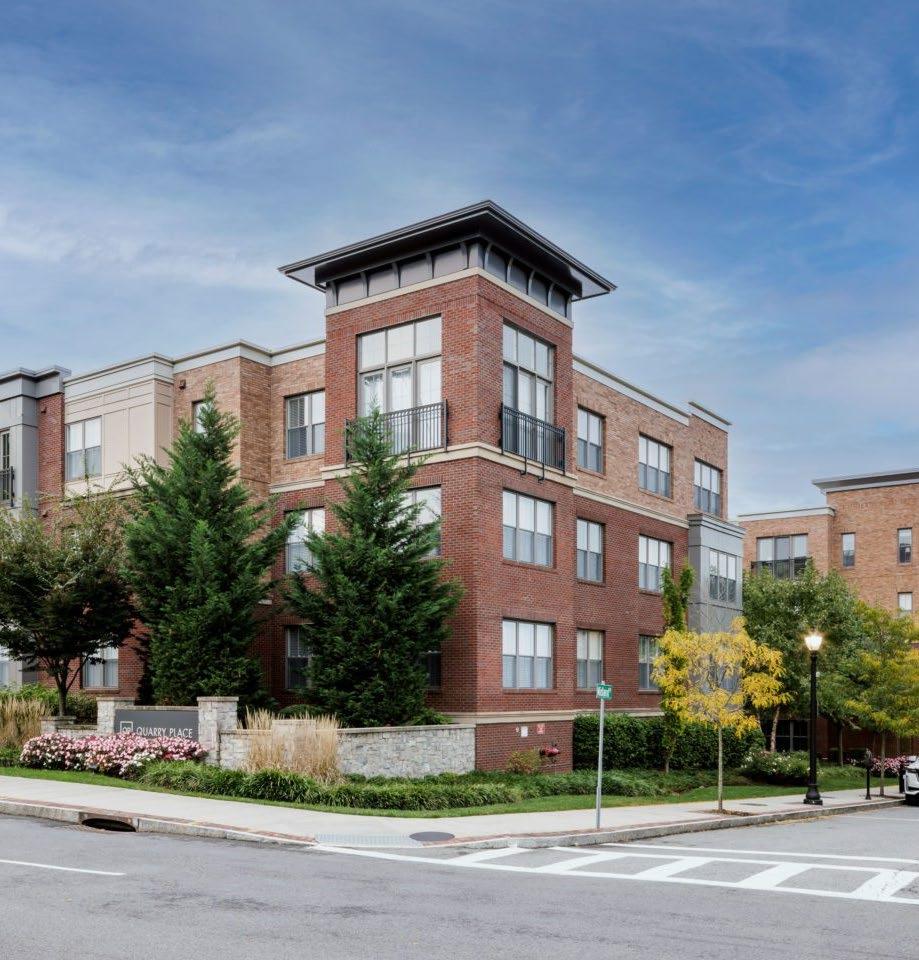
• Green features, including solar panels and green roof
• Garage parking spaces
• Exceeds Tier 1 (50 du/acre) by 44%

Stories 4 residential
Units 108
Lot Size 1.5 acres
Density 72 du / acre
1. Policy 2. Context 3. History 4. Case Studies 5. Policy in Practice
29
Tarrytown, Westchester County
62 Main Street
• Construction is underway
• Provides affordable housing for seniors, with incomes ranging from 30-70% of AMI
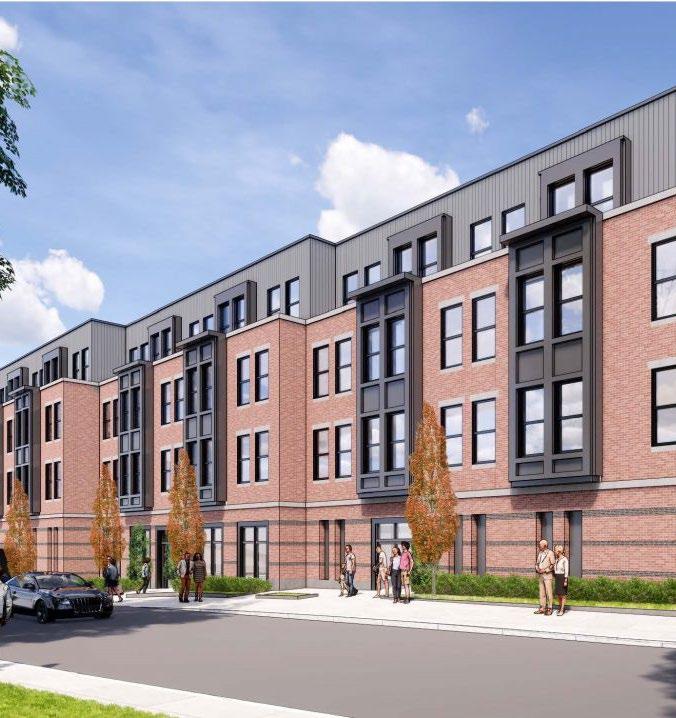
• Preserves historic 1911 façade of YMCA building, integrating with the neighborhood
• Exceeds Tier 1 (50 du/acre by 106%

Stories 4
Units 109 (100% affordable)
Lot Size 1.06 acres
Density 103 du / acre
1. Policy 2. Context 3. History 4. Case Studies 5. Policy in Practice Exceeds Tier 1 30
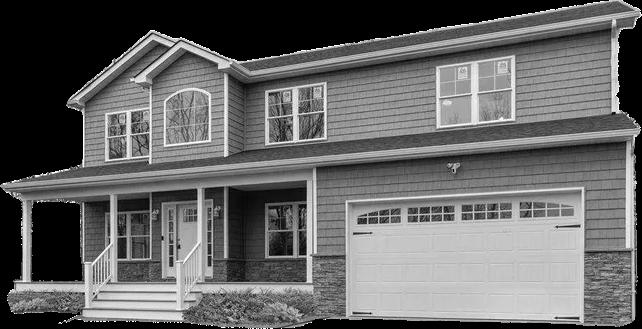
Single Family Detached
• 3 bed 2 bath, 1500 sf min
• $600k – $1.5m sale
• $3.7k – $8.3k monthly mortgage payment
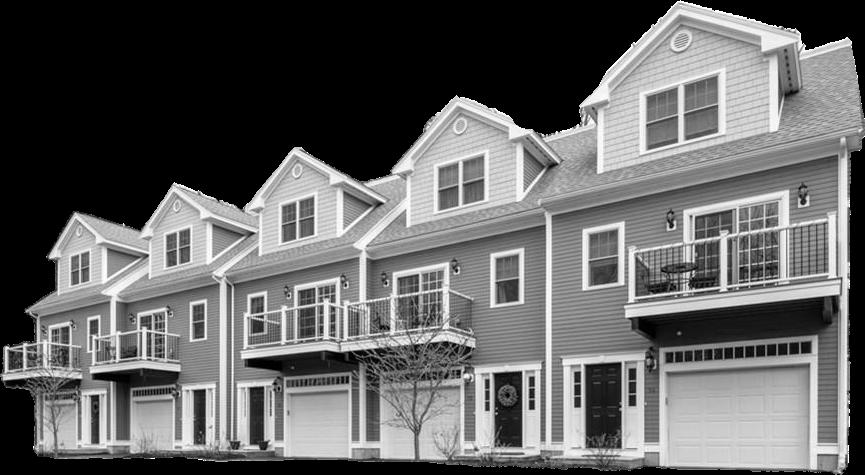
Single Family Attached
• 3 bed 2 bath, 1500 sf min
• $400k – $800k sale
• $2.5k – $5.2k monthly mortgage payment

Multifamily – 2 bed
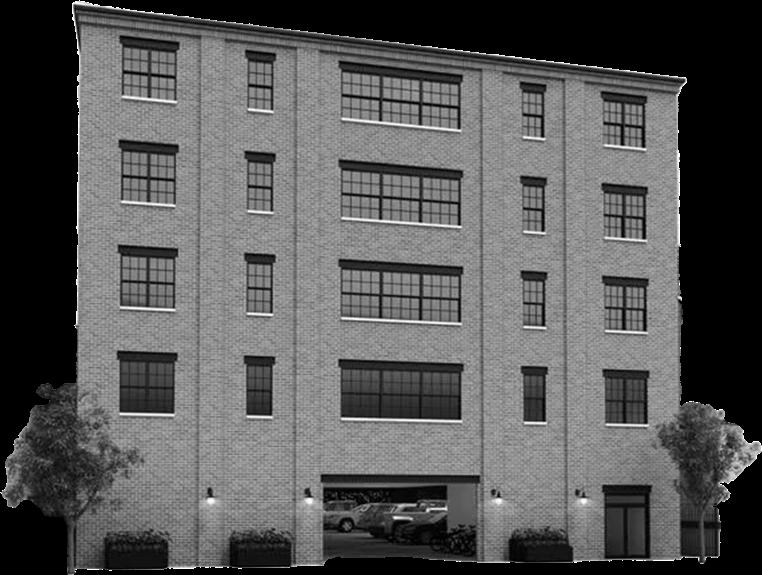
• 2 bed 1 bath, 1000 sf min
• $300k – $450k sale
• $1.9k – 2.7k monthly mortgage payment Or
Multifamily – 1 bed
• 1 bed 1 bath, 700 sf min
• $200k – $300k sale
• $1.4k – 1.9k monthly mortgage payment Or
• $3k-5k rent
• $2.5k-4k rent
1. Policy 2. Context 3. History 4. Case Studies 5. Policy in Practice
Mortgage payment is assumed to be 30-year fixed rate term, at 7.3% interest, after 10% down payment. Sources: Zillow
31
Single family dwellings are significantly more costly than multifamily dwellings
Single family homes are less affordable
Condos and Co - Ops offer more value
• Compared with single family homes, down payments and monthly costs for condos/coops are significantly lower
• Monthly payments are 15-40% less in these types of units, more typically found in multifamily developments
• Condo/coop savings over single family housing on a monthly basis:
• Nassau County – approximately $500 per month
• Suffolk County – approximately $600 per month
• Westchester County – approximately $1,400 per month
Most recent data provided by Zillow for each county. Monthly payments based on Zillow Home Value Index and assume 20% down payment 6.27% interest

$$500.00 $1,000.00 $1,500.00 $2,000.00 $2,500.00 $3,000.00 $3,500.00 $4,000.00
Nassau County Suffolk County Westchester County
Condo / Co-Op Single-family home
Estimated Monthly Mortgage Payments for Typical New Home Purchases, Zillow
1. Policy 2. Context 3. History 4. Case Studies 5. Policy in Practice 32 $2,900 $3,400 $2,150 $2,750 $2,200 $3,600
What could growth look like?
Communities will have different approaches based on local conditions.
The illustrative scenarios, are based on the new policy and the proximity to NYC.
A scenarios is provided for each of the following:

• 50 units per acre
• 30 units per acre
• 20 units per acre
• 15 units per acre
• The intention of the following illustrative scenarios, is to help communities understand the size and scale of new buildings that could be constructed under this proposal.
1. Policy 2. Context 3. History 4. Case Studies 5. Policy in Practice
Scenario Location Typology 15 miles from NYC 50 units/acre 15 - 30 miles from NYC 30 units/acre 30 – 50 miles from NYC 20 units/acre 50 miles from NYC 15 units/acre Scenario 1: Downtown Station Tier 1 Scenario 2: Commuter Station Tier 2 Scenario 3: Park & Ride Station Tier 3 Scenario 4: End- of-the-Line Station Tier 4 33
What could growth look like in Tier 1?

• In this scenario, 50 units per acre is met by focusing growth around the train station in the “opportunity” area.
• The remaining areas are lower scale housing which would be preserved and still meet the Tier 1 requirements.

1. Policy 2. Context 3. History 4. Case Studies 5. Policy in Practice
½ Mile Framework
"Tier 1- Downtown Station"
34

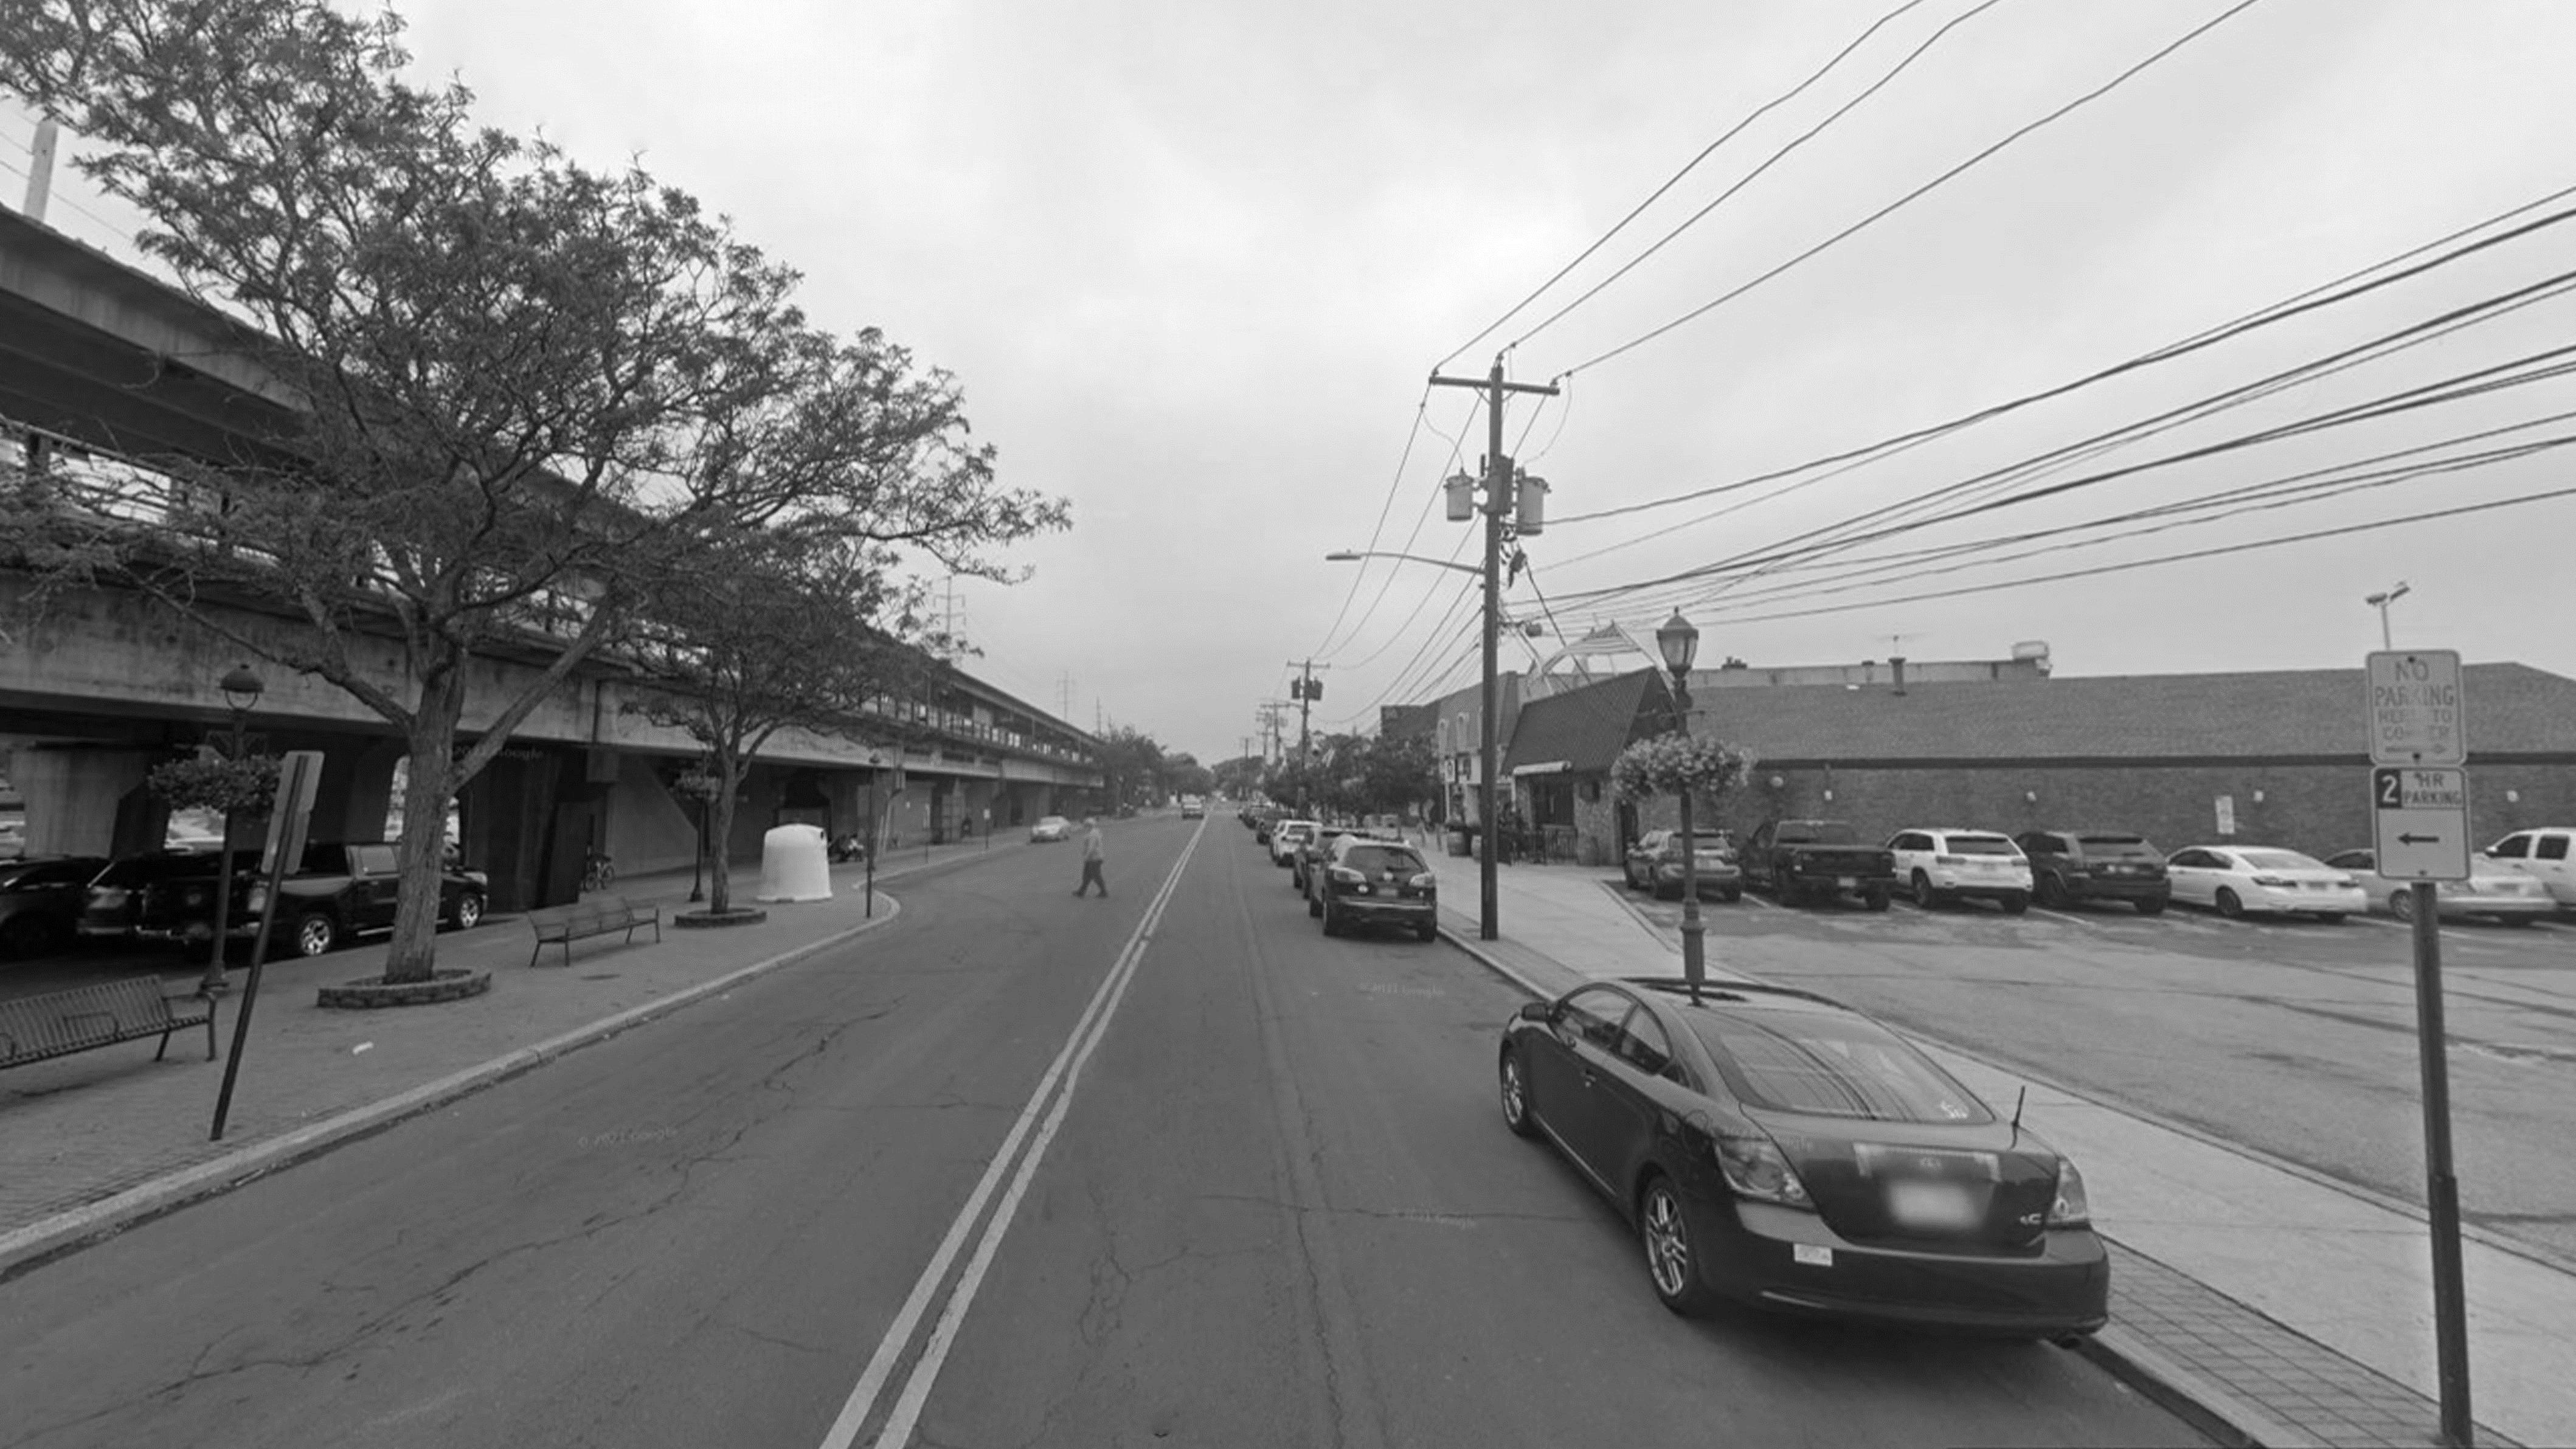
Vacant Lot to Housing and Main Street Activation Tier 1 - "Downtown Station" 1. Policy 2. Context 3. History 4. Case Studies 5. Policy in Practice 35
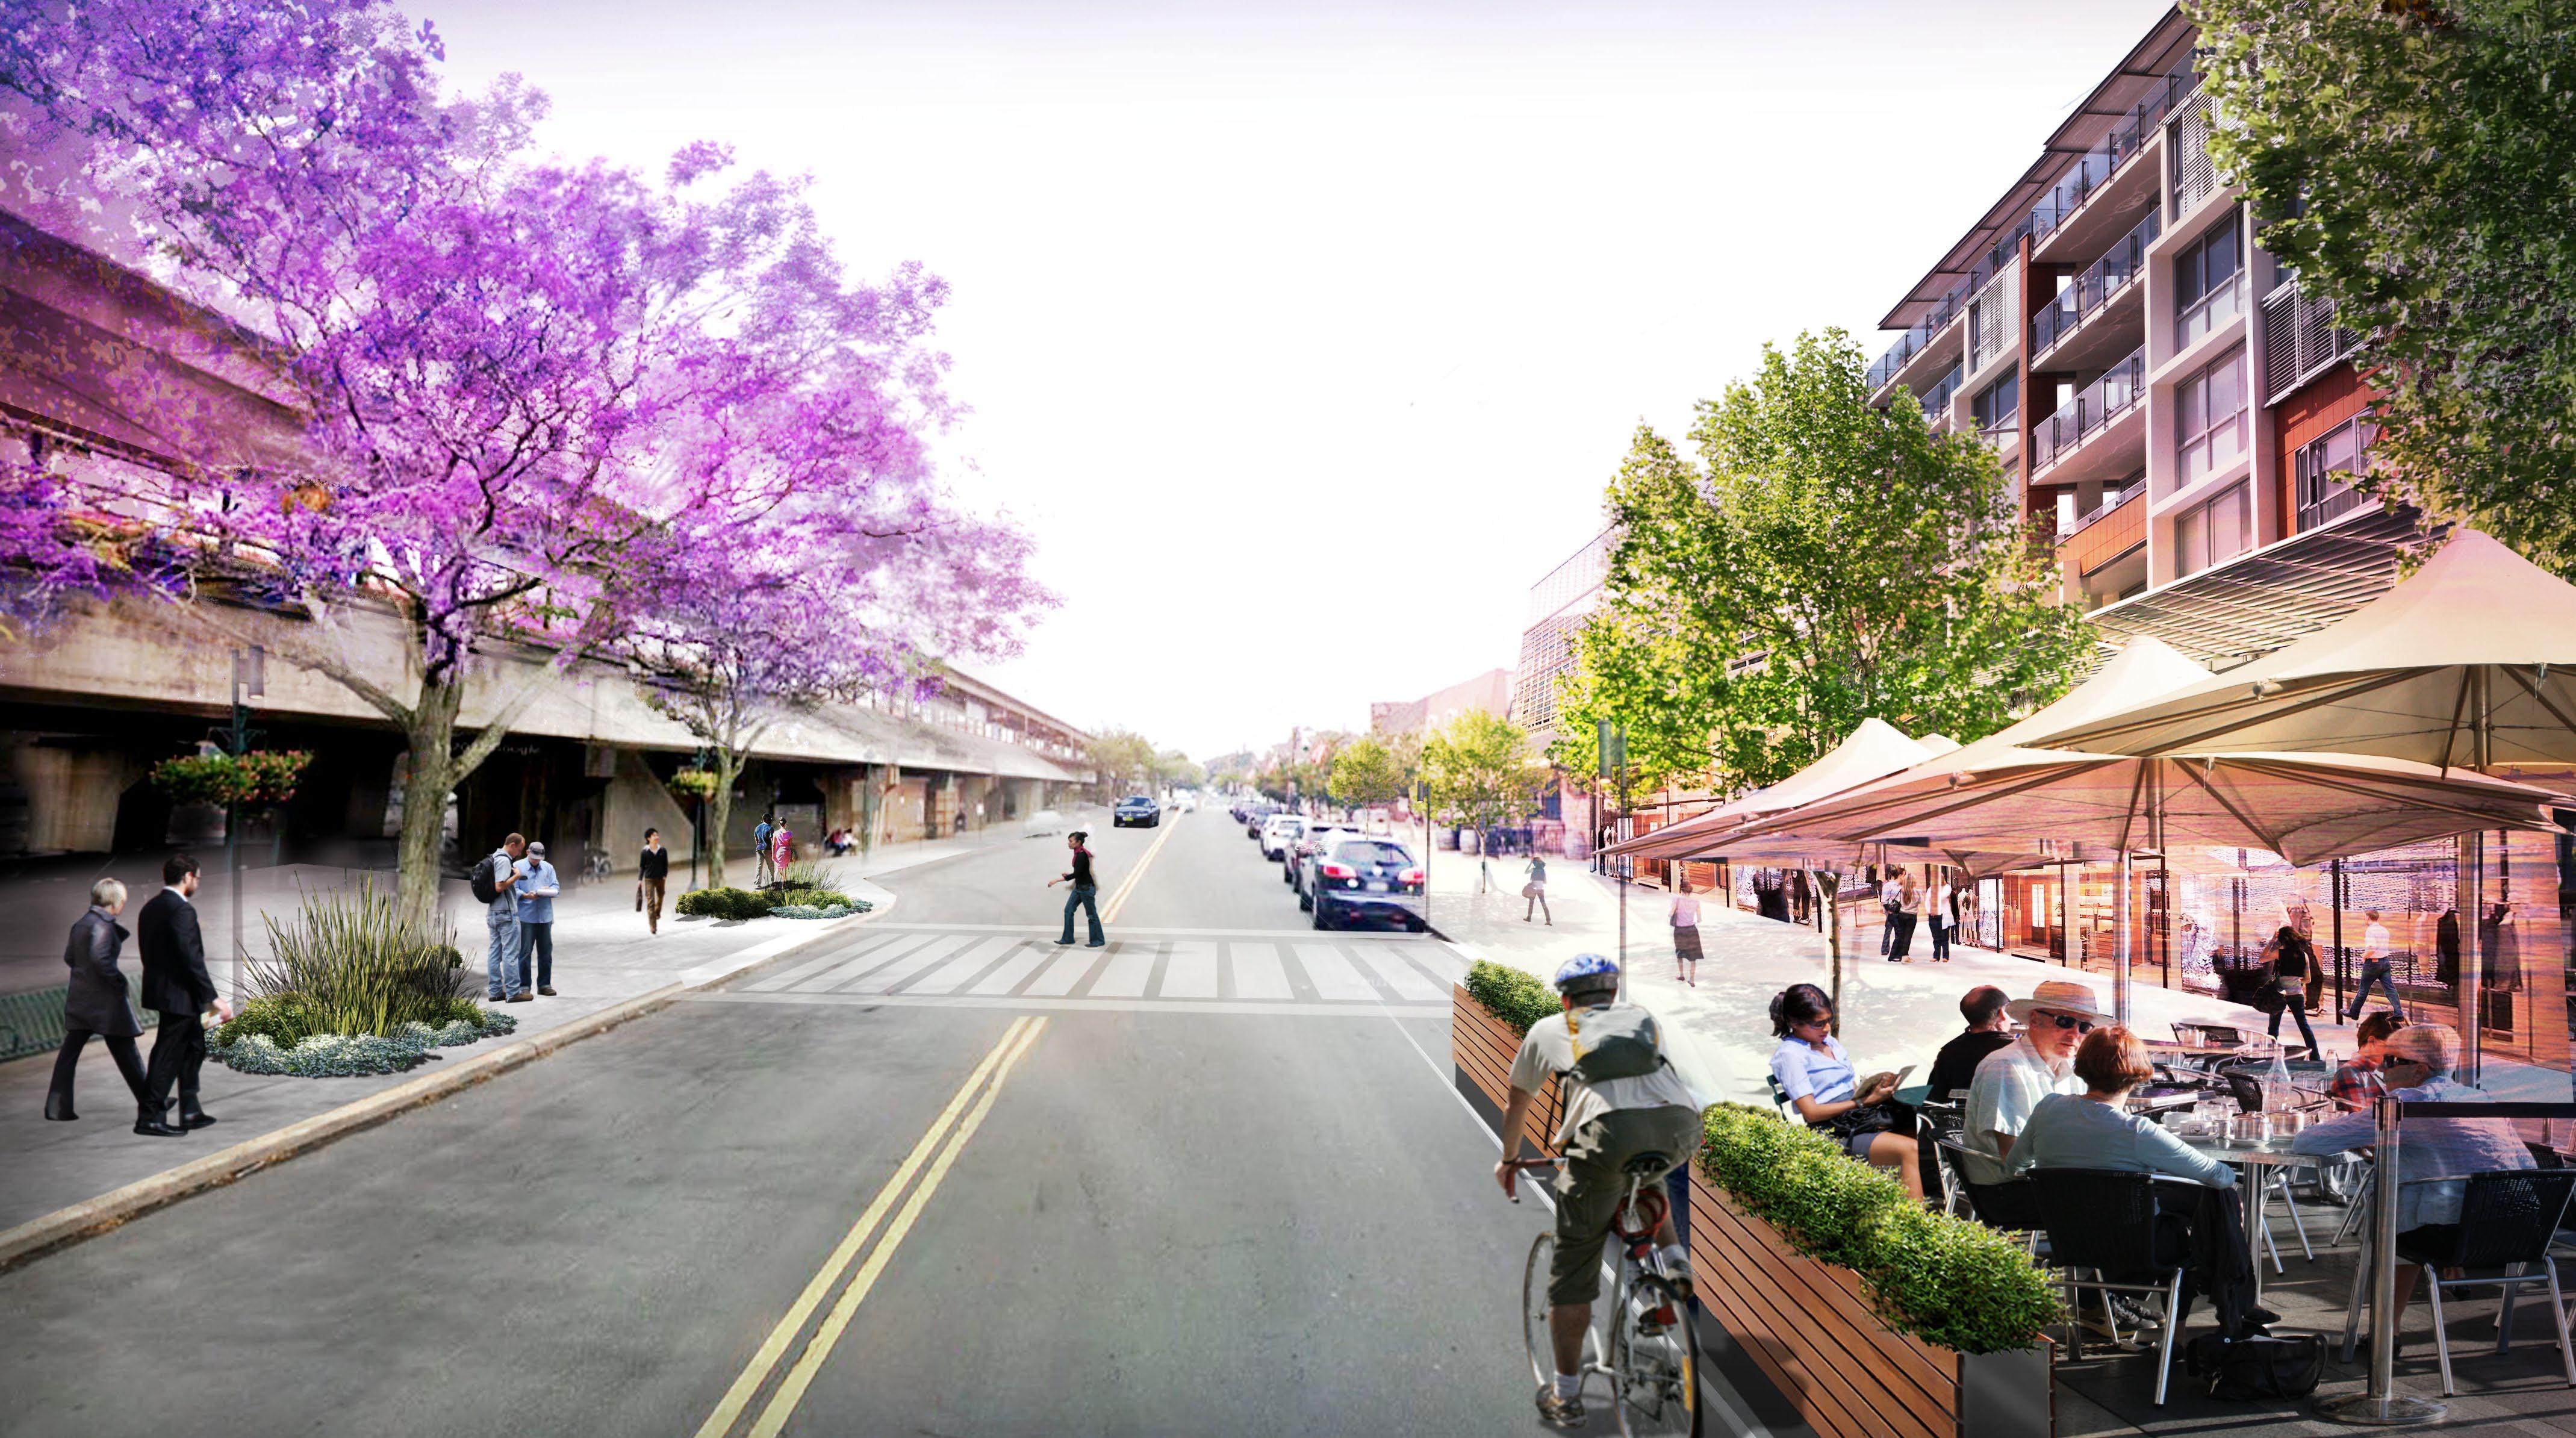
Opportunities for activation under elevated rail structures, as these provide an additional amenity and increase safety for waiting transit passengers.
New development on vacant parcels could help reinstate an active and vibrant main street.
Streetscape improvements, vegetation and enhanced pedestrian connectivity result in healthier, more walkable neighborhoods.

Active ground floor uses could enhance the ‘main street’ character and support existing local businesses.


1. Policy 2. Context 3. History 4. Case Studies 5. Policy in Practice Vacant Lot to Housing and Main Street Activation Tier 1 –
“Downtown Station”
36


1. Policy 2. Context
History 4. Case Studies
Policy in Practice
Tier
– “Downtown
3.
5.
Vacant Lot to Housing and Main Street Activation
1
Station”
What could growth look like in Tier 2?

• In this scenario, 30 units per acre is achieved with growth to the south of the station on a large, not fully occupied, commercial stretch/parking area.
• The remaining areas are active industrial areas which could remain.

Tier 2 – “Commuter Station” ½ Mile Framework 1. Policy 2. Context 3. History 4. Case Studies 5. Policy in Practice
38

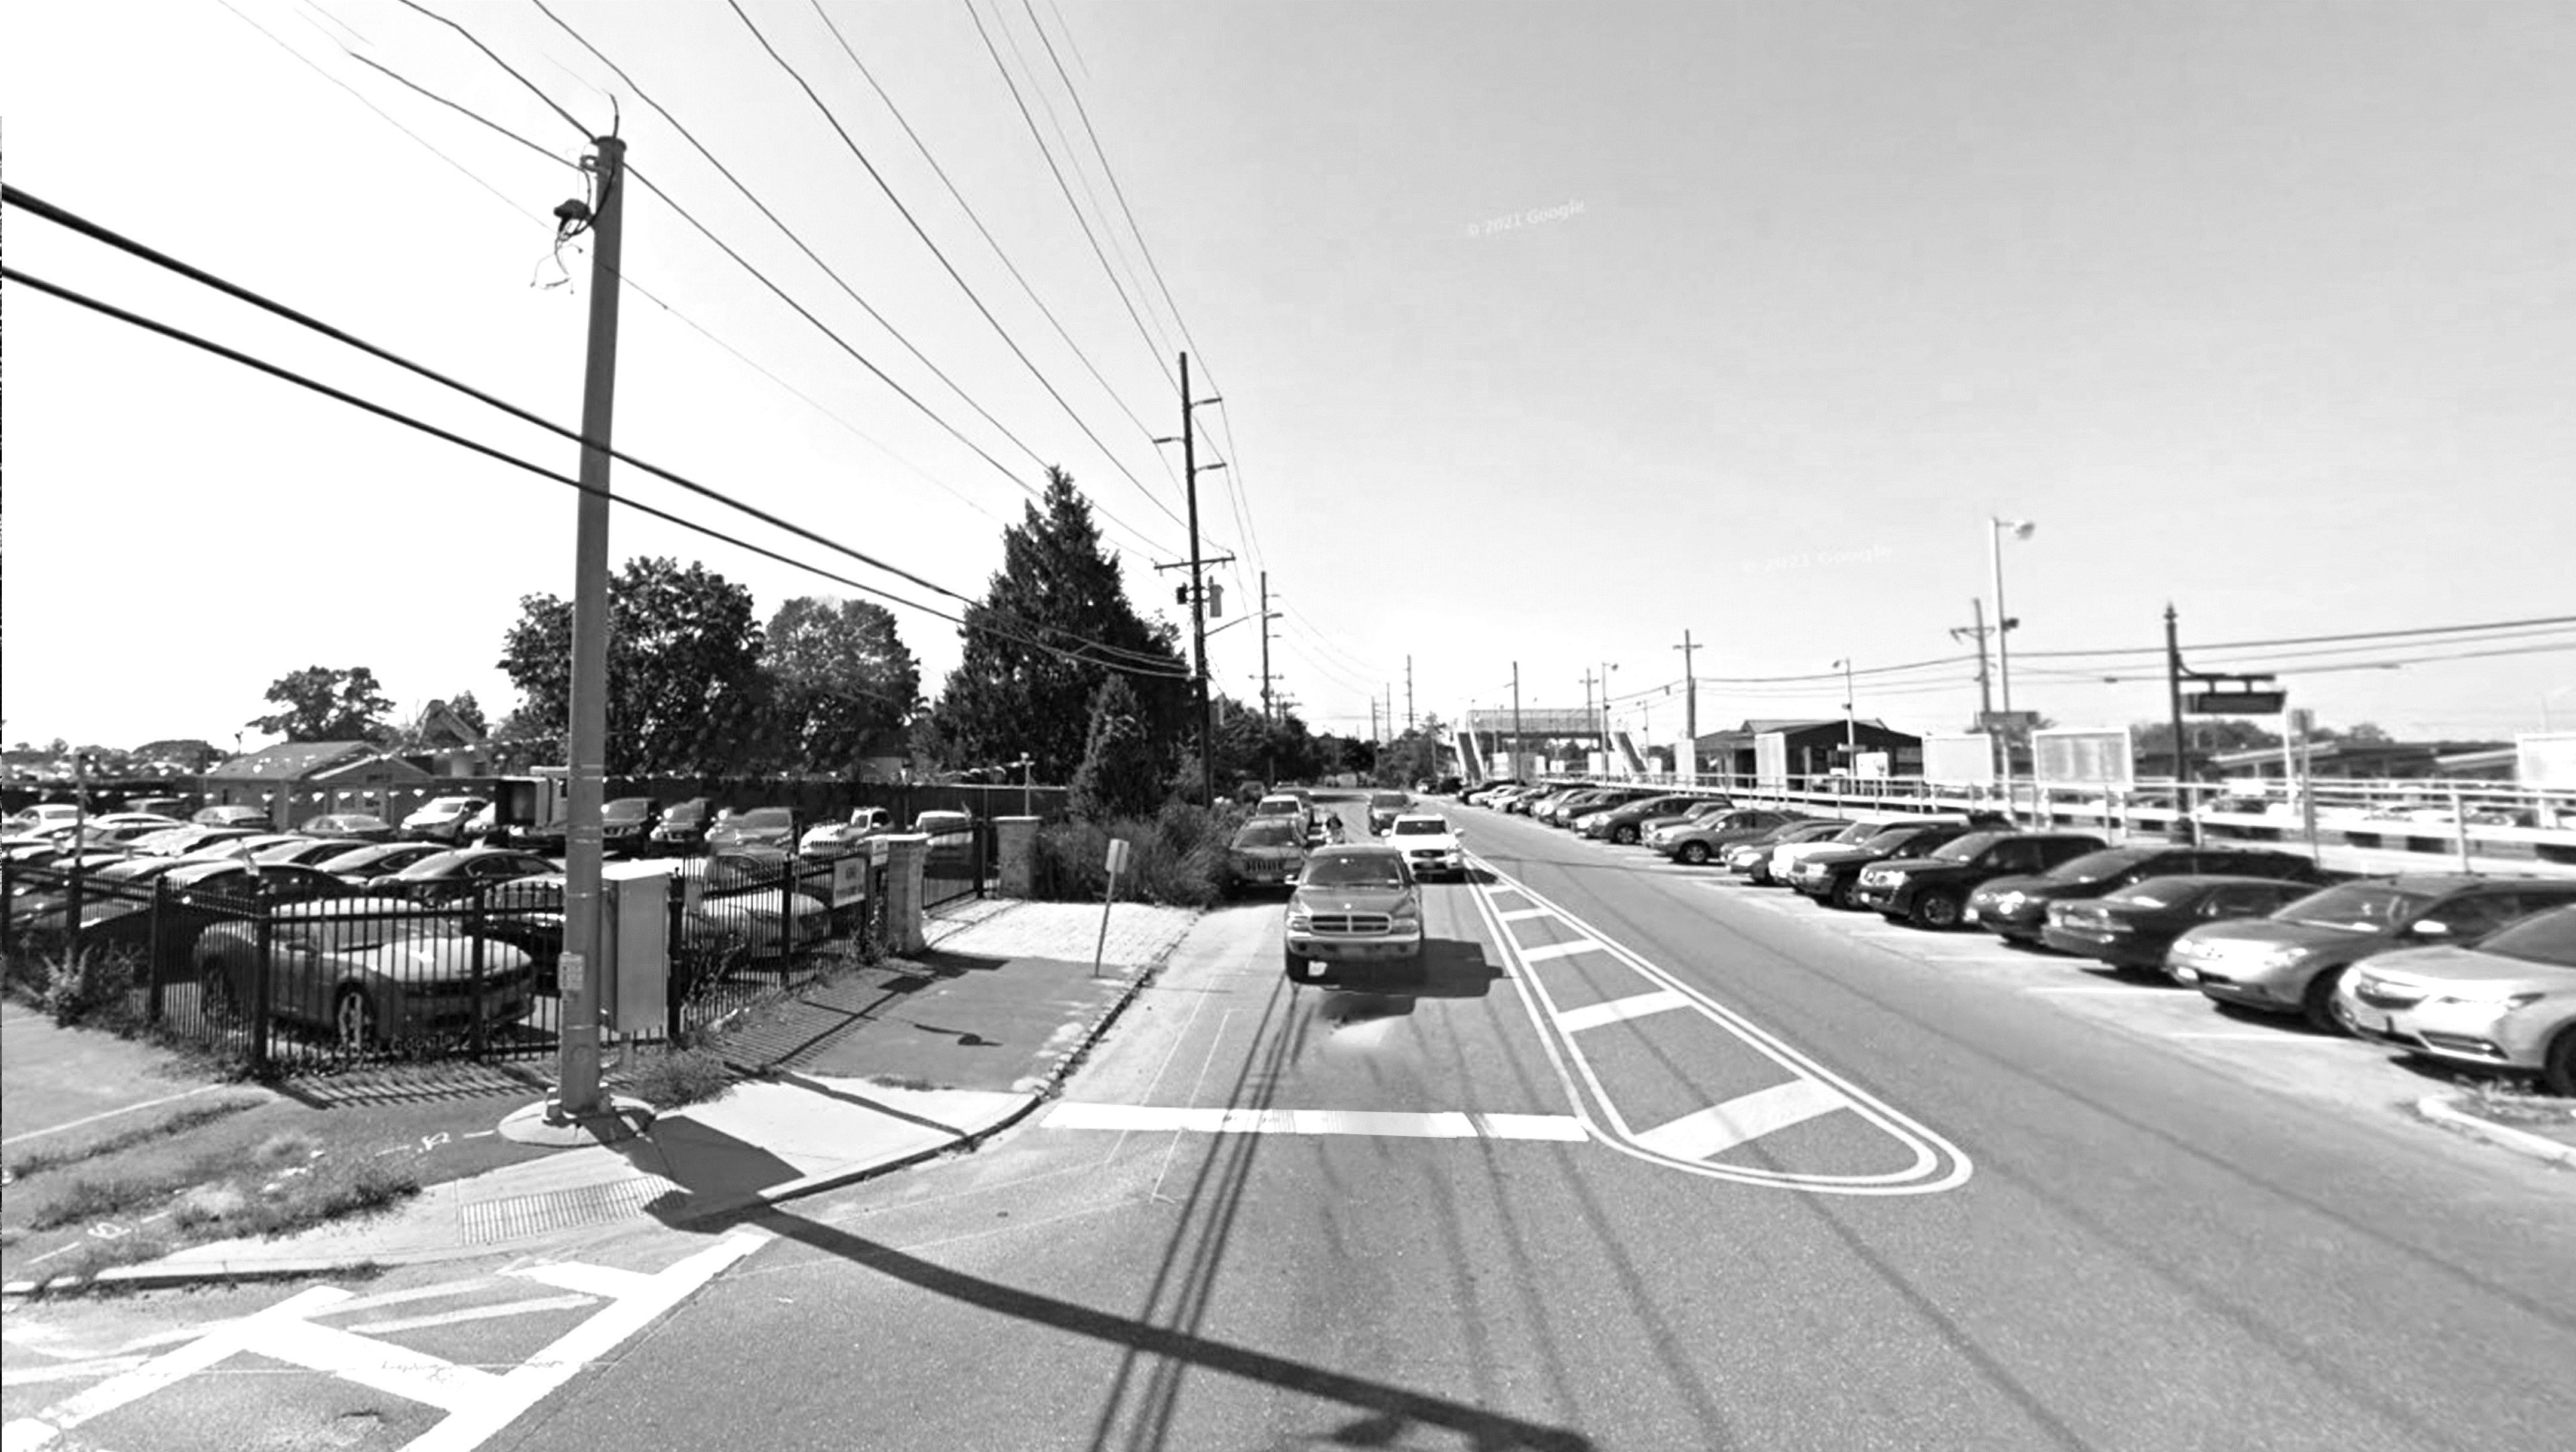
Tier 2 – “Commuter Station” Industrial to Mixed Use and Livable Streets 1. Policy 2. Context 3. History 4. Case Studies 5. Policy in Practice 39
New housing brings new communities, which are a potential catalyst for diversified business opportunities and new customers.
Cafés, retail, and other active ground floor uses would encourage ‘eyes on the street’ principles and increase safety at stations.


Possible new transit amenity, including shade and an enhanced pedestrian amenity.
Public realm improvements that contribute to traffic calming and offer environmental co-benefits.

Industrial to Mixed Use and Livable Streets Tier 2 – “Commuter Station” 1. Policy 2. Context 3. History 4. Case Studies 5. Policy in Practice
40
Tier 2 – “Commuter Station”


Industrial to Mixed Use and Livable Streets 1. Policy 2. Context
3. History 4. Case Studies
5. Policy in Practice
What could growth look like in Tier 3?

• In this scenario, 20 units per acre is achieved by developing on surface parking with new parking being adding below the new buildings.
• The remaining areas are lower scale housing that could remain, plus a large transportation facility which serves the broader region.

Tier 3 – “Park & Ride Station” ½ Mile Framework 1. Policy 2. Context 3. History 4. Case Studies 5. Policy in Practice
42
Tier 3 – “Park & Ride Station”
Parking Lot to Housing & Multimodal Mobility
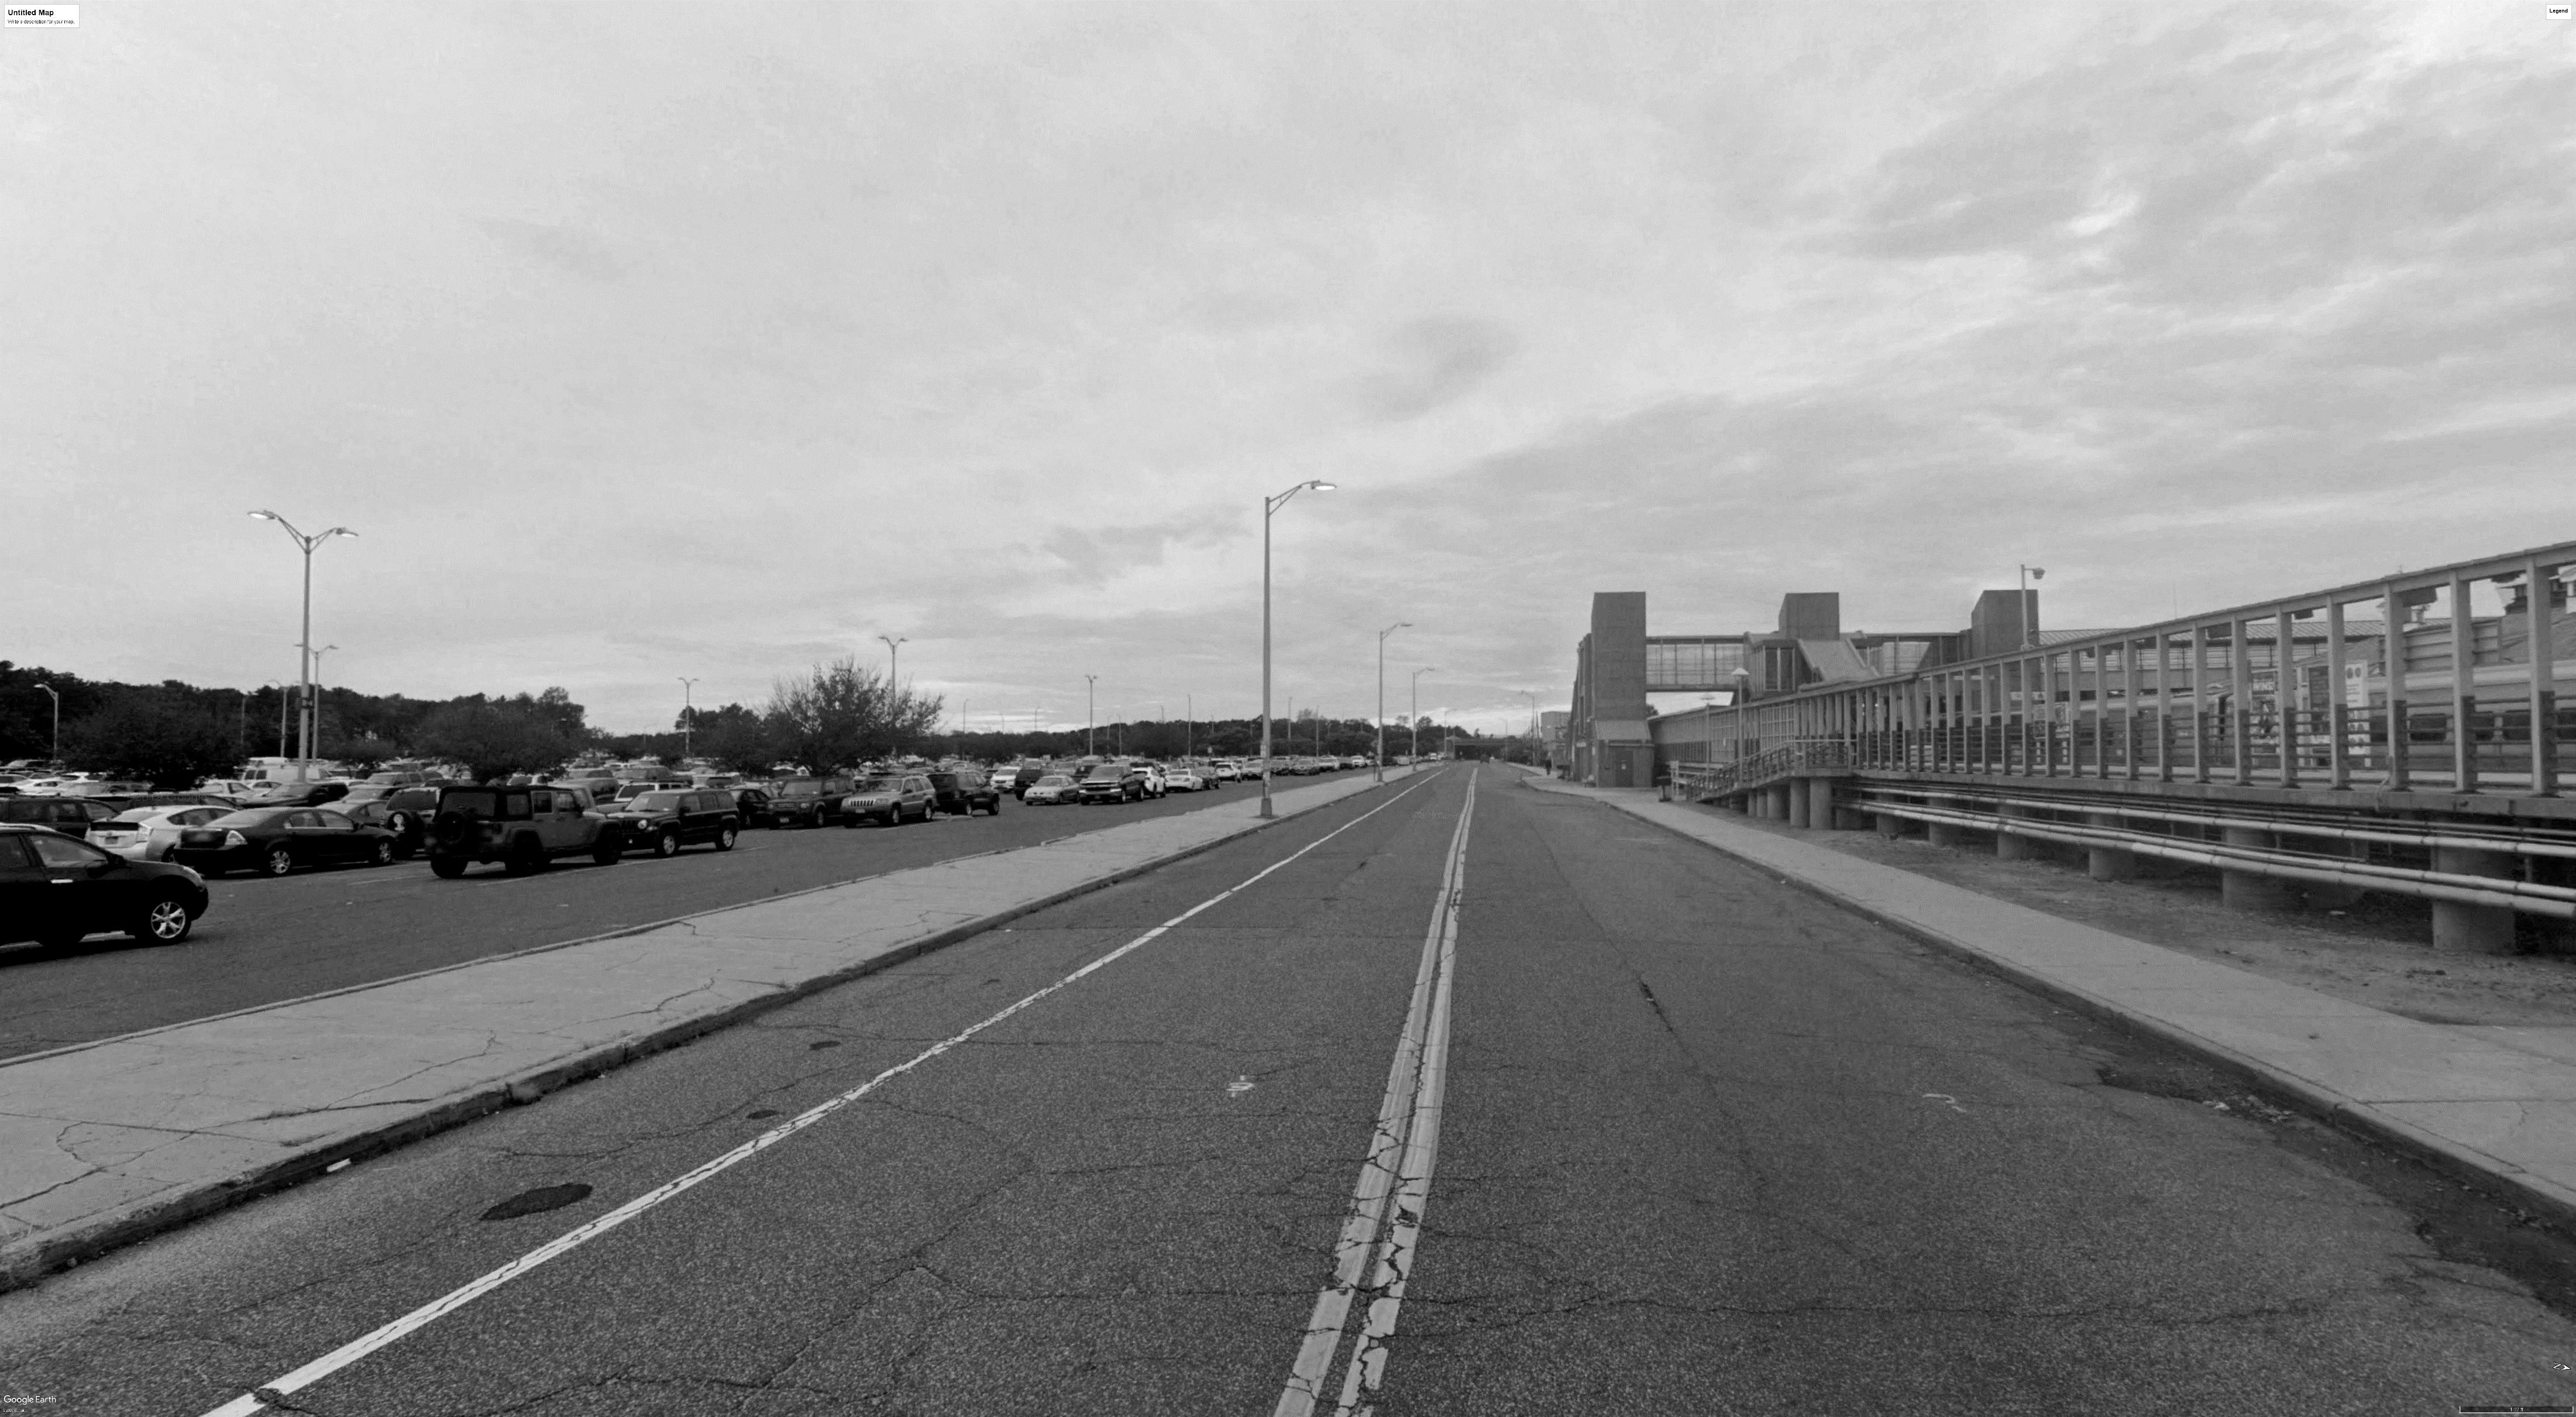
1. Policy 2. Context 3. History 4. Case Studies 5. Policy in Practice
43
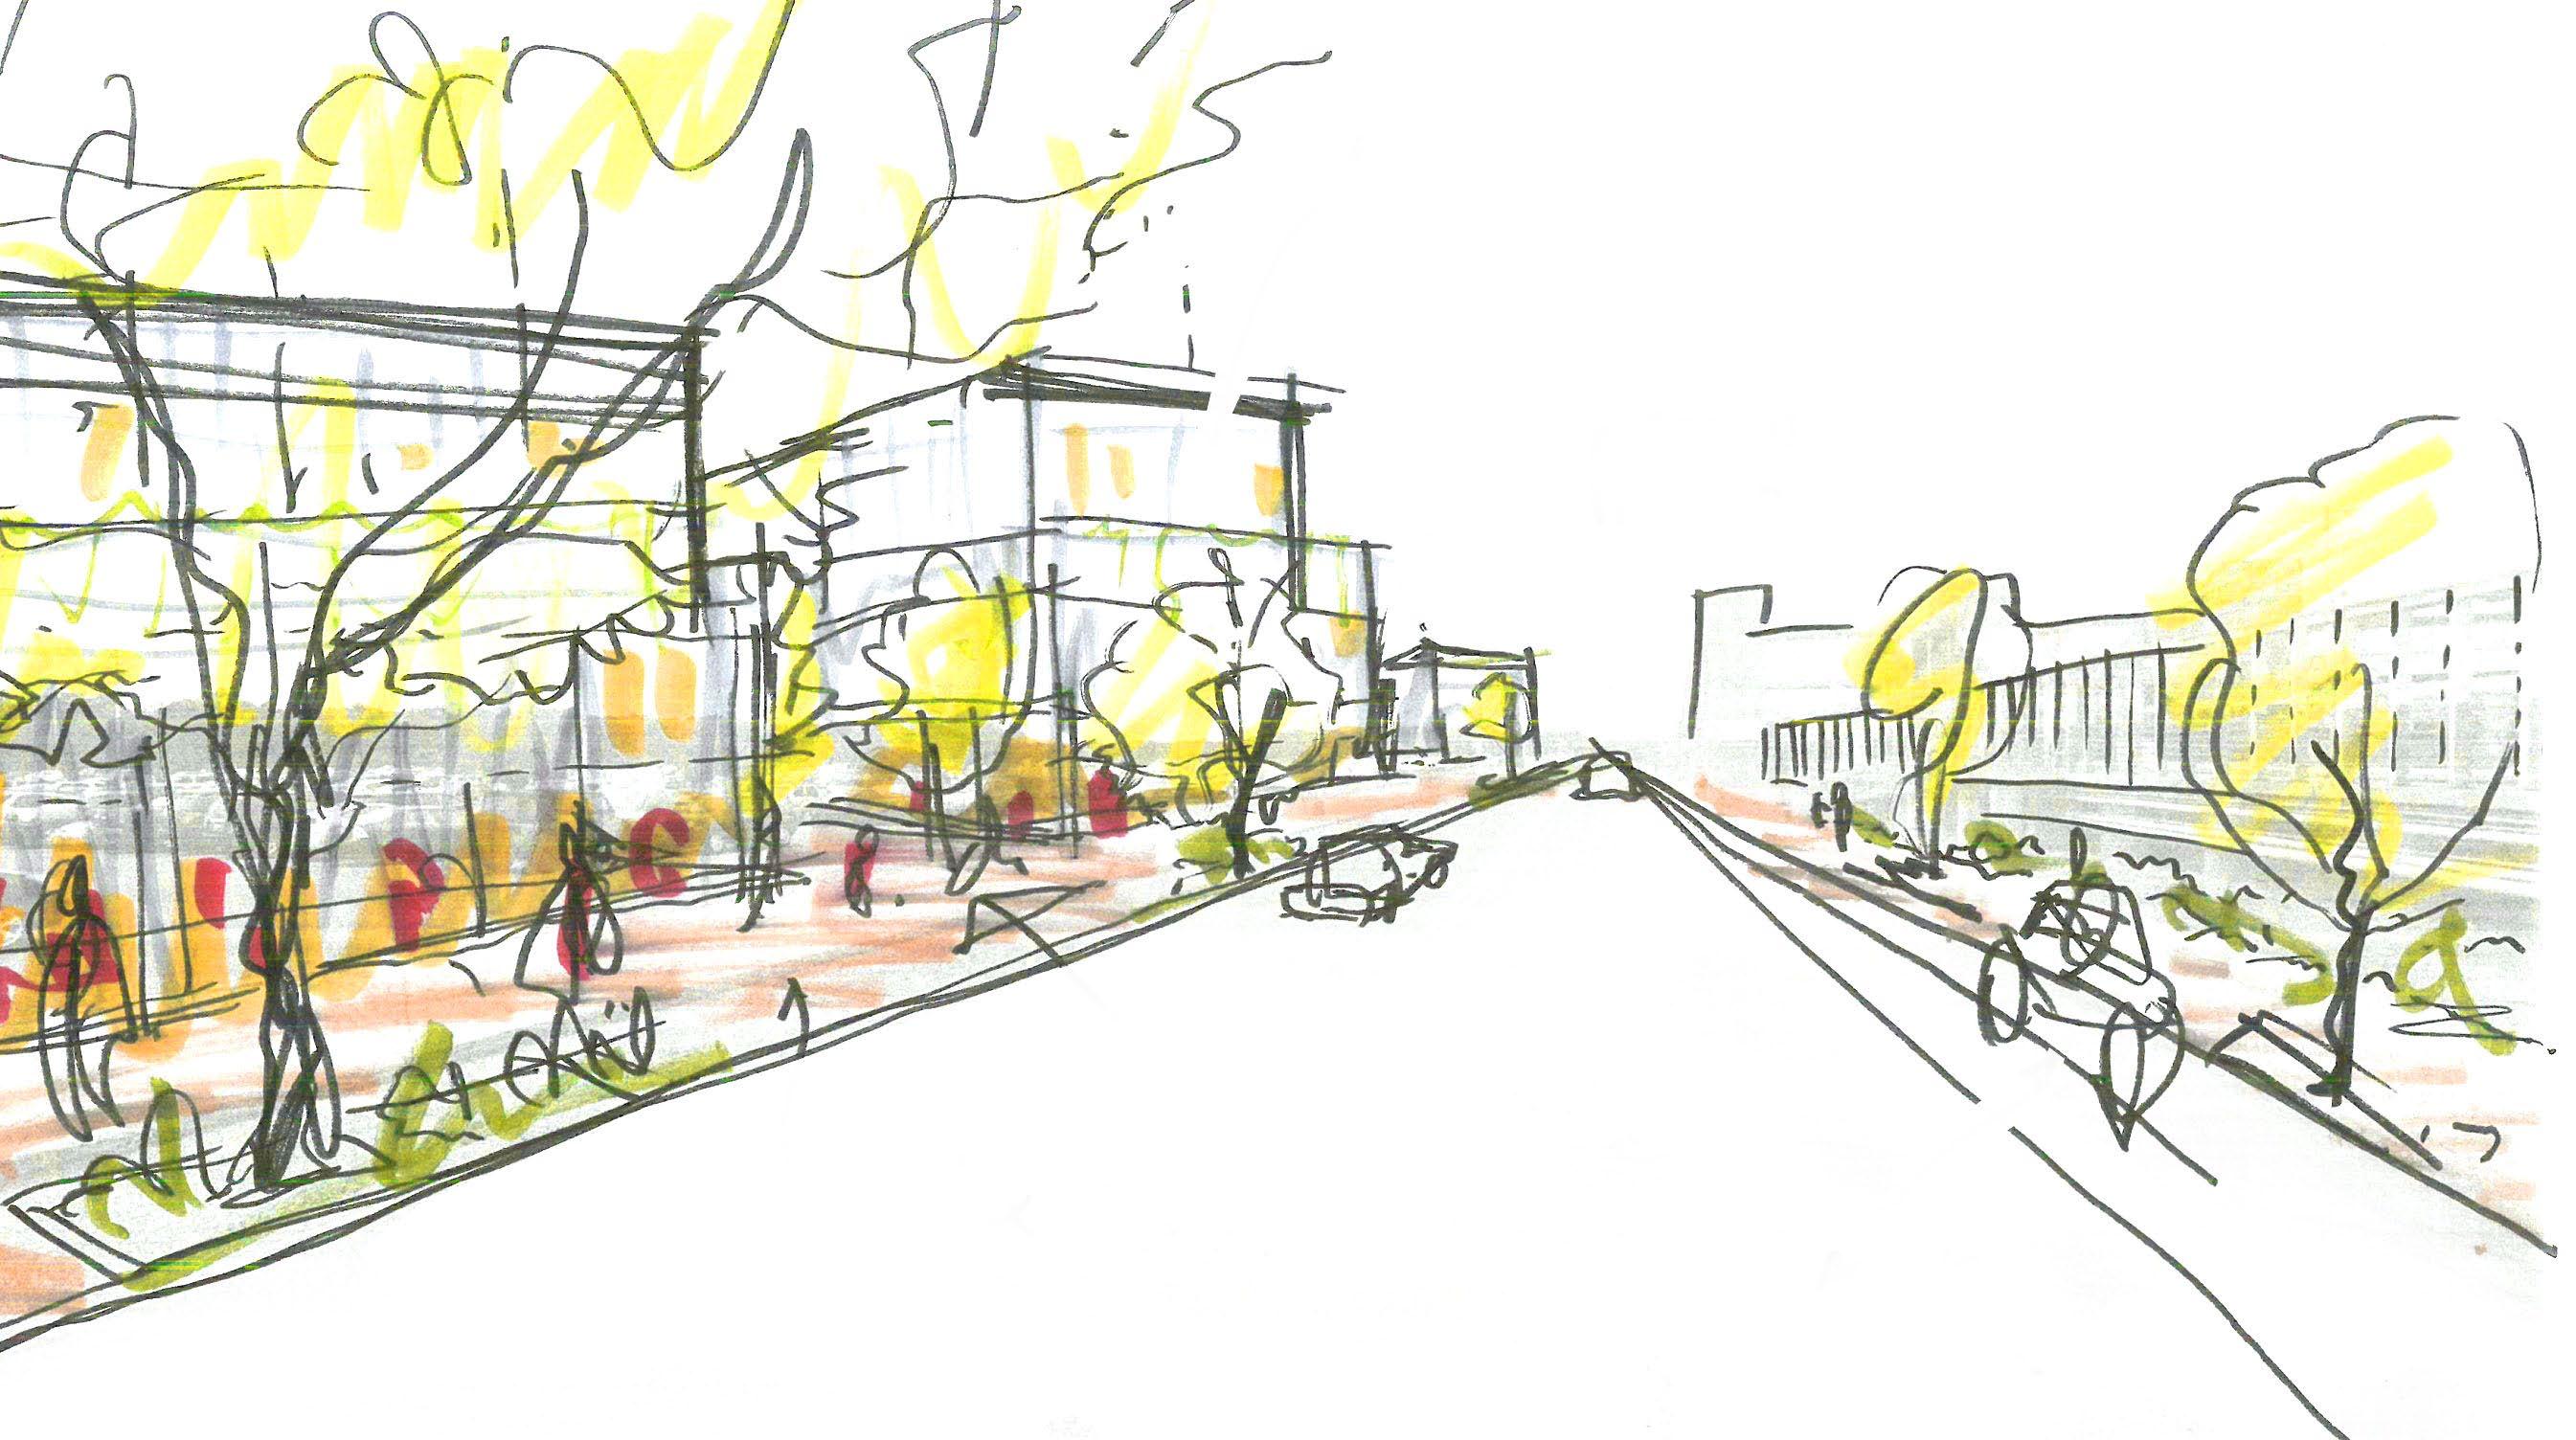
Affordable housing options for families at different price points.

Land development features such as open space and retail will enhances activation and safety for residents, workers, and transit passengers.
Parking demand is integrated into the land development. Underground parking could be a consideration.
Parking Lot to Housing & Multimodal Mobility


Active travel amenities provide robust transportation options for last mile travel.
1. Policy 2. Context 3. History 4. Case Studies 5. Policy in Practice
Tier
–
3
“Park & Ride Station”
44
Tier 3 – “Park & Ride Station”


Parking Lot to Housing & Multimodal Mobility

Policy
1.
Context
2.
History
3.
Case Studies
4.
Policy
Practice
5.
in
What could growth look like in Tier 4?

• In this scenario, 15 units per acre is met by adding new infill housing next to existing housing.
• Most of the growth in this scenario would occur along the train line and adjacent two -lane highway in the form of infill housing.
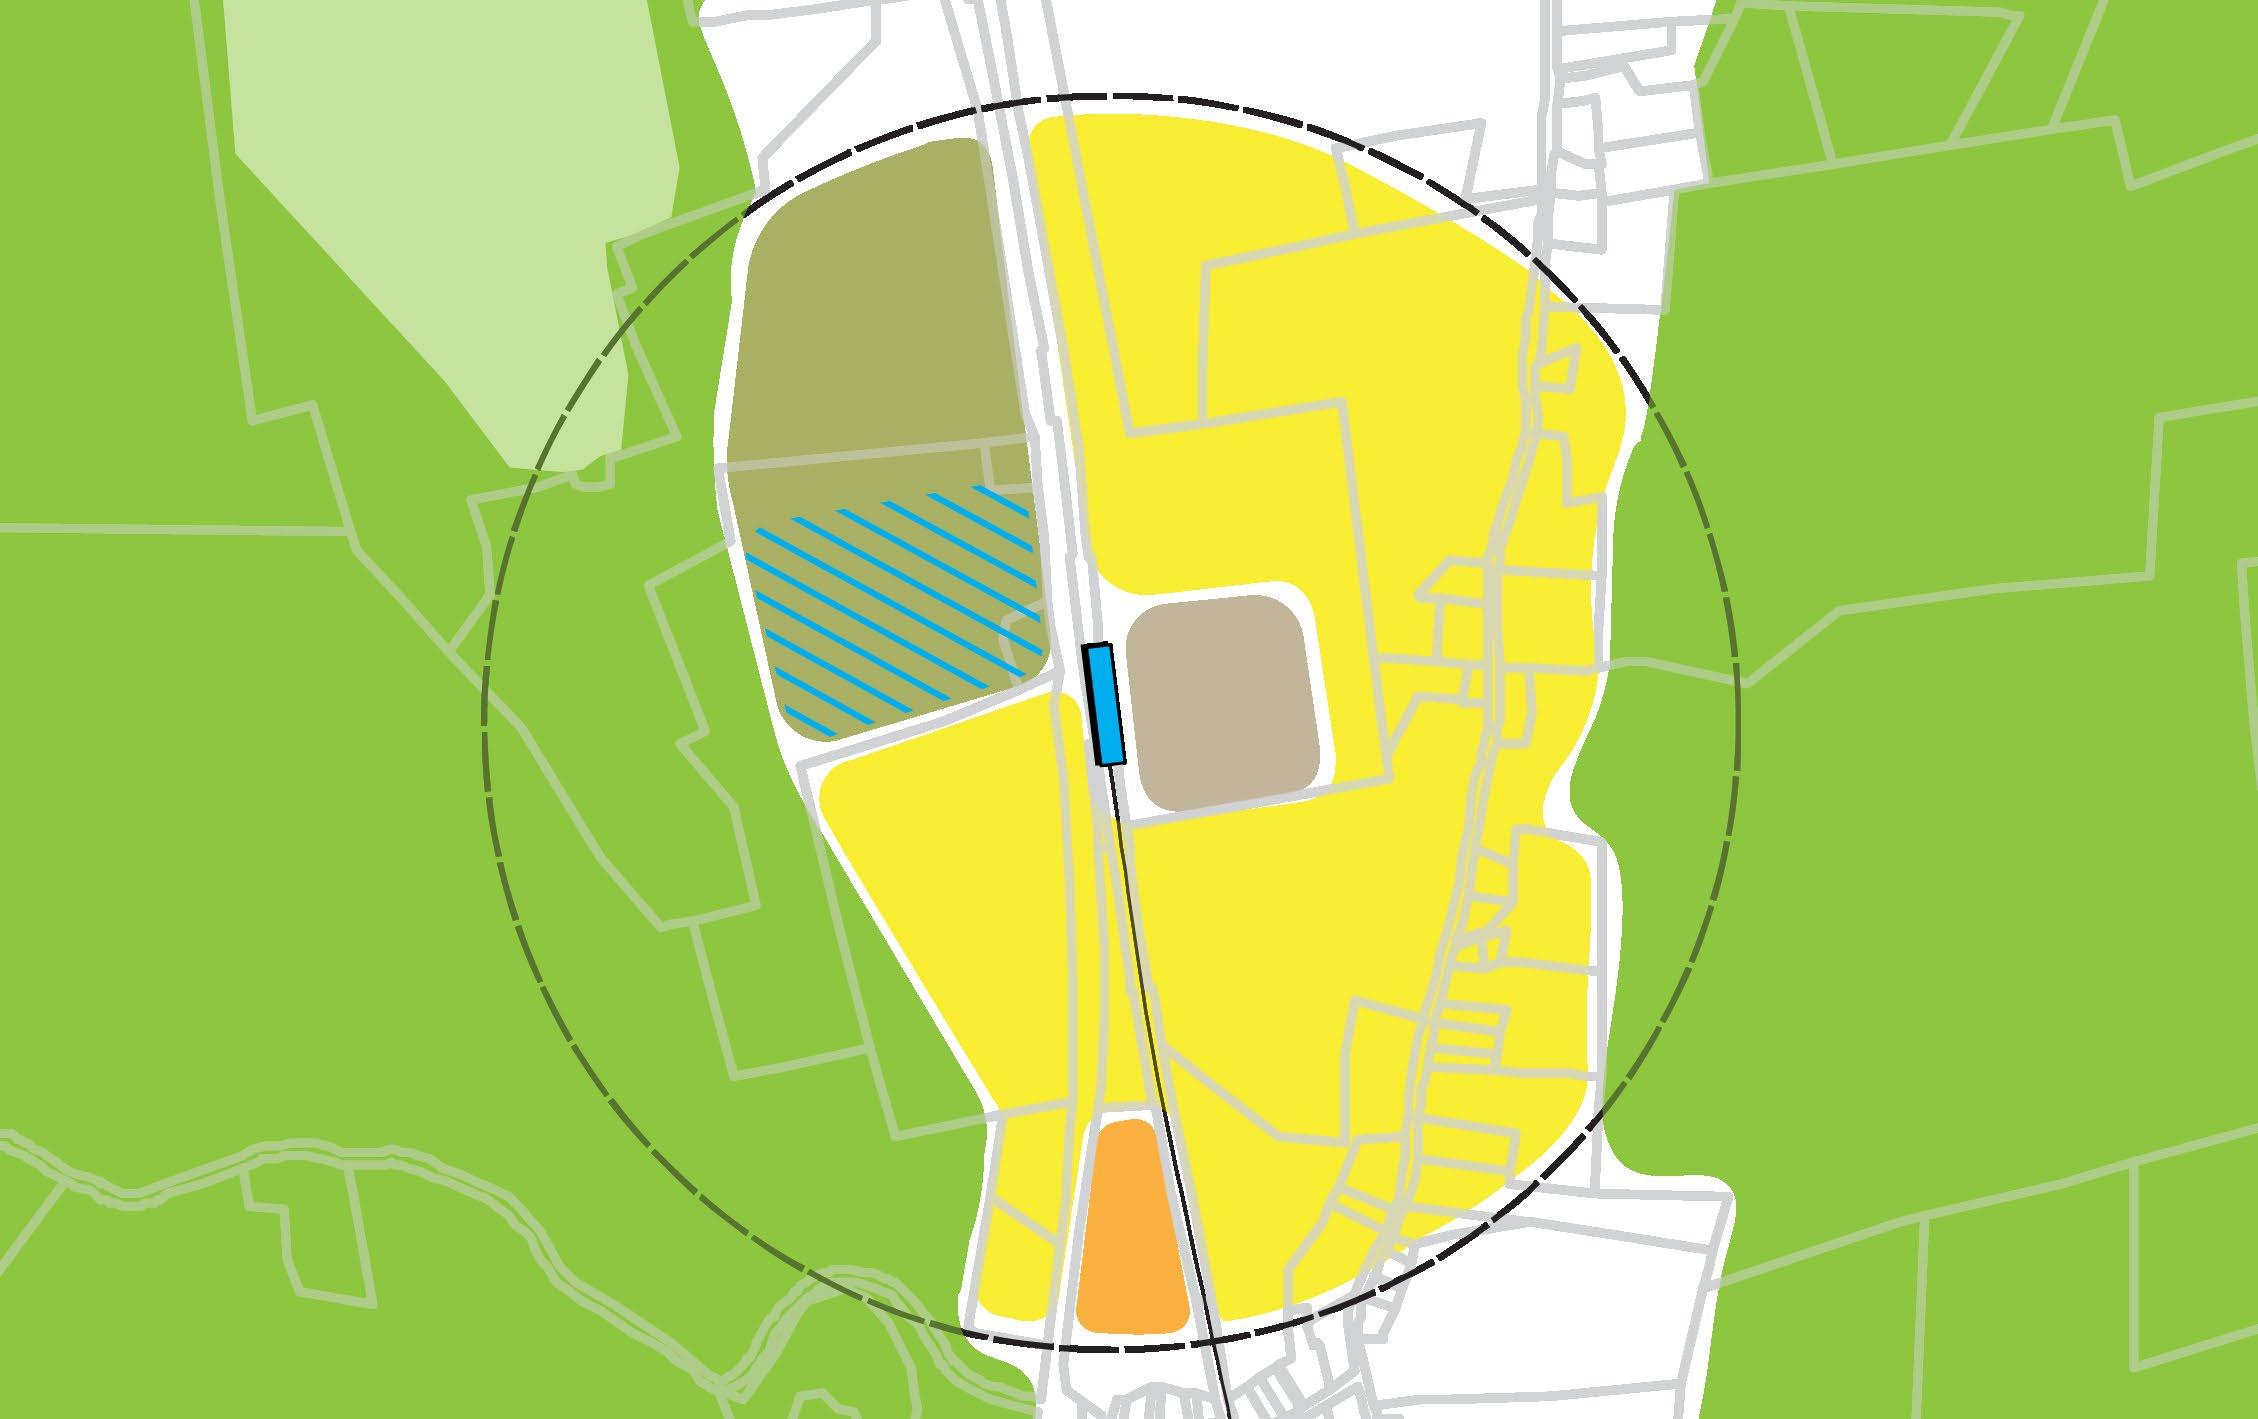
½ Mile Framework 1. Policy 2. Context 3. History 4. Case Studies 5. Policy in Practice
Tier 4 – “End- of-the-Line Station”
Agricultural
Transit Use
46
Residences Retained
Areas
Residences Retained

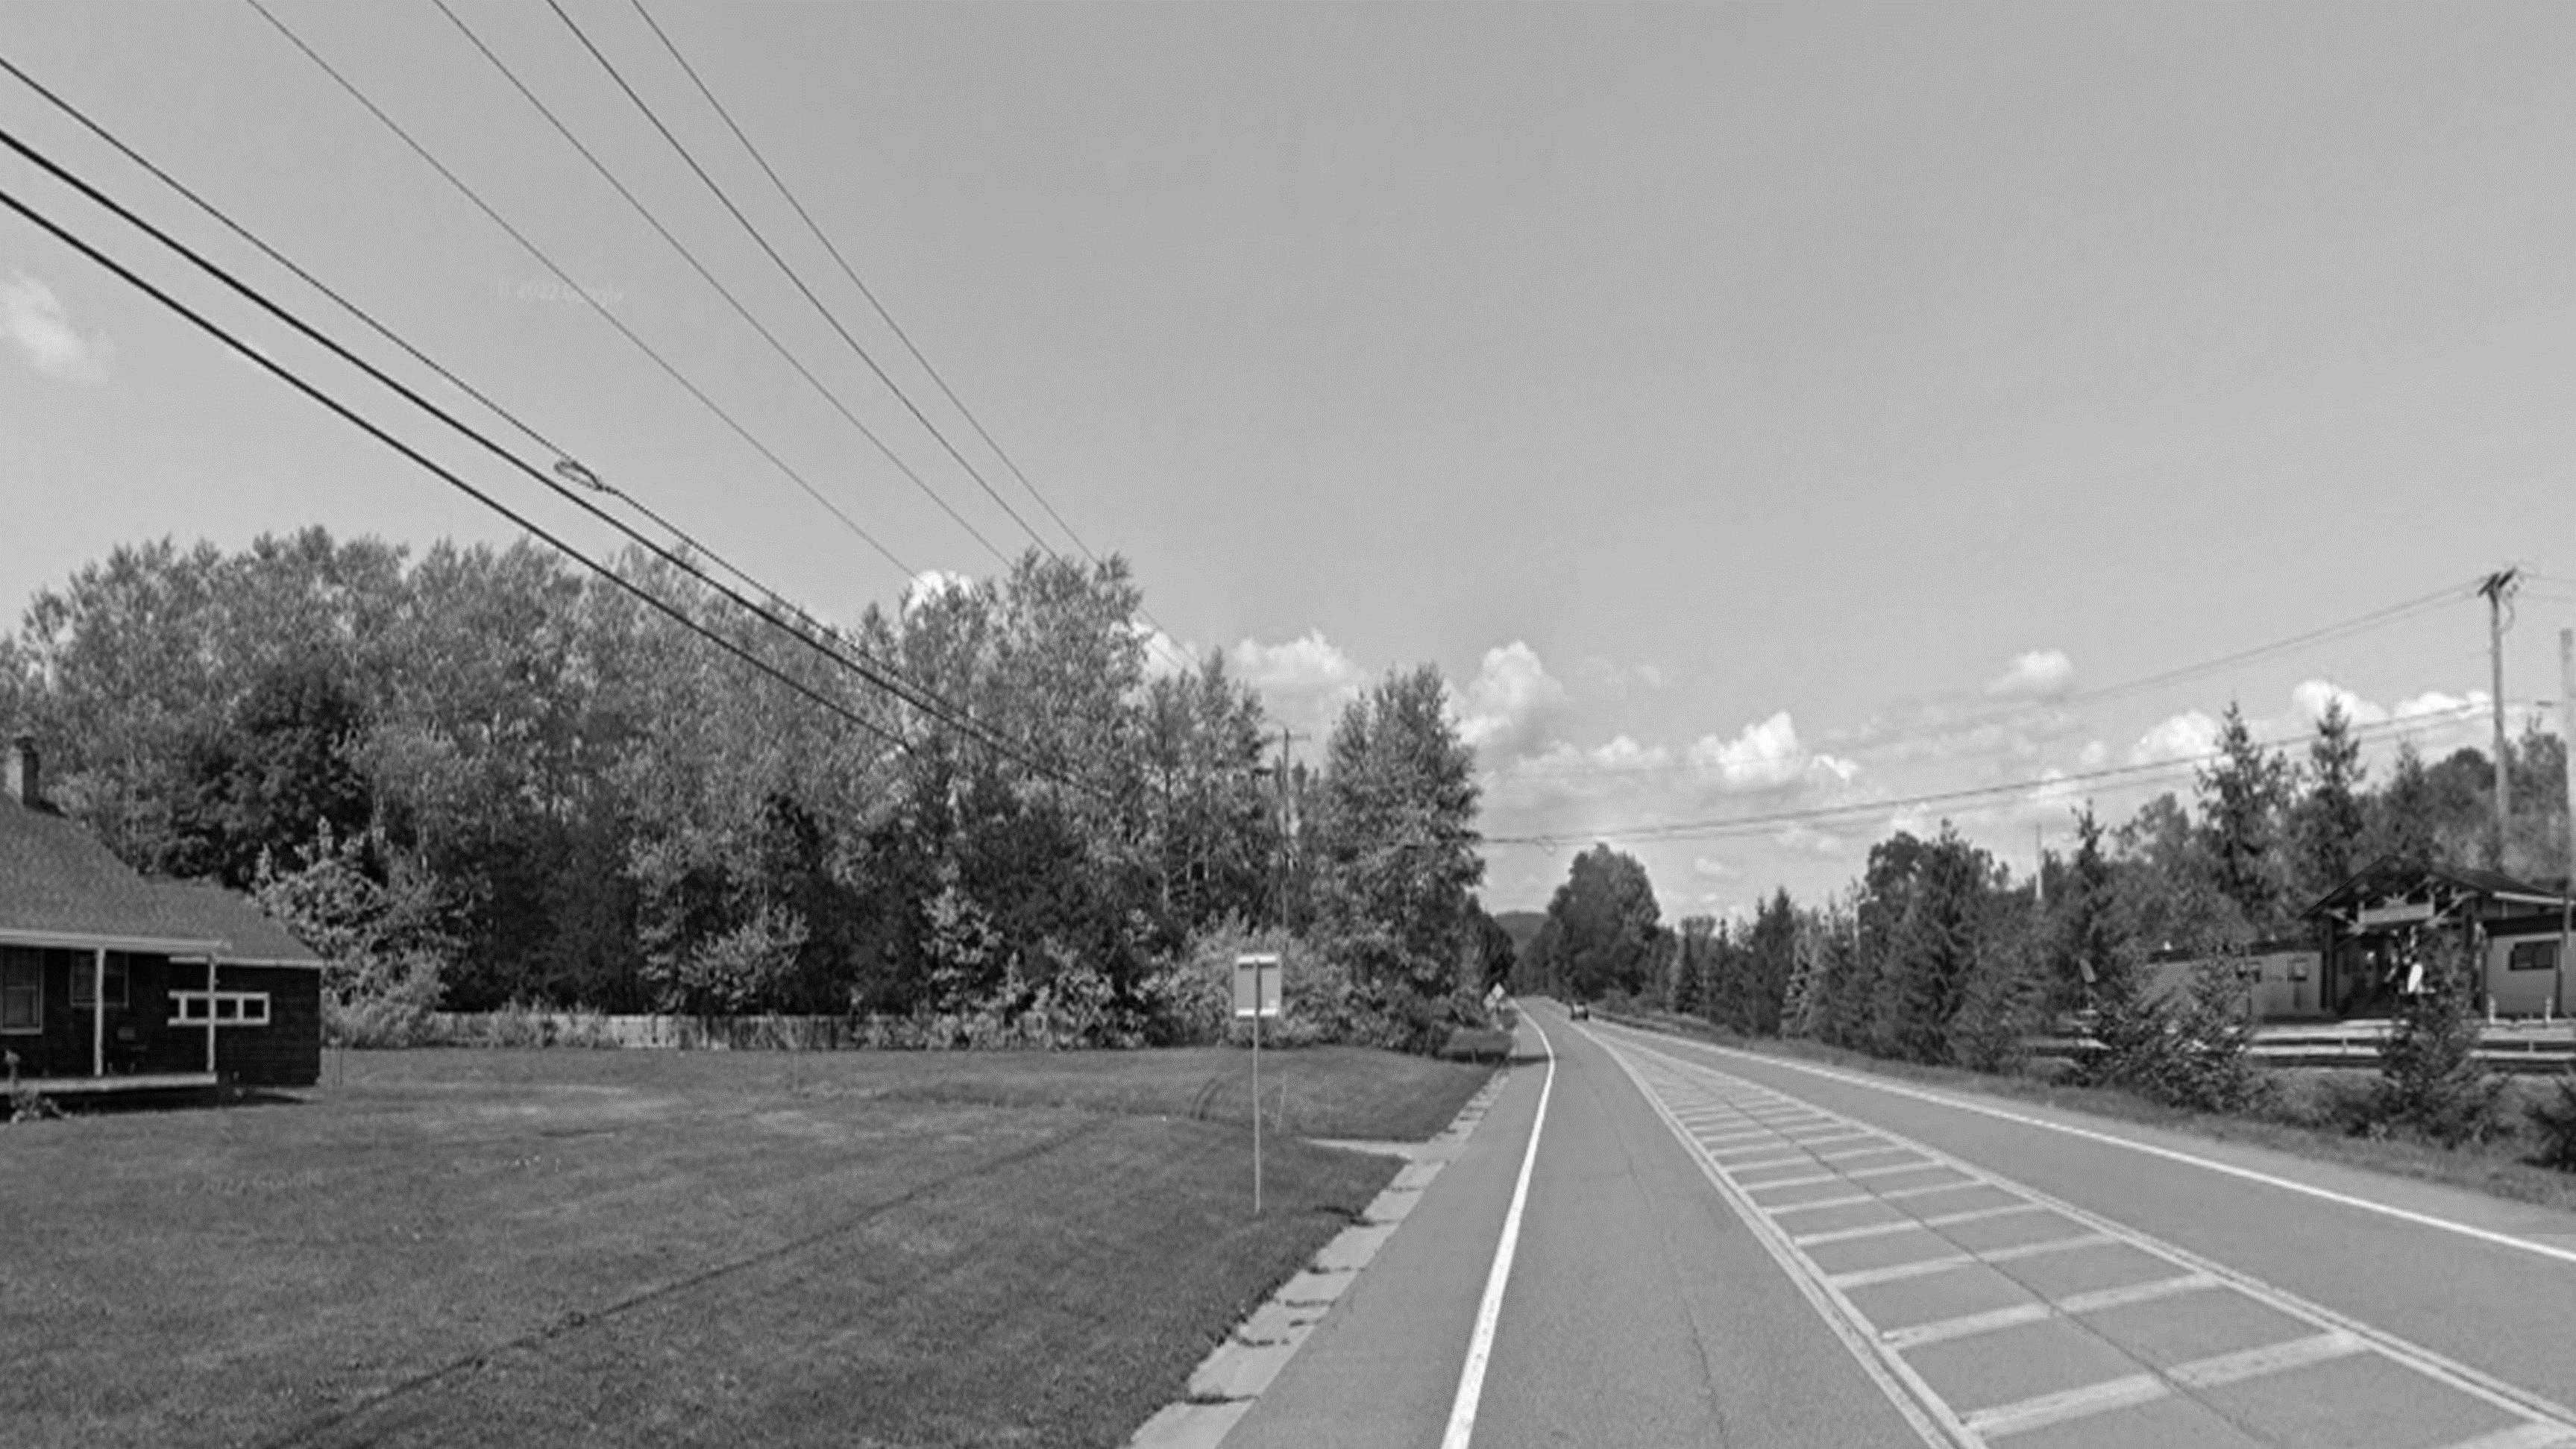
1. Policy 2. Context 3. History 4. Case Studies 5. Policy in Practice Undeveloped Lot to Context-Sensitive Housing
Tier
47
Options
4 – “End- of-the-Line Station”
Built forms are contextsensitive to existing buildings

Single-and multi-family housing options
Safe connections to station and transit amenities


Vegetative buffers integrate built-form into landscape
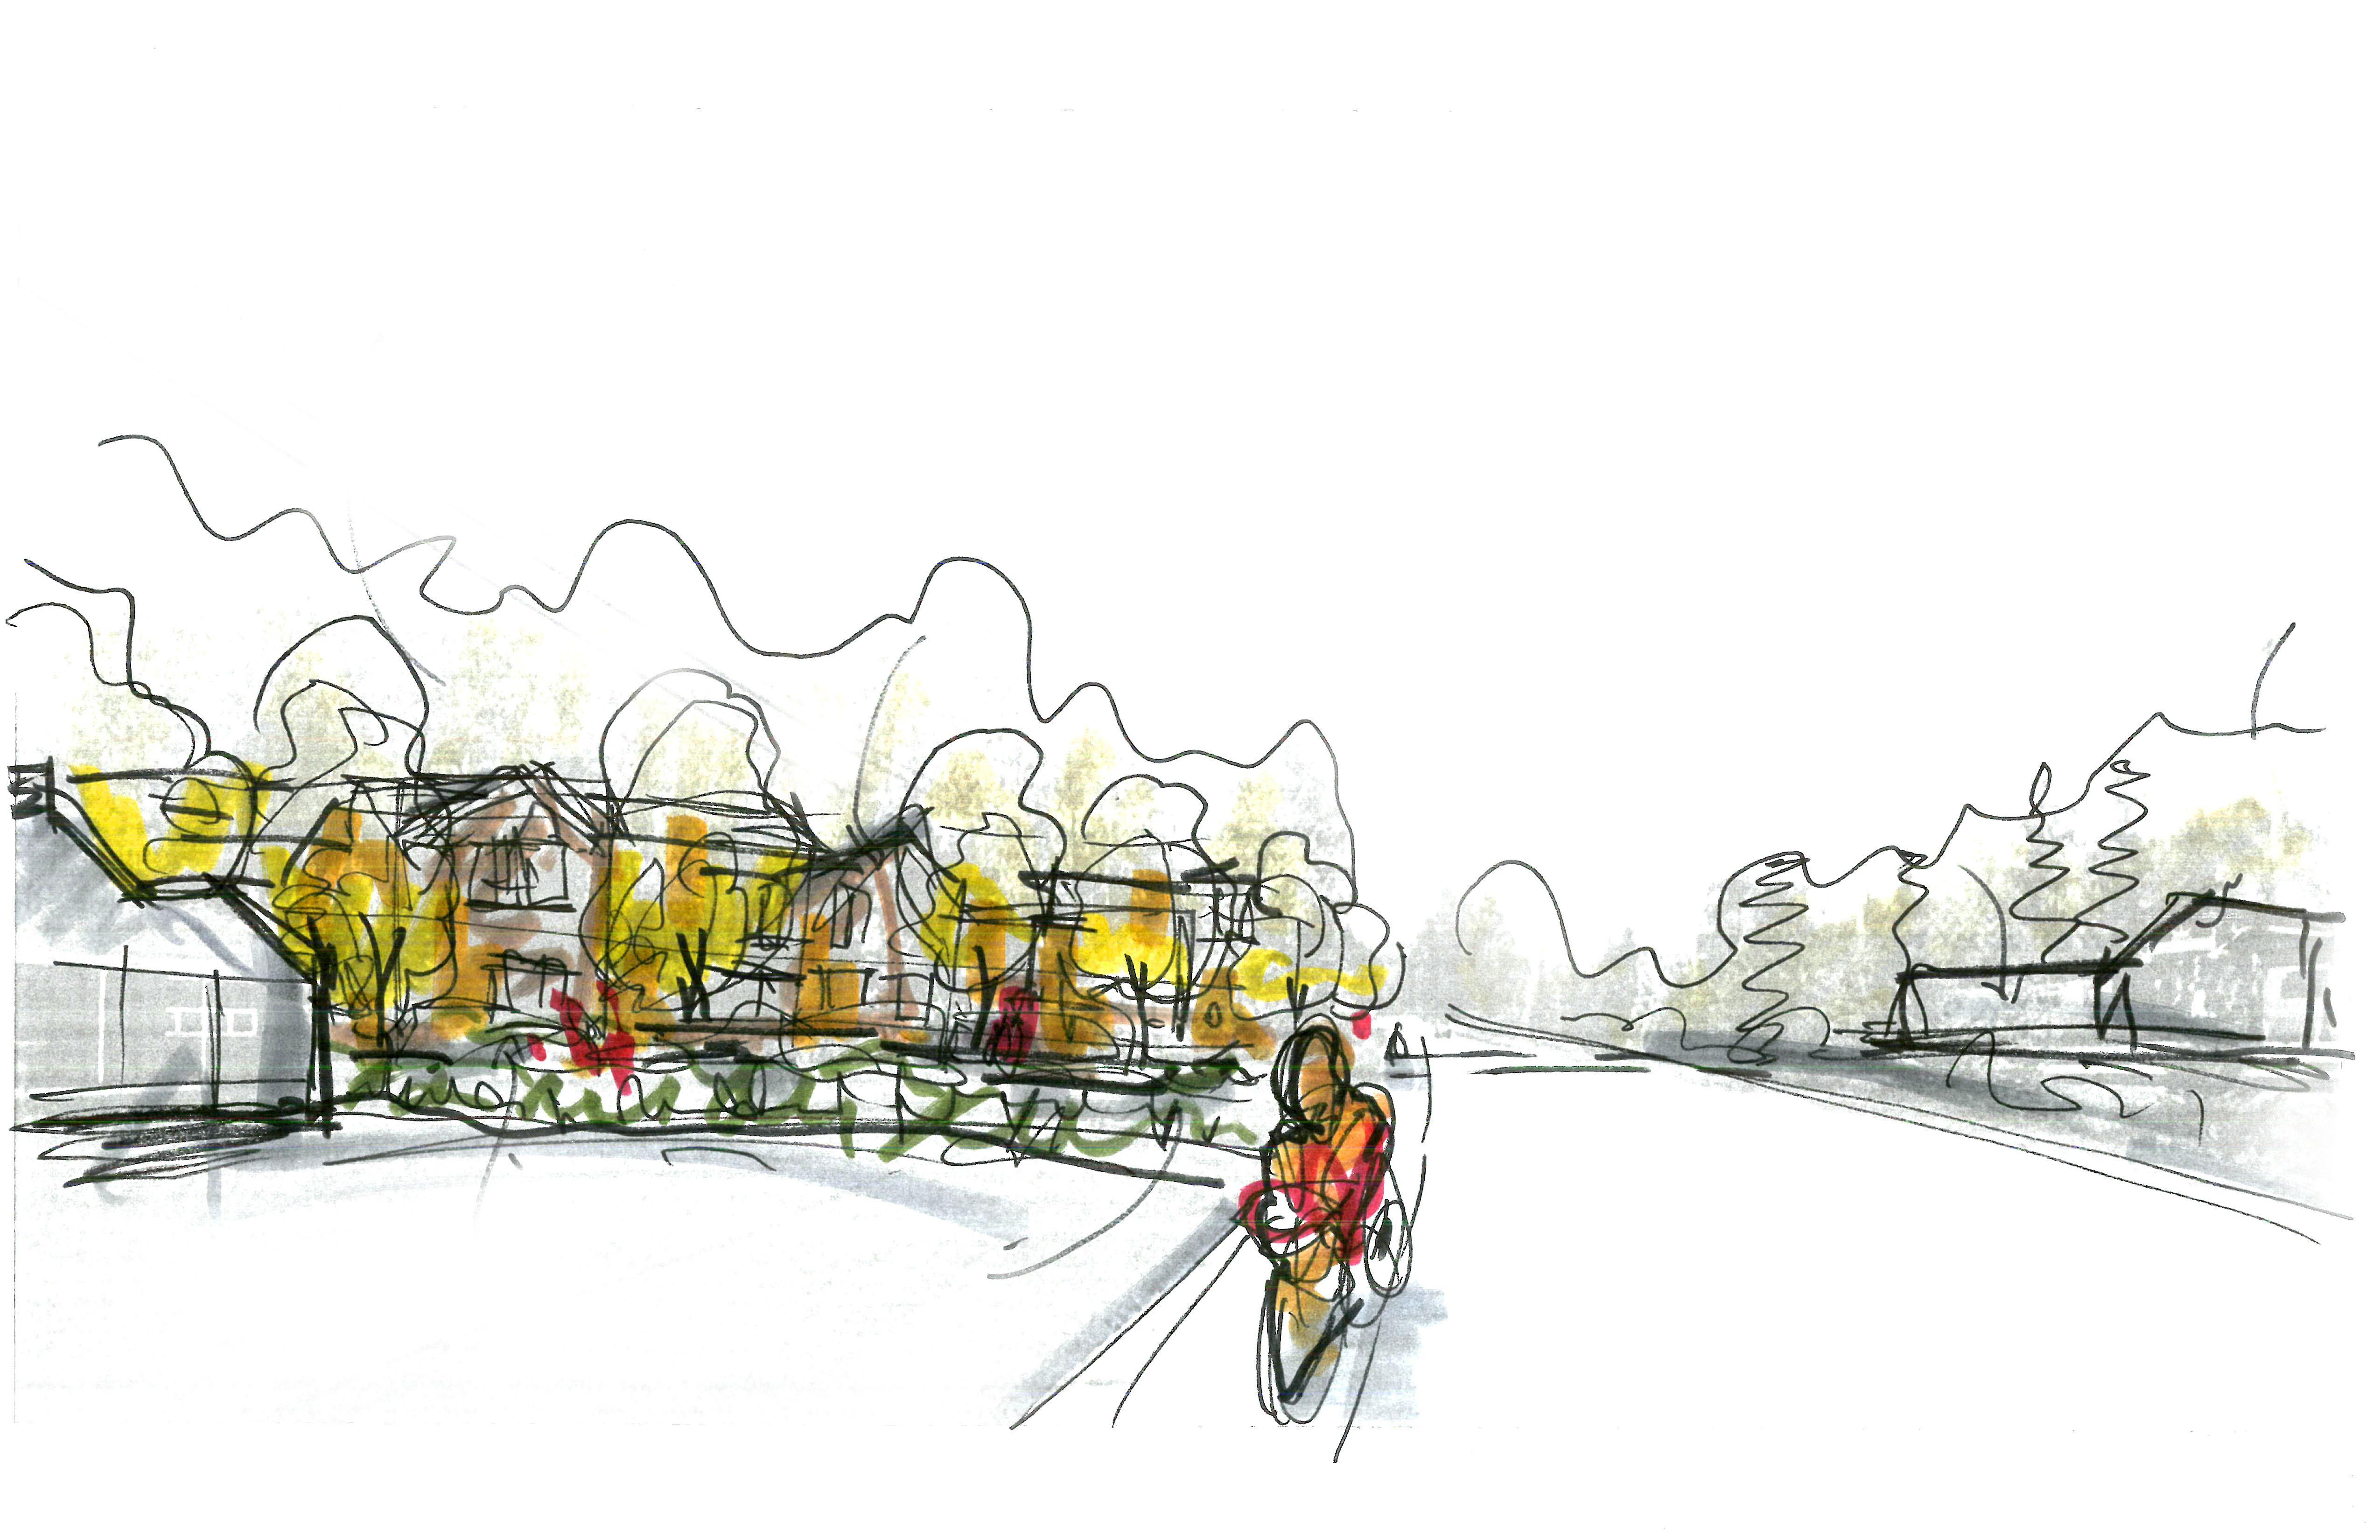
1. Policy 2. Context 3. History 4. Case Studies 5. Policy in Practice
Tier 4 – “End- of-the-Line Station”
Undeveloped Lot to Context-Sensitive Housing Options 48
Tier 4 – “End- of-the-Line Station”


1. Policy 2. Context 3. History 4. Case Studies 5. Policy in Practice
Undeveloped Lot to Context-Sensitive Housing Options
Policy Benefits Summary

1. Provides workforce housing – the current housing market makes it very difficult to attract and retain staff, across a range of essential workers – from retail, to childcare, to healthcare
2. Broadens the tax base – denser development can increase the tax base taking the property tax burden off single family housing
3. Supports local businesses – small businesses need a critical mass of population to survive and grow
4. Grows the regional economy – create new jobs from construction but also help attract/retain companies that need stable housing for their workforces (see #1)
5. Protects the environment – lower carbon footprints for denser development near transit, denser development can also help to preserve farmland/open space elsewhere
1. Policy 2. Context 3. History 4. Case Studies
Policy in Practice
5.
50


