SECTION 2
E NE RGY AND E M ISS IONS TOTAL ENERGY CONSUMPTION
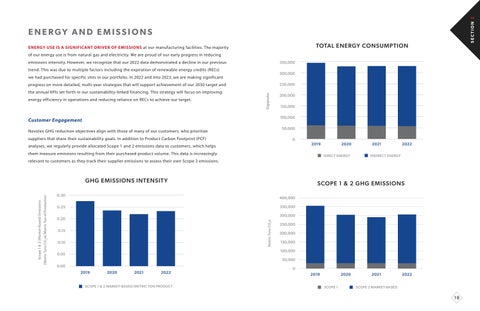
ENERGY USE IS A SIGNIFICANT DRIVER OF EMISSIONS at our manufacturing facilities. The majority of our energy use is from natural gas and electricity. We are proud of our early progress in reducing emissions intensity. However, we recognize that our 2022 data demonstrated a decline in our previous
350,000
trend. This was due to multiple factors including the expiration of renewable energy credits (RECs)
300,000
we had purchased for specific sites in our portfolio. In 2022 and into 2023, we are making significant progress on more detailed, multi-year strategies that will support achievement of our 2030 target and energy efficiency in operations and reducing reliance on RECs to achieve our target.
Gigajoules
the annual KPIs set forth in our sustainability-linked financing. This strategy will focus on improving
250,000 200,000 150,000 100,000
Customer Engagement
50,000
Novolex GHG reduction objectives align with those of many of our customers, who prioritize suppliers that share their sustainability goals. In addition to Product Carbon Footprint (PCF)
0 2019
analyses, we regularly provide allocated Scope 1 and 2 emissions data to customers, which helps them measure emissions resulting from their purchased product volume. This data is increasingly
2020 DIRECT ENERGY
2021
2022
INDIRECT ENERGY
relevant to customers as they track their supplier emissions to assess their own Scope 3 emissions.
SCOPE 1 & 2 GHG EMISSIONS
0.30
400,000 350,000
0.25
300,000
0.20
Metric Tons CO2e
(Metric Tons CO2e)/Metric Ton of Production
Scope 1 & 2 (Market-Based) Emissions
GHG EMISSIONS INTENSIT Y
0.15 0.10
250,000 200,000 150,000 100,000
0.05
50,000 0.00 2019
2020
2021
2022
SCOPE 1 & 2 MARKET-BASED/METRIC TON PRODUCT
0 2019
2020 SCOPE 1
2021
2022
SCOPE 2 MARKET-BASED
18


