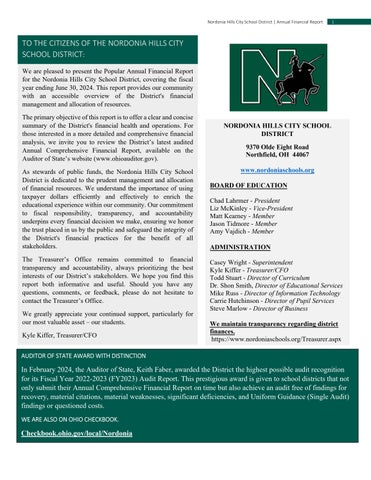
TO THE CITIZENS OF THE NORDONIA HILLS CITY SCHOOL DISTRICT:
We are pleased to present the Popular Annual Financial Report for the Nordonia Hills City School District, covering the fiscal year ending June 30, 2024. This report provides our community with an accessible overview of the District's financial management and allocation of resources.
The primary objective of this report is to offer a clear and concise summary of the District's financial health and operations. For those interested in a more detailed and comprehensive financial analysis, we invite you to review the District’s latest audited Annual Comprehensive Financial Report, available on the Auditor of State’s website (www.ohioauditor.gov).
As stewards of public funds, the Nordonia Hills City School District is dedicated to the prudent management and allocation of financial resources. We understand the importance of using taxpayer dollars efficiently and effectively to enrich the educational experience within our community. Our commitment to fiscal responsibility, transparency, and accountability underpins every financial decision we make, ensuring we honor the trust placed in us by the public and safeguard the integrity of the District's financial practices for the benefit of all stakeholders.
The Treasurer’s Office remains committed to financial transparency and accountability, always prioritizing the best interests of our District’s stakeholders. We hope you find this report both informative and useful. Should you have any questions, comments, or feedback, please do not hesitate to contact the Treasurer’s Office.
We greatly appreciate your continued support, particularly for our most valuable asset – our students.
Kyle Kiffer, Treasurer/CFO
AUDITOR OF STATE AWARD WITH DISTINCTION

9370 Olde Eight Road Northfield, OH 44067
www.nordoniaschools.org
BOARD OF EDUCATION
Chad Lahrmer - President
Liz McKinley - Vice-President
Matt Kearney - Member
Jason Tidmore - Member
Amy Vajdich - Member
ADMINISTRATION
Casey Wright - Superintendent
Kyle Kiffer - Treasurer/CFO
Todd Stuart - Director of Curriculum
Dr. Shon Smith, Director of Educational Services
Mike Russ - Director of Information Technology
Carrie Hutchinson - Director of Pupil Services
Steve Marlow - Director of Business
We maintain transparency regarding district finances. https://www.nordoniaschools.org/Treasurer.aspx
In February 2024, the Auditor of State, Keith Faber, awarded the District the highest possible audit recognition for its Fiscal Year 2022-2023 (FY2023) Audit Report. This prestigious award is given to school districts that not only submit their Annual Comprehensive Financial Report on time but also achieve an audit free of findings for recovery, material citations, material weaknesses, significant deficiencies, and Uniform Guidance (Single Audit) findings or questioned costs.
WE ARE ALSO ON OHIO CHECKBOOK. Checkbook.ohio.gov/local/Nordonia
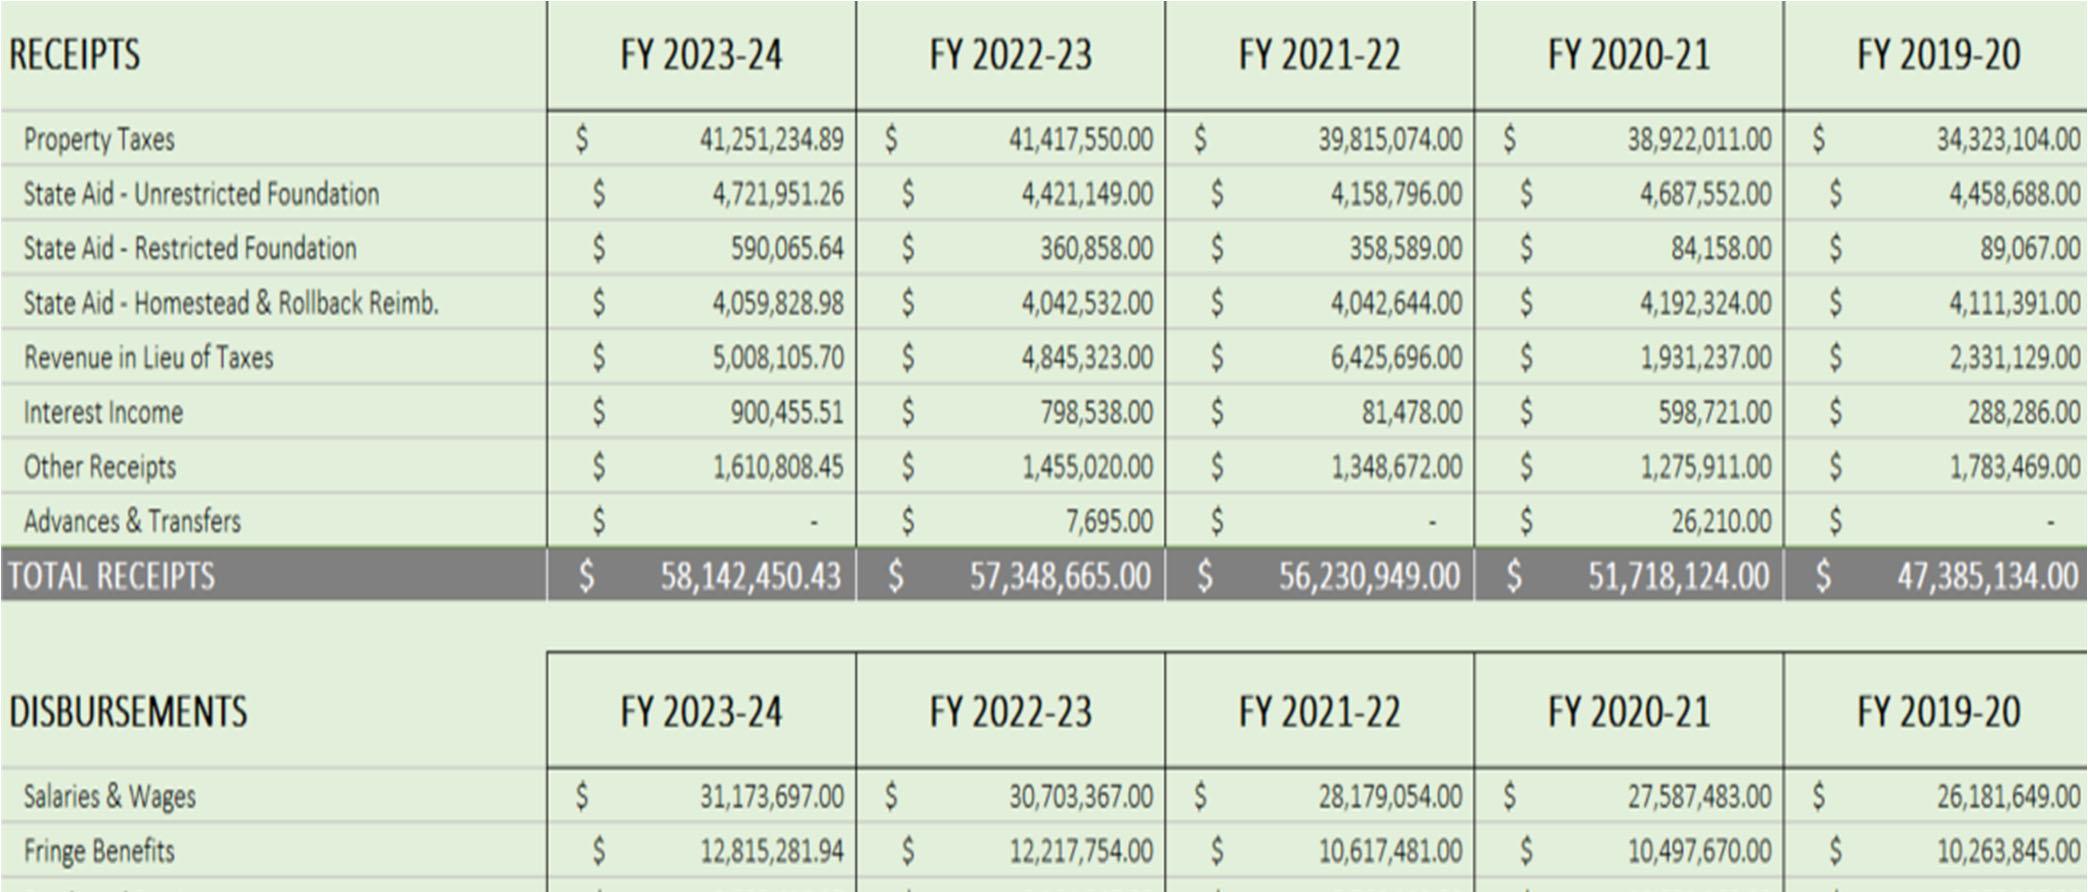
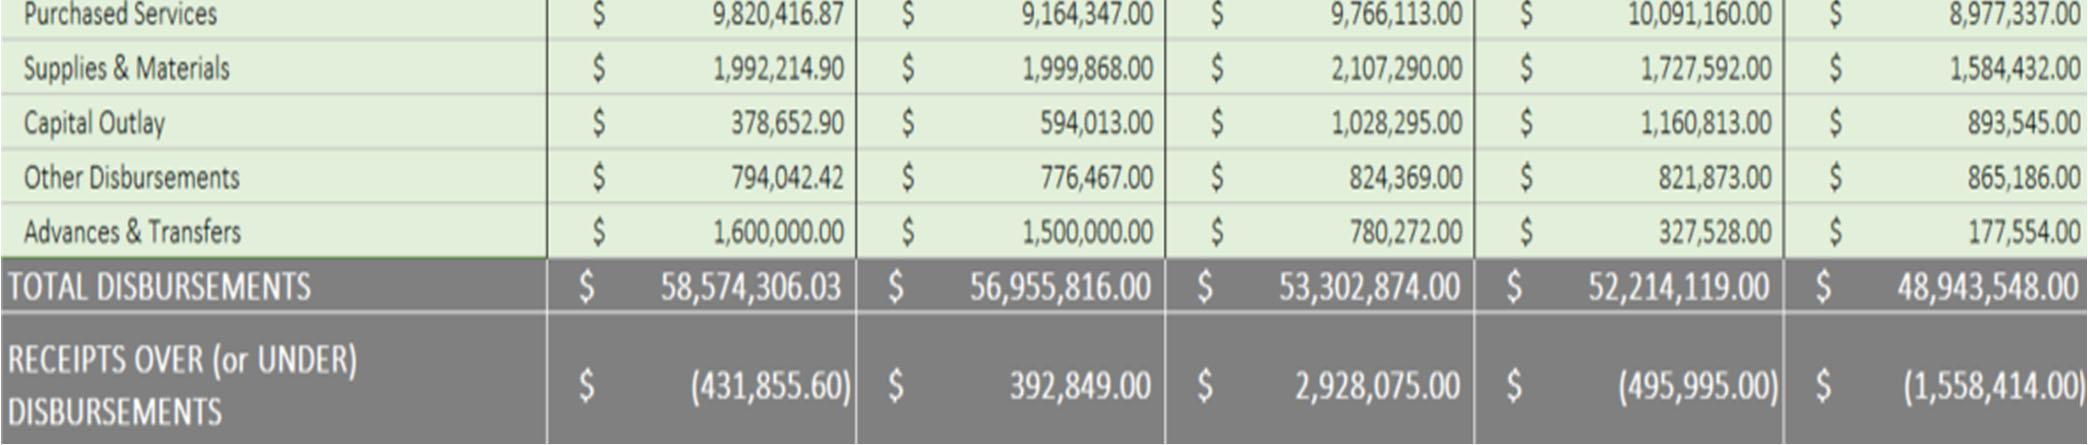
COMPARATIVE ANALYSIS: RECEIPTS & DISBURSEMENTS
The Financial Activity Statement below is shown on a cash basis for the District’s General Fund. This type of schedule, known in accounting terms as the income statement, provides a summary of the receipts received by the District compared to the disbursements paid by the District. Four years of financial activity is provided so that you can see the changes over time in the District’s receipts and disbursements.
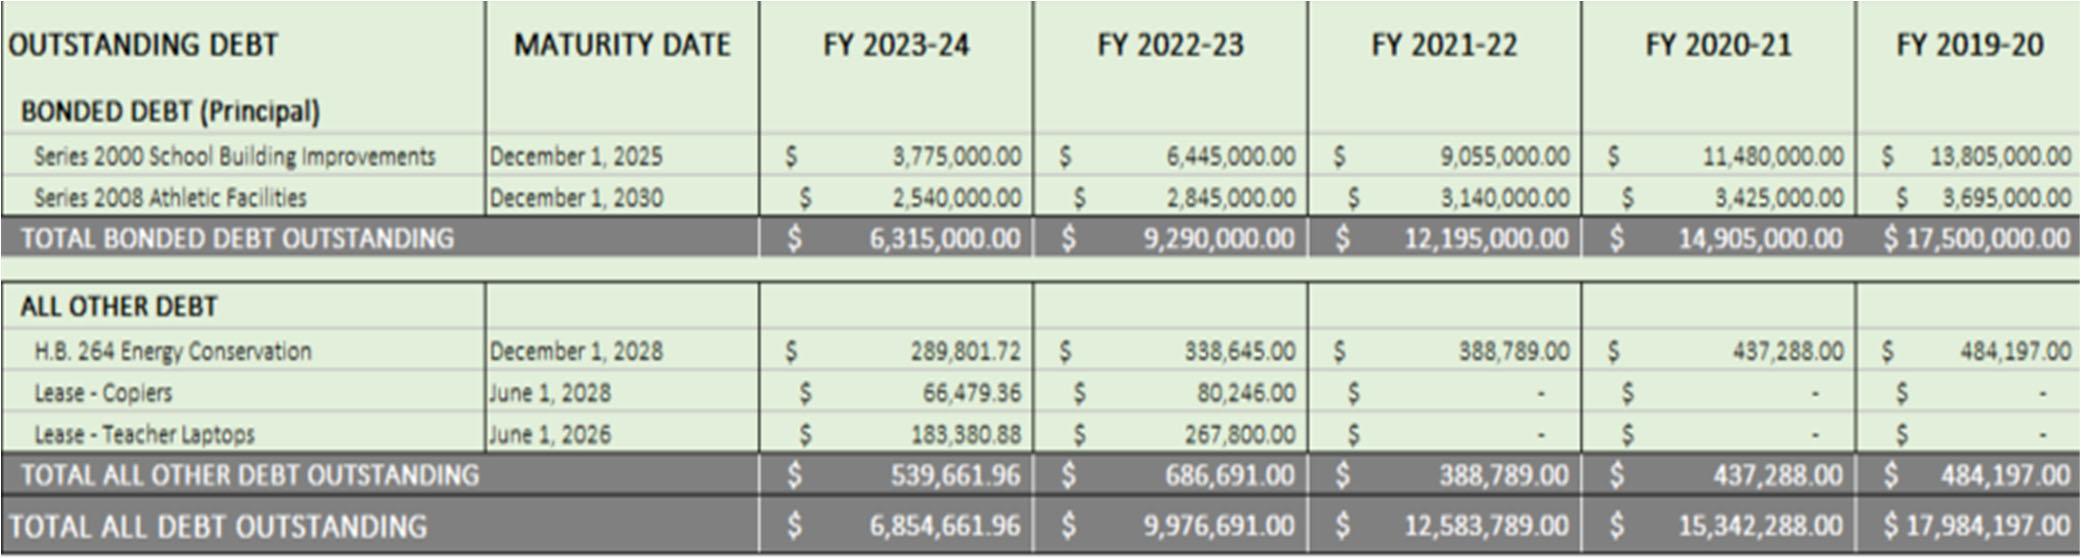
COMPARATIVE ANALYSIS: OUTSTANDING DEBT AT YEAR END – ALL FUNDS
The chart below captures all of the District’s long-term debt obligations and reflects the final pay-off dates. The chart is broken down between Bonded Debt and All Other Debt. Bonded Debt is paid for from dedicated tax levies that have been approved by the voters in prior years. All Other Debt is paid for by other resources of the District’s General Fund.
GENERAL FUND RECEIPTS
The graph below displays the General Fund’s cash basis receipts for Fiscal Year 2023-2024.
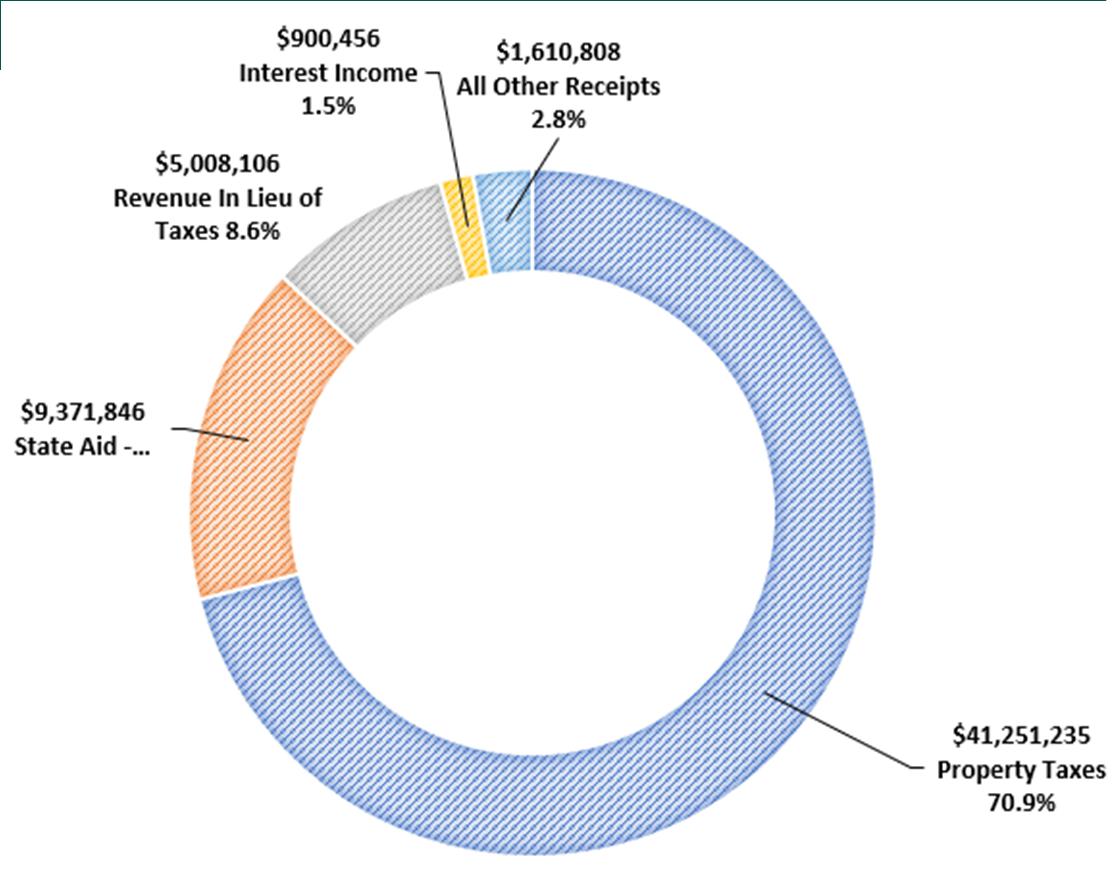
$ 58,142,450
RECEIPTS
GENERAL FUND DISBURSEMENTS
The graph below displays the General Fund’s cash basis disbursements for Fiscal Year 2023-2024.
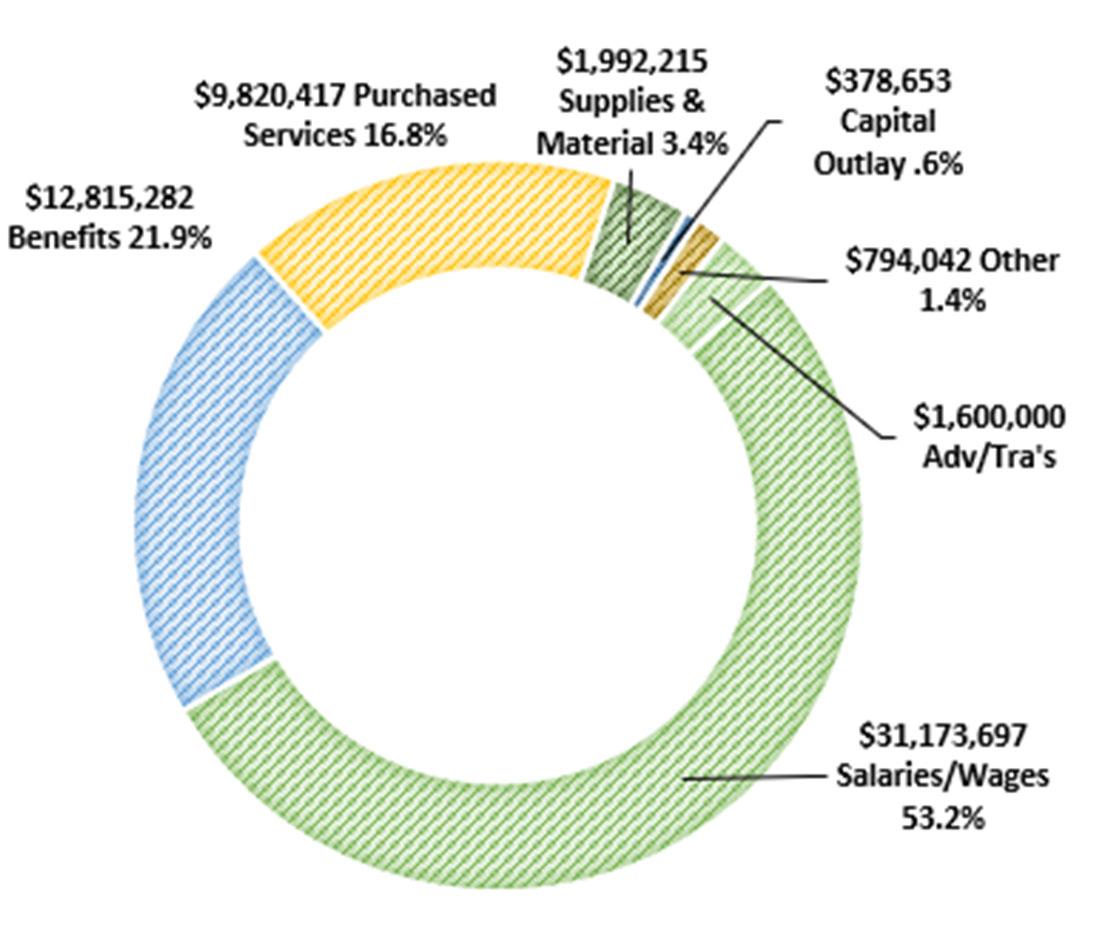
$ 58,574,306 TOTAL DISBURSEMENTS
OUR RECEIPTS are cash received from various sources. Below is a brief overview of the different types of receipts:
- Property tax receipts are comprised of residential payers, commercial and business payers, and public utility payers. This is by far the District’s largest receipt category.
- State Aid receipts are comprised of funds provided from the State’s biennial budget, Casino taxes and Homestead & Rollback reimbursements. This is our 2nd largest receipt category.
- Revenue in Lieu of Taxes is currently our 3rd largest receipt category and this is provided through tax arrangements the District enters into with property taxpayers and also specific agreements with other local governments such as cities, villages and townships.
- All Other Receipts is our 4th largest receipt category and only represents 2.55% of total receipts. This category is where student fees, rental fees, kindergarten tuition and other tuition receipts are all recorded here.
- Interest Income receipts fluctuate annually and are mainly dependent on current interest rates and cash balances.
OUR DISBURSEMENTS are cash paid out to different persons, businesses and other governmental entities. Below is a brief overview of the different types of disbursements:
- Salaries & Wages are payments made to our staff, coaches and other advisors. The is by far the largest disbursement category of the District.
- Fringe Benefits is the 2nd largest disbursement category of the District. This category pays the employee’s healthcare insurance, required pension contributions, Medicare contributions and workers compensation. All employees that receive insurance are required to contribute a percentage of their pay to help cover the cost of healthcare insurance.
- Purchased Services is the 3rd largest receipt category of the District. This category covers disbursements for a number of contractual services. Most notably student busing for regular and special education, nursing, counseling, special education pre-K and contracts for the upkeep and maintenance of the District’s facilities. Utilities are also paid from this category.
- Supplies & Materials is our 4th largest receipt category but only represents 3.4% of total disbursements. This category is where classroom items, such as software materials, are purchased from. Additionally, bus/fleet gasoline and diesel, office supplies and maintenance supplies are included here.
- The other disbursement categories are significantly minor to the overall disbursement total and do not fluctuate significantly.
COMPARATIVE ANALYSIS:
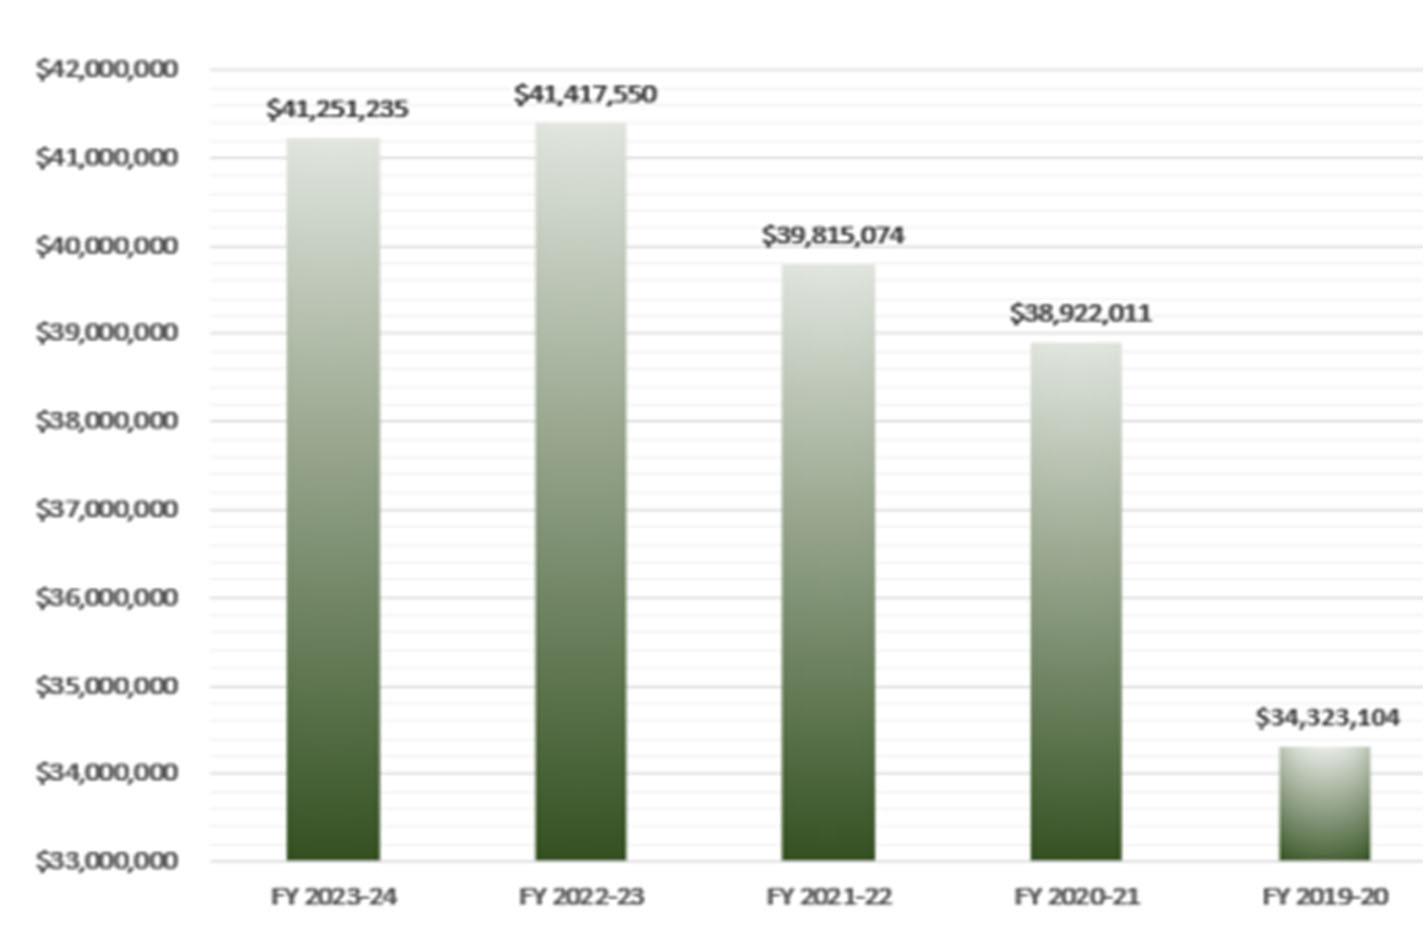
PROPERTY TAXES
To the right is a graph depicting the amount of cash collections received by the District from residential, commercial/business, and public utilities property taxpayers. Property taxes provide a majority of the local revenue needed to operate and maintain our schools. Property tax rates are calculated in mills. One mill is 1/1000th of assessed property value determined by the Summit County Fiscal Officer. Simply put, one mill is $1.00 for every $1,000 of assessed value.
UNDERSTANDING PROPERTY TAXES…At Least an Attempt to…
Unfortunately, digging into how your property taxes are calculated can be a confusing and frustrating task. An overwhelming amount of your property taxes have been established through a vote of the citizens. This vote accomplishes two things: 1) the length of the tax levy and 2) the tax amount or rate. This on its surface is simple, however the tax amount or rate is calculated off of your property’s value. This is where things get messy. If all things stayed the same, when your property value increases so would your taxes. The opposite would be true if your property value decreases. Understandably, your tax burden could become burdensome if your property’s value increases significantly. Alternatively, your tax burden would be relieved if your property values decreased significantly. This decrease could cause financial stress and uncertainty on the District that was expecting a certain amount of revenue to provide for its educational programs.
To remedy this challenge, the State passed H.B. 920 back in the 1970s. This law controls the amount of taxes from a property taxpayer independent of what happens to that taxpayer’s property value. During reappraisals, the County will appraise the value of your property. The voted tax rate will need to be adjusted up or down dependent on what happens to the value of your property. This rate adjustment is commonly referred to as the Effective Rate. Therefore, if your property value increases the Effective Rate will decrease to the level at which you will pay no more in taxes then you did when the tax levy was originally passed by the voters.
There are a few instances in which H.B. 920 does not apply so if you see your property taxes increase year over year then that could be one reason for those increases. Inside unvoted millage is the lead contributor to this and is governed by State law.
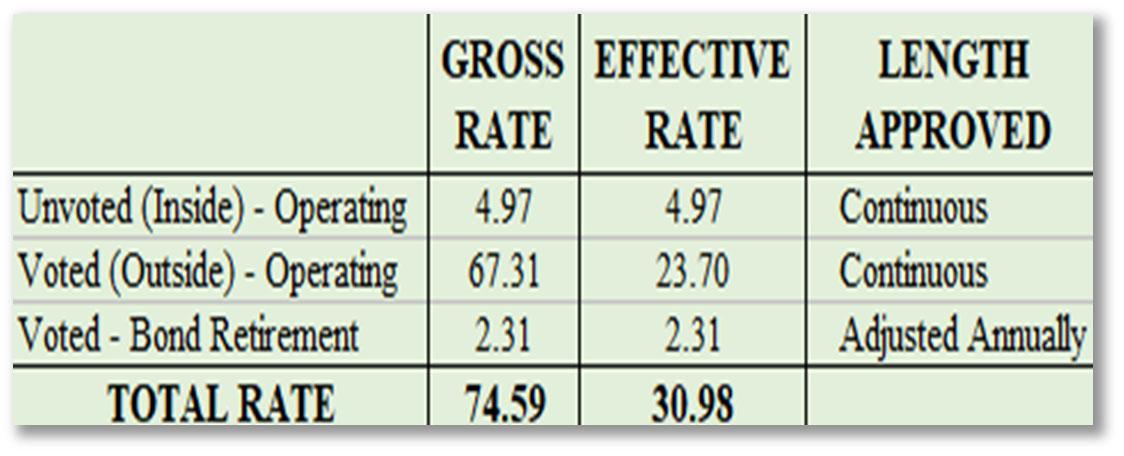
Gross Rate vs. Effective Rate
The chart below reflects the difference between the original voted tax rate and the current effective tax rate for the most recent tax year (2023). These rates have factored in the Summit County 2023 Triennial update.
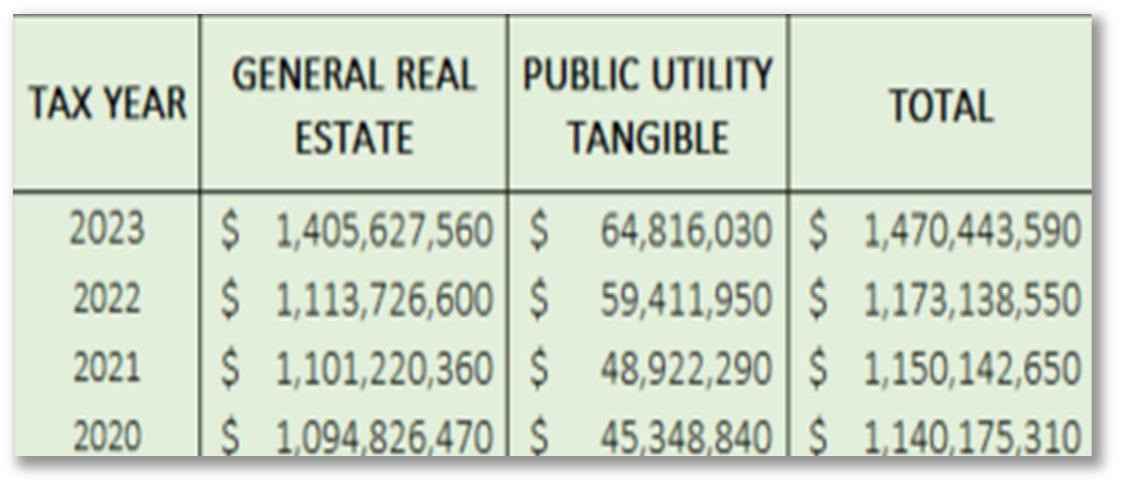
Assessed Values of Property
The chart below reflects the actual value of all the property within the District. Assessed value is established by State law at 35% of the respective property’s appraised fair value.
VALUE FOR THE LOCAL TAXPAYER: LOW EFFECTIVE TAX RATE & HIGH STUDENT ACHIEVEMENT
Despite encountering funding challenges, including ongoing limitations on state funding levels, the Nordonia Hills City School District maintains one of the lowest tax rates in Summit County. Notably, the Nordonia Hills City School District was one of only 5% of all the school districts across Ohio that received a calculated 5 Star rating from the Ohio Department of Education for the 2023 School Year. The chart below reflects all the school districts in Summit County ranked by their effective tax rate for Tax Year 2023 (highest to lowest).
Woodridge LSD
Stow-Munroe Falls CSD
Barberton CSD
Hudson CSD
Tallmadge CSD
Cuyahoga Falls CSD
Twinsburg CSD
Green LSD
Mogadore LSD
Akron CSD
Coventry LSD
Manchester LSD
Springfield LSD
Nordonia Hills CSD
Revere LSD
Copley-Fairlawn CSD
Norton CSD

DEFICIT SPENDING AND THE DISTRICT’S SAVING STRATEGY
Despite a deficit of $431,856 during the 2023-2024 school year, the District effectively managed a budget of approximately $59 million. This achievement underscores the challenges of Ohio public school finance, where balancing local resources while ensuring quality education for Nordonia Hills City School District students.
The District recognizes the critical responsibility of being stewards of public funds, emphasizing transparency, accountability, and efficiency in financial management. Stemming from this commitment, the District has undertaken a careful and strategic approach to personnel management. Rather than automatically filling positions left vacant due to retirements, the District is dedicated to evaluating the necessity and impact of each role on its operations and services to our students. This prudent approach saved the District approximately two million in savings over the last two school years.

SCHOOL DISTRICT
Inspiring every student to value learning, community and excellence