NOLS FY16 GREENHOUSE GAS EMISSIONS REPORT

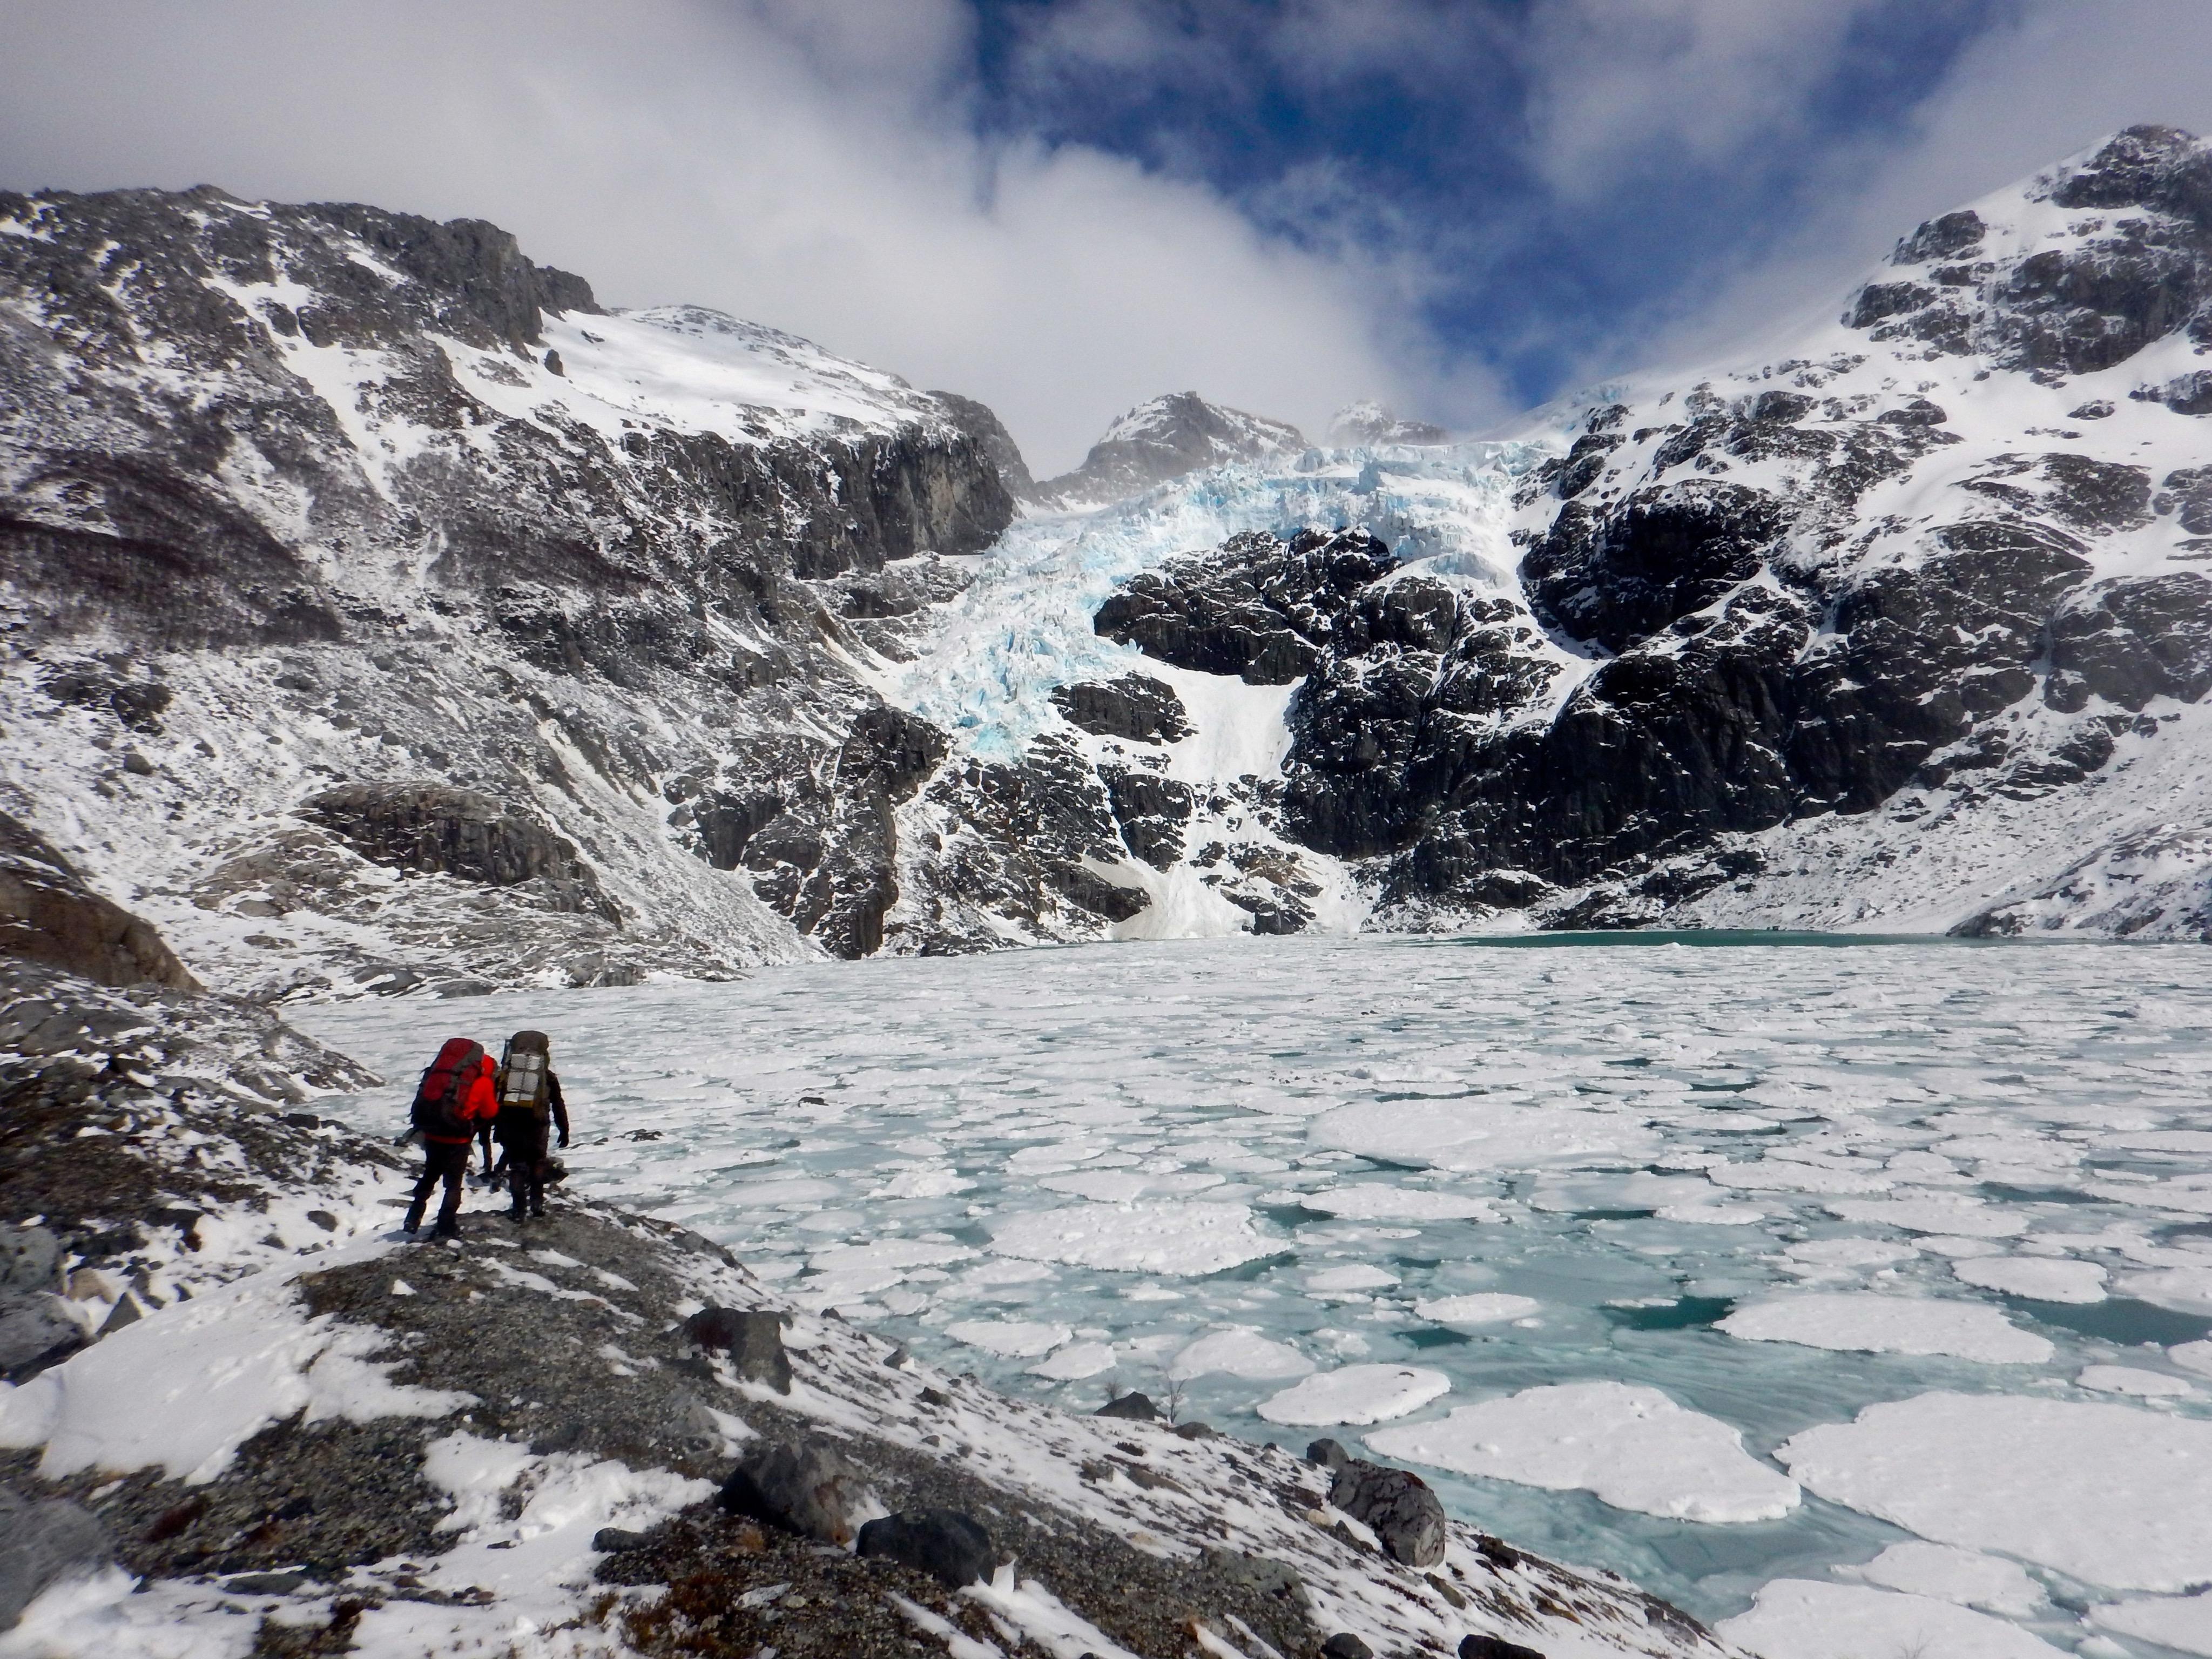
Photo by: Lindsay Nohl

Alaska.………….……….……………………….……………….….06
Australia.…………….………….……………….………….………07

Photo by: Lindsay Nohl
Alaska.………….……….……………………….……………….….06
Australia.…………….………….……………….………….………07
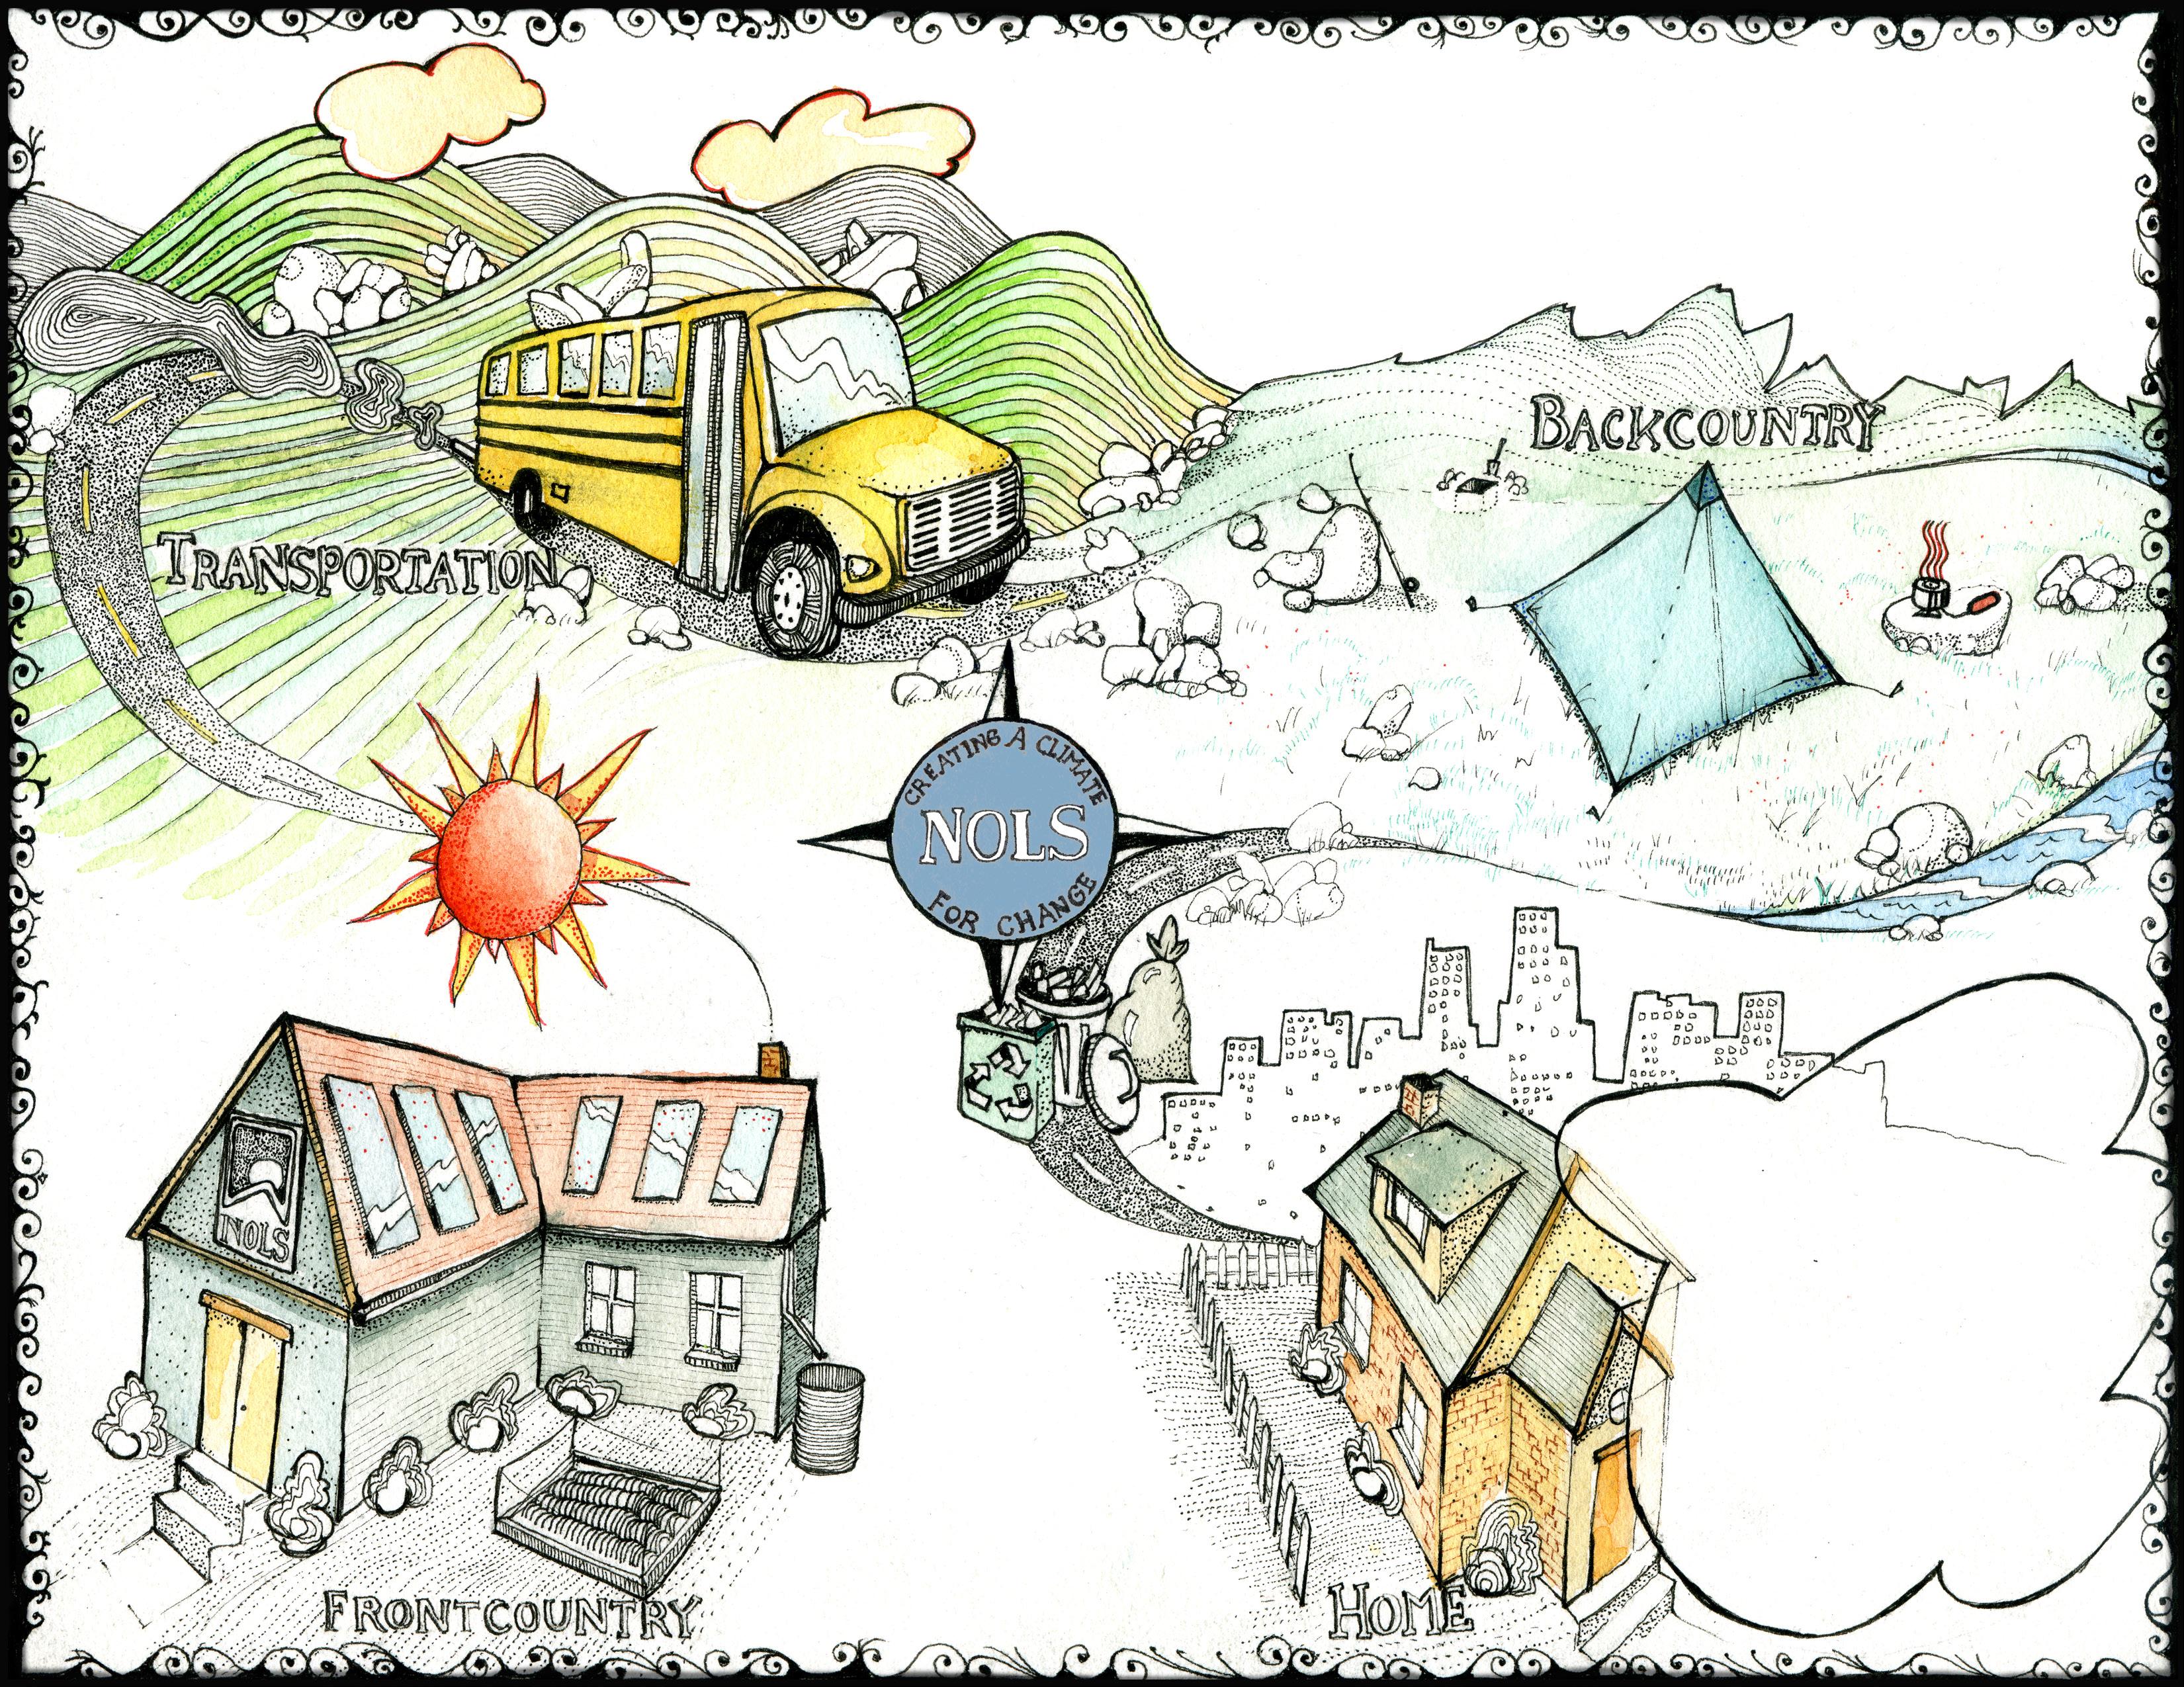
At NOLS, we understand that our operations have an environmental impact. Whether it's transporting students to the trailhead or running a campus facility, these daily actions create greenhouse gas emissions (GHG)—the primary cause of climate change. Our mission to be good stewards of the land compels us to track this impact, and make strides to reduce it.
The following GHG emissions report aims to serve as a vehicle for transparency and education about our GHG footprint both as an internal tool and as an external profile.
In 2006, NOLS identified the need for a comprehensive, schoolwide vision to reduce our environmental footprint and evaluate our progress. A year later, in 2007, we contracted with Pure Strategies, a greenhouse gas consulting firm, to conduct a sustainability audit for the school. The audit evaluated NOLS’ current practices, established a 2006 baseline footprint, and recommended improvements to reduce that footprint. This baseline footprint considered GHG sources within the Scope 1 and 2 boundaries but did not account for all emission sources related to NOLS operations.
To improve the data-collection process, NOLS looked to Carbon Tracker, a web-based software developed by Pure Strategies. We began using Carbon Tracker in 2009 to log our resource use and have continued with this method to calculate our GHG footprint for each subsequent fiscal year. Our system relies primarily on contributions from employees at each NOLS location. Employees are trained to input data on fuel, travel, and buildingrelated energy usage. Measurements are subject to some margin of error; however, this method provides us with a reliable enough estimate for us to understand our GHG footprint and keep working to reduce it.
Included in our footprint:
Scope 1
• building energy (leased and owned)
• vehicles (leased and owned)
• white gas fuel
Scope 2
• electricity
Scope 3
• student travel during course
• in-town staff travel
• outsourced rerations, evacuations, and drop-offs/pick-ups
Not currently included in our footprint:
• faculty travel
• commuting
• student travel to NOLS courses
• short-term rented facility emissions
• emissions from purchased materials
Our GHG reduction goals are based on the internationally recognized "2% Solution" which recommends reducing absolute carbon dioxide equivalent emissions (CO2eq)* by 2 percent annually until 2050. This puts NOLS at an 80 percent reduction in metric tons (Mt) of CO2eq from our 2006 baseline year levels by the year 2050. To break up this large goal into shorter-termed goals, we elected a 2010 goal of 10 percent Mt CO2eq reduction and a 2020 goal of 30 percent Mt CO2eq reduction, depicted on the graph below.
Over time we have built, renovated, moved, closed, and expanded our campuses. These aspects of a developing organization affect our GHG footprint directly. Plus, we are always trying to improve upon our reporting systems which may entail correcting for prior years’ data. Amidst all of this, our absolute goal for GHG reduction remains the same. No matter how much we change as a school, we want our net impact on the climate to go down.
Please see the notes section for an explanation concerning irregularities in the FY06 baseline year (marked by a (1) in the GHG emissions graphs). There is no reporting during FY07 and FY08 because we were establishing our sustainability program and systems for GHG tracking. Our first year of tracking was in FY09. This trial year was met with some reporting struggles as systems were still being tested, especially non-NOLS vehicle travel.
*Carbon dioxide equivalent, CO2eq, converts the primary greenhouse gases (methane, nitrous oxide, ozone, and water vapor) into a common denominator making for easier emission comparisons across various source types.
Along with tracking our absolute footprint, we also normalize our emission trends with the growth of the school in the form of student days. This method better illustrates “GHG intensity,” or how much CO2eq is emitted per student day. Our GHG reduction goals are based on our absolute footprint, not our normalized footprint, because we want to see an overall reduction in our footprint even as we continue to grow.
Over time we have seen our student days fluctuate and grow while our GHG emissions remain fairly steady. This indicates a decrease in GHG intensity as we support more students using the same amount of GHG emissions. It is important to note, however, that these student days only represent our NOLS location footprint. In fiscal year 2016 (FY16), there were over 92,000 student days that took place off of a NOLS campus at client locations for NOLS Wilderness Medicine, NOLS Custom Education, and NOLS Risk Services. We do not account for these student days because the GHG emissions associated with those days, i.e. instructor travel, are not currently tracked.
12% increase in student days since 2009
2% decrease in Mt CO 2 eq since 2006
13% decrease in GHG intensity since 2010
The following pages break down the NOLS GHG footprint by location with both total emissions from various resource types and GHG intensity. We start here with a side-by-side comparison of the locations.
Note that…
World Headquarters is not included in the GHG intensity graph since there are no student days to count.
East Africa’s footprint is too small when compared to other NOLS locations so it does not show here.
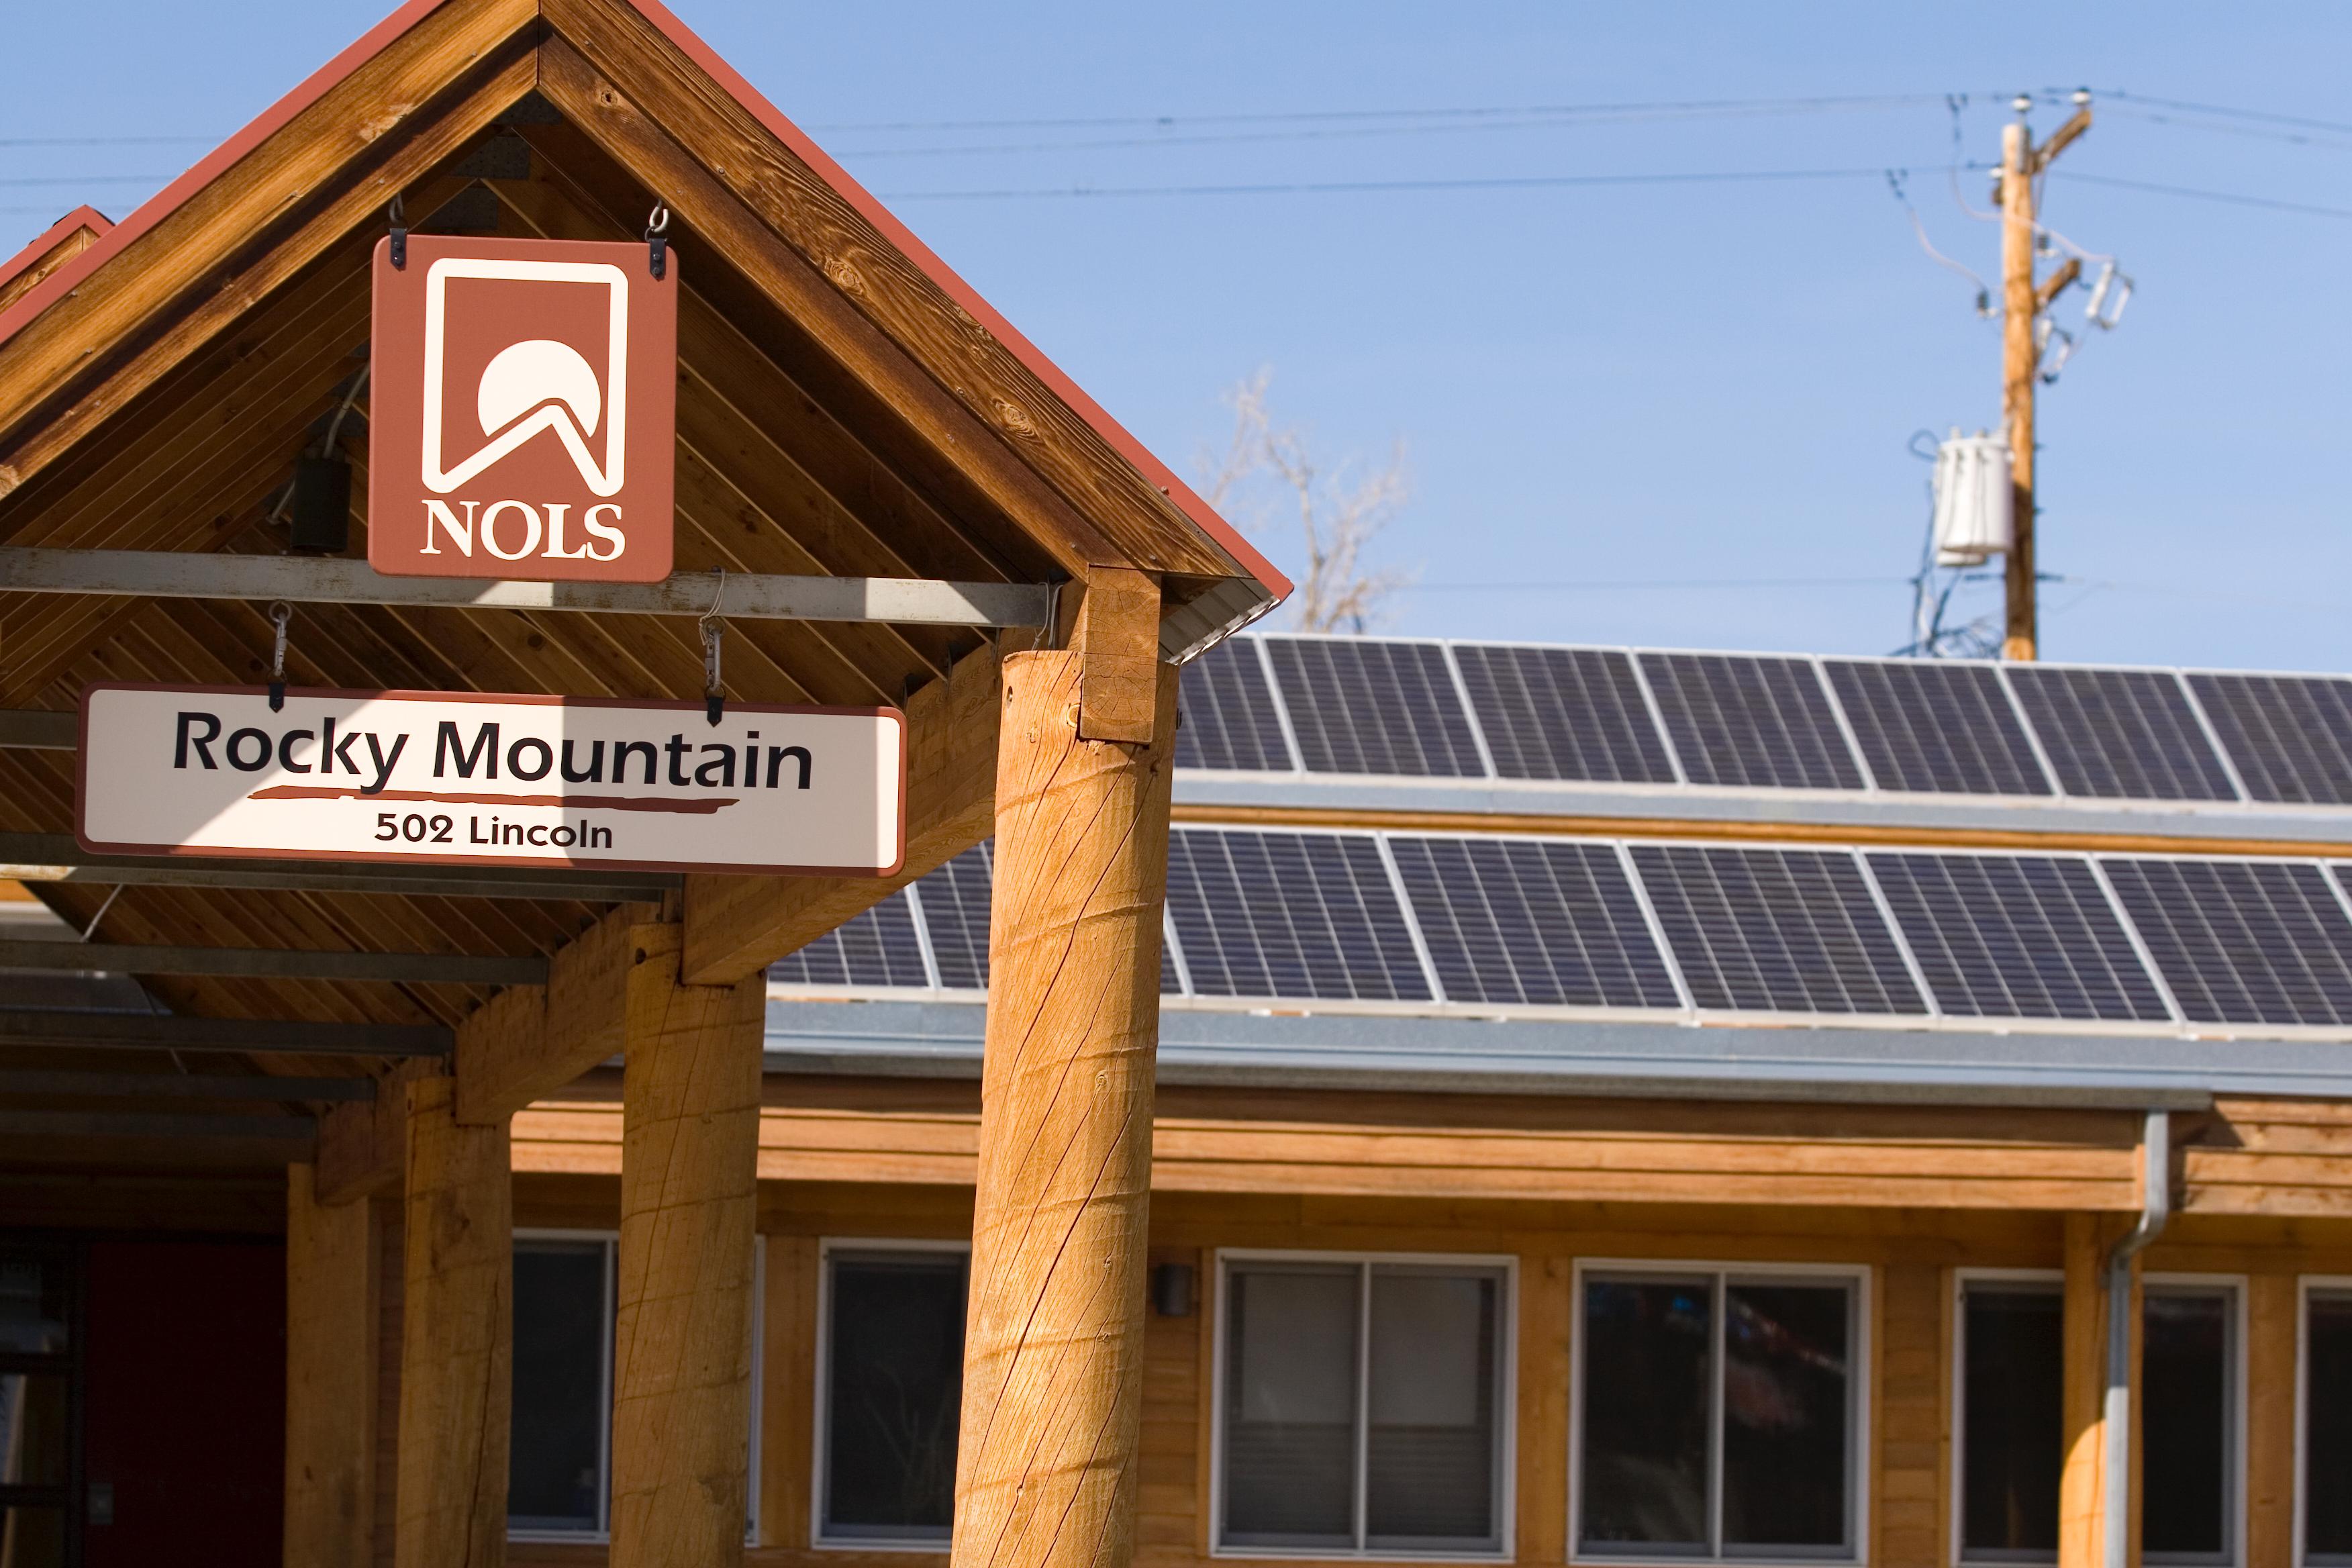
Three Peaks Ranch and the River Base are so intertwined with Rocky Mountain courses that we combine all three GHG intensity measures into one under Rocky Mountain.

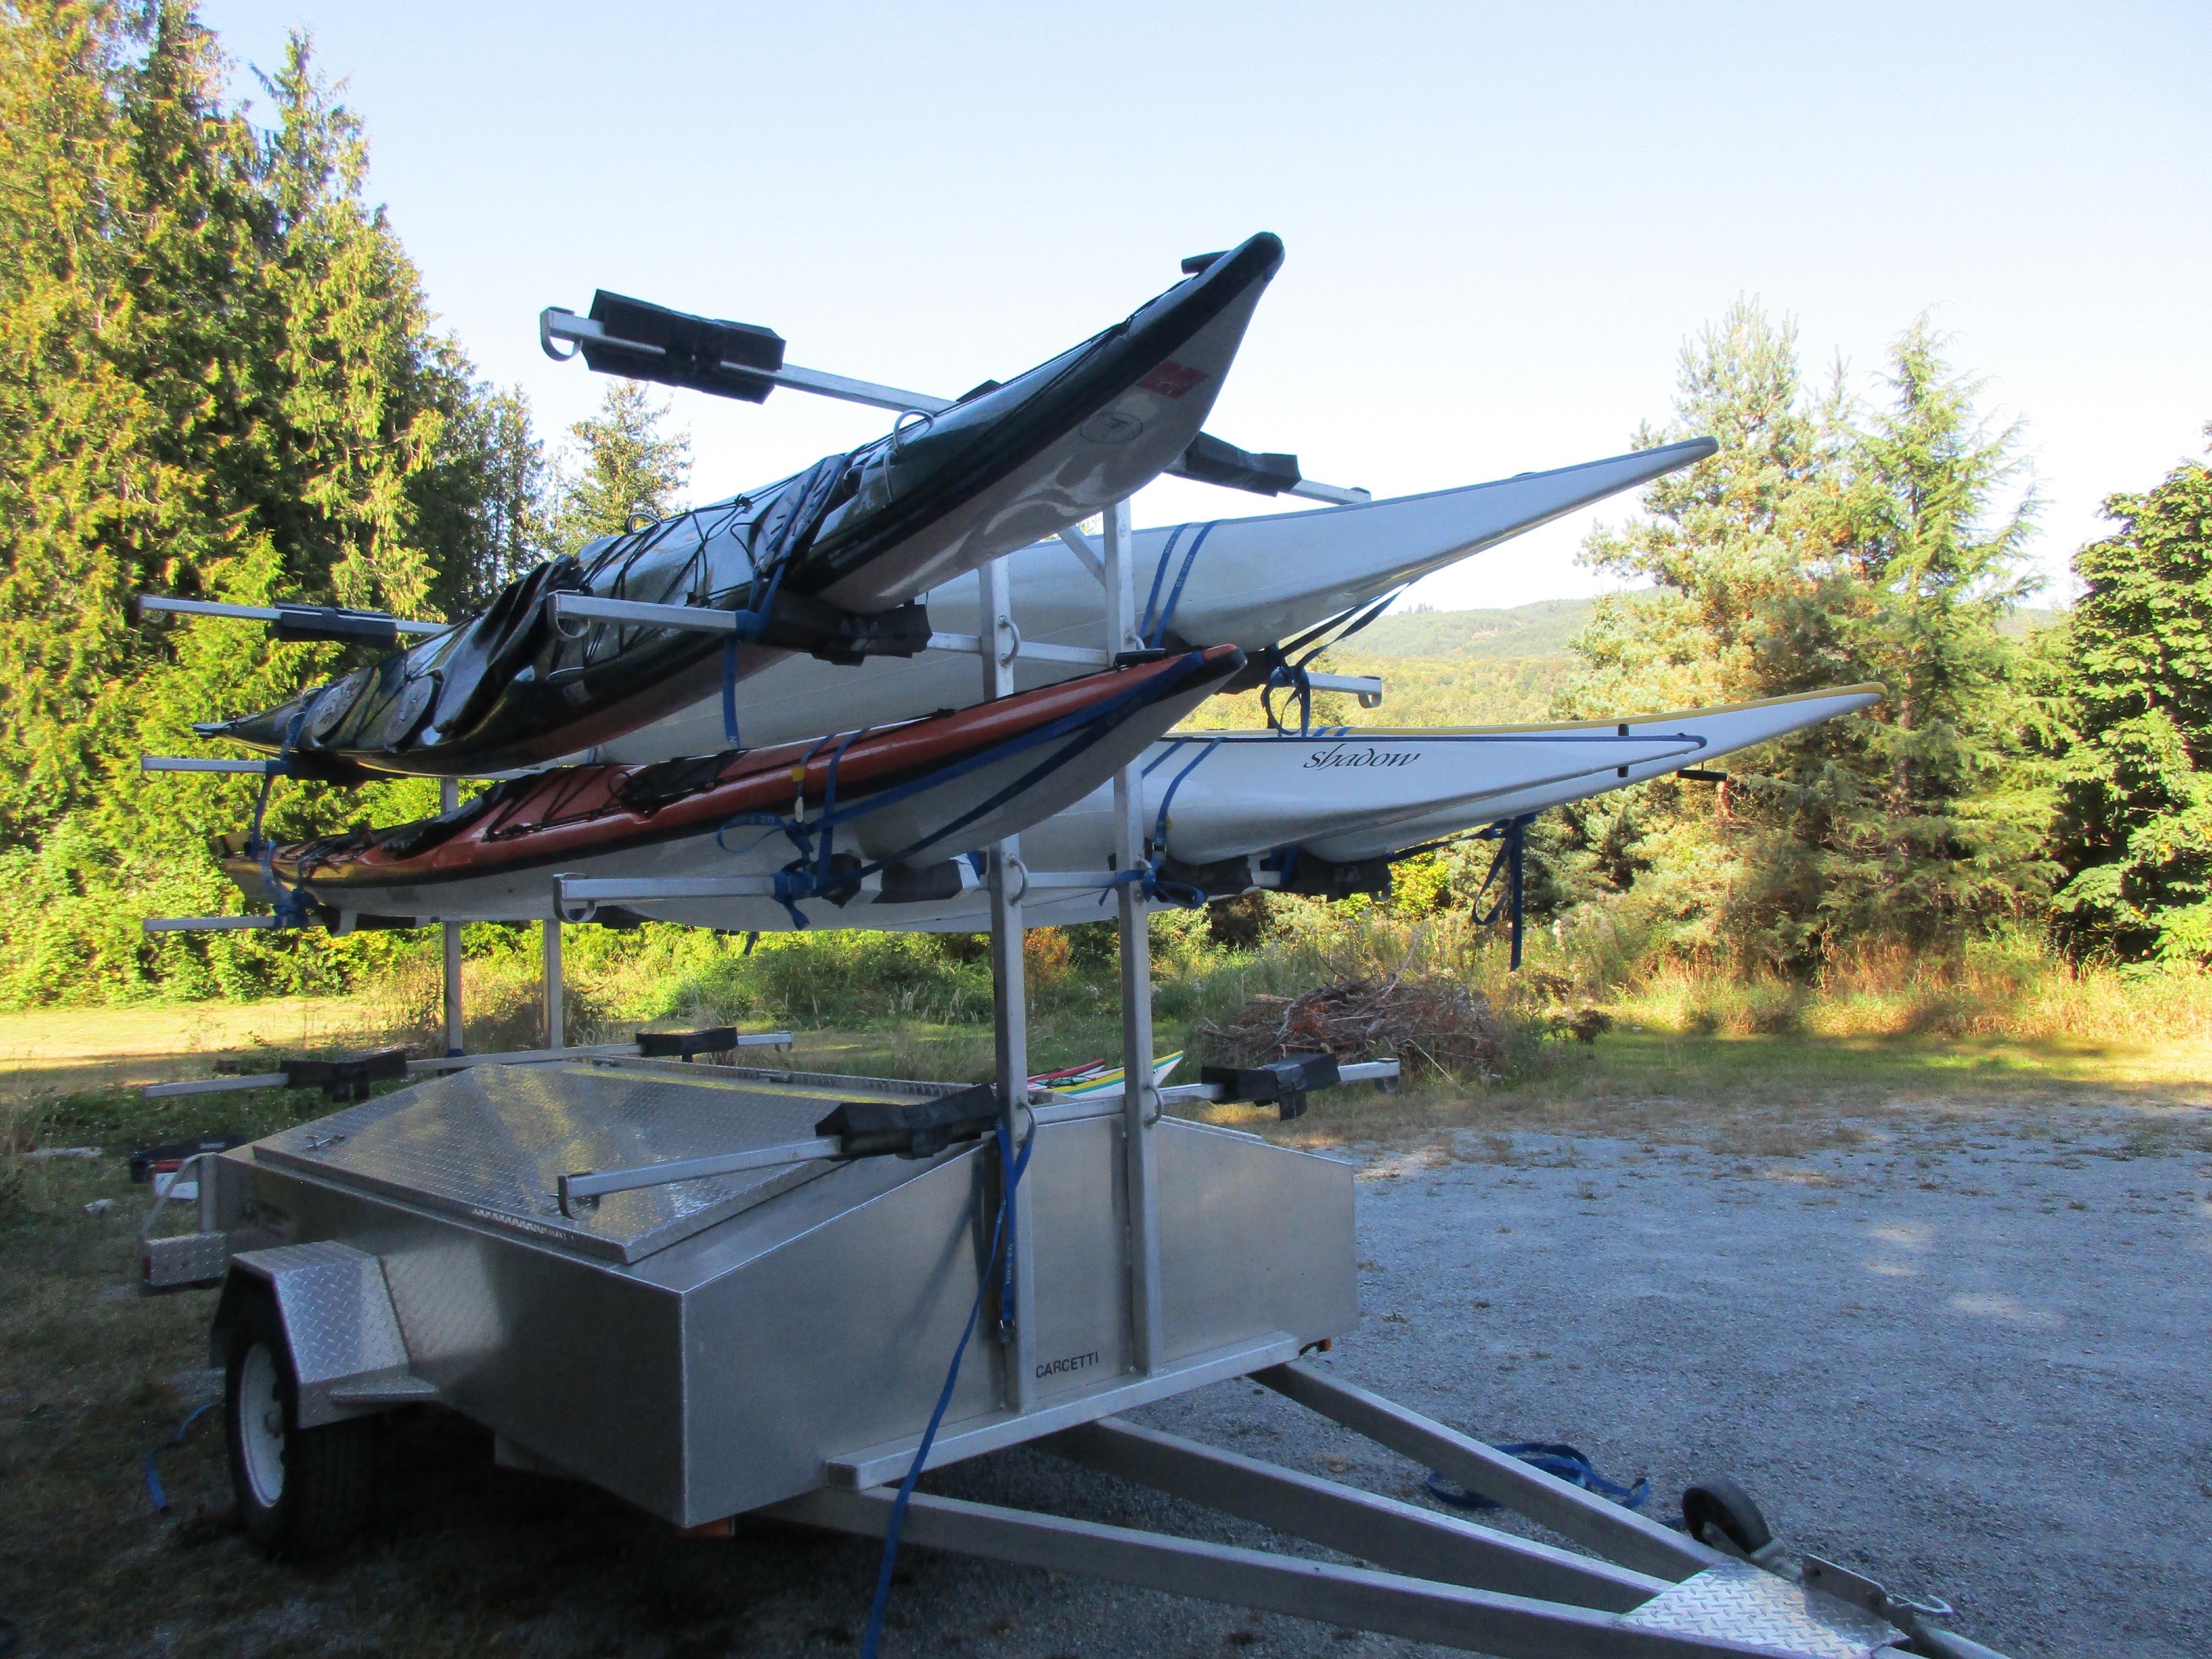
Course travel is a major part of the NOLS Alaska GHG footprint accounting for nearly half of total emissions. We utilize a myriad of transportation services such as small charter planes and charter boats to access remote locations for course dropoffs, pick-ups, and resupplies.
Air travel by in-town staff is up compared to earlier years likely due to increased travel reporting.
Gas charter boat travel was a highly used method of transport for courses this past year with an increase of 1,580 miles, or 22 Mt CO2eq, from FY15.
The Super Cub plane increased in use by 85 hours from FY15, equaling about 5.5 Mt CO2eq.
Gas
Gas
NOLS Vehicle Travel Gas
NOLS Vehicle Travel Diesel
In-town Staff Travel
Non-NOLS Vehicle Travel
Since FY13, NOLS Australia has generated no emissions related to electricity. The five kilowatt (kW) solar panel system, installed in FY11, builds up credits with the utility during the summer months from power we put back onto the grid. During the winter months, we use those solar credits to come out even on our electric usage.
During wet seasons in northwest Australia, the roads can be too flooded to drive our NOLS diesel trucks, forcing us to fly courses to their drop-off site.
NOLS in-town staff travel saw substantial emissions reduction from FY15 decreasing almost 6 Mt CO2eq, or 14,380 miles (23,142 km) driven by an average passenger car. (2)
NOLS Vehicle Travel Gas
NOLS Vehicle Travel Diesel
In-town Staff Travel
Non-NOLS Vehicle Travel
NOLS East Africa is a small operation with typically only four courses run each year. Since it is such a small operation and we cannot account for some of the resource use (see below), this location has a very small footprint.
We share a building with another tenant, which makes it difficult to parse out the electricity and heating fuel usage for our footprint. No figures are available.
Electricity at NOLS India is largely variable due to lack of consistency with what staff are reporting and the occupancy of different buildings over time. Since we rent this facility, it is more difficult to justify large energy efficiency improvements to reduce these emissions.
Propane increased significantly this year due to both instructors and in-town staff now using the kitchen for cooking meals. Previously, the kitchen was only used by in-town staff.
NOLS Mexico’s facility has a very light GHG footprint. The campus is run off-the-grid out of necessity due to its remote location. An eight kW photovoltaic solar panel system, installed in 1990, provides the majority of the location’s electricity and was the first of many NOLS solar panels to come.
Generator fuel is used as a backup when the solar panels are down or for nighttime use. Educating students and staff to charge electronics during the day when the solar panels are producing power, instead of using generator fuel at night, is a continual effort.
NOLS vehicle travel numbers are impacted by student day numbers. If we run the same number of courses with fewer students, that decreases our efficiency.
The spike in NOLS vehicle diesel during FY11 is due to the addition of a semester course. Since our campus moved from Christchurch to outside of Nelson in FY12, we have seen this category steadily decrease because of our closer proximity to our course areas. The absence of NOLS vehicle diesel in FY09 is due to reporting error.
The year following our campus move (FY13), we constructed a majority of the buildings on-site. These buildings take advantage of natural daylight and passive solar heating/cooling, which helps to explain why we did not see a spike in electricity use for these new, larger buildings.
While the majority of seasonal in-town staff are New Zealanders, this year we needed to send a last minute staff replacement from the United States, which increased in-town staff travel by over three Mt CO2eq. Fiscal years 2015 and 2016 both saw increases in in-town staff travel due to us sending two New Zealand employees to the annual NOLS Faculty Summit, held in Lander, WY, for training.
NOLS Northeast’s largest emissions source are NOLS gas vehicles. Before we purchased a NOLS vehicle to be permanently stationed at the Northeast location in FY14, we relied heavily on the private shuttling services of Paul Smith’s College, where our campus was located. Some of the annual gas use is from transporting staff and supplies from NOLS Rocky Mountain in Wyoming to New York at the beginning of the season and back at the end of the season.
After moving campus locations this year, NOLS Northeast is finally able to track its electricity usage.
NOLS vehicle travel increased this past year due to transporting an additional vehicle cross-country for the campus and to an increase in student days.
NOLS Pacific Northwest participates in a green power purchasing program through Puget Sound Energy for 3,200 kWh/month, which helps fund renewable energy projects in the Northwest. This, combined with on-site solar power, makes for 97 percent of the campus’s power derived from green energy sources. The solar panels were installed in FY14 and the green power purchasing started being recorded in FY15. See solar graphs for more details.
Course assisted air travel is high this year due to an increase in evacuations from the field and a course that needed an air shuttle to the field when roads were impassable. These circumstances increased our aviation gasoline use by 2,575 gallons and emissions by 20 Mt CO2eq.
NOLS
NOLS
In-town Staff Travel
Non-NOLS Vehicle Travel
Student days
Diesel is a large percentage of the footprint because we try not to concentrate the impacts of our courses to the local area. This can result in long drives to remote regions for course drop offs.
This year we were looking for a fluctuation in propane use since it was the first full year using the geothermal system. While there may have been a dip in propane use for spatial heating, cooking an additional meal for students offset any reduction in fuel use.
NOLS Vehicle Travel Gas
NOLS Vehicle Travel Diesel
In-town Staff Travel
NOLS River Base owns a compressed natural gas vehicle in its fleet of trucks. Natural gas vehicles are estimated to emit about 25 percent fewer carbon dioxide emissions than gasoline vehicles.(3)
Many sections of NOLS Rocky Mountain courses are run by our NOLS River Base. Since resources and student days are regularly shared between the two locations, we’ve incorporated the NOLS River Base GHG intensity measures in with the NOLS Rocky Mountain on page 15.
NOLS vehicle gas emissions increased in FY16 by about 10 Mt CO2eq, or 1,236 gallons of gasoline, from the previous year. That's equal to two passenger vehicles driven for one year.(2) This is due to increased student days as well as four to six courses a year now heading to a new operating location on the San Juan river, which happen to be our longest drive at NOLS River Base.
Vehicle Travel Diesel
Travel
Natural Gas
In-town staff travel is a small part of the overall GHG footprint at NOLS Rocky Mountain consistently coming in at about one percent.
With much of NOLS Rocky Mountain’s rerations support coming from NOLS Three Peaks Ranch horsepackers and several course sections taking place at NOLS River Base, all three locations’ emissions and student days are combined in the GHG intensity graph.
Our largest NOLS location, NOLS Rocky Mountain, saw reductions in electricity use during FY16. From the power bills, we can determine that every building on campus used less electricity. Compared to the average electricity use over the past eight years, emissions saved in FY16 are enough to provide power to a little over five average U.S. homes for a year. (2)
NOLS Vehicle Travel Diesel
In-town Staff Travel
Non-NOLS Vehicle Travel
NOLS Scandinavia was established in FY08 in Norway; however, it was not until after our relocation to Sweden in FY13 that we started tracking our GHG footprint.
Non-NOLS Vehicle Travel shows less than average GHG emissions in FY14 due to lack of reporting of our public transportation use.
Since NOLS Scandinavia shares a leased building with another tenant, it is difficult to parse out the electricity and heating fuel usage in order to measure our footprint. No figures are available at this time.
Occasionally expeditions can benefit from the Scandinavian public transportation network by incorporating the use of trains, buses, and ferries as part of the course logistics. Most backpacking courses set out on foot directly from the campus or have it as the last campsite at the end of the expedition.
In-town Staff Travel
Non-NOLS Vehicle Travel
Footprint & Student Days
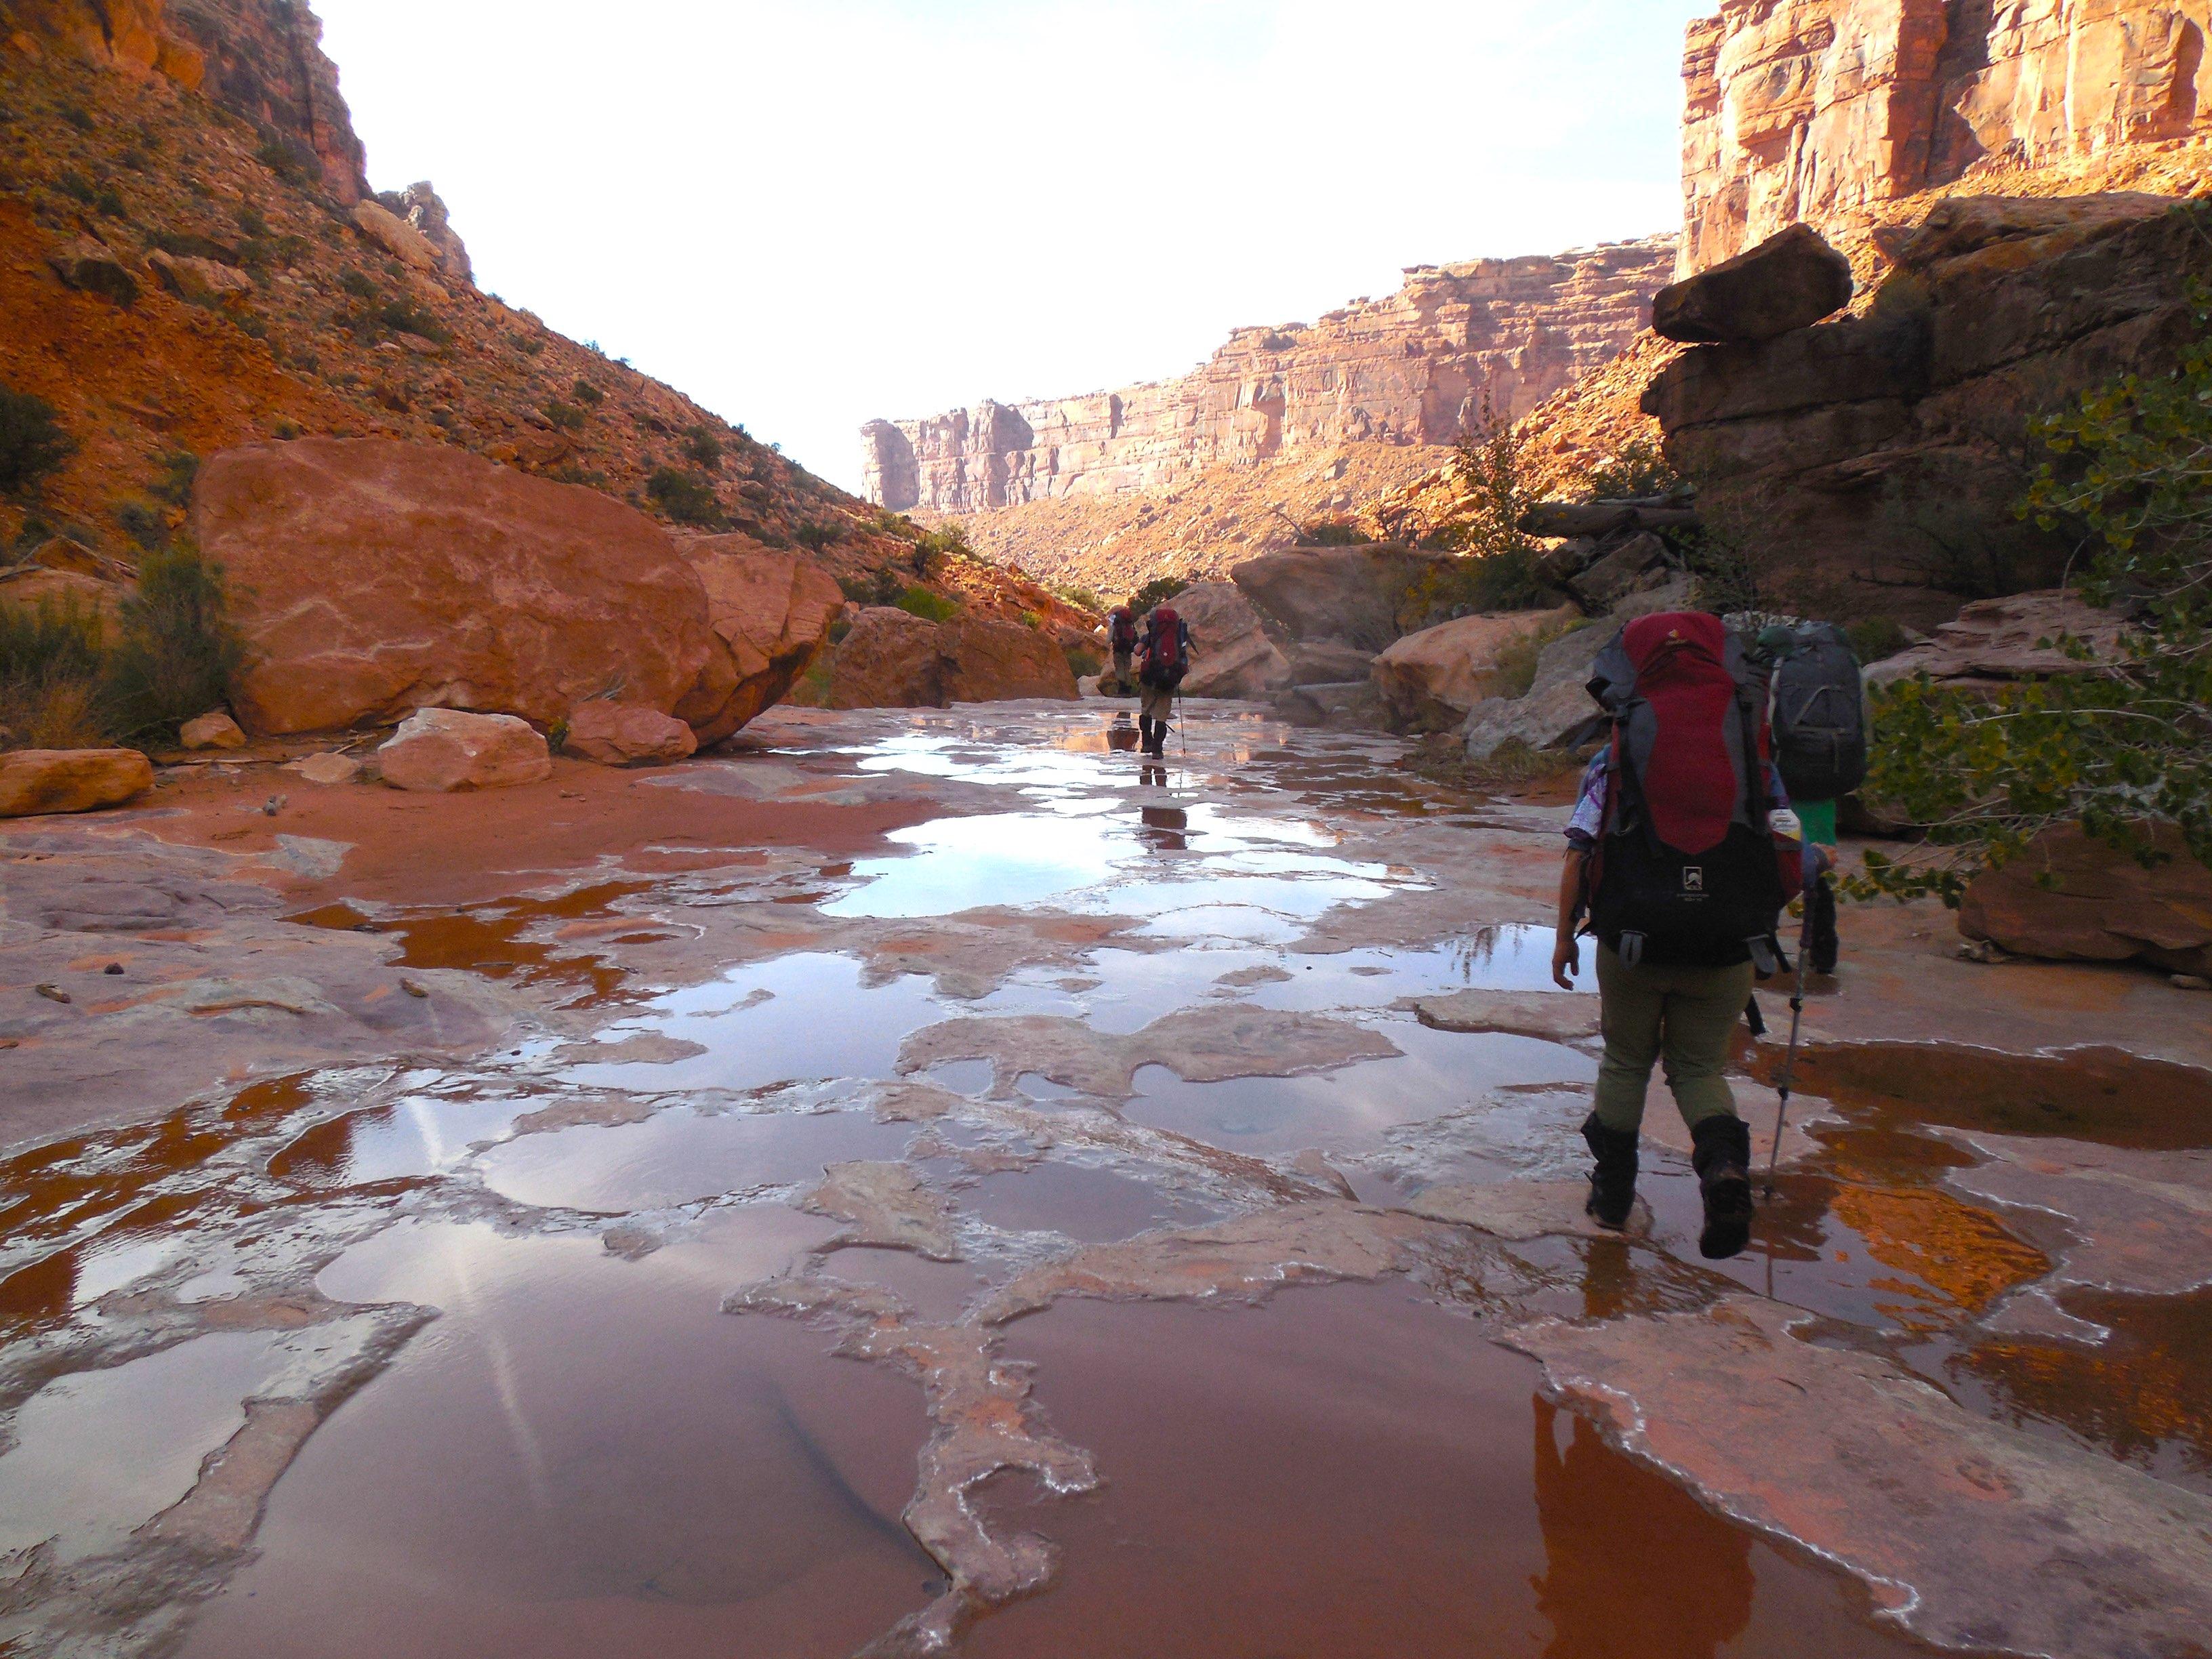
Drivers at NOLS Southwest have access to a fueling station in Tucson where alternative fuels, such as biodiesel and ethanol, are available. Ethanol is slowly becoming a part of this fleet’s fuel mix as we gain more experience with the fuel and the possibility of expansion in ethanol fueling stations grows where we operate.
Electricity consumption dropped by over five Mt CO2eq this past year—all of which came from reduced electricity use. That’s the equivalent of 139 tree seedlings sequestering carbon dioxide for 10 years. (2)
Even though NOLS Southwest's GHG emissions were slightly higher than last year, an increase in student days meant we were able to sustain a level GHG intensity.
Vehicle Travel Gas NOLS Vehicle Travel Diesel
In-town Staff Travel
Interestingly, NOLS Teton Valley student days do not strongly correlate with GHG emissions. The most notable fluctuations in GHG emissions come from facility sources, which can be more reflective of environmental factors than transportation, which is more closely linked to student day numbers.
This year NOLS Teton Valley's dominant heating fuel emissions source switched from heating oil to propane—a fuel with nearly half the GHG emissions.(3) Soon a new propane furnace will completely replace the heating oil system.
NOLS Vehicle Travel Gas
NOLS Vehicle Travel Diesel
In-town Staff Travel
Heating Oil
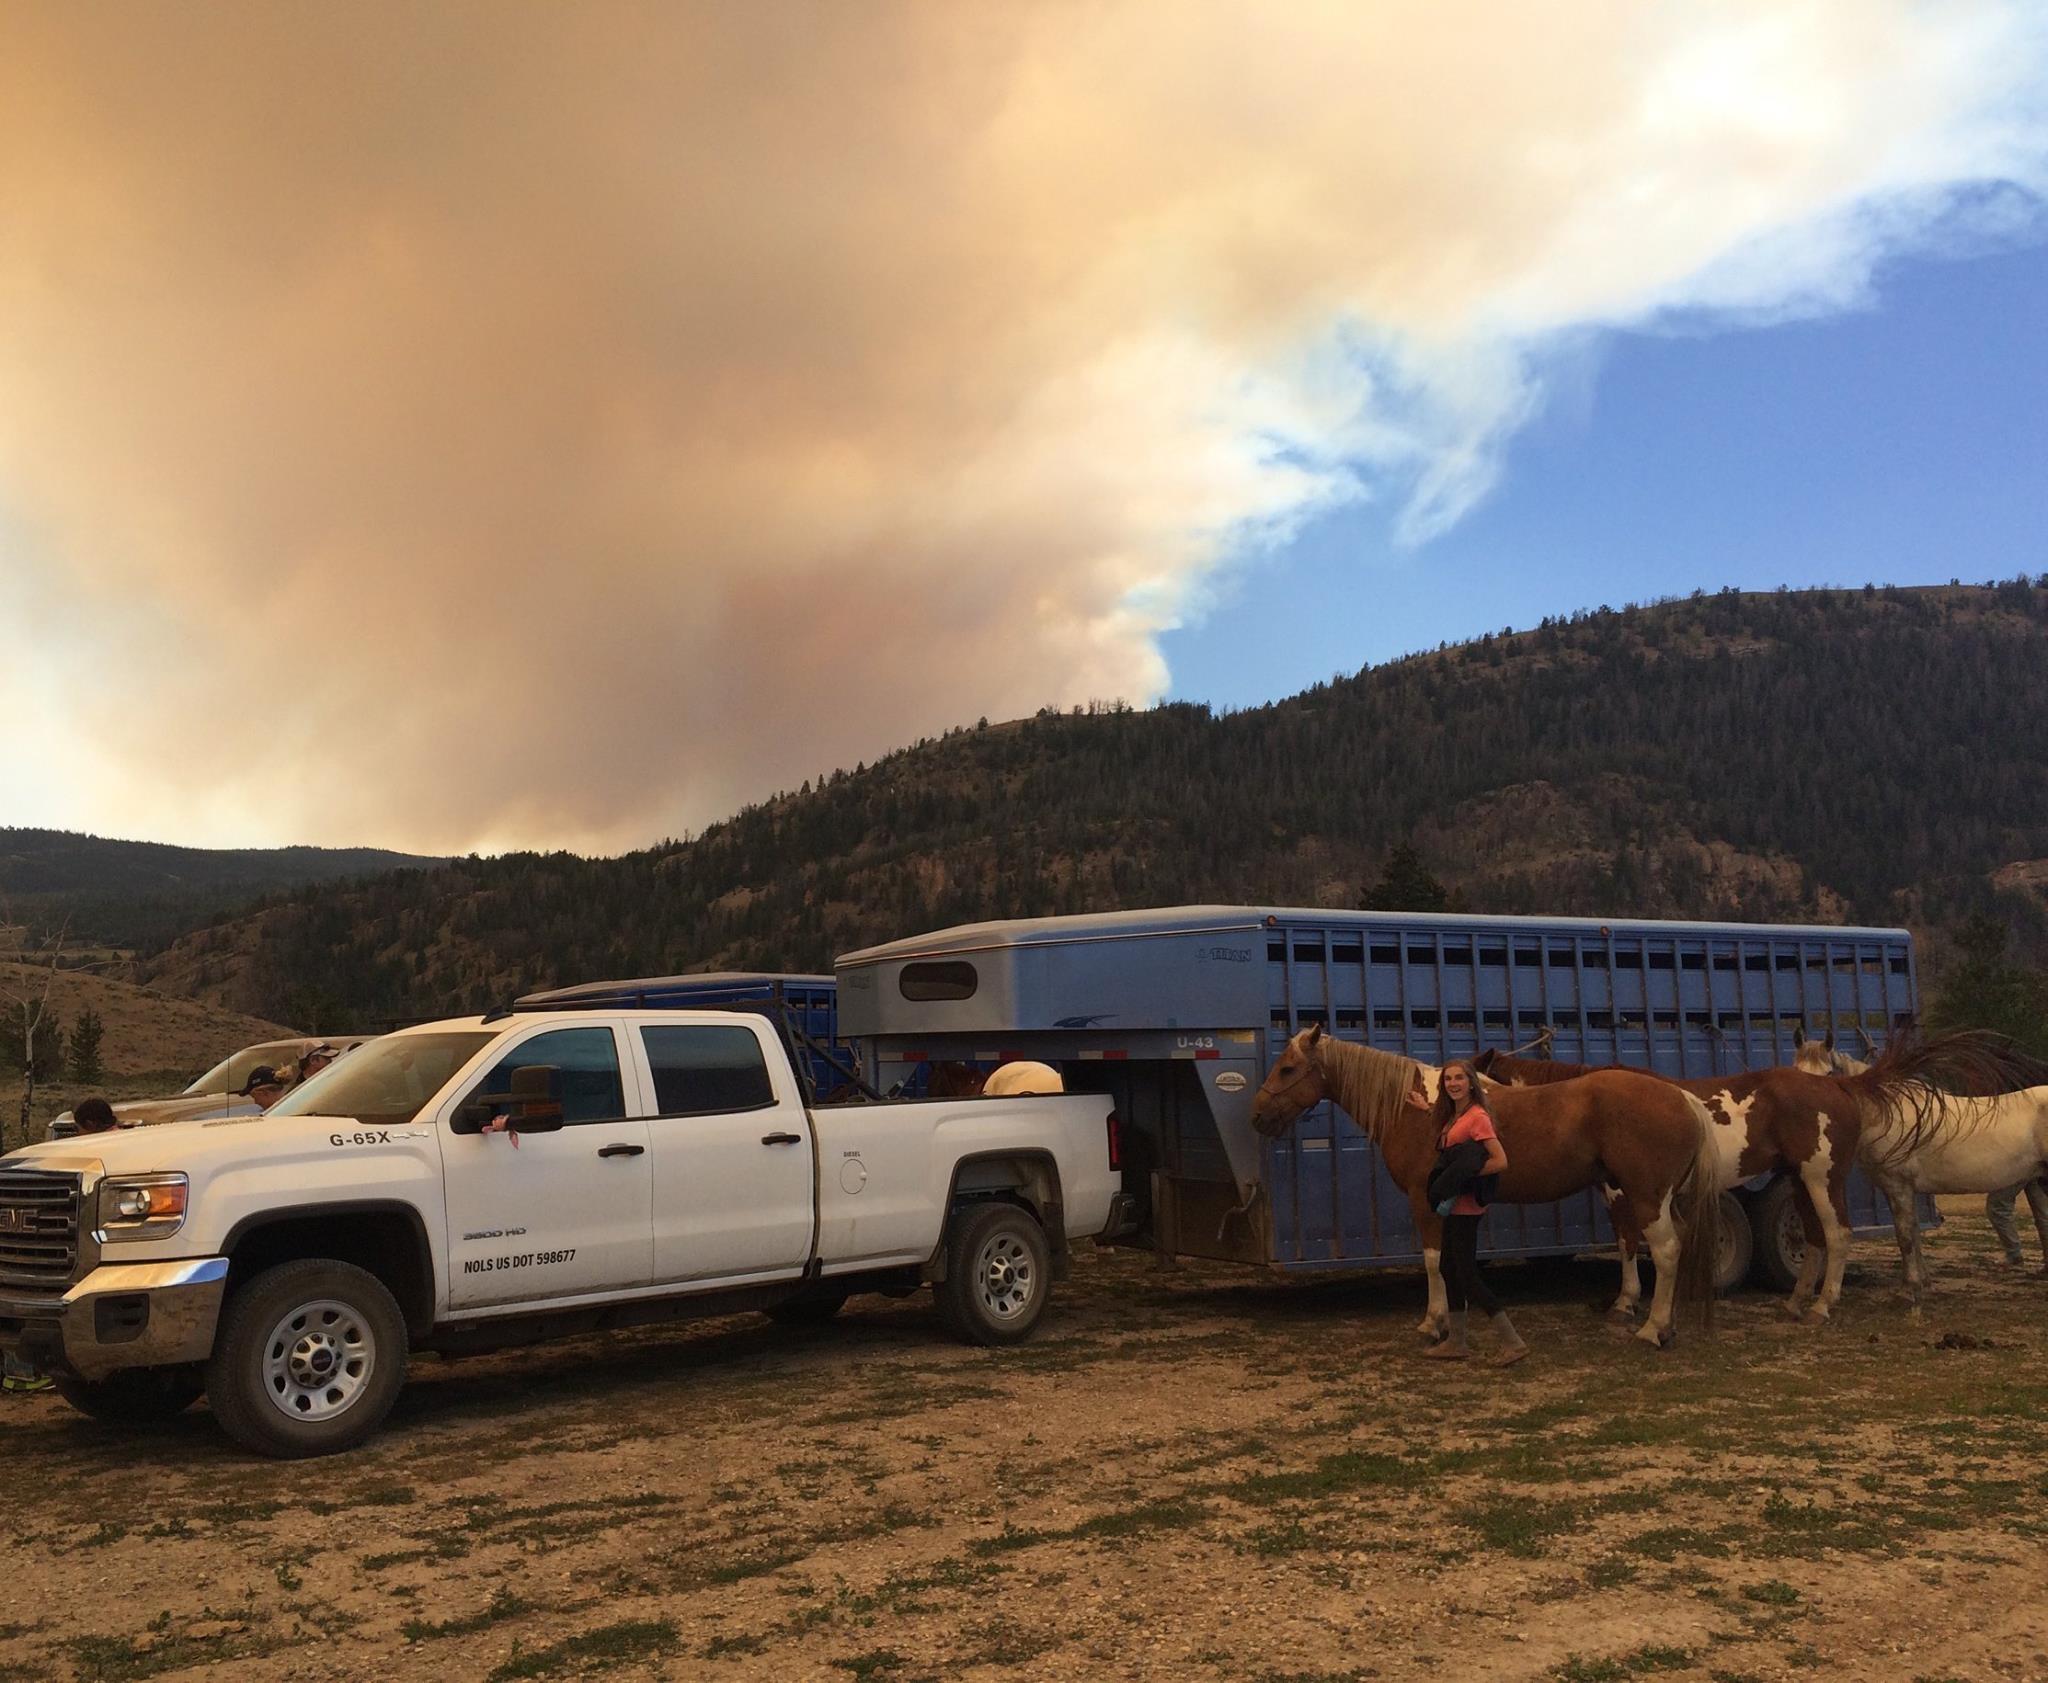
Operations at NOLS Three Peaks Ranch rely heavily on diesel trucks for hauling horse trailers, carrying out ranch chores, and transporting students to and from the field. Diesel surged in FY12 due to heavy use of a new, larger F550 truck used for hauling a ten-horse capacity trailer.
We do not calculate GHG intensity for the Three Peaks Ranch because the majority of the ranch’s operations go towards supporting NOLS Rocky Mountain courses with rerations. One can find a combined GHG intensity measure on page 16.
Electricity used at the Three Peaks Ranch was down in FY16. Compared to the average electricity consumption over the past eight years, in FY16 the ranch reduced emissions by four Mt CO2eq—that's comparable to almost four acres of U.S. forest sequestering carbon dioxide. (2)
In FY13, NOLS Yukon cancelled a semester course and shrank a few other courses in efforts to be more efficient with resources. The effect of this can be seen in the GHG footprint that year.
Heating oil, a very GHG intensive fuel, was phased out in FY12. For two years after that, the campus did not use any spacial heating since the facilities were closed down and winterized during the off-season. Starting in FY14, in-town staff began burning wood for spacial heating during the spring and fall.
In-town staff travel started decreasing in FY13 in part due to NOLS hiring more Canadian seasonal employees. This comes after changes in the Canadian government’s restrictions on hiring foreign temporary workers.
Both NOLS vehicle gas and diesel, NOLS Yukon's biggest emission sources, were down in FY16 by a little over seven Mt CO2eq, or 2,895 liters (765 gallons) of fuel.
Gas NOLS Vehicle Travel Gas
NOLS Vehicle Travel Diesel
In-town Staff Travel
Non-NOLS Vehicle Travel
Heating Oil
Since NOLS World Headquarters hosts no students, there is no student day metric.
We began internally tracking in-town staff travel in FY10. Our World Headquarters in-town travel tracking system faces challenges in maintaining consistency in reporting. With every department in charge of their own reporting and new hires not always receiving an orientation to the system, it makes for spotty reporting. A solution to the lack of reporting could be looping GHG travel reporting in with the travel expense journal or visa statement processes, which everybody is oriented on. We are holding off on this right now since we might be switching GHG tracking softwares in the near future.
Reported ground and air travel by NOLS World Headquarters in-town staff was down this year by 33 Mt CO2eq. That’s equivalent to about five roundtrips from Riverton, WY (the closest airport to World Headquarters) to Broome, Australia to visit our campus.(4) This reduction could be due to fewer trips— using more virtual communication methods—or to less reporting compliance.
NOLS World Headquarters gained significant GHG savings from electricity this year. We reduced about 100 Mt CO2eq compared to the past seven-year average. That’s equivalent to 3,545 incandescent lamps switched to LED.(2) There were no major energy efficiency upgrades this year and the emissions factors did not change, so we assume that the majority of the decrease was due to changes in use. We are not accounting for weather factors.
It should be noted that the majority of NOLS Wilderness Medicine student days take place off-site of the Wyss Campus. The emissions associated with short-term rental facilities and instructor travel are not within our reporting scope for these off-campus courses. Student days that take place at other NOLS locations are captured under that location’s footprint.
Electricity emissions rose significantly this year, 60 Mt CO2eq, equivalent to 64,026 pounds of burned coal, and it wasn't because of increased electricity consumption at the campus.(2) While updating the emissions factors from the electrical grid, we noticed that our utility was accidentally associated with the wrong emissions grid region. This switched us from a grid that mostly supplies its power from hydro power, a low greenhouse gas emitting fuel source, to a grid of mostly coal, the highest greenhouse gas emitting fuel source. The graphs below are corrected for past years of miscalculations.
While we continue to expand our renewable energy projects, we face particular constraints of scarcer and more competitive grants and low state net metering caps. For example, in Wyoming, there is a 25kW cap per meter that we can install of renewable energy. Our NOLS Rocky Mountain location, Noble hotel, World Headquarters buildings are already capped out, we can install no more renewable energy systems unless we install and pay for additional power meters. These limitations cause us to search for other sources of renewable energy.
Two NOLS locations currently take part in green power programs through their respective utilities. These green power programs sell customers renewable energy credits (RECs) from renewable energy projects the utility helps to fund or from the REC marketplace. Each REC offsets a defined amount of GHG/kWh.


During FY15-FY16 we investigated what it would mean for NOLS to enter into a Power Purchasing Agreement (PPA). These agreements encourage new development of alternative energy by having the energy customer sign into a multi-year agreement with an alternative energy seller, thereby creating a steady stream of capital for energy developers and a predictable electricity bill for the customer.
After discussions with two different companies who facilitate PPAs, we found that the western grid market, where most of our electricity is consumed, is not ideal for a PPA. One hurdle is that there are no Regional Transmission Organizations in the western grid (besides parts of California) which optimize supply and demand bids for wholesale electric power, an essential process for PPAs. Our other hurdle is we are too small of a power consumer to enter a PPA alone. We would need to partner with larger institutions such as hospitals, state government, or research universities to make our electricity demand more attractive to energy developers.

7% of
100% of

40% of total power use supplied by solar
57% of solar used on-site
43% of solar returned to power grid
In December of 2016, the Arizona Corporation Commission voted four to one to restructure net metering laws in Arizona. Until now, utility customers have paid retail rates for electricity and received wholesale rates for electricity returned to the grid. However, beginning in the winter of 2017, new solar customers will instead receive the “avoided cost” rate for solar returned to the grid. The new buy back rate will then be cut in half after ten years. Existing solar customers will be grandfathered in for the next 20 years under current net metering structure.
These net metering changes impact our decision timeline on when to install additional solar panels at our NOLS Southwest location in Tucson, Arizona. Unfortunately, this change comes in the same year as the construction of our new building at NOLS Southwest which, with its higher than budgeted costs, left little room in the budget for solar panels. We are looking towards grants to help offset the cost of the building so that we can afford to purchase a six kWh array.

Wyss 18.84kW array

Total Solar Production Total Power Use
Every January, sustainability hosts a Green Fleet meeting wherein transportation managers from several NOLS locations share new developments in fleet efficiency and alternative fuels. The following points are snapshots from our FY16 conversation:
In previous years, there was interest in pursuing use of biodiesel at Teton Valley; however, after research into the availability of the fuel in the region, we found that the lack of access to fueling stations and onsite bulk suppliers prohibits us from pursuing this technology. It was also noted that currently there is only one diesel truck at this location, which means we would need to convert the fleet to diesel vehicles.
This hybrid electric car gets heavy use by in-town staff for running errands plus, in some instances, serves as a student/instructor evacuation vehicle when the trailhead is easily accessible.
Drives when there are no passengers in the vehicle traveling to or from a trailhead we refer to as deadheads. To better promote travel efficiency and reduce deadheads, Alaska is looking to:
• Assess course mixes for opportunities to align course sections with similar gear needs and to coincide evening drop-offs with next morning pick-ups.
• Streamline staff airport pick-ups and centralize airport use to Anchorage.
• Maximize use of the 15-passenger van and a new 20-passenger shuttle bus with trailer hauling capacity and minimize use of larger school buses.

With less than three years left until our emissions target year of 2020, we need to focus on where we can take advantage of substantial in-house emissions reductions, such as a more efficient furnace at NOLS Teton Valley and increased transportation efficiency at NOLS Alaska. At the same time, we must map where we plan to see increases in emissions, such as with the new NOLS Southwest building and the Lander distribution center.
The reality is that even if we dedicate more resources toward inhouse emissions reductions, it is unlikely we will reach our 2020 goal entirely in-house. Within the next couple of years we need to start working with a third-party certified carbon offset program whose projects align with our mission and goals.
We face many challenges and opportunities as we aim for our GHG reduction targets: intensifying environmental disasters, uncertainty in policy changes, and developing carbon market forces, to mention a few. These factors directly impact our operations and our ability to adopt sustainability measures. When we consider internal factors, we look to the NOLS strategic plan and its growth and development goals. While growth can make our GHG reduction targets more difficult to achieve, it does not make them unattainable. By focusing on efficiencies and growing to capacity, we can lower our GHG intensity and our overall footprint. It is within this realm that we continue looking forward on our path towards sustainability.

(1) 2006 Baseline Year: When Pure Strategies conducted their baseline study of the NOLS GHG footprint in 2006, they relied on sparse data available at that time and estimates. The extent to which Scope 3 emissions were included in the 2006 audit is not clear from their records. These factors combined is why some locations show inconsistent 2006 data compared to other years. However, we do believe that when the emissions from all the locations are accumulated that it represents a decent overall representation of our footprint.
(2) United States Environmental Protection Agency. “Greenhouse Gas Equivalencies Calculator,” United States Environmental Protection Agency, accessed January 24, 2017, https://www.epa.gov/energy/greenhouse-gas-equivalencies-calculator. To view assumptions the EPA used in the equivalency calculator, visit https://www.epa.gov/energy/greenhouse-gases-equivalencies-calculator-calculations-and-references.
(3) United States Environmental Protection Agency. “Emission Factors for Greenhouse Gas Inventories,” United States Environmental Protection Agency. Last modified November 19, 2015.
(4) Foundation myclimate. The Climate Protection Partnership. Accessed September 23, 2017, https://co2.myclimate.org/en/portfolios? calculation_id=876570