
In 2006, NOLS identified the need for acomprehensive, schoolwide vision to reduce our carbon footprint and evaluate our progress. We contracted with Pure Strategiesin 2007 to conduct asustainability audit for theschool wherein they evaluated NOLS' current practices, established a 2006 baseline carbon footprint, and recommended improvements to reduce that footprint. In the context of human-induced climate change, monitoring acarbon footprint is particularly valuable. It allows us to measure environmental impact in specific categories, highlighting the areasin which reductionsshould befocused.
After NOLS established its baseline environmental footprint, a sustainability coordinator position wascreated to managethe ongoingcollection of footprint dataand foster implementation of Pure Strategy's recommendations. A central goal of our sustainability program is to be a support system, assisting locations in matters of sustainability. We haveworked to provideresourceson aschoolwide scale, such as the 2010 Creating a Climate for Change sustainability initiatives report and NOLS Sustainability Guidelines. With the publication of this Carbon Emissions Report, wecontinueto helplocationsachievetheir sustainability goals.
This report addresses the state of NOLS' carbon emissions, as an entire organization and also by location. It outlines our standards for carbon reporting as well as our emissions reduction goals. Current major initiatives for reducing energy use are highlighted such asalternativeenergy optionsand changesto our transportation systems. Progress reports for the overall organization and for each location have been compiled from availablecarbon emissionsdata. Theseoffer asnapshot of how carbon emissionsare distributed between operations and the overall progress made towards emissions reduction over these past years. This data can be used by locations to measure the efficacy of carbon reduction initiativesand track progresstowardsour goals.
One of the proposed waysto mitigate climate change is through the reporting by businesseson theimpact of their operations. Thisiscommonly done through the measurement of carbon footprints, "the total set of greenhouse gas emissions caused by an [individual, event, organization, product] expressed as CO2 [equivalent]" (Carbon Trust, 2010). Once the size and sources of the carbon footprint is determined, a strategy can be designed to reduceit.
Greenhouse gas reporting is divided into three scopes. Scope 1 includes direct emissions from organization-controlled sources. Scope 2 includes indirect emissions from organization-controlled sources. Scope 3 includesall other sources of emissions. While the Kyoto Protocol mandates thereportingof Scope1and 2emissions, many organizationsgo beyond and also report Scope3 emissionsto someextent.
After visitingkey operating locationsand interviewing staff members, PureStrategiesproduced an estimated carbon footprint for each location and the entire school for fiscal year (FY) 2006. Thismeasurement isused asour baseline footprint against which we establish goals and track progress This baseline footprint considered carbon sources within the Scope 1 and 2 boundaries, such ason-site fuel combustion, emissions from NOLS owned and leased vehicles, and electricity use as well as some Scope 3 emission sources. Thisallowed usto begin to establish systemsto measure and track our energy use; however, this initial footprint did not account for all emission sourcesrelatedto NOLSoperations.
In 2010 NOLS established a Scope 3 boundary based on what is realistically measurable. The Scope 3 sources we currently track include: student travel during NOLS courses, reimbursed intown staff travel, and outsourced re-rations/evacuations/drop-offs and pick-ups, all of which fit under the broader category of non-NOLSvehicles In FY 2015 we started including non-NOLS vehicle travel into our overall carbon footprint. This did not effect our 2006 baseline or emissions reduction goals since non-NOLSvehicleswerealready included in both of thosemeasurements.
N OLS Carbon Footprint Com ponents
Scope 1
BUILDING ENERGY
(leased andowned)
VEHICLES
(leased andowned)
WHITE GASFUEL
Scope 2
ELECTRICITY
Includedinourfootprintandcurrently targetedforreduction
Currentlynotincludedinourfootprint
Scope 3
STUDENT TRAVEL DURING COURSE
INTOWN STAFFTRAVEL
OUTSOURCED RE-RATIONS, EVACUATIONS, DROP-OFFS/PICK-UPS
FACULTY TRAVEL
COMMUTING
STUDENT TRAVEL TO NOLS COURSES
SHORT-TERM RENTED FACILITIES
EMISSIONSFROM PURCHASED MATERIALS
To improvethedata-collection process, NOLSlooked to Carbon Tracker, aweb-based software developed by Pure Strategies. Since 2009 wehaveused Carbon Tracker to log our energy use.
Thissystem reliesprimarily on contributionsfrom employeesat each location. Employees have been trained to input data on usage in the areas of transportation fuels, travel, and building-related energy. Carbon Tracker then convertsthesedistinct unitsto acrosscomparable value of carbon dioxideequivalent (CO2 eq). Measurements aresubject to somemargin of error, however thismethod providesuswith areliable enough estimate for us to understand our carbon footprint and keep workingto reduceit.
In 2006when PureStrategiesconducted their baseline studyof the NOLS carbon footprint they relied on sparse dataavailable at that time and estimates. For this reason, some locations show inconsistent 2006 data compared to other years. However, we do believe that when the emissions from all the locationsare accumulated that the 2006 baseline representsadecent overall representation of our footprint.
Our carbon reduction goals are based on recommendations and standardsset by other institutionsof higher education. One such standard is the internationally-recognized "2% Solution" which recommends reducing absolute carbon emissionsby 2 percent annually until 2050. Thiswould put NOLS at an 80 percent reduction in CO2eq by 2050. The scientific community hascome to ageneral consensusthat such areduction level will keep the partsper million of atmospheric carbon dioxidebelow catastrophic levels.
In addition to thislong-term 2050 goal, NOLS decided to set some interim goalsbased on thissame 2% Solution: a10 percent reduction from 2006 carbon levelsby 2010, and a30percent reduction by 2020. Thesegoals are absolute, representing the total actual carbon emitted by school operations within our carbon footprint boundary, and are kept unchanged even astheschool continuesto grow.
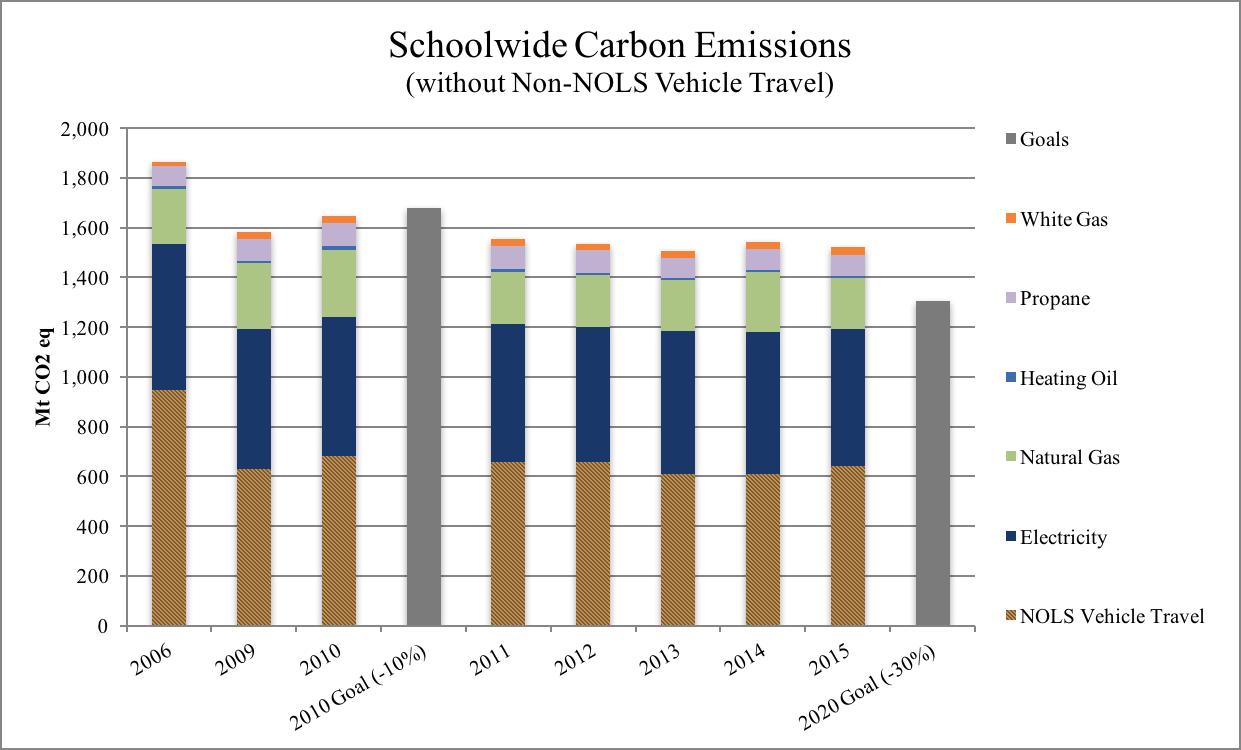
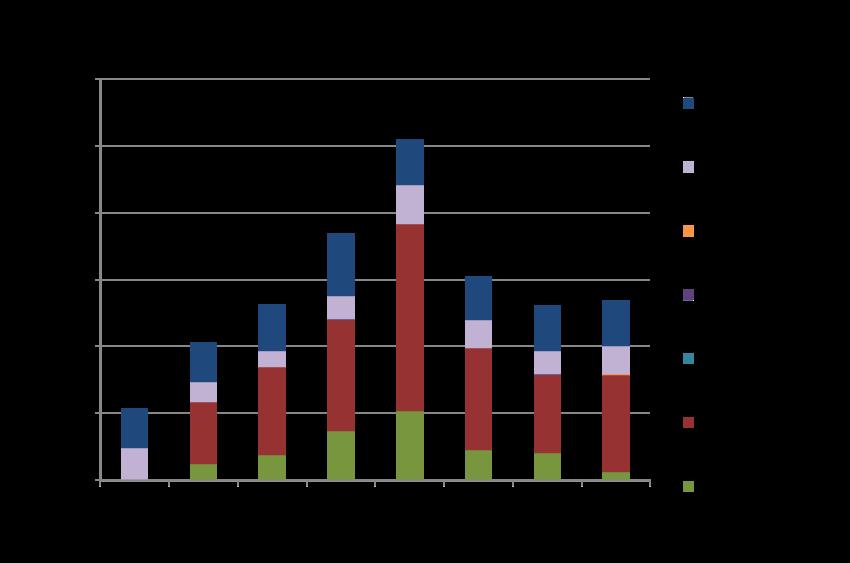
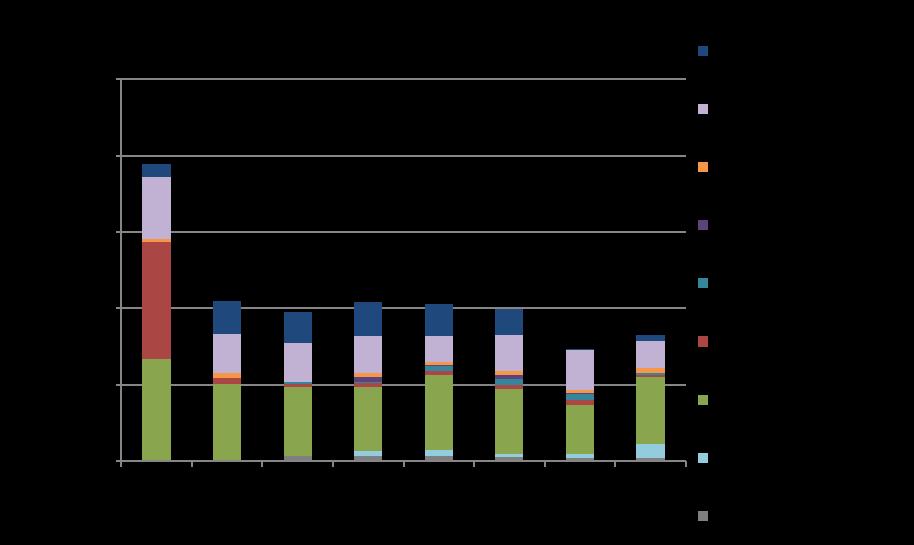
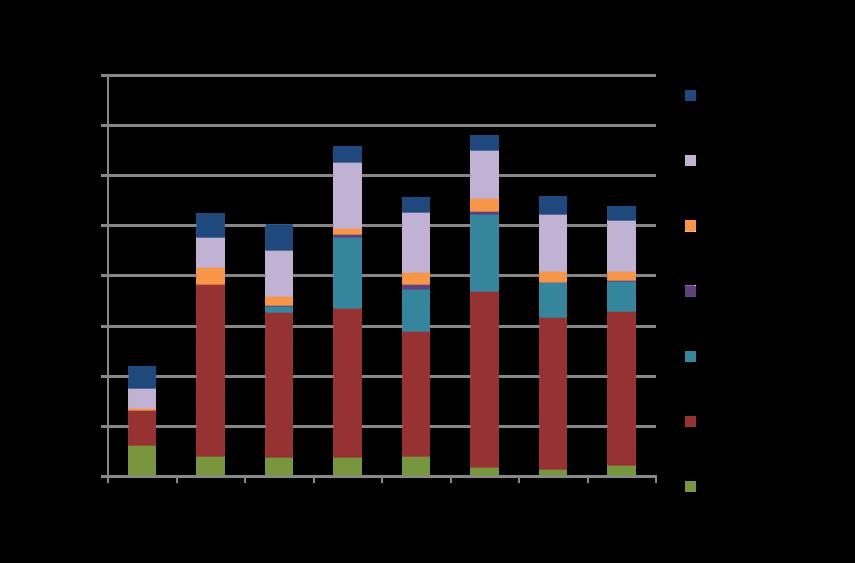
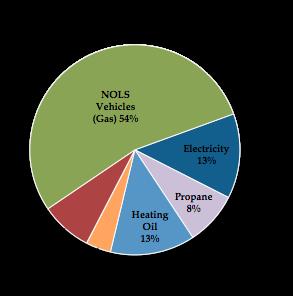
Our carbon reduction goals were initially set based on the FY 2006 carbon footprint. Thisbaseline footprint took into consideration the carbon sourcesof: NOLSvehicle travel, electricity, propane, natural gas, white gas, heating oil, and some Scope 3 sources. Based on these parameters, NOLS seemed to have succeeded in reaching our 2010 goal and to be progressing towardsachievingour 2020 goal aswell.
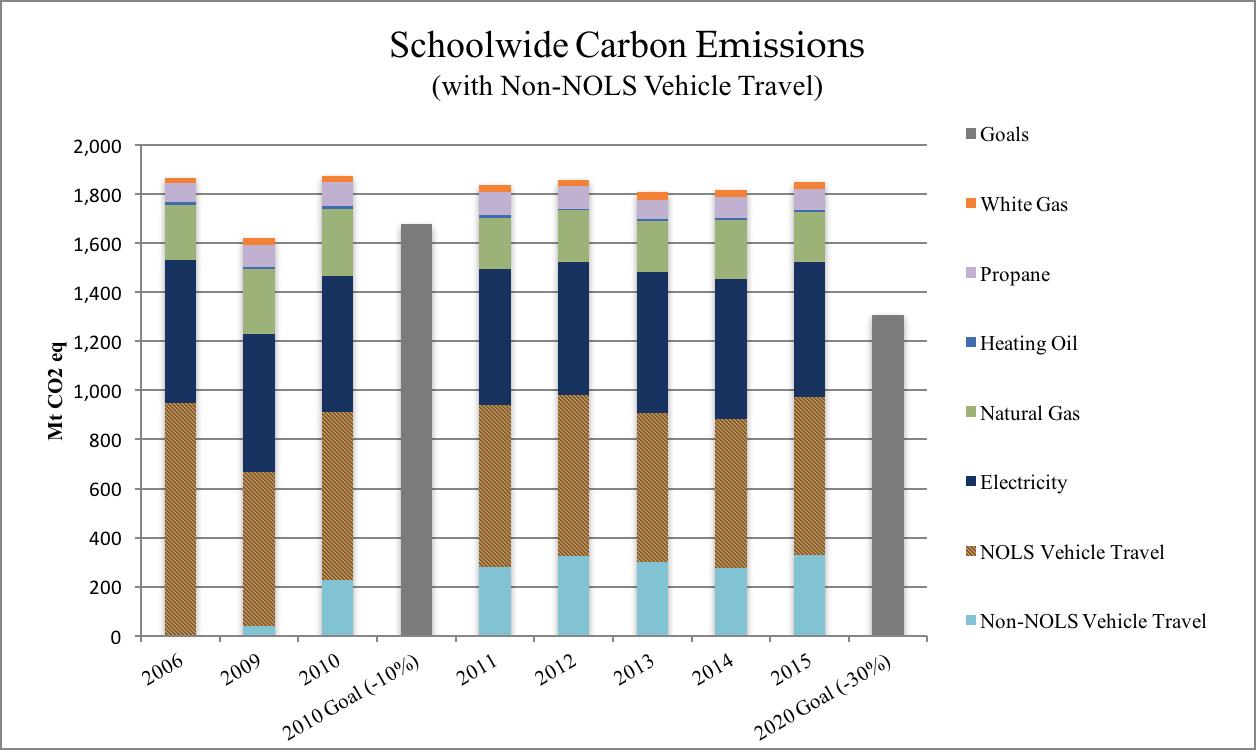
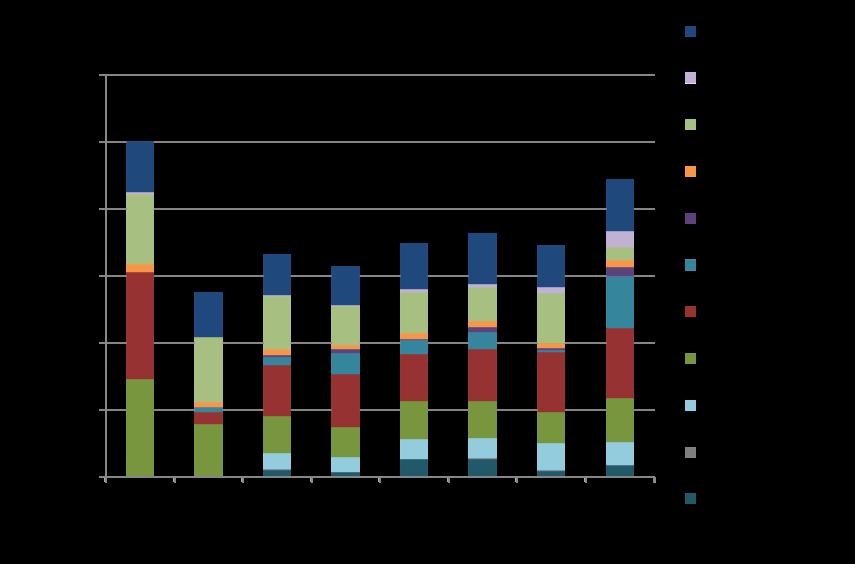
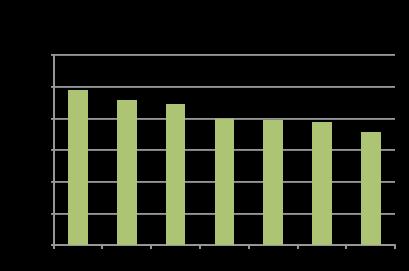
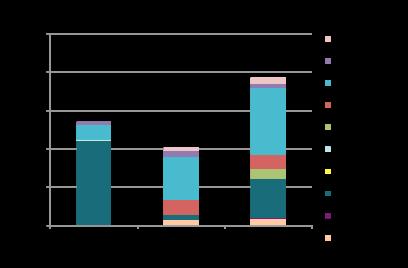
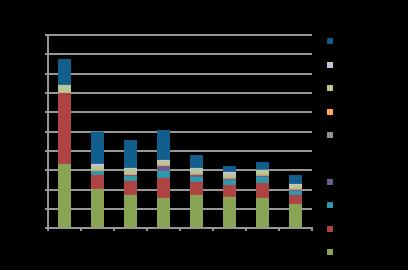
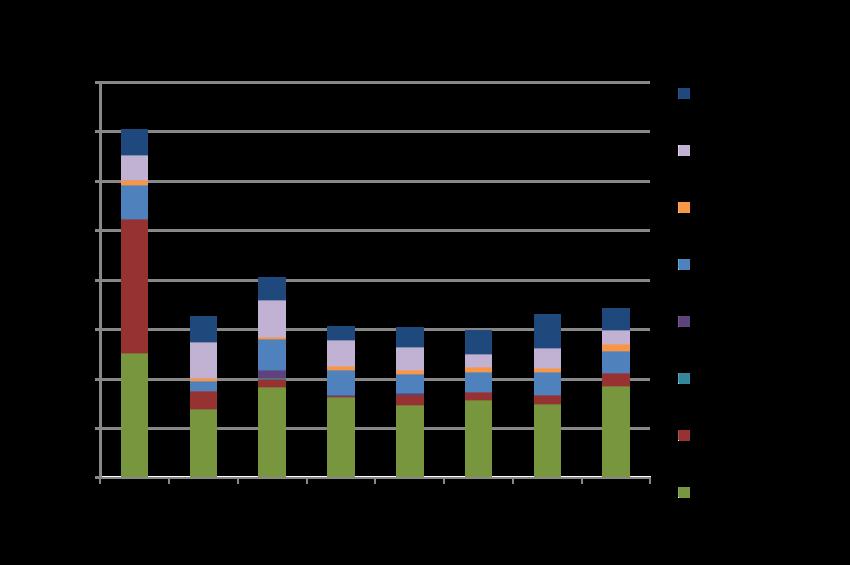
However, during FY 2015, we noticed that non-NOLSvehicletravel, a component of the footprint staff have been reporting on since 2009, was not being included in the overall footprint due to lack of reporting compliance for intown staff travel. When we include non-NOLS vehicle travel emissions, as we will do from here on out, the increase in emissions shows that we did not, in fact, reach our 2010 goal but have maintained a relatively steady line in carbon emissions since 2006. Note that non-NOLS vehicle travel wasincluded in the 2006 baseline datafrom which we set our reduction goals. It isthanksto the sustainability effortsof our locationsthat helped to keep emissionssteady even as the school continued to grow with morestudents, new facilitiesand transitioningoperating locations.
Fiscal Years
Fiscal Years
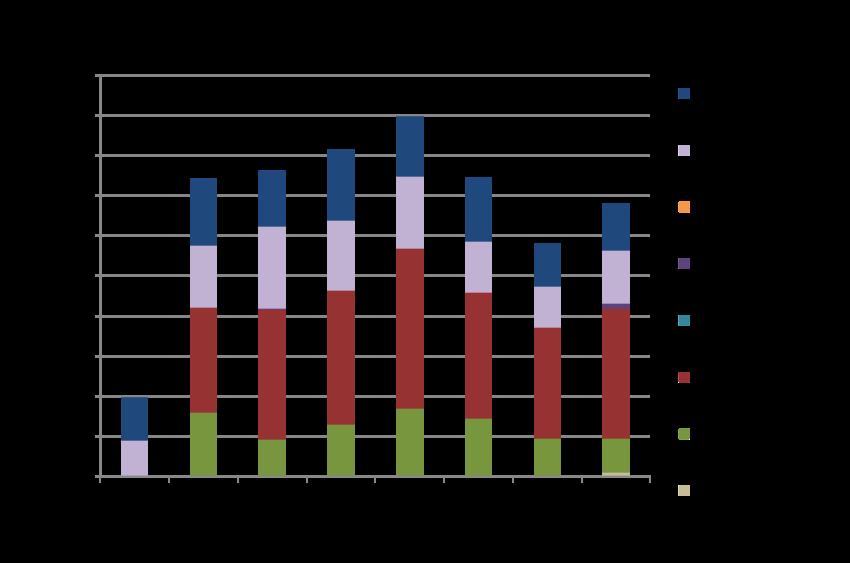
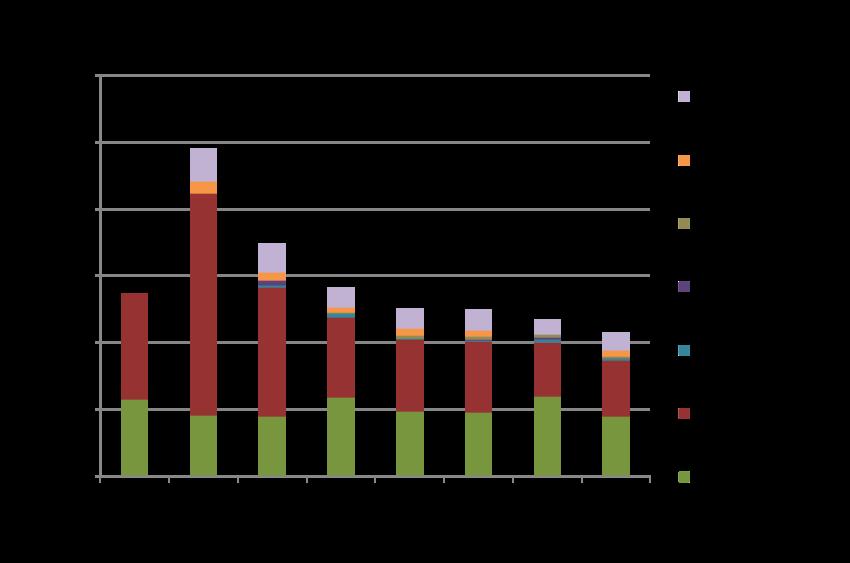
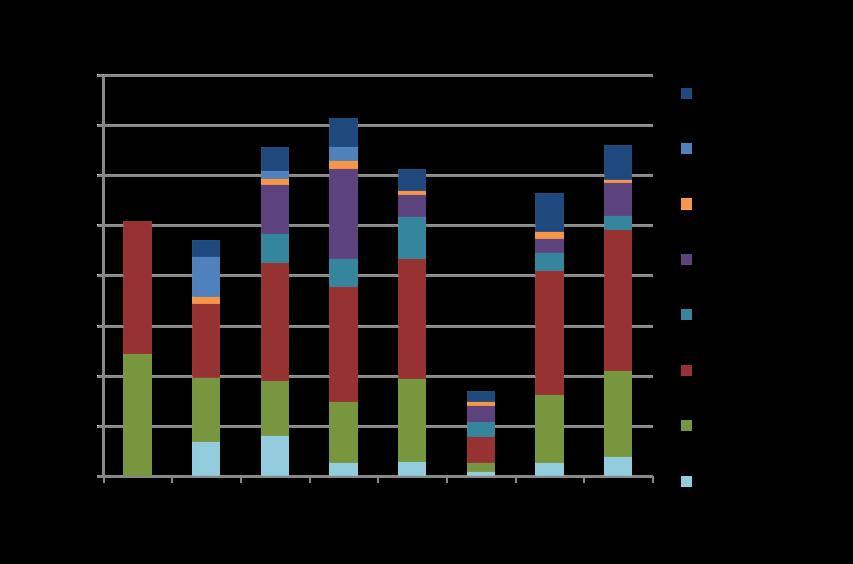
Our carbon footprint goals areabsolute; they areareflection of the total actual carbon emitted by schoolwideoperationswithin our carbon footprint boundaries. Over timewehavebuilt, renovated, moved, closed, and expanded our campuses. Theseaspectsof adeveloping organization effect our carbon footprint directly. Plus, we arealways tryingto improve upon our reporting systems which may entail correctingfor prior years' data. Amidst all of this, our absolutegoal for carbon reduction remains the same. No matter how much we change as a school we want our net impact on the climateto go down.
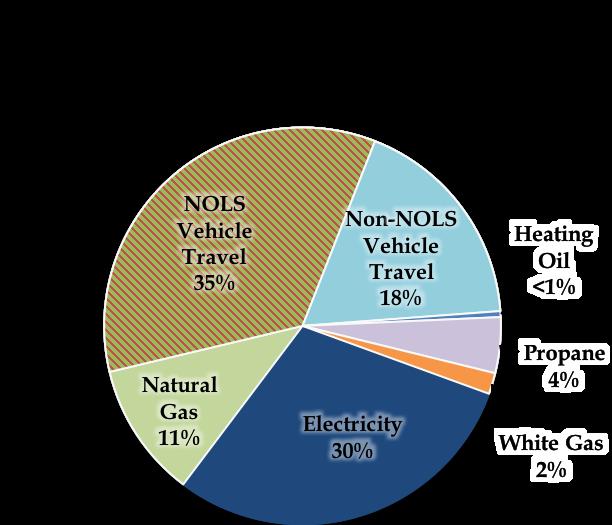
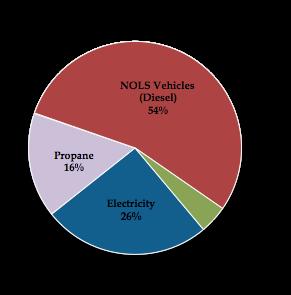
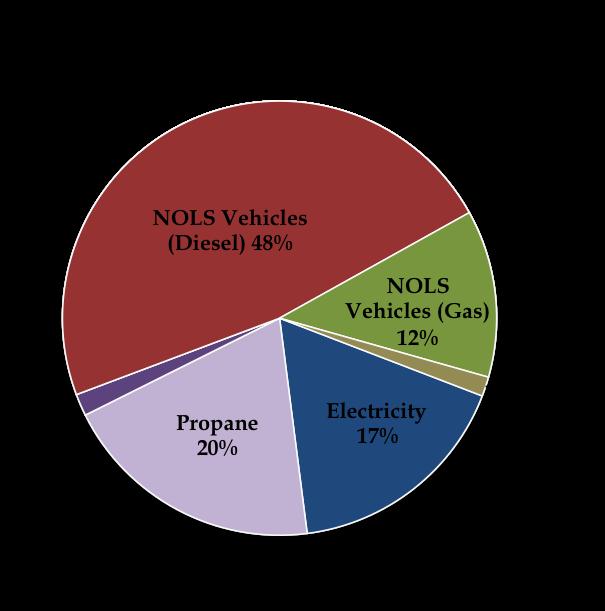
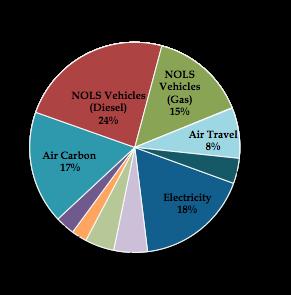
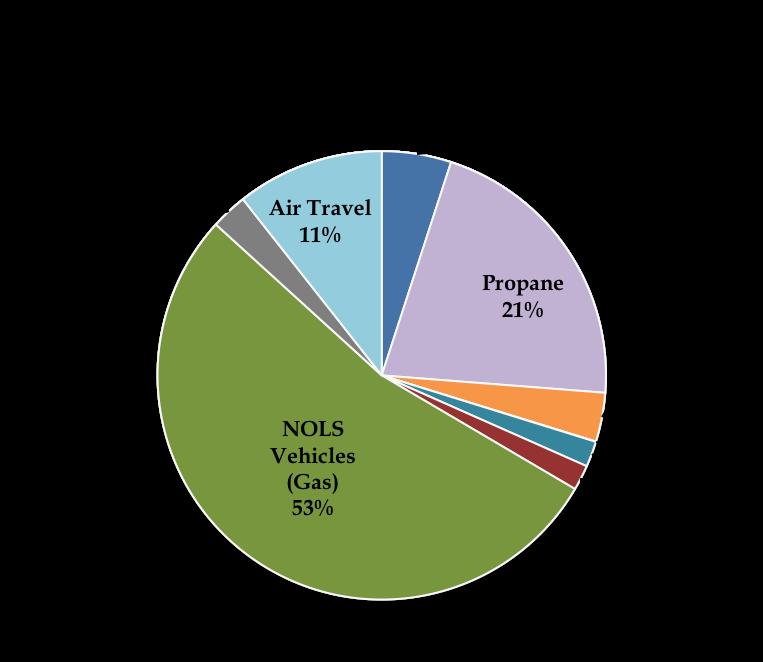
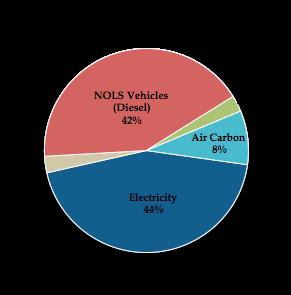
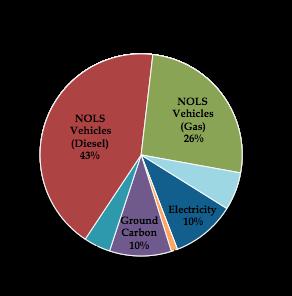
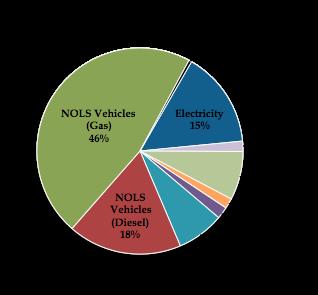
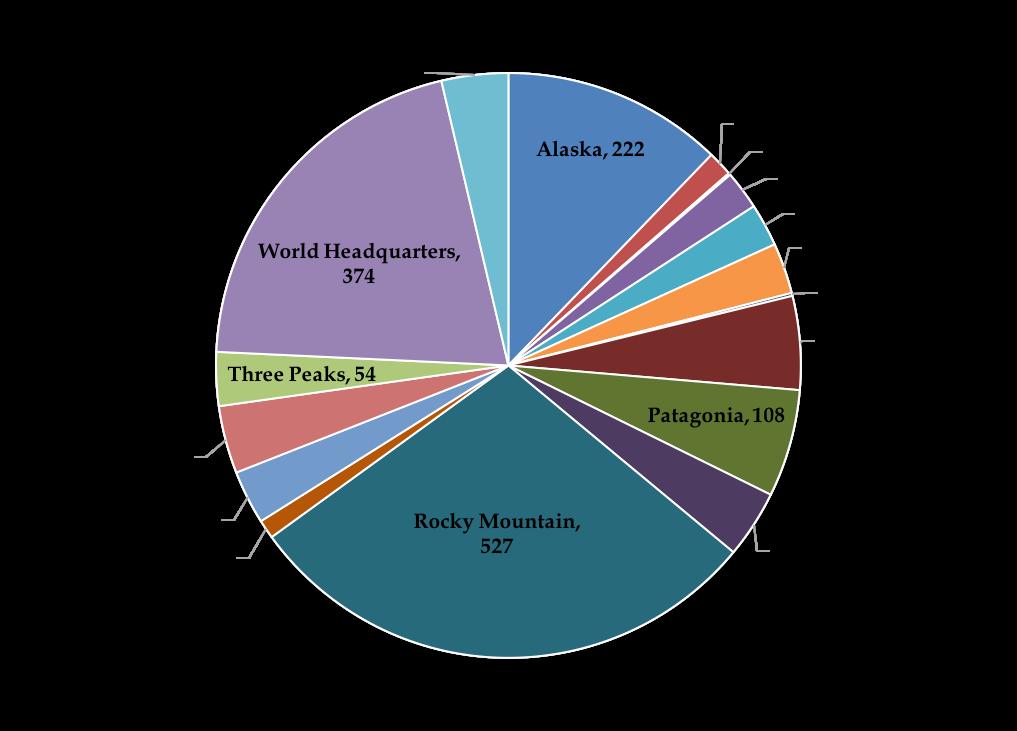
TheFY 2015 carbon footprint graph to theright and theemission trend graphson page3represent the absolute values of our schoolwide footprint When we assessthe data, we see that more than half of our carbon emissionscomefrom travel and nearly athirdfrom electricity use.
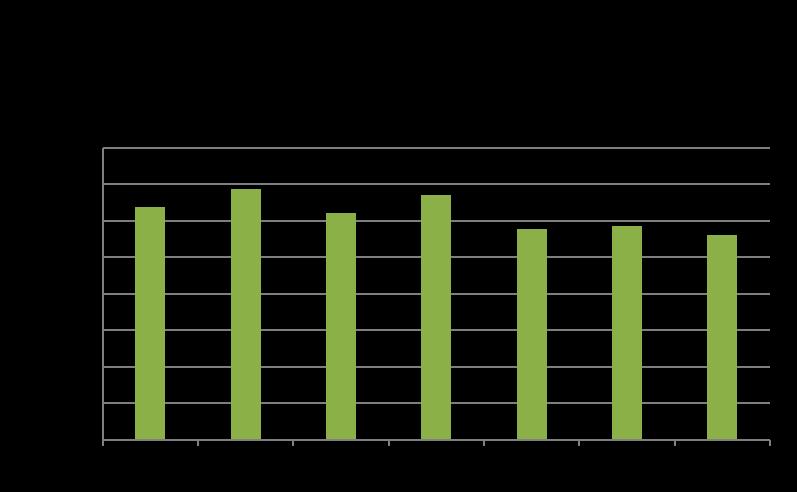
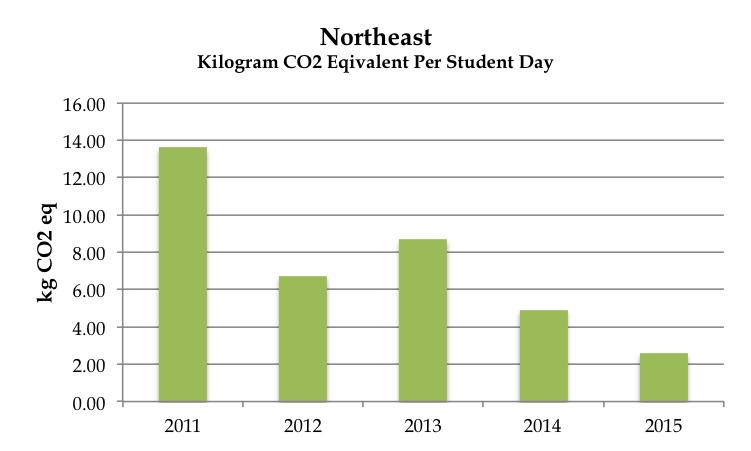
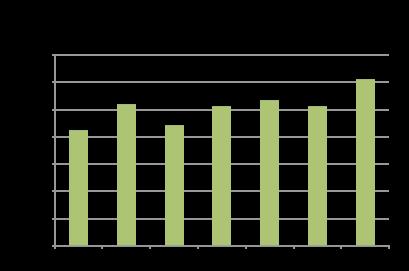
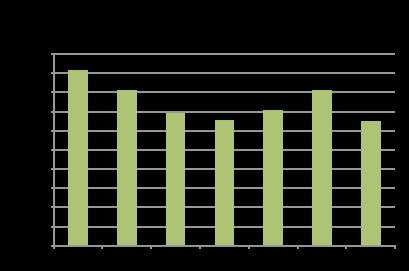
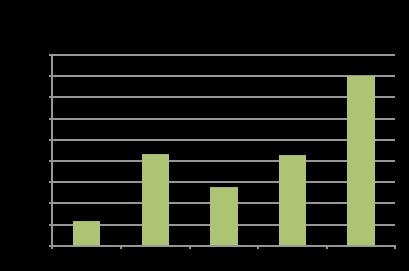
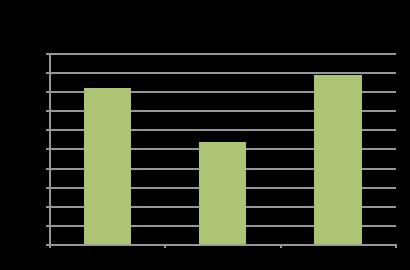
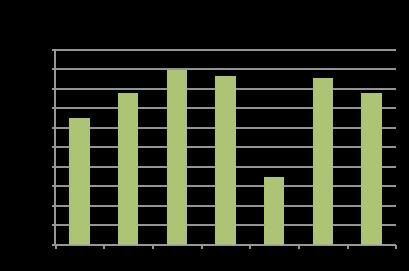
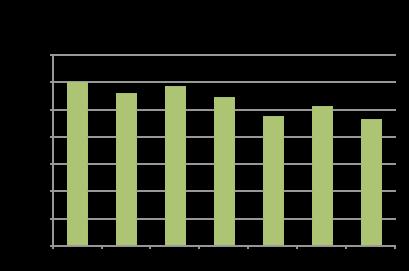
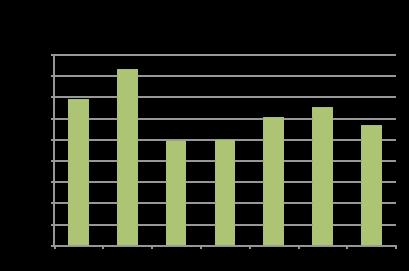
Normalized carbon reporting showshow much carbon is used per student day*. Thismethod better illustrates"carbon intensity."Measuringcarbon intensity may beparticularly useful if the school growssignificantly in ashort period of time.
The chart below showsthat the amount of carbon emitted per student day hasfluctuated over the past years. Fiscal year 2015 shows a slight increase from the previous year, however still followsagenerally downwardtrend sinceFY 2010.
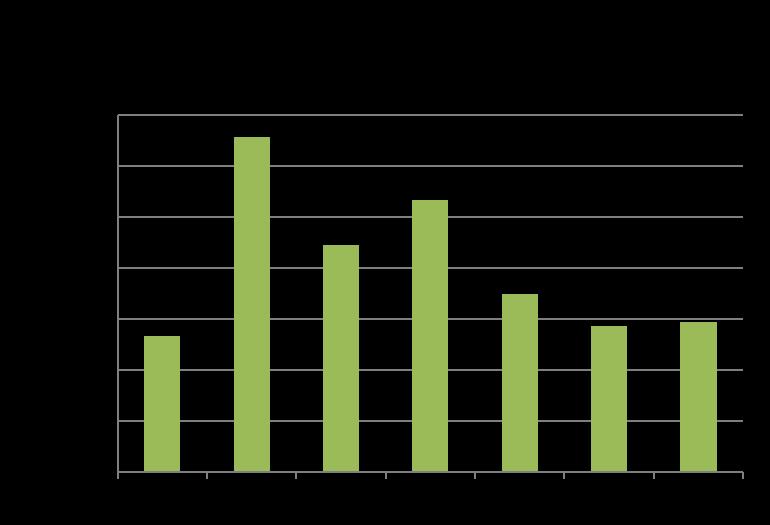
*Student daysarederivedfrom field andclassroom dayshosted by NOLScampuses.


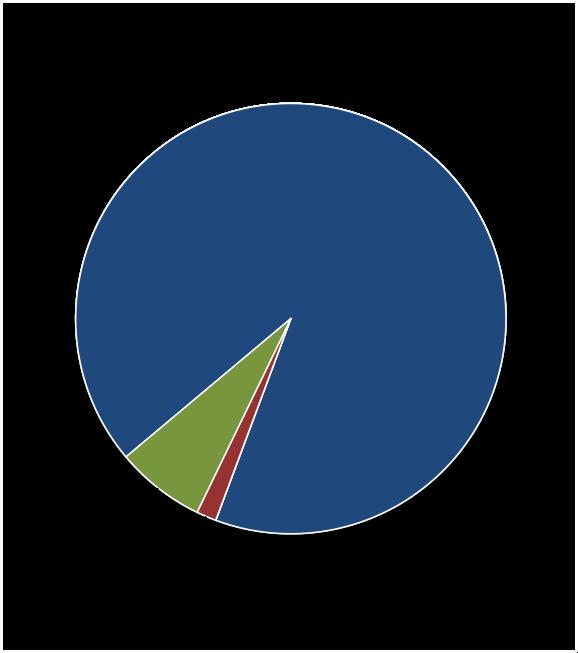
=Total power used from grid and solar combined
=Total solar power produced at facility
=Amount of solar power used at facility
=Amount of solar power returned to grid
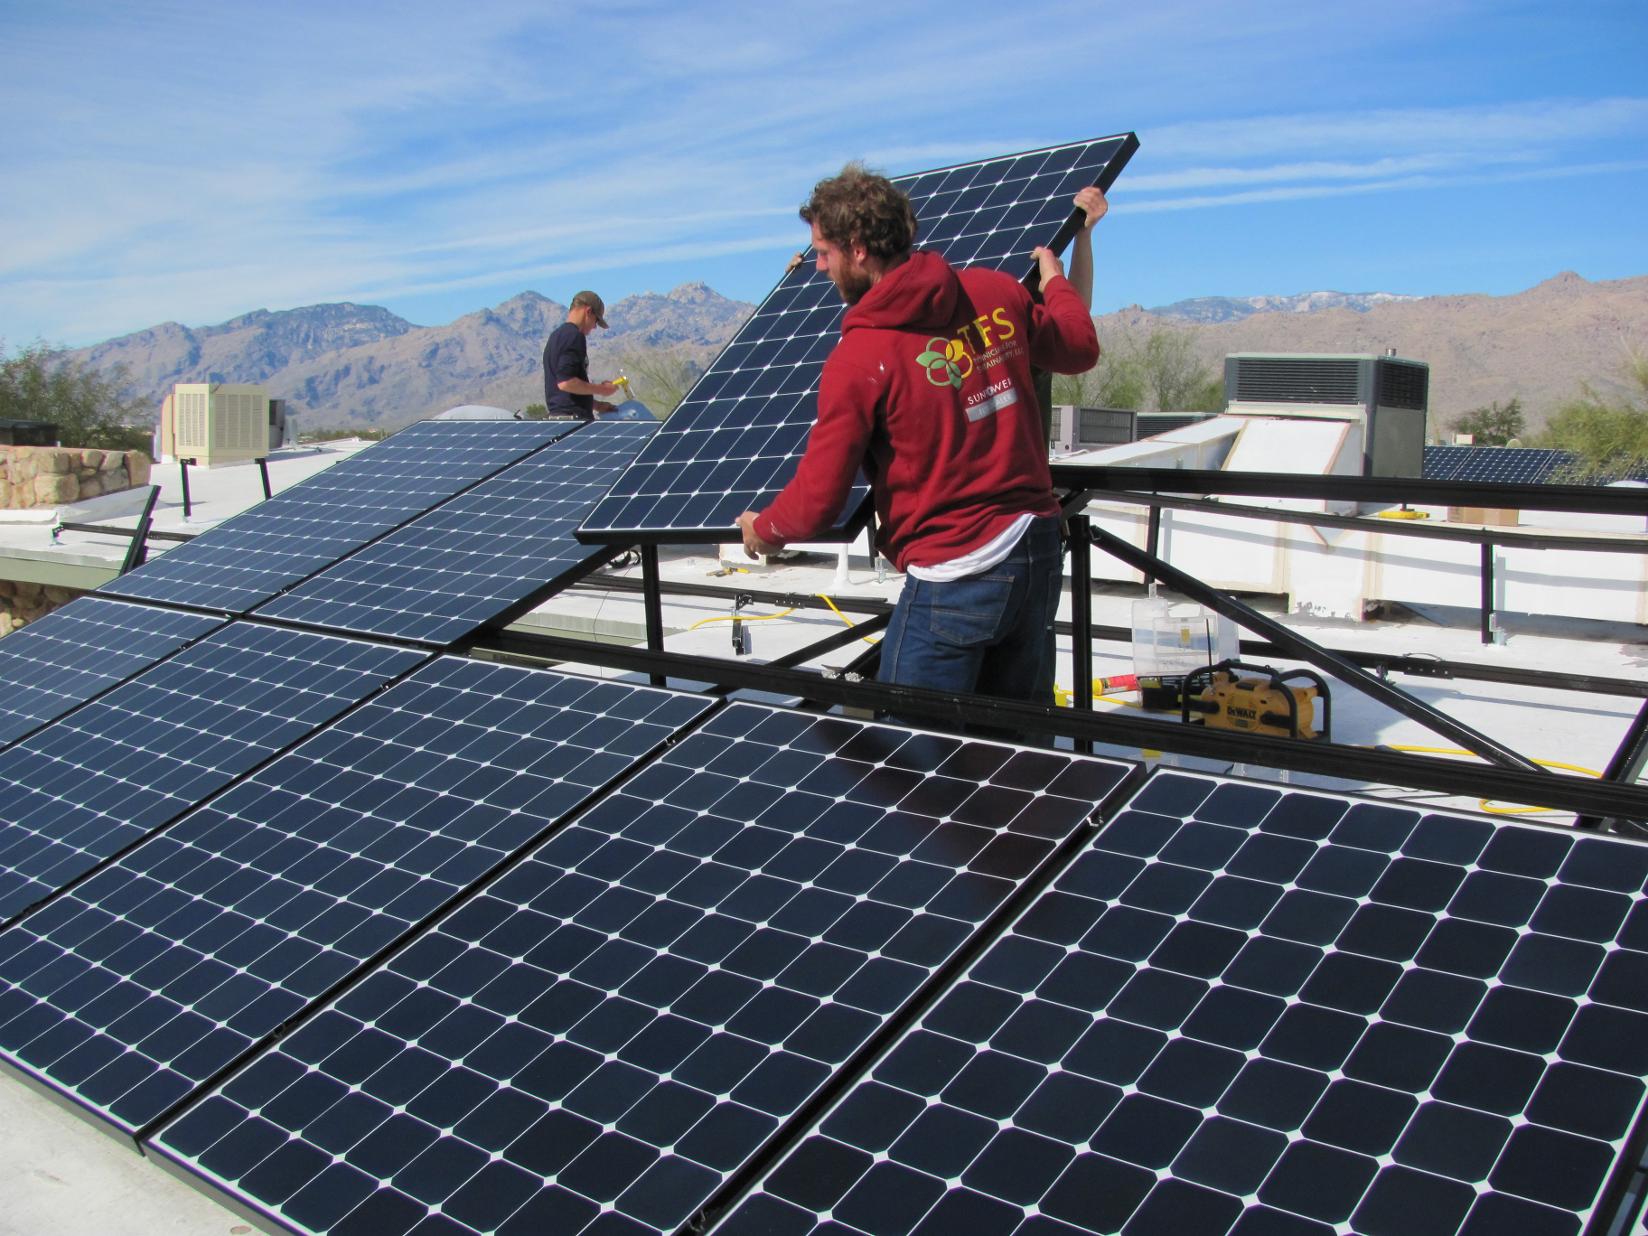
The initial phase of achieving our conservation and reduction goals called for locations to explore alternative energy options. Asof the date of publication for thisreport, NOLS hasinstalled photo-voltaic solar arrays at nine locations. The following graphs describe solar production at seven of these locations during FY 2015. Not displayed hereareAustraliaand Mexico which aremostly powered by solar (seecorrespondinglocation pagesfor moreinformation).
You will noticethat at times, even when thesolar panelsarefeeding power back to the grid, that there is still unmet power consumption at the facility. This is because we are taking into consideration theentire power consumption of all the buildings on site and not only the power reading on the meter with the solar panels. Nighttimeelectricity use and current wiringof thecampusalso contribute to imbalances.
Thisyear we refined our accountingmethodsfor solar energy. NOLSsolar power projectsfunded through Rocky Mountain Power grantscan only claim ownership of renewable energy credits(RECs)? or the associated environmental benefitsof renewable energy? proportional to the amount that NOLS funds the project. Therefore, NOLSowns20 percent of RECsat World Headquarters, 26 percent at theRocky Mountain, and 45 percent at theNoble. Thisstipulation reducesthe amount of emissionsreduction we can claim, but still lessensour relianceon fossil fuels.
On-site renewable energy expansion faces some constraints. Grants have becomescarcer and more competitive, and stateslike Wyoming set low caps on the size of array that an entity may connect to the grid. The Pacific Northwest and Rocky Mountain campusesare currently purchasing green power through their respective utility companies, a great way to support renewableenergy development and offset our emissionsat thesametime
Optionsto reduceour carbon footprint includepurchasingRECswhich are alessexpensivealternativein unregulated carbon marketslike Wyoming. A large-scale option would be to invest in alternative energy through a small-scalePower Purchasing Agreement. Thiswould entail NOLSsigning amulti-year agreement with an alternativeenergy seller who would develop additional alternative energy infrastructure. A feasibility study is currently underway to further explorethisoption.
=Total power used from grid and solar combined
=Total solar power produced at facility
=Amount of solar power used at facility
=Amount ofsolar power returned to grid
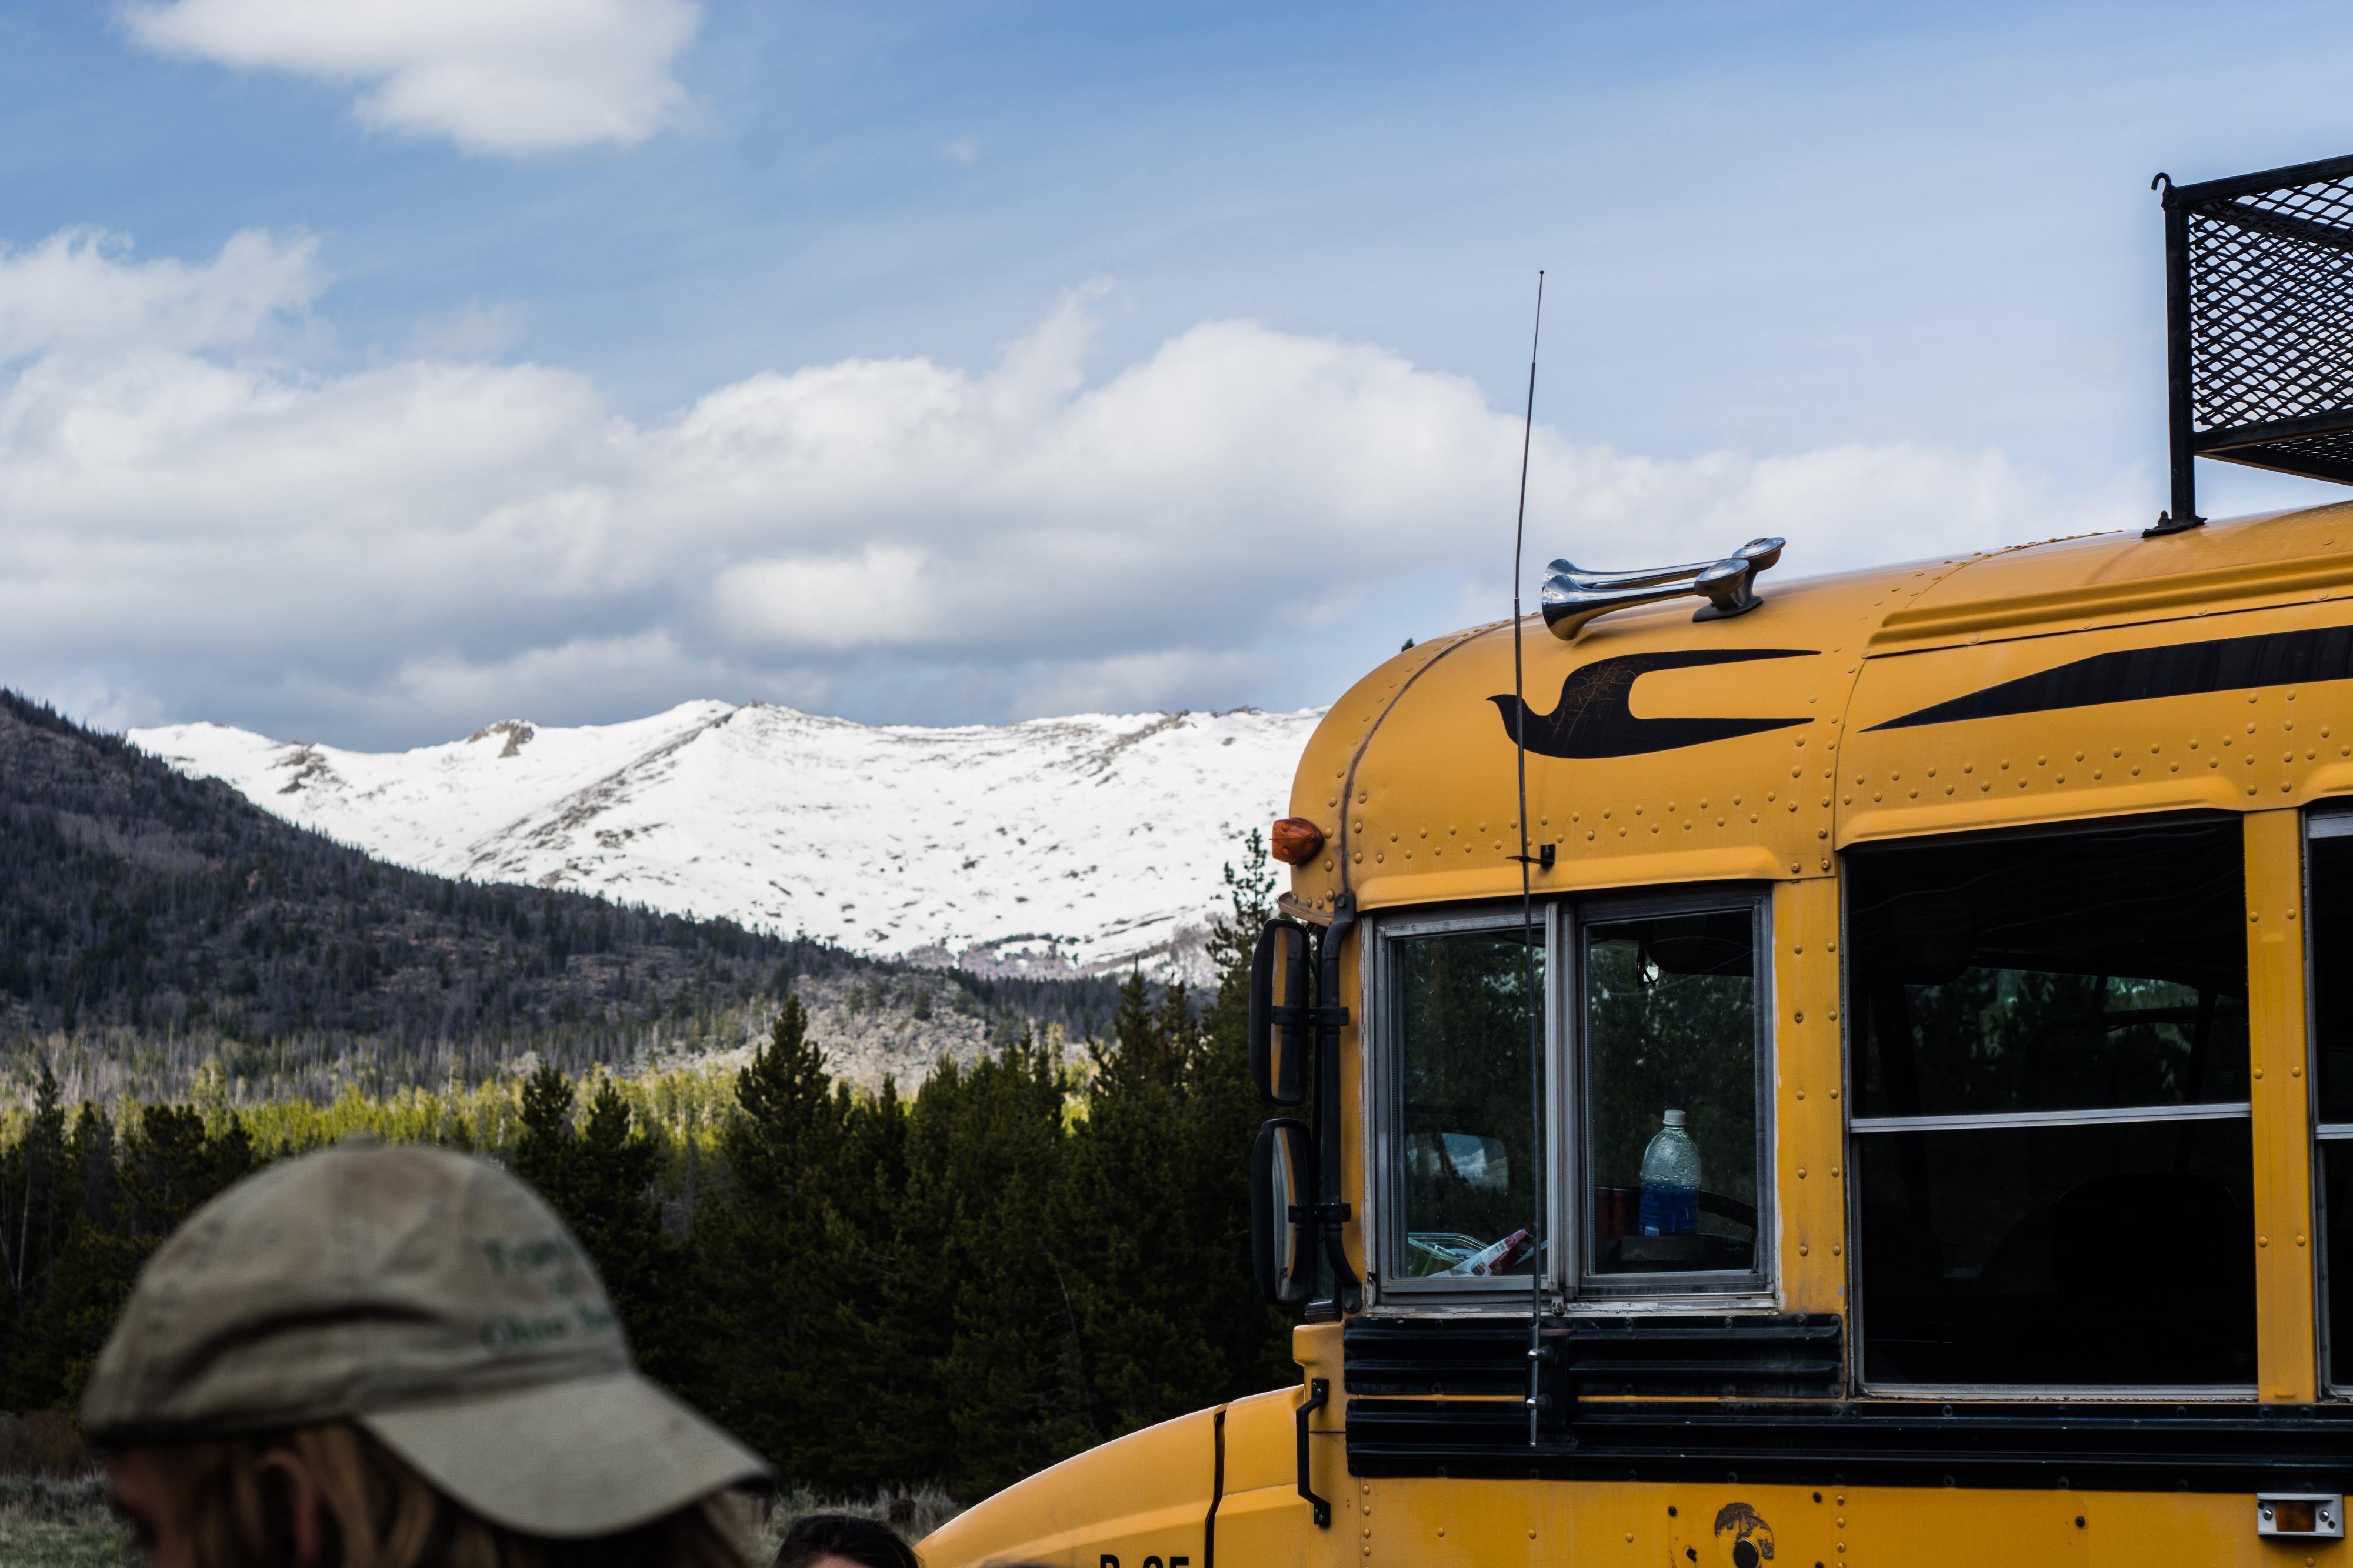
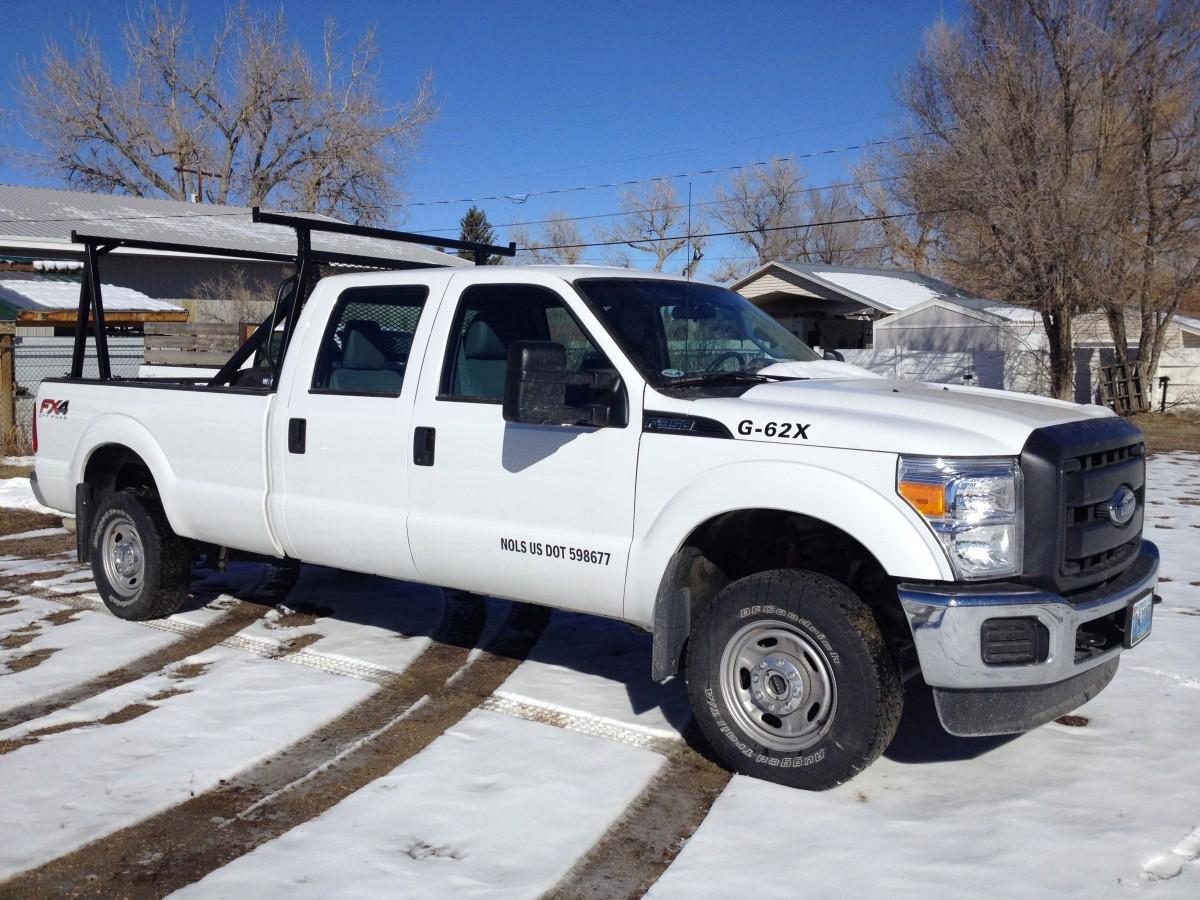
As safety standardshave improved for 15-passenger vans, NOLS hasbeen able to reincorporate them into our fleet? as opposed to 12-passenger vans, which have been the primary large-capacity vehicle (excepting buses) through FY 2015. There isgreat potential to reduceour carbon footprint with thisdevelopment. Reinstating 15-passenger vans ensures that we can accommodate more students and, when combined with the capability of hauling atrailer, we will be ableto transport some courses with one vehicle instead of two. This transition will take place as opportunitiesfor replacingvehiclesarise.
Fiscal year 2015 marked the first test run for the new Compressed Natural Gas (CNG) full-sized truck at our River Base location in Vernal, UT. According to the U.S. Energy Information Administration, natural gasemitsabout onequarter of the CO2 emissions that gasoline emits (U.S. Energy Information Administration, 2015). We hope to be realizing those reductions in the coming years and look towards increased availability of this fuel in other locations. Feedback from the primary driver of this vehicle is that the duel fuel compatibility of the vehicle, running on both gasoline and natural gas, is a plus. The one noticeabledownside was the decreased hauling power while pulling a full raft trailer. CNG within the NOLSfleet may bemorevaluablefor transit purposes.
Two locations are currently experimenting with bio-diesel: NOLS Pacific Northwest and NOLSSouthwest. ThePacific Northwest tractor occasionally runs on a B20 blend (containing 20 percent bio-diesel) and the Southwest busfills up with either aB5 or B10 blend, depending on the fillingstation. Both locationsface thechallengeof sourcing from adependable supplier of bio-diesel asthe availability of thefuel constantly fluctuates. Expanded use of bio-diesel isuncertain dueto lack of infrastructure where we operate. The Environmental Stewardship & Sustainability department of NOLS will update on the performances of these vehiclesasthey get moreuse thiscomingseason.
Thispast January we revived the sustainability transportation committee to share fleet status between locations. Three locations participated including the Rocky Mountain, Pacific Northwest, and Teton Valley. The ability to collaborate on the needs of each location and to sharevisions for agreener fleet were some of the reported benefits of the gathering. Sustainability also contributed to the conversation by providing data on fuel usage and emission trends. The sustainability program is looking to make this meeting an annual occurrence.

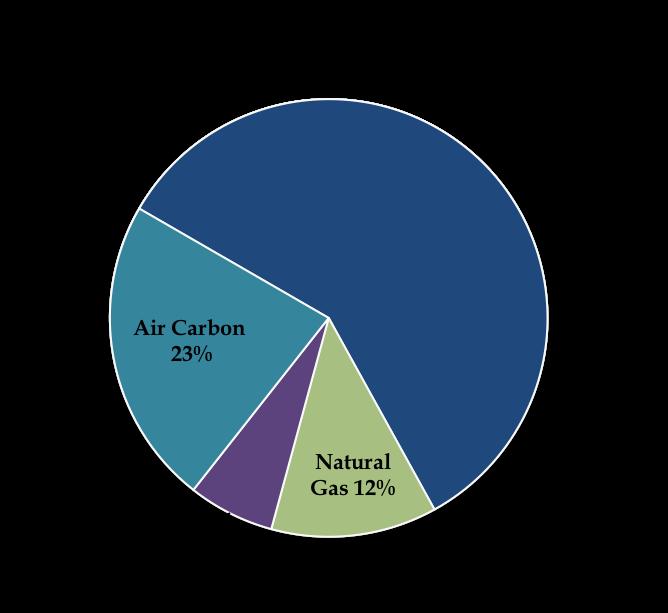
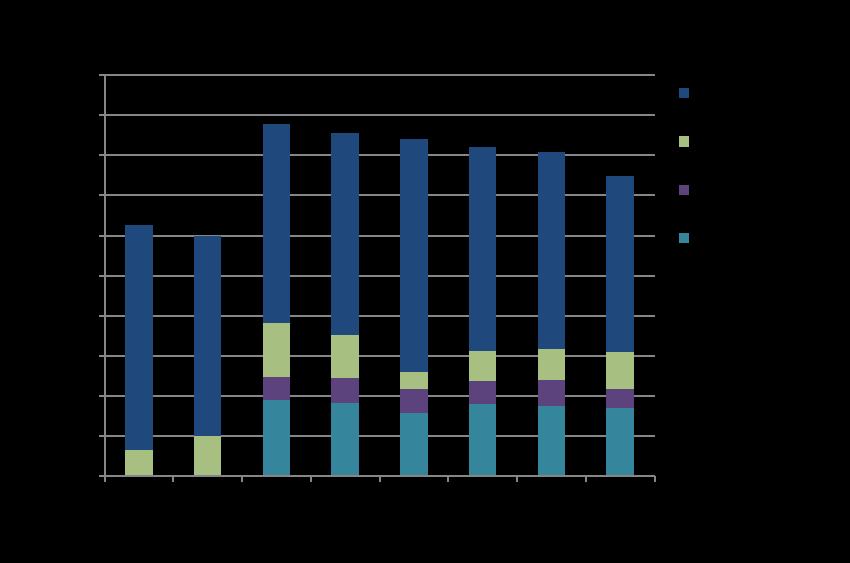
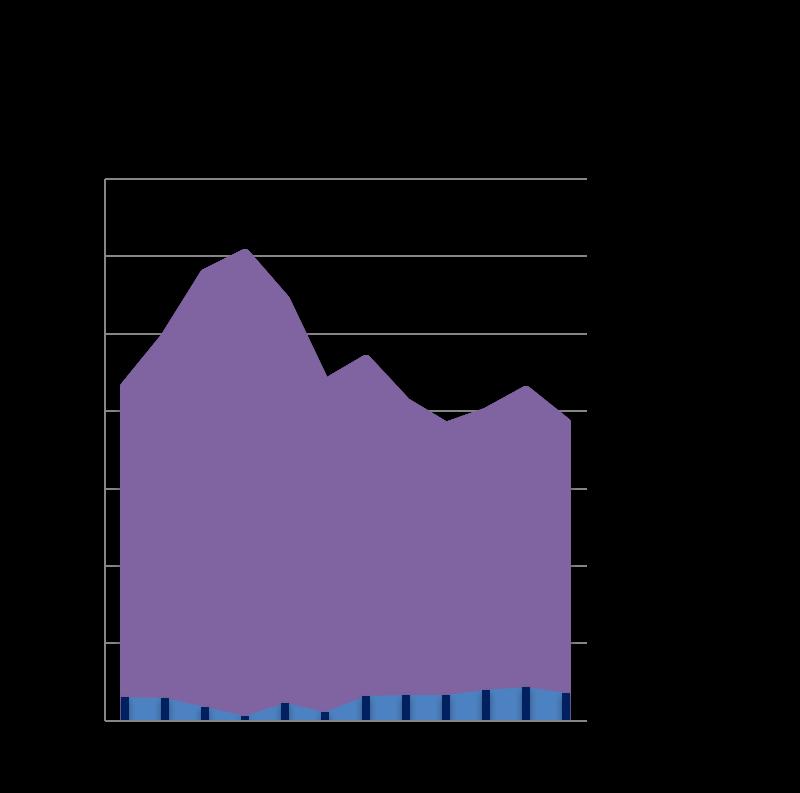
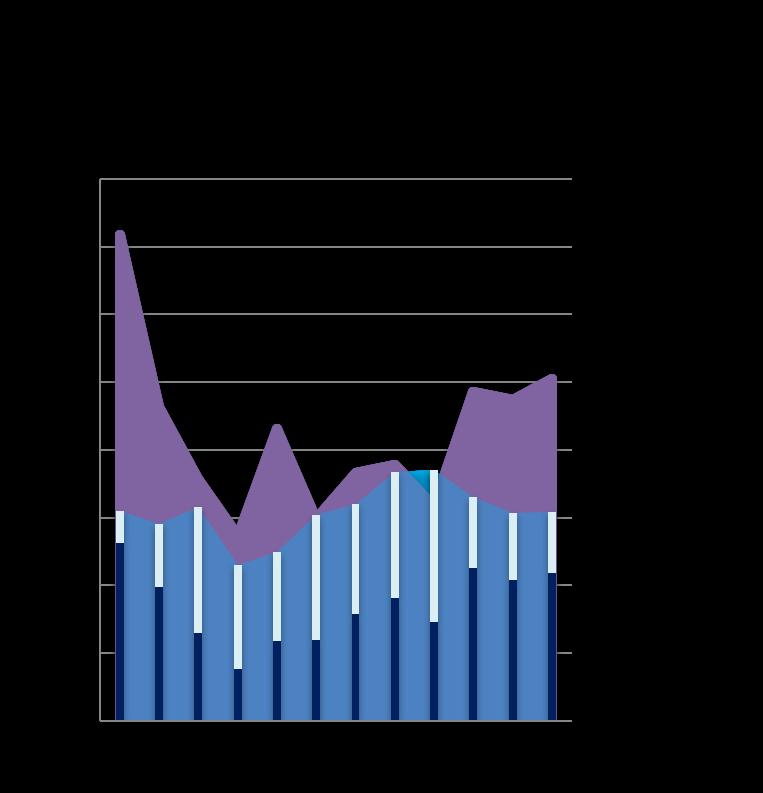
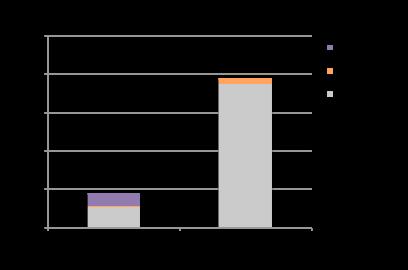
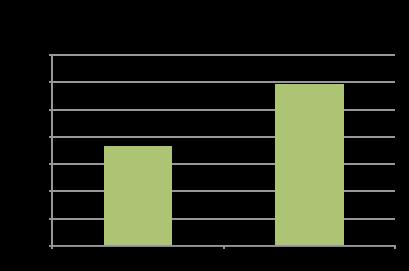
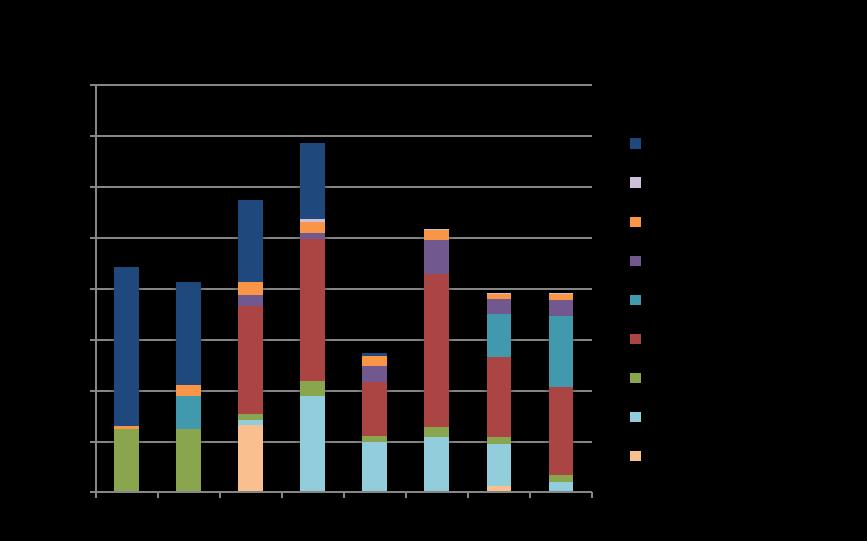
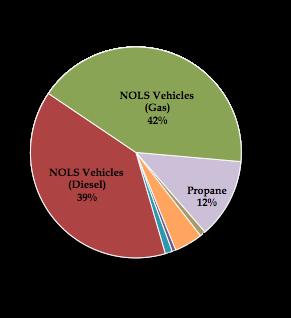
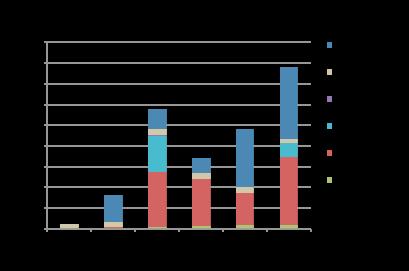
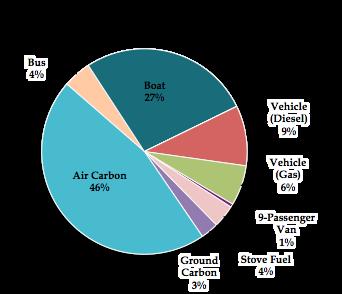
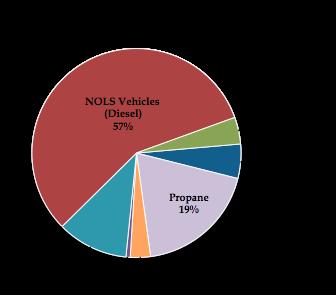
With no surprise, our World Headquartersmaintainsone of the largest carbon footprintsat NOLS. Staff here are more likely to fly for business and the building itself has many structural energy inefficiencies. Together, air carbon and electricity makeup thelargest componentsof theWorld Headquartersfootprint.
We began internally tracking air travel in FY 2010, accounting for the jump in emissions that year. In FY 2015 we experienced our lowest record of electricity consumption and second lowest of air carbon. A major priority going forward will be focusing on energy efficiency improvements, such as continuing the transition to LED lights.
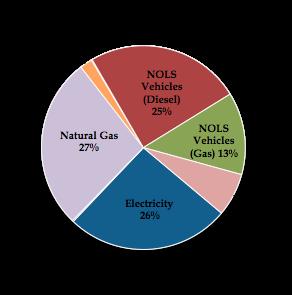
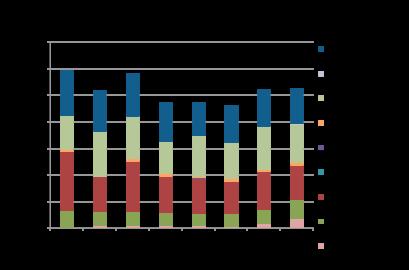
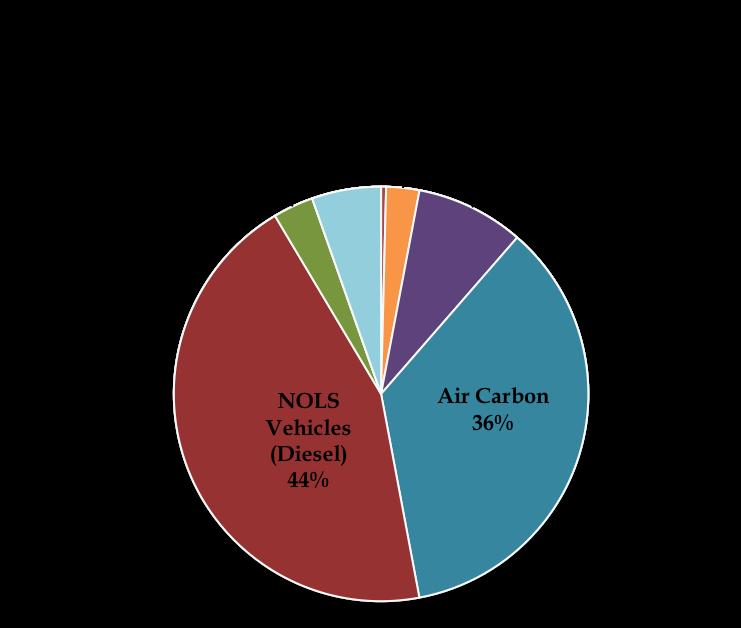
Rocky Mountain hereincludestheNoble Hotel and theRocky Mountain facility in Lander. Sincethebuildingson thiscampusarelarge and sectionsof them quite old, it isnatural that the gasand electricity componentsconstituteover half of the overall emissions. Vehicletransportation from both NOLSvehiclesand outsourced re-rations, accountsfor nearly the rest of the Rocky Mountain footprint with 43 percent of theemissions. Neither air carbon nor ground carbon arevisible on these graphssincetheamountsaretoo small to register.
Carbon intensity iscalculated alittle differently for Rocky Mountain. Sincemuch of the re-rations support for Rocky Mountain'sbackpacking coursescomes from Three Peaks horse packers, and several course sections for Rocky Mountain's semester coursestakeplacerafting at theRiver Base, we'vecombined theemissions and student days for all three locations. Even with this larger footprint, Rocky Mountain fairswell when compared to carbon intensitiesofother NOLSlocations.
ThreePeakshas auniquefootprint in that many of itsemissionsareassociated with re-rationing Rocky Mountain courses and not solely from Three Peaks horse packing courses. Operationsat ThreePeaksrely heavily on diesel trucksfor hauling horse trailers, carrying out ranch chores, and transporting studentsto and from the field. Diesel usesurged in FY 2012 dueto anew larger F550 truck used for haulinga ten horse capacity trailer We plan to sell this truck and the trailer in FY 2016 because of the unforeseen need for our drivers to obtain a CDL license when hauling long trailers. Oncewe downsizeto an eight horsecapacity trailer therewill no longer beaneed for such aheavy duty truck.
Since the operations of the Three Peaks and Rocky Mountain locations are so tightly intertwined, acarbon intensity by student day measurement by itself would be misleading. Therefore, ThreePeak'sstudent daysand carbon emissionshavebeen included into theRocky Mountain carbon intensity graph on page9.
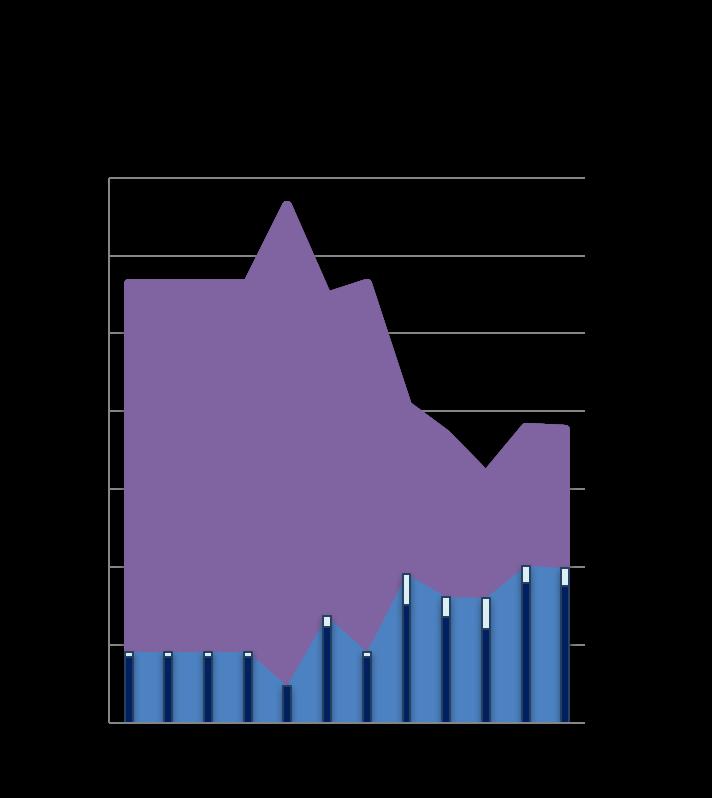
NOLS vehicle travel makes up over 60 percent of the River Base's carbon emissionsin FY 2015, the majority of that coming from diesel. This past year marked thefirst year of use for theCompressed Natural Gas(CNG) truck at the River Base. With CO2 emissionsestimated to be about 25 percent lower than gas vehicles, thistruck iswelcomed into thefleet.
Fiscal year 2014 marked the lowest carbon emissionsfor the River Base due to reduced consumption levelsin almost every category. A major renovation of the main bay startedin FY 2015 and will becompleted in FY 2016. Thisrenovation's main purpose is to improve operational efficiency, but there are some energy efficiency improvements such asupgrading to LED light bulbs and more energy efficient appliancesin thekitchen.
Many sections of Rocky Mountain courses are run by the River Base. Since resourcesand student days are regularly shared between thetwo locations, we've combined both of their carbon intensity measures into the Rocky Mountain graph located on page9.
Fiscal Years
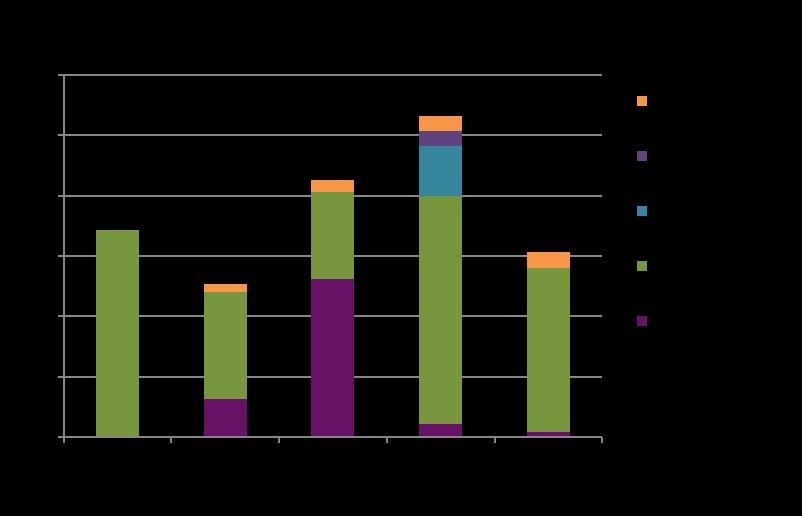
The Northeast'slargest emissionssource isthrough NOLS gasvehicles. Before we purchased aNOLSvehicleto be permanently stationed at theNortheast location in FY 2014, werelied heavily on theprivate shuttlingservicesof Paul Smith'sCollege where our campuswas located. Some of the annual gas use is from driving cross country from Wyoming to New York in a borrowed NOLS Rocky Mountain vehicleto transport staff and suppliesat thebeginningand end of each season.
Starting in 2016 with a change in campus location, the Northeast will begin tracking emissionsassociated with utilities. Thiswill raisethecarbon footprint we account for, but in theend, will better reflect our resourceuse.


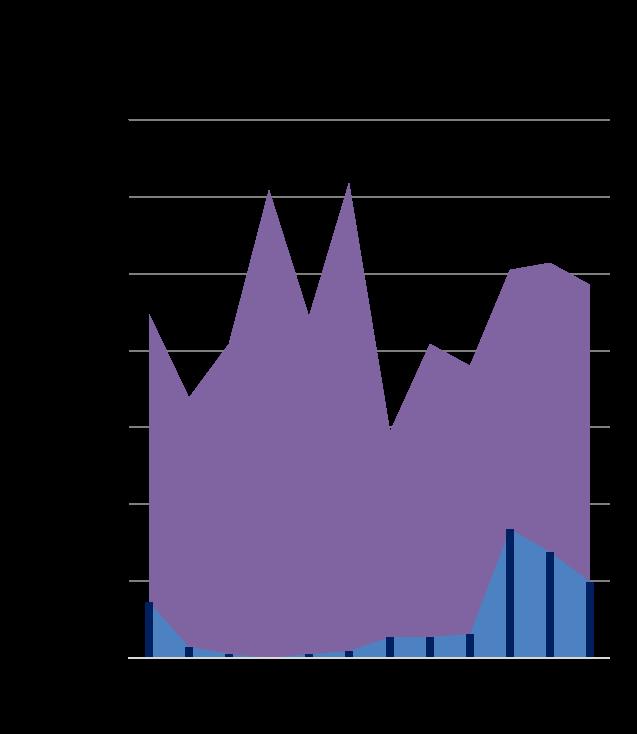
East Africahasthesmallest carbon footprint out ofany location becauseof its size. In FY 2014, theland cruiser usewaslessdueto not runningthefall semester course. Transportation islikely to continueto be thelargest emission sourceaslongaswedo not account for electricity consumption at our rented facility.
Between FY 2014 andFY 2015thecarbon intensity (CO2eq/student day) of operationsincreased. An increasein student enrollment translated into an increased need of transportation to get studentsinto thefield.
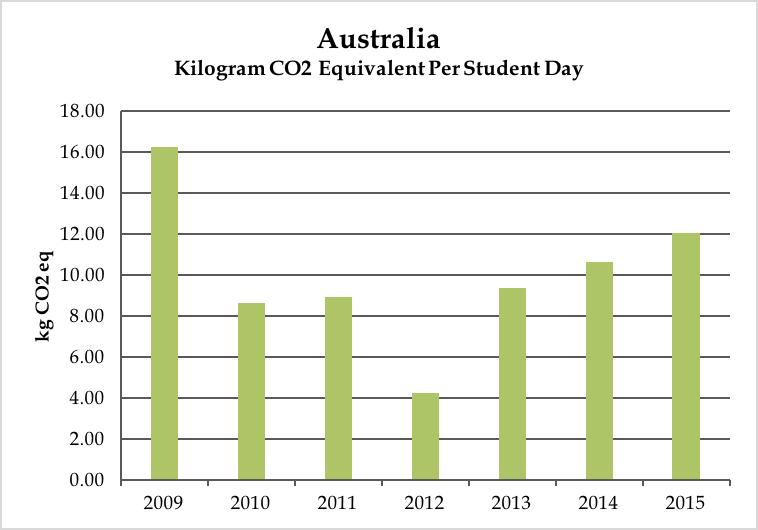
Since the installment of solar panels at Australia in FY 2011, every year thereafter has resulted in substantially reduced electricity. Now we have built up enough on-site solar generation that, through net metering, we are meeting our electricity demand.
Year-to-year diesel and course air travel fluctuations have a unique story in Australia. During a wet season, the sandy terrain of northwest Australia is too flooded to travel via ground so coursesmust travel by plane to thecourse drop-off site. When theroadsarepassableduringthedry season thecoursescan useaNOLS vehiclefor drop-offs .
Student daysin FY 2012 did not go down dramatically yet wesee ahugereduction in emissions. The cause of this is two fold. As mentioned above, our electricity footprint became non-existent plus both air travel and NOLS vehicle diesel saw dramatic reductions.
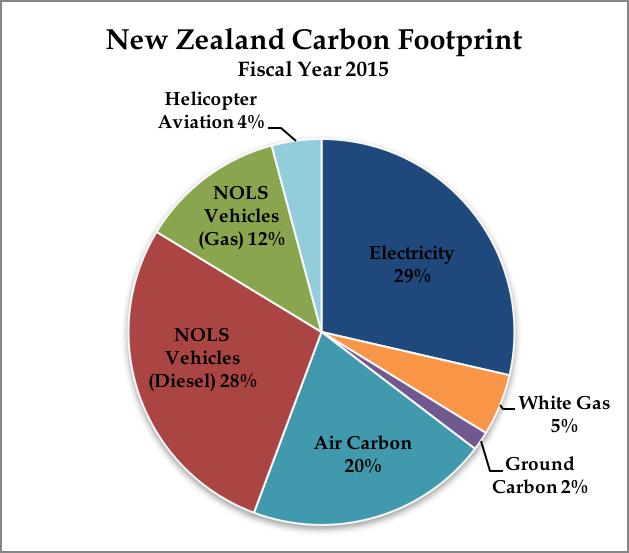
In FY 2012 we changed locations within New Zealand from Christchurch to outsideof Nelson. Webought the property and thefollowingyear constructed a majority of the buildings on-site. With the new buildings up and running, stationarysourcesof emissions(i.e. electricity) increased only slightly.
(Incomprehensive2006student data.)
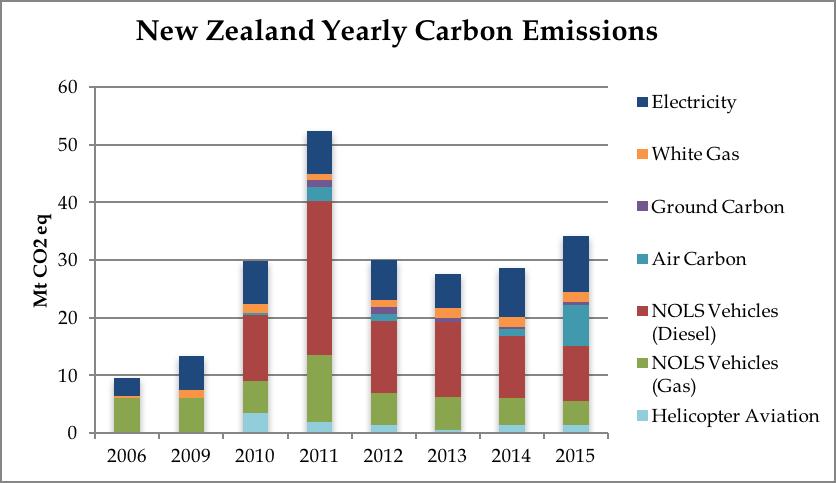
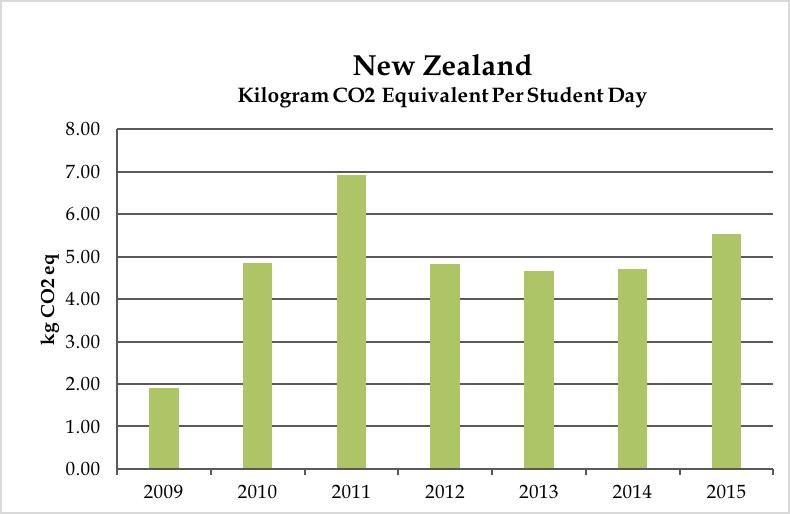
Fiscal year 2011 experienced a peak in student day numbers due to an additional semester which corresponds to the peak in emissionsthat year. We see in the student day carbon intensity graph that thetrend almost perfectly matchesthat of the carbon footprint graph. This indicates a strong relationship between the number of student daysand thecarbon emissionsgenerated to run those courses in New Zealand. AirCarbon=intownstaffairtravel
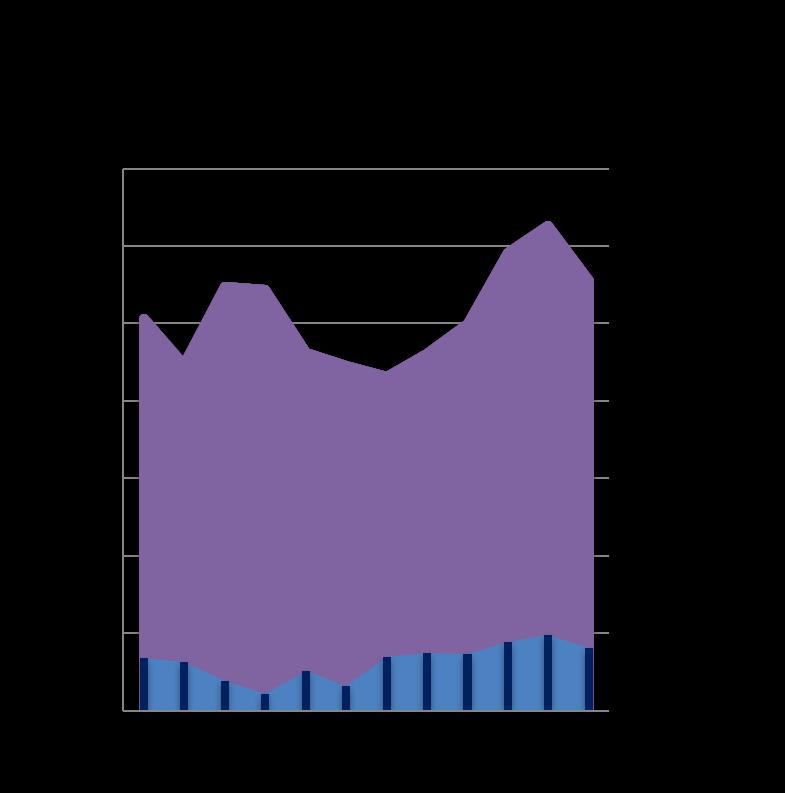
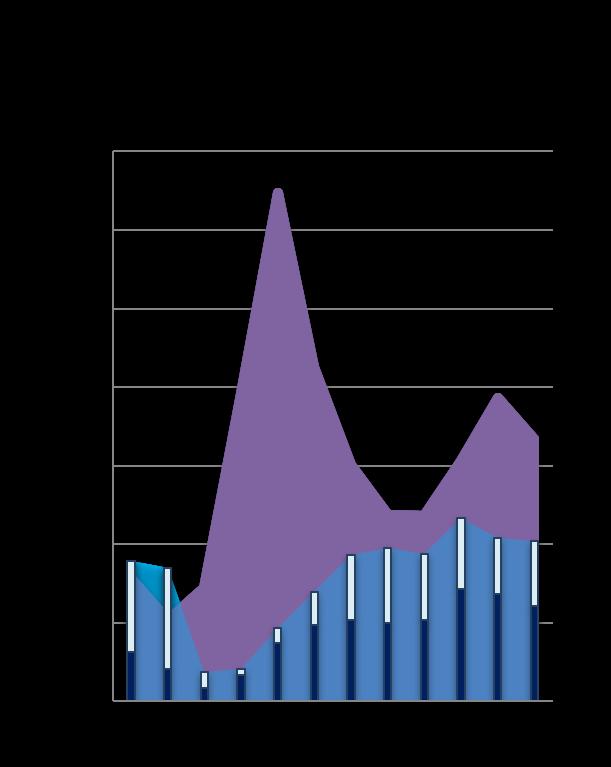
In Alaska, coursetravel accountsfor over half of total emissions. If weadd intown staff travel (air and ground carbon), transportation accounts for a little over 70 percent oftotal emissions.
Fiscal year 2015's emissions leapt up considerably, departing from the slow upward trend of emissions since FY 2009. All emission sources increased in FY 2015 besides natural gas. Air carbon for intown staff travel and propane use contributed most significantly to this increase. Better compliance with intown staff travel reportingisthecausefor theadditional air carbon.
(Incomprehensive2006 student data.) Fiscal Years
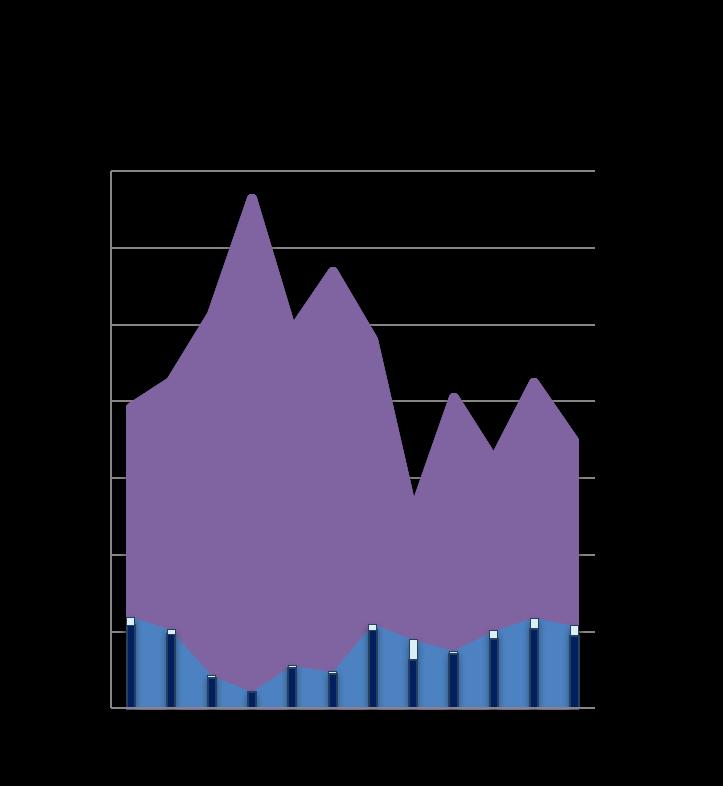
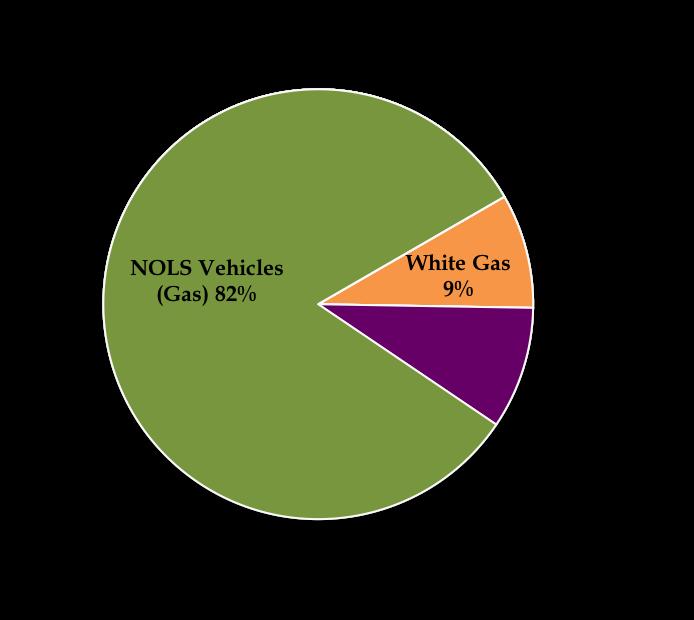
Mexico has a vehicle dominant carbon footprint, but is incredibly efficient on facility use. In FY 2015, NOLS vehicle gas and diesel use accounted for 81 percent of the Mexico carbon footprint. If we look at that vehicle use since FY 2009, diesel has been on a downward trend. In fact, almost every emission source decreaseseach year. Oneof Mexico'sstrongsuits, which hasgrown out of necessity, isitspower independencewith electricsolar panels.
The carbon intensity of Mexico'soperations(CO2eq/student day) islower than it wasin FY 2009 with slight increasesin FY 2013 and FY 2014. Fiscal year 2014 differsfrom other yearsin that weran shorter courses.
AirCarbon=intownstaffairtravel
GroundCarbon=intownstaff
Years
(Incomprehensive2006 student data)
In FY 2015, NOLS Pacific Northwest started accounting in Carbon Tracker for green power purchasesit had been purchasing through thepower company. This monthly purchase of 3,200kWh in renewable energy greatly reduces our footprint and helpsfund thedevelopment of regional renewable energy projects in theNorthwest.
With theexception of the FY 2006 footprint, yearly carbon emission totalshave hovered around 100 metric tons of CO2 equivalent and the carbon intensity (CO2eq/student day) of operations hassteadily decreased since FY 2009. Pacific Northwest hasbeen ableto takeon morestudentswhilemaintaining or lowering overall emissions. We seeareduction in carbon intensity during FY 2015 due to increased student day numbers.
Indiahas seen a substantial increase in electricity these past couple of years. Thisisdue to theinclusion of theoperationsoffice, instructor quarters, and main office electricity sources in FY 2014. Since we rent this facility, it is moredifficult to justify large energy efficiency improvementsto reducethese emissions.
During FY 2015 we saw a decline in the number of courses run yet an increase in overall diesel use. This is because diesel use increased from intown staff using NOLSvehiclesfor travel. Course-related diesel followed student day trendsfor FY 2015.
NOLS Scandinaviawas established in FY 2008 in Norway. However, it wasnot until after our relocation to Sweden in FY 2013 that westarted to track our carbon footprint.
All but four percent of Scandinavia'scarbon emissionscomefrom transportation sources. Air carbon makes up the largest portion of the Scandinavia footprint due to travel by seasonal staff to theScandinaviacampusfrom other NOLS locationsand to theUnited States. All of thevehiclesused by thecampusare either rented or public transportation. NOLS Scandinavia courses can occasionally take advantage of public transportation, such as buses, ferries, and trains, to transport courses. Some backpacking courses can even set out on foot straight from campus.
There are also emissions associated with power consumption, but since utilities are included in therental priceof thebuilding andtheproperty isshared with other users, it would bedifficult to parseout thispart of thefootprint.
NOLS vehicle use is up from the first couple years of reporting, but air carbon (intown staff travel) isdown. Starting the winter of FY 2012, Yukon did abetter job of winterizing thefacility duringtheoff-season which shrank our heating oil use, a very carbon-intensive fuel, to almost zero. Then in FY 2014, with the change of location, heating oil became obsolete and Yukon instead switched to usingwood stovesfor heat. Wedo not currently account for wood burningstoves in our carbon calculations.
The dip in carbon emissionsand carbon intensity during FY 2013 came from a slimming down of operations. That year Yukon offered one lesssemester course and shortenedacoupleof typically longer courses. From FY 2014-FY 2015 more studentsmeant a drop in carbon intensity (CO2eq/student day) with an increase in absolutecarbon emissionsduringthosesameyears.
In Patagonia, the long drives for course drop offs account for the reliance on diesel. Diesel consumption isnot predicted to diminish dueto theenvironmental impactsthat comefrom concentrating too many coursesin onearea. Thereisyet another influence on vehicular travel that addsto theunpredictability of fuel use.
NOLS Patagonia instructors of courses over two weeks can help design their courseroute. Thisisabigperk but alsomay add up to longer drives.
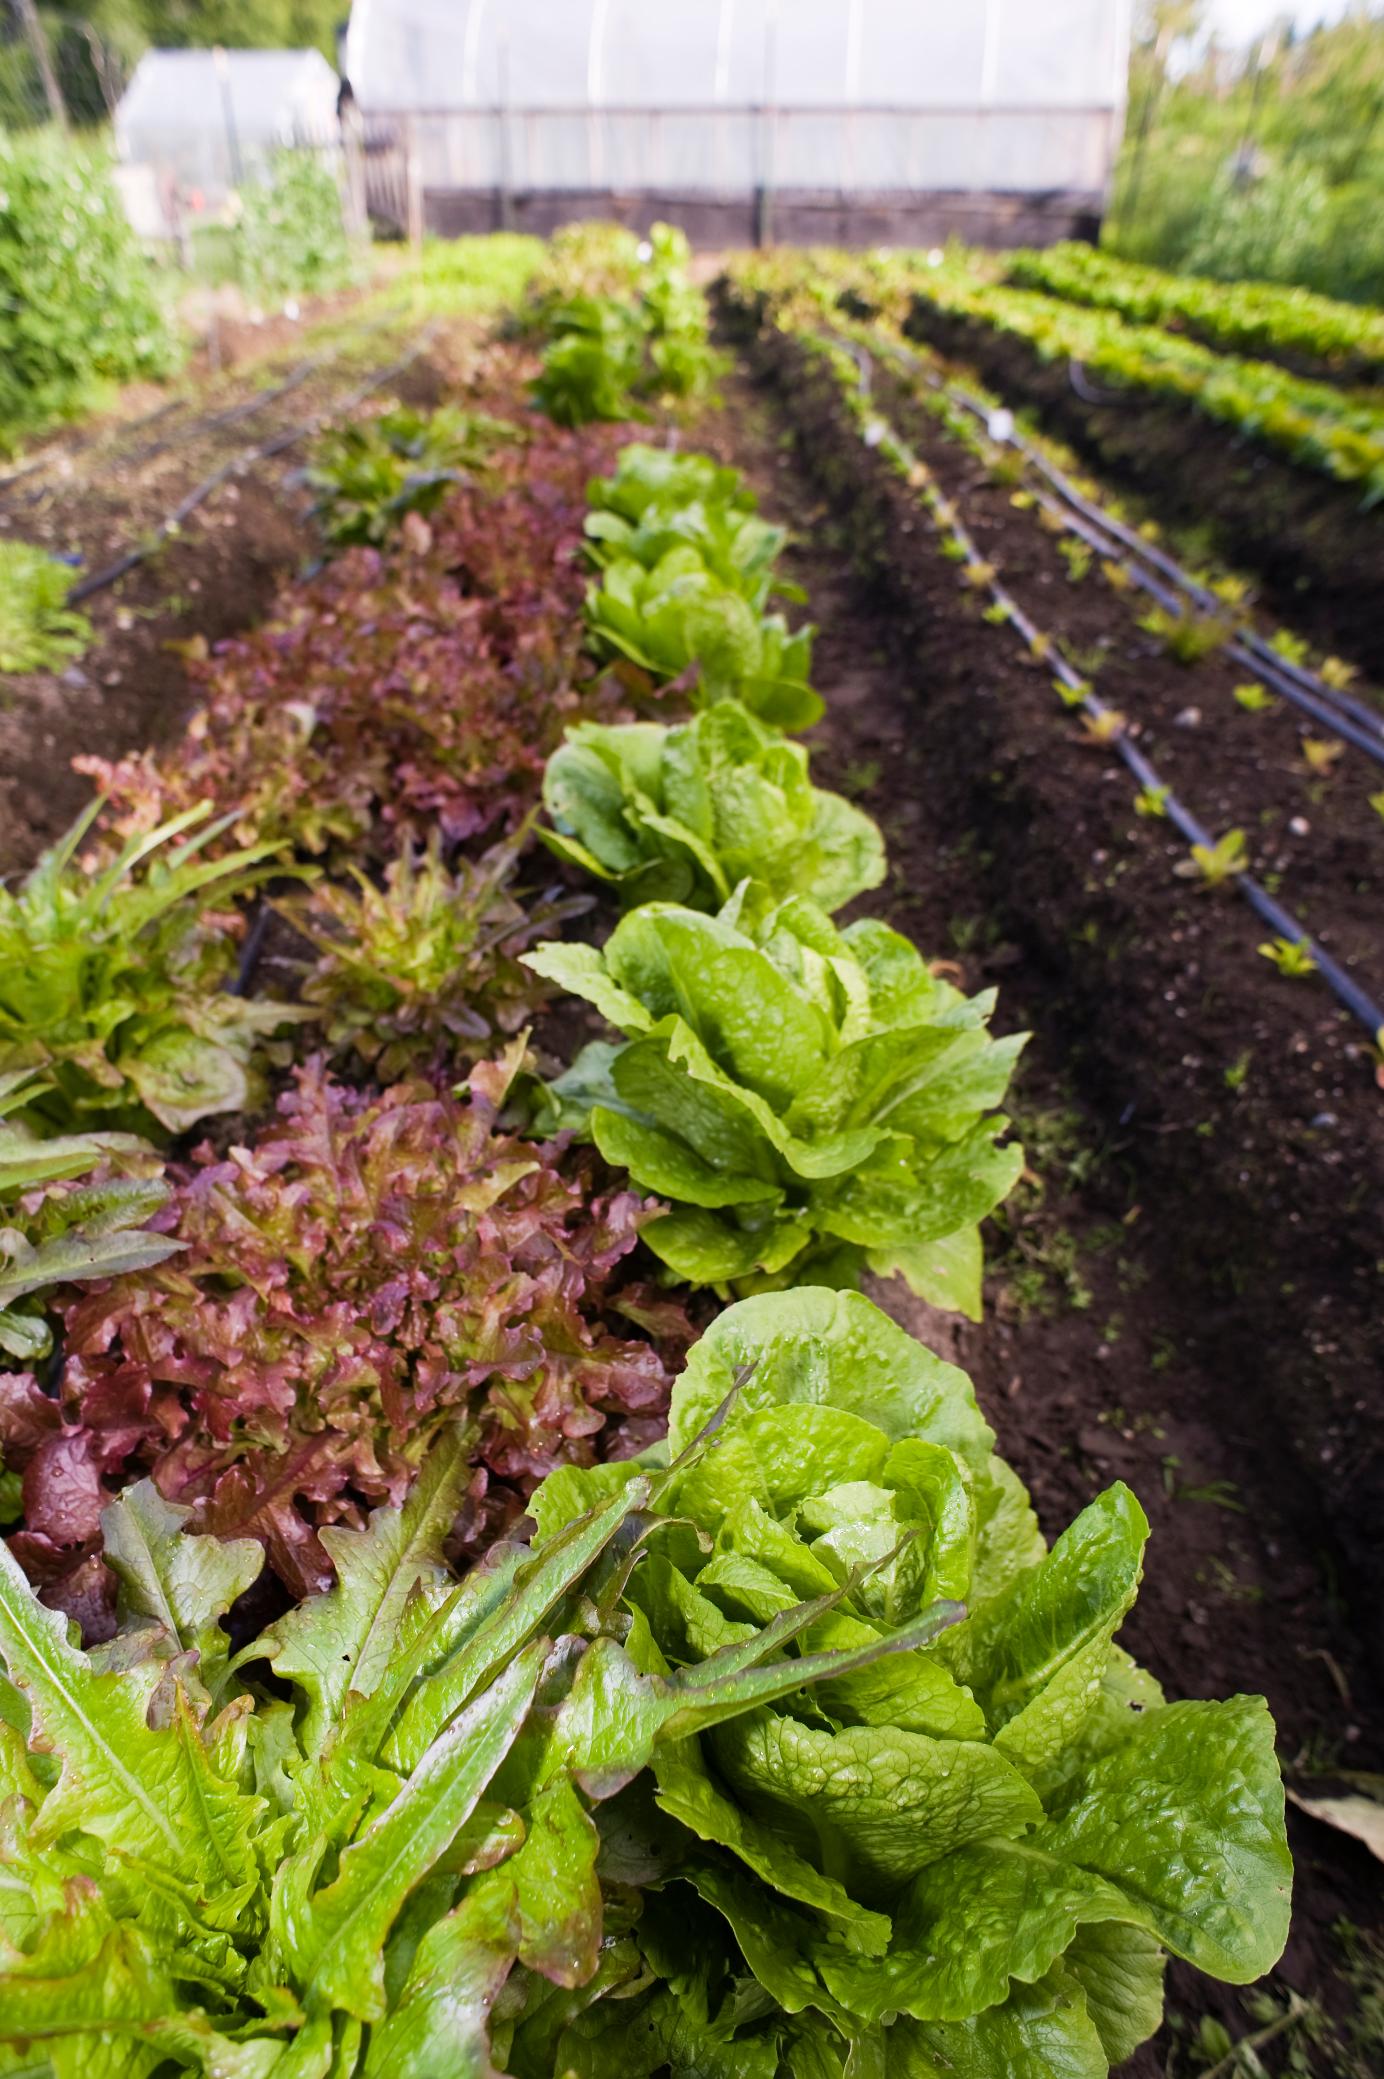
Now that the geothermal system is working in Patagonia, as of FY 2015, the hope isto see a decrease in propane demand for building heating. However, we may not be ableto seeadifference in overall propaneconsumption becauseof the increased number of cooked mealsserved to thestudents. We will have a better ideaof thenew demandsfor propanethiscomingyear.
The most noticeable difference in the Southwest's carbon footprint since FY 2009 is the decrease in emissions associated with electricity. Emissions from electricity have been cut in half from 33 percent of thetotal footprint in FY 2009 to 15 percent of the footprint in FY 2015. Refer to the solar graphs on page6 for moredataon solar.
NOLS Southwest drivers have access to a fueling station in Tucson where alternative fuelssuch asbiofuelsand ethanol areavailable. Thesefuels, ethanol more so than biodiesel, are slowly becoming a part of this fleet's fuel mix. After more experience with these fuels and the possibility of expansion in alternative fueling stations where we operate, Southwest will be ableto serve asavaluableresourceto other NOLSlocations.
AirCarbon=intown staff airtravel
GroundCarbon=intownstaff groundtransportation
*Referto2006 baselineyearexplanation.
Course travel currently accounts for just over 60 percent of total emissions. Starting in FY 2016 weare establishing better systemsto track air and ground carbon entries (intown staff travel) into Carbon Tracker. It ispredicted that theseemissionsamounts will bepretty low.
Teton Valley istheonly location that still usesheatingoil. Heating oil containsabout 14 percent more carbon emissionsthan propane and about 27 percent more carbon emissions than natural gas, making it a relatively inefficient fuel. A new propane furnaceisin theworksto replacetheheatingoil system.
Carbon intensity generally follows the same trend lines as the overall carbon emissions. However, when wecompare yearsFY 2015 and FY 2010, FY 2015 had thesecond highest overall carbon emissionsbehind 2010 yet thecarbon intensity was much lower.

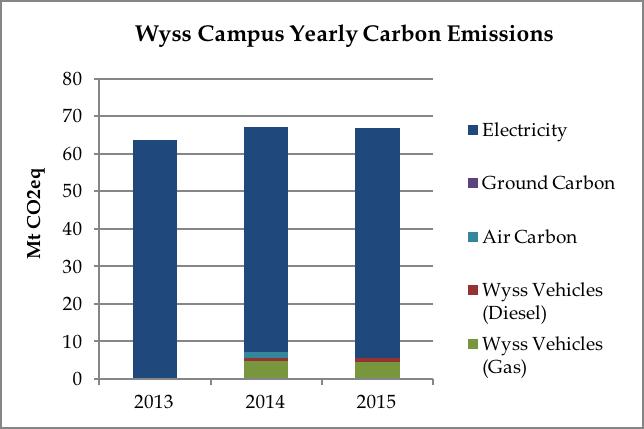
The Wyss campus carbon footprint differs dramatically from the other NOLS locationssince most of the classroom settingsare on-site. There are many off-site (non-Wysscampus) NOLSWildernessMedicinecourses, but wedo not account for emissions at those facilities, nor do we currently track emissions from instructor travel to off-sitelocations.
Heating and cooling of Wyss facilities is powered by a geothermal system and electricity instead of other fuels, such as natural gasor propane. This will make it easy for us to reduce our footprint in the future with more installations of solar panelsor larger renewableenergy investments.
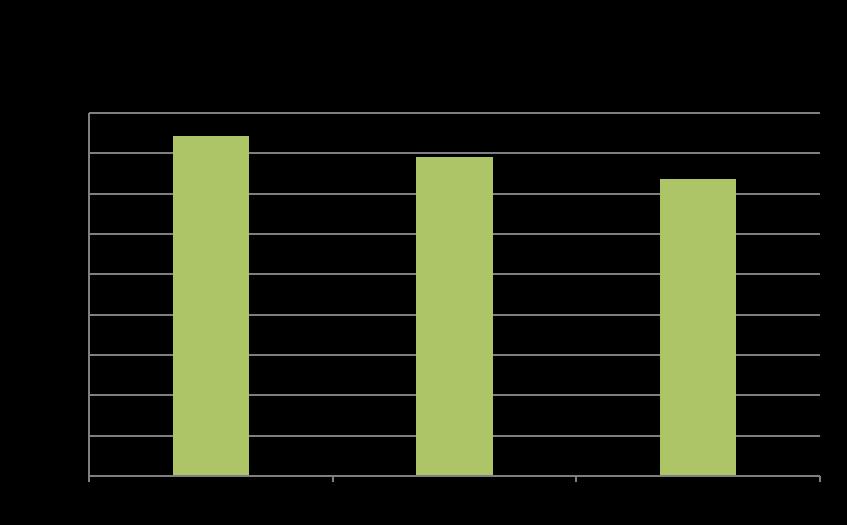
If the Wyss campus continues its current trajectory of hosting more student days each year while maintaining an even carbon footprint, we will seethetrend of lower carbon intensity continueaswell.

If wetakeinto consideration thenumber of occupantsof World Headquartersand substitute that in placeof student days, World Headquarters' carbon intensity (CO2eq/occupant day) supersedesthat of theoperating locations. This number would crowd thegraph and istherefore left out.
ThreePeaksand River Basecarbon intensity measuresareincluded with that of Rocky Mountain since student daysbetween thosethree locationsareso closelylinked.


Fiscal year 2015 camewith many new challengesand opportunities for sustainability at NOLS. When wediscovered thegapsin our carbon accountingand realized wherethat put usin relation to our goals, theinitial reaction wasdiscouragement. Wethought wewere on track with all of thehardwork our NOLSlocationshaveput in to buildingefficiencies. But it'simportant in theseinstancesto turn the situation aroundand createpositiveaction.
Thisreport isafirst stepin that positiveaction. By creating afeedback loopto NOLSlocationsand operationsstaff on how operational decisionsaffect thelocation'sfootprint, wecan better budget and plan for improvementsand celebratelastingsuccesses.
Carbon emission reportsservean important rolein increasing the transparency of our impact. Whether theaudienceispotential students, current students, NOLSemployees, or theNOLSBoard of Trustees, increasingunderstanding of our footprint iskey and helpsto continuethediscussion of sustainability. If you haveany questionsor commentsafter reviewing thisreport, pleasecontact us.
NOLSSustainability Coordinator, KaraColovich sustainability@nols.edu
Special thanksto Cat Cook, our Environmental Stewardship & Sustainability intern, for compilingthedataand organizing content for thisdocument. Also, abig thank you to those NOLS staff whosedrivefor sustainability hasinspired new waysof livingand workingat our locations.