2033 City of Norwalk Recreation & Parks Master Plan


Recreation and Parks facilitates leisure experiences for the residents of Norwalk by operating and maintaining a system of parks, open spaces, and community facilities; preserving and protecting the City’s natural resources; promoting the arts in Norwalk and offering a wide variety of leisure opportunities that enhance physical, intellectual, social, and cultural growth and development and ensuring they are accessible to all.

We extend our gratitude and appreciation to the residents of City of Norwalk, Recreation and Parks Department staff, elected officials, and stakeholders for their participation in interviews, surveys, workshops, and the process to adoption of this Mater Plan. Your feedback and expertise has been critical to the development of this guide for the future of City of Norwalk Recreation and Parks.
Harry Rilling, Mayor
Greg Burnett, Council President, Member At-Large
Darlene Young, Majority Leader, District B
Bryan Meek, Minority Leader, District D
Heidi Alterman, District D
Nicol Ayers, District A
Edwin Camacho, Member At-Large
Joshua Golstein, Member At-Large
David Heuvelman, District A
John Kydes, District C
Tom Livingston, District E
Jenn McMurrer, District C
Nora Niedzielski-Eichner, Member At-Large
Diana Revolus, District B
Margared Shanahan, District E
Barbara Smyth, Member At-Large
Darlene Young, Chairperson
Nicol Ayers, District A
Joshua Goldstein, Member At-Large
John Kydes, District C
Jen McMurrer, District C
Bryan Meek, District D
Margaret Shanahan, District E
Published: DRAFT - May 31, 2023
City of Norwalk, CT Recreation and Parks Department 125 East Ave. Rm 225, Norwalk CT 06861-5125 www.norwalkct.gov
Harry Rilling, Mayor
Laoise King, Chief of Staff
Sally Johnson, Executive Assistant
Michelle Woods Math, Director of Communications
Irene Dixon, City Clerk
Robert Stowers, Director of Recreation and Parks
Ken Hughes, Superintendent of Parks and Public Property
Sandy Korkatzis, Superintendent of Recreation
Rebecca Kovacs, Events Coordinator
Bobby Pentino, Recreation Supervisor
Diane Campbell, Recreation Supervisor
Steve Kleppin, Director of Planning and Zoning
Sabrina Godeski, Director of Business Development and Tourism
Theresa Argondezzi, Assistant Director of Community Health
Susan Zecca, City Staff
Darin Callahan, Assistant Corporation Counsel
Thomas Kulhawik, Former Police Chief (retired Jan. 2023)
Brian Bidolli, Director of the Norwalk Redevelopment Agency
Consultant Team
Kimley-Horn
BerryDunn
ETC Institute
Tavella Design Group, LLC
This document has been prepared by Kimley-Horn on behalf of the City of Norwalk Recreation and Parks Department. Reproduction or distribution of this document and its contents are prohibited without approval of the City of Norwalk Recreation and Parks Department. All contents of this document are the property of the City of Norwalk CT.
All pictures and images are property of the City of Norwalk CT unless source is noted.
 Norwalk Recreation & Parks Master Plan
The purpose of recreation and parks master planning is to create well-designed, functional, and sustainable parks and recreation facilities that meet the needs of residents and visitors. This type of planning aims to balance the demands for healthy lifestyles, environmental protection, social equity, and cultural preservation. Master planning involves the strategic allocation of services and infrastructure to help ensure efficient use of resources, minimize environmental impacts, and foster healthy and livable neighborhoods. The ultimate goal of recreation and parks planning is to create communities that are safe, accessible, and enjoyable places to live, work, and play for all residents.
This Recreation and Parks Master Plan (RPMP) was developed as an update to Norwalk’s prior master plan completed in 1996. Since the prior plan’s adoption, incredible changes have occurred including multiple recessions, community growth, and a global pandemic. Through these impacts, needs and priorities for recreation and parks have evolved. This planning process was structured to identify current needs and priorities as well as project needs over the next ten or more years.
This master plan is intended to be referenced regularly to identify community needs for parks and recreation facility development and investment, align goals with other community-wide goals, and gauge progress towards meeting community needs.

• This master plan has been developed in a linear process, building upon prior work; Section 1: Needs Assessment identifies existing and projected future community needs for recreation and parks. Section 2: Vision and Implementation establishes a long-range vision and recommends implementation strategies. A strategic plan concludes the plan with recommendations for actions to be completed by the City over the next 5+ years.
• For a quick review of key takeaways, review each bullet list located at the beginning of each subsection.
• The appendix includes full results from public and staff workshops, surveys, and other data sources used in development of recommendations.
• This master plan is formatted for the general public as a means of transparency, while also serving as a guiding document for elected officials and city staff in the provision of recreation and parks facilities and services.
The benefits associated with recreation and parks have been well studied over the last few decades. Some of the most well documented benefits include:
1. Promoting Physical and Mental Health: Parks are essential for promoting physical and mental health. Regular exercise in parks has been linked to reduced risk of chronic diseases like obesity, heart disease, and diabetes. Additionally, parks offer a serene and peaceful environment, which can provide mental health benefits such as reduced stress, anxiety, and depression.
2. Enhancing Environmental Sustainability: Parks are crucial for enhancing environmental sustainability. They serve as natural buffers against climate change, absorb carbon dioxide emissions, mitigate the impacts of air and water pollution, protect communities from storm surges,and reduce urban heat island effects. Parks provide habitats for wildlife, promote biodiversity, and protect natural resources such as water, soil, and vegetation. Parks also are excellent for stormwater management by acting as sponges during large storm events and disasters.
3. Providing Economic Benefits: Parks provide economic benefits to the communities they serve. They generate revenue for local businesses and create jobs in the areas of park maintenance, tourism, and recreation.
4. Fostering Social Cohesion: Parks play an essential role in fostering social equity and promoting community inclusion. They provide a space for people to come together, build relationships, and participate in community events and activities.
5. Preserving Cultural Heritage: Parks can help preserve cultural heritage and promote cultural identity. Parks can also be used to celebrate cultural events and traditions, promoting cultural awareness and understanding
6. Increasing Property Values: Parks and green spaces can increase the value of nearby properties, which can help to attract new businesses and residents to the area.
7. Promoting Tourism: Parks can attract tourists to an area, which can boost the local economy through increased spending on lodging, food, and activities.
The Pittsburgh Parks Conservancy and the City of Pittsburgh committed to the goal of bringing all parks in all city neighborhoods up to a high level of quality by developing a data-driven methodology coupled with residents’ input and priorities on maintenance, rehabilitation, capital improvements, and programming. In 2019, voters passed a parks tax referendum that contributes $10 million annually and provides baseline funding to implement park improvements. Key strategies for success of this initiative were leveraging accurate and relevant data; educating city leaders, community members, and conservancy and city staff at all levels; and gaining buy-in from citizens.
In addition to the parks tax referendum, the Conservancy raises approximately $8 million annually, with a goal of reaching $10 million to match the public taxes. Combined these are measurable actions in achieving progress with the more than $400 million in deferred capital projects spread across 165 park sites.
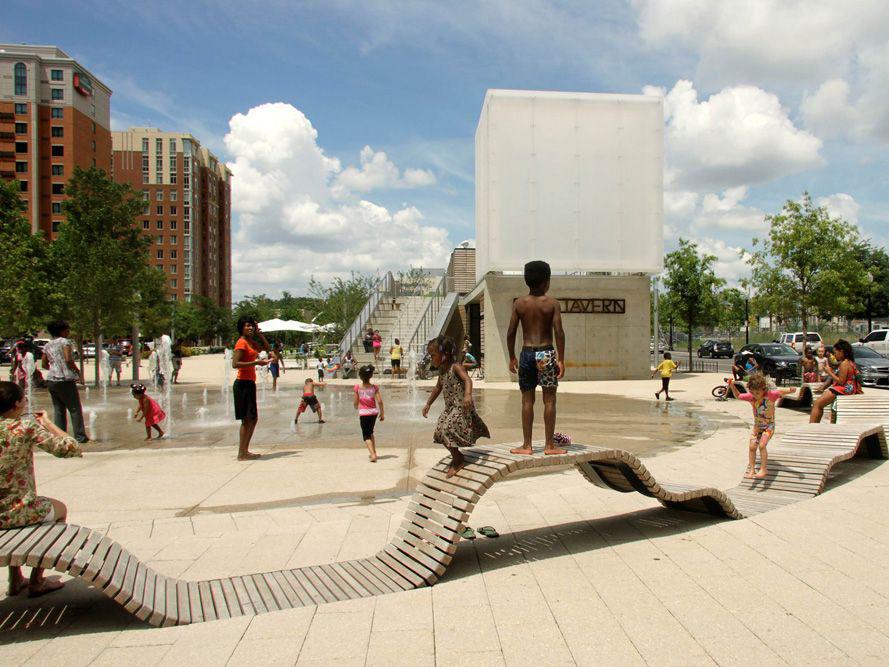
Located along the East River, Hunter’s Point South Waterfront Park was developed in 2013 to serve as a park space and the first line of defense from storm events. The incorporation of resilient design best practices control how water enters and leaves the site to protect park amenities and the adjacent neighborhoods. A total of 1.5 acres of constructed tidal marshes provide habitat, absorb excess nutrients, prevent shoreline erosion, and soften the edge of the concrete retaining walls and bulkheads. Bioswales slow and filter runoff and prevent standing water and combined sewer overflows. RipRap and rock-filled gabbions deflect impacts from waves and lessen impacts from large volumes of storm water to the East River. At a total of 30 acre, Hunter’s Point serves as inspiration for Norwalk’s Veterans Park. Amenities include open lawn space,a network of waterfront trails, a dog park, and a 13,000 SF pavilion with cafe and restrooms supporting solar panels.


August Wilson Park Improvements and Phase I of ‘Resorting Pittsburgh Parks’ Project


Source: Equitable Parks: Case Studies + Recommendations, City Parks Alliance, 2020; www.pittsburghparks.org

What is you and your household’s most preferred leisure and recreation provider to visit?
57.8% of Hispanic/Latino/a/x households Only 37.2% of Black households
55.3% of households with children between the ages of 10-19
Second most popular destination for households with children under the age of 10
41.4% (#4) for households with children under the age of 10
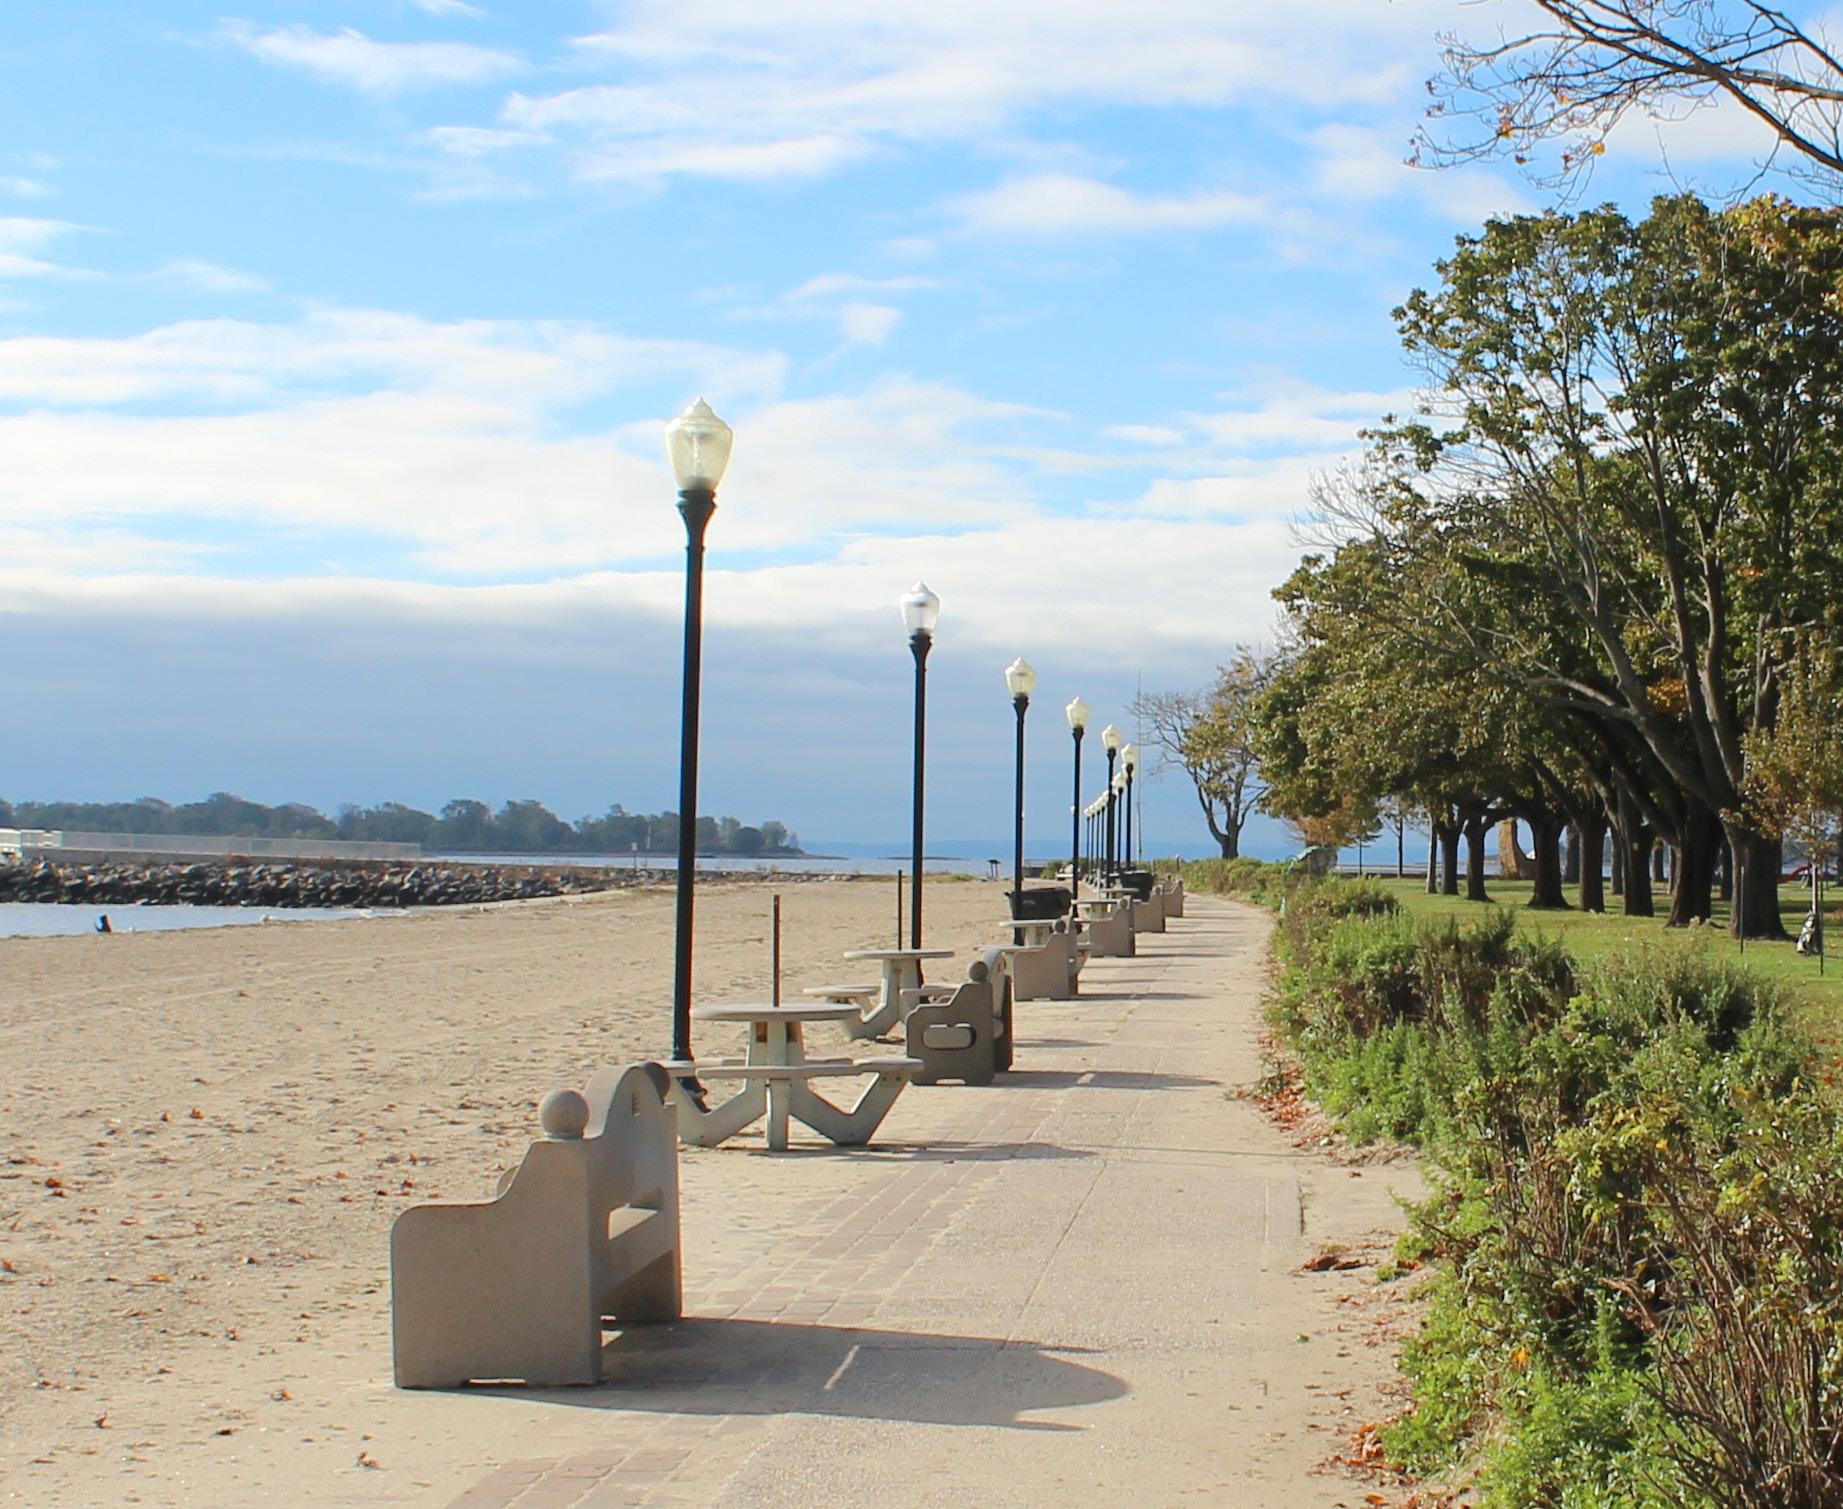
Residents of Norwalk have a high level of pride in their parks. This fact was not only heard through in-person interviews and workshop, but statistically valid survey data identifies that residents would rather spend their leisure time at a City of Norwalk park than any other leisure or recreation provider, Figure X2. A large majority of residents (83%) selected the City’s Calf Pasture Beach, and 48% selected Cranbury Park as their preferred destination for leisure, while 43% selected going to a restaurant and 16% selected shopping.
As provider of the top leisure destinations in Norwalk, the City’s Recreation and Parks Department is a proud steward of the places residents go to create memories, celebrate family and friends, learn about the City’s heritage, and enjoy the natural wonders of the coast community. Elected officials have continued to prioritize the preservation and stewardship of Norwalk’s parks and open spaces, therefore protecting the quality of life enjoyed by so many residents.
During and after the COVID-19 pandemic, support for public parks in the United States significantly increased, including in Norwalk. As people spent more time at home, many looked for ways to stay active and maintain their mental health. Additionally, the pandemic highlighted disparities in access to parks and green space in low-income and marginalized communities in many cities. This led to calls in many cities for more equitable distribution of park resources and funding, as well as efforts to create new parks and improve existing ones.
City of Norwalk parks celebrate almost 100 years of history, starting with Mathews Park and Taylor Farm. The success of these two initial city parks spurred the growth of the park system residents enjoy today with the addition of Woods Pond, Chimmons and Sheffield Islands, and other park sites, in the 1950s, 60s, and 70s.
Cranbury and Veterans Parks joined the system in the 1980s as two important regional parks that anchor the park system today. Through development and acquisitions recommendations from seven master plans over the last 90+ years, the City’s parks system has grown to over 50+ sites, including school parks, and over 900+ acres of public parkland. This includes dozens of small, open space sites that add to the aesthetics of many neighborhoods.
The City of Norwalk is not the only provider of parkland and recreation facilities in the City. Though there are no state or national parks located within city limits, nor any county parks, as there is no county government, several taxing districts own and maintain park spaces in Norwalk. These additional public open spaces and parks are identified but not included in the evaluation of the City’s parks for this master plan. Each provider plays a role in helping to meet residents’ needs for parks and recreation.
 Norwalk Recreation & Parks Master Plan
Previous efforts by the City of Norwalk and departments have produced several plans and studies which form a base of knowledge and a vision for Norwalk that this master plan seeks to build upon. The section includes summaries of key plans, relevant goals, and strategies with specific applications for this master plan. The following reports and plans were reviewed upon the initiation of this master plan and again during implementation planning in order to leverage prior efforts by the City:
• Norwalk Tomorrow (Citywide Plan POCD 2019-2029)

• City of Norwalk Recreation and Parks Master Plan (1996)
• Norwalk Pedestrian Plan (2019)
• Pedestrian & Bikeway Transportation Plan (2012)

• WestCOG Hazards Mitigation Plan (2016-2020)
• Various Park Master Plans (Ryan Park, Veteran’s Park, Cranbury Park, Oyster Shell Park, Freese Park)


• TOD Redevelopment Plan (2016)
• Capital improvements program (historic and current)
• Previous Parks and Open Space Master Plan was completed in 1993 and adopted in 1996.
• The City’s Plan of Conservation and Development (POCD) adopted in 2019 includes a focus on improvements to parks and recreation to elevate it to best in state, enhance access to the waterfront, and enhance resiliency and protection of natural and historical resources.
• Of the 36 recommended park, recreation, and open space actions from the previous 1996 adopted master plan, 23 have been substantially completed or completed, and 13 remain not completed, or are no longer feasible or valid. Additional evaluation of remaining recommendations to determine feasibility is needed.


Why we developed this plan.
The Norwalk Tomorrow plan establishes a ten-year vision for the city to become a national example across 11 quality of life and economic, environmental and social sustainability. The following summaries are excerpts from relevant sections and recommendations:
The 2019-2029 Citywide Plan is the only plan for Norwalk that covers the entire city. The State of Connecticut requires municipalities to update their plans every ten years. The plan guides decision making about the physical, economic, and social development of the City.
The plan identifies several priority concepts and strategies which focus on actions for the city to take that will improve the quality of life, economic prosperity of residents and sustainability within Norwalk. Several concepts and strategies have direct relevance to this master plan and include:
1. The Norwalk parks and recreation system as the best city system in the state. Develop and implement an integrated parks, beaches, open space, and recreation plan.
The Citywide Plan was developed with many opportunities for public participation. Interviews, a citywide visioning workshop, nine neighborhood-based district workshops, four topic-based workshops, a youth meeting, and opportunities for digital participation added to discussion and review by the Planning Commission and Oversight Committee appointed by Mayor Rilling. Norwalkers from all walks of life gave their time to help shape the plan.
2. Enhanced protection of environmental resources. Improve coastal and inland water quality, habitat, and open spaces through green stormwater management and other measures.
3. Leadership in sustainability and resilience. Establish and implement a city sustainability program and develop a Climate Change Vulnerability Assessment and Implementation Plan.
4. Enhanced protection of historic resources and promotion of arts and culture. Develop and implement a Historic Preservation Plan and an Arts & Culture Plan.
5. Modernized user-friendly land use regulations consistent with the plan. Rewrite the zoning ordinance and develop corridor and neighborhood plans that incorporate basic principles of good city and neighborhood design, which consider people first.
Figure A1 illustrates a diagrammatic expression of key land use issues and changes for Norwalk. These include support for walkable mixed-use centers,
The purpose of planning is to get to action. The Citywide Plan includes a ten-year implementation matrix setting out the What, How, Who, and When for policies and actions to achieve the goals of the plan. Annual public hearings will give citizens a report on implementation and the plan will be used in capital improvement planning, work plans, and to guide land use decision making. Partnerships with residents, businesses, institutions, and nonprofits will be important to the success of the plan.
creation of new walkable urban villages, transformation of underutilized areas near transit, concentration of industrial uses, and a robust green and blue network of trails and connectivity.
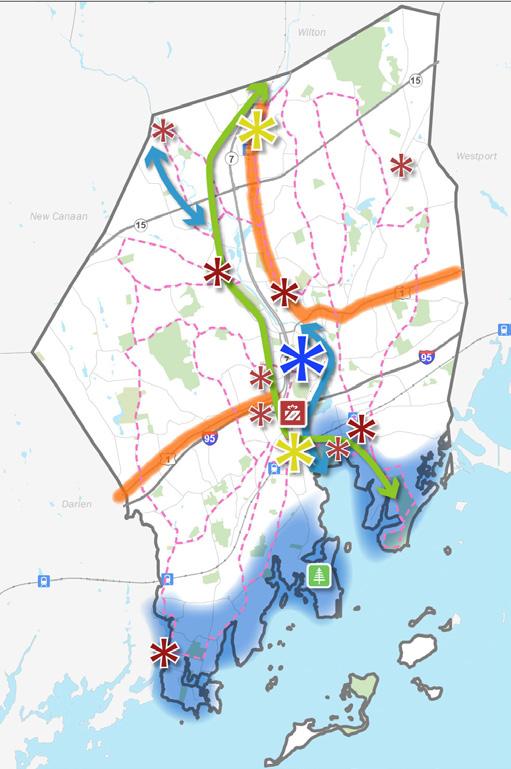

Additional key items shown on the diagram include opportunities for resiliency enhancements, potential

future open space at the former Manresa Island power plant site, and on-street bike routes.
These recommendations do not reflect zoning and are intended to illustrate the plan’s vision, goals and recommendations. The Norwalk Tomorrow plan seeks to build upon these items, confirm community needs and priorities, and identify an elevated level of detail for recommendations identified.
The Norwalk Tomorrow plan also identifies specific goals and actions for select topics. The following are select recommendations with specific relevance to the RPMP. Recommendations included in the PRMP are intended to leverage the efforts already underway by the as well as reconfirm community need and prioritization.
Environment, Sustainability, and Resilience:
Parks, Open Space, Trail, and Recreation Systems:
• Create an Open Space Committee to develop a Parks, Open Space, Trails, and Recreation System Plan.
• Give priority to completing the Norwalk River Valley Trail.
• Identify more opportunities to provide public access to water, including streams, the Norwalk River and coastline.
• Identify potential park opportunities in areas of the city under-served by parks so that all residents can walk or bike to a park.

Sustainability and the Norwalk Environment:
• Use green infrastructure and low-impact development to improve water quality and mitigate flooding.
• Develop a Climate Action Plan for reducing greenhouse gases.
• Collaborate with nonprofits to further protect environmental resources.
• Continue to maintain and increase the shade tree canopy.
• Continue to remediate and redevelop brownfield sites.
Coastal Resources and Resilience:
• Continue to implement and enforce the Norwalk Harbor Management Plan.
• Balance environmental protection, waterdependent uses, and public access and recreation.
• Develop a Climate Change Vulnerability Assessment and Adaptation plan.
Creating the Best City Parks & Recreation System in the State:
Develop and implement an integrated plan for open space, parks, trails, and recreation programs that enhances quality of life, provides recreation for all ages, and helps protect the environment.
Goal #1: Norwalk aims to have the best city park and recreation system in Connecticut.
Policies:
• Support a systematic and integrated approach to open space, park, and recreation planning and management.
• Support development of a connected green and blue network of parks, open space, and trails.
• Avoid development, encroachments or other activities that would affect opportunities for beneficial use and enjoyment of existing city parks and open space.
Strategy:
1. Develop a parks, open space, and recreation system plan, including a management plan, that emphasizes connectivity and promotes healthy lifestyles.
• Organize a committee led by the Conservation Commission to create a Parks, Open Space, Trails, and Recreation system plan.
• Survey the public about open space, park and recreation use, satisfaction, and desires for the future.
• Create a ten-year plan, with public participation.
• Implement an asset management system for the Parks and Recreation Department as part of a citywide system.
• Identify priority walking and biking routes for access to open space and recreation destinations.
• Give priority to completion of the Norwalk River Valley Trail.
• As part of a zoning rewrite, create an “Open Space” zoning category and rezone all park and conservation land that is permanently protected.
2. Identify opportunities to provide more public access to water, including streams as well as the Norwalk River and coastline.
• Seek open space protection along Long Island Sound.
• Pursue planning and funding for public access to Long Island Sound on Manresa Island
• Identify small, neighborhood-scale water access to ponds and streams.
Goal #2: Norwalk’s park and recreation system serves residents throughout the city while protecting and managing natural resources.
Policies:
• Enhance recreational programming to serve the changing needs of all types of households and individuals.
Strategy:
1. Seek to park opportunities in underserved areas of the city to work towards providing walking access to a park for every resident (within 1/2mi).
• As part of the Parks, Open Space and Recreation Plan, identify underserved areas in the city and potential park opportunities so that all residents can walk or bike to a park.
• Expand the NorWALKER program.
• Survey residents regularly to make sure recreation and park opportunities reflect changing demographics and needs.
• Develop a reduced-fee or scholarship program to support fee-based park and recreation activities for lower-income children and youth.
• As part of the Parks, Open Space, and Recreation.
• Plan, analyze and consider setting aside all or some of recreation fees to fund recreation department capital needs.
The City’s prior Master Plan for parks and open space began in 1993 and was adopted first by the City’s Planning Commission in 1993, then by Common Council in 1995 and made effective in July 1996.
Norwalk’s park system began based on recommendations from the City’s 1935 communitywide plan which recommended the acquisition of Mathews Park and Taylor Farm. It was not until 1952, however, that the City completed the first parks master plan. An update in 1958 established the policy of schools serving as parks and the creation of the Recreation and Parks Commission. Additional master plan updates were completed in 1968, 1973, 1977, and a Plan for Development in 1991. The 1991 Plan of Development recommended 12 acres of park land per 1,000 (or Acreage Level of Service) standard that was carried forward in the 1996 Master Plan and included in this master plan.
The 1996 Master Plan included descriptions of each existing park and classified sites into two categories:
• City-Wide Parks
• Area Parks
Condition of each existing park was included and noted that most parks were well maintained, free of litter, and safe in condition. Also noted were observed needs for a preventative maintenance program and a tree maintenance program, which are still primary needs today. Recreation program offerings were also evaluated and noted as mostly seasonal and at capacity with a primary limitation being lack of staff and suitable locations.
A survey was conducted in 1993 for the development of the master plan. Comparisons to survey results from 2022 include:
• Norwalk waterfront and beaches remain the most popular leisure destinations. In 1993, 75% of respondents had visited the City’s primary beach in the last year versus 83% in 2022. Cranbury was visited by 50% of respondents in 1993 versus 48% in 2022.
• Continued growth in the gap of communications. Approximately 1/3 of respondents indicated a lack of information about offerings was a primary barrier in 1993. That has grown to 38.9% in 2022 despite the availability of social media, emails, and lower cost communications tools and techniques.
• Maintenance of existing parks is most important. The top priority in 1993 (45%) was maintenance of existing parks and facilities versus 40.7% identifying maintenance of beach or waterfront parks and 33.2% maintenance of existing parks in 2022. One difference in the question from 1993 and 2022, is that responses in 2022 emphasized actions would be supported with the respondent’s additional tax dollars.
• Residents’ support for acquisition of additional park land has grown significantly since 1993. In the prior survey 11% of respondents indicated a priority for additional acquisition versus 29.7% support for acquisition of natural lands and 23.4% support for additional neighborhood park land acquisition in 2022.
The following section is an assessment of the level of completion for all 36 recommended operating and capital improvements identified in the 1996 Master Plan. The assessment is categorized into three groups: Parks, Recreation, and Open Space recommendations.
Parks Operating:
1. The Department should improve their preventative maintenance program to address park facilities that require periodic maintenance and repair.
2023 Assessment: Though improvements have been made over the last 30 years, this action is still
largely not completed as deferred maintenance needs and lifecycle replacement still is not proactively budgeted and implemented.
2. A tree planting and maintenance program should be enacted by the Department to protect the living resources in our parks. Initially, an assessment of the conditions of the existing trees in our parks is needed. Norwalk Clean and Green could assist in this in this effort to beautify our parks.
2023 Assessment: The City of Norwalk recently completed a City Tree Canopy Improvement Study (2018). Additionally, Common Council approved an updated Tree Ordinance in 2021 to enhance the City’s existing tree canopy and grow it equitably. The Department has recently progressed this action with a budget request for a new arborist/ horticulturalist position to help the Department be proactive in addressing the management and enhancement of tree canopy in parks.
3. Common Council should adopt park rules and regulations that address noise, letter, drinking, etc. within our parks. Provisions should be expressly made for the enforcement of these rules and regulations.
2023 Assessment: The City of Norwalk has maintained ordinances for parks and recreation since 1958. Ordinances have been periodically updated including in their entirely in 2019. Additionally, the City has specific codes for recreation and parks that include sanitation, conduct and behavior in parks, operating policies, permits, etc. Overall, the City and Department have completed this action.
4. The Common Council should review all parks not previously dedicated and should dedicate selected parks. This will require the City to replace a dedicated park in-kind if it is used for another purpose.
2023 Assessment: The City retains over 54 park sites, including neighborhood, community, regional, and school parks. The City also owns and maintains dozes of additional open spaces that add to the aesthetics of the community but do not necessarily contribute usable recreation space. These
spaces should be classified by the City as general open space and not parks in order to manage expectations of their potential use. This action has not been completed and is advised to not be carried forwarded.
5. The Common Council should restrict commercial and business activities that unrelated to park uses from locating within parks.
2023 Assessment: The City’s recently updated ordinances, specifically Code 74-12.1, restricts commercial or business activities in all parks not approved by the Parks, Recreation, and Cultural Affairs Commission. This action has been completed
Parks Capital:
6. Implement the Master Plan for the State Heritage Park, located on the west bank of the Norwalk River, adjacent to the Maritime Center. This Plan includes provision for a community boat house.
2023 Assessment: The Norwalk State Heritage Park was dedicated on June 2, 2001, in conjunction with Norwalk’s 350th anniversary. The park includes a Heritage Walking Route which connects Mathews Park, Oyster Shell Park, the Maritime Aquarium, and North Water Street Park. This action has been completed.
7. Encourage the Connecticut Department of Environmental Protection and the Department of Transportation to build the Route 7 Linear Park. Phase 1 of the Linear Park should extend from Mathews Park to Grist Mill Road.
2023 Assessment: The Route 7 Linear Park project has been advanced as the Norwalk River Valley Trail (NRVT) which has been constructed in segments and runs from North Water Street Park, north to Broad Street, approximately 1.8 miles south of Grist Mill Road. This action has been progressed, but further acquisition, design, and construction of the NRVT is needed.
8. Encourage the Connecticut Department of Transportation to construct a regional trail along the southern edge of the Merritt Parkway right-of-way.
2023 Assessment: The Norwalk Pedestrian and Bikeway Transportation Plan, completed in 2012, did not identify this route as a suggested pedestrian or bike route. This action has not been completed. Provided the level of evaluation, public input, and analysis of Norwalk’s pedestrian and bikeway needs, this plan does not recommend to advance this action item.
9. Complete the implementation of the Riveredge Park and Bikeway along the east bank of the Norwalk River, from Veterans Park to Mill Hill Park.
2023 Assessment: This project has progressed to become the nearly completed 3-mile Harbor Loop Trail. Through coordination from the City’s Planning and Zoning Department and Norwalk Redevelopment Authority, public access has been zones into all new construction along the route. Public meetings for the design of segments from the Maritime Aquarium, including redesign of North Water Street Park and SoNo Wharf, were held in early 2022. This action is significantly completed
10. To increase the utility of ballfields, consider erecting lights at locations which would not adversely impact nearby properties.
2023 Assessment: The Department has added lighting to several athletic fields and courts. This action has been completed. This master plan includes additional recommendations for lighting that will further increase the capacity of existing facilities. Additionally, technology advancements in lighting has reduced and nearly eliminated former negative impacts associated with lighting, such as glare and light pollution. Today’s lighting systems include full cut-off and anti-glare which eliminate light slippage into surrounding properties.
11. Update the Cranbury Park Master Plan so as to allow the park, recreation and open space value of this park to be more fully realized.
2023 Assessment: The Department completed a park-wide master plan for Cranbury Park in 2010 and a separate master plan for the mansion in 2012. Both plans included a phased implementation with additional phases currently unfunded. Significant progress has been made.
12. Incorporate public squares, plazas or greens into the redevelopment of the Norwalk and South Norwalk downtowns.
2023 Assessment: The City has incorporated new or redesigned public spaces in redevelopment opportunities. Ryan Park is the most prominent example of recent action as well as the redesign of the North Water Street Park as part of the railroad bridge reconstruction. Additional opportunities should continue to be sought by the city. This action has had significant progression
13. Adopt a plan for the restoration of Mathews Park which resolves the issue of the Department of Public Works presence within the Park.
2023 Assessment: The City completed changes at Mathews Park to remove the Department of Public Works facilities and usage. This includes lease and development of the Stepping Stones Childrens Museum and construction of Devon’s Place. This action has been completed
14. Provide a formal parking area for users at Taylor Farms.
2023 Assessment: The Department has developed a formal, 16-space, parking lot accessible from Canfield Ave. with primary purpose of serving dog park users. Recommendations included in this master plan are for expansion of this parking lot and installation of ADA accessible spaces and access to the dog park area. This action has been completed
Recreation Operating:
15. The Department should publish a consolidated listing of recreation programs offered by the city, community centers, and taxing districts and increase circulation of the program listing to improve the public awareness of these offerings.
2023 Assessment: The Department has not completed this action. Coordination for programming with other providers, including taxing districts, is not currently provided.
16. The Department should update the guide ‘Public Recreation Opportunities in Norwalk’s Parks’ and
increase its distribution to the public.
2023 Assessment: The Department does not publish a guide, however, an estimated 76% of park agencies still print one as of 2022. Publishing a guide is recommended for Norwalk with integration of QR codes and continued social media outreach as part of a comprehensive marketing plan. Action is currently not completed. In important note is that the Department is currently implementing a new software platform for field registration.
17. Common Council should expand program fees to partially defray the expense of providing recreation facilities and programs.
2023 Assessment: The City has maintained a fee schedule for programming, rentals, etc. and is currently undertaking a user fee demand study to determine appropriate charges for programming and other services. The Department is targeting completion of this study in 2023.
18. Encourage the Department in cooperation with the Board of Education to increase the use of school gymnasiums for recreation programs.
2023 Assessment: The Department has drafted and will be completing the adoption and signing of a Joint Use Agreement (JUA) between the Department and Norwalk Public Schools clarifying and confirming use of school facilities for recreation programming. This action is on track for completion in 2023-2024
19. Common Council should consider the creation of an Advisory Committee to advise the Recreation and Parks Committee of the Common Council.
2023 Assessment: The City has not completed this action through the creation of an advisory committee to advise the Parks, Recreation, and Cultural Affairs Committee of the Common Council.
Recreation Capital:
20. The City supports the construction of an ice skating rink by a private developer.
2023 Assessment: The SoNo Ice House opened for business in October 2012 after nearly five years of effort to realize development of the facility. Action
has been completed.
21. The City should seek to retain in perpetuity nine holes of the Silvermine Golf course for public use.
2023 Assessment: The Silvermine Golf Club is a privately owned and operated course with 27 holes, including a nine hole executive par 3 and 4 hole course. At this time, the course is private and available to members only. This action has not been completed and should be evaluated if need within the community still justifies to retain this action.
22. The Oak Hills Park Commission should construct a municipal golf driving range in the park.
2023 Assessment: The Oak Hills Park Commission has been replaced by the Oak Hills Park Authority (OHPA) in 1997. Chapter 73 Park Authorities, Article 1 - Oak Hills Park Authority was adopted in February 1997. It establishes the Authority’s purpose as acquiring, constructing, operating, maintaining, and managing the Oak Hills Park. To date, this action is not completed. This recommendation should be evaluated further to determine if need still exists within the community for this type of facility. Recent trends nationally have resulted in private industry being aggressive in capturing the golf driving range market with such high-end facilities as Top Golf constructing ranges throughout the US, but none currently in Norwalk. The Shorehaven Golf Club provides a driving range.
23. The Department should continue its program of refurbishing existing recreation facilities. A prioritized list of these projects should be submitted prior to capital budget approval.
2023 Assessment: The Department has regularly replaced or refurbished playgrounds, sports courts, and athletic facilities. As part of this master plan, recommendations focus on a priority of maintaining existing facilities and includes a prioritized list. This action has been completed and continues to be implemented by the Department.
24. The Department should continue its program of capital repair and improvements to park buildings. A prioritized list of these projects should be submitted prior to capital budget approval.
2023 Assessment: The Department has regularly repaired existing park buildings, which mostly consist of restrooms and picnic shelters. Larger facility repairs or renovations have included the bathhouses at Calf Pasture Beach and the Gallaher Mansion at Cranbury Park. Some facilities repairs have been deferred and have been included in this master plan’s recommendations. This action has been completed and continues to be implemented.
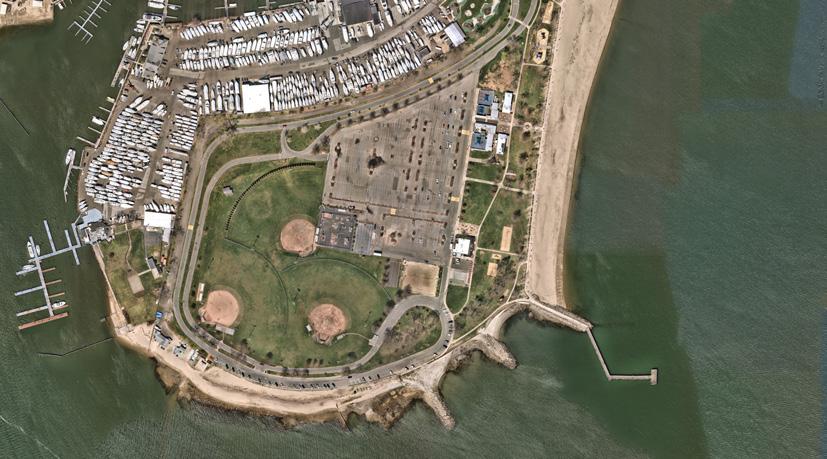
25. The Department should provide a fishing pier and picnic tables at Veterans Park.
2023 Assessment: A master plan for Veterans Park was completed in 2012 and included recommendations for two piers; a floating ‘Pier Point’ with docks in the east side of the park, and a ‘Harbor Pier’ located on the river side of the park. The Pier Point docks were included in shortterm recommendations (0-5 Years) and the Harbor Pier was included in mid-term recommendations (6-10 Years). Neither pier has been constructed and most recommendations from the 2012 master plan remain unfunded. This action has not been completed. Further feasibility of constructing piers at Veterans Park should be completed. An existing pier at Calf Pasture Beach was damaged by hurricanes in 2011 and 2012 and subsequently rebuilt to new standards.
26. Build a new playground for toddlers at Calf Pasture Park with private sector contributions.
2023 Assessment: Calf Pasture Beach continues to offer a playground area for multiple age groups. In addition, a splash pad was opened in 2014. This action has been completed.
27. The Department should prepare and implement a program to make all of the City’s parks and recreation facilities compliant with the American Disabilities Act (ADA).
2023 Assessment: The Department lacks a current ADA Transition Plan and Barrier Removal Plan. Though many parks do contain accessible parking, access routes, and accessible facilities, some observations noted during development of this master plan should be further evaluated in order to ensure accessibility standards are achieved. This action remains to be completed.
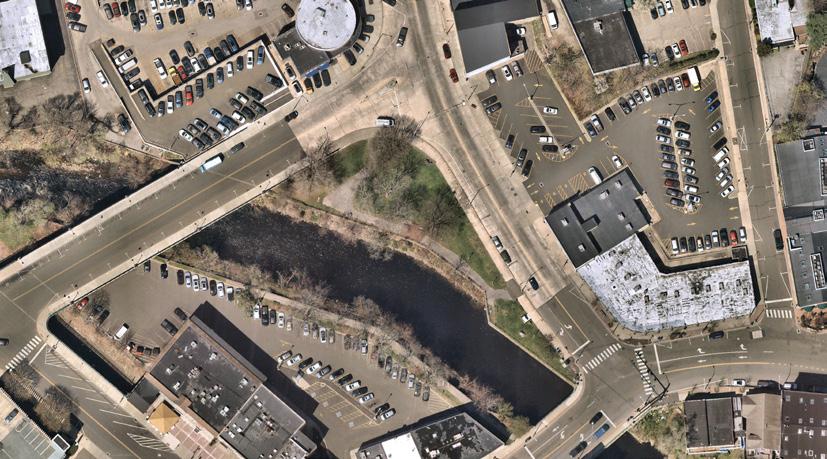
28. The Department should improve selected street ends to increase public access to the waterfront.
2023 Assessment: This master plan includes additional recommendations for acquisition of additional waterfront parcels as well as development of public right-of-ways for additional waterfront access. This action remains to be completed.
29. Where feasible, increase public access to the waterfront, including the Norwalk, Silvermine, and Five Mile Rivers (except single family houses).
2023 Assessment: The City, with assistance from partners agencies and nonprofits, has developed several miles of trails along the Norwalk River, including the NRVT and Harbor Loop Trail. The Silvermine and Five Mile Rivers are less publicly accessible. This action has had significant progress.
30. The Oak Hills Park Commission should continue to maintain and improve the golf course and other park facilities.
2023 Assessment: The Oak Hills Park Commission has been replaced with the OHPA in 1997. The park is leased to a private entity which maintains the golf course for public access. This action has been completed
31. Designate open space parcels, per State Statute 12-107e, to encourage open space preservation via tax incentives.
2023 Assessment: The City’s latest POCD Plan did not include designation of open space parcels beyond property that the city, taxing districts, or non-profits already own and manage as open space. This action remains not completed
32. Encourage the amendment of State Statute 12107e to provide municipalities the right of first refusal for parcels designated as open space by the city, and where the property owner has applied for and obtained an open space classification for tax purposes. This section should be further amended to require that designated open space be maintained for a minimum period of time and to
require the payment of abated taxes if the property is developed.
2023 Assessment: State Statute 12-107e has not been amended to included the recommended language. This action remains not completed
33. Require that a ninety day right of first refusal be given to the city before a parcel designated as open space for tax purposes can be sold for development
2023 Assessment: This recommended amendment to State Statute 12-107e has not be completed
34. The city should retain the unimproved open space it already owns (i.e. Stonecrop Road, Ponus Avenue, Comstock Hill Road, etc.)
2023 Assessment: The city has retained several unimproved open spaces totally approximately 80-acres. In addition, Norwalk Land Trust has acquired and maintains over 90-acres of open spaces for conservation with limited to no public access. This action has been completed
Open Space Capital:
35. Use conservation easements, acquisition by nonprofit land trust or other means to preserve open space with valuable natural resources, such as Peach Island, Betts Pond Brook (north of Blake Street), the park land opposite the former Nash Engineering property, etc.
2023 Assessment: Several conservation easements and acquisitions by land trusts (Norwalk Land Trust primarily) have preserved open space throughout the City. Additional actions should be taken by interested parties to further preserve open space throughout the city. This action has been progressed substantially.
36. The City should consider the acquisition of critical parcel of open space as they become available.
2023 Assessment: To-date, over 15% of the city’s maintained park land consists of preserved open space. This action has been implemented and continues to be a primary strategy for the city to grow the park system.
Norwalk has a long history of proactively planning to maintain the quality of life for residents with parks and recreation being a major element. With almost 100-years of planning the City’s open space, Norwalk recognizes the potential for the city’s parks to be destinations for residents, positively impact resident’s quality of life, and protect the community’s heritage and critical natural features.
In review of the city’s prior adopted Parks and Open Space Master Plan, substantial progress has been made or completion of 23 of 36 recommended actions. Though 13 actions still remain to be completed, several need to be re-evaluated to determine if the action should be carried forward, or the action requires an entity other than the Recreation and Parks Department to lead.
Overall, the ability of the City to plan for its future is a critical initiative. For many recommendations to be fully implemented, the city must be proactive in budgeting for long-term needs, replacement of facilities, and enhance its ability to acquire land for park or open space when beneficial to the community.
Demographic analysis is used to understand trends within the population related to age, population density, race and ethnicity, and median household income throughout the city. Understanding this information in relation to geographic location is key to informing recreation and park facility long range planning.
Total population of Norwalk is projected to continue to grow at a rate of approximately 0.48% percent annually. Figure B1 illustrates this population growth, reaching over 100,000 people by the year 2040. Population estimates can inform long-term needs in regards to park acreage and recreation facility quantity and sizes. As the City continues to grow, additional parkland and recreation facilities will be needed in order to maintain existing level of service. These future needs are further assessment in the Level of Service Analysis section.
Of the total population in 2021; 29.2% of residents were under 25, 41.2% of residents were ages 25-54, and 28.8% of residents were over 55. Distribution of age groups within the overall population of the City aligns closely with state averages. Figure B2 compares nine age groups of city residents to state averages. From 2010 to 2021, residents over the age of 65 increased by 3.2%, while there was a decline in the number of resident in the 25 to 34 and 45 to 54 age groups. Figure B3 illustrates age group trajectories with the most change since 2010.
• Norwalk is projected to reach over 100,000 residents by the year 2040.
• Norwalk has more young adults and children and less adults over age 65 than state averages.
• Since 2010, population below age 24 in Connecticut has dropped 3.4%, while increasing 0.5% in Norwalk.
• Annual growth rate for Norwalk from 20102020 (0.63%) doubled the rate from 2000-2010 (0.32%).
• Norwalk grew 6.5% since 2010 compared to 3.2% between 2000 and 2010.
• Changes in demographic trends, i.e. remote working, has allowed many people to relocate to suburban communities such as Norwalk.
• Concentrations of minority populations overlap with areas of high youth and senior populations as well as lower income households.
• Residents in Norwalk enjoy slightly higher average household income and projected growth of household income than state averages.
With remote work becoming a more frequent lifestyle since the 2020 US Census, population figures will likely be impacted as many people have left more densely populated business and commercial centric cities to live in suburban communities, like Norwalk, throughout the northeast.

Figure B4 highlights geographic distribution of senior and youth residents. Each dot on the maps represents one person within the identified age group. Concentration of youth population, those under age 19, can be identified in the central and southern areas of the city and fairly evenly distributed elsewhere. Senior population, or those over age 65, is concentrated centrally and to the west of the downtown area.

(2010-2021)
U.S.
The maps shown in Figure B5 illustrate black, white, and hispanic and/or latino populations in context to park locations and geographic distribution of densities. These US Census categories only begin to identify the extensive ethnic and racial diversity that exists within Norwalk. US Census data from 2020 identify concentration of black populations in the central area of the City, with a small high-density area in South Norwalk. This area is in close proximity to several small neighborhood and pocket parks and a few community parks, Springwood Park and Flax Hill Park.

The city’s population of residents identifying themselves as white is distributed around the perimeter of the city, with the highest density in the southwest or Rowyaton area. Within several higher density white areas, there is additional access to


parkland provided by taxing districts as well as access to two of the three existing regional parks, Cranbury Park and Calf Pasture Beach. The exception of this is in the furthest west and east areas where open space is primarily located on school property with little to no community or neighborhood parks.
The Hispanic/Latino population is mostly concentrated near downtown Norwalk, with the highest density west of the Main Street and in the Spring Hill neighborhood north of I-95 and west of US Route 7. Recreation and park facilities in these areas are primarily neighborhood and pocket park spaces and a few notable larger parks including Springwood Park and Mathews Park.

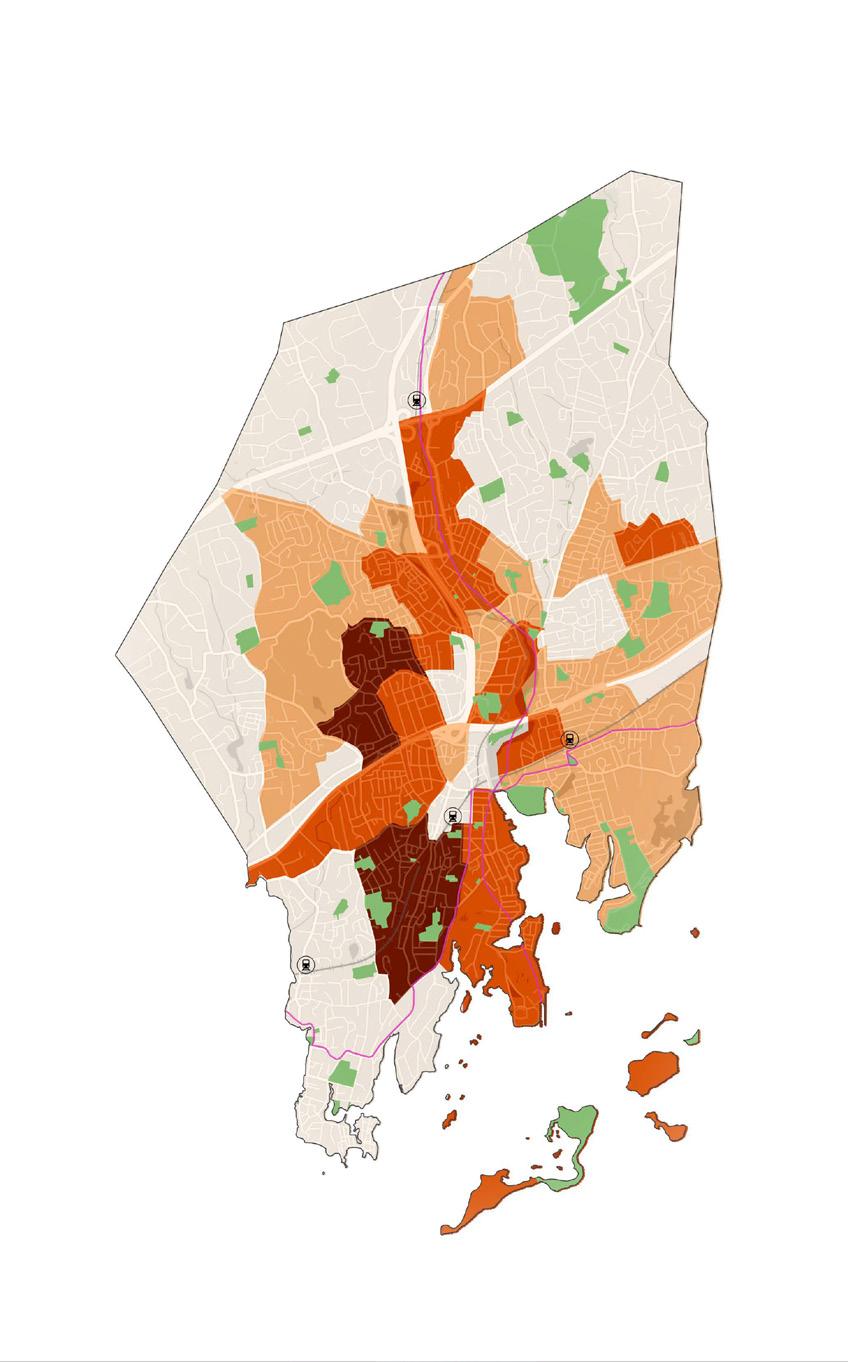
Figure B6 represents median household income data ranges across the City by US Census Tract. The largest range of income exists in the southwest area of the city with a range of median incomes of less that $24,999 to over $100,000 annually located in close proximity. An additional area of lower household income exists in the Spring Hill neighborhood north of I-95 and west of US Route 7.
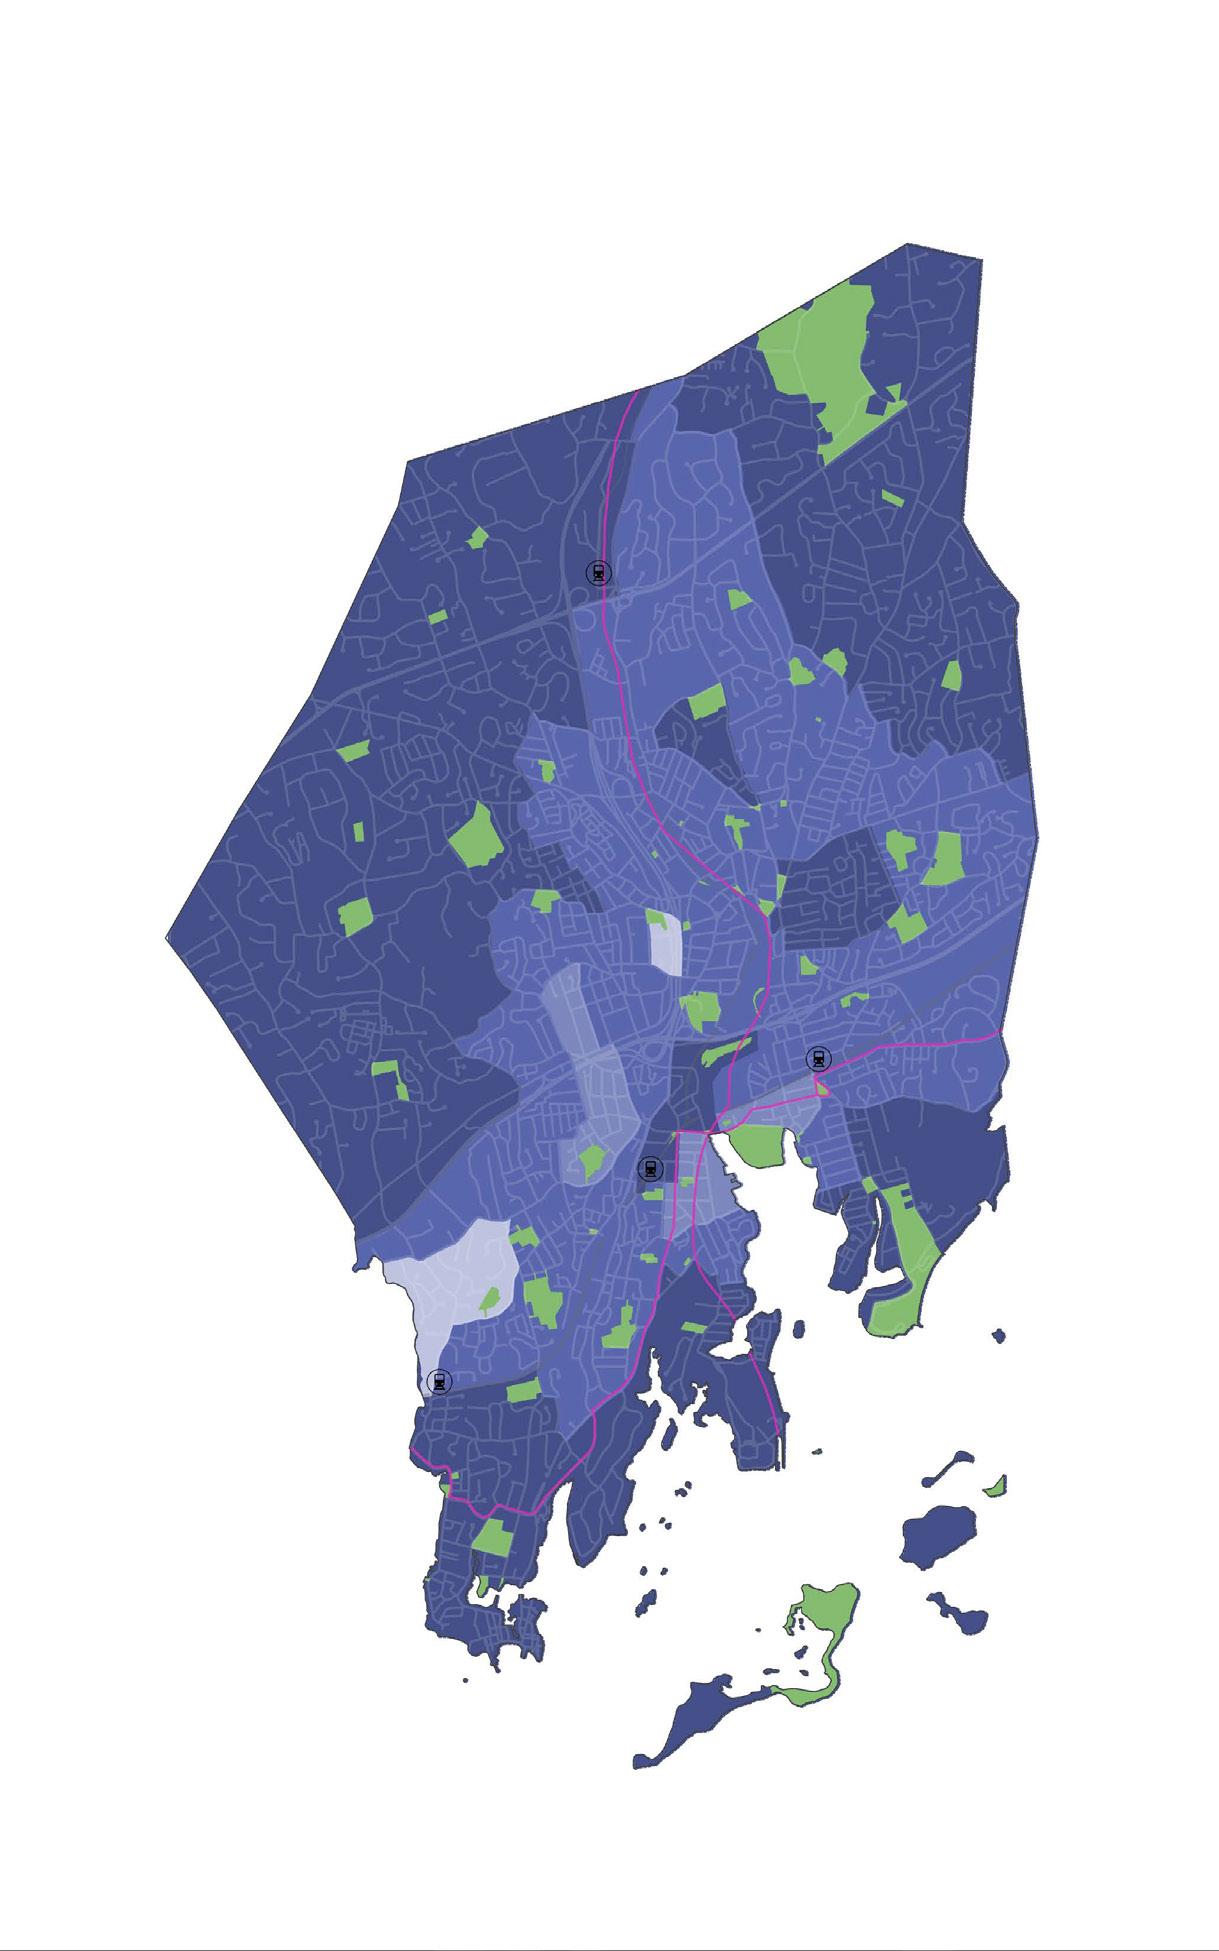
Figure B7 illustrates household income ranges for City of Norwalk residents in relation to state averages across eight income levels. In Norwalk, 17.2% of residents earn over $200,000 annually compared to a state average of 13.4%; while 13.3% of Norwalk residents earn less that $25,000 annually compared to the state average of 16.1%.
Figure B8 identifies projected changes in average annual household income projected by 2026 for the City of Norwalk and the State of Connecticut. The average annual household income and percent of increase are expected to be higher in Norwalk than the state averages.
Recreation and parks facilities are an invaluable public resource that support community building and overall health and wellness of adjacent residents. Inventory of age, racial and ethnic data, and household income, is necessary to ensure continued investment in the recreation and parks system is distributed equitably across the growing population.
U.S.


Park evaluations involve visiting each park to fill out a qualitative and quantitative evaluation of each space. Park elements that are evaluated range from general maintenance quality to number of benches. These scores can then be used to map park qualities and facilities across the City. The 60+ recreation and parks facilities across Norwalk were categorized into more specific typologies to better be able to evaluate what each park. These typologies are:
• Neighborhood and Mini Parks
• Community Parks

• Regional Parks


• School Parks


• Taxing District and Other Parks Park locations and typologies are identified on Map C2. The highest and lowest scoring City parks are highlighted in the graphic below.
• City and School Parks are well maintained, used by visitors, and scored highest on condition followed by comfort and image.
• Among the highest scoring parks are some of Norwalk’s largest regional and community parks or those that have more recently been improved.


• Sustainability and resiliency measurements have the most opportunity to improve the overall score of existing park facilities. This was the lowest scoring category across all park types followed by access and linkage.


Public parks in the United States have evolved significantly over time, both in terms of their functions and their use. In the early days of the country, parks were primarily seen as a way to preserve natural landscapes and provide a respite from the hustle and bustle of urban life. During the 19th century, many large parks were established in major cities, such as Central Park in New York City, with the goal of providing a place for people to enjoy nature, relax, and escape the crowded conditions of the city.

Over time, the functions of public parks expanded to include a wide range of recreational activities. Parks have become an important resource for health and wellness, with many offering walking trails, fitness classes, and other opportunities for physical activity. Parks have also become a destination for cultural events and festivals, with many parks hosting concerts, art shows, and other community events.
The use of public parks has also changed over time. Historically, parks were primarily used by the wealthy and middle class, who had the leisure time and means to enjoy them. However, as the working class grew, parks became more accessible to a wider range of people. Today, parks are used by people of all ages and backgrounds, and they serve as an important resource for people of all income levels.
important venue for the exercise of free speech and the right to assemble. Additionally, parks have been an important resource for marginalized communities, providing a space for socializing and gathering, and have been an important tool in the fight for racial and social justice.
Despite the evolution of public parks functions and use, challenges remain. Parks have been underfunded in the past, and many are in need of repair and maintenance. Additionally, access to parks is not equal across all communities, with low-income and marginalized communities often having less access to parks and green space. Furthermore, in recent years, the use of public spaces has increased, leading to overcrowding
Parks have also played an important role in the history of social and political movements in the United States. Many parks have been the site of protests, rallies, and other public gatherings, and they have been an
Overall, public parks in the United States have evolved over time, from being primarily a place for the wealthy to enjoy nature, to being a vital community resource. Today, people of all ages and backgrounds enjoy a wide range of recreational activities, while parks serve as a platform for cultural events, political movements, and community gatherings. Though challenges remain, public parks continue to be an important resource for the health and well-being of individuals and communities.
The Power of 10+; Project for Public Spaces: Project for Public Spaces is a non-profit organization that assists in the design, research, and establishment of thriving public spaces. The Power of 10+ is an idea that, in order for a place to thrive, each place should have a range of reasons (10+) for people to be there. Reasons can range from waiting for a bus, to something unique to the qualities of that place. For example, attending a history tour of oystering in the Long Island Sound. The concept is scalable to the size of the public space. Each space should have 10+
reasons that encourage residents to pack a lunch and walk to the park, plaza, or facility.
The result of this philosophy is a network of places to visit and ways people can spend time in their community. Combining a range of engagement opportunities (sports courts, dog areas, bus stops, food trucks, seating, etc.) maintains engagement and activity in public spaces even while some interest in activities may grow and shrink with the seasons or recreational interests.

The basis of CPTED is that the built environment can create or limit opportunity for crime. This design principle builds on Jane Jacobs’ 1960s commentary on the value of natural surveillance of the urban streetscape in New York City and Oscar Newman’s identification of clearly defined ownership, natural surveillance, and symbolic barriers as design tools to prevent crime in the 1970s. Today, CPTED is an internationally adopted set of design standards used to prevent crime in urban spaces.
The best and most widely adopted of these standards includes ensuring clear view into and out of a site from adjacent streets, and creating an environment where people take ownership. The core critique of CPTED principles is that they can be used as a tool to reinforce hostility towards any park patrons
determined ‘illegitimate;’ opening the door to bias and exclusion within public spaces. CPTED standards have been used to reinforce hostile public space design decisions. Some examples include not including trees for ‘visibility’, heavily patrolling spaces in place of ‘natural surveillance’, and fencing spaces from adjacent neighborhoods for purpose of controlled access. Crime is motivated by a range of factors and cannot be prevented or controlled by any single public space design element.
Incorporating key design elements of CPTED principles can prevent the opportunity for crime to happen in a specific place. Public engagement and community ownership is the best method of designing safe public spaces, leading to lower levels of maintenance, better use, and natural surveillance. Limiting the opportunity for violent or property crime to happen to public space users is a basis of good design.
Size: <3.0 acre


Service Area: 0.5 mi
Neighborhood and pocket parks may have small athletic courts, playgrounds, or open lawn space with benches, and shade trees. These parks are accessible to immediate residents by walking or biking.
Irving
Size: 3.0+ acres
Service Area: 1.0 mi
Community parks provide open space to residents across the city. These types of parks may have more extensive walking trails, full size athletic facilities, community centers, restrooms, or regularly scheduled programming.
Size: 20+ acres
Service Area: 3.0mi
Regional Parks are large parks recognized as a resource across the city. These parks may have large recreation facilities, educational centers, expansive natural areas, or historic sites.
Service Area: 0.5mi
Throughout Norwalk public school playgrounds and recreation facilities provide residents with similar facilities as Neighborhood and Community Parks in the summers, evenings, and on weekends.
Service Area: 0.5mi
This category includes parks and open spaces that serve nearby residents within walking or biking distance but are funded from within the taxing district. Many of these spaces feature open lawn space, small courts, or historic features.


Park evaluations are an extension of a quality Level of Service measurement. During an evaluation, each park’s performance is rated across six categories and 40 topics. The final product provides a weighted score from 0-100, with 100 being the highest possible score. Park scores can then be mapped and geographically evaluated for neighborhood-level and city-wide trends. The criteria is intended to objectively observe parks both individually and as a system. Parks and open spaces within the ‘taxing district and other parks’ typology were not included in park evaluations.
The criteria used is based in part on guidelines developed by Project for Public Spaces (PPS), a nonprofit organization dedicated to helping communities create and sustain public spaces that build stronger communities. For each question, parks are assigned a rating based on observation at the time of the park visit. Ratings are based on a scale of 1-5, with 1 representing the lowest and 5 representing the highest. A rating of “n/a” indicates that the criteria was not applicable and is not included in final ratings.
Ratings are based on observations made during a limited time period and are intended to provide information regarding trends for individual parks or across the park system only. Map C3 identifies individual evaluation scores across all City and School Park facilities. The following section details the scoring range of evaluations. The six categories of evaluation include:
• Design and Construction
• Effectiveness
• Condition
• Comfort and Image
• Access and Linkage
• Sustainability and Resiliency
Parks with scores in this category are defined as parks that have new or recently enhanced facilities or features, that are readily accessible through multiple modes of transportation, exhibit multiple features that enhance the comfort and experience of park users, and exhibit a maintenance quality that meets or exceeds standards of the city.
Parks with scores in this category are defined as parks that have serviceable facilities or features providing functional recreational access for the public, and are accessed primarily by vehicle with some connections to adjacent neighborhoods. These parks exhibit few features that enhance the comfort and experience of park users beyond a minimal recreational access capacity. They also exhibit a maintenance level sufficient for the uses in the park, but may benefit from additional maintenance.
Parks within this score category are generally defined as parks with facilities or features that have exceeded their functional life span and/or need enhancement or replacement to provide functional recreational access for the public. These parks exhibit few, if any, features that enhance the comfort and experience of park users and exhibit a maintenance level insufficient to continue to provide the desired uses and recreational access.
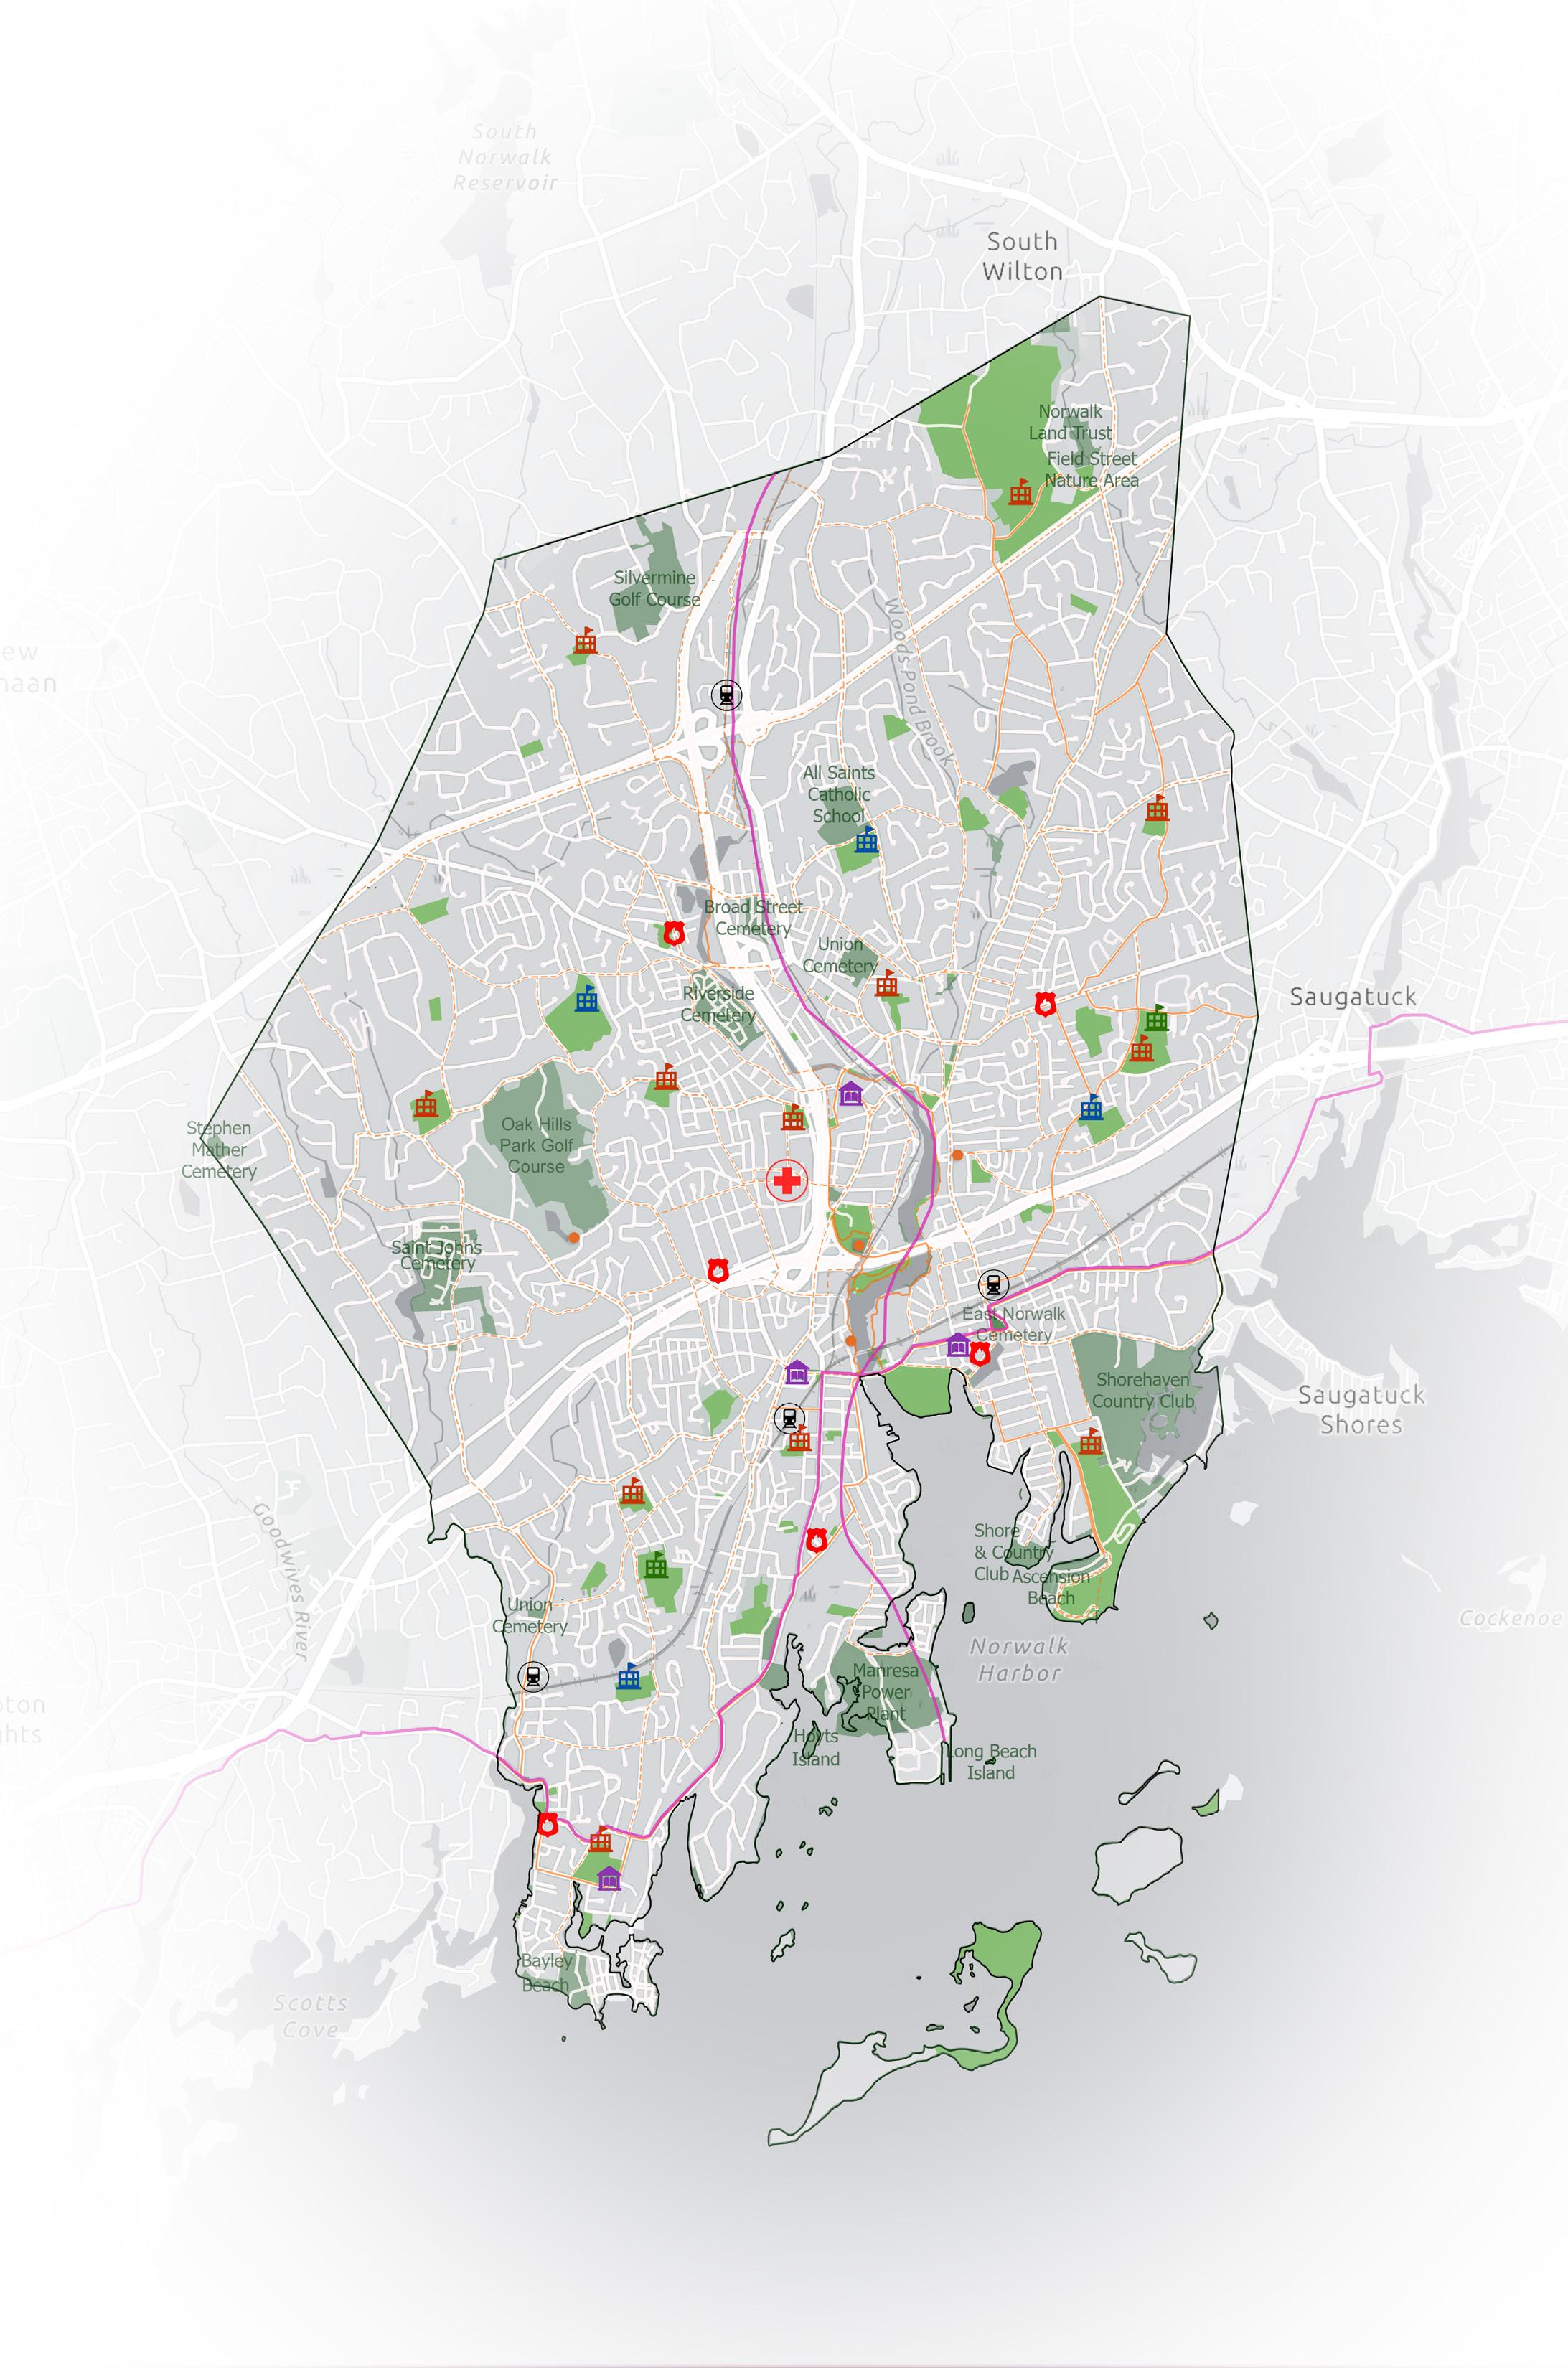
Figure C4
Average by Evaluation Category: Average by Park Typology:
Design & Construction 63/100
Effectiveness 65/100
Condition 68/100
Comfort & Image 66/100
Access & Linkage 59/100
Sustainability & Resiliency 45/100
Mini & Neighborhood Parks: 63/100
Community Parks: 63/100
Regional Parks: 73/100
School Parks: 61/100
Average Park Score: 64/100
Oct. 2021
Park evaluations across Norwalk, on average, meet expectations in all categories. Figure C4 identifies averages for each evaluation category and averages by park typology. Higher average scores represent strengths, lower scores represent opportunity for improvement.
Norwalk parks are well maintained in good condition, are comfortable to spend time in, provide effective open and recreation space, and score near average on design and construction. Despite these qualities, sidewalks, play equipment, and fields are in need of improvement as a result of time and thorough use by the community.
Sustainability and resiliency, the existing park system’s lowest scoring category, includes subheadings of social, environmental, and economic sustainability. Improvements to the overall parks system within this category could include increase gathering areas,
improvement of water quality prior to draining off site, connecting parks into larger ecological corridors, including educational signage or features, ability of park sites to generate private or public revenue, or ability of parks to promote or support permanent jobs. Access and linkage can be improved by increasing view lines into open space, increase consistent signage to and throughout larger parks, increase safe walking and biking park entries, recognize changes needed to modify space to accommodate people with special needs, connect parks to primary amenities, or connect parks to public transit routes.
Modifying existing parks to meet or exceed expectations is a priority in improving the overall parks system and also establishes a maintenance and facility baseline for future recreation and parks facilities.
The purpose of a Level of Service (LOS) Analysis is to quantify how well the existing parks system is meeting the needs of residents. The National Recreation and Park Association’s (NRPA) definition of LOS analysis is “an allocation mechanism for the delivery of park land and basic recreation facilities throughout a community. By adoption of such a standard, a community in essence says that all citizens
, [...], will have an equal opportunity to share in the basic menu of services implicit in the standard and accompanying spatial distribution and allocation of policies.”
LOS analysis was measured based on four concepts:
• Acreage (Amount of Park Land)
Every resident should have similar opportunities to park land.
• Facilities (Number of Facilities)
Every resident should have similar opportunities to use recreation facilities.
• Funding and Staffing
Every resident should enjoy comparable level of funding spent on capital and operations.
• Access (Distance or Travel Time)
Every resident should be able to access specific park facilities within similar walking, bicycling, public transit and/or driving distances.
• Norwalk currently provides parkland above national and peer community acreage LOS levels when other providers such as taxing districts are included.
• Current acreage LOS is 11.67 acres per 1,000 population compared to the City’s 1996 Master Plan’s standard of 12.0 acres per 1,000.
• Future acquisition of approximately 91.6 acres of parkland will be needed in order to maintain existing LOS standards.
• School parks represent approximately 32% of all city owned parkland in Norwalk.
• Norwalk provide a higher than national average number of seveal recreation facilities types, which may demonstrate a historically higher local demand.
• Future recreation facility needs include tennis courts, multipurpose fields, basketball courts, and playgrounds.
• Staffing levels are below peer communities (5.5-10.75 FTE) and significantly lower than national averages (56 FTE).
• Funding is approximately 2% below national averages for simular jurisdictions.
• Access to parkland is most limited in the perimeter neighborhoods of the city to the west, north and east.
• Access to all types of parks is best along the US Route 7 corridor through the City.

The most common way to measure LOS for existing acreage is number of park acres per 1,000 population in a community. What does this measurement mean? A general lack of national standards in definition of what should count as parks results in difficulty in comparing figures with peer communities or establishment of a national benchmark. Analysis, however, can identify local trends and result in standards that meet the needs and desires of residents for the long-term vision of the community.
Total park acreage estimates were determined for each park typology based on land ownership, management, and public access, Figure D1. With these estimates, an acreage LOS can begin to be analyzed. The best acreage LOS standard for the City is ultimately based on public input and what the community desires.
The current acreage LOS for Norwalk is 11.67 acres of park land per 1,000 population. This figure includes city owned parks, school parks, and park land that is public accessible by other providers such as taxing districts
and the Oak Hills Park Golf Course. Without these other providers of public park land, City owned park land is provided at a 9.6 acres per 1,000 population ratio. Both of these acreage LOS measurements are above NRPA averages for a park agencies serving a jurisdiction between a population of 50,000 and 99,999 which is 9.20 acres per 1,000 residents. The City’s 1996 Master Plan established a standard of 12.0 acres LOS.
Compared to peer communities, the City of Norwalk provides slightly less acreage of parkland per 1,000 (0.53 acres per 1,000 population less). However, when other providers are considered, Norwalk residents enjoy an acreage LOS above peer communities.
To maintain existing acreage LOS while Norwalk continues to grow in population, an additional 91.6 acres is needed by the year 2040. This additional acreage estimate is determined as the sum of additional park land across all park typologies with the largest portion needed in larger regional and community parks.
The second LOS measurement analyzes the provision of facilities on a per capita basis. From baseball fields at Calf Pasture Beach, to the many playgrounds across neighborhood parks, existing parks provide a wide range of recreation facilities.Similar to the acreage LOS analysis, there are no national standards for facility LOS goals. Each community’s provision of facilities is intented to meet local needs; however, the measurement can be utilized to compare Norwalk to national averages.
Facility LOS is determined by quantifying the number of facilities provided per capita. Data collected through park evaluations and from Department staff populated an inventory of existing recreation facilities. Figure D2 compares the City’s existing facilities to national
standards and projects needs for 2040 as the city continues to grow.
Results indicate that residents enjoy a surplus of recreation facilities when compared to 2022 NRPA average. Compared to national average, the City is only in need of additional volleyball courts (sand), pickleball court, and indoor space. Overall, the surplus of recreation facilities may indicate a historic higher local demand for recrecreation facilities. Having an above national average level of facilities also means the Department’s limited staff are maintaining a greater number of facilities which increases operational and maintenance costs per capita compared to national averages.
When projections in population growth are forecasted based upon 2022 LOS levels, a higher need compared to NRPA averages is identified for several facilities:
• Tennis Courts (4)
• Multipurpose Fields (3)
• Basketball Courts (3)
• Playgrounds (3)
The above recreation facilities types all would need three or more additional units by 2040 if LOS enjoyed by residents today are maintained. By maintaining existing facilities LOS as the city continues to grow or benchmarking local standard to national averages, both actions would result in the need for select types of recreation facilities. Other providers, such as local taxing districts are examples of partnerships that can provide public access to recreation amenities without duplicating facilities.
level of need
The third LOS measurement analyzed was staffing and funding. Figure D3 identifies developed acres per full-time equivalent (FTE) staff member, FTE per 10,000 residents, and expenditures per capita compared to national and peer averages. This measurement method helps to identify how Norwalk is funding and staffing parks and recreation facilities compared to other providers.
Staffing is the primary area where the Department is below national and peer community averages. Based upon analysis of FTE staffing levels on a per acre and per 10,000 residents measurement, the Department is deficit of between 5.5 and 10.75 FTE positions when compared to peer communities. National averages indicate an even larger deficiency of staff with 56 FTE positions needed to met the average number for agencies managing park systems for jurisdictions between 50,000 and 99,999 populations. As of 2023, below is a comparison of the number of residents per FTE position:
• City of Norwalk: 1 FTE per 2,941 residents
• Peer Communities Average: 1 FTE per 2,252 residents
• National Average: 1 FTE per 1,041 residents
Analysis of expenditures indicates a more complex situation for the Department. Compared to peer communities, Norwalk receives 21-18% higher funding for capital projects and operations. As noted with the Facilities LOS analysis, one potential reason for the Department receiving more expenditures than peer communities is the high number of recreation facilities per capita, which include school parks. Additionally, it is important to note, determining precise expenditure amounts for peer communities are complicated in many cases by having Park and Recreation Departments within Public Work Departments, similar to Norwalk. Full cost associated with park and recreation only projects and operations can be difficult to fully and accurately delineate.
On a per capita measurement, the Department’s historical funding level over the last ten years has averaged approximately 2% less than national averages for similar sized park agencies.
The final LOS analysis is related to access to parks and recreation facilities. This measurement answers the vital question, How well can residents get to parks? This is typically measured as a distance, either in miles or travel time. Being able to analyze access to parkland and recreation facilities is important for Norwalk for the following reasons:
1. The City provides an above-average amount of parkland to residents compared to peers, but not all residents share in ease of access.
2. As shown in the demographic analysis, the City is segregated racially and ethnicity by neighborhoods. Ensuring each neighborhood has access to parkland and recreation opportunities is an important step toward improvements in social inequities.
Access LOS can be analyzed by using the City’s GIS street network data to measure respective travel distances (½ mile, 1 mile, or 3 miles) from each park entrance. This creates each park’s or recreation facility’s service area, or the area in which someone could walk, bike, or drive a reasonable distance to each. Pocket parks and neighborhood parks often have minimum to no parking and smaller programed areas, as they are meant to serve immediate residents; therefore, walking and biking distances are primarily used with these types of parks.
Larger parks or sports facilities are designed to accommodate larger numbers of visitors and, due to their uniqueness and cost to construct and operate, frequently serve a larger area of the community with an expectation that visitors drive, carpool, or take transit to these facilities. Natural barriers such as the Norwalk River or Silvemine River, and man-made barriers such as I-95 impact the service area for each park or recreation facility and are included in the analysis. The result is a series of true walkshed, bikeshed, and driveshed for each facility. Distances used for each park typology are based on typical ½ to 1 mile walking range for mini, neighborhood, and community parks. A 10 minute walk translates into a ½-mile distance while a 20 minute walk
Peer Communities:
Hartford - 99%
New Haven - 96%
Stamford - 77%
Waterbury - 60% Danbury 37%
Percentage of the community within a 10-min walk (within 1/2 mile of a city park)
Percentage of the community within a 20-min walk (within 1 mile of a city park)
40% 69% 82%
Percentage of the community within a 15-min bike ride (within 3 mile of a regional park)
is typically a one mile distance. The ½-mile distance also translates into an average 5 minute bike ride. Regional parks and the sports facilities typology rely upon access by biking, driving or transit. Because of this, they are evaluated by a larger, 3 mile service area or a 15 minute bike ride.
Areas outside color shaded service areas are not considered to have reasonable access to the identified park or facilities. Taxing district parks have been included in this access LOS analysis under ‘Other Parks’ because of their location within the city limits.
Figure D4 identifies the geographic percentage of the city within three distances: 10-minute or 1/2 mile walking distance; 20-minute or 1 mile walking distance; and 15-minute or 3-mile bike ride. Analysis identifies that 40% of residents in Norwalk are within a 10-minute walk to a local park. Understanding context is important in determining whether this measurement is good or bad. The average percentage for peer communities for 10-minute access to parks is 74%, indicating Norwalk has substantial room for improvement in providing neighborhood-level connectivity to parks. As the measurement distance increases to a 20-minute walk, access increases to 69% of the city’s geography, and again as the distance is increased to a 15-minute bike ride or three miles, approximately 82% of the city is within access of a park.
The maps following the conclusion of this section present Access Service Areas by park typologies:
Map D5: Existing Park LOS
Map D6: Neighborhood and Pocket Park LOS
Map D7: School Park LOS
Map D8: Taxing District & Other Park LOS
Map D9: Community Park LOS
Map D10: Regional Park LOS
Map D11: Neighbhorhood, Pocket Park, and School Parks LOS
Map D12: Neighbhorhood, Pocket Park, School Parks, and Community Parks LOS
Map D13: Existing Parks 1/2mi LOS
Analysis based on park typologies shows overall park access is most limited to perimeter neighborhoods in the west, north and east areas of the city. Parks accessible by walking or biking are concentrated in
the central neighborhoods of the city closest to the downtown area, and larger regional parks primarily serve neighborhoods closer to US Route 7.
Additional maps show access LOS of specific facilities within park space:
Map D14: Baseball & Little League Field LOS
Map D15: Softball Field LOS
Map D16: Play Equipment LOS
Map D17: Restroom LOS
Map D18: Athletic Fields LOS
Map D19: Tennis Courts LOS
Map D20: Basketball Courts LOS
LOS analyses are measurements intended to evaluate the existing park system through comparison or service area. Through these measurements, Norwalk has been identified as meeting or exceeding acreage and facilities per capita averages, specifically when compared to peer communities. As the city continues to grow, it will be important to continue to invest in additional parkland and recreation facilities to maintain LOS measurements.
Two measurements identified potential areas of need for Norwalk: staffing and access LOS. Norwalk is significantly below peer communities and national average for staffing. In addition, funding on a per capita measurement is also below national averages (2%) for jurisdictions the same size as Norwalk.
Analysis of access to parks identifies that Norwalk trails peer communities when it comes to providing park space within a 10 minute walk of all residents 40% for Norwalk compared to 74% for peer communities. Access does improve as the distance to parks is increased; however, on average, less than 10% of the public is typically willing to walk more than 10 minutes to a park.

Taxing Districts and Other Parks and Open Spaces:
Pond Brook
Street Park
Creek Park
Park
Hill
Park
Garden Open Space
Water Park
Run Open Space
Nature Preserve
Wall
Park
The Department’s recreation programs and services were evaluated through a series of data analysis, conversations with staff, a staff survey, and the results from the community needs survey.

In support of the Department’s efforts in developing high quality programs, the recreation assessment is intended to provide best practices to recreation program development and delivery of services. The goal of the assessment is to help develop a strategic vision for program delivery, identify any gaps, and pursue opportunities to strengthen programming for the community. The following key tasks were completed:
• Inventory of programs
• Age segmentation of programs
• Distribution of the types of programs
• Life cycle analysis
• Review of similar providers and duplicative services
• Staff and community engagement
Some of the assessment components reviewed multiple years of data. It should be noted that performance trends in these instances were all impacted by the COVID-19 pandemic in 2020. Additionally, the single-year assessment components used data from 2019 in lieu of the most recent fiscal data.
• Continue to explore ways to diversity the Department’s core program areas beyond the current five: aquatics, camps, youth sports, cultural, and adult leagues.
• The Department currently lacks development and implementation of an annual program plan to identify age segments, recreation interests, and meeting community programmatic needs.
• The absences of access to flexible indoor space is a significant barrier to developing new and expanded programming opportunities.
• Department needs resources to identify and pursue additional partnerships, leasing opportunities, and/or acquisition opportunities for additional indoor space.
• Department is currently in process of executing a JUA with Norwalk Public Schools and will need resources to monitor its implementation, review and adjust terms as needed, and utilize access to additional indoor space.
• The Department is currently completing a cost recovery study to determine a consistent philosophy and set of goals.
• Survey results indicate a strong level of support (68.6%) for additional user fees or charges for programming and events. Support increases for households with children, representing a recognition of value.
• Team and outdoor sports are most desired activities for youth (under age 17), while fitness, aquatic, and outdoor sports were primary desired activities for adults.
One of the Department’s key service areas is the delivery of recreation programs. Categorizing these programs into core program areas helps the Department staff organize the administration of likeservices and also helps the community understand the leisure opportunities in an organized manner. The Department had three core program areas in 2019: Aquatics, Camps, and Youth Sports. In the subsequent years observed, staff continued to expand and diversify its program menu to include Adult Leagues, Aquatics, Camps, Youth Sports, and Cultural. This growth demonstrates a commitment to continuous improvement, and a desire to continue to provide for the needs and desires of the community.
Out of 44 programming options most typically offered by public park agencies, the peer communities were found to offer roughly 65% of total options. For the City of Norwalk, program offerings are only 9% of options. This represents a significant list of potential programming options to offer where community needs align with department mission and goals.
Understanding how the Department’s enrollmentbased program menu is distributed across the core program areas helps to identify the extent of programming within each program area in relation to the whole. Figures E1 and E2 depicts the total of programs offered in 2019 and 2022 according to program area.
The program menu consisted of three core program areas in 2019: Aquatics, Camps, and Youth Sports. The large majority of classes were offered in Aquatics (90.6%). Department staff made significant changes to the program menu between 2019 and 2022 expanding into five core program areas: Adult Leagues, Aquatics, Camps, Youth Sports, and Cultural. This shift diversified the program menu, as depicted in Figure E2

More than half (52.8%) of programs were in Aquatics in 2022; while a significantly lower percentage than three years prior, Aquatics continues to dominate the program menu. Camps accounted for over one-third (36.4%) of programs in 2022, a significant shift from the 4.8% in 2019.
5.6% Youth Sports
90.6% Aquatics
36.4% Camps
3.7% Cultural 1.4% Adult Leagues
4.8% Camps 52.8% Aquatics

The age segment analysis reviews the distribution of the program offerings according to the age segments serviced. For the purposes of this assessment, two age segments were defined based upon program offerings: youth (age 18 of less) and adult (age 19 and older). In 2021, 97.8% of programs offered were for youth, and 2.2% of programs offered were for adults. While recreation providers typically offer more youth than adult programming, the dichotomy between the Department’s aged-based offerings is quite high. While many programmatic growth opportunities exist for the Department, reaching the needs of adults should be a key age-based demographic target in the near future.
is more likely to result in a higher potential of market capture (e.g., the adult category displays a current 77.5 percentage-point difference).
While this is only one way to analyze programming, it is a very helpful tool in identifying who the Department is serving. Other considerations need to be reviewed, such as programming being provided by other local providers (i.e. senior programming) and community demand. Additionally, public engagement can be conducted on a regular basis by Department staff to gauge community interests in programming. During focus group meetings and stakeholder interviews conducted as part of the this master plan, programming for teens and multi-generational opportunities was specifically identified as a need. The age segmentation clusters all adults between the ages 18+ as a single group, but as future programming for adults is developed, specific sub-groups needs may be considered. An important consideration by Department staff is to avoid over-saturating the market with high quality products and services that are already supplied by other providers.
In addition to assessing the menu of programs as offered, it is helpful to assess how the programs actually perform. In this analysis, the extent of program performance was measured using participation metrics, see Figure E4.
The segmentation review can be used to assess the extent to which each age group is being served. The segmentation does not necessarily need to mirror the community’s age demographic segmentation in an exact manner; however, an ongoing goal can be to balance the menu toward a reflection of the community makeup.
As the Department considers opportunities for program expansion, Figure E3 can help identify target age segments for enhancements, additions, and/ or innovations. Extending the enrollment-based programmatic reach to those age segments that have the highest spread between offerings and population
Total enrollment into the Department’s programs was 4,160 in 2019, a year that demonstrates pre-pandemic participation levels. Participation in 2020 was significantly reduced due to the pandemic and aligns with nationwide participation trends. The gradual increase between 2020 and 2021, and the great start to 2022’s registration figures indicate a solid recovery and continued trajectory to pre-pandemic participation levels.
Participation in aquatics and youth sports program areas have consistently been stronger than the other program areas. While aquatics participation was highest in 2019 aquatics, camp participation outpaced the other areas in 2021.
A positive shift from 2019 to 2022 was the Department’s reach to more age groups. Unlike 2019, where participants ranged from age 5-15, 2022 participants spanned age 4-18+.
The large quantity of 2022 participants (160) that did not provide their age demonstrates an opportunity to track participants’ demographic data more closely. Without key data points like age, it is difficult for staff to make data-driven decisions.
A recreation programs SWOT analysis of the Department observed the following key findings:
The Department is known for its swimming lessons. User fees are low, and the Department has a reputation for delivering a good product. Youth and adult sports opportunities are provided both in-house as well as facilitated for affiliate groups. The summer camp program an area of growing strength.
One of the biggest challenges the Department faces is a low number of programming staff. There was a time when the Department employed more than 20 full time staff; at the beginning of the recreation assessment, there were four. Additionally, the Department has access to limited indoor programming space to conduct recreation programs. The Department currently hold programs at two school-owned sites, a community room, and a barn.
An improved relationship with the school district could help increase community access in a more consistent manner. New Department staff offer a promise of potential program menu growth. As program offerings grow, there is an opportunity to communicate the programs and activities in a more comprehensive listing, such as a catalogue. Developing new partnerships can broaden the Department’s ability to reach residents’ needs.
Changes to the facilities where the Department currently holds programs can directly impact its ability to provide services. Natural forces are causing and continue to threaten beach erosion.
The community needs assessment survey provided insight to residents’ recreation programs needs and desires. Following are key takeaways from survey results:
• Nature enjoyment had the top importance rating as well as the highest unmet need rating, which resulted in nature enjoyment being the highest Priority Investment Rating activity. These are atypical results compared to other communities (35 percentage points higher than the national average) and therefore stand out as the largest programmatic gap and opportunity.

• Compared to the national averages, the survey respondents indicated a low percent of program participation (12 percentage points lower than the national average) in the last year. This result aligns with the number of recorded participants, and
number of opportunities currently available to the community.
• Not knowing what is being offered was the largest reported barrier to participation.
• Department staff had observed that its user fees were low; the survey respondents’ willingness to pay results indicate that 67% would be willing to pay for activities important to their household.
• Another stand-out result of the survey was that two-thirds of respondent households with a need for special recreation have unmet or partly met needs. This equated to approximately 1,073 households with a need for special population recreation program opportunities.
This section addresses key areas of best practices for recreation programming including the following attributes: quality standards, customer requirements, key performance indicators, and cost recovery goals. Additionally, marketing, customer satisfaction, staffing levels, and equity are reviewed as an opportunity to align with benchmark agencies.
A key to developing consistent services is the use of service and program standards. The use of standards provides a more consistent service experience. As program growth continues, and as staff time permits, standards can be deployed throughout the entire recreation program system, such as customer requirements, instructor standards, safety, staff training and development, and program quality.
In addition to standards, efforts should be made to develop a listing of key customer requirements for core program areas. Key customer requirements are defined as those areas of the program purchasing process that are most important to registrants. For example, an adult softball player’s key requirements may include cost of the league, quality of athletic field maintenance, cleanliness of restrooms , access to free parking, quality of the umpires, game times, and location of the field. Identifying key requirements is important for staff to deliver in the items most
important to the customer. This also reinforces key elements of service that staff should become familiar.
Another area of strengthening includes the development of key performance indicators. Organizations that measure performance also have a documented process in place to ensure follow through on results. A robust measurement system generally includes a more comprehensive set of measures, including:
• Number of programs per age segment
• Customer satisfaction (Details are included in the next section)
• Cost recovery rates by core program area
• Number of new programs offered annually (to drive innovation)
• Number of program cancellations
• Household percentage of program participation
• Percent of programs in introduction and growth stage
• Customer retention, repurchase intent, and referral
The Department could benefit from a marketing plan to create promotion strategies for core programs and events. A plan can start out simple and evolve over time as participation and staffing levels increase. As a starting point, a simple marketing plan could include answers to the following questions:
• Who are you? Conduct brand development sessions with staff and public.
• What do you want to achieve? Overall development of marketing goals with staff.
• Who are they? Identification of target markets.
• How will we connect with them? Develop channels to communicate to the appropriate market segments.
• How do they want to be communicated with? Develop content guidelines for each channel.
• How are we doing? Define evaluation methods with staff.

One of the primary recommendation of the Formula 2040 Parks, Recreation, and Open Space Master Plan for Prince George’s County was a transition from the existing model of smaller neighborhood community centers at approximately 20,000sqft to larger multigenerational community centers meant to serve multiple neighborhoods as well as facilities for the entire family. Creating large and more diverse facilities decreases the total number of facilities needed across the county because they better serve immediate residents. Service areas established within the master plan are oriented by travel time rather than jurisdiction of any kind, and then ranked by priority of need for a new community center. Following the master plan, feasibiltiy studies have been completed for each service area to identify details that will impact the form and recreation typologies for each new or improved location. These factors include: urban or suburban context, specific local demographics and public engagement, business opportunity, and project site.
The publication of a seasonal program guide is part of a greater strategy for communicating program opportunities. Combined with posts to websites, email, social media, and community presentations, the program guide is one way to publicize programs, activities, policies, and events. It is also an opportunity to highlight staff and advertise for staff that are needed. Even as different communities may have different preferences for how they receive program information, program guides continue to be the most widely preferred method for recreation program participants, regardless of location or size of the agency. According to NRPA research, 76% of park and recreation agencies print a program catalogue or guide promoting their offerings.
It is important to follow best practices when creating a program guide including:
1. Maximize the return on investment (ROI) from the guide through offering various registration tools, times, etc. Recreation departments should make it as easy as possible for customers to enroll in programs and events.
2. Welcome notes and letters to customers should not be placed on the front or back covers or on the first few pages – these are prime spaces for attracting participants to new programs or services.
3. Program descriptions should follow the five “C”s to attract participants:
• Clear – be clear in the broad sense. Describe programs in a way that does not limit the instructor: “this class may include crafts and music projects”.
• Concise – do not use phrases like “This class will…” or “You will learn…”. Assume that the reader knows the program will be fun – do not include. Do not include the age in the title or in the body of the description – it should be included in the activity category or with program details such date, time, location, and fee.
• Creative – use different descriptive works and try not to repeat the same words often.
• Consistent – confirmation information should be at the end of the description. For example: “Bring sunscreen and a hat”.
• Catchy – each program description should be unique. A customer should not have to look at a page of activities that all start in the same manner.
4. An automated registration system that is easy to use is important. The Department has struggled with RecTrac and recently sought out a new system. An automated system should not only be easy for the customer to use but provide easy data reporting for staff.
5. Distribution of the program guide – best practices call for direct mail. Recreation departments need to be aware of the printing cost and potential perceptions around environmental issues when printing large quantities of program guides. Some organizations are now using QR codes within their guides to reduce that amount of text and include fewer pages.
6. Selling advertising space is a good option to offset the cost of the printing and mailing a guide.
It is important to have a process in place for program participants and staff to continually evaluate the programs and events provided to the community. Comment cards with survey questions to rate the quality of the programs can work well to gauge satisfaction. Performance measures, developed by staff, can be a very effective in driving a program that continually improves. As staff develop and manage programs, the following questions can be considered:
• Is participation increasing or decreasing? If participation is increasing, that could mean that the program should continue. If participation is decreasing, are there steps to take to increase interest through marketing efforts, changes to time/day of the program, format, or instructor? If not, it may be time to discontinue the program.
• Is there information contained in the participant/ staff feedback that can be used to improve the program?
• Are cost recovery goals being met? If not, can costs be reduced or can fees be increased?
• Is there another program provider that is more suitable to offer this program? If yes, the Department could provide referrals for its customers.
• Is the program taking up valuable facility space that could be used for expansion of more popular programs or new programs in demand by the community?
Agencies across the nation are finding ways to help ensure their programs and services are being provided in an equitable manner. Whether via geographic location, target audience, or diverse interests, continuing to assess and analyze service offerings through a diversity, equity, and inclusion lens is a best practice the Department can strengthen in both analysis and implementation.
One key area identified for improvement is the best practice of offering inclusion and/or specialized services for participants with special needs. Municipal departments are often the sole providers of therapeutic recreation for a community.
Department staff also defined a need for an equitable field allocation system. With limited fields and resources, the current “historical use” system does not foster an equitable opportunity. Staff also felt there is an opportunity to have the Department’s materials translated into Spanish.
Best practice agencies have identified cost recovery goals for core program areas. The goal can be calculated from actual performance in the three most recent years’ financial results by core program area. This should be accompanied by a cost-of-service study to determine indirect charges and identification of true costs of service. Currently a consistent methodology is not in place, however, the Department is undertaking a cost recovery study and is expected to be complete is 2023. Figure E5 identifies levels of support for additional user fees or charges, showing there is a high level of value recognized by users.
The results of the statistical survey (Appendix 3) were reviewed as a means to refine the similar provider review’s focus. A product of the survey are Priority Investment Ratings (PIR) which are intended to help organizations determine where to focus resources to make the greatest impact. The PIR equally weighs the importance that a respondent places on a program type and how many respondents have an unmet need for that program. The highest rating is weighted to a score of 200 with lower scores representing a lower priority investment rating. The top eight program types for Norwalk with the highest PIR include:
• Nature Enjoyment (PIR: 200)
• Fitness & wellness (PIR: 138)
• Special events/festivals (PIR: 133)
• Senior activities (PIR:132)
• Performing arts (PIR: 128)
• Aquatics (PIR: 119)
• History & museums (PIR: 118)
• Water-related activities (PIR: 111)
Similar providers have been identified and are available to review in greater detail in Appendix 5 for each of the eight priority investment areas above.
In the areas of performing arts and fitness, the public and non-profit sectors are providing a plethora of opportunities. The Department should consider becoming a resource for community members to find the programs they are seeking. By utilizing the information included in this report and adding to it each year, the Department could refer people where they can find their desired recreation opportunities. Another opportunity for the Department would be to partners with some of these businesses and nonprofits to offer programs and events to meet expressed community needs.
It is important to understand national trends with recreation and leisure interests and programming over the last ten years. However, an important note is that each community is unique and the region of the country has a bearing on trends and other operational factors.
Changing trends in recreation and leisure have resulted in an increase in demand, a desire for inclusiveness, a cost-effective approach to service delivery, and the need for measurable outcomes. In an effort to respond to these trends, agencies have developed strategies to become more efficient and effective with the delivery of services, in order to respond to challenges unique to changing recreation needs. Table E6 identifies recreation and leisure activity trends nationally.
Trends in recreation, in addition to populationbased measurements, should be considered when identifying future programming needs for parks. The following section summarizes regional and national trends that are relevant to Norwalk based on the outcomes from the public engagement and statistically valid survey. The trends topic areas are tailored to focus on the eight high priorities for investment for activities based on the (PIR).
A wide variety of sources were used in gathering information for this report, including:
• American College of Sports Medicine (ACSM)
• American Council on Exercise (ACE)
• American Planning Association
• Center for Disease Control and Prevention
• City Parks Alliance
• Forbes
• National Recreation and Park Association (NRPA)
• The Aspen Institute
• The Learning Resource Network (LERN)
• The New York Times
• The Outdoor Industry Association
Fitness/Wellness
Youth lacrosse, adult soccer, adult cricket, youth/adult rugby, pickleball, youth camps/clinics, individual sports (fencing), adventure/non-traditional (BMX, mountain biking, disc golf, ultimate frisbee), youth sports specific training
Functional training classes, personal/small group training, yoga, nutrition, healthy lifestyle education, drop-in pay as you go classes, more Saturday class, introduction of some Sunday classes
Cultural
Youth
Music production for youth, digital media, programs oriented toward specific ethnic groups
Before/After school programs at recreation centers (specifically summer camps), nonschool day events, extended break events/ programs.
Education Camps
Outdoor Eco-tourism, environmental education
Seniors
Fitness/Wellness, Baby Boomer focused activities
Aquatics Therapy, triathlon training
General Interests
Special Events
Personal finance
Family-oriented community-wide events; outdoor dining, farmer’s markets, movie nights, Halloween/Christmas walks
Playing in nature is an educational opportunity that has numerous benefits, from increasing active and healthy lifestyles, to developing a conservation mindset, to understanding the ecosystems and wildlife that depend on them. According to the report, “Nature Play & Learning Places: Creating and Managing Places where Children Engage with Nature,” there is a genuine need for learning spaces that spark creative play with natural materials, such as plants, vines, shrubs, rocks, water, logs, and other elements (2020).
Richard Louv introduced the term, “Nature-Deficit Disorder” in 2005, which describes the effects of urbanization, technological advances, and social changes. Scientific evidence suggests that this disorder contributes to emotional and physical illnesses, including attention difficulties, obesity, nature illiteracy, and an “epidemic of inactivity.”
Environmental education, provided by non-profits and parks and recreation agencies, can help combat nature-deficit disorder by sparking curiosity in the outdoors either through structured nature programming or through unstructured nature play. Nature Play is defined as “A designated, managed area in an existing or modified outdoor environment where children of all ages and abilities play and learn by engaging with and manipulating diverse natural elements, materials, organisms, and habitats, through sensory, fine motor and gross motor experiences.”
Nature Play spaces can provide valuable lessons for children, not only regarding learning their natural environment and appreciation for nature, but also for personal development. These spaces, like playgrounds, provide safe spaces to take risks and understand behavioral outcomes. One of the most essential elements in planning nature play spaces is to conduct a risk assessment to reduce the unnecessary potential of injury. For instance, natural objects such as logs and boulders may be placed strategically for climbing but consider where the child might land if he or she were to fall or jump off. Similarly, trees can be used as natural climbing features, with consideration to removing shrubs and nearby smaller trees below. Nature Play can happen in forest-based schools, play zoos, gardens, and summer camps. American Camp Association reported that there are approximately 5,000-day camps that currently operate in the U.S.
Fitness & Wellness: Each year, the ACSM conducts a survey of worldwide fitness trends. Now in its 16th year, the ACSM circulates an electronic survey to thousands of fitness professionals around the world to determine health and fitness trends. The list below includes the top 10 fitness trends for 2022.
Wearable Technology: Wearable technology, which includes activity trackers, smartwatches, heart rate monitors, GPS tracking devices, and smart eyeglasses
(designed to show maps and track activity), has been one of the top three trends since 2016. Examples include fitness and activity trackers such as those from Misfit, Garmin, Pebble Time, Samsung, Basis, Jawbone, Fitbit, and Apple. These devices can track heart rate, calories, sitting time, and much more. It is estimated that wearable technology is a $95 billion industry.
Home Exercise Gyms: The trend in home exercise gyms has risen because of the COVID-19 pandemic and it is expected for this trend to continue. Home gyms allows participants to choose what equipment they invest in at various price points and can be used by individuals or as a family. However, for this trend to continue it is noted that home gym businesses will need to lower equipment costs to keep participants working out at home instead of a gym outside the home.
Outdoor Activities: Likely because of the COVID-19 pandemic, outdoor activities such as group walks, group rides, or organized hiking groups are gaining in popularity. These can be short events, daylong events, or planned weeklong excursions. Typically, people meet at a local park, hiking area, or bike trail with a designated leader. This trend for health and fitness professionals to offer outdoor activities to clients began in 2010 and has been in the top 20 ever since 2012. This has become much more popular the past several months as agencies work to offer fitness programs outdoors that help to ensure physical distancing.
Strength Training with Free Weights: Strength training remains popular in all sectors of the health and fitness industry. Free weights, barbells, kettlebells, dumbbells, and medicine ball classes do not just incorporate equipment into another functional class or activity. Instructors begin by teaching the proper form and technique for each exercise and then progressively increase the resistance. New exercises are added periodically, starting with proper form and technique. Many younger clients of both communitybased programs and commercial clubs train almost exclusively using weights. In today’s gyms, however, there are many others (men and women, young and old, and patients with stable chronic diseases) who use weight training to improve or maintain strength.
Exercise for Weight Loss: Another trend that has increased because of the COVID-19 pandemic is exercising for weight loss. This trend has been top 20 since the beginning of the survey, but peaked at number five in 2022, a rise from number sixteen in 2021. Participants are moving towards this trend because the pandemic caused perceived or real weight gain and diet programs generally recommend supplementing with exercise.
Personal Training: Personal training is a one-onone workout with a trainer that begins with fitness testing and goal setting. The trainer then works with the client and prescribes workouts specific to their needs. The profession of personal training is becoming more accessible online, in clubs, in the home, and in worksites that have fitness facilities. Many fitness centers continued to offer personal training during the COVID-19 outbreak. Since this survey was first published in 2006, personal training has been ranked in the top 10.
High-Intensity Interval Training (HIIT): HIIT involves short bursts of high-intensity exercise followed by a short period of rest or recovery and typically takes fewer than 30 minutes to perform (although it is not uncommon for these programs to be much longer in duration). HIIT has been a top five trend since 2014. Despite warnings by some fitness experts of the potential for increased injury using HIIT, this form of exercise is popular in fitness centers all over the world.
Body Weight Training: Body weight training uses minimal equipment, which makes it an inexpensive way to exercise effectively. Although most people think of body weight training as being limited to pushups and pull-ups, it can be much more than that. This type of training first appears in the trends survey in 2013 at number three.
Online Live and On-Demand Exercise Classes:
Previously this trend has been to “virtual online training” or “online training”, however this was changed in 2022 to specify what type of online classes are trending. COVID-19 forced closures of exercise programming in many spaces which resulted in an increase in online training for at home exercise
classes. This trend can be offered live or prerecorded to groups and individuals. Prerecorded sessions offer participants the chance to partake in these classes no matter what their schedule may be.
Health and Wellness Coaching: Health and wellness coaching bridges behavioral science by promoting a healthy lifestyle and programs to support that lifestyle. Typically, this coaching is one-on-one, and coaching consists of goal setting and providing support, guidance, and encouragement. The coach focuses on the specific needs and wants of the participant’s lifestyle and values.
Special Events/Festivals: Special events and festivals often act as essential place-making activities for residents, economic drivers, and urban brand builders. This phenomenon is described in Governing Magazine: “Municipal officials and entrepreneurs see the power of cultural festivals, innovation-focused business conferences and the like as a way to spur short-term tourism while shaping an image of the host city as a cool, dynamic location where companies and citizens in modern, creative industries can thrive” (2013).
According to the 2022 Event Trends Report by Eventbrite, the following trends are expected to impact event planners and community builders in the coming years:
• Strength in Diverse Communities: The pandemic built a different source of community through virtual events. Virtual events enabled audiences to expand in terms of being able to include broader reach to different ages, ethnicities, geographic locations, rural communities, and those who are differently abled. Event organizers are also looking to diversify entertainers and presenters.
• Go Green: The trend of hosting “green events” is a popular one for many communities. Although the pandemic impacted responses around making events environmentally friendly a priority, with a return to in person events it will certainly make a turn around. Virtual events have had a major impact on the carbon footprint of events. In a 2021 Nature Communications study, they found that virtual events decreased those footprints by 94% and energy use was cut by 90%.
• Optimism, Resiliency, and Creativity: Event organizers are still feeling some uncertainty around a resurgence in COVID-19 cases, however 75% of respondents indicated they are optimistic about future events. The pandemic has left organizers feeling more adaptable, innovative, and creative. Half of organizers around the globe indicated COVID-19 made their teams more resilient.
A Pew Research Center survey found that 73% of adults consider themselves lifelong learners. Do-ityourself project classes and programs that focus on becoming a more “well-rounded” person are popular. Phrases such as “how-to” can be added to the agency website’s search engine optimization as consumers now turn to the internet as their first source of information regarding how-to projects. Safeguarding online privacy is also a trending course.
Fitness and Wellness: Programs such as yoga, Pilates, tai chi, balance training, chair exercises, and others continue to be popular with older participants.
Encore Programming: This is a program area for baby boomers who are soon to be retired and focuses on a broad range of programs to prepare people for transitions into retirement activities. Popular programs for 55+ market include fitness and wellness (specifically yoga, mindfulness, tai chi, relaxation, personal training, etc.), drawing and painting, photography, languages, writing, computer and technology, social media, cooking, mahjong, card games, volunteering, and what to do during retirement.
Specialized Tours: Participants are looking for more day trips that highlight unique local experiences or historical themes. For example, a focus on authentic food, guided night walks, bike tours, concentration on a specific artist’s work, and ghost walks are among the themes being sought out.
Creative Endeavors: Improv classes are specifically targeting age groups with classes that promote creative endeavors. Workshops and groups help seniors play, laugh, and let loose while practicing
mental stimulation, memory development, and flexibility.
Performing Arts and Cultural Programming: The statistical survey results indicated residents are seeking more opportunities to engage in performing arts, history, and museums. Agencies across the country use indoor and outdoor facilities for art, cultural, musical experiences. Parks and recreation professionals and artists partnering create a community atmosphere that bolsters creativity and accessibility while encouraging physical activity. The Centers for Disease Control and Prevention (CDC) recommends the following strategies for building these partnerships:
• Join community-based groups that plan and develop projects designed to make an activityfriendly community.
• Partner with community-based groups to increase the use of parks by adding design elements that reflect local cultural traditions.
• Include creative place-making when developing a strategy for community development. Creative place-making integrates arts, culture, and design into public spaces to promote well-being and increase physical activity.
• Create inclusive ways for community members to be involved with community development decision making.
The Connecticut Office of the Arts has several initiatives dedicated to supporting the arts across the state which is supported by various programs, grants, resources, and partners. Some of the partners they work with include The CT Arts Alliance, Cultural Alliance of Fairfield County, RiseUP, and several other regional groups including Greater Hartford Arts Council, Cultural Alliance of Western Connecticut, Arts Council of Greater New Haven, etc.
Pool Design: Municipal pools have shifted away from the traditional rectangle shape, and instead have shifted to facilities that include zero-depth entry, play
structures that include multiple levels, spray features, small to medium slides, and separate play areas segmented by age/ability.
Indoor warm water therapy pools continue to grow in popularity with the aging population, creating a shallow space for low-impact movement at a comfortable temperature enables programming options to multiply. “Endless” or current pools that are small and allow for “low-impact, high-intensity movement” are becoming popular, as well.
Water Fitness: The concept of water fitness is a huge trend in the fitness industry, with many new programs popping up such as aqua yoga, aqua Zumba, aqua spin, aqua step, and aqua boot camp. Whether recovering from an injury, looking for ease-of-movement exercise for diseases such as arthritis, or simply shaking up a fitness routine, all demographics are gravitating toward the water for fitness. Partnerships can be important for parks and recreation agencies, such as working with hospitals to accommodate cardiac patients and those living with arthritis or multiple sclerosis.
Spray Parks: Spray parks (or spray grounds) are now a common replacement for aging swimming pools, particularly because it provides the community with an aquatic experience without the high cost of traditional pools. Spray parks do not require high levels of staffing, require only minimal maintenance, and offers the community a no-cost (or low-cost) alternative to a swimming pool. A spray park typically appeals to children ages 2 – 12 and can be a standalone facility in a community or incorporated inside a family aquatic center.
Water-Related Activities: Each year, the Sports and Fitness Industry Association (SFIA) releases a Sports, Fitness, and Leisure Activities Topline Participation Report. The SFIA report indicates that water sports had the largest overall growth in participation among all seven sports categories.
Between 2020 and 2021, the water sports with the highest overall growth were boarding sailing/ windsurfing (+9.9%), kayaking – sea/touring (+5.6%), and water skiing (+4.7%). The water sports that experienced the highest decreases in participation
between 20202 and 2021 were kayaking – recreational (-14.6%), canoing (-6.4%), and sailing (-3.6%).
Each year, the NRPA publishes an article about industry trends and predictions in Parks and Recreation Magazine. In the 2023 edition of the article, Top Trends in Parks and Recreation for 2023 (written by Richard Dolesh—former Vice President of Strategic Initiatives for NRPA), the trends identified for 2023 focused on technology, health and wellness, worker satisfaction, and recreation program trends. Below are a few highlights from Dolesh’s article:
• Parks and recreation agencies will be able to reduce their carbon footprint through the electrification of business elements such as buildings, vehicles, and equipment. The switch to electronic power is healthier, cheaper, more efficient, and more environmentally friendly for our communities.
• Five state park systems and one national park implemented programs that loan persons with disabilities access to off-road, tracked, and powered wheelchairs. This is just one of many ways parks and recreation agencies are looking to provide opportunities for inclusion.
• Worker satisfaction is more important now than ever and should be a top goal for your organization’s culture. Employees who feel a sense of genuine care for their well-being from their employer are more engaged and productive.
• The lack of childcare workers and lifeguards and the impact that has on parks and recreation agencies’ recreation is expected to continue. The childcare workforce is one of the only occupations that has not rebounded from the COVID-19 pandemic.
• Pickleball has exploded onto the recreation scene; however, the loud volume coming from pickleball courts leaves little to be desired for those living nearby.
• Digital twin mapping is used to provide 3D models of the actual physical environment and is compatible with geographic information systems
(GIS). The result of the two maps is a virtual image showing spatial relationships between objects, buildings, and elements of nature.
• Anchor institutions, typically universities and hospitals, are nonprofit organizations that create strong bonds within their community. Parks and recreation agencies operate similarly and should be viewed as vital pieces of our communities.
• Parks and recreation agencies across the nation relaxed the use and sale of alcohol at the parks, typically during special events. Recreational use of cannabis is now on the rise, with 21 states allowing recreational use, and may not be far behind the recreational use of alcohol in parks.
• Single-use plastic utensils are easy to use in a park setting; however, some parks are looking for a more sustainable solution – edible utensils. Various companies now have items like edible straws, spoons, and forks that can help make agencies with food services more environmentally friendly.
A primary industry standard source for trend data includes the annual Sport & Fitness Industry Association (SFIA): Sports, Fitness, and Leisure Activities Topline Participation Report. The following summary includes data from the SFIA 2023 report.
The SFIA Topline Participation Report provides insight into which activities are most popular by age group and which are growing in popularity. An important note is that the 2023 edition of the report includes impacts to recreation participation during COVID. Understanding how trends have been impacted by the pandemic is vital to long-range planning and are included in this analysis.
In general, the national participation rate in sports and fitness activities continued to increase to 77.6% of all US residents over age six in 2022. Though the national participation rate increased, activity rates by
sports category (see list of categories on pg. 73) have experienced more fluctuation between 2017-2022 (Figure E7), with racquet sports (+23%) and outdoor sports (+12) with the most increase while individual sports (-10%) declined. Other sports categories such as fitness (+3%), team sports (+2.6%), and water sports (+4.3%) experienced more modest growth. Relevant highlights include:
• Yoga (+10.4%) and Pilates (+11.6%) were the top increasing fitness sports in the last three years, while weight/resistance machines (-17.1%) experienced the largest decline in participation.
• Basketball (+13.0%) and outdoor soccer (+9.3%) were the top team sports that experienced growth while softball (-14.6%), rugby (-16.2%), and rollerhockey (-15.3%) had the largest declines in the last three years.
• Skateboarding (+36.4%), trail running (+20.5%), golf driving range/indoor simulator (+56.9%) had the largest increase in participation for individual sports, while traditional triathlons (-11.0%) and bowling (-6.8%) declined.
• Sport and boulder climbing (+164.7%), tent camping (+32.8%), birdwatching (+23.4%), dayhiking (+19.9%), BMX bicycling (+14.6%), and road bicycling (+10.6%) experienced significant increases in participation since the impacts of COVID-19.
• Pickleball (+158.6%), tennis (+33.4%), cardio tennis (+12.4%), and badminton (+6.5%) experienced the largest increases while all racquet sports increased in participation rates in the last three years.
• Surfing (+24.6%) and recreational kayaking (+19.1%) had the greatest level of growth for water sports, while canoing and snorkeling had the greatest number of participants.
Historic participation levels provide an insight of past trends, while analyzing the sports and activities that non-participants would like to participate in can provide insight into future trends. Whether impacted by barriers to participation such as lack of access to facility, lack of programming, no transportation


access, etc., Figure E8 illustrates the top activity each age group aspires to participate within the next 12 months.
• Across all age groups, except 18-24, the top aspired activity was fishing.
• Camping was the second most aspired activity for adults 25 and older as well as youth aged 6-12.
• Active recreation activities primarily populate the list for age groups under 17, while fitness, aquatic, and outdoor sports were primary desired activities for adults.
Participations trends were also analyzed by generations types, see Figure E9. Participation rates of population older than age six, as well as, one-year and three-year trends are identified. For the Boomer generation (1945-1964), the highest participation was in fitness (66.2%) and outdoor sports (43.3%), however, the highest growth was in racquet sports (+46.1%). For Gen X (1965-1979), fitness and outdoor sports remain the highest in overall participation rates, but trends indicate racquet sports (+30.2%), water sports (+23.5%), and team sports (+20.2%) experienced the largest growth. Millennials (19801999), participated in individual sports (43.4) at twice the rate of Boomers (22.9%), however, fitness and


Sports Categories:
Fitness Activities: Aquatic Exercise, Barre, Bodyweight Exercise & Bodyweight Accessory Assisted Training, Boot Camp Style Training, Cardio Kickboxing, CrossTraining Style Workouts, Dance, Step, and Other Choreographed Exercise to Music, Elliptical Motion/Cross-Trainer, Barbells, Dumbbells/Hand Weights, High Impact/Intensity Training, Kettlebells, Pilates Training, Rowing Machine, Running/Jogging, Stair-Climbing Machine, Stationary Cycling (Group/Recumbent or Upright), Swimming for Fitness, Tai Chi, Treadmill, Walking for Fitness, Weight/Resistance Machines, and Yoga.
Individual Sports: Adventure Racing, Archery, Bowling, Boxing for Competition, Boxing for Fitness, Golf on a 9 or 18-hole Golf Course, Horseback Riding, Hunting (Bow, Handgun, Rifle, Shotgun), Ice Skating, Martial Arts, MMA for Competition, MMA for Fitness, Roller Skating (2x2 Wheels, Inline Wheels), Shooting (Sport Clays, Trap/Skeet), Skateboarding, Target Shooting (Handgun, Rifle), Triathlon (non-Traditional/Off Road, Traditional/Road).
Outdoor Sports: Adventure Racing, Archery, Backpacking Overnight, Bicycling Adventure Racing, Archery, Bowling, Boxing for Competition, Boxing for Fitness, Golf on a 9 or 18-hole Golf Course, Horseback Riding, Hunting (Bow, Handgun, Rifle, Shotgun), Ice Skating, Martial Arts, MMA for Competition, MMA for Fitness, Roller Skating (2x2 Wheels, Inline Wheels), Shooting (Sport Clays, Trap/Skeet), Skateboarding, Target Shooting (Handgun, Rifle), Triathlon (nonTraditional/Off Road, Traditional/Road).
Racquet Sports: Badminton, Cardio Tennis, Pickleball, Racquetball, Squash, Table Tennis, Tennis.
Team Sports: Baseball, Basketball, Cheerleading, Football (Flag, Tackle, Touch), Gymnastics, Ice Hockey, Lacrosse, Paintball, Roller Hockey, Rugby, Soccer (Indoor, Outdoor), Softball (Fast-Pitch, Slow-Pitch), Swimming on a Team, Track and Field, Ultimate Frisbee, Volleyball (Beach/Sand, Court, Grass), and Wrestling.
Water Sports: Boardsailing/Windsurfing, Canoeing, Kayaking (White Water, Sea/Touring, Recreational), Jet Skiing, Rafting, Sailing, Scuba Diving, Snorkeling, Stand-Up Paddling, Surfing, Wakeboarding, and Water Skiing.
outdoor sports still remained the top two categories. Millennials increased participation in water sports (+25.2%) and racquet sports (+20.4%) the most in the last three years. Gen Z (2000+) participated most in outdoor sports (61%), followed by fitness (55.5%) and team sports (54.8%). For the youngest generation included in the study, Gen Z, the greatest growth in participation rates were experienced in waters sports (+34.9%) and racquet sports (+29.1%).
• The top two (2) most participated sport categories for every generation were fitness and outdoor sports.
• Team sports participation rates were highest for Gen Z and Millennial generations.
• Fitness sports and activities participation rate for the Boomer generation increased 10.7% and racquet sports participation increased 46%.
• Outdoor and team sports were the most participated categories for the 6-12 age group. Beyond age 12, fitness sports and activities had the most participation followed by outdoor and team sports.
• Racquet sports was the top growth category for Boomers and Gen X and the second highest for Millennials and Gen Z.
The following highlights summarize opportunities to strengthen the Department’s ability to meet residents needs and priorities for recreation. Following each action, a recommended timeframe is identified as one of the following: Short-Term (ST) for completion within the next 1-3 years; Medium (MT) for within next 4-6 years, and Long-Term (LT) for completion within 7-10 years.
1. Continue to diversify the Department’s core program areas beyond the current five; work to achieve more balance in the distribution across the core program area types.
• Start laying the foundation for the addition of a nature-based program area. Explore partners and/or independent contractors to support program provision. (ST)
• Start providing nature-based programs. Target at least one per season. (ST)
• Increase the quantity of nature-based programs to three per season. (ST)
• Generate a plan to expand youth sports programming. Consider non-traditional sports and martial arts. (MT)
• Add one new youth sport offering each year (i.e., tae kwon do, ultimate frisbee, track & field, lacrosse). (MT)
• Consider outdoor adventure programming as a new area. Explore partners to provide kayaking, camping, fishing, etc. (LT)
• Introduce outdoor adventure programs. (LT)
2. In addition to increasing the number of core program areas, also increase variety of program types within each area, using the top PIR opportunities as a guide: nature enjoyment, fitness & wellness, special events/festivals, senior activities, performing arts, aquatics, history & museums, and water-related activities.
• Create an adult walking club in parks. (ST)
• As facility space becomes available, add fitness programs. (ST)
• Create one new family special events, add one each year. (ST)
• As facility space becomes available, add senior adult activities. (ST)
• As facility space becomes available, add early childhood programs. (ST)
• Partner with local museums to add historical programming. (ST)
• Seek out partners to add youth swim lessons. (ST)
3. Develop and implement an annual program plan that identifies how the Department will serve age segments, recreation interests, and fulfill the community’s leisure needs in a more balanced manner.
• Using the report as a starting point, compare the program menu to demographics annually. (ST)
• Seasonally, challenge staff to add programs for teens, adults, and seniors. (ST)
• Demonstrate annual program plan adjustments and modifications based on participation and program life cycle. (ST)
• Conduct a community needs survey to gauge satisfaction and new recreational program needs. (MT)
• Respond to community needs survey results by developing/adjusting program plan accordingly. (MT)
4. Focus on expanding recreation opportunities for specific markets, including adults and those with special needs.
• At new special events, continue to survey adults regarding programming needs. (ST)
• Hold adult programs at local small businesses, i.e. coffee shops, breweries, that combine the business’ expertise and a leisure experience. For example, wine tasting while painting. (ST)
• Integrate at least one new adult program opportunity per season. (ST)
• Seek out partners to provide programming to people with special needs. Establish cooperative agreements for collaborative service provision. (ST)
• Develop an inclusion services plan for people who need special accommodations. This includes internal operations, advertising, and implementation of services. (MT)
• Start providing inclusion services. (MT)
• Begin developing and providing programs specifically for people with special needs. (MT)
1. Nurture the Department’s relationship with the school district, starting with the approval and implementation of the draft Joint Use Agreement (JUA). Establish more consistent communication and collaboration; renegotiate the parameters of the community’s school use during out-ofschool times. Monitor the JUA’s execution, meet to discuss what is/is not working, and modify if needed.
• Approve the JUA (ST)
• Schedule programming according to new JUA. (ST)
• Meet quarterly to discuss the agreement’s implementation and opportunities for operational improvement. (ST)
• Renegotiate the JUA as needed. (MT/LT)
2. Define the Department’s role as partner, provider, facilitator, and/or resource for recreation opportunities by completing a program planning matrix. Then, communicate the Department’s role both internally (with other City departments) and externally with residents.
• Complete program planning matrix. (ST)
• Establish internal processes and procedures to support new roles. (ST)
• Generate any new partnership agreements (ST)
• Develop and execute communication plan, internally then externally. (MT)
• Revisit roles by updating the program planning matrix. (MT)
3. Collaborate with similar providers to identify ways to better-meet the community’s recreation needs based on PIR results. Focus first on exploring collaborative opportunities with existing area organizations providing nature programs and services, followed by continued collaboration with the Senior Center to increase senior program opportunities.
• Establish a service providers networking group, with the Department serving as the leader and conduit. (ST)
• Lead quarterly meetings with the service providers networking group. (ST)
• Establish annual planning goals with the Senior Center. (ST)
• Collaborate on one event per year with Senior Center. (ST)
• Explore potential Senior Center facility-based cooperative agreements. (ST)
1. Improve field maintenance by developing field maintenance standards, providing additional funding for implementation of best practices, and additional staff to implement the standards.
• Develop field maintenance standards. (ST)
• Establish annual funding plan for field maintenance standards execution, including staff and supply needs. (ST)
• Consider fees and charges review as means to support park and field maintenance. (ST)
• Increase field maintenance staffing. (ST)
2. Increase indoor recreation space to support program offering expansion.
• Finalize and execute 98 S. Main facility renovation plans. (ST)
• Open and staff 98 S. Main facility. (ST)
• Develop funding plan for future indoor spaces. (ST)
• Generate concept plan for future Taylor Farms Park facility to support funding plan needs. (MT)
• Design future Taylor Farms Park facility. (LT)
3. Explore additional partnerships, lease agreements, and/or acquisition as a means to achieve access, in both quantity and variety.
• Analyze three non-traditional recreation program spaces for viability. (ST)
• Consider lease agreements, repurposing existing community spaces. (ST)
• Identify five potential facility partners and engage in visioning discussions. (MT)
• Conduct annual review of real estate opportunities. (MT)
4. Current plans for the new Norwalk High School include construction of a new indoor aquatic facilities with a separate public entrance point which will allow for better programming opportunities. If the new pool, is not developed, the Department should lead efforts to plan to meet the community’s indoor aquatic needs elsewhere. This could include collaborating with similar providers, securing funding through alternative revenue sources (i.e., grants, referendum, corporate sponsorships), and/or public-private partnership.
• Evaluate potential aquatic facility solutions with similar providers. (ST)
• Review alternative revenue source options annually. (ST)
1. Increase staffing to support program development and growth.
• Add part-time positions that will enhance marketing and communications and programmatic offerings. (ST)
• Increase programming staff to support program area growth. (ST)
• Increase staff support only as indoor programming space is acquired. (ST)
• Shift part time positions to full time. (MT)
2. Develop a seasonal program guide to more comprehensively communicate the participation opportunities.
• Retain per diem or part time design support. (ST)
• Develop seasonal program guide production process. (ST)
• Establish advertising parameters to offset production costs. (ST)
• Determine delivery process (electronic and/ or paper) and any corresponding fees, if desired. (ST)
• Begin seasonal production and distribution process. (ST)
Key Takeaways: Overview
Comparison to national averages and peer communities is an effective way to identify successes and opportunities within the current recreation and parks system. Ultimately, facilities, programs, acreage, access, funding, and staff are established as a resource for Norwalk residents. Public engagement is a way to identify the unique needs and recreational interests of the community in combination with national and peer comparison. Figure F1 summarizes participation data across a few of the input methods used for this master plan.
• Planning efforts balanced qualitative (public input) and quantitative (data) engagement techniques.

• Statistical survey was random (each household had an equal opportunity) and stratified to match the city’s demographics and helped to confirm online survey results.
• Only 20% of residents have participated in a City of Norwalk recreation program or event over the prior year versus 32% nationally. Less than 9% of seniors over 65% have participated.
• Highest needs and importance for recreation facilities include alking paths/sidewalks, restrooms, natural parks and preserves, trails, and outdoor pools.
Community Workshop Participants
64
11 Stakeholder Interviews 3,270+ Website Visitors 110+ Presentation Downloads 1,000+ Business Cards
398 Statistical Survey Responses Online Survey Responses
337
• Highest needs and importance for activities include nature enjoyment, fitness and wellness, performing arts, seniors adult, and aquatics.
• Maintaining existing beach parks and water access (40.7%), maintenance of existing parks (33.2%), and development of new trails and connecting existing trails/sidewalk (33.2%) were the top supported actions residents are willing to fund with additional taxes.
54 Focus Group Participants
480+ hours of Public Engagement Participation
• Over 67% of respondents are willing to provide additional tax funding to improve parks and recreation offerings.
• Majority of residents support developing a park foundation (60.2%), use of additional sponsorships (59.3%), and additional user fees or charges (54%) for alternative funding.
Maintaining transparency throughout the planning process can increase public trust and support for development projects. Involving the public can also help identify potential issues and concerns early on, providing to opportunity to address them before becoming a major problem. Establishing a collaborative relationship between the City and the community leads to recreation and park systems that meet the needs of residents and promote social, economic, and environmental sustainability.
The formats of public engagement has changed significantly in the recent years. The rise of social media platforms has enabled individuals to easily connect and share information, leading to increased levels of online activism and grassroots movements. The COVID-19 pandemic forced many public engagement efforts to move online, with virtual meetings and events becoming the norm. This has allowed for greater accessibility and inclusivity, as individuals who may not have been able to attend in-person events can
now participate from anywhere with some methods, at any time. However, there are also concerns about the impact of these changes on the quality and effectiveness of public engagement efforts, as well as social equity in access to technology. This master plan sought to balance techniques used by having in-person events as well as virtual and digital offerings.
Public engagement formats and events facilitated during the development of this master plan are formatted in a timeline in Figure F3 and are summarized in the following section:

Individual interviews with Recreation and Parks Department Staff and elected officials were conducted to receive specific feedback about the day-to-day functionality and challenges. Department Staff recommended stakeholders that where also interviewed as representatives of organizations that collaborate with the Department. Online interviews were completed in early March, 2022.
Focus groups of 5-10 people met across March 9th-11th 2022 to discuss special topics and how they relate to needs and priorities, what groups see as the vision for recreation and parks, and comparable communities. These focus areas included civic organizations, bike and pedestrian connectivity focus groups, seniors/active adults, sports and athletic leagues, stustainability, teen and youth, and venders/ concessionaries.
Community Workshops were advertised through City of Norwalk websites and social media accounts. There were two types of community workshops facilitated within this planning process. The first were Needs Assesment Community Workshops held virtually in early March 2022. These workshops began with a presentation of the overall project followed question prompts related to what participants recognize as top priorities for parks and programs, what outcome they are hoping for from this planning process, and what funding sources they support.


Nov.
Feb.
Staff, Elected Officals, and Stakeholder Interviews Focus Group Interviews
March
Individual interviews gave insight into day-to-day function and challenges. These groups included members of civic organizations, seniors, athletic leagues, stustainability advocates, teens, and more.
Needs Assessment Community Workshop
March
Needs Assessment Community Workshops were held virtually and open to the public.
March
Surveys provide a quanatiative method of data collection that can be cross tabulated to identify different needs of members of the community.


May


April

Common Council Presentation & Adoption of Master Plan
July 25, 2023
Vision & Implementation Community Workshop Staff Implementation Workshop
Oct. 13 & Oct. 15, 2022
Three (3) Vision & Implementation Workshops where held across two days.
Presentation Briefing to Common Council
June 27, 2023
Public Presentation of Draft Master Plan

June 8, 2023
Presentation followed by a four week public review period.
Presention to Recreation, Parks, and Cultural Affairs Committee
July 12, 2023
RCPA Committee approval and recommendation to Common Council for adoption.
Jan. 31, 2023
Workshop focused on Master Plan goals, priority setting City actions, role of the Department, funding sources, and partnerships.

Recreation, Parks, and Cultural Affairs Committee Presentation

Sept. 14, 2022
The second type of community workshops were Vision and Implementation Workshops These were a series of three workshops, one with Department Staff and two open to the public held October 13th and 15th 2022. These workshops began with a presentation followed by small group excercises. The first was a ‘SWOT’ exercise (strengths, weaknesses, opportunities, and threats), and in the second groups chose overall goals that they saw as a priority and specific actions that would support those goals. A summary of these vision workshops is included in Appendix 1.
An additional Staff Implementation Workshop was held at City Hall in late Janaury 2023 with Department Staff completing three excersicse. The first was a review of capital and operational funding and the expected funds needed to incorporate all parts of the proposed Master Plan goals over the next the next ten years. The second excersise was to define prioritization criteria and a ranking system that could be used to compare proposed improvement projects to decide which is the highest priority to be complete. The last exercise was a review of objectives and goals for input regarding potential partnerships and funding, timeframe, and specific Department actions. A summary of the Staff Implementation Workshop is included in Appendix 2
Interviews and workshops allow for the collection of qualitative data while surveys are a method of collecting quantitative data. The statistical surevey was sent to approximately 1,500 households randomly thoroughout the City. Each houeshold had an equal chance of receiving a surevy. Methods to complete the survey included mail-in response, by phone, or online. A total of 337 responses were received establishing a +/-5.3% margin of error rate with responses weighted to match the demographics of the City.
Question topics included which programs and facilities participants currently use, satisfaction with existing recreation and parks, barriers that prevent them from using parks and programs, support for improvement actions, and input on funding and tax actions. The following pages present key results from the statistical survey. Full statistical survey results can be found in Appendix 3.
An online survey was available to anyone interested. A QR code was available on all advertised media, at all public engagement related excersises, and on business cards distributed throughout the planning process. The online survey included many of the same questions as the statistical survey, allowing a confirmation of data results.
The survey was completed by 398 respondents with 93% being residents of Norwalk. Responses were enough to make overall results statistically accurate with a margin of error of +/- 4.9%. Results from the online survey were consistent and within the margin of error for most questions from the statistical survey and helped to confirm results. See online survey results are included in Appendix 4.
An interactive, mobile friendly project engagement website was launched in Feburary 2022 and remained active throughout the project. The site has had over 3,270 visits by 1,180 unique users. Presentations and the draft master plan were made available on the website to download with over 110 completed. The site provided information for opportunities to participate, review prior workshop presentations, complete survey questions, and review the project schedule.
The public engagement outcomes are valuable to informing recommendations of this master plan to work towards a long-term plan that serves specific community needs. Information collected throughout all qualitative and quantative public engagement is a reflection of local expertise of the City or specifc neighborhoods. Input provided through public engagement can be best used to inform more specific recommendations regarding projects, funding, and priority setting.
F4. Which parks and recreation amenities/facilities do you currently use and which do you think should receive the MOST attention from the City over the next two (2) to four (4) years?
The top five (5) selected amenities/facilities chosen to receive the most attention are the same amenities/facilities identified as the most used.
Beaches were identified as the most visited and the amenity which should receive the most priority for attention in the next 2-4 years.
F5. Do you feel there are sufficient parks and green space areas within walking distance of your residence?
LOS Access evaluation estimates 40% of residents are within a half mile, or a ten minute walk, from a park. Survey respondents show a higher percentage of resident who consider themselves within walking distance to a park. This indicates residents are willing to walk farther to get to the nearest park or green space.
No
Yes
F6. Have you or a member of your household participated in a City of Norwalk program or activity in the last 12 months?
Total results indicate a below national average participation rate in programs and activities. Cross tabulation shows there is an above average participation rate in household with children under 10 or children between the ages of 10-19.
9.4% of residents 18-34 and 9% of residents over age 65
28.9% of Hispanic Latino/a/x households
46.6% of households with children under 10
40.4% of households with children between 10-19
F7. Overall, how would you rate the quality of the programs offered by the City of Norwalk that you and members of your household participate in?
National Averages


Residents indicated an ‘Excellent’ opinion of program quality (19.7%) lower than the national average (23%); but a higher ‘Good’ opinion of program quality (60.6%) than the national average (56.0%).

F8. Check all the ways you prefer to learn about City of Norwalk recreational programs and activities.
City/Department Website
Email Blasts
Social Media (Twitter, Facebook, etc.)
Recreation Brochures
From Friends & Neighbors
Newspaper Ads/Articles
Radio or Cable Access Television
School Flyers/Newsletters
Conversations with City/Department Staff
Other
F9. Reasons that prevent you or other members of your household from using parks, trails, recreation, and aquatic facilities or programs in Norwalk more often. (Top 10 results)
National Averages (where possible)

I do not know what is being offered
Lack of restrooms
I do not know locations of parks/facilities
Lack of sidewalk or bike lane access
Parks/facilities too far from residence
Security is insufficient/loitering
Program or facility not offered
Parks/facilities are too crowded
Parks or facilities not well maintained
Lack of accessibility parking
The three most preferred types of communication are all resources that are digitally accessible. While most residents may prefer these methods, it is important to maintain diverse formats of communication.
Top 3 methods of communication are technology based. Same top three communication preferences for White and Hispanic/Latino/a/x households.
#2 for Black households
Park goers are over twice as likely to not use amenities and facilities because they do no know the locations of parks/facilities, security is insufficient, parks are not well maintained, and/or facilities are too crowded compared to national averages.
#1 and #3 barriers are a related to communication of information.
Top barrier for Black households and households with children under the age of 10
Top barrier for households with children age 10-19
A result of crowding at Calf Pasture Beach

F10. Estimated number of households in Norwalk whose needs for facilities are being partly met or not met.
Walking Paths/Sidewalks (43%), Public Restrooms (33%) and Natural Parks & Preserves (32%) are indicated as the most needed facility across Norwalk households.
Walking/Running
Outdoor Social Gathering Spaces
Outdoor Exercise Equipment or Stations
Community or Recreation Centers

Community Gardens
Dog Parks (off‐leash)
Larger Community Parks
Canoe/Kayak launches
Pickleball Courts
Indoor Courts
Multipurpose Fields
Playgrounds
Tennis Courts
Splash Pads
Marina/Boat Launches
Skate Parks
Golf Courses Basketball Courts
Youth Baseball and Softball Fields
Disc Golf Courses
Adult Baseball and Softball Fields
89.5% of households over the age of 55
43.5% of Hispanic/Latino/a/x households
60% of households between the ages of 18-34
27.3% of Hispanic/Latino/a/x households
20% of households with children between the ages of 10-19
F11. Which facilities do you think are most important for you and members of your household? (Top 12 results)

Walking paths/sidewalks, natural parks and preserves, and small neighborhood parks are most important to Norwalk households.
Walking Paths/Sidewalks
Natural Parks & Preserves
Small Neighborhood Parks
Dog Parks (off‐leash)
Outdoor Pools
Larger Community Parks
Trails/Multi‐Use Paths
Restrooms
Playgrounds
Walking/Running Tracks
Multipurpose Fields
Outdoor Exercise Equipment or Stations
43.1% of households over the age of 55
24.4% of Hispanic/Latino/a/x households
43.1% and #1 most important for households with children under age 10
F12. Estimated number of households in Norwalk whose needs for activities are being partly met or not met.
Nature Enjoyment (35%), Fitness & Wellness (32%) and Performing Arts (30%) are indicated as the most needed activities across Norwalk households.
Using Wi‐Fi
30%+ of households
41.7% of Black households
68.8% of households between the ages of 18-34
45% of Hispanic/Latino/a/x households
20%+ of households
53.8% of households between the ages of 18-34
40% of Black households
10%+ of households
Teen (6th‐12th grade) activities

Youth (K‐5th grade) activities
Youth Sports eSports (video games)
F13. Which activities do you think are most important for you and members of your household? (Top 12 results)
Nature Enjoyment, Special Events and Festivals, and Senior Adult Activities are most important to Norwalk households.
43.3% of households over the age of 65
25.6% of Black households
23.3% of Black households and 20% of Hispanic/Latino/a/x households
#2 for households with children under the age of 10
#1 for households with children under the age of 10


F14. Which activities do you currently participate in most often? (Top 10 results)


Nature Enjoyment, and Special Events and Festivals are consistently high across survey data related to activities that are needed, important, and currently participated in.
#1 for Black households
Water‐Related Activities


Socializing
Performing Arts
Family Events
Senior Adult Activities
57.8% of households between the ages of 18-34
Only 30.2% of Black households
30.2% of Black households
Only 4.7% of Black households
29.3% of households with children under the age of 10
25.5% of households with children between ages 10-19
22.4% of households with children under the age of 10
F15. Rate your level of support of each action that the city of Norwalk could take to improve the Recreation and Parks system.
(Top 5 Most Supported and Bottom 5 Least Supported Results)

The actions most supported are related to maintaining existing parks and open space while least supported actions are related to additional development of parks and facilities.
#1 for households with children under the age of 10
F16. Which actions from would you be most willing to fund with your tax dollars?
(Top 10 Results)
Redevelop/improve
Only 58.1% support from Black households
Develop indoor/outdoor aquatics facility(ies)
Redevelop/improve existing neighborhood parks
Maintain existing sports fields & sport courts
With consideration to personal tax dollars, maintaining existing beach parks & water access and maintaining existing parks remain at the top and actions involving development and improvement rise on the list.
#1 for Hispanic/ Latino/a/x households and household with children between ages 10-19
Maintaining existing sports fields & sport courts falls lower on the supported actions list after consideration of personal tax dollars.
#1 for households with children under the age of 10
F17. Additional amount you would be willing to pay in property taxes to fund the actions that you indicated as most important to your household.
67.2% of respondents indicated a willingness to pay additional property tax to support improvements to parks and recreation.
21.4% of households with children under the age of 10
F18. Which funding sources do you most prefer?

Park foundation, sponsorship, and user fee/ charges funding sources are preferred by residents.
#1 for
and
Through the completion of various public engagement and research techniques, a number of parks and recreation needs and priorities emerged. Figure G1 provides a summary overview of the findings from each analysis technique, which were further refined based on additional public input and analysis.
Three types of research were utilized in a mixedmethods, triangulated approach to a needs assessment process: observational, qualitative, and quantitative. Together, these research methods provided multiple opportunities to crosscheck results and better determine an accurate understanding of Norwalk’s needs and priorities for parks, recreation facilities, and programming.
The top ten facilities and programs needs are identified as a means to concisely present findings. These facilities and activities are ones identified through multiple techniques to have the highest level of importance and most unmet need by the community. In addition to the identification of the top communitywide needs from public participation and survey techniques, overall priorities have emerged and are listed in descending order to the right.
Key Takeaways:
• Recreation and park facility top needs include trails, additional parks, and select athletic facilities.

• Top recreation program and activities include diverse opportunities from fitness/wellness to nature enjoyment, racquet sports, and adventure recreation.
• Priorities focus on implementation of the City’s bike and pedestrian connectivity projects, obtaining additional funding, and diversifying programming and facility offerings.
1. Prioritize waterfront and passive parks and programming to better connect to water.
2. Provide equitable access to parks through connectivity and new acquisition or development.
3. Diversify programming to better meet changing demographics and interests with additional indoor space and aquatic facilities.
4. Enhance bike and pedestrian accessibility, including to park destinations and within parks.
5. Prioritize alternative funding options to provide operational funding and additional capital improvements funding.
Facilities
= Indicates High Needs
= Indicates Medium Needs
= Indicates Low Needs
Walking Paths / Sidewalks
Smaller Neighborhood Parks
Natural Parks and Preserves
Trails / Multi-Use Paths
Restrooms (Public)
Beaches (Public)
Larger Community Parks
Outdoor Pools
Multipurpose Fields
Community/Recreation Centers
Programs and Activities
Water-Related Activities (Swimming, Fishing)
Aquatics
Nature Enjoyment
Special Events / Festivals
Senior Adult Activities
Fitness and Wellness
Performing Arts
Teen (6-12th Grades) Activities
Special Populations
Family Events (Movie Nights, etc.)
 Norwalk Recreation & Parks Master Plan

Long-range visions are crucial for effective planning because they provide a roadmap for development over time. By considering factors such as population growth, changing demographics, physical conditions of facilities, and public input, the City can create a blueprint that not only meets the current needs of residents but also anticipates future needs.
Long-range visions can help elected officials make informed decisions about park development, acquisitions, funding, and modifications to policies, among other things. Without a long-term plan, park and recreation systems risk becoming irrelevant to residents and negatively impact quality of life. Therefore, having a long-range vision is essential for creating livable, sustainable, and thriving neighborhoods that can adapt to changing needs and priorities while continuing to meet the needs of their residents well into the future.
By extrapolating the Departments mission to incorporate the framework distilled from public input and comprehensive analysis, a set of unique components (Figure H1) can be identified. Combined, these diverse components will guide the development of parks and recreation facilities across the city. Each component was developed through community input and analysis of the existing physical system. Guiding principles identified for each component describe the community’s aspirations for the overall system and physical attributes.
• Norwalk’s vision for recreation and parks builds upon the vision established by the City’s Norwalk Tomorrow Plan (POCD 2019-2029).

• Comprehensive Vision consists of five (5) components defined through public engagement and review of characteristics of the recreation and parks system.

• Working as an interconnected system, the five components identify clear initiatives that can be championed by advocates and progressed by staff.
• Specific goals and objectives are defined to assist in progressing the overall vision.
Guiding principles for waterfront, natural, and regional parks include the following:

1. Increase Conservation of Biodiversity: Protection and preservation of unique ecosystems and biodiversity, providing a haven for endangered species and rare habitats.
2. Increase Recreational Activities: Offering of opportunities for hiking, bird watching, fishing, and other outdoor recreational activities, which promote physical fitness and mental well-being.
3. Promote Education and Research: Provide opportunities for scientific research, education, and interpretation of natural and cultural resources, enabling people to learn about the environment and history of a particular area.
4. Enhance Economic Benefits: Waterfront, natural, and regional parks often attract tourists, which can generate revenue, create jobs, and help to retain local leisure activity expenditures.
5. Improve Resiliency: Provide a vital role in enhancing resiliency by absorbing environmental shocks, mitigating hazards, and protecting local environments.

Guiding principles for community and neighborhood parks include:
1. Promote Physical Activity: Provide a space for people to engage in physical activity, such as walking, running, and playing sports. This helps promote physical health and can reduce the risk of obesity and other health problems.
2. Enhance Mental Health: Spending time in parks has been shown to improve mental health and reduce stress levels. Parks provide a peaceful and relaxing environment for people to escape the stresses of daily life.
3. Foster Social Connections: Bringing people together and providing a space for community members to socialize and connect. This helps build a sense of community and can lead to increased social cohesion.
4. Provide Educational Opportunities: Providing opportunities for people to learn about nature and local environments. This can help foster a sense of environmental stewardship and promote sustainability.
5. Improve Property Values: Increase or sustain property values and make neighborhoods more attractive to homebuyers. This can lead to economic benefits for the community as a whole.
Guiding principles for indoor/outdoor athletic facilities include:
1. Improve Community Health: Municipal sports complexes can promote physical activity and encourage people to lead healthier lifestyles. They provide a space for people of all ages and abilities to participate in sports and recreation activities.
2. Increase Socialization: Sports complexes also provide opportunities for socialization, where people can meet new friends and interact with others who share their interests.
3. Enhance Economic Benefits: Municipal sports facilities can also have positive economic impacts, as they attract visitors and events to the community, generating revenue for local businesses and the City.
4. Improve Infrastructure: Sports complexes can also help improve the infrastructure of a community by creating new facilities and upgrading existing ones.

Guiding principles for school parks focus on these special facilities providing additional recreation opportunities, serving as neighborhood parks, and promoting community building:

1. Promote Physical Activity: Provide students with a safe and fun space to engage in physical activity, which can help them develop their motor skills, coordination, and overall good lifelong fitness habits. Regular exercise has also been linked to improved mental health, academic performance, and social skills.
2. Increase Outdoor Learning: Promote school parks as opportunities for outdoor classroom, providing a unique and engaging environment for learning. Students can observe and study nature, practice scientific inquiry, and learn about environmental conservation.
3. Improve Quality of Life: Engaging in lifelong sports can lead to an improved overall quality of life, including increased energy levels, better sleep, and a greater sense of well-being. Offer opportunities for students to interact with their peers, develop social skills, and make new friends.
4. Provide Community Building: Serve as a focal point for the community, providing a place for families and neighbors to come together and participate in recreational activities. School parks can also promote community engagement and volunteerism, as parents and other community members can get involved in maintaining and improving neighborhoods.
2. Improve Mental Health: Contribute to a positive impact on mental health. Physical activity has been shown to reduce stress, anxiety, and depression, while social activities can help individuals build relationships and a sense of community.
3. Improve Personal Growth: Provide opportunities for individuals to try new activities and challenge themselves to learn new skills. By learning, individuals can build confidence, selfesteem, and a sense of accomplishment.
Guiding principles for recreation programming include:
1. Promote Physical Health: Promote physical activity, which is essential for maintaining good health through increasing participating in activities like sports, dance, yoga, and fitness classes can improve cardiovascular health, strength, flexibility, and overall physical well-being.
4. Promote Community Building: Bring people together and foster a sense of community. By participating in group activities, individuals can meet new people, make friends, and feel a sense of belonging.
5. Promote Lifelong Learning: Provide opportunities for lifelong learning. Individuals can learn new skills and acquire knowledge in a fun and engaging way.


While looking for solutions for combined sewer overflows due to flooding in the historic Fourth Ward area of the City, Atlanta’s Department of Watershed Management, Department of Parks and Recreation, and Atlanta BeltLine, Inc. partnered on the development of Historic Fourth Ward Park. Creative and intentional pond structure design allowed for this space to be design as a landmark and amenity for the community while also solving technical water management challenges. Partnership across City Departments and professional design disciplines created the atmosphere for the same site to serve many purposes. This solution saved the City of Atlanta and estimated $50 million compared to traditional sewer tunnel solutions with the added benefits of an effective public space.
The implementation of recreation and park planning is crucial for the development and sustainability of neighborhoods. Effective planning enables the creation of well-designed and functional park and recreation facilities that meet the needs of residents and visitors, while promoting social cohesion, improved health, and environmental sustainability. Effective planning also helps ensure that access to resources such as open spaces, playgrounds, athletic fields and courts are efficient and equitable.
Planning helps to ensure that the built environment is safe, accessible, and resilient to natural disasters and other shocks, while also shaping the character and identity of Norwalk, reflecting its cultural, historical, and natural heritage. Overall, the implementation of recreation and park planning is essential for creating livable, prosperous, and resilient neighborhoods that meet the needs of present and future generations.
To advance the Long-Range Vision, implementation strategies must be defined and priorities established. Implementation strategies play critical roles in making the vision realistic and are intended to provide guidance in bringing the master plan vision to reality through several critical elements: funding analysis, probable cost estimate, phasing strategies, and prioritization.
Utilizing this information, recommendations intend to satisfy system-wide objectives at an individual park level. These recommendations form a portion of the probable cost estimate. In addition to costs associated with vision-based recommendations, cost estimates also incorporate projects that have been previously identified by the Department, including requested or unfunded projects identified in the prior master plans.
• The Department cost recovery rate has rebounded to 19% for 2022, lower than the national average of 26% for similar agencies.
• Capital projects and land acquisition have been grouped into four phasing timeframes: ShortTerm (1-3 Years), Medium-Term (4-6 Years), Long-Term (7-10 Years), and Vision (10+ Years).
• 40.7% or $58.1 million of total costs are recommended for completion or substantial progress within the next ten (10) years.
• Historic trends in capital improvement funding may provide $44.25 million over next ten years, 76% of needed funding, therefore requiring additional sources.
• Partnerships are key for implementation and may help to reduce projected costs; supporting the establishment of a Parks Foundation is key.
• Short-term recommendations have a probable cost estimate of $19.35 million or 13.6% of all projects.
• Short-term projects require an additional $341,500 in operating and maintenance (O&M) costs annually resulting in approximately 3-4 additional FTE positions.
• If all recommendations are implemented, funding has the potential to increase from an estimated $44.25 million to an estimated $71.74 million, or 123% of the needed capital funding for all projects recommended for the next 10 years, providing flexibility.

Many communities were quick to reduce expenditures as uncertainties arrived in early 2020, only to find out in some cases that revenues were not as impacted or were impacted in ways that balanced incoming federal and state subsidies.
Funding for the Department is split between two primary types; operations and capital. Average funding levels for these two funding types has varied significantly. Operations funding has averaged $4.4 million annually over the last five years and experienced only a minimum decrease in 2021, otherwise this funding types has grown and remained fairly stable. This type of funding is traditionally stable for most public park agencies as these funds pay for staffing, benefits, and other costs that are consistent from year to year.

Capital funding has had a different level of funding for the Department. Funding for fiscal year (FY) 2023 is 44% above historic average. Large swings in funding have resulted in these costs representing between 7% and 20% of the City’s total capital budget (without Board of Education). These swings can be tied to
the funding of significant capital projects which may increase the capital budget in specific years. Averaging capital funding over the last ten years results in an annual budget of approximately $3.35 million. In addition, the Department has been successful in obtain grants, earmarks, and other alternative funding, with over $11.5 million obtained in FY 2023 alone. Most alternative funding comes from one-off opportunities, but by regularly applying resources to efforts, annual funding levels can be more consistent.
Inflation has had a considerable impact on funding for most public agencies, especially with capital budgets. Excluding FY 2023 amounts, the historic average annual capital budget for the Department from FY 2014 to 2022 was $3.18 million. FY 2023 capital funding is approximately 51% higher than this average, however, when inflation is considered over this period, the value of the increased is 27% less. A primary recommendation is to index capital funding levels to inflation rates and maintain 2023 funding level or higher.
If these historic trends are assumed to continue over the next ten years, the Department could expect to receive approximately $46.25 million in capital funding, see Figure I1. Two additional recommendations to increase capital funding is to support the development of a Parks Foundation that can proactively raise private donations and contribute to projects aligned with the Department’s mission. The Department should also utilize city resources more or add staffing expertise for grant writing to the Department to increase grant opportunities. Typically, the Department has averaged $1.279 million annually from alternative sources, but implementation of additional strategies would include increasing annual contributions to $1.8 million annually and provide better consistency of availability.
Based on cost estimates derived from parks and open space evaluations and projects identified in Capital Improvement Program (CIP) requests plus recommendations associated with the Long-Range Vision, the estimated probable capital cost is approximately $142.75 million in 2023 dollars for complete implementation of all projects identified within the Vision. The total capital costs estimate includes system
improvements anticipated to occur to establish and maintain park delivery within ten (10+) years. Estimated costs have been aligned to park components, Figure I2. Funding for capital projects to enhance program offerings such as indoor facilities space representing the largest portion at 30.9%, followed by waterfront, natural, and regional parks at 25.4%. The full list of projects and estimated costs used to derive the total includes over 120 line items.
Escalation is an important consideration for mediumand long-term projects primarily. The US Bureau of Labor Statistics - Consumer Price Index was 9.49% in 2022 and was projected to be 4.5% in 2023 and 2.9% in 2024. Construction cost increases should be considered prior to a project progressing into the funding stage.
An additional cost consideration is the role that partnerships may have in reducing capital or acquisition costs for the City. Implementation of higher cost facilities such as greenways or indoor facilities should first consider opportunities to partner with other agencies. Partnerships have the potential to significantly reduce costs, while remaining projects could be further reduced through strategic use of grants or sponsorships.
The Phasing Plan for capital improvement projects is comprised of four different phases based on community needs and priorities and input from Department staff.
Figure I3 summarizes these phases and provides a framework for the implementation of over $142.75
million in capital improvements. Approximately 13.6% of total capital costs is included in the short-term phase, meaning targeted for completion or substantial progress in the next 1-3 years. An additional 9.4% of projects is shown in the medium-term phase, to be completed in the next 4-6 years. The long-term phase totals 17.7% of capital projects and would take between 7-10 years to complete. The vision phase includes projects that have a lower priority or take longer to identify funding or partners. These projects are likely to not be completed within the next ten (10) years and represent 59.3% of project capital costs.


With the addition of new facilities and increased park acreage, O&M costs can be expected to increase. This plan is conservative in the assumption that the replacement of existing park amenities or facilities will result in a minimal cost adjustment for O&M. Improving existing parks or adding new parks and facilities will commonly result in additional O&M costs, however, in some cases costs may be reduced. Figure I4 identifies the estimated additional annual O&M costs by recommended phase. Short-term additional O&M costs are estimated to be $341,500, mediumterm costs at $237,150, long-term costs $446,900 and vision projects additional O&M costs of $1,494,600.
Full implementation of the Long-Range Vision is estimated to increase O&M by approximately $2.52 million annually, or 3% of capital improvements. This equates to an estimated $30,000 in O&M costs for
each $1 million in capital investment, however, higher costs are associated with the addition of new facilities or amenities vs. replacement of existing facilities. Short-term O&M increases may result in the needs for approximately 3-4 additional FTE staff positions based upon a national average of $103,272 in funding per FTE position. Implementation of all short, medium, and long-term projects over the next ten years would result in the potential need for 10-11 FTE additional staff positions. New positions may be most needed in the following categories: marketing and special event, recreation programming, park and facility maintenance, and custodial staff.

In order for the Department to be able to prioritize projects, a criteria is needed that responds to community-wide needs and goals. The following criteria, Figure I5, can be used as a test for each opportunity or project in order to determine its level of priority in comparison to other projects. This will promote the maximum efficiency of limited resources for the Department.
When the prioritization criteria is applied to projects, the following are the highest scoring in descending order by phase timeframe. Figure I6 identifies the top 20 projects for completion within the next three years; Figure I7 identifies the top 15 projects to be completed within the medium-term timeframe or in the next six years. Figure I8 identifies the top 15 priority projects for the long-term timeframe or those that may take more than ten years to implement.
Utilizing multiple funding sources has become the most effective way of maximizing the amount of funding a community can obtain. Grant stacking allows a project to draw funding from several sources. The idea of grant stacking refers to grouping grants of varying levels (federal, state and local) to support one project. Careful selection of grants can result in one grant providing the matching funds requirement for another grant and the reciprocal as well. This process can address acquisition and development in phases to best meet a project’s intent and time schedule.
One specific capital project that may benefit from this strategy, is the recommended multi-generational recreation center. As a significant capital project, seeking alternative funding sources such as state or federal appropriations leveraged by local match funding is recommended. Combined with potential partnerships with adjacent communities, taxing districts, and/or nonprofits and private sponsorships, large project such as the recreation center can be realized. Additionally, seeking hazard mitigation funding sources for stormwater improvement or resiliency enhancement could utilize the local match or appropriations as well.
Cost Recovery is not a philosophy, it is a strategy in the much larger context of how the Department secures and allocates resources, that allows it to maximize services. Fees and charges are considered a responsible and necessary means to supplement tax revenue, with a focus on mission and affordability of the Department’s most critical programs for the City’s most at-risk populations.
Dr. John Crompton notes in his article in Parks and Recreation magazine (January 2020), for fee-based services: “the appropriate policy is to charge the break-even price to higher income cohorts [using the Benefit Principle] and meet the Ability to Pay Principle by giving discounts to low-income users, rather than offering the service to everyone at a reduced price,” or charging everyone the break-even price and effectively excluding low income residents. The Department is evaluating current policies and goals, and will be updating as them relates to cost recovery. Goals should focus on a total for the Department but have sub-categories and goals.
Based upon similar Departments, Figure I9 identifies comparable cost recovery rates for various facility types. The Department will need to continue to evaluate and monitor performance but setting targets for facility operations and disseminating that information outward into the Department is important. An additional consideration for a change in policy should be to implement a targeted increase in cost recovery combined with a strategy to reinvest additional revenues (above a threshold) directly into the parks contributing.
The Department currently has a cost recovery of 19% compared to 26% national average for similarly sized agencies. Less than 30% of the Department’s revenue comes from recreation programming with the majority (62%) received from operations at the City’s three regional parks, Figure I10.
Recreation programming has been highly successful and enjoys a high cost recovery of 126%, whereas the park operations at Calf Pasture Beach has the lowest cost recovery among the City’s three regional parks at 47%, as shown in Figure I11

Opportunities to enhance both of these primary revenue sources need to be further explored.

Complimentary Providers
Exploring potential complimentary providers in the Norwalk area will help ensure that neighbors have enhanced and equitable access to recreation and program opportunities. Other organizations that provide facilities and activities include:
• Youth Sports Organizations – Should continue to be responsible for providing some team sports for youth. However, the Department will still need to provide most, if not all, of the facilities for these activities. It is recommended that the Department establish a youth athletics council that meets monthly. This council would work to coordinate programs and activities, prioritize athletic facility usage, and promote coaches training.
• Other Government Providers – There needs to be strong efforts to partner with other governmental agencies and departments, as well as taxing districts in the area to develop programs and services. This is most likely to occur with neighboring communities. Program areas that could be provided by other organizations through a partnership include special needs, special events, and outdoor recreation activities.
• Non-Profit Providers – Coordinating with a variety of non-profit providers to deliver recreation services needs to continue to be pursued. Organizations such as the Boys & Girls Club, cultural arts groups, etc. should be encouraged to continue to develop facilities and provide programs in Norwalk. These types of organizations are well positioned to provide a variety of programs in different areas.
• Private Providers – There are a considerable number of private recreation, sports, and fitness providers located in the Norwalk market (health clubs, dance, martial studios, aquatics, and arts studios). These entities should be counted on to provide more specialized activities that are difficult for the public sector to conduct.
• Faith Based Organizations – With a significant number of churches and other faith based institutions in the community, they often provide some recreation services for their congregation
and community. These organizations should be seen as possible providers of some basic community based recreation services and facilities as well.
• Medical Providers – If the Department focuses on fitness and wellness programming in the future then an expanded primary/ equity partnership with local medical providers can have a significant impact.
• Social Service Agencies – There is a trend with parks and recreation departments throughout the country to integrate social services with recreation services. This is particularly true for youth and seniors. To expand social services, there should be a renewed effort to expand partnerships with other agencies in the area.
• Community Organizations – Developing working relationships with community organizations and service clubs such as the Rotary Club, Jaycee Foundation, and Kiwanis International could provide much needed support for programs as well as facilities. They could also be sponsors.
• Business and Corporate Community – It is important to approach the corporate community with a variety of sponsorship opportunities to enhance the revenue prospects of the Department’s programs and facilities. With completion of an updated city-wide master plan, the Department’s ability to leverage identified need and community vision for parks and recreation should continue to have an impact on receiving financial support from the business community.
Through the implementation of these seven strategies, the City has a roadmap that outlines funding targets, recommended policy changes, identification of capital and O&M projected costs, recommended phasing and prioritization of projects use a transparent criteria, and recommendations that may increase revenues. If all recommendations are implemented, funding has the potential to increase an estimated $44.25 million to an estimated $71.74 million, or 123% of the needed capital funding for all projects recommended for the next 10 years, providing flexibility to the plan.
The funding analysis and phasing plan outline considerations for implementing various improvements. The Strategic Plan outlines specific actions needed to implement the vision.
Figure J1 identifies objectives to help implement goals identified in the previous section. Each goal includes a list of objectives with targeted timeframes for completion of significant progress. Four timeframes are utilized: “short-term” represents priority objectives to be completed or significantly progressed in the next 1-3 years, and “medium-term” represents objectives that may take up to 4-6 years to complete, while “long-term’ objectives may take up to 7-10 years to complete. One additional timeframe is ‘Ongoing’ which is for objectives that are currently being completed and are to continue. Overall there are 10 goals and 41 objectives identified within the Strategic Plan.
Each objective also includes a recommended role that the Recreation and Parks Department may have in implementation, potential action types, potential funding sources, and identification of possible partners.

Priority of objectives is tied to public and staff input gathered and documented throughout the needs and priorities assessment. Together, this information will allow the City to review and efficiently update the implementation plan, as needed in the future, to reflect completion of objectives, changing conditions, demographics, or priorities.
• Definition of objectives is intended to assist City staff with implementation prioritization.
• Four categories of time are used to prioritize all objectives: Short-Term (1-3 Years), MediumTerm (4-6 Years), and Long-Term (7-10 Years. Additional objectives may be identified as on-going which are actions that should be continued.
• The Strategic Plan includes 10 goals and 41 defined objectives.
• Objectives include a timeframe, the role that the Department may have in implementation, identification of potential action types, potential funding sources, and possible partners.
• Strategic Plan objectives should be reviewed regularly and updated as priorities change or they are completed.
Partner with Norwalk Police Dept. to review and enhance security and surveillance best practices for parks.
Develop template for standard restroom options and implement based upon priority park improvements.
Continue to engage the public in the planning and design of new parks or improvements to existing parks and recreation facilities.
Identify and partner with volunteer groups to encourage maintenance of existing parks and facilities.
Improve athletic field and sport court maintenance by developing standards and identification of additional funding for implementation of best practices.
Explore additional opportunities to provide athletic fields and sport court lighting to increase capacity of existing facilities and upgrade lighting fixtures to new, more efficient LED options with anti‐light pollution technology.
Creating shared parking to reduce impervious surface, increase park space, and support business and local resources.
Identify priorities for enhanced access to existing parks; i.e. crosswalks, entry points, bike racks, etc.
Develop access standards for parks, i.e. pedestrian, bicycle, and where appropriate, vehicle parking standards.
Continue to partner with Norwalk Public Schools, taxing districts, and other park and recreation providers to meet community needs in neighborhoods that lack walking/biking access to public parks.
Continue to partner with Transportation, Mobility and Parking Dept. for the implementation of the Transportation Master Plan's pedestrian and bicycle infrastructure to priority park destinations.
Evaluate existing city owned, vacant, or underutilized properties, and where needed, identify potential acquisition opportunities for additional parkland in areas without existing walk or bike access to parkland.
Identify and secure alternative funding sources to ensure Department's ability to implement recommendations for capital and operational needs
Evaluate and implement cost recovery recommendations for programs, services, and rentals.
Prioritize the implementation of capital improvements for parks and recreation facilities within City's Capital Improvement Program (CIP).
Explore establishment of a Parks Foundation with a mission to supplement improvements to existing parks and programming.
Secure staff and proactively obtain competitive grants and other funding sources such as special taxing districts or revenue bonds for priority park capital and recreation programming opportunities.
Identify opportunities to leverage existing funding and grants awards through grant stacking during the acquisition, planning, and/or design phase of projects.
Provide year‐round indoor recreation opportunities to residents through development of new facilities and partnerships
Identify potential partnerships with community organizations
Explore establishment of a Parks Foundation with a mission to supplement improvements to existing parks and programming.
Secure staff and proactively obtain competitive grants and other funding sources such as special taxing districts or revenue bonds for priority park capital and recreation programming opportunities.
Identify opportunities to leverage existing funding and grants awards through grant stacking during the acquisition, planning, and/or design phase of projects.
Provide year‐round indoor recreation opportunities to residents through development of new facilities and partnerships
Evaluate feasibility and potential site for an inter‐generational community and recreation center with potential indoor aquatics.
Identify potential partnerships with community organizations with shared goals to provide indoor space through lease agreement, acquisition, or private partnership.
Develop new indoor programming options through implementation of the Norwalk Public Schools Joint‐Use Agreement.
Develop plan to meet community's needs for indoor aquatics through collaboration with similar providers, securing funding through alternative revenue sources, and/or public‐private partnership.
Develop an inter‐generational community and recreation center with potential indoor aquatics.
Evaluate feasibility and potential site for a small recreation center with indoor gymnasium, classrooms/community rooms in the northern area of city.
Provide residents and visitors with inclusive and equitable programming options based upon community needs and recreation trends
Identify opportunities and contract with private providers for specialized program offerings.
Develop additional seasonal and inclusive programming opportunities; specifically for nature enjoyment, fitness and wellness, special events, senior/active adults, performing arts, aquatics, history and museums.
Continue to diversify the Department's core program areas beyond the current five to achieve more balance in distribution across program area types; specifically for adults and those with special needs.
Develop and implement an annual program plan that identifies how the Department will serve age segments, recreation interests, and fulfill the communities leisure needs in a balanced manner.
Collaborate with other providers with shared goals for the development and enhanced public access to nature and senior/active adult programming.
Develop a mobile‐friendly seasonal program guide to more comprehensive communicate participation opportunities and continue to enhance the program registration experience. Incorporate technology in program and registration management to annually evaluate trends in participation and program status and better inform the decision making process for program development.
Enhance the resiliency of waterfront facilities and universal access while highlighting the cultural and historical significance of these special spaces to the City of Norwalk
Update and implement priority improvements of the Veteran's Memorial Park master plan to include resilient best practices.
Continue to partner with the Norwalk River Valley Trail to include completion of the WilWalk segment from Broad Street to Wilton and the Harbor Loop Trail.
Identify street rights‐of‐way with access to waterfront and develop public access points to the water.
Evaluate and implement additional kayak launch opportunities at Oyster Shell Park, North Water Street Park, Veteran's Memorial Park, Calf Pasture Beach, Shady Beach Park, Woodward Avenue Park and future opportunities at Keyser Point.
Continue to provide residents with high‐quality customer service through meeting existing and future staffing needs for enhanced programming and maintenance
Explore short‐term options for additional part‐time positions to enhance marketing, communications, and programmatic offerings.
Increase part‐time and future full‐time staffing in‐line with increased access to indoor facility space. Shift staff positions to full‐
annual review and evaluation of needs.
Memorial Park master plan to include resilient best practices.
Continue to partner with the Norwalk River Valley Trail to include completion of the WilWalk segment from Broad Street to Wilton and the Harbor Loop Trail.
Identify street rights‐of‐way with access to waterfront and develop public access points to the water.
Evaluate and implement additional kayak launch opportunities at Oyster Shell Park, North Water Street Park, Veteran's Memorial Park, Calf Pasture Beach, Shady Beach Park, Woodward Avenue Park and future opportunities at Keyser Point.
Continue to provide residents with high‐quality customer service through meeting existing and future staffing needs for enhanced programming and maintenance
Explore short‐term options for additional part‐time positions to enhance marketing, communications, and programmatic offerings.
Increase part‐time and future full‐time staffing in‐line with increased access to indoor facility space.
Shift staff positions to full‐time to support program area growth through annual review and evaluation of needs.
Promote collaborative partnerships with Norwalk Public Schools, nonprofits, and private entities to ensure efficient use of public facilities and development of innovative programming that meets residents needs
Identify the Department's role as partner, provider, facilitator, and/or resource for recreation opportunities by developing a program planning matrix and communicating with existing and potential future partners.
Nurture the Department's relationship with NPS through the approval and implementation of the Joint‐Use Agreement and establish consistent communications and collaboration to monitor parameters of the agreement and modify as needed.
Continue
Facilitate an annual workshop and industry day with existing and potential future partners for programming, maintenance, and volunteer organizations to present needs and align resources. Identify opportunities for greenway and blueway connections to existing parks and potential development of additional paved an unpaved park trails.
Partner with Transportation, Mobility and Parking Dept. to develop and implement blueway route signage, additional launch locations, kayak lockers, and facilities.
Identify and promote blueway routes to island parks through development of digital content and signage at launch sites.
Facilitate an annual workshop for greenway and blueway partners and advocate to promote benefits of network and better align resources and efforts for implementation.
The following is a list of suggestions for successful implementation of the City of Norwalk Recreation and Parks Master Plan. These elements represent the commitment and discipline required to integrate the process into daily operations:
• The plan becomes the guidepost for Norwalk Recreation and Parks Department. When decisions or responses to the community are needed, the plan will serve as the reference point for decision-making and whether new issues or responses to the community are of higher importance than what has been established in the plan.
• The Master Plan information should be included as part of employee onboarding.
• Post a summary version of the plan on the website and track results. This will assist in providing the community with information about Parks and Recreation’s strategic direction and commitment to results. Summarize the plan’s progress and distribute as part of an annual report.
• A staff person or team should have the responsibility of being the “champion” of the plan’s implementation to help ensure success. This staff person is responsible for monitoring the plan’s progress and works with staff to effectively integrate the plan with operations.
• Assign a leader to each recommendation. Recommendations generally require a team of employees to work on completing it through a cross-functional team and can involve staff from other City departments.
• Regularly report on the plan’s progress. Break the plan into separate fiscal years, and report one year at a time as an ongoing annual work plan. Each recommendation for the year should include a list of tactics that support its completion. It is the project leader’s responsibility to report on their progress on a quarterly basis. Input each year’s data in a spreadsheet or strategic
planning software that lists the recommendations projected start date, completion date and the name of the staff person responsible for completing the recommendation.
• At the end of the year, perform an annual review of the Master Plan and document any changes to initiatives to reflect changes in priorities. This process can be included at an annual review meeting in which successive years’ initiatives are discussed as part of the annual budget process. Initiatives should tie into the budget process.
• After each year of the plan, the staff should review the plan’s process and re-tool any parts of the process that need improvement.
• Track the measures on a quarterly basis. Provide an annual narrative about the results. Review the inventory of measures on an annual basis and adjust as necessary to help ensure the measures continuously add value to decision-making.
• Update major stakeholders on the plan’s implementation and results on an annual basis.
• Conduct staff meetings on a quarterly or semiannual basis to review the plan’s progress and results.
• Track ideas for new strategies that arise and review them periodically to determine if they supplant any existing initiatives.


Vision Workshops
Workshop Dates: October 13th – October 15th 2022
Workshop Dates: October 13th – October 15th 2022
Attendees:
Attendees:
See Sign-In Sheet
See Sign-In Sheet
Consultant Staff: KH: Nick Kuhn, Bonnie Von Ohlsen, Alexa Sikoryak, Halley Bartlett
BerryDunn: Elsa Fischer
Consultant Staff: KH: Nick Kuhn, Bonnie Von Ohlsen, Alexa Sikoryak, Halley Bartlett
BerryDunn: Elsa Fischer
Three Vision Workshops were held in the City of Norwalk on October 13th and October 15th 2022. The workshops included a presentation and two interactive exercises to collect input. The presentation included an outline of guiding documents, demographic trends, park evaluations, level of service, and inventory of available programs, and the initial statistical survey results. Following the presentation, attendees were divided into groups of 5-8 people to participate in two exercises.
Three Vision Workshops were held in the City of Norwalk on October 13th and October 15th 2022. The workshops included a presentation and two interactive exercises to collect input. The presentation included an outline of guiding documents, demographic trends, park evaluations, level of service, and inventory of available programs, and the initial statistical survey results. Following the presentation, attendees were divided into groups of 5-8 people to participate in two exercises.
Exercise 1: SWOT The first activity was to identify Strengths, Weaknesses, Opportunities, and Threats (SWOT) of the existing City of Norwalk Recreation and Parks System over the course of 40 minutes.
Exercise 1: SWOT The first activity was to identify Strengths, Weaknesses, Opportunities, and Threats (SWOT) of the existing City of Norwalk Recreation and Parks System over the course of 40 minutes.
Exercise 2: Goals and Objectives For each identified Sub-System (Programs, Waterfront, Natural and Regional Parks, Community/Neighborhood Parks, School Parks, and Athletic Fields), Participants were prompted to define 1-2 long term goals and for each goal define 1-2 objectives or measurements such as projects, potential partners and/or changes.
Exercise 2: Goals and Objectives For each identified Sub-System (Programs, Waterfront, Natural and Regional Parks, Community/Neighborhood Parks, School Parks, and Athletic Fields), Participants were prompted to define 1-2 long term goals and for each goal define 1-2 objectives or measurements such as projects, potential partners and/or changes.
The following notes document the written input of participants participating in exercises. Written words that were emphasized (underlined, circled, or with and explanation point) have also been emphasized within the format of these notes. Vision Workshop Session 1 and Session 2 included a virtual participation option; the comments of virtual participants are included in the corresponding Vision Workshop Session Notes.
The following notes document the written input of participants participating in exercises. Written words that were emphasized (underlined, circled, or with and explanation point) have also been emphasized within the format of these notes. Vision Workshop Session 1 and Session 2 included a virtual participation option; the comments of virtual participants are included in the corresponding Vision Workshop Session Notes.
Thursday, October 13th, 2022 | 11:00am-3:00pm
GROUP 1

Exercise 1: SWOT
Strengths
Wide Variety of spaces
Workshop Dates: October 13th – October 15th 2022
Beach/Waterfront Access
See Sign-In Sheet
Variety of Programs/Activities

Dedicated Staff
Attendees:
Consultant Staff: KH: Nick Kuhn, Bonnie Von Ohlsen, Alexa Sikoryak, Halley Bartlett
Even distribution throughout theCity
BerryDunn: Elsa Fischer
Kids camps/programs
Most residents in close proximity to parks
Vision (Trails, Parks, Paths)
Concerts at the beach
People Value parks/Services (public support)
Historic facilities on park sites
Mathews Park, Oyster Shell Park, Ryan Park
Sports facilities (tennis, pickleball, etc.
Islands
Three Vision Workshops were held in the City of Norwalk on October 13th and October 15th 2022. The workshops included a presentation and two interactive exercises to collect input. The presentation included an outline of guiding documents, demographic trends, park evaluations, level of service, and inventory of available programs, and the initial statistical survey results. Following the presentation, attendees were divided into groups of 5-8 people to participate in two exercises.
Weaknesses
No Pool
Waterfront Access
Exercise 1: SWOT The first activity was to identify Strengths, Weaknesses, Opportunities, and Threats (SWOT) of the existing City of Norwalk Recreation and Parks System over the course of 40 minutes.
No secure dog parks
Not a lot of indoor facilities
No dedicated facility (YMCA)
Not enough bathrooms
Lack of staff in regard to maintenance
Exercise 2: Goals and Objectives For each identified Sub-System (Programs, Waterfront, Natural and Regional Parks, Community/Neighborhood Parks, School Parks, and Athletic Fields), Participants were prompted to define 1-2 long term goals and for each goal define 1-2 objectives or measurements such as projects, potential partners and/or changes.
Lack of funding
Lack of teen/millennial programming
No mass transit access
Disconnected trails/paths – Norwalk River Valley Trail
Island Access
Harbor Access
The following notes document the written input of participants participating in exercises. Written words that were emphasized (underlined, circled, or with and explanation point) have also been emphasized within the format of these notes. Vision Workshop Session 1 and Session 2 included a virtual participation option; the comments of virtual participants are included in the corresponding Vision Workshop Session Notes.
Larger events/programming
Opportunities
Providing more dog friendly facilities
Acquire more land
More connectivity (bike, pedestrian, etc.)
More indoor recreation
Coordination w/ BOE, and Rec & Parks
Potential access to BOE Facilities
More tourism focused programming
Partnership w/private sector for programming Business Improvement District
Bathrooms at EVERY park
Recreation and Parks Master Plan
Connected and Complete off-street trails
Vision Workshops
Water dependent activity access
Expand hours of operation
Funding opportunities (ARPA)
Workshop Dates: October 13th – October 15th 2022
Green infrastructure
See Sign-In Sheet
Combat Climate change
City coordination
Attendees:
Threats
Climate Change
Flooding
Erosions
Drought
Consultant Staff: KH: Nick Kuhn, Bonnie Von Ohlsen, Alexa Sikoryak, Halley Bartlett
BerryDunn: Elsa Fischer
Funding access
Seasonal/weather extremes
Storms
Overdevelopment
Three Vision Workshops were held in the City of Norwalk on October 13th and October 15th 2022. The workshops included a presentation and two interactive exercises to collect input. The presentation included an outline of guiding documents, demographic trends, park evaluations, level of service, and inventory of available programs, and the initial statistical survey results. Following the presentation, attendees were divided into groups of 5-8 people to participate in two exercises.
Economic fluctuation (pricing)
Siloed work processes/non-coordination
Limited facilities
Pandemics
Exercise 1: SWOT The first activity was to identify Strengths, Weaknesses, Opportunities, and Threats (SWOT) of the existing City of Norwalk Recreation and Parks System over the course of 40 minutes.
Procurement process (length)
ARPA CLIFF
Permitting w/state agencies
Privatization
Wildlife
Exercise 2: Goals and Objectives For each identified Sub-System (Programs, Waterfront, Natural and Regional Parks, Community/Neighborhood Parks, School Parks, and Athletic Fields), Participants were prompted to define 1-2 long term goals and for each goal define 1-2 objectives or measurements such as projects, potential partners and/or changes.
Loss of natural landscapes
Loss of tree canopy
Sound health
Marine life
The following notes document the written input of participants participating in exercises. Written words that were emphasized (underlined, circled, or with and explanation point) have also been emphasized within the format of these notes. Vision Workshop Session 1 and Session 2 included a virtual participation option; the comments of virtual participants are included in the corresponding Vision Workshop Session Notes.
Programs
Goal: Offer a set of year-round programs that are diverse and inclusive
Marketing/awareness
Number of programs
Number of Persons Assisted
Goal: Public indoor and outdoor pool access/programs
Community Rec. Center
School Use
Waterfront, Natural, and Regional Parks
Goal: Increase access and usage of waterfront
Capital and operating funding
Public private partnership
Workshop Dates: October 13th – October 15th 2022
Plans/zoning changes
See Sign-In Sheet
Goal: Water dependent city events - Tourism
Attendees:
Operating funding and staff
Consultant Staff: KH: Nick Kuhn, Bonnie Von Ohlsen, Alexa Sikoryak, Halley Bartlett
Public private partnership (sponsors)
BerryDunn: Elsa Fischer
Goal: Resiliency measure for coastal assets
Any improvements need green infrastructure
Funding/Grants
Community/Neighborhood Parks
Goal: Increase maintenance at all park facilities
Three Vision Workshops were held in the City of Norwalk on October 13th and October 15th 2022. The workshops included a presentation and two interactive exercises to collect input. The presentation included an outline of guiding documents, demographic trends, park evaluations, level of service, and inventory of available programs, and the initial statistical survey results. Following the presentation, attendees were divided into groups of 5-8 people to participate in two exercises.
Staff additions
Staff education
Volunteer activities
Exercise 1: SWOT The first activity was to identify Strengths, Weaknesses, Opportunities, and Threats (SWOT) of the existing City of Norwalk Recreation and Parks System over the course of 40 minutes.
Collaboration w/Parks and BOE
Trash Pickup/Receptacles
Goal: Increase amenity access and availability
Add bathrooms
Exercise 2: Goals and Objectives For each identified Sub-System (Programs, Waterfront, Natural and Regional Parks, Community/Neighborhood Parks, School Parks, and Athletic Fields), Participants were prompted to define 1-2 long term goals and for each goal define 1-2 objectives or measurements such as projects, potential partners and/or changes.
ADA access
Funding
Art
Shade
Storage (bike, boat, etc.)
School Parks
The following notes document the written input of participants participating in exercises. Written words that were emphasized (underlined, circled, or with and explanation point) have also been emphasized within the format of these notes. Vision Workshop Session 1 and Session 2 included a virtual participation option; the comments of virtual participants are included in the corresponding Vision Workshop Session Notes.
Goal: Knowledge of availability and use
Scheduling
Posted hours
Decreased use by private companies
BOE coordination
Goal: Access to indoor School Facilities after hours
Custodial staff
Increased costs/need funding
Athletic Fields
Goal: Increase maintenance and staff
Routine maintenance
Funding needed (sponsorship)
Workshop Dates: October 13th – October 15th 2022
Coordination BOE and Parks
More frequent trash clean ups
See Sign-In Sheet
Attendees:
Goal: Equitable access and equitable programs
Consultant Staff: KH: Nick Kuhn, Bonnie Von Ohlsen, Alexa Sikoryak, Halley Bartlett
Increase connectivity or have more
BerryDunn: Elsa Fischer
Lighting
Many age programming
Inventory and assessment for lighting, bathrooms, etc.
Strengths
Three Vision Workshops were held in the City of Norwalk on October 13th and October 15th 2022. The workshops included a presentation and two interactive exercises to collect input. The presentation included an outline of guiding documents, demographic trends, park evaluations, level of service, and inventory of available programs, and the initial statistical survey results. Following the presentation, attendees were divided into groups of 5-8 people to participate in two exercises.
Beaches and Water/Splash Pads
Variety of fields
Park dispersant/NRVT
Exercise 1: SWOT The first activity was to identify Strengths, Weaknesses, Opportunities, and Threats (SWOT) of the existing City of Norwalk Recreation and Parks System over the course of 40 minutes.
Dog Parks (Taylor Farm, Cranbury, Rowayton)
Public School Parks (Unique)
Trails within parks (Cranbury, NRVT, Oyster Shell)
Weaknesses
Exercise 2: Goals and Objectives For each identified Sub-System (Programs, Waterfront, Natural and Regional Parks, Community/Neighborhood Parks, School Parks, and Athletic Fields), Participants were prompted to define 1-2 long term goals and for each goal define 1-2 objectives or measurements such as projects, potential partners and/or changes.
Not enough staff per acre
Parks and Rec independence (communication/representation)
Lack of sidewalks and bike lanes
Lack of info about park offerings
Access to waterfront
Lack of public pool
The following notes document the written input of participants participating in exercises. Written words that were emphasized (underlined, circled, or with and explanation point) have also been emphasized within the format of these notes. Vision Workshop Session 1 and Session 2 included a virtual participation option; the comments of virtual participants are included in the corresponding Vision Workshop Session Notes.
Availability of public land
Safe access to existing facility
Opportunities
Preserve natural open space
More coordination between city and taxing districts; sharing resources
Opportunities for partnerships
Placemaking (bridge, trees, signage)
Walkability/connectivity
Public Realm space programming
Ability to be responsive to community needs
Threats
Expensive land and lack of it
Lack of adequate staffing level
Lack of budget availability
Climate change
Workshop Dates: October 13th – October 15th 2022
Multiple Park authorities (taxing district)
See Sign-In Sheet
Lack of authority/requirements of future development
Attendees:
Consultant Staff: KH: Nick Kuhn, Bonnie Von Ohlsen, Alexa Sikoryak, Halley Bartlett
BerryDunn: Elsa Fischer
Programs
Goal: Partnering with Schools and Taxing Districts
Quality of School Parks
Establish roles, responsibilities, and partnershipS
Waterfront, Natural, and Regional Parks
Goal: Access to existing facilities
Three Vision Workshops were held in the City of Norwalk on October 13th and October 15th 2022. The workshops included a presentation and two interactive exercises to collect input. The presentation included an outline of guiding documents, demographic trends, park evaluations, level of service, and inventory of available programs, and the initial statistical survey results. Following the presentation, attendees were divided into groups of 5-8 people to participate in two exercises.
Safe and convenient access for kayak launch
Shady Beach launch area is high conflict
Improving pike and walkability to parks - Cranbury Park
Exercise 1: SWOT The first activity was to identify Strengths, Weaknesses, Opportunities, and Threats (SWOT) of the existing City of Norwalk Recreation and Parks System over the course of 40 minutes.
Community/Neighborhood Parks
Goal: Meeting the future need of future park land and needs
Within code, have clear requirements of open space
Having the appropriate staff to support need
Exercise 2: Goals and Objectives For each identified Sub-System (Programs, Waterfront, Natural and Regional Parks, Community/Neighborhood Parks, School Parks, and Athletic Fields), Participants were prompted to define 1-2 long term goals and for each goal define 1-2 objectives or measurements such as projects, potential partners and/or changes.
School Parks
Goal: Age-appropriate facilities
Maintain quality amenities consistent through all locations
Athletic Fields
The following notes document the written input of participants participating in exercises. Written words that were emphasized (underlined, circled, or with and explanation point) have also been emphasized within the format of these notes. Vision Workshop Session 1 and Session 2 included a virtual participation option; the comments of virtual participants are included in the corresponding Vision Workshop Session Notes.
Goal: Meeting demands/interests of residents
Having clear avenue for public input
Having budget that is available to meet needs
GROUP 3
Exercise 1: SWOT
Park ranger – security cameras – P.D.
Restrooms
Add Lighting/security cameras
Upgrade existing
Add shade trees
Threats
Capital Budget Funds
Operating budget funds
Workshop Dates: October 13th – October 15th 2022
Lack levels of adequate staff
Climate Change
Lack of security
Attendees:
Lack of equipment
Competing priorities
Lack of walkable parks
Electric [leaf] blowers
See Sign-In Sheet
Consultant Staff: KH: Nick Kuhn, Bonnie Von Ohlsen, Alexa Sikoryak, Halley Bartlett
BerryDunn: Elsa Fischer
Programs
Getting a marketing person
Three Vision Workshops were held in the City of Norwalk on October 13th and October 15th 2022. The workshops included a presentation and two interactive exercises to collect input. The presentation included an outline of guiding documents, demographic trends, park evaluations, level of service, and inventory of available programs, and the initial statistical survey results. Following the presentation, attendees were divided into groups of 5-8 people to participate in two exercises.
Better coordination between departments (website and seasonal meetings)
More research and data analysis
Allocating funding in a better way
Hold fundraisers to increase funds
Exercise 1: SWOT The first activity was to identify Strengths, Weaknesses, Opportunities, and Threats (SWOT) of the existing City of Norwalk Recreation and Parks System over the course of 40 minutes.
Public outreach programs (at schools, parks, and community centers)
Waterfront, Natural, and Regional Parks
Adopt master plan to organize initiatives and implement them
Purchase land around Ryan Park and South Norwalk
Exercise 2: Goals and Objectives For each identified Sub-System (Programs, Waterfront, Natural and Regional Parks, Community/Neighborhood Parks, School Parks, and Athletic Fields), Participants were prompted to define 1-2 long term goals and for each goal define 1-2 objectives or measurements such as projects, potential partners and/or changes.
Redo the Kayak launches at Shady
Identify a spot for a community center
Reclaim vacant properties for community use
Reclaim YMCA property (eminent domain)
Community/Neighborhood Parks
The following notes document the written input of participants participating in exercises. Written words that were emphasized (underlined, circled, or with and explanation point) have also been emphasized within the format of these notes. Vision Workshop Session 1 and Session 2 included a virtual participation option; the comments of virtual participants are included in the corresponding Vision Workshop Session Notes.
Goal: Make parks safe, accessible, and provide amenities that lead to community use
Obtain funding
Park rangers
Cameras and signage
Maintenance
Drainage
School Parks
Goal: Improve existing facilities
Provide public bathrooms
Upgrade equipment
Recreation and Parks Master Plan
Increase/improve lighting outdoors
Vision Workshops
Improve maintenance (trash)
More garbage cans
Goal: Provide age – appropriate facilities
Workshop Dates: October 13th – October 15th 2022
Design playgrounds for use by all ages
Athletic Fields
Attendees:
See Sign-In Sheet
Consultant Staff: KH: Nick Kuhn, Bonnie Von Ohlsen, Alexa Sikoryak, Halley Bartlett
Goal: improve existing indoor facilities (Broad River Sports Complex)
Obtain property
Modernize
BerryDunn: Elsa Fischer
Add amenities (Concessions, bathrooms)
Goal: Develop Community Center
Obtain property
GROUP 4
Three Vision Workshops were held in the City of Norwalk on October 13th and October 15th 2022. The workshops included a presentation and two interactive exercises to collect input. The presentation included an outline of guiding documents, demographic trends, park evaluations, level of service, and inventory of available programs, and the initial statistical survey results. Following the presentation, attendees were divided into groups of 5-8 people to participate in two exercises.
Exercise 1: SWOT
Exercise 1: SWOT The first activity was to identify Strengths, Weaknesses, Opportunities, and Threats (SWOT) of the existing City of Norwalk Recreation and Parks System over the course of 40 minutes.
Strengths
Waterfront/Beach
Accessible Transit/Highway
Shellfish industry/History
Oak Hills Golf and sledding
Many parks/variety
Exercise 2: Goals and Objectives For each identified Sub-System (Programs, Waterfront, Natural and Regional Parks, Community/Neighborhood Parks, School Parks, and Athletic Fields), Participants were prompted to define 1-2 long term goals and for each goal define 1-2 objectives or measurements such as projects, potential partners and/or changes.
Splashpads
Natural open space
Variety of programs (5k, music programs, concerts at beach, social activities, camps)
Harbor front
Public Marina
Norwalk River Valley Trail
The following notes document the written input of participants participating in exercises. Written words that were emphasized (underlined, circled, or with and explanation point) have also been emphasized within the format of these notes. Vision Workshop Session 1 and Session 2 included a virtual participation option; the comments of virtual participants are included in the corresponding Vision Workshop Session Notes.
Weaknesses
Not enough trails (NRVT is short)
Sidewalks (lack of)
Traffic and the bridge
Ferry to islands-timing
Lack of trees/shade along city streets (maintenance issue)
No Pools
Water access for public (kayak, beach)
Understaffed Recreation and Park Department (Park Maintenance)
Opportunities
Recreation and Parks Master Plan Vision Workshops
Use lights to extend use of facilities and security
Increase amenities across all neighborhoods
Basketball courts – Siting
Workshop Dates: October 13th – October 15th 2022
Opportunity to provide more low fee/creative access to programs/reach more people
Community-wide Recreation Center/Field house
See Sign-In Sheet
Recreation and park public programs to all youth
Pickleball courts (at beach?)
Attendees:
Mark trails in the nature preserves/more nature preserves
Consultant Staff: KH: Nick Kuhn, Bonnie Von Ohlsen, Alexa Sikoryak, Halley Bartlett
BerryDunn: Elsa Fischer
Threats
Resource Funding
Climate Change – sea level rise, flooding, more storm events
Competition with other towns – (Facilities)
Outsourcing/privatization of resources
Maintaining and improving existing Quality of facilities/programs
Change of administration/ political will
Public safety/security of facilities
Three Vision Workshops were held in the City of Norwalk on October 13th and October 15th 2022. The workshops included a presentation and two interactive exercises to collect input. The presentation included an outline of guiding documents, demographic trends, park evaluations, level of service, and inventory of available programs, and the initial statistical survey results. Following the presentation, attendees were divided into groups of 5-8 people to participate in two exercises.
Parking issues
Maintenance equipment/upkeep - cost
Exercise 1: SWOT The first activity was to identify Strengths, Weaknesses, Opportunities, and Threats (SWOT) of the existing City of Norwalk Recreation and Parks System over the course of 40 minutes.
Exercise 2: Goals and Objectives
Programs
Goal: Provide equitable and affordable programs
Develop a sliding scale for program fees
Improve communication to reach all residents (All languages, ages, neighbors)
Exercise 2: Goals and Objectives For each identified Sub-System (Programs, Waterfront, Natural and Regional Parks, Community/Neighborhood Parks, School Parks, and Athletic Fields), Participants were prompted to define 1-2 long term goals and for each goal define 1-2 objectives or measurements such as projects, potential partners and/or changes.
Waterfront, Natural, and Regional Parks
Goal: Develop better access to waterfront and aquatic recreation (ponds, rivers, harbor)
Develop a soft launch into harbor and other waterways
Build another public pool
The following notes document the written input of participants participating in exercises. Written words that were emphasized (underlined, circled, or with and explanation point) have also been emphasized within the format of these notes. Vision Workshop Session 1 and Session 2 included a virtual participation option; the comments of virtual participants are included in the corresponding Vision Workshop Session Notes.
Community/Neighborhood Parks
Goal: Improve safety and security in public parks
Better lighting
Security cameras
Safe walking access
Maintain sightlines
School Parks
Goal: Upgrade and improve maintenance of school parks
Improve and upgrade equipment for playgrounds
Level fields and improve grass
Athletic Fields
Goal: More multipurpose fields
Evaluate possible location for new fields
Workshop Dates: October 13th – October 15th 2022
Repurpose existing fields
GROUP 5
Attendees:
Exercise 1: SWOT
Strengths
See Sign-In Sheet
Consultant Staff: KH: Nick Kuhn, Bonnie Von Ohlsen, Alexa Sikoryak, Halley Bartlett
BerryDunn: Elsa Fischer
Programs: Aquatics, Camp Events
Waterfront: Beach/Water access, Splash Pads, Shady Beach
Community: Taxing District Parks (clean), Big Dog Parks, Historical
School Parks: Diversity
Parks and Recs team = Good Communication
Athletic Facilities: Nathan Hale, West Rocks, BM, NHS (Outdoors), Pickleball Courts
Three Vision Workshops were held in the City of Norwalk on October 13th and October 15th 2022. The workshops included a presentation and two interactive exercises to collect input. The presentation included an outline of guiding documents, demographic trends, park evaluations, level of service, and inventory of available programs, and the initial statistical survey results. Following the presentation, attendees were divided into groups of 5-8 people to participate in two exercises.
Weaknesses
No community center
Parking
Exercise 1: SWOT The first activity was to identify Strengths, Weaknesses, Opportunities, and Threats (SWOT) of the existing City of Norwalk Recreation and Parks System over the course of 40 minutes.
Capacity for programs
Accessibility
Space
Bathrooms can’t host sport tournaments (Vets)
Need better transportation to large parks/beach
Public Pool
Exercise 2: Goals and Objectives For each identified Sub-System (Programs, Waterfront, Natural and Regional Parks, Community/Neighborhood Parks, School Parks, and Athletic Fields), Participants were prompted to define 1-2 long term goals and for each goal define 1-2 objectives or measurements such as projects, potential partners and/or changes.
Lack of funding/investment vs. other communities
Need more staff
Geographic diversity
Lack of senior and early childhood programs
Need more equipment
The following notes document the written input of participants participating in exercises. Written words that were emphasized (underlined, circled, or with and explanation point) have also been emphasized within the format of these notes. Vision Workshop Session 1 and Session 2 included a virtual participation option; the comments of virtual participants are included in the corresponding Vision Workshop Session Notes.
Cleanliness
Lack of ownership
Relationship w/schools
Lack of special needs programs/equipment
Sliding scale/scholarship
Not enough benches
Not enough garbage cans
New facilities in underserved areas
Funding
Private/public partnerships
Private fundraising
Green facility
New sponsors
Community and recreation center – the old YMCA
Strengthen communication with neighbors
Workshop Dates: October 13th – October 15th 2022
Improve relationship with schools
See Sign-In Sheet
Waterfront activities/programs – utilize waterfront
Use other parks for programs
Attendees:
Threats
Isolation
Competition
Funding
Staffing
Consultant Staff: KH: Nick Kuhn, Bonnie Von Ohlsen, Alexa Sikoryak, Halley Bartlett
BerryDunn: Elsa Fischer
High needs and high numbers
Privatize
No park standards
Everyone calls/tags Ken
Three Vision Workshops were held in the City of Norwalk on October 13th and October 15th 2022. The workshops included a presentation and two interactive exercises to collect input. The presentation included an outline of guiding documents, demographic trends, park evaluations, level of service, and inventory of available programs, and the initial statistical survey results. Following the presentation, attendees were divided into groups of 5-8 people to participate in two exercises.
Lack of training
Lack of communication between departments
Vandalizing/graffiti
Lack of strategy
Exercise 1: SWOT The first activity was to identify Strengths, Weaknesses, Opportunities, and Threats (SWOT) of the existing City of Norwalk Recreation and Parks System over the course of 40 minutes.
Not enough walkability
Lack of enforcement
Lack of responsibility (by users)
Exercise 2: Goals and Objectives For each identified Sub-System (Programs, Waterfront, Natural and Regional Parks, Community/Neighborhood Parks, School Parks, and Athletic Fields), Participants were prompted to define 1-2 long term goals and for each goal define 1-2 objectives or measurements such as projects, potential partners and/or changes.
Programs
Goal: place to put programs Community Center
Partnership fundraising/foundation
Goal: better communication about programs
The following notes document the written input of participants participating in exercises. Written words that were emphasized (underlined, circled, or with and explanation point) have also been emphasized within the format of these notes. Vision Workshop Session 1 and Session 2 included a virtual participation option; the comments of virtual participants are included in the corresponding Vision Workshop Session Notes.
Revamp website
Goal: more staffing
Lobby the CC and BET
Waterfront, Natural, and Regional Parks
Goal: More access
Repurpose waterfront properties (Vets park)
Goal: more activities
Communication, partnerships, funding, park maintenance
Community/Neighborhood Parks
Goal: have more
Identify areas and fund them
Workshop Dates: October 13th – October 15th 2022
Goal: accessibility (ADA, walkability, parking, bike- ability)
See Sign-In Sheet
Identify where there are gaps bring in Jim Travers
Attendees:
School Parks
Consultant Staff: KH: Nick Kuhn, Bonnie Von Ohlsen, Alexa Sikoryak, Halley Bartlett
BerryDunn: Elsa Fischer
Goal: Responsibility/accountability/standardization
Identify who has ownership and make them standardized collaboration
Goal: be proactive
Strategize and prioritize, make a plan
Athletic Fields
Goal: Need more for all people/leagues, need more staff/training
Three Vision Workshops were held in the City of Norwalk on October 13th and October 15th 2022. The workshops included a presentation and two interactive exercises to collect input. The presentation included an outline of guiding documents, demographic trends, park evaluations, level of service, and inventory of available programs, and the initial statistical survey results. Following the presentation, attendees were divided into groups of 5-8 people to participate in two exercises.
How short are we?
How do we fund this?
Exercise 1: SWOT The first activity was to identify Strengths, Weaknesses, Opportunities, and Threats (SWOT) of the existing City of Norwalk Recreation and Parks System over the course of 40 minutes.
Goal: Maintenance
More staff/funding
Goal: indoor facility/pool
Plan for a community center
GROUP 6
Exercise 2: Goals and Objectives For each identified Sub-System (Programs, Waterfront, Natural and Regional Parks, Community/Neighborhood Parks, School Parks, and Athletic Fields), Participants were prompted to define 1-2 long term goals and for each goal define 1-2 objectives or measurements such as projects, potential partners and/or changes.
Exercise 1: SWOT
Strengths
Great waterfront/beaches
The following notes document the written input of participants participating in exercises. Written words that were emphasized (underlined, circled, or with and explanation point) have also been emphasized within the format of these notes. Vision Workshop Session 1 and Session 2 included a virtual participation option; the comments of virtual participants are included in the corresponding Vision Workshop Session Notes.
Plenty of sport activity programs including (tennis, pickleball, softball, volleyball, swimming)
Ryan Park, Cranbury Park, Calf Pasture, Shady beach, Taylor farm are great popular parks, NRVT and Oak Hills
Naramake, Fox Run, Cranbury School, Brian McMahon have great school parks
Community Gardens
Athletic facilities (West Rock, McMahon, Nathan Hale, Norwalk High)
Staffing
Proper equipment
No public pool – indoor/outdoor
Access to fields
Trail at Cranbury Park needs cleanup – need more natural trails
More bathroom access
Training and development of staff
Need more community/rec centers
Need more waterfront access
Workshop Dates: October 13th – October 15th 2022
Lack of available land
Opportunities
Attendees:
Focus on Urban Core
See Sign-In Sheet
Consultant Staff: KH: Nick Kuhn, Bonnie Von Ohlsen, Alexa Sikoryak, Halley Bartlett
Advancement of waterfront access
BerryDunn: Elsa Fischer
Timing and funding of master plan
Opportunity of signage
Walkability/bike-ability
Tree planting
Threats
Lack of funding
Climate change
Three Vision Workshops were held in the City of Norwalk on October 13th and October 15th 2022. The workshops included a presentation and two interactive exercises to collect input. The presentation included an outline of guiding documents, demographic trends, park evaluations, level of service, and inventory of available programs, and the initial statistical survey results. Following the presentation, attendees were divided into groups of 5-8 people to participate in two exercises.
Security at parks/schools
City [and] School friction
Lack of land for new parks
Lack of pride in some parks
Exercise 1: SWOT The first activity was to identify Strengths, Weaknesses, Opportunities, and Threats (SWOT) of the existing City of Norwalk Recreation and Parks System over the course of 40 minutes.
Lack of staff
Programming, not keeping up with changing demographics
Challenge to make improvements from low to high priority
Exercise 2: Goals and Objectives For each identified Sub-System (Programs, Waterfront, Natural and Regional Parks, Community/Neighborhood Parks, School Parks, and Athletic Fields), Participants were prompted to define 1-2 long term goals and for each goal define 1-2 objectives or measurements such as projects, potential partners and/or changes.
Programs
Goal: Increased participation
Income-based pricing
More programming
Outreach – teens, early childhood, underprivileged, etc.
The following notes document the written input of participants participating in exercises. Written words that were emphasized (underlined, circled, or with and explanation point) have also been emphasized within the format of these notes. Vision Workshop Session 1 and Session 2 included a virtual participation option; the comments of virtual participants are included in the corresponding Vision Workshop Session Notes.
Goal: Increased breadth of programs
Needs assessment
Skilled staff (additional hires)
Waterfront, Natural, and Regional Parks
Goal: Increased access
Optimize use of City land at water
Signage
Sidewalks/trails leading to water
Goal: Better utilization of River/Waterfront
Harbor-Loop Trail and NRVT improvements
Goal: Increased Flood Resilience
Natural Shorelines
Workshop Dates: October 13th – October 15th 2022
Goal: Increase improved trails
See Sign-In Sheet
Increase maintenance
Attendees:
Increase connectivity
Consultant Staff: KH: Nick Kuhn, Bonnie Von Ohlsen, Alexa Sikoryak, Halley Bartlett
BerryDunn: Elsa Fischer
Community/Neighborhood Parks
Goal: Increase User Amenities
Provide public bathrooms
Seating/shaded areas
Picnic areas
Kayak racks/access
Goal: Increase Community Events
Three Vision Workshops were held in the City of Norwalk on October 13th and October 15th 2022. The workshops included a presentation and two interactive exercises to collect input. The presentation included an outline of guiding documents, demographic trends, park evaluations, level of service, and inventory of available programs, and the initial statistical survey results. Following the presentation, attendees were divided into groups of 5-8 people to participate in two exercises.
Organized events – Music, entertainment, block parties, festivals
Goal: Find your park
Wayfinding
Exercise 1: SWOT The first activity was to identify Strengths, Weaknesses, Opportunities, and Threats (SWOT) of the existing City of Norwalk Recreation and Parks System over the course of 40 minutes.
Trails/sidewalks/connections
All need Staff
School Parks
Exercise 2: Goals and Objectives For each identified Sub-System (Programs, Waterfront, Natural and Regional Parks, Community/Neighborhood Parks, School Parks, and Athletic Fields), Participants were prompted to define 1-2 long term goals and for each goal define 1-2 objectives or measurements such as projects, potential partners and/or changes.
Goal: Equitable access to fields
Stakeholder coordination
Technology to schedule
Goal: support youth activities
Advertisements/outreach
The following notes document the written input of participants participating in exercises. Written words that were emphasized (underlined, circled, or with and explanation point) have also been emphasized within the format of these notes. Vision Workshop Session 1 and Session 2 included a virtual participation option; the comments of virtual participants are included in the corresponding Vision Workshop Session Notes.
Goal: Coordination with school leadership
Shared resources
Better communication
Athletic Fields
Goal: User Amenities
Bathroom access
Concessions
Goal: Equitable access
Eliminating historic preferences
Camps, clinics, to add participation
Goal: Increase staff/resources to maintain existing fields
More funding
Workshop Dates: October 13th – October 15th 2022
GROUP 7
See Sign-In Sheet
Exercise 1: SWOT
Attendees:
Strengths
Consultant Staff: KH: Nick Kuhn, Bonnie Von Ohlsen, Alexa Sikoryak, Halley Bartlett
BerryDunn: Elsa Fischer
Programs: Aquatics, Holiday programs, summer camps, youth sports
Waterfront/Natural/Regional Parks: Great beach, walking trails (Cranbury Park), Boating opportunities
Neighborhood/Community Parks: Overall cleanliness, recent capital improvements, multi-use, rental revenue (walks/weddings/ER)
School parks: Playgrounds, turf fields
Athletic facility: New pickleball courts, new turf complexes/lights
Three Vision Workshops were held in the City of Norwalk on October 13th and October 15th 2022. The workshops included a presentation and two interactive exercises to collect input. The presentation included an outline of guiding documents, demographic trends, park evaluations, level of service, and inventory of available programs, and the initial statistical survey results. Following the presentation, attendees were divided into groups of 5-8 people to participate in two exercises.
Weaknesses
Exercise 1: SWOT The first activity was to identify Strengths, Weaknesses, Opportunities, and Threats (SWOT) of the existing City of Norwalk Recreation and Parks System over the course of 40 minutes.
Programs: Senior programs, special need programming, limited indoor facility, toddler programming
Waterfront/Natural/Regional Parks: Crowded, inadequate parking, not enough public access, canoe/kayak access
Exercise 2: Goals and Objectives For each identified Sub-System (Programs, Waterfront, Natural and Regional Parks, Community/Neighborhood Parks, School Parks, and Athletic Fields), Participants were prompted to define 1-2 long term goals and for each goal define 1-2 objectives or measurements such as projects, potential partners and/or changes.
Neighborhood/Community Parks: parking (Ryan/Ludlow), Cleanliness/AKE, Litter, Bathroom graffiti, lighting
School parks: Need more amenities for kids, litter, cooperation w/BOE
Athletic facility: Lack of bathrooms, Community center, condition (drainage), pay for parking, indoor basketball
Budget and Staff
Opportunities
Programs: more staff = more programs [and] variety
The following notes document the written input of participants participating in exercises. Written words that were emphasized (underlined, circled, or with and explanation point) have also been emphasized within the format of these notes. Vision Workshop Session 1 and Session 2 included a virtual participation option; the comments of virtual participants are included in the corresponding Vision Workshop Session Notes.
Waterfront/Natural/Regional Parks: kayak launch, additional access, more signage - beach
Neighborhood/Community Parks: uniform signage, more staff=increased maintenance
School parks: Equity in amenities across all school sites, outdoor bathrooms
Athletic facility: pool, community center, skating rink, classroom space, update existing facilities
Threats
Programs: Staff levels/budget/facilities, competitors
Waterfront/Natural/Regional Parks: Changing weather/erosion, out of town vs. resident access, lack of parking
Neighborhood/Community Parks: Additional park space needs staffing levels for maintenance, lack of proper maintenance equipment
School parks: security, increased use by schools
Athletic facility: budget, space for additional fields
Exercise 2: Goals and Objectives
Workshop Dates: October 13th – October 15th 2022
Programs
Goal: Best [and] most diverse programming reaching the most amount of people
Attendees:
See Sign-In Sheet
Funding for new staff and facilities
Consultant Staff: KH: Nick Kuhn, Bonnie Von Ohlsen, Alexa Sikoryak, Halley Bartlett
Need capital funds for community center
BerryDunn: Elsa Fischer
Goal: increase outreach to underserved communities
Offering programs within the community
Waterfront, Natural, and Regional Parks
Goal: Increased public access
Land purchases
Capital funds for launch ramps
Pedestrian access
Three Vision Workshops were held in the City of Norwalk on October 13th and October 15th 2022. The workshops included a presentation and two interactive exercises to collect input. The presentation included an outline of guiding documents, demographic trends, park evaluations, level of service, and inventory of available programs, and the initial statistical survey results. Following the presentation, attendees were divided into groups of 5-8 people to participate in two exercises.
Community/Neighborhood Parks
Goal: upgrade facilities including bathrooms
Exercise 1: SWOT The first activity was to identify Strengths, Weaknesses, Opportunities, and Threats (SWOT) of the existing City of Norwalk Recreation and Parks System over the course of 40 minutes.
Capital funding for new improvements
Goal: more complete maintenance
Budget staffing requests
School Parks
Exercise 2: Goals and Objectives For each identified Sub-System (Programs, Waterfront, Natural and Regional Parks, Community/Neighborhood Parks, School Parks, and Athletic Fields), Participants were prompted to define 1-2 long term goals and for each goal define 1-2 objectives or measurements such as projects, potential partners and/or changes.
Goal: Cooperation with Board of Education
Joint Use agreement
Goal: Litter control
Additional staffing request
The following notes document the written input of participants participating in exercises. Written words that were emphasized (underlined, circled, or with and explanation point) have also been emphasized within the format of these notes. Vision Workshop Session 1 and Session 2 included a virtual participation option; the comments of virtual participants are included in the corresponding Vision Workshop Session Notes.
Athletic Fields
Goal: Community Center with Pool
Capital funding request or other appropriation
Bake sale
Goal: Condition of fields – provide preventative maintenance
Drainage study for highly used sites
Goal: Bathroom Buildings
Capital request
Staff to clean/stock/open/close
Workshop Dates: October 13th – October 15th 2022
See Sign-In Sheet
Attendees:
Consultant Staff: KH: Nick Kuhn, Bonnie Von Ohlsen, Alexa Sikoryak, Halley Bartlett
BerryDunn: Elsa Fischer
Three Vision Workshops were held in the City of Norwalk on October 13th and October 15th 2022. The workshops included a presentation and two interactive exercises to collect input. The presentation included an outline of guiding documents, demographic trends, park evaluations, level of service, and inventory of available programs, and the initial statistical survey results. Following the presentation, attendees were divided into groups of 5-8 people to participate in two exercises.
Exercise 1: SWOT The first activity was to identify Strengths, Weaknesses, Opportunities, and Threats (SWOT) of the existing City of Norwalk Recreation and Parks System over the course of 40 minutes.
Exercise 2: Goals and Objectives For each identified Sub-System (Programs, Waterfront, Natural and Regional Parks, Community/Neighborhood Parks, School Parks, and Athletic Fields), Participants were prompted to define 1-2 long term goals and for each goal define 1-2 objectives or measurements such as projects, potential partners and/or changes.
The following notes document the written input of participants participating in exercises. Written words that were emphasized (underlined, circled, or with and explanation point) have also been emphasized within the format of these notes. Vision Workshop Session 1 and Session 2 included a virtual participation option; the comments of virtual participants are included in the corresponding Vision Workshop Session Notes.
Thursday, October 13th, 2022 | 5:00pm-8:30pm
GROUP 1
Exercise 1: SWOT
Strengths
Diversity of types of parks
Workshop Dates: October 13th – October 15th 2022
Amount of coastline we have
See Sign-In Sheet
Variety of options for children
Plus easy to drive from one to the other
Attendees:
Consultant Staff: KH: Nick Kuhn, Bonnie Von Ohlsen, Alexa Sikoryak, Halley Bartlett
Older parks and newer parks that are both good
BerryDunn: Elsa Fischer
Norwalk has unique parks (Sheffield Island)
Weaknesses
Access to waterfront – specifically SoNo
Lack of indoor tennis and pickleball options
Lack of fenced in dog parks and dog parks in general
Lack of YMCA or Rec Center w/pool
Lack of Community Center
Access to parks for kids in public housing
Three Vision Workshops were held in the City of Norwalk on October 13th and October 15th 2022. The workshops included a presentation and two interactive exercises to collect input. The presentation included an outline of guiding documents, demographic trends, park evaluations, level of service, and inventory of available programs, and the initial statistical survey results. Following the presentation, attendees were divided into groups of 5-8 people to participate in two exercises.
Connected bike path system
Prioritizing it when re-doing a road
Exercise 1: SWOT The first activity was to identify Strengths, Weaknesses, Opportunities, and Threats (SWOT) of the existing City of Norwalk Recreation and Parks System over the course of 40 minutes.
Opportunities
Planning for pedestrian (specifically children) traffic for new SoNo School
Bubble being built over tennis courts at Springwood Park (Grassroots)
Expand access to public housing areas from parks
Increased number of dogs w/covid and amount of dogs allowed and in apartments creates opportunity to create more dog friendly space
Exercise 2: Goals and Objectives For each identified Sub-System (Programs, Waterfront, Natural and Regional Parks, Community/Neighborhood Parks, School Parks, and Athletic Fields), Participants were prompted to define 1-2 long term goals and for each goal define 1-2 objectives or measurements such as projects, potential partners and/or changes.
More thought into parking needs for events or shuttle bus options
Opening all parks to leased dogs
Threats
Increased number of residents with more developments/condos
Increased amount of dogs due to covid and above mentioned apartments
The following notes document the written input of participants participating in exercises. Written words that were emphasized (underlined, circled, or with and explanation point) have also been emphasized within the format of these notes. Vision Workshop Session 1 and Session 2 included a virtual participation option; the comments of virtual participants are included in the corresponding Vision Workshop Session Notes.
Climate change on coastline
Underfunding for maintenance planning for future
Red tape to get a tennis bubble (that is fully funded) approved
Short term rentals
Development by large corporations’ trees being cut down (Eversource)
Programs
Goal: Access to affordable/free swimming lessons (life skill)
Recreation and Parks Master Plan
See if we can get grants/capital for a new pool
Vision Workshops
Or corporate donations
Goal: Build a community/athletic center (w/pool?)
Identify space for this center
Workshop Dates: October 13th – October 15th 2022
Identify funding
See Sign-In Sheet
Goal: Grow Grassroots tennis
Attendees:
Consultant Staff: KH: Nick Kuhn, Bonnie Von Ohlsen, Alexa Sikoryak, Halley Bartlett
Reach more families in Norwalk
BerryDunn: Elsa Fischer
Develop more ways to teach kids both on and off the occurs
Continue to support concussion education
Waterfront, Natural, and Regional Parks
Goal: Access and Parking
Better planning prior to events w/learning from previous years
Parks and Rec representative at town transport meetings/decisions
Adding connecting bike paths and pedestrian access
Three Vision Workshops were held in the City of Norwalk on October 13th and October 15th 2022. The workshops included a presentation and two interactive exercises to collect input. The presentation included an outline of guiding documents, demographic trends, park evaluations, level of service, and inventory of available programs, and the initial statistical survey results. Following the presentation, attendees were divided into groups of 5-8 people to participate in two exercises.
Goal: Increase access to more waterfront
Allow for more parking further away with good walking paths
Goal: More programming for watersport activities
Exercise 1: SWOT The first activity was to identify Strengths, Weaknesses, Opportunities, and Threats (SWOT) of the existing City of Norwalk Recreation and Parks System over the course of 40 minutes.
Sailing, Kayaking, Paddleboard
Community/Neighborhood Parks
Goal: Increase Maintenance and upkeep
Exercise 2: Goals and Objectives For each identified Sub-System (Programs, Waterfront, Natural and Regional Parks, Community/Neighborhood Parks, School Parks, and Athletic Fields), Participants were prompted to define 1-2 long term goals and for each goal define 1-2 objectives or measurements such as projects, potential partners and/or changes.
Engage volunteers or incentivize workers more often
Look at historical investment and compare to population growth – adjust accordingly
Goal: Increase diversity of activities for all ages and abilities
Study each park and note its features and age and add missing options where possible
Look at age of people living near respective parks and plan accordingly
The following notes document the written input of participants participating in exercises. Written words that were emphasized (underlined, circled, or with and explanation point) have also been emphasized within the format of these notes. Vision Workshop Session 1 and Session 2 included a virtual participation option; the comments of virtual participants are included in the corresponding Vision Workshop Session Notes.
School Parks
Goal: Fix bureaucracy and political issues between Schools and Parks and Rec. Joint use agreement of public vs. programs.
Set up a committee with members from both to discuss
Gather data and monitor changes in school outdoor related incidents
Athletic Fields
Goal: Rec Center and Aquatic Center
Field Locations
Find funding
Allow local programs and ideas (community design?)
Affordable and free swim lessons (Stew’s)
GROUP 2
Workshop Dates: October 13th – October 15th 2022
Exercise 1: SWOT
Strengths
Attendees:
See Sign-In Sheet
Consultant Staff: KH: Nick Kuhn, Bonnie Von Ohlsen, Alexa Sikoryak, Halley Bartlett
Programs: Summer Camps, Skate camp, adult sports programs
BerryDunn: Elsa Fischer
Water/Nature Parks: Views of the Sound/access to Sound, Golf Course
School Parks: School gyms (indoors), Highschool walking track and City Hall
Neighborhood parks: Event Space (Vets/Oster Shell), pocket parks
Athletics: Tennis programs (shared use), Youth Sports (Baseball/basketball), Disc Golf (Cranbury)
Weaknesses
Lack of indoor facilities/pools – pickleball, sports generally (e.g. Chelsea Piers)
Volleyball court drainage
Three Vision Workshops were held in the City of Norwalk on October 13th and October 15th 2022. The workshops included a presentation and two interactive exercises to collect input. The presentation included an outline of guiding documents, demographic trends, park evaluations, level of service, and inventory of available programs, and the initial statistical survey results. Following the presentation, attendees were divided into groups of 5-8 people to participate in two exercises.
Accessibility – pedestrian access (Vets) and lack of sidewalks, unsafe bike lanes (Calf Pasture)
Restrooms (hours/signage)
Exercise 1: SWOT The first activity was to identify Strengths, Weaknesses, Opportunities, and Threats (SWOT) of the existing City of Norwalk Recreation and Parks System over the course of 40 minutes.
Rec center (e.g. Warney)
QR code surrounding towns have
Opportunities
Connectivity – completing NRVT
Vets Park – Promenade, trees, flood control
Exercise 2: Goals and Objectives For each identified Sub-System (Programs, Waterfront, Natural and Regional Parks, Community/Neighborhood Parks, School Parks, and Athletic Fields), Participants were prompted to define 1-2 long term goals and for each goal define 1-2 objectives or measurements such as projects, potential partners and/or changes.
Special events (Concerts/shows) Roosevelt Island type events
Transit access and more frequent buses
Pairing new development with new park space (P & Z a requirement)
Indoor courts conversion during the winter (bubble)
Bike racks (w/cameras)
The following notes document the written input of participants participating in exercises. Written words that were emphasized (underlined, circled, or with and explanation point) have also been emphasized within the format of these notes. Vision Workshop Session 1 and Session 2 included a virtual participation option; the comments of virtual participants are included in the corresponding Vision Workshop Session Notes.
Central hub for department communications (website)
Threats
Climate change – sea level rise, water quality (beach closures)
Safety/security – especially at bathrooms and bike racks
Better facilities in other towns – especially senior programming
Poor communication/advertising – better communication [could lead to] more support and funding
Programs
Goal: Senior programs Coordinated with Community Services Department
Recreation and Parks Master Plan
Waterfront, Natural, and Regional Parks & Community/Neighborhood Parks
Vision Workshops
Goal: Activities at Vets Park and at Calf Pasture
Goal: Environmental Programs
Nature
Workshop Dates: October 13th – October 15th 2022
Bird watching
See Sign-In Sheet
Goal: Oak Hills multi-use
Attendees:
Trails
Pool Pickleball
Consultant Staff: KH: Nick Kuhn, Bonnie Von Ohlsen, Alexa Sikoryak, Halley Bartlett
BerryDunn: Elsa Fischer
Goal: River Valley Trail Promotion and Connection
Goal: Safe Pedestrian/Bike Access
Security Cameras
Bathroom Hours and Access
Parking Lots
Three Vision Workshops were held in the City of Norwalk on October 13th and October 15th 2022. The workshops included a presentation and two interactive exercises to collect input. The presentation included an outline of guiding documents, demographic trends, park evaluations, level of service, and inventory of available programs, and the initial statistical survey results. Following the presentation, attendees were divided into groups of 5-8 people to participate in two exercises.
Goal: Underutilized Vets Park
Goal: Harbor Loop Trail – disjointed
Goal: Water refill stations
Goal: Purchase more space for parks “Imminent Domain”
Exercise 1: SWOT The first activity was to identify Strengths, Weaknesses, Opportunities, and Threats (SWOT) of the existing City of Norwalk Recreation and Parks System over the course of 40 minutes.
Lakota Oaks
School Parks
Security
Public access posting hours of accessibility
Exercise 2: Goals and Objectives For each identified Sub-System (Programs, Waterfront, Natural and Regional Parks, Community/Neighborhood Parks, School Parks, and Athletic Fields), Participants were prompted to define 1-2 long term goals and for each goal define 1-2 objectives or measurements such as projects, potential partners and/or changes.
ADE- Devices, secured by cameras
Water refill stations
Athletic Fields
Goal: Recreation/Community center like a YMCA
Goal: City Public/Private Partnership
The following notes document the written input of participants participating in exercises. Written words that were emphasized (underlined, circled, or with and explanation point) have also been emphasized within the format of these notes. Vision Workshop Session 1 and Session 2 included a virtual participation option; the comments of virtual participants are included in the corresponding Vision Workshop Session Notes.
Norden Facility – indoor: track, volleyball/basketball, community rooms, programs, activities, sports
Goal: More pickleball courts spread out in different parts of the city
The following is a record of the chat messaging shared through the virtual participation throughout the presentation and Exercise 1 and Exercise 2:
Margaret Fleming: Norwalk needs a pool
Margaret Fleming: Norwalk needs a teen center
Workshop Dates: October 13th – October 15th 2022
Diane Lauricella: ++++Pool One on each side of the River. I tried to get the Mall to include a pool on the ground floor...
See Sign-In Sheet
Margaret Fleming: Splash pad is great
Margaret Fleming: concession at beach is great
Attendees:
Consultant Staff: KH: Nick Kuhn, Bonnie Von Ohlsen, Alexa Sikoryak, Halley Bartlett
Margaret Fleming: norwalk needs a Y
BerryDunn: Elsa Fischer
Halley Bartlett KHA: Prompt for online chat: "What activities do you or members of your household currently participate in or have a need?"
Margaret Fleming: a real Y
Elsa Obuchowski: What activity do I do? Walking. Dog-friendly walking.
Margaret Fleming: we use the beach
Three Vision Workshops were held in the City of Norwalk on October 13th and October 15th 2022. The workshops included a presentation and two interactive exercises to collect input. The presentation included an outline of guiding documents, demographic trends, park evaluations, level of service, and inventory of available programs, and the initial statistical survey results. Following the presentation, attendees were divided into groups of 5-8 people to participate in two exercises.
Exercise 1: SWOT The first activity was to identify Strengths, Weaknesses, Opportunities, and Threats (SWOT) of the existing City of Norwalk Recreation and Parks System over the course of 40 minutes.
Diane Lauricella: Thank you for setting up the hybrid participation.
Peggy Holton: Does analysis data include impact of climate change on available open space? On potential for new open space?
Exercise 2: Goals and Objectives For each identified Sub-System (Programs, Waterfront, Natural and Regional Parks, Community/Neighborhood Parks, School Parks, and Athletic Fields), Participants were prompted to define 1-2 long term goals and for each goal define 1-2 objectives or measurements such as projects, potential partners and/or changes.
Elsa Obuchowski: I think it's important to keep and maintain the beach. Calf Pasture Beach is a real treasure Norwalk can be proud of.
Luz Mendez: We go to the beach, dog park, Cranbury Park, Veterans Park
The following notes document the written input of participants participating in exercises. Written words that were emphasized (underlined, circled, or with and explanation point) have also been emphasized within the format of these notes. Vision Workshop Session 1 and Session 2 included a virtual participation option; the comments of virtual participants are included in the corresponding Vision Workshop Session Notes.
Peggy Holton: Does potential new open space needed for new facilities exist in Norwalk?
Elsa Obuchowski: Interesting to see the population trends, considering the great many Facebook comments people have recently posted in reaction to the drought emergency declaration, saying Norwalk needs to stop building apartments (and, by implication, limit population growth).
Luz Mendez: It would be nice if it could be another dog park and a public pool
Peggy Holton: If you include offerings by Norwalk non-profits and service organizations in the analysis of what Norwalkers want, how does the total offering profile look compared to other communities and to needs?
Elsa Obuchowski: Taylor Farm Park is a treasure, very important for dog owners.
Alan Kibbe: More and better access points to Norwalk Harbor for kayaking and aquatics would be great
Workshop Dates: October 13th – October 15th 2022
Attendees:
Elsa Obuchowski: Is there still kayak rental at Calf Pasture Beach? I remember trying it once quite a few years ago, but it didn't work out well because they didn't provide guidance as to where you could and could not go in your kayak.
See Sign-In Sheet
Consultant Staff: KH: Nick Kuhn, Bonnie Von Ohlsen, Alexa Sikoryak, Halley Bartlett
BerryDunn: Elsa Fischer
Alan Kibbe: Our harbor is an underused asset
Diane Lauricella: +++ Alan Kibbe harbor comments. Harbor Management plan and POCD wants more harbor Road End parks...let's focus to enhance this great asset!
Alan Kibbe: Calf Pasture isn't the best access point for inexperienced paddlers
Diane Lauricella: Please consider adding more soccer fields and community gardens on public property.
Three Vision Workshops were held in the City of Norwalk on October 13th and October 15th 2022. The workshops included a presentation and two interactive exercises to collect input. The presentation included an outline of guiding documents, demographic trends, park evaluations, level of service, and inventory of available programs, and the initial statistical survey results. Following the presentation, attendees were divided into groups of 5-8 people to participate in two exercises.
Exercise 1: SWOT The first activity was to identify Strengths, Weaknesses, Opportunities, and Threats (SWOT) of the existing City of Norwalk Recreation and Parks System over the course of 40 minutes.
Exercise 2: Goals and Objectives For each identified Sub-System (Programs, Waterfront, Natural and Regional Parks, Community/Neighborhood Parks, School Parks, and Athletic Fields), Participants were prompted to define 1-2 long term goals and for each goal define 1-2 objectives or measurements such as projects, potential partners and/or changes.
The following notes document the written input of participants participating in exercises. Written words that were emphasized (underlined, circled, or with and explanation point) have also been emphasized within the format of these notes. Vision Workshop Session 1 and Session 2 included a virtual participation option; the comments of virtual participants are included in the corresponding Vision Workshop Session Notes.
Saturday, October 15th, 2022 | 10:00am-1:00pm
Strengths
Workshop Dates: October 13th – October 15th 2022
Programs: good to be held at schools, keep within community, ease of access, frequency of concerts
See Sign-In Sheet
Waterfront / Natural /Regional : Public transportation access to beach, facilities (kayak launch, boat launch), Kayak/paddleboard storage, camping on the island
Attendees:
Consultant Staff: KH: Nick Kuhn, Bonnie Von Ohlsen, Alexa Sikoryak, Halley Bartlett
BerryDunn: Elsa Fischer
Community / Neighborhood: Maintenance at Calf Pasture, ADA access at Calf Pasture, Community garden and nonprofit space at Fodor Farm, availability of rental space, park buildings, dog parks
School Parks: every school has a park, have trees and plants to reduce carbon footprint
Athletic facilities: Have a lot of good fields – quantity
Weaknesses
Programs: need swimming safety and classes, need more sailing opportunities, trade education that work with schools (boat mechanics and maintenance), better public private partnerships, fix permit process for facility/space access
Three Vision Workshops were held in the City of Norwalk on October 13th and October 15th 2022. The workshops included a presentation and two interactive exercises to collect input. The presentation included an outline of guiding documents, demographic trends, park evaluations, level of service, and inventory of available programs, and the initial statistical survey results. Following the presentation, attendees were divided into groups of 5-8 people to participate in two exercises.
Waterfront/ Natural/ Regional: Trails at Cranberry are not well maintained (erosion from use), taken advantage of by out-of-towners
Exercise 1: SWOT The first activity was to identify Strengths, Weaknesses, Opportunities, and Threats (SWOT) of the existing City of Norwalk Recreation and Parks System over the course of 40 minutes.
Community/Neighborhood: Permitting – limited access for young kids, programs are limited to certain areas so local kids have issues getting there.
School Parks: Permitting, safety (footpaths, fencing), noise off site
Athletic facilities: need public swimming pools, fix permitting process, lack of winter sport space and programing, limited public skating opportunities
Exercise 2: Goals and Objectives For each identified Sub-System (Programs, Waterfront, Natural and Regional Parks, Community/Neighborhood Parks, School Parks, and Athletic Fields), Participants were prompted to define 1-2 long term goals and for each goal define 1-2 objectives or measurements such as projects, potential partners and/or changes.
Opportunities
Programs: Cranbury- more programs, environmental, trees Robinson family event, education hub (vernal pools), wetland preservation
The following notes document the written input of participants participating in exercises. Written words that were emphasized (underlined, circled, or with and explanation point) have also been emphasized within the format of these notes. Vision Workshop Session 1 and Session 2 included a virtual participation option; the comments of virtual participants are included in the corresponding Vision Workshop Session Notes.
Waterfront/ Natural / Regional: Norwalk islands are underutilized, Vet[eran]s Park is underutilized (gazebos, picnic areas, events), Master plan for waterfront – more development?
Community/ Neighborhood: Large part of Cranberry is not used (cut in for trails, riding paths, etc.), opportunities for concessions, pocket/urban park opportunities for city owned properties, parking lot – Cross street and wooded area – North Street
Threats
Programs – entitlement and non-inclusivity, lack of diversity, politics, funding, maintenance
Waterfront-Climate change, sea level rise
Natural/Regional Parks- water quality, Broad River Sports Facility and well field interaction, contamination from turf fields runoff (liability), funding/maintenance
Community/Neighborhood Parks- resistance to change, funding/maintenance, safety (blue light system)
School Parks – collaboration between schools and parks department for use, funding/maintenance
Athletic facilities – Community center, funding/maintenance, lack of an indoor facility
Resistance to change
Workshop Dates: October 13th – October 15th 2022
Exercise 2: Goals and Objectives
See Sign-In Sheet
Programs
Attendees:
Goal: Provide aquatic programs for all ages
Consultant Staff: KH: Nick Kuhn, Bonnie Von Ohlsen, Alexa Sikoryak, Halley Bartlett
BerryDunn: Elsa Fischer
Find/create facilities
Find location for potential indoor and outdoor facilities
Establish public-private partnerships for fundings
Goal: provide more outdoor winter programming
Identify places to provide winter amenity space outdoors
Goal: Provide environmental programming
Cranbury opportunities
Three Vision Workshops were held in the City of Norwalk on October 13th and October 15th 2022. The workshops included a presentation and two interactive exercises to collect input. The presentation included an outline of guiding documents, demographic trends, park evaluations, level of service, and inventory of available programs, and the initial statistical survey results. Following the presentation, attendees were divided into groups of 5-8 people to participate in two exercises.
The old dumps
Increase partnerships (already have with the aquarium
Apply for grants to obtain funding
Exercise 1: SWOT The first activity was to identify Strengths, Weaknesses, Opportunities, and Threats (SWOT) of the existing City of Norwalk Recreation and Parks System over the course of 40 minutes.
Waterfront, Natural, and Regional Parks
Goal: Prepare facilities for sea level rise
Identify at risk facilities
Incorporate sustainability practices (wind, solar, green infrastructure)
Exercise 2: Goals and Objectives For each identified Sub-System (Programs, Waterfront, Natural and Regional Parks, Community/Neighborhood Parks, School Parks, and Athletic Fields), Participants were prompted to define 1-2 long term goals and for each goal define 1-2 objectives or measurements such as projects, potential partners and/or changes.
Modify zoning laws to accomplish goals on city-owned properties
Plan for 100–500-year storms
Evaluate distance between waterfront and development to provide increase vegetated buffer area
Upgrade natural infrastructure that controls flooding
Goal: Improve Cranbury Park
The following notes document the written input of participants participating in exercises. Written words that were emphasized (underlined, circled, or with and explanation point) have also been emphasized within the format of these notes. Vision Workshop Session 1 and Session 2 included a virtual participation option; the comments of virtual participants are included in the corresponding Vision Workshop Session Notes.
Expand park to include unused area
Investigate possibility of incorporating trails for walking and horseback riding
Community/Neighborhood Parks
Goal: Provide parks in new areas
Identify spaces that could be used for parks
Goal: Provide more amenities in each park (especially Broad River)
Identify areas that could use improvements
Provide seating in parks with shade
Provide walking paths
Goal: Increase funding for parks
Apply for grants
Workshop Dates: October 13th – October 15th 2022
Goal: Utilize space at the end of dead end roads on the harbor
Create kayak launches when possible
See Sign-In Sheet
Improve space to be usable
Attendees:
Create pocket parks
Consultant Staff: KH: Nick Kuhn, Bonnie Von Ohlsen, Alexa Sikoryak, Halley Bartlett
BerryDunn: Elsa Fischer
School Parks
Goal: Increase public access to school parks
Improve permitting process
Increase staffing to police and areas when being used by the public
Goal: improve ADA access to parks
Provide ramps where they do not already exist
Increase ADA-friendly playgrounds
Three Vision Workshops were held in the City of Norwalk on October 13th and October 15th 2022. The workshops included a presentation and two interactive exercises to collect input. The presentation included an outline of guiding documents, demographic trends, park evaluations, level of service, and inventory of available programs, and the initial statistical survey results. Following the presentation, attendees were divided into groups of 5-8 people to participate in two exercises.
Goal: Provide environmentally friendly park spaces
Review the use of artificial turf
Use sustainable materials when developing amenities (surfaces)
Exercise 1: SWOT The first activity was to identify Strengths, Weaknesses, Opportunities, and Threats (SWOT) of the existing City of Norwalk Recreation and Parks System over the course of 40 minutes.
Athletic Fields
Goal: Provide independent review of use of artificial turf vs. natural turf
Identify a neutral party to investigate
Collect info for and against each
Exercise 2: Goals and Objectives For each identified Sub-System (Programs, Waterfront, Natural and Regional Parks, Community/Neighborhood Parks, School Parks, and Athletic Fields), Participants were prompted to define 1-2 long term goals and for each goal define 1-2 objectives or measurements such as projects, potential partners and/or changes.
Goal: maximize use while balancing cost to maintain
Evaluate where funding is spent
Make sure facilities are charging a fair amount to utilize facilities
Goal: Provide an indoor athletic facility with an indoor pool
The following notes document the written input of participants participating in exercises. Written words that were emphasized (underlined, circled, or with and explanation point) have also been emphasized within the format of these notes. Vision Workshop Session 1 and Session 2 included a virtual participation option; the comments of virtual participants are included in the corresponding Vision Workshop Session Notes.
Identify public-private partnership
Identify specific need for indoor programming
Strengths
Recent (10 yrs.) improvements great – especially Calf Pasture
Diversity in activities for all age groups
Long Island Sound waterfront – multiple activities
Shell fishing opportunity
Workshop Dates: October 13th – October 15th 2022
Marine center at Brian McMahon – Very Good
See Sign-In Sheet
Taylor Farm – Dog walking
Running track at City Hall
Attendees:
Consultant Staff: KH: Nick Kuhn, Bonnie Von Ohlsen, Alexa Sikoryak, Halley Bartlett
Maintenance/mowing-much better last 2 years
BerryDunn: Elsa Fischer
Dept. p.w. [Public Works Department]
At white barn site – stream water quality is being done; land trust easement has potential for access
Land trust open to partnerships with city – open space, 100% volunteer
Weaknesses
Turf fields = PFAS – EPA limit 0 – near water supply
Beach – DOH closing lab – testing process – delays (6 hrs.)
PFAS – Facilities are already over limits (zero room to increase)
Three Vision Workshops were held in the City of Norwalk on October 13th and October 15th 2022. The workshops included a presentation and two interactive exercises to collect input. The presentation included an outline of guiding documents, demographic trends, park evaluations, level of service, and inventory of available programs, and the initial statistical survey results. Following the presentation, attendees were divided into groups of 5-8 people to participate in two exercises.
All ages in Parks = may need to separate
ADA access needs improvement
Lack of kayak launch locations
Walking at beach in winter – no place to get warm
Exercise 1: SWOT The first activity was to identify Strengths, Weaknesses, Opportunities, and Threats (SWOT) of the existing City of Norwalk Recreation and Parks System over the course of 40 minutes.
People feed the geese – health issues
Not enough benches along walking routes
Brownfields/contaminated lands /remediation (Fly Ash…)
Opportunities
Exercise 2: Goals and Objectives For each identified Sub-System (Programs, Waterfront, Natural and Regional Parks, Community/Neighborhood Parks, School Parks, and Athletic Fields), Participants were prompted to define 1-2 long term goals and for each goal define 1-2 objectives or measurements such as projects, potential partners and/or changes.
Do not part in turf fields
Private well testing – enforce for overall benefit
White barn site land trust easement +5ac of open space
Turf testing – independent
Provide better ADA access
Don’t close the city lab [YMCA] – Should keep and expand
The following notes document the written input of participants participating in exercises. Written words that were emphasized (underlined, circled, or with and explanation point) have also been emphasized within the format of these notes. Vision Workshop Session 1 and Session 2 included a virtual participation option; the comments of virtual participants are included in the corresponding Vision Workshop Session Notes.
Kayak launch – re-open at Vet[eran]s Park, increase number of launch areas (Calf Pasture)
Re-establish public access to water (Harbor connection)
Shell fishing – educate current fishing industry/community – keep
Marine biology education at Calf Pasture Beach
Educate public re: Geese health issue
Add seating areas – add education/views/shade
Freshwater Fishing – access to public – NRVT
Power Plant Cleanup/Kayak access/ City gets rights to property
Threats
Recreation and Parks Master Plan
Climate Change/Flooding (PFAS overflow)
Sea level rise/Road to beach may be cut off (access)
Vision Workshops
Private well testing now is only voluntary (may not be done), no link between public and private
Workshop Dates: October 13th – October 15th 2022
Geese health issues – Fecal matter /ECOLI/ water quality
Tides – water quality
See Sign-In Sheet
Attendees:
Programs
Consultant Staff: KH: Nick Kuhn, Bonnie Von Ohlsen, Alexa Sikoryak, Halley Bartlett
BerryDunn: Elsa Fischer
Goal: Increase/expand learn to swim (all High school students learn)
Provide pools to provide lessons
Goal: increase bike safety opportunities
More bike trails
Bike safety/education
Goal: increase nature/ environmental education to all
Three Vision Workshops were held in the City of Norwalk on October 13th and October 15th 2022. The workshops included a presentation and two interactive exercises to collect input. The presentation included an outline of guiding documents, demographic trends, park evaluations, level of service, and inventory of available programs, and the initial statistical survey results. Following the presentation, attendees were divided into groups of 5-8 people to participate in two exercises.
Buildings at Calf Pasture – use for educational programs
Waterfront, Natural, and Regional Parks
Goal: More secure waterfront
Exercise 1: SWOT The first activity was to identify Strengths, Weaknesses, Opportunities, and Threats (SWOT) of the existing City of Norwalk Recreation and Parks System over the course of 40 minutes.
Increase police presence at waterfront parks
Goal: Better access/ EV/ other vehicular energy access
Provide EV charging at beach and parks
Review new development and parks for solar power use
Exercise 2: Goals and Objectives For each identified Sub-System (Programs, Waterfront, Natural and Regional Parks, Community/Neighborhood Parks, School Parks, and Athletic Fields), Participants were prompted to define 1-2 long term goals and for each goal define 1-2 objectives or measurements such as projects, potential partners and/or changes.
Goal: Encourage more environmental/marine education
Provide educational materials at city parks and signage
Plant I.D. education/signage
Goal: Maintain safe, clean water
The following notes document the written input of participants participating in exercises. Written words that were emphasized (underlined, circled, or with and explanation point) have also been emphasized within the format of these notes. Vision Workshop Session 1 and Session 2 included a virtual participation option; the comments of virtual participants are included in the corresponding Vision Workshop Session Notes.
Restore and improve city LAV – measure water quality
Expand testing beyond coliform, ETC.
Goal: Increase Kayak access
Change policy to permit access
Come up with new launch sites
Community/Neighborhood Parks
Goal: increase public safety at parks
Separate activity areas (age groups, activity level)
Enforcement of rules (hours, no dogs, etc.)
Provide video surveillance in parks
Goal: increase pocket parks/smaller neighborhood [parks]
Identify sites
Workshop Dates: October 13th – October 15th 2022
Partner to maintain parks (neighbors who use it)
See Sign-In Sheet
Goal: Balance population and parks into future (not lose park land)
Attendees:
Rooftop open spaces?
Consultant Staff: KH: Nick Kuhn, Bonnie Von Ohlsen, Alexa Sikoryak, Halley Bartlett
BerryDunn: Elsa Fischer
Address multifamily growth relative to park land (developer provide $$$ [payment in lieu of] or space as a requirement)
School Parks & Athletic Fields
Goal: maintain surface and ground water quality in area of fields
For turf fields, test for safety prior to and after installation
Goal: Encourage organizations and synergy with City (public/private/communicate)
Surveys, events, projects with public/private organizations
Three Vision Workshops were held in the City of Norwalk on October 13th and October 15th 2022. The workshops included a presentation and two interactive exercises to collect input. The presentation included an outline of guiding documents, demographic trends, park evaluations, level of service, and inventory of available programs, and the initial statistical survey results. Following the presentation, attendees were divided into groups of 5-8 people to participate in two exercises.
Set up formal communication between school staff and City Parks and Recreations
City Recreation and Parks provide sharing of information (website?)
Exercise 1: SWOT The first activity was to identify Strengths, Weaknesses, Opportunities, and Threats (SWOT) of the existing City of Norwalk Recreation and Parks System over the course of 40 minutes.
Exercise 2: Goals and Objectives For each identified Sub-System (Programs, Waterfront, Natural and Regional Parks, Community/Neighborhood Parks, School Parks, and Athletic Fields), Participants were prompted to define 1-2 long term goals and for each goal define 1-2 objectives or measurements such as projects, potential partners and/or changes.
The following is a record of the chat messaging shared through the virtual participation throughout the presentation and Exercise 1 and Exercise 2:
Diane Cece: I'm not seeing a live shot on zoom. Only a screen with the Norwalk Recs Parks Master Plan graphic
Midge Kennedy: Best because of access to coastline
Midge Kennedy: Add large spaces for hiking trails
Midge Kennedy: add something for young teens on bikes, reg or motorized
The following notes document the written input of participants participating in exercises. Written words that were emphasized (underlined, circled, or with and explanation point) have also been emphasized within the format of these notes. Vision Workshop Session 1 and Session 2 included a virtual participation option; the comments of virtual participants are included in the corresponding Vision Workshop Session Notes.
Diane Cece: Parks, and the recreation programs, should first and foremost be for the primary use and enjoyment by Norwalk residents, including preferred access and parking.
Diane Cece: Norwalk youth and families would benefit greatly from a public ice skating rink that is non-for-profit and managed either by Recreation and Parks or by the local PAL or other non-profit.
Diane Cece: A recent request by dog owners to open the beach for dog access in the winter was denied. Though I'm not a dog owner I would like to see that
Diane Cece: TOTALLY agree with Midge on the need for youth bikes and motorbikes
Diane Cece: Ken Huges from Recs and Parks is there, and is telling Nick about the audio/visual issues.
Diane Cece: They are apparently doing breakout sessions, so once we can hear again then perhaps the 3 of us can be our own little breakout group!
Workshop Dates: October 13th – October 15th 2022
Diane Cece: Nick, where you are speaking now is very clear on my end. and we can now see the screen.
Attendees:
Diane Cece: PROGRAMMING STRENGTHS: programs for younger children and sports activities, and outdoor concerts PROGRAMMING WEAKNESS: programs for teens and seniors and mobility challenged PROGRAMMING
See Sign-In Sheet
Consultant Staff: KH: Nick Kuhn, Bonnie Von Ohlsen, Alexa Sikoryak, Halley Bartlett
BerryDunn: Elsa Fischer
OPPORTUNITIES: Collaboration with Oak Hills Park for increased public programming, especially in winter but also summer evenings for concerts and other performing arts. PROGRAMMING THREATS: lack of private funding sponsor, Redevelopment Agency taking "control" of public park space (Ryan, Freese as examples)
Three Vision Workshops were held in the City of Norwalk on October 13th and October 15th 2022. The workshops included a presentation and two interactive exercises to collect input. The presentation included an outline of guiding documents, demographic trends, park evaluations, level of service, and inventory of available programs, and the initial statistical survey results. Following the presentation, attendees were divided into groups of 5-8 people to participate in two exercises.
Exercise 1: SWOT The first activity was to identify Strengths, Weaknesses, Opportunities, and Threats (SWOT) of the existing City of Norwalk Recreation and Parks System over the course of 40 minutes.
Midge Kennedy: Well, I think we have strengths with the facilities we do have. I like that we have a municipal golf course (but wish they would stop poisoning their area with Roundup and other awful substances). Calf Pasture Beach is great with Taylor Farms nearby. Could we add biking/skateboard challenges around those areas, Fodor Farm provides a wonderful teaching opportunity-can we get more lower income kids and parents involved there?
Midge Kennedy: Weaknesses: I still see too many kids in the summer just hanging out in South Norwalk. Can we as a town create more programs for this youth?
Exercise 2: Goals and Objectives For each identified Sub-System (Programs, Waterfront, Natural and Regional Parks, Community/Neighborhood Parks, School Parks, and Athletic Fields), Participants were prompted to define 1-2 long term goals and for each goal define 1-2 objectives or measurements such as projects, potential partners and/or changes.
Diane Cece: WATERFRONT NATURAL AND REGIONAL: of course our waterfront public access is important, however I'm concerned about how you may be defining "regional" in terms of parks. If regionalization and tourism are a primary goal of parks management, I think this contributes to the parking and amenity woes we face today at a number of parks, but especially the beaches.
The following notes document the written input of participants participating in exercises. Written words that were emphasized (underlined, circled, or with and explanation point) have also been emphasized within the format of these notes. Vision Workshop Session 1 and Session 2 included a virtual participation option; the comments of virtual participants are included in the corresponding Vision Workshop Session Notes.
OPPORTUNITES: While I would oppose carnival type or for-profit waterdependent programs (such as the prior ideas for a massive mini golf or duck boat operations at Veterans Memorial Park, I would support an amenity such as water taxis that ferry folks up and down the Norwalk River between West Ave area and Sono and Beach. Also would support commuter ferry service depending on where it would be located, traffic and parking. A possible threat to Beach or Veterans Memorial is a consideration underway to erect a waterfront emergency services station? - depending on the rationale & size being considered this could impact public access, amenities & programs
Diane Cece: NEIGHBORHOOD AND POCKET PARKS - Programming has improved greatly at the taxing district parks, and I'd like to see that continued, and
expanded. Weaknesses are lack of programming at the smaller, neighborhood parks such as Freese Park, Mathews Park, etc. Concerts and other performing arts could be increased, and Mathews Park would also be a good candidate for a skating rink or other seasonal family activities.
Workshop Dates: October 13th – October 15th 2022
Attendees:
See Sign-In Sheet
Consultant Staff: KH: Nick Kuhn, Bonnie Von Ohlsen, Alexa Sikoryak, Halley Bartlett
WEAKNESS: Norwalk should implement a neighborhood parks account that developers of large apartment complexes fund for maintenance and programming! If there are developments of 50 or more units within a 1 mile radius of a neighborhood park then the developer should pay an annual fee AND sponsor community events there. THREATS - in regards to apartment complexes, the P&Z Commission does not require nearly enough on-site open space for active and passive recreation or green space. This also contributes to the nearest neighborhood parks & private properties becoming littered with dog feces.
BerryDunn: Elsa Fischer
Diane Cece: SCHOOL PARKS/ATHLETIC FIELDS: some parks and fields appear to be much better maintained than others. Weakness and threat is that there doesn't appear to be any usage monitoring in evenings, weekends, holidays and it seems that many out of towners overtake some parks for organized and unorganized team sports such as soccer. Are public parks available for sports teams on a fist come first serve basis or must they register? Also, whenever field lighting or amplified audio is installed at school fields the highest priority should be given to abutting neighbors to mitigate light and noise pollution, especially after 9pm.
Three Vision Workshops were held in the City of Norwalk on October 13th and October 15th 2022. The workshops included a presentation and two interactive exercises to collect input. The presentation included an outline of guiding documents, demographic trends, park evaluations, level of service, and inventory of available programs, and the initial statistical survey results. Following the presentation, attendees were divided into groups of 5-8 people to participate in two exercises.
Diane Cece: CALF PASTURE BEACH - Every resident I know would prefer to get rid of the parking authority and system at the beach and return to the entry shack system with plate readers lane for residents and a single lane for nonresidents to pay with cash or credit card at gate. If cash is a security issue than modern technology with multiple high def cameras should be a deterrent!
Exercise 1: SWOT The first activity was to identify Strengths, Weaknesses, Opportunities, and Threats (SWOT) of the existing City of Norwalk Recreation and Parks System over the course of 40 minutes.
Exercise 2: Goals and Objectives For each identified Sub-System (Programs, Waterfront, Natural and Regional Parks, Community/Neighborhood Parks, School Parks, and Athletic Fields), Participants were prompted to define 1-2 long term goals and for each goal define 1-2 objectives or measurements such as projects, potential partners and/or changes.
The following notes document the written input of participants participating in exercises. Written words that were emphasized (underlined, circled, or with and explanation point) have also been emphasized within the format of these notes. Vision Workshop Session 1 and Session 2 included a virtual participation option; the comments of virtual participants are included in the corresponding Vision Workshop Session Notes.
Diane Cece: VETERANS MEMORIAL PARK MASTER PLAN - The consultants should find out exactly WHY the bulk of the approved master plan for Veterans Memorial Park has never been funded (or requested for funding by staff) after having been approved 10 years ago! Residents spent hours providing feedback and feel ignored. We don't want this Planning session to be another "check the box" exercise where our feedback is requested only to be ignored.
Diane Cece: The benchmarking slide on staffing clearly illustrates just how underfunded and understaffed the Norwalk Recs and Parks is! It's one thing to brag on operating on shoestring budget and staff, but clearly the desired improvements in parks and activities warrants funding and staffing at a higher level. But if City management doesn't ask, then Council can
Diane Cece: (cont) correction: then Council can't fund. Please advise city staff to budget and staff accordingly...
The summaries below consolidate themes recorded during each of the three (3) public Visioning workshops facilitated in October 2022.
Exercise 1 summarizes the top five (5) topics documented through participant notes gather in-person and virtually during all three (3) workshops. Exercise 2 summary includes a list of the top twenty (20) goals identified by participants. Each list is in descending order by frequency of mention in participant developed notes or contributed virtually during all three workshops.
Workshop Dates: October 13th – October 15th 2022
Strengths
Attendees:
See Sign-In Sheet
Consultant Staff: KH: Nick Kuhn, Bonnie Von Ohlsen, Alexa Sikoryak, Halley Bartlett
Waterfront access (seaport town)
BerryDunn: Elsa Fischer
Athletic facilities (outdoor fields)
Unique offerings (island parks, historic public spaces)
Youth programming and access to playgrounds
Biking and walking trails
Weaknesses
Safe pedestrian access to parks (lack of sidewalks, crosswalks, etc.)
Lack of community center (option for year-round recreation)
Lack of public aquatic facility (indoor or outdoor)
Three Vision Workshops were held in the City of Norwalk on October 13th and October 15th 2022. The workshops included a presentation and two interactive exercises to collect input. The presentation included an outline of guiding documents, demographic trends, park evaluations, level of service, and inventory of available programs, and the initial statistical survey results. Following the presentation, attendees were divided into groups of 5-8 people to participate in two exercises.
Staffing level for Recreation and Parks
Incomplete/short greenway trail network (lack of connectivity to destinations)
Exercise 1: SWOT The first activity was to identify Strengths, Weaknesses, Opportunities, and Threats (SWOT) of the existing City of Norwalk Recreation and Parks System over the course of 40 minutes.
Opportunities
Programming and improvement of existing parks
Collaboration and partnerships with private entities, schools, and nonprofits (joint-use agreements)
Development of a community center
Increase access to existing parks
Exercise 2: Goals and Objectives For each identified Sub-System (Programs, Waterfront, Natural and Regional Parks, Community/Neighborhood Parks, School Parks, and Athletic Fields), Participants were prompted to define 1-2 long term goals and for each goal define 1-2 objectives or measurements such as projects, potential partners and/or changes.
Collaboratively identifying alternate funding opportunities (parks foundation, partnerships, etc.)
Threats
Funding (lack of options/sources)
Climate change (sea-level rise, storms, etc.)
The following notes document the written input of participants participating in exercises. Written words that were emphasized (underlined, circled, or with and explanation point) have also been emphasized within the format of these notes. Vision Workshop Session 1 and Session 2 included a virtual participation option; the comments of virtual participants are included in the corresponding Vision Workshop Session Notes.
Population growth and development types (downtown, changing lifestyle needs)
Maintenance of parks (inequity, lifecycle replacements, etc.)
Lack of collaboration and information sharing (city dept. – NPS, across depts.)
1. Improve maintenance of existing facilities
2. Improve access to existing facilities
3. Identify alternative funding sources
Vision Workshops
4. Develop a Community Center/Recreation Center
5. Develop inclusive and equitable programming options
6. Improve waterfront facilities and access
Workshop Dates: October 13th – October 15th 2022
7. Increase recreation and parks staffing
See Sign-In Sheet
8. Develop an aquatics facility
Attendees:
Consultant Staff: KH: Nick Kuhn, Bonnie Von Ohlsen, Alexa Sikoryak, Halley Bartlett
9. Acquire additional land for parks
BerryDunn: Elsa Fischer
10. Develop a collaborative partnership with private entities, Norwalk Public Schools, and nonprofits
11. Develop and expand greenway and blueway trail network
12. Develop urban solutions for growth areas
13. Incorporate city-wide goals for resiliency
14. Improve safety and security in parks
Three Vision Workshops were held in the City of Norwalk on October 13th and October 15th 2022. The workshops included a presentation and two interactive exercises to collect input. The presentation included an outline of guiding documents, demographic trends, park evaluations, level of service, and inventory of available programs, and the initial statistical survey results. Following the presentation, attendees were divided into groups of 5-8 people to participate in two exercises.
15. Increase public use and access of Norwalk Public Schools school parks and indoor facilities
16. Develop programming that address seasonal needs and opportunities
17. Incorporate data collection and analysis more into decision making process
Exercise 1: SWOT The first activity was to identify Strengths, Weaknesses, Opportunities, and Threats (SWOT) of the existing City of Norwalk Recreation and Parks System over the course of 40 minutes.
18. Increase youth program offerings
19. Develop additional options for bathroom access and upgrade existing bathrooms in park
20. Identify and sign blueway routes
Exercise 2: Goals and Objectives For each identified Sub-System (Programs, Waterfront, Natural and Regional Parks, Community/Neighborhood Parks, School Parks, and Athletic Fields), Participants were prompted to define 1-2 long term goals and for each goal define 1-2 objectives or measurements such as projects, potential partners and/or changes.
The following notes document the written input of participants participating in exercises. Written words that were emphasized (underlined, circled, or with and explanation point) have also been emphasized within the format of these notes. Vision Workshop Session 1 and Session 2 included a virtual participation option; the comments of virtual participants are included in the corresponding Vision Workshop Session Notes.
Workshop Dates: January 31st, 2023 9am-12pm EST
Workshop Dates: October 13th – October 15th 2022
See Sign-In Sheet
Attendees: See Sign-In Sheet
Attendees:
Consultant Staff: KH: Nick Kuhn, Bonnie Von Ohlsen, Alexa Sikoryak, Halley Bartlett
BerryDunn: Elsa Fischer
Consultant Staff: KH: Nick Kuhn, Halley Bartlett BerryDunn: Elsa Fischer
The Implementation Workshop for the City of Norwalk Recreation and Parks Master Plan began with a presentation of the needs and priorities assessment summary, and a review of draft vision goals built from the Survey and Vision Workshop results. Following the presentation, participants collaborated in small groups of 3-5 to complete a three-step exercise.
Three Vision Workshops were held in the City of Norwalk on October 13th and October 15th 2022. The workshops included a presentation and two interactive exercises to collect input. The presentation included an outline of guiding documents, demographic trends, park evaluations, level of service, and inventory of available programs, and the initial statistical survey results. Following the presentation, attendees were divided into groups of 5-8 people to participate in two exercises.
Exercise 1: SWOT The first activity was to identify Strengths, Weaknesses, Opportunities, and Threats (SWOT) of the existing City of Norwalk Recreation and Parks System over the course of 40 minutes.
Step 1: Review projected funding sources The first step was a review of the historical trends of capital and operational funding of the Recreation and Parks Department, the expected funds needed to incorporate all parts of the proposed Recreation and Parks Master Plan goals over the next ten (10) years, and additional alternative funding sources not currently incorporated into the Recreation and Parks fiscal planning. Alternative Funding sources presented included partnerships, additional revenue from user fees invested back into parks, special taxing districts, and revenue bonds.
Exercise 2: Goals and Objectives For each identified Sub-System (Programs, Waterfront, Natural and Regional Parks, Community/Neighborhood Parks, School Parks, and Athletic Fields), Participants were prompted to define 1-2 long term goals and for each goal define 1-2 objectives or measurements such as projects, potential partners and/or changes.
Step 2: Prioritization Criteria The second step prompted groups to define prioritization criteria and a ranking system that could be used to compare proposed improvement projects to decide which is the highest priority to be completed. Criteria ranking examples included a 0- 5 point scale and a triple bottom line ranking system.
The following notes document the written input of participants participating in exercises. Written words that were emphasized (underlined, circled, or with and explanation point) have also been emphasized within the format of these notes. Vision Workshop Session 1 and Session 2 included a virtual participation option; the comments of virtual participants are included in the corresponding Vision Workshop Session Notes.
Step 3: Review of Objectives The third step provided groups with the Vision Goals and specific Objectives for their review and input Input and notes were prompted with the following headings: Desired Timeframe, Role of Recreation and Parks Department and City, Identification of Actions, and Potential Partnerships. Desired Timeframe utilized categories including: Ongoing (OG), Short-Term (ST, 1-3 years), Mid-Term (MT, 4-7 years), Long-Term (LT, 7-10), or Vision (V, 10+ years). This acronym system can be found
The following notes document the written input of groups written input within Step 2 and Step 3 of the implementation workshop exercise.
Group 1
1. Revenue Funding
2. Public Demand
Vision Workshops
3. Funding Opportunity: Grants
4. Staffing: More Full-Time Staff, and More Maintenance Staff
Workshop Dates: October 13th – October 15th 2022
5. Safety: Surveillance, Lighting, Water Safety Education, and Access
6. Economic Opportunities: Community Center, Vets Park
Group 2
Attendees:
1. Aquatics Literacy - 5
2. Equity - 5
See Sign-In Sheet
Consultant Staff: KH: Nick Kuhn, Bonnie Von Ohlsen, Alexa Sikoryak, Halley Bartlett
BerryDunn: Elsa Fischer
3. Addressing the (need) gap - 5
4. Public Demand - 5
5. Accessibility (ADA compliance and more) - 5
6. Environmental Design (intentional design and impact) - 5
7. Connectivity to public spaces (i.e. public transit) - 4
8. Walkability - 4
Three Vision Workshops were held in the City of Norwalk on October 13th and October 15th 2022. The workshops included a presentation and two interactive exercises to collect input. The presentation included an outline of guiding documents, demographic trends, park evaluations, level of service, and inventory of available programs, and the initial statistical survey results. Following the presentation, attendees were divided into groups of 5-8 people to participate in two exercises.
9. Stabilization (manageability and sustainability) - 3
10. Revenue generation - 3
Exercise 1: SWOT The first activity was to identify Strengths, Weaknesses, Opportunities, and Threats (SWOT) of the existing City of Norwalk Recreation and Parks System over the course of 40 minutes.
Group 3
• Equity
10 minute safe walk to parks for everyone
Urban Core – expanded green space in high density – low income neighborhoods
Access, connectivity, and safety
Exercise 2: Goals and Objectives For each identified Sub-System (Programs, Waterfront, Natural and Regional Parks, Community/Neighborhood Parks, School Parks, and Athletic Fields), Participants were prompted to define 1-2 long term goals and for each goal define 1-2 objectives or measurements such as projects, potential partners and/or changes.
Improved quality of life
• Staffing
• Projects that fit available grant criteria
• Green infrastructure
Bioswails, impervious land, built to flood
The following notes document the written input of participants participating in exercises. Written words that were emphasized (underlined, circled, or with and explanation point) have also been emphasized within the format of these notes. Vision Workshop Session 1 and Session 2 included a virtual participation option; the comments of virtual participants are included in the corresponding Vision Workshop Session Notes.
Andrews Field – ecological wetlands park – partnership opportunity wit Norwalk Land Trust, Tree alliance, NRWA Bike/Walk
Balance of low maintenance projects (ecological and natural parks), and high maintenance activity parks
• Waterfront access
• Develop short-term goals – projects that can be completed with existing resources
• Taking already owned city land that is underutilized and making it green
• Waterfront Access
• Lighting Group 4
1. Need – 5
2. Multi-Generational – 5
3. Multi-Purpose – 5
Workshop Dates: October 13th – October 15th 2022
4. Accessible – 4
5. Equitable – 4
Attendees:
See Sign-In Sheet
6. Revenue Generator – 4
7. Sustainable – 3
Consultant Staff: KH: Nick Kuhn, Bonnie Von Ohlsen, Alexa Sikoryak, Halley Bartlett
BerryDunn: Elsa Fischer
8. POCD (City Goals) – 5
9. Maintenance – 3
10. Funding – 5
1. Improves access to and connectivity of parks: 0-5
2. Generates revenue: 0-5
Three Vision Workshops were held in the City of Norwalk on October 13th and October 15th 2022. The workshops included a presentation and two interactive exercises to collect input. The presentation included an outline of guiding documents, demographic trends, park evaluations, level of service, and inventory of available programs, and the initial statistical survey results. Following the presentation, attendees were divided into groups of 5-8 people to participate in two exercises.
3. Pursues Equity: 0-5
4. Utilizes available staff, funding, and City owned land: 0-5
5. Ability to be maintained with available staff resources: 0-4
6. Sustainable design incorporating green infrastructure and/or restoration: 0-4
Exercise 1: SWOT The first activity was to identify Strengths, Weaknesses, Opportunities, and Threats (SWOT) of the existing City of Norwalk Recreation and Parks System over the course of 40 minutes.
7. Accommodates public demands and interests: 0-4
8. Increasing Connectivity to public spaces, parks, and waterfront: 0-3
9. Aligns with POCD (City Goals) and needs: 0-3
Exercise 2: Goals and Objectives For each identified Sub-System (Programs, Waterfront, Natural and Regional Parks, Community/Neighborhood Parks, School Parks, and Athletic Fields), Participants were prompted to define 1-2 long term goals and for each goal define 1-2 objectives or measurements such as projects, potential partners and/or changes.
The following notes document the written input of participants participating in exercises. Written words that were emphasized (underlined, circled, or with and explanation point) have also been emphasized within the format of these notes. Vision Workshop Session 1 and Session 2 included a virtual participation option; the comments of virtual participants are included in the corresponding Vision Workshop Session Notes.
Goals and Objectives were provided to participant groups. Implementation Workshop input is recorded for each group in the specified color. Reference legends for participant group color coding and abbreviation definition related to Subsystems and Timeframes
Workshop Dates: October 13th – October 15th 2022
See Sign-In Sheet
Attendees:
Consultant Staff: KH: Nick Kuhn, Bonnie Von Ohlsen, Alexa Sikoryak, Halley Bartlett
BerryDunn: Elsa Fischer
Three Vision Workshops were held in the City of Norwalk on October 13th and October 15th 2022. The workshops included a presentation and two interactive exercises to collect input. The presentation included an outline of guiding documents, demographic trends, park evaluations, level of service, and inventory of available programs, and the initial statistical survey results. Following the presentation, attendees were divided into groups of 5-8 people to participate in two exercises.
Exercise 1: SWOT The first activity was to identify Strengths, Weaknesses, Opportunities, and Threats (SWOT) of the existing City of Norwalk Recreation and Parks System over the course of 40 minutes.
Exercise 2: Goals and Objectives For each identified Sub-System (Programs, Waterfront, Natural and Regional Parks, Community/Neighborhood Parks, School Parks, and Athletic Fields), Participants were prompted to define 1-2 long term goals and for each goal define 1-2 objectives or measurements such as projects, potential partners and/or changes.
The following notes document the written input of participants participating in exercises. Written words that were emphasized (underlined, circled, or with and explanation point) have also been emphasized within the format of these notes. Vision Workshop Session 1 and Session 2 included a virtual participation option; the comments of virtual participants are included in the corresponding Vision Workshop Session Notes.
CNP
CNP, SP 2.2 Develop access standards for parks, i.e. pedestrian, bicycle, and where appropriate, vehicle parking standards.
WTNR, CNP, SP, AF
Identify priorities for enhanced access to existing parks; i.e. crosswalks, entry points, bike racks, etc.
Workshop Dates: October 13th – October 15th 2022
See Sign-In Sheet
2.4
Continue to partner with Transportation, Mobility and Parking Dept. for the implementation of the Transportation Master Plan's pedestrian and bicycle infrastructure to priority park destinations.
Attendees:
Consultant Staff: KH: Nick Kuhn, Bonnie Von Ohlsen, Alexa Sikoryak, Halley Bartlett
BerryDunn: Elsa Fischer
CNP 2.5 Evaluate existing city owned, vacant, or underutilized properties, and where needed, identify potential acquisition opportunities for additional parkland in areas without existing walk or bike access to parkland.
Identify and secure alternative funding sources to ensure Department's ability to implement recommendations for capital and operational needs
3.1
Evaluate and implement cost recovery recommendations for programs, services, and rentals
Three Vision Workshops were held in the City of Norwalk on October 13th and October 15th 2022. The workshops included a presentation and two interactive exercises to collect input. The presentation included an outline of guiding documents, demographic trends, park evaluations, level of service, and inventory of available programs, and the initial statistical survey results. Following the presentation, attendees were divided into groups of 5-8 people to participate in two exercises.
CNP, PGS 3.4 CNP, AF 3.5
Prioritize the implementation of capital improvements for parks and recreation facilities within City's Capital Improvement Program (CIP)
Explore establishment of a Parks Foundation with a mission to supplement improvements to existing parks and programming
Seek and secure competitive grants and other funding sources such as special taxing districts or revenue bonds for priority park capital and recreation programming opportunities
Identify opportunities to leverage existing funding and grants awards through grant stacking during the acquisition, planning, and/or design phase of projects. PGS CNP, WTNR, AF, SP 3.2 CNP, PGS 3.3
Exercise 1: SWOT The first activity was to identify Strengths, Weaknesses, Opportunities, and Threats (SWOT) of the existing City of Norwalk Recreation and Parks System over the course of 40 minutes.
Provide year-round indoor recreation opportunities to residents through development of new facilities and partnerships
Exercise 2: Goals and Objectives For each identified Sub-System (Programs, Waterfront, Natural and Regional Parks, Community/Neighborhood Parks, School Parks, and Athletic Fields), Participants were prompted to define 1-2 long term goals and for each goal define 1-2 objectives or measurements such as projects, potential partners and/or changes.
AF 4.2 Identify potential partnerships with community organizations with shared goals to provide indoor space through lease agreement, acquisition, or private partnership.
PGS 4.3 Develop new indoor programming options through implementation of the Norwalk Public Schools Joint-Use Agreement.
Page CNP,
PGS 4.4 Develop plan to meet community's needs for indoor aquatics through collaboration with similar providers, securing funding through alternative revenue sources, and/or public-private partnership.
914.368.9200
5.2 PGS
Provide residents and visitors with inclusive and equitable programming options based upon community needs and recreation trends
5.1 PGS Develop additional seasonal and inclusive programming opportunities; specifically for nature enjoyment, fitness and wellness, special events, senior/active adults, performing arts, aquatics, history and museums.
Identify opportunities and contract with private providers for specialized program offerings
PGS 5.3 Continue to diversify the Department's core program areas beyond the current five to achieve more balance in distribution across program area types; specifically for adults and those with special needs.
PGS 5.4 Develop and implement an annual program plan that identifies how the Department will serve age segments, recreation interests, and fulfill the communities leisure needs in a balanced manner.
PGS
PGS
PGS
Workshop Dates: October 13th – October 15th 2022
5.5 Collaborate with other providers with shared goals for the development and enhanced public access to nature and senior/active adult programming.
See Sign-In Sheet
WTNR
WTNR
WTNR
Attendees:
5.6 Develop a mobile-friendly seasonal program guide to more comprehensive communicate participation opportunities and continue to enhance the program registration experience.
Consultant Staff: KH: Nick Kuhn, Bonnie Von Ohlsen, Alexa Sikoryak, Halley Bartlett
5.7 Incorporate technology in program and registration management to annually evaluate trends in participation and program status and better inform the decision making process for program development.
BerryDunn: Elsa Fischer
Enhance the resiliency of waterfront facilities and universal access while highlighting the cultural and historical significance of these special spaces to the City of Norwalk
6.1 Update and implement priority improvements of the Veteran's Memorial Park master plan to include resilient best practices.
6.2 Continue to partner with the Norwalk River Valley Trail to include completion of the WilWalk segment from Broad Street to Wilton and the Harbor Loop Trail.
6.3 Identify street rights-of-way with access to waterfront and develop public access points to the water.
WTNR, CNP 6.4 Evaluate and implement additional kayak launch opportunities at Oyster Shell Park, North Water Street Park, Veteran's Memorial Park, Calf Pasture Beach, Shady Beach Park, Woodward Avenue Park and future opportunities at Keyser Point.
Three Vision Workshops were held in the City of Norwalk on October 13th and October 15th 2022. The workshops included a presentation and two interactive exercises to collect input. The presentation included an outline of guiding documents, demographic trends, park evaluations, level of service, and inventory of available programs, and the initial statistical survey results. Following the presentation, attendees were divided into groups of 5-8 people to participate in two exercises.
Exercise 1: SWOT The first activity was to identify Strengths, Weaknesses, Opportunities, and Threats (SWOT) of the existing City of Norwalk Recreation and Parks System over the course of 40 minutes.
7.1 PGS
PGS
Continue to provide residents with high-quality customer service through meeting existing and future staffing needs for enhanced programming and maintenance
Explore short-term options for additional part-time positions to enhance marketing, communications, and programmatic offerings.
7.2 Increase part-time and future full-time staffing in-line with increased access to indoor facility space.
PGS 7.3 Shift staff positions to full-time to support program area growth through annual review and evaluation of needs.
Exercise 2: Goals and Objectives For each identified Sub-System (Programs, Waterfront, Natural and Regional Parks, Community/Neighborhood Parks, School Parks, and Athletic Fields), Participants were prompted to define 1-2 long term goals and for each goal define 1-2 objectives or measurements such as projects, potential partners and/or changes.
PGS
Promote collaborative partnerships with Norwalk Public Schools, nonprofits, and private entities to ensure efficient use of public facilities and development of innovative programming that meets residents needs
8.1 Identify the Department's role as partner, provider, facilitator, and/or resource for recreation opportunities by developing a program planning matrix and communicating with existing and potential future partners.
SP, PGS 8.2 Nurture the Department's relationship with NPS through the approval and implementation of the Joint-Use Agreement and establish consistent communications and collaboration to monitor parameters of the
PGS 8.3 Facilitate an annual workshop and industry day with existing and potential future partners for programming, maintenance, and volunteer organizations to present needs and align resources.
The following notes document the written input of participants participating in exercises. Written words that were emphasized (underlined, circled, or with and explanation point) have also been emphasized within the format of these notes. Vision Workshop Session 1 and Session 2 included a virtual participation option; the comments of virtual participants are included in the corresponding Vision Workshop Session Notes.
914.368.9200
WTNR
Continue to partner for the planning and development of a comprehensive greenway and blueway trail network
9.2 Partner with Transportation, Mobility and Parking Dept. to develop and implement blueway route signage and additional launch locations and f acilities.
WTNR 9.3 Identify and promote blueway routes to island parks through development of digital content and signage at launch sites.
Workshop Dates: October 13th – October 15th 2022
WTNR 9.4 Facilitate an annual workshop for greenway and blueway partners and advocate to promote benefits of network and better align resources and e fforts for implementation.
See Sign-In Sheet
Development standards for urban solutions in growth areas
Attendees:
Consultant Staff: KH: Nick Kuhn, Bonnie Von Ohlsen, Alexa Sikoryak, Halley Bartlett
CNP 10.1 Identify unique lifetstyle needs for urban residents and implement through planning and design of new or reinvestment in existing urban park spaces.
BerryDunn: Elsa Fischer
CNP 10.2 Identify and partner with organizaitions with interest in economic development and urban redevelopment to align resources and identify uni que needs.
CNP 10.3 Include standards for urban spaces to include durable ('sustainable' instead of 'durable' ) materials, multi-use facilities, and higher level of maintenance and lifecycle replacement to match higher levels of use where appropriate. Goal should be stustainable and resilent and not just durrable. i.e. turf fields are durrable and last longer but not good for the enviornment
lighting,
signage;
beyond
Abb. Timeframes Groups PGS Programs OG - Ongoing Group 1 WTNR Waterfront, Trails, Natural & Regional Parks ST - Short-Term (1-3 Years) Group2 CNP Community/Neighborhood Parks MT - Mid-Term (4-7 Years) Group 3 SP Schools Parks LT - Long-Term (7-10 Years) Group 4 AF Athletic Facilities V - Vision (10+ Years Subsystem
Three Vision Workshops were held in the City of Norwalk on October 13th and October 15th 2022. The workshops included a presentation and two interactive exercises to collect input. The presentation included an outline of guiding documents, demographic trends, park evaluations, level of service, and inventory of available programs, and the initial statistical survey results. Following the presentation, attendees were divided into groups of 5-8 people to participate in two exercises.
Exercise 1: SWOT The first activity was to identify Strengths, Weaknesses, Opportunities, and Threats (SWOT) of the existing City of Norwalk Recreation and Parks System over the course of 40 minutes.
Exercise 2: Goals and Objectives For each identified Sub-System (Programs, Waterfront, Natural and Regional Parks, Community/Neighborhood Parks, School Parks, and Athletic Fields), Participants were prompted to define 1-2 long term goals and for each goal define 1-2 objectives or measurements such as projects, potential partners and/or changes.
Workshop Dates: October 13th – October 15th 2022
See Sign-In Sheet
Attendees:
Consultant Staff: KH: Nick Kuhn, Bonnie Von Ohlsen, Alexa Sikoryak, Halley Bartlett
BerryDunn: Elsa Fischer
Three Vision Workshops were held in the City of Norwalk on October 13th and October 15th 2022. The workshops included a presentation and two interactive exercises to collect input. The presentation included an outline of guiding documents, demographic trends, park evaluations, level of service, and inventory of available programs, and the initial statistical survey results. Following the presentation, attendees were divided into groups of 5-8 people to participate in two exercises.
Exercise 1: SWOT The first activity was to identify Strengths, Weaknesses, Opportunities, and Threats (SWOT) of the existing City of Norwalk Recreation and Parks System over the course of 40 minutes.
Exercise 2: Goals and Objectives For each identified Sub-System (Programs, Waterfront, Natural and Regional Parks, Community/Neighborhood Parks, School Parks, and Athletic Fields), Participants were prompted to define 1-2 long term goals and for each goal define 1-2 objectives or measurements such as projects, potential partners and/or changes.
The following notes document the written input of participants participating in exercises. Written words that were emphasized (underlined, circled, or with and explanation point) have also been emphasized within the format of these notes. Vision Workshop Session 1 and Session 2 included a virtual participation option; the comments of virtual participants are included in the corresponding Vision Workshop Session Notes.
Q4. Have you or other members of your household participated in any programs offered by the City of Norwalk during the past 12 months?
Q4a. Approximately how many different recreation programs offered by the City of Norwalk have you or members of your household participated in over the past 12 months?
by percentage of households that have participated in programs (excluding “not provided”)
by percentage of respondents (multiple selections could be made)
Walking paths/sidewalks
Natural parks and preserves Restrooms
Trails/Multi‐use paths
Smaller neighborhood parks
Larger community parks
Picnic areas/shelters
Walking/running track(s)
Outdoor social gathering spaces
Outdoor pools
Community gardens
Dog parks (off‐leash)
Community centers/Recreation centers
Playgrounds
Outdoor exercise equipment or stations
Canoe/Kayak launches
Multipurpose fields (soccer, lacrosse and football
Tennis courts
Splash pad(s)
Golf course(s)
Marina/Boat launches
Pickleball courts
Indoor courts (basketball, volleyball)
Basketball courts
Youth baseball and softball fields
Skate parks
Adult baseball and softball fields
Disc golf course(s) Other
Youth baseball and softball fields
Multipurpose fields (soccer, lacrosse and football
Basketball courts
Marina/Boat launches
Splash pad(s)
Dog parks (off‐leash)
Tennis courts
Smaller neighborhood parks
Skate parks
Natural parks and preserves
Picnic areas/shelters
Disc golf course(s)
Canoe/Kayak launches
Walking/running track(s)
Trails/Multi‐use paths
Outdoor social gathering spaces
Walking paths/sidewalks
Restrooms
Community gardens
Indoor courts (basketball, volleyball)
Community centers/Recreation centers
Pickleball courts
Outdoor exercise equipment or stations
Natural parks & preserves Smaller neighborhood parks Dog parks (off‐leash) Outdoor pools Larger community parks Trails/multi‐use paths
lacrosse & football)
0%10%20%30%40%50% 1st Choice2nd Choice3rd Choice
by percentage of respondents (multiple selections could be made)
I
Lack
by percentage of respondents (multiple selections could be made)
by percentage of households that have a need for activities
Youth sports (soccer, tee ball, etc.)
sports (tennis, pickleball, etc.)
0%20%40%60%80%100% Fully Met Mostly MetPartly MetNot Met
by percentage of respondents who selected the item as one of their top three choices
Water‐related activities (swimming, fishing)
Outdoor/adventure recreation
Youth (K‐5th grade) activities
Youth sports (soccer, tee ball, etc.) Using Wi‐Fi Yoga/Pilates/Zumba Youth camps
‐
by percentage of respondents
Maintain existing beach parks & water access Maintain existing parks
Redevelop/Improve existing beach & waterfront parks
Develop new trails & connect existing trails/sidewalks
Maintain existing sports fields & sport courts
Maintain existing school parks
Redevelop/Improve existing neighborhood parks
Purchase land for open space or natural areas
Redevelop/Improve existing school parks
Purchase land & develop more neighborhood parks
Redevelop/Improve existing athletic fields & sport courts
Purchase land/develop more larger community parks
Develop indoor/outdoor aquatics facility(ies)
Develop indoor spaces & courts
Develop more dog parks
Develop more athletic fields & sport courts
Maintain existing beach parks & water access
Maintain existing parks
Develop new trails & connect existing trails/sidewalks
Redevelop/Improve existing beach & waterfront parks
Purchase land for open space or natural areas
Purchase land & develop more neighborhood parks
Maintain existing school parks
Develop indoor/outdoor aquatics facility(ies)
Redevelop/Improve existing neighborhood parks
Maintain existing sports fields & sport courts
Purchase land/develop more larger community parks
Redevelop/Improve existing school parks
Develop more dog parks
Redevelop/Improve existing athletic fields & sport courts
Develop indoor spaces & courts
Develop more athletic fields & sport courts
Q 4 W hich of t he f ollowing best describes you? (check all t hat apply)
Q 5 Count ing yourself , how many people in your household are. . .
City of Norwalk Rec reation and Parks M aster Plan Com m unity Survey
ANS WE R CHOI CE S
S t at e of Connec t ic ut S t at e P ark s
The Marit ime A quarium at Norwalk
Town of Wes t port
P riv at e Gy m or Rec reat ion P rov ider
Cit y of S t amf ord
Ot her munic ipal park s or programs
Nat ional P ark or ot her Federal lands
Town of New Canaan
S t epping S t ones Mus eum f or Children
Ot her public s c hools
I only v is it Cit y of Norwalk park s or programs
Ot her (pleas e s pec if y )
I only v is it Cit y of Norwalk park s or programs
Ot her (pleas e s pec if y )
I do not v is it park s or rec reat e
Not s ure
CI FY )
1 Darien
2 Oak Hills
3 I lead v olunt eers at Oy s t er S hell P ark t o res t ore t he nat iv e gardens and r plant s
4 Norwalk Lit t le League
5 Cherry Lawn Darien
6 Tow of Darien, Town of Fairf ield
7 Tow of Darien
8 Wilt on
9 Compo B eac h
10
12
S t epping S t ones Mus eum f or Children
Ot her public s c hools
I only v is it Cit y of Norwalk park s or programs
Ot her (pleas e s pec if y )
I do not v is it park s or rec reat e
Not s
Q 10 W hich ot her providers do you visit parks or part icipat e in recreat ion programming or special event s? (Select all t hat apply)
City of Norwalk Rec reation and Parks M aster Plan Com m unity Survey
Q 11 W hich F O UR of t he f ollowing leisure and recreat ion providers would you most pref er t o visit ?
Q 12 Have you or ot her members of your household part icipat ed in any programs (sport s, recreat ion, et c. ) or event s of f ered by t he Cit y of Norwalk during t he last 12 mont hs?
Q 13 Approximat ely how many dif f erent recreat ion programs or event s of f ered by t he Cit y of Norwalk have you or members of your household part icipat ed in over t he past 12 mont hs?
Q 14 W hat days and t imes do you most f requent ly part icipat e in programs or visit parks?
Q 15 O verall, how would you rat e t he qualit y of t he program(s) or event (s) t hat you and/ or members of your household part icipat ed in over t he last 12 mont hs?
Q 16 Rat e your level of sat isf act ion wit h t he f ollowing program services provided by t he Cit y of Norwalk Recreat ion and Parks Depart ment
Fees c harged f or v alue rec eiv ed
Qualit y of c us t omer s erv ic e
at ion of programs Times programs are of f ered Qualit y of ins t ruc t ors E as e of regis t rat ion
Qualit y of t he f ac ilit y where program/ ev ent is of f ered A v ailabilit y of inf ormat ion on Cit y 's / Depart ment 's
it e
Q 17 Select ALL of t he ways you or members of your household t ravel t o t he park or t o part icipat e in a recreat ion program or event
Q 17 Select ALL of t he ways you or members of your household t ravel t o t he park or t o part icipat e in a recreat ion program or event .
of Norwalk Rec reation and Parks M aster Plan Com m unity Survey
Q 19 Do you f eel t here are suf f icient parks and green space areas wit hin walking dist ance of your residence?
Q 19 Do you f eel t here are suf f icient parks and green space areas wit hin walking dist ance of your residence?
City of Norwalk Rec reation and Parks M aster Plan Com m unity Survey
City of Norwalk Rec reation and Parks M aster Plan Com m unity
WE R
Lac k of res t rooms
I do not k now what is of f ered
Lac k of s idewalk s or bik e lane ac c es s
P ark s / f ac ilit ies are not well maint ained
P ark s / f ac ilit ies are t oo c rowded
ANS WE R CHOI CE S
Lac k of res t rooms
I do not k now what is of f ered
Lac k of s idewalk s or bik e lane ac c es s
P ark s / f ac ilit ies are not well maint ained
P ark s / f ac ilit ies are t oo c rowded
e o r o t her
S ec urit y is ins uf f ic ient / loit ering
P ark s / f ac ilit ies t oo f ar f rom res idenc e
L ack o f acces s ibil it
Lac k of t rail ac c es s
F ees ar e t o o high
P rogram or f ac ilit y not of f ered
S ec urit y is ins uf f ic ient / loit ering
P ark s / f ac ilit ies t oo f ar f rom res idenc e
Lac k of t rail ac c es s
P rogram or f ac ilit y not of f ered
Us e priv at e or ot her c ommunit y 's park s / f ac ilit ies
Spaces no t co mfo r t abl e
Lac k of ac c es s ibilit y or park ing
Fees are t oo high
Par k o per at ing ho u r s no t
S pac es not c omf ort able out doors
Po o r cu s t o mer s er vice by
P ark operat ing hours not c onv enient
P oor c us t omer s erv ic e by s t af f
I do no t kno w l o cat io ns o f
I do not k now loc at ions of park s / f ac ilit ies
L ack o f t r ans po r t at i
Lac k of t rans port at ion/ public t rans it
P hy s ic al healt h limit at ions
Us e priv at e or ot her c ommunit y 's park s / f ac ilit ies
Lac k of ac c es s ibilit y or park ing
Fees are t oo high
S pac es not c omf ort able out doors
P ark operat ing hours not c onv enient
P oor c us t omer s erv ic e by s t af f
I do not k now loc at ions of park s / f ac ilit ies
Lac k of t rans port at ion/ public t rans it
P hy s ic al healt h limit at ions
Phys ical heal t h
Tot al Res pondent s : 217
# OTHE R (P LE AS E S P E CI FY )
Tot al Res pondent s : 217
# OTHE R (P LE AS E S P E CI FY ) DATE
DATE
1 Many park s hav e no amenit ies f or y ounger c hildren P lay grounds in ot her nearby t owns and c it ies of f er more f or c hildren, s o we go t here as a f amily 3/ 26/ 2022 2: 54 P M
1 Many park s hav e no amenit ies f or y ounger c hildren P lay grounds in ot her nearby t owns and c it ies of f er more f or c hildren, s o we go t here as a f amily
2 P ark s f or walk ing are horrible in E as t Norwalk no maint enanc e at all beaut if ul s c enery but horrible f oot pat hs in Vet erans P ark
2 P ark s f or walk ing are horrible in E as t Norwalk no maint enanc e at all beaut if ul s c enery but horrible f oot pat hs in Vet erans P ark
3 would us e more park s if dogs were allowed Wis h t hos e t hat don't pic k up af t er t heir dogs would get t ic k et ed and t hen allow t hos e of us t hat do res pec t ot hers t o us e more areas I es pec ially mis s Oy s t er S hell P ark and would lov e t o s ee t he out er ring of Vet erans P ark av ailable t o dogs
3 would us e more park s if dogs were allowed Wis h t hos e t hat don't pic k up af t er t heir dogs would get t ic k et ed and t hen allow t hos e of us t hat do res pec t ot hers t o us e more areas I es pec ially mis s Oy s t er S hell P ark and would lov e t o s ee t he out er ring of Vet erans P ark av ailable t o dogs
4 P ark ing s hould be f ree at Frees e P ark f or Norwalk res ident s 3/
4 P ark ing s hould be f ree at Frees e P ark f or Norwalk res ident s
a f requent v is it or of park s / play grounds I f t here are ev ent s hap pening, I am not aware of t hem - s o mark et ing is an is s ue I am nev er s een a f ly er along t he riv erwalk ,
pec t
quarium or Children's Mus eum, nor hav e I rec eiv ed any t hing in t he mail
t he
5 My pers pec t iv e is as a f requent v is it or of park s / play grounds I f t here are ev ent s hap pening, I am not aware of t hem - s o mark et ing is an is s ue I am nev er s een a f ly er along t he riv erwalk , at t he A quarium or Children's Mus eum, nor hav e I rec eiv ed any t hing in t he
lay ground s omet hing t hat was brought t o May or Rilling’s
6 There is no wat er in t he P lay ground s omet hing t hat was brought
Fees are t oo high
S pac es not c omf ort able out doors
P ark operat ing hours not c onv enient
P oor c us t omer s erv ic e by s t af f
I do not k now loc at ions of park s / f ac ilit ies
Lac k of t rans port at ion/ public t rans it
P hy s ic al healt h limit at ions
1 Many park s hav e no amenit ies f or y ounger c hildren P lay grounds in ot her nearby t owns and c it ies of f er more f or c hildren, s o we go t here as a f amily
2 P ark s f or walk ing are horrible in E as t Norwalk no maint enanc e at all beaut if ul s c enery but horrible f oot pat hs in Vet erans P ark
3 would us e more park s if dogs were allowed Wis h t hos e t hat don't pic k up af t er t heir dogs would get t ic k et ed and t hen allow t hos e of us t hat do res pec t ot hers t o us e more areas I es pec ially mis s Oy s t er S hell P ark and would lov e t o s ee t he out er ring of Vet erans P ark av ailable t o dogs
4 P ark ing s hould be f ree at Frees e P ark f or Norwalk res ident s
5 My pers pec t iv e is as a f requent v is it or of park s / play grounds I f t here are ev ent s happening, I am not aware of t hem - s o mark et ing is an is s ue I am nev er s een a f ly er along t he riv erwalk , at t he A quarium or Children s Mus eum, nor hav e I rec eiv ed any t hing in t he mail
6 There is no wat er in t he P lay ground, s omet hing t hat was brought t o May or Rilling’s
y ears ago
7 no ac c es s barriers t o park s f or us ; hav en t s een any programs of int eres t during COV I D (1 t een at home) and als o limit ed t ime f or programs
8 no dogs at c alf pas t ure of f s eas on; c ranbury t oo f ar and c rowded and not well k ept
City of Norwalk Rec reation and Parks M aster Plan Com m unity Survey
9 P oor K ay ak A c c es s t o wat er in Norwalk Not K ay ak B oat er Friendly
10 Very P oor K ay ak ac c es s in Norwalk inc luding all ex is t ing ac c es s point s P oor launc h or non ex is t anc e ac c es s
14 Cranberry
lor Farm, need t o allow dogs
We need P ic k le B all c ourt s
Child play s s port s and we do a lot of t rav eling bec aus e of it
I lov e t he park s I wis h t here was more programming
not permit t ed at s ome park s
Woods P ond is near where I liv e and c ould be a wonderf ul park I t is not well maint ained at all I n t he wint er, my f amily and ot hers us e t he pond t o s k at e on but it 's rat her dangerous t o get ont o t he ic e bec aus e of bloc k s of c onc ret e and brok en met al I t would be a wonderf ul plac e t o s k at e wit h jus t a bit more c are
work in Norwalk s o by t he t ime I get home t here’s no going bac k out
muc h park ing and roadway s , not enough green s pac e
bas k et ball or t ennis c ourt s , or park s
Fees are t oo high
S pac es not c omf ort able out doors
25 Í don’t work in Norwalk s o by t he t ime I get home t here’s no going bac k out
P ark operat ing hours not c onv enient
26 Too muc h park ing and roadway s , not enough green s pac e
P oor c us t omer s erv ic e by s t af f
27 Ver f ew bas k et ball or t ennis c ourt s , or park s
28 The amount of people and lac k of pat rol mak es going t o ev ent s undes irable
I do not k now loc at ions of park s / f ac ilit ies
29 Lac k of res t rooms in lat e f all, wint er
Lac k of t rans port at ion/ public t rans it
P hy s ic al healt h limit at ions
33 s t upid, res t ric t iv e Cov id rules
# OTHE R (P LE AS E S P E CI FY )
34 I really don't f eel prev ent ed f rom v is it ing any park s or programs
1 Many park s hav e no amenit ies f or y ounger c hildren P lay grounds in ot her nearby t owns and c it ies of f er more f or c hildren, s o we go t here as a f amily
36 t he pas t 12 mont hs hav e been an anamoly B ef ort e t hat we part ic pat ed muc h more f reqeunt ly
2 P ark s f or walk ing are horrible in E as t Norwalk no maint enanc e at all beaut if ul s c enery but horrible f oot pat hs in Vet erans P ark
37 B as eball f ields are not maint ained on a regular bas is I ns uf f ic ient amount of US A B LE f ields
3 would us e more park s if dogs were allowed Wis h t hos e t hat don't pic k up af t er t heir do gs would get t ic k et ed and t hen allow t hos e of us t hat do res pec t ot hers t o us e more areas I es pec ially mis s Oy s t er S hell P ark and would lov e t o s ee t he out er ring of Vet erans P ark av ailable t o dogs
39 I am a propert y owner in Norwalk and s o pay t ax es in y our t own and us ed t o get a beac h pas s unt il c hanged t o v ehic le regis t rat ion
City of Norwalk Rec reation and Parks M aster Plan Com m unity Survey
4 P ark ing s hould be f ree at Frees e P ark f or Norwalk res ident s
40 My hous ehold does not liv e in Norwalk
41 poor email c ommunic at ion ev en af t er it was point ed out by many f amilies horrible f emale umpire f or y out h f all s of t ball
c ut down t rees and t rample of f -t rail areas S ad t o s ee what us ed t o be a healt hy f ores t get abus ed
5 My pers pec t iv e is as a f requent v is it or of park s / play grounds I f t here are ev ent s happening, I am not aware o f t hem - s o mark et ing is an is s ue I am nev er s een a f ly er along t he riv erwalk , at t he A quarium or Children's Mus eum, nor hav e I rec eiv ed any t hing in t he mail
42 not hing prev ent s us now t hat Cov id is les s problemat ic
44 I 'm not aware of t he ac t iv it ies Need more f or S r Cit iz ens A ls o Cov id k eeps me away Need t ight er Cov id Rules , mas k s , s oc ial dis t anc ing, s af et y requirement s , et c
6 There is no wat er in t he P lay ground s omet hing t hat was brought t o May or Rilling’s at t ent ion 2 y ears ago
City of Norwalk Rec reation and Parks M aster Plan Com m unity Survey
43 A llowing Cranbury P ark s f ores t t o be damaged/ des t roy ed by v is it ors and f ris bee golf ers who
45 P ublic s wimming pool unav ailable
c ut down t rees and t rample of f -t rail areas S ad t o s ee what us ed t o be a healt hy f ores t get abus ed
7 no ac c es s barriers t o park s f or us ; hav en't s een any programs of int eres t during COV I D (1 t een at home) and als o limit ed t ime f or programs
/ 110
44 I 'm not aware of t he ac t iv it ies Need more f or S r Cit iz ens A ls o Cov id k eeps me away Need t ight er Cov id Rules , mas k s , s oc ial dis t anc ing, s af et y requirement s , et c
8 no dogs at c alf pas t ure of f s eas on; c ranbury t oo f ar and c rowded and not well k ept
46 The qualit y of play grounds is muc h higher in s urrounding t owns Ther e is more v aried equipment and t he park s are k ept f ree of lit t er Wit h y oung c hildren, lit t er is a real c onc ern bec aus e t hey will pic k it up and don’t k now t o av oid t hings lik e brok en glas s
47 Dis res pec t f ul dog owners let t heir pet s of f leas h on leas h-required areas
9 P oor K ay ak A c c es s t o wat er in Norwalk Not K ay ak B oat er Friendly
45 P ublic s wimming pool unav ailable
48 Dogs not permit t ed, ev en on leas h, whic h mak es no s ens e
46 The qualit y of play grounds is muc h higher in s urrounding t owns There is more v aried equipment and t he park s are k ept f ree of lit t er Wit h y oung c hildren, lit t er is a real c onc ern bec aus e t hey will pic k it up and don t k now t o av oid t hings lik e brok en glas s
49 The play ground at oy s t er s hell park does not hav e any benc hes whic h is f rus t rat ing
Member of priv at e c lub
47 Dis res pec t f ul dog owners let t heir pet s of f leas h on leas h-required areas
Need public pool or Y mc a in Norwalk
48 Dogs not permit t ed, ev en on leas h, whic h mak es no s ens e
49 The play ground at oy s t er s hell park does not hav e any benc hes whic h is f rus t rat ing
Member of priv at e c lub
Need public pool or Y mc a in Norwalk
Q 22 I ndicat e if you or members of your household have a need f or t he f ollowing recreat ion FACI LI T Y and how much of your need is current ly being met eit her by t he Cit y of Norwalk or ot her recreat ion and park providers.
Q 22 I ndicat e if you or members of your household have a need f or t he f ollowing recreat ion FACI LI T Y and how much of your need is current ly being met eit her by t he Cit y of Norwalk or ot her recreat ion and park providers.
I have a need and it’s fully met
I have a need and it’s mostly met
I have a need and it’s partly met
I have a need and it’s not met I do not have a need for this activity
S plas h pad(s
Dis c golf c ours e(s )
S k at e park s
Marina/ B oat launc hes
P lay grounds
Golf c ours e(s )
1 Where do we res pond if we don't pers onally hav e a need, but f eel t he c ommunit y s hould hav e an amenit y, s uc h as pool, c ommunit y gardens , s k at ing rink et c
2 S haded areas , awnings , benc hes , pic nic s pot s are ov erall lac k ing Calf P as t ure play ground is beaut if ully maint ained The ot her play grounds don't get as muc h TLC
3 Why does ev ery one t hink y ou need t ennis c ourt s and t hey are rarely us ed and bas k et
c ourt s are f ull?
4 need c hes s t ables at park s , benc hes c los e t oget her f or groups , ident if ied f riends hip benc hes mos t park s hav e limit ed s eat ing and it 's f ar apart f rom ot hers
5 More K ay ak ac c es s t o wat er
6 B at hrooms need t o be updat ed at t he beac h P LE A S E I am embarras s ed t o bring my f riends f rom Wes t port t o t he beac h
7 P ic k leball/ t ennis c ourt at s enior c ent er need res urf ac ing, and y ou c an paint pic k le lines
mak e t wo c ourt s
8 Week end golf is now f or t he ric h res ident s and ric h out of t own res ident s You mus t buy a members hip pas s f or a f ew t hous and t o be able t o get an early week end t ime Ot herwis e y our lef t play ing in t he af t ernoon This needs t o be c hanged we play els ewhere now bec aus e I c annot ev en af f ord t o play in my own t own A wf ul
u r t s (bas ket bal l ,
9 P ic k leball c ourt s are not av ailable and us needed
10 Need more ac c es s t o t he Norwalk Riv er wit h park s and t rails
11 A s s is t anc e f rom s c hool f or rowers brien mc mahon
12 B ik e t rails - not met
Co mmu nit y gar dens Pickl ebal l co u r t s
13 bas eball f ields are not being maint ained properly f or by park s and rec and giv e t he priv at e t he priv at e groups t hat are willing t o do t he work a hard t ime There was no reas on Fox Run had weeds growing in t he in f ield during t he ent ire bas eball s eas on and f all ball s eas on
Tr ail s / M u l t i-u s e pat hs
14 Cov id k eeps me away at t he pres ent t ime S t ric t er Cov id rules are needed
15 would be amaz ing t o hav e an out door pool and pic k leball c ourt in Norwalk
16 I would lik e t o s ee a c ommunit y out door pool f or Norwalk We c urrent ly don't hav e one and and it 's needed We c an c harge res ident s a s mall f ee t o us e it
Ou t do o r s o cial gat her ing Picnic ar eas /s hel t er s
17 S af e B ik e pat h wit h Greenway, not jus t bik e lanes
18 P lac es t o walk dog on leas h Why does n’t Norwalk allow leas hed dogs in park s ??
Nat u r al par ks and pr es er ves
Tennis co u r t s
M u l t ipu r po s e fiel ds (s o cc
Cano e/ K ayak l au nches
Q 22 I ndicat e if you or members of your household have a need f or t he f ollowing recreat ion FACI LI T Y and how much of your need is current ly being met eit her by t he Cit y of Norwalk or ot her recreat ion and park providers.
Q 23 W hich T HREE recreat ion f acilit ies list ed are most import ant t o you or members of your household?
Bo at l au nches
e par ks
e/ K ayak
Q 23 W hich T HREE recreat ion f acilit ies list ed are most import ant t o you or members of your household?
Q 24 I ndicat e if you or members of your household have a need f or t he f ollowing ACT I VI T I ES and how much of your need is current ly being met eit her by t he Cit y of Norwalk or ot her recreat ion and parks providers.
I have a need and it’s fully met
I have a need and it’s mostly met
I
I
Q 24 I ndicat e if you or members of your household have a need f or t he f ollowing ACT I VI T I ES and how much of your need is current ly being met eit her by t he Cit y of Norwalk or ot her recreat ion and parks providers.
er educ at ion eS port s (v ideo games ) S pec ial populat ions (inc lus iv e programming)
# OTHE R (P LE AS E S P E CI FY )
1 I f eel lik e our downt own & park s are underut iliz ed S ummer c onc ert s eries , we are t he bes t s it uat ed t own in Fairf ield Count y t o pull s omet hing lik e t his of f - we'v e got t he s pac e and t he park ing Let 's hav e a s t anding week end Farmer's Mark et t o s upport loc al bus ines s es , Family Mov ie night under t he s t ars at Vet eran's P ark , E nc ourage Mus ic ians t o play in our park s , E nc ourage more f ood t ruc k s on bus y da y s , hos t k id t hemed c ommunit y ev ent s (mus ic c irc le, s t ory t ime in t he park - why is n't t he Norwalk library doing any of t his ? Darien Library is in c onjunc t ion wit h park s & rec & t he Nat ure Cent er), adult ev ent s - I hav e nev er s een an out door boot c amp f it nes s c las s or y oga, t he c it y c ould hire an ins t ruc t or and of f er a f ree mont hly c las s in a park Guided t ours of t he downt own s ono/ riv er walk I would lov e t o s ee light s / dec or around our riv erwalk & downt own area during t he holiday s eas on We s hould be enc ouraging art is t ic ex pres s ion & energy in our c ommunit y and dedic at ing res ourc es t o it S ignage ov erall is lac k ing I lov e t he pic t orial s ignage along t he riv erwalk , but it s s t art ing t o degrade and t here c ould be more of it all ov er t he plac e Look out magnif y ing s c opes along t he riv er would be f un, c hild & adult s iz ed We need t o hire more s t af f t o maint ain our park s along t he riv er, t ras h ac c umulat es v ery f as t & t he lands c aping is a bit lac k lus t er Dev on's plac e play ground is not being regularly maint ained wit h t he s ame TLC as Calf P as t ure I t needs s ome money put int o it f or Lands c aping and upk eep The play ground near t he mall-s ide needs t o be part ially f enc ed and t he s idewalk s rec onf igured B enc hes / s eat ing areas are hard t o c ome by and I k now t hes e c an be t ric k y as t hey c an at t rac t unwant ed v is it ors , but t here s imply are not a lot of plac es t o res t and s oc ializ e
4 more y out h, adult , and s r c it iz ens ac t iv it ies onc e Cov id is ov er or c ont ained
5 Tang S oo Do wit h Doug P eoples is s omet hing t hat has been and c ont inues t o be a s t andout , c ons is t ent legac y in Norwalk A priorit y f or my f amily is t o ens ure t hat t here are no plans t o impede t his program in t he f ut ure A s it s t ands , we are dis appoint ed in t he lac k of t rans parenc y by P ark s & Rec t o hav e Mr P eoples remov e his belongings f rom t he of f ic e he has oc c upied f or dec ades
6 P lac e t o walk dogs !
Q 25 W hich T HREE act ivit ies list ed are most import ant t o you or members of your household?
Q 25 W hich T HREE act ivit ies list ed are most import ant t o you or members of your household?
eat io His t o r y and mu s eu ms A du l t s po r t s
r adu l t act ivit iesCity of Norwalk Rec reation and Parks M aster Plan Com m unity Survey
P urc has e land and dev elop more neighborhood park s
Dev elop more at hlet ic f ields and s port c ourt s
Dev elop indoor s pac es and c ourt s
P urc has e land and dev elop more larger c ommunit y park s
needed
4 Finis h t he dev elopment of t he pat h along t he riv er - t here is a s ec t ion bet ween c ondos t hat has no f inis hed pat h-jus t a f oot t rail
5 I wis h I c ould put 3 c hec k mark s on " Redev elop/ I mprov e ex is t ing beac h and wat erf ront park s " P LE A S E UP DATE t he B at hrooms
MORE DOG PA RK S
Dev elop more dog park s City of Norwalk Rec reation and Parks M aster Plan Com m unity Survey
7 B uild a Rec reat ion Cent er lik e in Ridgef ield, wit h an indoor/ out door pool, play ground, indoor s pac es and c ourt s
8 prov ide indoor and out door c ourt s f or P ic k le B all (out door nex t t o t ennis c ourt s on Gregory
9 B uild and I ndoor Trac k and Field Fac ilit y lik e Hillhous e New Hav an, New B alanc e A rmory or Oc ean B reez e NY et c
10 J us t don’t remov e t he t rees !
11 I nc lude wint er ac t iv it ies in y our plan Norwalk has s ev eral great ponds t hat c ould be us ed f or ic e s k at ing This happens already but t he pond my f amily goes t o is n t well maint ained at all I don't t hink muc h is needed and it c ould hav e a wonderf ul impac t
12 B uilding a neighborhood park f or c hildren around t he rout e 7 neighborhood, c los e t o t he Merrit
7 t rain s t at ion
13 Curious why maint enanc e of ex is t ing f ac ilit ies is ev en a ques t ion
14 Creat e nat ure park wit h v arious boat ing opport unit ies at Manres a I s land
15 Hav ing indoor and out door s wimming pool f or t he s ummer and wint er would be great f or s wim les s ons t oo as well as f or rec reat ion
16 Maint ain t he ex is t ing f ields bet t er, c reat e a bas eball c omplex at P onus Wit h bat hrooms
17 why buy more land f or park s when y ou already hav e plent y of t own land t hat s it s empt y wit h no t res pas s s igns (red c ot t age on Fillow)
18 We need t o f oc us on t he pot ent ial pos it iv e impac t Norwalk c an hav e on c limat e c hange Grow and maint ain t rees , and park s where people c an f ind peac e and s olit ude in t he woods Cont ain ac t iv it ies t hat c ould damage our nat ural as s et s
19 k eep what we hav e and improv e t hem Mak e t hem more s af e during Cov id ex ix t anc e
20 P urc ahs e land t o build a c it y out door pool
21 Change rules in park s t o allow dog walk ing We don’t need of f leas h dog park s as muc h as plac es t o walk dogs
Q 26 T he f ollowing are act ions t hat t he Cit y of Norwalk could t ake t o improve t he Recreat ion and Parks syst em. I ndicat e your level of support f or each act ion.
Norwalk Recreation & Parks Master Plan
Q 27 W hich T HREE act ions would you be most willing t o f und wit h your t ax dollars?
Q 28 F unding f or parks, recreat ion f acilit ies/ programs, school parks, and t rails may be secured f rom a variet y of sources. W hich t hree of t he f ollowing choices of f
sources do you most pref er?
Q 28 F unding f or parks, recreat ion f acilit ies/ programs, school parks, and t rails may be secured f rom a variet y of sources. W hich t hree of t he f ollowing choices of f unding sources do you most pref er?
Q 29 F unding collect ed t hrough user f ees and charges helps t he Cit y t o provide high-qualit y programs and services t hrough lower propert y t axes. Such programs are likely t o be f acilit y or recreat ion programs, yout h or adult sport s, paid park event s, and special event s and f est ivals. Please check t he addit ional amount in user f ees or charges you would be willing t o pay f or your f avorit e Recreat ion and Parks act ivit y or program which you or members of your household part icipat e. (addit ional amount s are per event or program f or each person)
Q 29 F unding collect ed t hrough user f ees and charges helps t he Cit y t o provide high-qualit y programs and services t hrough lower propert y t axes. Such programs are likely t o be f acilit y or recreat ion programs, yout h or adult sport s, paid park event s, and special event s and f est ivals. Please check t he addit ional amount in user f ees or charges you would be willing t o pay f or your f avorit e Recreat ion and Parks act ivit y or program which you or members of your household part icipat e. (addit ional amount s are per event or program f or each person)
Q30 A percent age of t he Cit y' s budget is used f or t he operat ions, maint enance, and improvement of parks, recreat ion f acilit ies/ programs, school parks, and t rails. T his percent age varies and has increased by an average of 1. 3% annually over t he last t en-years whereas t he Cit y' s overall budget has increased on average 3. 1%. T he qualit y of maint aining, operat ing, improving, and securing parks, recreat ion f acilit ies/ programs, school parks, and t rails is largely impact ed by t he amount of propert y t axes allocat ed f or t hese. F rom t he f ollowing list , please check t he addit ional amount you would be willing t o pay in propert y t axes t o f und t he act ions you indicat ed as most import ant t o your household in Q uest ion #28.
Q30 A percent age of t he Cit y' s budget is used f or t he operat ions, maint enance, and improvement of parks, recreat ion f acilit ies/ programs, school parks, and t rails. T his percent age varies and has increased by an average of 1. 3% annually over t he last t en-years whereas t he Cit y' s overall budget has increased on average 3. 1%. T he qualit y of maint aining, operat ing, improving, and securing parks, recreat ion f acilit ies/ programs, school parks, and t rails is largely impact ed by t he amount of propert y t axes allocat ed f or t hese. F rom t he f ollowing list , please check t he addit ional amount you would be willing t o pay in propert y t axes t o f und t he act ions you indicat ed as most import ant t o your household in Q uest ion #28.
Submitted by: BerryDunn 2211 Congress Street Portland, ME 04102-1955 207.541.2200
Chad Snow, Principal csnow@berrydunn.com
Barbara Heller, Project Manager bheller@berrydunn.com
Submitted On: May 2023
BerryDunn completed a recreation programming assessment in support of the City of Norwalk (City), Connecticut’s Parks and Recreation Department’s (Department’s) master planning efforts. The Department’s recreation programs and services were evaluated through a series of data analysis, conversations with staff, focus group feedback, and results from the community needs survey. This recreation assessment report offers detailed insight into the Department’s recreation program offerings, and helps to identify the strengths, weaknesses, and opportunities for future program direction. This report also assists with identifying program categories, programming gaps, and future program considerations.
A program menu consists of the recreational activities offered for a specific time frame. The Department’s 2019 program menu contains the last full data set for one year of programs not impacted by the COVID-19 pandemic and was therefore used as a base for the program menu analysis. The subsequent years’ offerings were also reviewed. This section will review the menu’s core program areas, program inventory, program distribution, and age segmentation.
The Department had three core program areas in 2019: Aquatics, Camps, and Youth Sports. In the subsequent years observed, staff continued to expand and diversify its program menu to include Adult Leagues, Aquatics, Camps, Youth Sports, and Cultural. This growth demonstrates a commitment to continuous improvement, and a desire to continue to provide for the needs and desires of the community.
Adult leagues and tournaments are offered for sports such as bocce, men’s flag football, men’s basketball, volleyball, and softball. Participants can join as teams or as free agent individuals interested in joining a team.
Learn to swim, lifeguard instruction, and swim instructor classes are at the high school pool and at the beach. Learn to swim classes are offered for a variety of days, times, and ages.
Summer day camps, called Play and Learn Camps, are available from Pre-K through ninth grade participants for seven weeks in June, July, and August. In addition to the traditional summer day camp options, the Department offers a skateboard camp. Unique to oceanside communities, the camps offer beach time in addition to activities like crafts, games, and sports. Extended camp time is offered in the mornings and evenings, beyond the core day.
Youth sports programs offer skill development opportunities for youth in areas such as baseball, basketball, skateboarding, girls’ volleyball, and more. Based in a community recreation approach, participation, exploration, and growth are encouraged over competition.
Cultural programming includes garden plot reservations, green house table use, and one-time special programs such as Kids Kickball, Spooktacular, Holiday Breakfast with Frosty, and Bubble-Mania Holiday Show.
The following is a list of major program categories that park and recreation agencies throughout the country commonly provide. This list helps to identify if there are any common program areas not offered by an agency. Most agencies offer a majority of programs. In matching the Department’s inventory of programs against this list, 9.1% of the program areas are represented. (Purple text represents programs offered by the Department.)
Active Adult
Aquatics
Arts
Before/After school
Biking
Birthday Party Services
Childcare
Cooking
Dance
Day/School break camps
E-Sports
Early Childhood
Environmental/Nature
Extreme Sports
Fitness
General Interest
Golf
Gymnastics/Tumbling
Historical programs
Homeschool
Horseback Riding
Ice Skating/Hockey
Language Arts
Lifelong Learning
Martial arts
Music
Open Gym
Outdoor Adventure
Pets
Preschool
Running/Walking
Seniors
Special/Community Events
Specialty Camps
Sports
STEM/STEAM
Summer Camp (day-long)
Sustainability/Green
Teen
Tennis
Theatre/Acting
Therapeutic Recreation
Trips
Wellness
For comparison purposes, the consulting team reviewed the program category percentages against its database of park and recreation agencies nationwide. The comparison agencies’ average percentage of program categories was 64.7%, which is higher than the Department’s 9.1%. The program categories depicted with black text represent opportunities for program menu expansion where aligned with community needs.
To add an additional nationwide benchmark perspective, a review of similarly sized communities that added their program menu information into the National Recreation and Parks Association (NRPA) database resulted in the following percentages of communities that offered key program area categories:
Based on this analysis alone, the Department has a lot of room for growth in it its variety of recreation program opportunities.
Understanding how the Department’s enrollment-based program menu is distributed across the core program areas helps to identify the extent of programming within each program area in relation to the whole. Figures 1 and 2 depicts the total of programs offered in 2019 and 2022 according to program area.
The program menu consisted of three core program areas in 2019: Aquatics, Camps, and Youth Sports. The large majority of classes were offered in Aquatics (90.6%). Department staff made significant changes to the program menu between 2019 and 2022 – expanding into five core program areas: Adult Leagues, Aquatics, Camps, Youth Sports, and Cultural. This shift diversified the program menu, as depicted in Figure 2.
More than half (52.8%) of programs were in Aquatics in 2022; while a significantly lower percentage than three years prior, Aquatics continues to dominate the program menu. Camps accounted for over one-third (36.4%) of programs in 2022, a significant shift from the 4.8% in 2019.


The age segment analysis reviews the distribution of the program offerings according to the age segments serviced. For the purposes of this assessment, BerryDunn youth and adult age categories.
In 2021, 97.8% of programs offered were for youth, and 2.2% of programs offered were for adults. While recreation providers typically offer more youth than adult programming, the dichotomy between the Department’s aged-based offerings is quite high.

While many programmatic growth opportunities exist for the Department, reaching the needs of adults should be a key age-based demographic target in the near future.
In addition to traditional programing, the Department provides other services that support the community’s recreation opportunities. The staff manages the permitting system for sports fields (both turf and grass), and gymnasium reservations. The Department also administers passes for the waste disposal and beach parking.

In addition to assessing the menu of programs as offered, it is helpful to assess how the programs actually perform. In this analysis, the extent of program performance was measured using participation metrics.
Enrollment
Total enrollment into the Department’s programs was 4,160 in 2019, a year that demonstrates pre-pandemic participation levels. Participation in 2020 was significantly reduced due to the pandemic and aligns with nationwide participation trends. The gradual increase between 2020 and 2021, and the great start to 2022’s registration figures indicate a solid recovery and continued trajectory to pre-pandemic participation levels.
*Partial year, through Q1
Participation in aquatics and youth sports program areas have consistently been stronger than the other program areas. While aquatics participation was highest in 2019 aquatics, camp participation outpaced the other areas in 2021.
Figure 5 depicts how the ages of Norwalk participants has shifted over time.
2019 Participants 2022 Participants
A positive shift from 2019 to 2022 was the Department’s reach to more age groups. Unlike 2019, where participants ranged from age 5-15, 2022 participants spanned age 4-18+.
The large quantity of 2022 participants that did not provide their age (160) demonstrates an opportunity to track participants’ demographic data more closely. Without key data points like age, it is difficult for staff to make data-driven decisions.
The heat map visualization in Figure 6 depicts the household locations of 2022 participants. Each unique household is represented once in the image. The concentration spectrum uses blue shaded areas to represent a lower number of household locations, then shifts to purple, red, and yellow as the number of households increases.
Based on the household’s geographic locations, the western edge of the community has experienced less participation than the more central portion of the community.


A recreation programs SWOT analysis of the Department observed the following key findings:
Strengths
The Department is known for its swimming lessons. The prices are low, and the Department has a reputation for delivering a good product. Youth and adult sports opportunities are provided both in-house as well as facilitated for affiliate groups. The summer camp program an area of growing strength.
One of the biggest challenges the Department faces is a low number of programming staff. There was a time when the Department employed more than 20 full time staff; at the beginning of the recreation assessment, there were four. Additionally, the Department has access to limited indoor programming space to conduct recreation programs. They currently hold programs at two school-owned sites, a community room, and a barn.
An improved relationship with the school district could help increase community access in a more consistent manner. New Department staff offer a promise of potential program menu growth. As program offerings grow, there is an opportunity to communicate the programs and activities in a more comprehensive listing, such as a catalogue. Developing new partnerships can broaden the Department’s ability to reach residents’ needs.
Changes to the facilities where the Department currently holds programs can directly impact its ability to provide services. Natural forces are causing and continue to threaten beach erosion.
The community needs assessment survey provided insight to residents’ recreation programs needs and desires. Nature enjoyment had the top importance rating as well as the highest unmet need rating, which resulted in nature enjoyment being the highest Priority Investment Rating activity. These are atypical results compared to other communities (35 percentage points higher than the national average) and therefore stand out as the largest programmatic gap and opportunity.
Compared to the national averages, the survey respondents indicated a low percent of program participation (12 percentage points lower than the national average) in the last year. This result aligns with the number of recorded participants, and number of opportunities currently available to the community.
Not knowing what is being offered was the largest reported barrier to participation.
Department staff had observed that its user fees were low; the survey respondents’ willingness to pay results indicate that 67% would be willing to pay for activities important to their household.
Another stand-out result of the survey was that two-thirds of respondent households with a need for special recreation have unmet or partly met needs. This equated to approximately 1,073 households with a need for special population recreation program opportunities.
This section addresses key areas of best practices for recreation programming including the following attributes: quality standards, customer requirements, key performance indicators, and cost recovery goals. Additionally, marketing, customer satisfaction, staffing levels, and equity are reviewed as an opportunity to align with benchmark agencies.
A key to developing consistent services is the use of service and program standards. The use of standards provides a more consistent service experience. As program growth continues, and as staff time permits, standards can be deployed throughout the entire recreation program system, such as customer requirements, instructor standards, safety, staff training and development, and program quality.
In addition to standards, efforts should be made to develop a listing of key customer requirements for core program areas. Key customer requirements are defined as those areas of the program purchasing process that are most important to registrants. For example, an adult softball player’s key requirements may include cost of the league, quality of athletic field maintenance, cleanliness of restrooms, access to free parking, quality of the umpires, game times, and location of the field. Identifying key requirements is important for staff to deliver in the items most important to the customer. This also reinforces key elements of service that staff should become familiar.
Key requirements should be identified by customers and can be included as part of an importance/performance matrix. This determines how important a requirement is to the customer and how the Department is performing. Surveys and program evaluations should include questions that assess customer satisfaction in these areas.
Another area of strengthening includes the development of key performance indicators. Organizations that measure performance also have a documented process in place to ensure follow through on results. A robust measurement system generally includes a more comprehensive set of measures, including:
Number of programs per age segment
Customer satisfaction (Details are included in the next section)
Cost recovery rates by core program area
Number of new programs offered annually (to drive innovation)
Number of program cancellations
Household percentage of program participation
Percent of programs in introduction and growth stage
Customer retention, repurchase intent, and referral
Best practice agencies have identified cost recovery goals for core program areas. The goal can be calculated from actual performance in the three most recent years’ financial results by core program area. This should be accompanied by a cost-of-service study to determine indirect charges and identification of true costs of service. The development of a cost-of-service study will also be helpful in creating a standardized approach to pricing services. Currently, a consistent methodology is not in place.
The Department could benefit from a marketing plan to create promotion strategies for core programs and events. A plan can start out simple and evolve over time as participation and staffing levels increase. As a starting point, a simple marketing plan could include answers to the following questions:
1. Who are you? Conduct brand development sessions with staff and public.
2. What do you want to achieve? Overall development of marketing goals with staff.
3. Who are they? Identification of target markets.
4. How will we connect with them? Develop channels to communicate to the appropriate market segments.
5. How do they want to be communicated with? Develop content guidelines for each channel.
6. How are we doing? Define evaluation methods with staff.
The publication of a seasonal program guide is part of a greater strategy for communicating program opportunities. Combined with posts to websites, email, social media, and community presentations, the program guide is one way to publicize programs, activities, policies, and events. It is also an opportunity to highlight staff and advertise for staff that are needed. Even as different communities may have different preferences for how they receive program information, program guides continue to be the most widely preferred method for recreation program participants, regardless of location or size of the agency. According to NRPA research, 76% of park and recreation agencies print a program catalogue or guide promoting their offerings.
It is important to follow best practices when creating a program guide including:
1. Maximize the return on investment (ROI) from the guide through offering various registration tools, times, etc. Recreation departments should make it as easy as possible for customers to enroll in programs and events.
2. Welcome notes and letters to customers should not be placed on the front or back covers or on the first few pages – these are prime spaces for attracting participants to new programs or services.
3. Program descriptions should follow the five “C”s to attract participants:
a. Clear – be clear in the broad sense. Describe programs in a way that does not limit the instructor: “this class may include crafts and music projects”.
b. Concise – do not use phrases like “This class will…” or “You will learn…”. Assume that the reader knows the program will be fun – do not include. Do not include the age in the title or in the body of the description – it should be included in the activity category or with program details such date, date, time, location, and fee.
c. Creative – use different descriptive works and try not to repeat the same words often, if possible.
d. Consistent – confirmation information should be at the end of the description. For example: “Bring sunscreen and a hat”.
e. Catchy – each program description should be unique. A customer should not have to look at a page of activities that all start in the same manner.
4. An automated registration system that is easy to use is important. The Department has struggled with RecTrac and recently sought out a new system. An automated system should not only be easy for the customer to use but provide easy data reporting for staff.
5. Distribution of the program guide – best practices call for direct mail. Recreation departments need to be aware of the printing cost and potential perceptions around environmental issues when printing large quantities of program guides. Some organizations are now using QR codes within their guides to reduce that amount of text and include fewer pages.
6. Selling advertising space is a good option to offset the cost of the printing and mailing a guide.
It is important to have a process in place for program participants and staff to continually evaluate the programs and events provided to the community. Comment cards with survey questions to rate the quality of the programs can work well to gauge satisfaction. Performance measures, developed by staff, can be a very effective in driving a program that continually improves. As staff develop and manage programs, the following questions can be considered:
Is participation increasing or decreasing? If participation is increasing, that could mean that the program should continue. If participation is decreasing, are there steps to take to increase interest through marketing efforts, changes to time/day of the program, format, or instructor? If not, it may be time to discontinue the program.
Is there information contained in the participant/staff feedback that can be used to improve the program?
Are cost recovery goals being met? If not, can costs be reduced or can fees be increased?
Is there another program provider that is more suitable to offer this program? If yes, the Department could provide referrals for its customers.
Is the program taking up valuable facility space that could be used for expansion of more popular programs or new programs in demand by the community?

The BerryDunn consulting team crated the service matrix to assist recreation departments with programming decisions to best gauge whether programs should be offered, continued, or discontinued. This can be a useful tool as the Department continues to expand existing programs and add new.
Once a program is established, key performance indicators will be an important part of the continued evaluation of the program for effectiveness and efficiently. Performance indicators should be applied to all programs and events and report on a regular basis.
According to a national benchmarking data acquired through the National Recreation and Park Association, of the 51 peer agencies in the same population size bracket, the median number of full time equivalent (FTE’s) employees per 10,000 population was 9.3. At the time of this report’s compilation, Department’s FTE’s per 10,000 was 2.97.
Compared to BerryDunn’s database of client data, similarly sized communities produce, on average, 23.02 programs per 1,000 residents. Norwalk produces 6.6 programs per 1,000 residents. This comparison used Norwalk’s 2019 total number of programs, 565; the average of the peer benchmarks was 1,555 programs. This data demonstrates that similarly-sized communities are producing more recreation programs for their communities. That said, the benchmark data has also identified that the number of programs and services a recreation department can offer is directly related to the number of programming staff it employs. The peer benchmark agencies in BerryDunn’s database employ an average of 11.2 full time programming staff. The average output of programs per full time employee, within the context of the benchmark agencies, is 106.7 programs per full time employee. The Department’s current average output is 188.3. This comparison demonstrates that the Department’s current full time programming team is beyond the benchmark (and likely capacity) to produce more programs. If the Department desires to increase its programmatic reach (and subsequently participation) one of the first steps will be to employ additional programming staff.
Agencies across the nation are finding ways to help ensure their programs and services are being provided in an equitable manner. Whether via geographic location, target audience, or diverse interests, continuing to assess and analyze service offerings through a diversity, equity, and inclusion lens is a best practice the Department can strengthen in both analysis and implementation.
One key area identified for improvement is the best practice of offering inclusion and/or specialized services for participants with special needs. Municipal departments are often the sole providers of therapeutic recreation for a community.
Department staff also defined a need for an equitable field allocation system. With limited fields and resources, the current “historical use” system does not foster an equitable opportunity. Staff also felt there is an opportunity to have the Department’s materials translated into Spanish.
BerryDunn was tasked with reviewing similar providers of recreation programs the Norwalk area. The results of the ETC Needs Assessment were reviewed as a means to refine the similar provider review’s focus. ETC developed the Priority Investment Rating (PIR) to help organizations determine where to focus resources to make the greatest impact. The PIR equally weighs the importance that a respondent places on a program type and how many respondents have an unmet need for that program. The top eight Norwalk, CT program types with the highest PIR include:
Nature Enjoyment (PIR: 200)
Fitness & wellness (PIR: 138)
Special events/festivals (PIR: 133)
Senior activities (PIR:132)
Performing arts (PIR: 128)
Aquatics (PIR: 119)
History & museums (PIR: 118)
Water-related activities (PIR: 111)
The similar provider review was conducted using these eight priority investment areas.
Nature Enjoyment
Nature Enjoyment was the program type with the highest PIR in the ETC needs assessment survey results. Norwalk has a great deal to offer with its location adjacent to the Long Island Sound and the Norwalk River. The Town has several beach parks and fishing piers providing access to the water in several locations. In addition, other organizations provide access to different types of nature for the public’s enjoyment. The organizations in Table 2 may be appropriate to target as future partners.
There are many private facilities located in and near Norwalk providing fitness opportunities for adults with a few offering programs for youth. There is a great deal of variety, including many types of group exercise classes, personal training, strength and cardio conditioning, swimming, dance, tennis, pickleball, squash, self-defense, and martial arts. After 90 years in operation, the Norwalk YMCA closed in 2012. This facility had a history of providing health and wellness opportunities for area families and, at the time of closing, had 3,000 members. The building is now vacant, and the land is owned by the local hospital. Table 3 includes the fitness and wellness facilities located in the area.
The Town of Norwalk provides space for many organizations to host community events and festivals and provides many on their own as well. As a result of the Covid-19 pandemic, people continue to seek outdoor activities that are perceived to be safe. Table 4 includes five large events held annually in Norwalk. There are also a number of family events held at the Stepping Stones Museum for Children throughout the year.
Name of Event Activities
MarketProvided by
agesNorwalk Seaport Association Norwalk Art Festival Juried fine arts festival with 75 artists, food vendors, children's hands‐on art experience All agesGordon Fine Arts
Seaport Oyster Festival Live music, Food vendors, Arts & Crafts Show
SoNo Art Festival Showcasing the work of 100 juried artists, music, food vendorsAll agesGordon Fine Arts
Norwalk Film Festival Over 50 films screened througout the event. Norwalk Arts Society
Nice Festival Music, food, art, entertainment, and interactive gamesAll agesNice Inc.
There is a senior center in Norwalk that is run by a non-profit organization, holding programs at two locations (11 Allen Road and 92 Cedar Street). According to Department staff members, many residents have expressed their dissatisfaction with the current programming offered at these facilities. The Department is planning to host some events with the senior center in the future. The staff agrees with the results of the needs assessment survey and feel that there is a gap in senior programming in Norwalk. In searching for additional recreation providers for the senior population, nothing was found.
Similar to the fitness offerings in Norwalk, there are a number of organizations providing music lessons, dance instruction, performing arts, and opportunities for live entertainment (including music, stand-up, plays, and musicals). Table 5 includes performing arts related offerings in Norwalk and the surround communities.
2 William St, Norwalk Music lessons (drums, bass, piano)/in‐person or online Youth, adult Private
Music
Giuliano's Music 406 Westport Ave, NorwalkMusic lessons, instrument sales and rental, and guitar repairYouth, adult Privale
Mary Ann Hall's Music for Children32 Main St, Norwalk Early Childhood Music lessons (voice, piano, ukulele, recorder), full staged performances
Infant/parent ‐ 12 yearsPrivate
Silvermine School of Music 36 Comstock Hill Ave, Norwalk Piano lessons, performances, competitions, master classesYouth, adult Private Music Together of Fairfield County156 South Ave, New CanaanEarly Childhood Music lessons
Hillwood Music
14 Hillwood Pl, NorwalkGuitar lessons
Daniela Gongora Music Academy 0 East Ave, Norwalk Violin (Suzuki method), chamber orchestra
Bennett Mazzola Music
2 Dewal Dr, Norwalk Music lessons (clarinet, saxophone, flute, and piano)
John Cutrone 9 Frances Ave, NorwalkDrum lessons
The Ewald Suzuki Guitar Method, LLC230 East Ave, NorwalkClassical guitar lessons
Music Theatre of Connecticut509 Westport Ave, NorwalkActing classes, School of Performing Arts, camps, and Equity productions
Wall Street Theater 71 Wall Street, NorwalkStandup comedy, live music
Norwalk Academy of Dance205 Westport Ave, NorwalkDance instruction (in creative, ballet, jazz, lyrical, and hip hop), tumbling, and acrobatics, and dance competitions
Dance Dimensions
15 Cross Street, NorwalkDance instruction in ballet, jazz, tap, hip hop, and lyrical
Fred Astair Dance Studios 314 Westport Ave, NorwalkDance instruction in Salsa, Mambo, Hustle, Swing, Merengue, Rumba, Cha Cha, Samba, Bolero, Paso Doble, Jive, Bachata, Tango, Foxtrot, Tango, Waltz, Quickstep, and Two ‐Step; events, and rentals
Dance instruction in jazz, contemporary, hip hop,
Infant/parent ‐ 8 yearsPrivate
youth, adult Private
Youth Private
Youth, teens, adultsPrivate
Youth, adult Private
Youth, adult Private
Youth, adult Nonprofit
Youth, adult Nonprofit
Age 3 ‐ 19 yearsPrivate
Age 3 ‐ high schoolPrivate
Adults Private
The Spot Just Dance Studios48 Westport Ave, Norwalk
Access to swimming pools in the Norwalk area is limited. There are YMCAs in both Darien and Westport and an outdoor public pool in New Canaan. The community needs survey indicated an
interest in swimming (both indoors and out) as well as a public pool. The full list of opportunities is included in Table 6.
The Norwalk area is rich in history with many opportunities to learn about the past. Working to partner with the organizations included in Table 7 is highly recommended as new programming is added.
Norwalk residents are interested in more access to water and water-related activities. With pool related opportunities included in Table 6, Table 8 focuses on activities on or around the natural bodies of water. Although access to the water is available, most of these opportunities are costly.
In the areas of performing arts and fitness, the public and non-profit sectors are providing a plethora of opportunities. The Department should consider becoming a resource for community members to find the programs they are seeking. By utilizing the information included in this report and adding to it each year, the Department could refer people where they can find their desired recreation opportunities. Another opportunity for the Department would be to partners with some of these businesses and nonprofits to offer programs and events to meet expressed community needs.
The following section summarizes regional and national trends that are relevant to Norwalk, CT based on the outcomes from the Community Interest and Opinion Survey performed by ETC Institute. The trends topic areas are tailored to focus on the eight high priorities for investment for activities based on the (PIR).
A wide variety of sources were used in gathering information for this report, including:
American College of Sports Medicine (ACSM)
American Council on Exercise (ACE)
American Planning Association
Center for Disease Control and Prevention
City Parks Alliance
Forbes
National Recreation and Park Association (NRPA)
The Aspen Institute
The Learning Resource Network (LERN)
The New York Times
The Outdoor Industry Association
Nature Programming & Nature‐Deficit Disorder
Playing in nature is an educational opportunity that has numerous benefits, from increasing active and healthy lifestyles, to developing a conservation mindset, to understanding the ecosystems and wildlife that depend on them. According to the report, “Nature Play & Learning Places: Creating and Managing Places where Children Engage with Nature,” there is a genuine need for learning spaces that spark creative play with natural materials, such as plants, vines, shrubs, rocks, water, logs, and other elements (2020).
Richard Louv introduced the term, “Nature-Deficit Disorder” in 2005, which describes the effects of urbanization, technological advances, and social changes. Scientific evidence suggests that this disorder contributes to emotional and physical illnesses, including attention difficulties, obesity, nature illiteracy, and an “epidemic of inactivity.”
Environmental education, provided by non-profits and parks and recreation agencies, can help combat nature-deficit disorder by sparking curiosity in the outdoors either through structured nature programming or through unstructured nature play. Nature Play is defined as “A designated, managed area in an existing or modified outdoor environment where children of all
ages and abilities play and learn by engaging with and manipulating diverse natural elements, materials, organisms, and habitats, through sensory, fine motor and gross motor experiences.”
Nature Play spaces can provide valuable lessons for children, not only regarding learning their natural environment and appreciation for nature, but also for personal development. These spaces, like playgrounds, provide safe spaces to take risks and understand behavioral outcomes. One of the most essential elements in planning nature play spaces is to conduct a risk assessment to reduce the unnecessary potential of injury. For instance, natural objects such as logs and boulders may be placed strategically for climbing but consider where the child might land if he or she were to fall or jump off. Similarly, trees can be used as natural climbing features, with consideration to removing shrubs and nearby smaller trees below. Nature Play can happen in forest-based schools, play zoos, gardens, and summer camps. American Camp Association reported that there are approximately 5,000-day camps that currently operate in the U.S.
Each year, the ACSM conducts a survey of worldwide fitness trends. Now in its 16th year, the ACSM circulates an electronic survey to thousands of fitness professionals around the world to determine health and fitness trends. The list below includes the top 10 fitness trends for 2022.
Wearable technology, which includes activity trackers, smartwatches, heart rate monitors, GPS tracking devices, and smart eyeglasses (designed to show maps and track activity), has been one of the top three trends since 2016. Examples include fitness and activity trackers such as those from Misfit, Garmin, Pebble Time, Samsung, Basis, Jawbone, Fitbit, and Apple. These devices can track heart rate, calories, sitting time, and much more. It is estimated that wearable technology is a $95 billion industry.
The trend in home exercise gyms has risen because of the COVID-19 pandemic and it is expected for this trend to continue. Home gyms allows participants to choose what equipment they invest in at various price points and can be used by individuals or as a family. However, for this trend to continue it is noted that home gym businesses will need to lower equipment costs to keep participants working out at home instead of a gym outside the home.
Likely because of the COVID-19 pandemic, outdoor activities such as group walks, group rides, or organized hiking groups are gaining in popularity. These can be short events, daylong events, or planned weeklong excursions. Typically, people meet at a local park, hiking area, or bike trail with a designated leader. This trend for health and fitness professionals to offer outdoor activities to clients began in 2010 and has been in the top 20 ever since 2012. This has become much more popular the past several months as agencies work to offer fitness programs outdoors that help to ensure physical distancing.
Strength training remains popular in all sectors of the health and fitness industry. Free weights, barbells, kettlebells, dumbbells, and medicine ball classes do not just incorporate equipment into another functional class or activity. Instructors begin by teaching the proper form and technique for each exercise and then progressively increase the resistance. New exercises are added periodically, starting with proper form and technique. Many younger clients of both community-based programs and commercial clubs train almost exclusively using weights. In today’s gyms, however, there are many others (men and women, young and old, and patients with stable chronic diseases) who use weight training to improve or maintain strength.
Another trend that has increased because of the COVID-19 pandemic is exercising for weight loss. This trend has been top 20 since the beginning of the survey, but peaked at number five in 2022, a rise from number sixteen in 2021. Participants are moving towards this trend because the pandemic caused perceived or real weight gain and diet programs generally recommend supplementing with exercise.
Personal training is a one-on-one workout with a trainer that begins with fitness testing and goal setting. The trainer then works with the client and prescribes workouts specific to their needs. The profession of personal training is becoming more accessible online, in clubs, in the home, and in worksites that have fitness facilities. Many fitness centers continued to offer personal training during the COVID-19 outbreak. Since this survey was first published in 2006, personal training has been ranked in the top 10.
HIIT involves short bursts of high-intensity exercise followed by a short period of rest or recovery and typically takes fewer than 30 minutes to perform (although it is not uncommon for these programs to be much longer in duration). HIIT has been a top five trend since 2014. Despite warnings by some fitness experts of the potential for increased injury using HIIT, this form of exercise is popular in fitness centers all over the world.
Body weight training uses minimal equipment, which makes it an inexpensive way to exercise effectively. Although most people think of body weight training as being limited to push-ups and pull-ups, it can be much more than that. This type of training first appears in the trends survey in 2013 at number three.
Previously this trend has been to “virtual online training” or “online training”, however this was changed in 2022 to specify what type of online classes are trending. COVID-19 forced closures of exercise programming in many spaces which resulted in an increase in online training for at
home exercise classes. This trend can be offered live or prerecorded to groups and individuals. Prerecorded sessions offer participants the chance to partake in these classes no matter what their schedule may be.
Health and Wellness Coaching
Health and wellness coaching bridges behavioral science by promoting a healthy lifestyle and programs to support that lifestyle. Typically, this coaching is one-on-one, and coaching consists of goal setting and providing support, guidance, and encouragement. The coach focuses on the specific needs and wants of the participant’s lifestyle and values.
Special events and festivals often act as essential place-making activities for residents, economic drivers, and urban brand builders. This phenomenon is described in Governing Magazine: “Municipal officials and entrepreneurs see the power of cultural festivals, innovationfocused business conferences and the like as a way to spur short-term tourism while shaping an image of the host city as a cool, dynamic location where companies and citizens in modern, creative industries can thrive” (2013).
According to the 2022 Event Trends Report by Eventbrite, the following trends are expected to impact event planners and community builders in the coming years:
Strength in Diverse Communities: The pandemic built a different source of community through virtual events. Virtual events enabled audiences to expand in terms of being able to include broader reach to different ages, ethnicities, geographic locations, rural communities, and those who are differently abled. Event organizers are also looking to diversify entertainers and presenters.
Go Green: The trend of hosting “green events” is a trend that is here to stay. Although the pandemic impacted responses around making events environmentally friendly a priority, with a return to in person events it will certainly make a turn around. Virtual events have had a major impact on the carbon footprint of events. In a 2021 Nature Communications study, they found that virtual events decreased those footprints by 94% and energy use was cut by 90%.
Optimism, Resiliency, and Creativity: Event organizers are still feeling some uncertainty around a resurgence in COVID-19 cases, however 75% of respondents indicated they are optimistic about future events. The pandemic has left organizers feeling more adaptable, innovative, and creative. Half of organizers around the globe indicated COVID-19 made their teams more resilient.
A Pew Research Center survey found that 73% of adults consider themselves lifelong learners. Do-it-yourself project classes and programs that focus on becoming a more “well-rounded”
person are popular. Phrases such as “how-to” can be added to the agency website’s search engine optimization as consumers now turn to the internet as their first source of information regarding how-to projects. Safeguarding online privacy is also a trending course.
Programs such as yoga, Pilates, tai chi, balance training, chair exercises, and others continue to be popular with older participants.
This is a program area for baby boomers who are soon to be retired and focuses on a broad range of programs to prepare people for transitions into retirement activities. Popular programs for 55+ market include fitness and wellness (specifically yoga, mindfulness, tai chi, relaxation, personal training, etc.), drawing and painting, photography, languages, writing, computer and technology, social media, cooking, mahjong, card games, volunteering, and what to do during retirement.
Participants are looking for more day trips that highlight unique local experiences or historical themes. For example, a focus on authentic food, guided night walks, bike tours, concentration on a specific artist’s work, and ghost walks are among the themes being sought out.
Improv classes are specifically targeting age groups with classes that promote creative endeavors. Workshops and groups help seniors play, laugh, and let loose while practicing mental stimulation, memory development, and flexibility.
The survey results indicated residents are seeking more opportunities to engage in performing arts, history, and museums. Agencies across the country use indoor and outdoor facilities for art, cultural, musical experiences. Parks and recreation professionals and artists partnering create a community atmosphere that bolsters creativity and accessibility while encouraging physical activity. The Centers for Disease Control and Prevention (CDC) recommends the following strategies for building these partnerships:
Join community-based groups that plan and develop projects designed to make an activity-friendly community.
Partner with community-based groups to increase the use of parks by adding design elements that reflect local cultural traditions.
Include creative place-making when developing a strategy for community development. Creative place-making integrates arts, culture, and design into public spaces to promote well-being and increase physical activity.
Create inclusive ways for community members to be involved with community development decision making.
The Connecticut Office of the Arts has several initiatives dedicated to supporting the arts across the state which is supported by various programs, grants, resources, and partners. Some of the partners they work with include The CT Arts Alliance, Cultural Alliance of Fairfield County, RiseUP, and several other regional groups including Greater Hartford Arts Council, Cultural Alliance of Western Connecticut, Arts Council of Greater New Haven, etc.
Municipal pools have shifted away from the traditional rectangle shape, and instead have shifted to facilities that include zero-depth entry, play structures that include multiple levels, spray features, small to medium slides, and separate play areas segmented by age/ability. Indoor warm water therapy pools continue to grow in popularity with the aging population, creating a shallow space for low-impact movement at a comfortable temperature enables programming options to multiply. “Endless” or current pools that are small and allow for “lowimpact, high-intensity movement” are becoming popular, as well.
The concept of water fitness is a huge trend in the fitness industry, with many new programs popping up such as aqua yoga, aqua Zumba, aqua spin, aqua step, and aqua boot camp. Whether recovering from an injury, looking for ease-of-movement exercise for diseases such as arthritis, or simply shaking up a fitness routine, all demographics are gravitating toward the water for fitness. Partnerships can be important for parks and recreation agencies, such as working with hospitals to accommodate cardiac patients and those living with arthritis or multiple sclerosis.
Spray parks (or spray grounds) are now a common replacement for aging swimming pools, particularly because it provides the community with an aquatic experience without the high cost of traditional pools. Spray parks do not require high levels of staffing, require only minimal maintenance, and offers the community a no-cost (or low-cost) alternative to a swimming pool. A spray park typically appeals to children ages 2 – 12 and can be a stand-alone facility in a community or incorporated inside a family aquatic center.
Each year, the Sports and Fitness Industry Association (SFIA) releases a Sports, Fitness, and Leisure Activities Topline Participation Report. The SFIA report indicates that water sports had the largest overall growth in participation among all seven sports categories.
Table 9 demonstrates the change in time from over the past five years (2016 to 2021) for waterrelated activities that are relevant to Norwalk from the 2022 report. The 1-year, 2-year, and 5-
year average annual growth (AAG) are charted in the tables to indicate the level of change for boardsailing/windsurfing, canoeing, jet skiing, kayaking, sailing, stand-up paddling, and water skiing.
Between 2020 and 2021, the water sports with the highest overall growth were boarding sailing/windsurfing (+9.9%), kayaking – sea/touring (+5.6%), and water skiing (+4.7%). The water sports that experienced the highest decreases in participation between 20202 and 2021 were kayaking – recreational (-14.6%), canoeing (-6.4%), and sailing (-3.6%).
Each year, the NRPA publishes an article about industry trends and predictions in Parks and Recreation Magazine. In the 2023 edition of the article, Top Trends in Parks and Recreation for 2023 (written by Richard Dolesh—former Vice President of Strategic Initiatives for NRPA), the trends identified for 2023 focused on technology, health and wellness, worker satisfaction, and recreation program trends. Below are a few highlights from Dolesh’s article:
Parks and recreation agencies will be able to reduce their carbon footprint through the electrification of business elements such as buildings, vehicles, and equipment. The switch to electronic power is healthier, cheaper, more efficient, and more environmentally friendly for our communities.
Five state park systems and one national park implemented programs that loan persons with disabilities access to off-road, tracked, and powered wheelchairs. This is just one of many ways parks and recreation agencies are looking to provide opportunities for inclusion.
Worker satisfaction is more important now than ever and should be a top goal for your organization’s culture. Employees who feel a sense of genuine care for their well-being from their employer are more engaged and productive.
The lack of childcare workers and lifeguards and the impact that has on parks and recreation agencies' recreation is expected to continue. The childcare workforce is one of the only occupations that has not rebounded from the COVID-19 pandemic.
Pickleball has exploded onto the recreation scene; however, the loud volume coming from pickleball courts leaves little to be desired for those living nearby.
Digital twin mapping is used to provide 3D models of the actual physical environment and is compatible with geographic information systems (GIS). The result of the two maps is a virtual image showing spatial relationships between objects, buildings, and elements of nature.
Anchor institutions, typically universities and hospitals, are nonprofit organizations that create strong bonds within their community. Parks and recreation agencies operate similarly and should be viewed as vital pieces of our communities.
Parks and recreation agencies across the nation relaxed the use and sale of alcohol at the parks, typically during special events. Recreational use of cannabis is now on the rise, with 21 states allowing recreational use, and may not be far behind the recreational use of alcohol in parks.
Single-use plastic utensils are easy to use in a park setting; however, some parks are looking for a more sustainable solution – edible utensils. Various companies now have items like edible straws, spoons, and forks that can help make agencies with food services more environmentally friendly.
The following recommendations summarize the opportunities to strengthen the Department’s performance. Following each action, a recommended timeframe is identified as one of the following: Short-Term (ST) for completion within the next 1-3 years; Medium (MT) for within next 4-6 years, and Long-Term (LT) for completion within 7-10 years.
Program Menu
1. Continue to diversify the Department’s core program areas beyond the current five; work to achieve more balance in the distribution across the core program area types.
Start laying the foundation for the addition of a nature-based program area. Explore partners and/or independent contractors to support program provision. (ST)
Start providing nature-based programs. Target at least one per season. (ST)
Increase the quantity of nature-based programs to three per season. (ST)
Generate a plan to expand youth sports programming. Consider non-traditional sports and martial arts. (MT)
Add one new youth sport offering each year (i.e., tae kwon do, ultimate frisbee, track & field, lacrosse). (MT)
Consider outdoor adventure programming as a new area. Explore partners to provide kayaking, camping, fishing, etc. (LT)
Introduce outdoor adventure programs. (LT)
2. In addition to increasing the number of core program areas, also increase variety of program types within each area, using the top PIR opportunities as a guide: nature enjoyment, fitness & wellness, special events/festivals, senior activities, performing arts, aquatics, history & museums, and water-related activities.
Create an adult walking club in parks. (ST)
As facility space becomes available, add fitness programs. (ST)
Create one new family special events, add one each year. (ST)
As facility space becomes available, add senior adult activities. (ST)
As facility space becomes available, add early childhood programs. (ST)
Partner with local museums to add historical programming. (ST)
Seek out partners to add youth swim lessons. (ST)
3. Develop and implement an annual program plan that identifies how the Department will serve age segments, recreation interests, and fulfill the community’s leisure needs in a more balanced manner.
Using the report as a starting point, compare the program menu to demographics annually. (ST)
Seasonally, challenge staff to add programs for teens, adults, and seniors. (ST)
Demonstrate annual program plan adjustments and modifications based on participation and program life cycle. (ST)
Conduct a community needs survey to gauge satisfaction and new recreational program needs. (MT)
Respond to community needs survey results by developing/adjusting program plan accordingly. (MT)
4. Focus on expanding recreation opportunities for specific markets, including adults and those with special needs.
At new special events, continue to survey adults regarding programming needs. (ST)
Hold adult programs at local small businesses, i.e. coffee shops, breweries, that combine the business’ expertise and a leisure experience. For example, wine tasting while painting. (ST)
Integrate at least one new adult program opportunity per season. (ST)
Seek out partners to provide programming to people with special needs. Establish cooperative agreements for collaborative service provision. (ST)
Develop an inclusion services plan for people who need special accommodations. This includes internal operations, advertising, and implementation of services. (MT)
Start providing inclusion services. (MT)
Begin developing and providing programs specifically for people with special needs. (MT)
1. Nurture the Department’s relationship with the school district, starting with the approval and implementation of the draft Joint Use Agreement (JUA). Establish more consistent communication and collaboration; renegotiate the parameters of the community’s school
use during out-of-school times. Monitor the JUA’s execution, meet to discuss what is/is not working, and modify if needed.
Approve the JUA (ST)
Schedule programming according to new JUA. (ST)
Meet quarterly to discuss the agreement’s implementation and opportunities for operational improvement. (ST)
Renegotiate the JUA as needed. (MT/LT)
2. Define the Department’s role as partner, provider, facilitator, and/or resource for recreation opportunities by completing a program planning matrix. Then, communicate the Department’s role both internally (with other City departments) and externally with residents.
Complete program planning matrix. (ST)
Establish internal processes and procedures to support new roles. (ST)
Generate any new partnership agreements (ST)
Develop and execute communication plan, internally then externally. (MT)
Revisit roles by updating the program planning matrix. (MT)
3. Collaborate with similar providers to identify ways to better-meet the community’s recreation needs based on PIR results. Focus first on exploring collaborative opportunities with existing area organizations providing nature programs and services, followed by continued collaboration with the Senior Center to increase senior program opportunities.
Establish a service providers networking group, with the Department serving as the leader and conduit. (ST)
Lead quarterly meetings with the service providers networking group. (ST)
Establish annual planning goals with the Senior Center. (ST)
Collaborate on one event per year with Senior Center. (ST)
Explore potential Senior Center facility-based cooperative agreements. (ST)
1. Improve field maintenance by developing field maintenance standards, providing additional funding for implementation of best practices, and additional staff to implement the standards.
Develop field maintenance standards. (ST)
Establish annual funding plan for field maintenance standards execution, including staff and supply needs. (ST)
Consider fees and charges review as means to support park and field maintenance. (ST)
Increase field maintenance staffing. (ST)
2. Increase indoor recreation space to support program offering expansion.
Finalize and execute 98 S. Main facility renovation plans. (ST)
Open and staff 98 S. Main facility. (ST)
Develop funding plan for future indoor spaces. (ST)
Generate concept plan for future Taylor Farms Park facility to support funding plan needs. (MT)
Design future Taylor Farms Park facility. (LT)
3. Explore additional partnerships, lease agreements, and/or acquisition as a means to achieve access, in both quantity and variety.
Analyze three non-traditional recreation program spaces for viability. (ST)
Consider lease agreements, repurposing existing community spaces. (ST)
Identify five potential facility partners and engage in visioning discussions. (MT)
Conduct annual review of real estate opportunities. (MT)
4. Current plans for the new Norwalk High School include construction of a new indoor aquatic facilities with a separate public entrance point which will allow for better programming opportunities. If the new pool, is not developed, the Department should lead efforts to plan to meet the community’s indoor aquatic needs elsewhere. This could include collaborating with similar providers, securing funding through alternative revenue sources (i.e., grants, referendum, corporate sponsorships), and/or public-private partnership.
Evaluate potential aquatic facility solutions with similar providers. (ST)
Review alternative revenue source options annually. (ST)
1. Increase staffing to support program development and growth.
Add part-time positions that will enhance marketing and communications and programmatic offerings. (ST)
Increase programming staff to support program area growth. (ST)
Increase staff support only as indoor programming space is acquired. (ST)
Shift part time positions to full time. (MT)
2. Develop a seasonal program guide to more comprehensively communicate the participation opportunities.
Retain per diem or part time design support. (ST)
Develop seasonal program guide production process. (ST)
Establish advertising parameters to offset production costs. (ST)
Determine delivery process (electronic and/or paper) and any corresponding fees, if desired. (ST)
Begin seasonal production and distribution process. (ST)
Aquatics
Camps
Cultural Youth Sports
New [Nature]
New [Fitness & Wellness]
New [Aquatics]
New [other]
New [other] Partner
develop unpaved hiking trail loop with benches and interpretative signage; provide ADA parking spaces and ADA route to spectator seating areas; provide bike racks and


