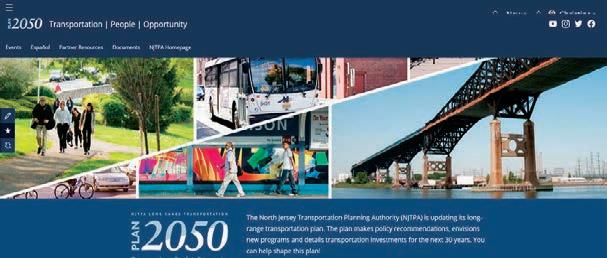
NJTPA Plan 2050: Transportation. People. Opportunity.
u Transportation
u People
u Opportunity
This publication is financed by the Federal Highway Administration and Federal Transit Administration of the U.S. Department of Transportation. The NJTPA is solely responsible for its contents.
NJTPA’s host agency is the New Jersey Institute of Technology.
This plan was prepared by NJTPA Staff, under the direction of the NJTPA Board of Trustees. Assistance was provided by AECOM USA, Inc.; Fitzgerald & Halliday, Inc.; McAndrew Company; Rutgers University—Voorhees Transportation Center; Urbanomics; and WSP Parsons-Brinckerhof.
Foreword from the NJTPA Chair and Executive Director
WE ARE PROUD TO PRESENT Plan 2050: Transportation. People. Opportunity. approved by the NJTPA Board on September 13, 2021. It sets out a vision for the future development of our region’s transportation system, drawing important lessons from the life-altering pandemic that is reshaping many aspects of society and transportation. It responds to the need for greater attention to equity, the environment, economic progress and sustainability, among other priorities.
As this document was being finalized for printing and publishing in fall 2021, a new federal surface transportation law was enacted, the Infrastructure Investment and Jobs Act. The Act provides crucial support for addressing the needs and issues identified in this plan and implementing many of the policies and projects it identifies, including hundreds of projects in the project index that will be funded over the next decade or more.
The NJTPA, together with its partner agencies and subregions, will work to leverage new resources and fulfill new national mandates and priorities in the federal law. All the while, we will be guided by this plan and will continue to reach out to the public in the region for input and direction.
Plan 2050 provides a solid foundation for long range transportation planning and investments on behalf of the residents of the North Jersey region. We thank the thousands who contributed to shaping this plan during these extraordinary times, whether through participation in surveys, virtual forums or submission of comments. We welcome your continued involvement as we implement Plan 2050.
Kathryn A. DeFillippo
Mary D. Ameen NJTPA Chair NJTPA Executive Director
From left: NJTPA Chair and Morris County Commissioner
Kathryn A. DeFillippo and NJTPA Executive Director
Mary D. Ameen
Appendices
Available at njtpa.org/plan2050
APPENDIX A: Background Papers Active Transportation in the NJTPA Region Climate Change and Transportation The COVID-19 Pandemic and North Jersey Freight Transportation Technology
APPENDIX B: System Performance
APPENDIX C: Regional Capital Investment Strategy
APPENDIX D: Public Outreach
APPENDIX E: Demographic Forecasts
APPENDIX F: Congestion Management Process
APPENDIX G: Transportation Demand Management Plan
APPENDIX H: Air Quality Conformity Determination
APPENDIX I: Local Concept Development
APPENDIX J: Administrative Modifications to Plan 2050
APPENDIX K: Resilience Improvement Plan
1
Introduction
TRANSPORTATION. PEOPLE. OPPORTUNITY.
These themes are the focus of this plan and the work of the NJTPA. They signify not only the goal of investing wisely to improve the roads, rails and other infrastructure, but to shape these investments to meet the needs of transportation users and support a thriving, sustainable regional economy for the benefit of all. ■ Those themes have deep roots in the work of the NJTPA in its three-decades-long history as the region’s Metropolitan Planning Organization (MPO). But, today, emerging from the tumultuous and life-altering events of 2020-2021— pandemic, social isolation, racial reckoning and environmental threats —the themes take on new and different meanings and prompt us to explore new priorities for the future of transportation. ■ This plan inaugurates those efforts, though many uncertainties remain about the long-term impacts of recent events. At the same time, this plan is one of
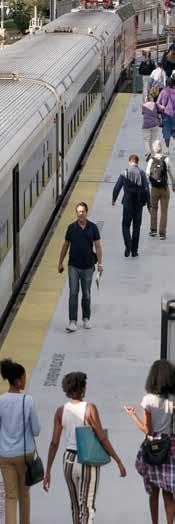
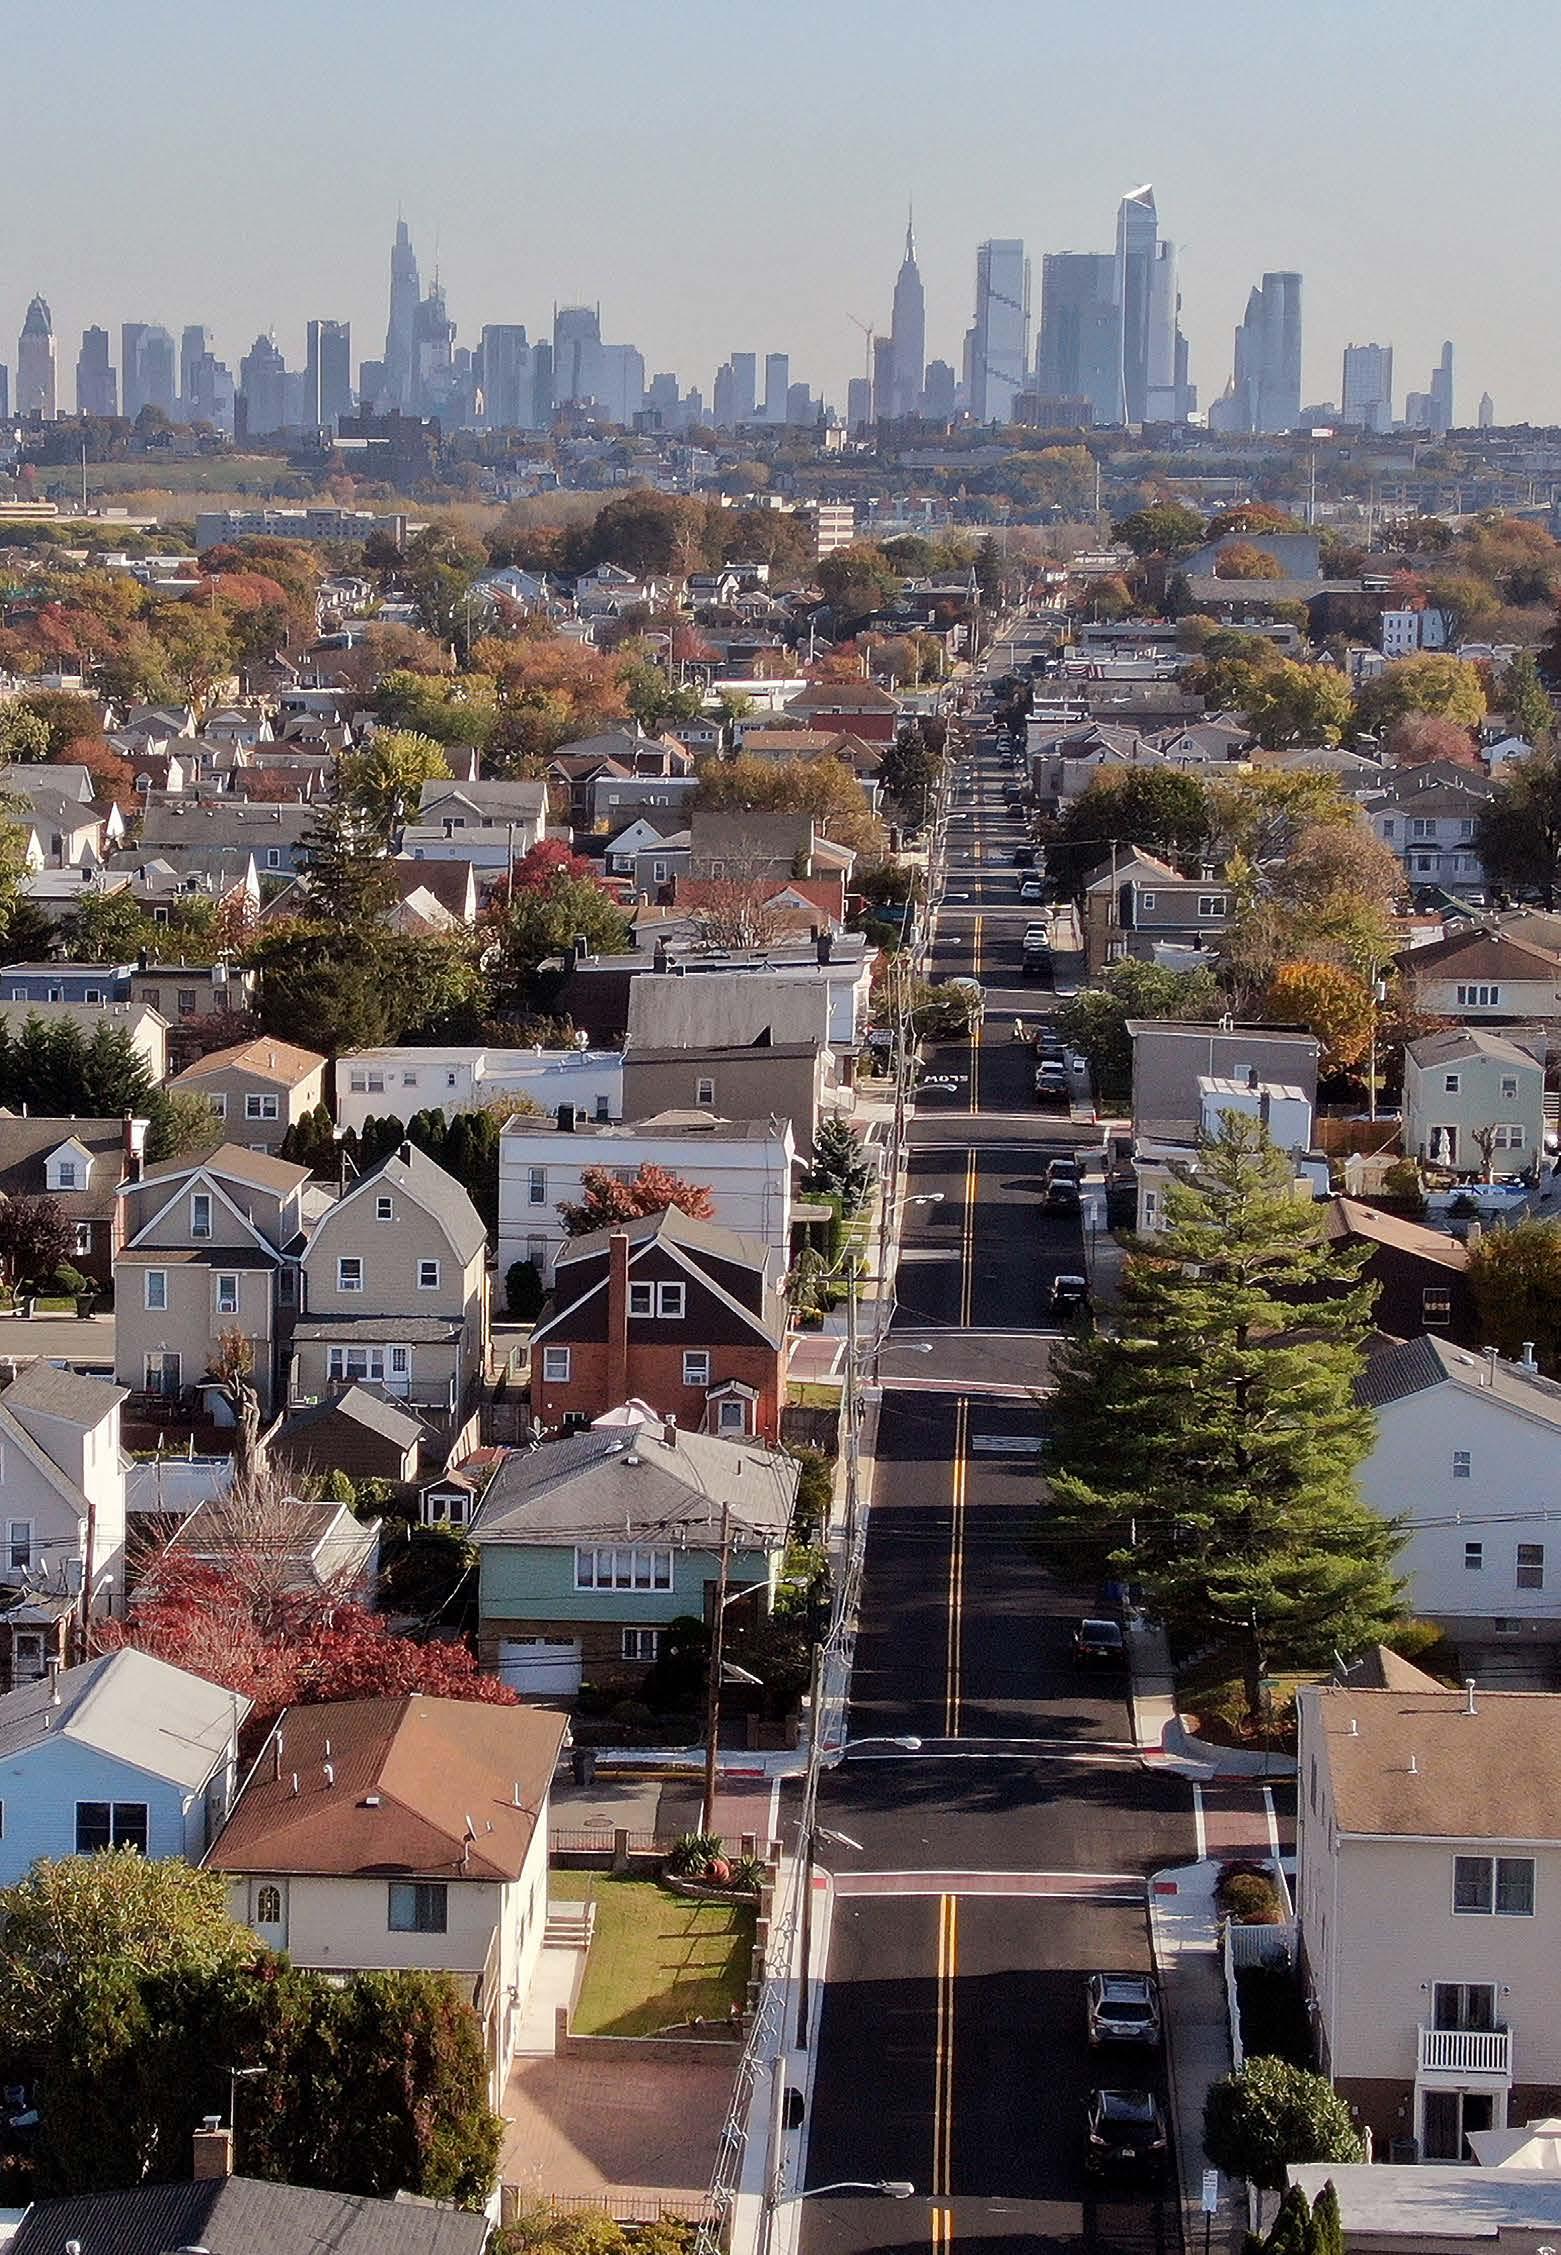
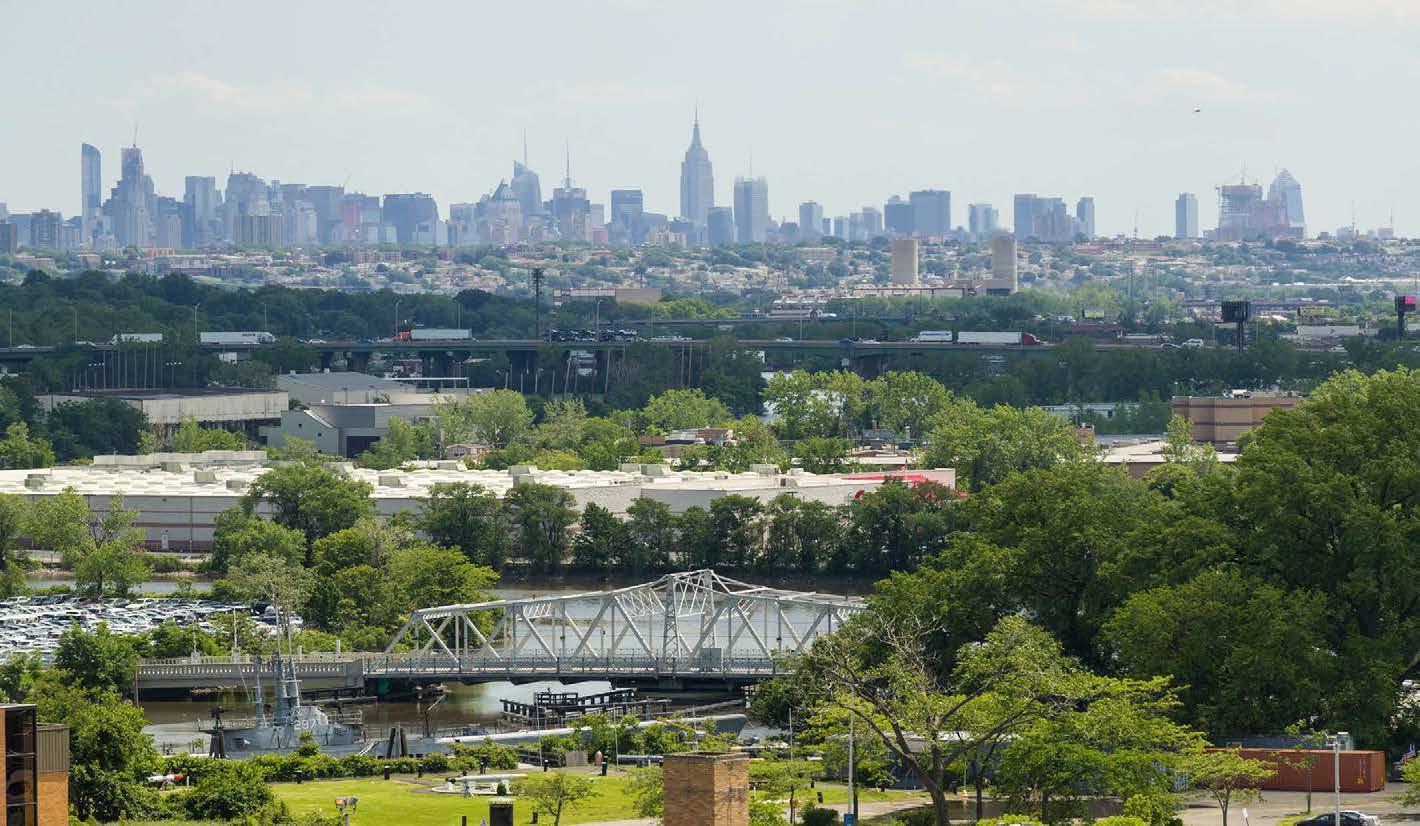
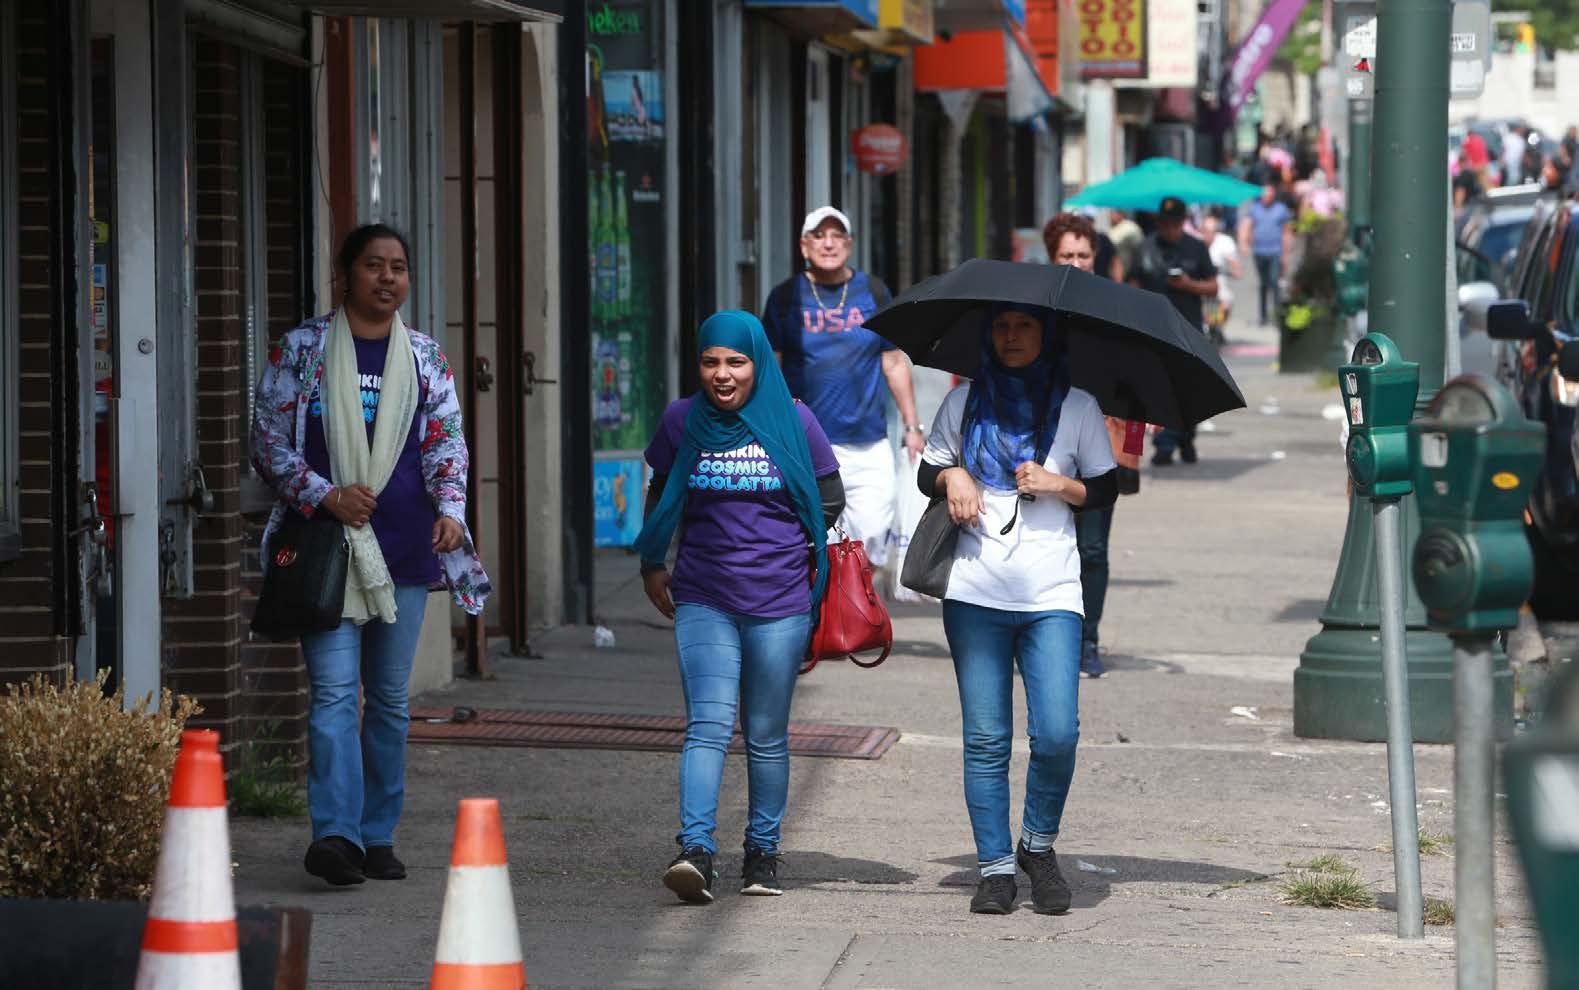
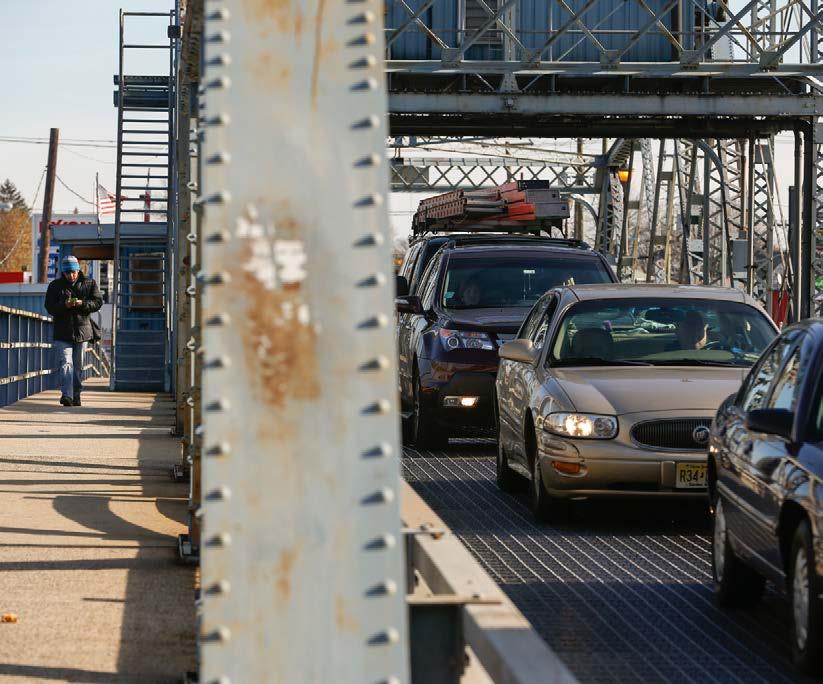
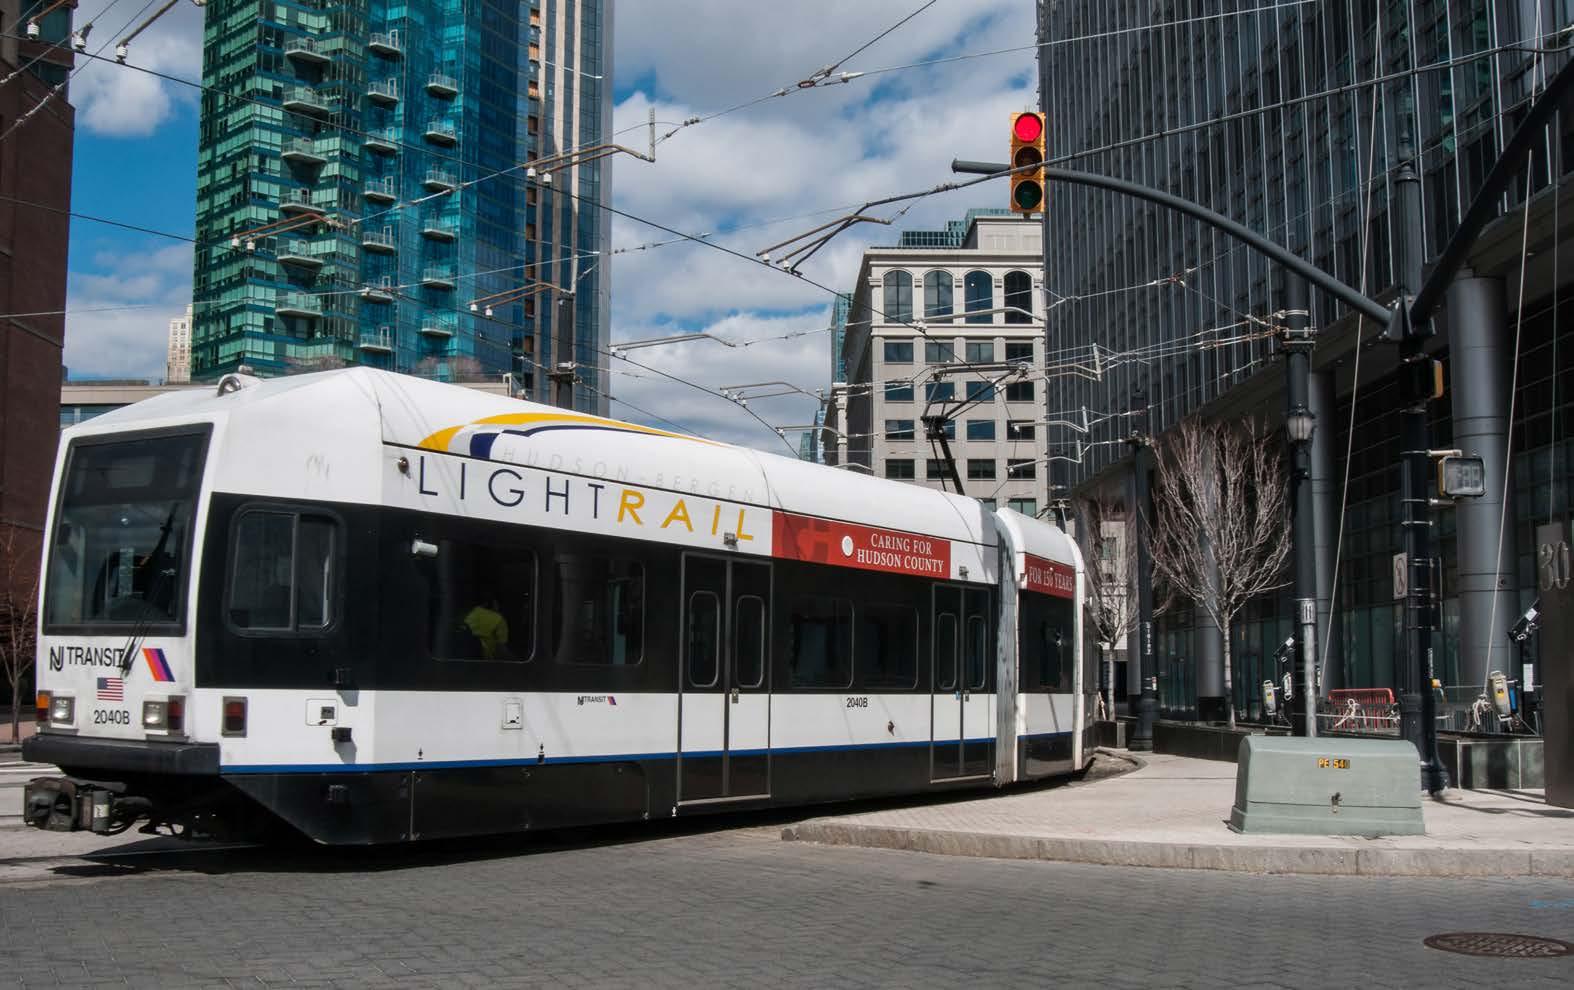
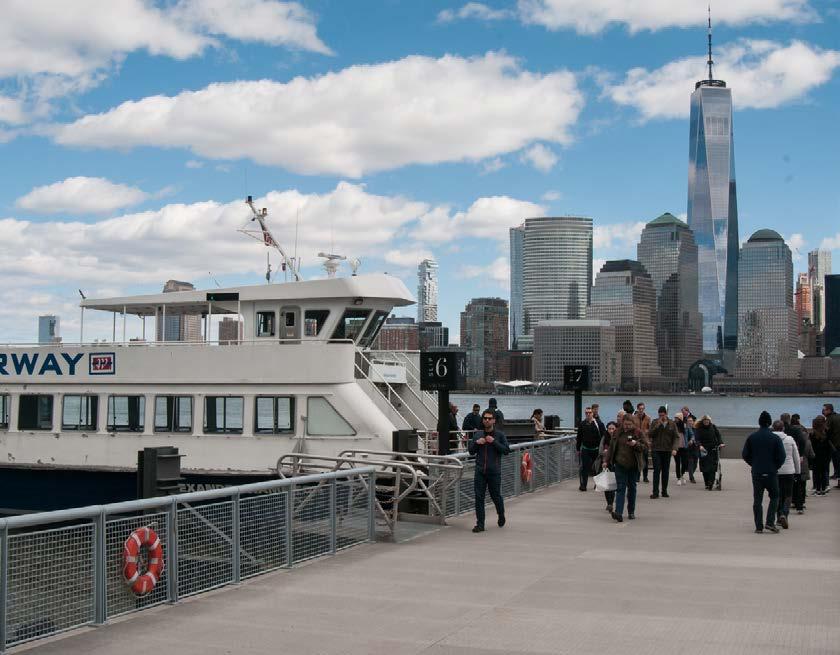
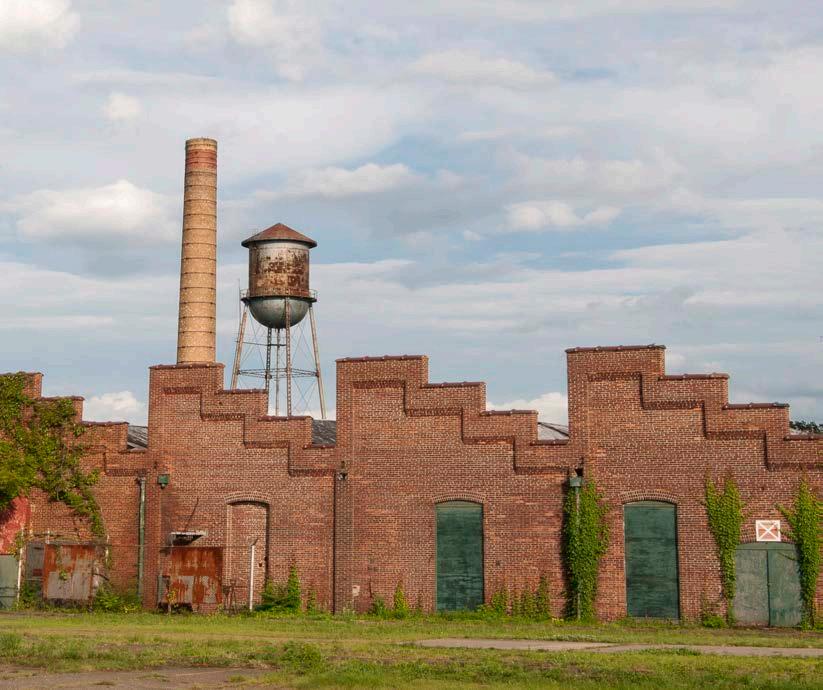
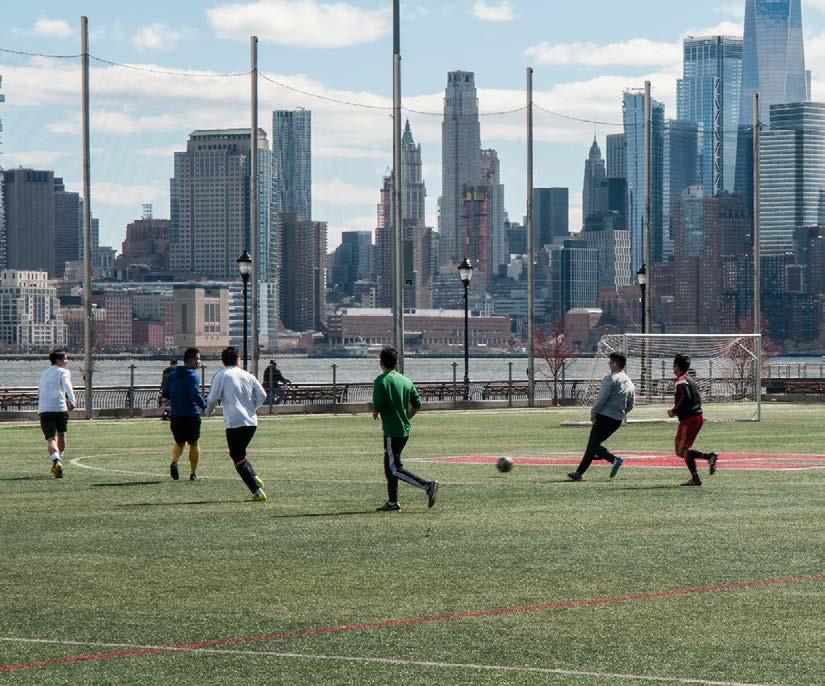
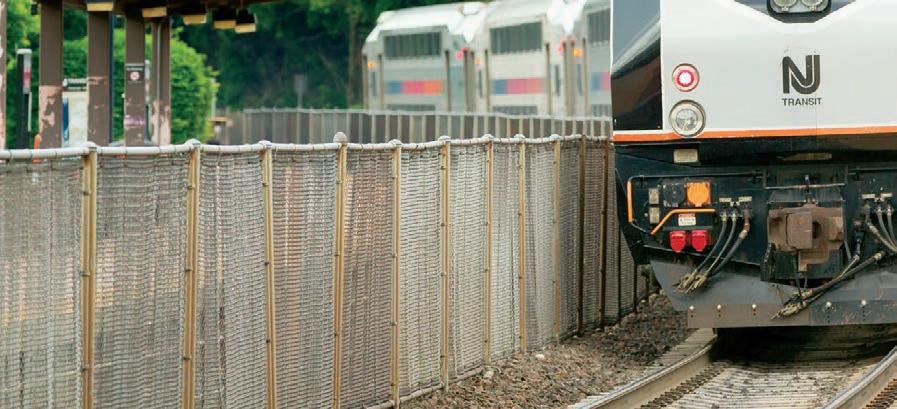
Secaucus, Hudson County ▶
continuity, carrying out NJTPA’s responsibilities and mandates for ensuring the safe and efficient functioning of the extensive transportation system serving North Jersey which forms the foundation for the regional economy and quality of life.
Policies and investments in this plan will set the trajectory for future development of the region and its transportation system—stretching out to this plan’s horizon of 2050.
Transportation. People. Opportunity.
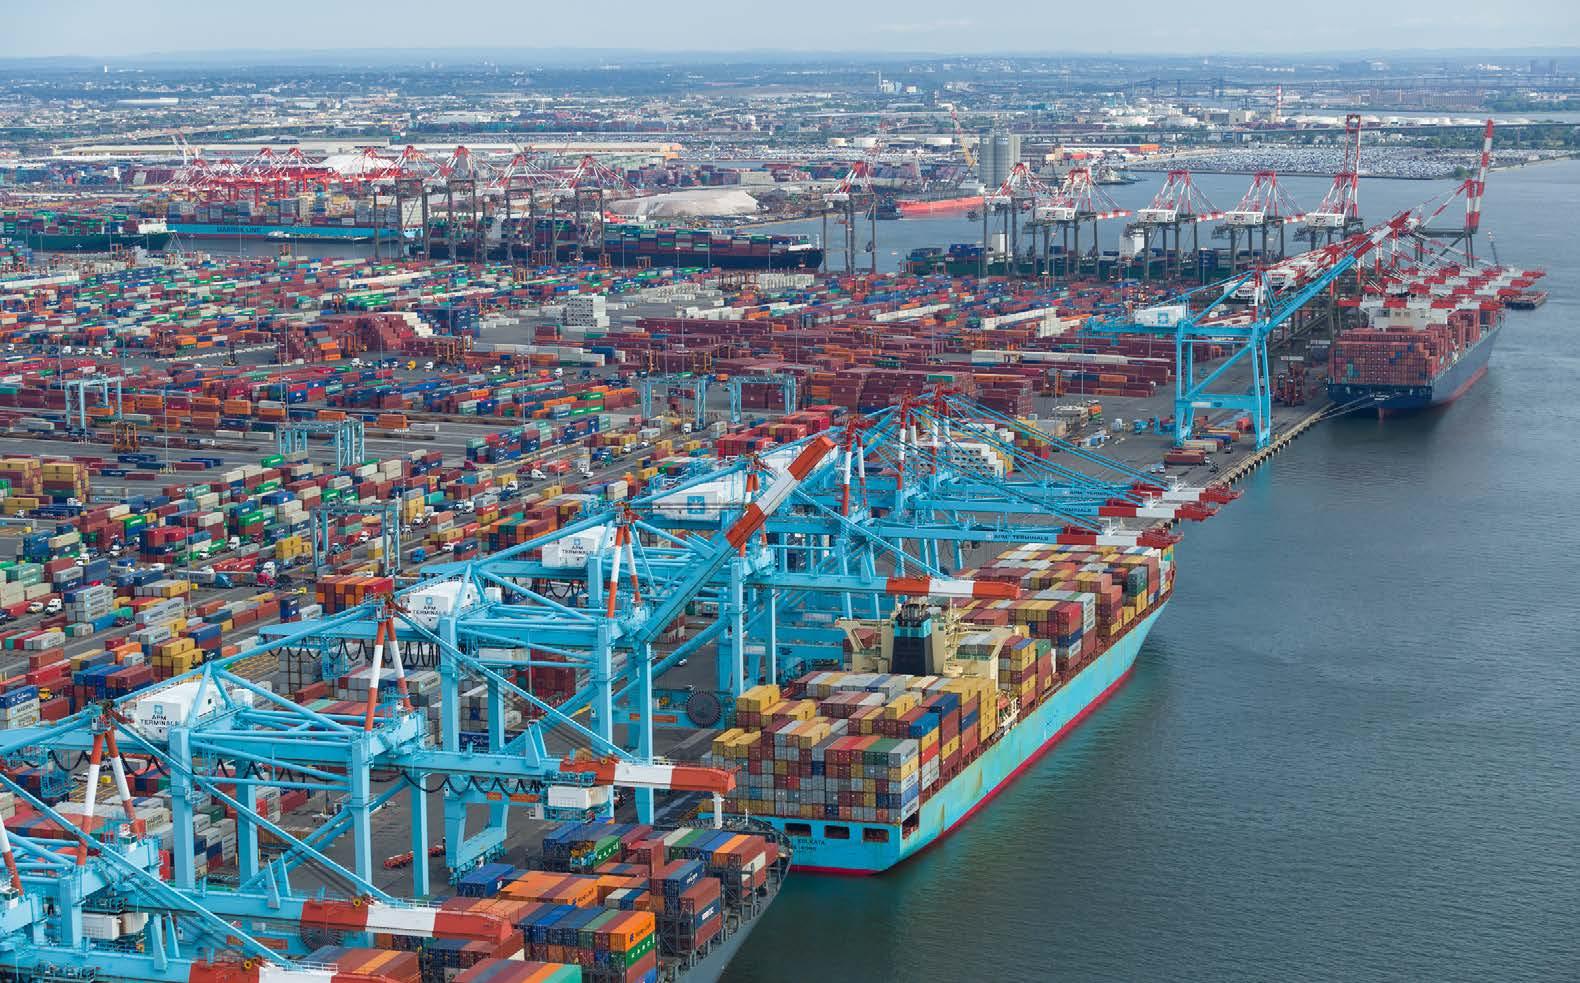
North Jersey’s multimodal transportation network is a vital economic asset. In many ways, it is a defining feature of our region, which is home to the largest marine port on the east coast; a major international airport; one of the nation’s busiest roads (the New Jersey Turnpike) and rail lines (the Northeast Corridor); the nation’s third largest mass transit network; and freight rail yards that are the end point of transcontinental supply chains; and more.
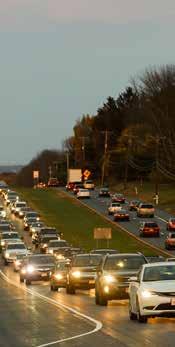
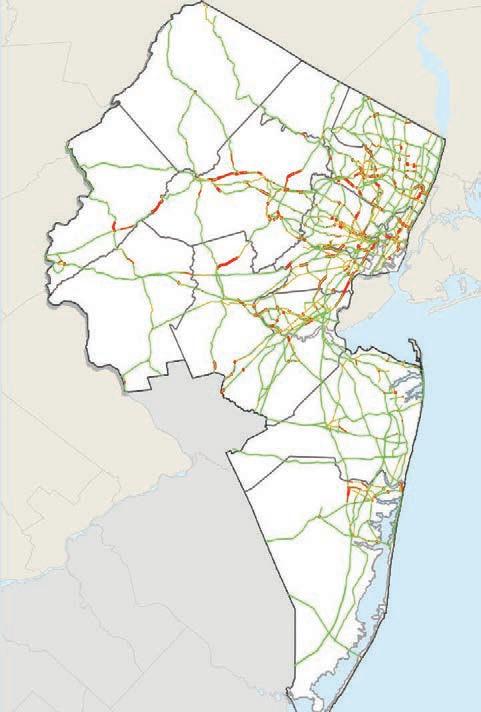
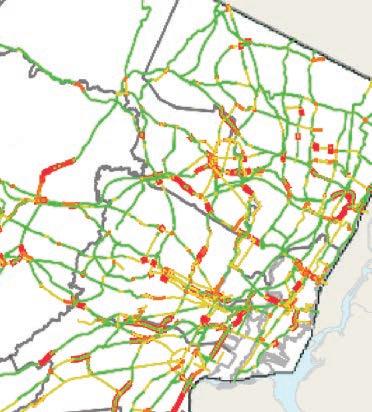
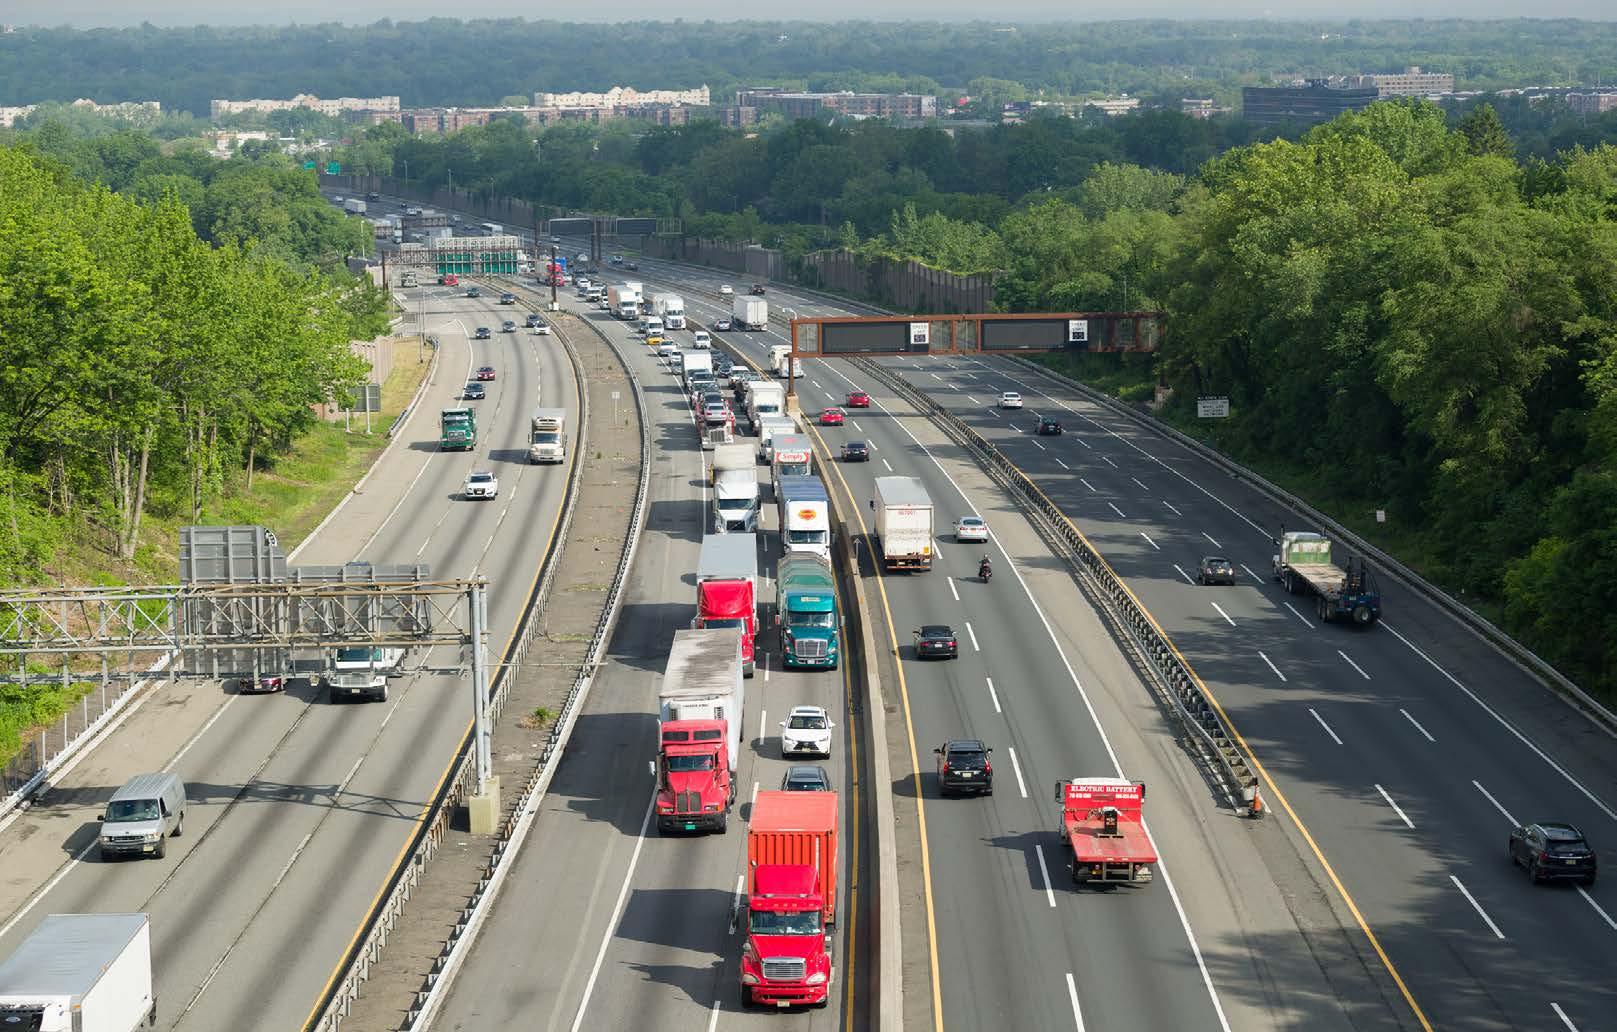
In recent years, the daily onslaught of cars, trucks and buses travelling the road network has resulted in severe congestion in some locations, hampering commerce and commuting, and causing growing
safety and environmental concerns. While the mass transit system offers a convenient alternative for many trips, constrained funding has left it struggling to meet demand. All aspects of the transportation system are hampered by aging infrastructure. And not all segments of the population share equally in the benefits of transportation access.
These problems have demanded attention and investment—$2 billion or more annually in recent years—and this plan discusses much more that needs to be done. Still, judging by transportation performance in recent years, by-and-large the system has worked well in its essential functions, underpinning the region’s dynamic economy and supporting the lives and livelihoods of the region’s residents. The transportation system makes possible future growth and progress—the “opportunity” that is a central theme of this plan.
Yet the pandemic and other events, as noted, have presented challenges that require changes in how the transportation system is planned, managed and financed. Some of these changes can be made immediately, while others may take years to fully address. Among the new realities:
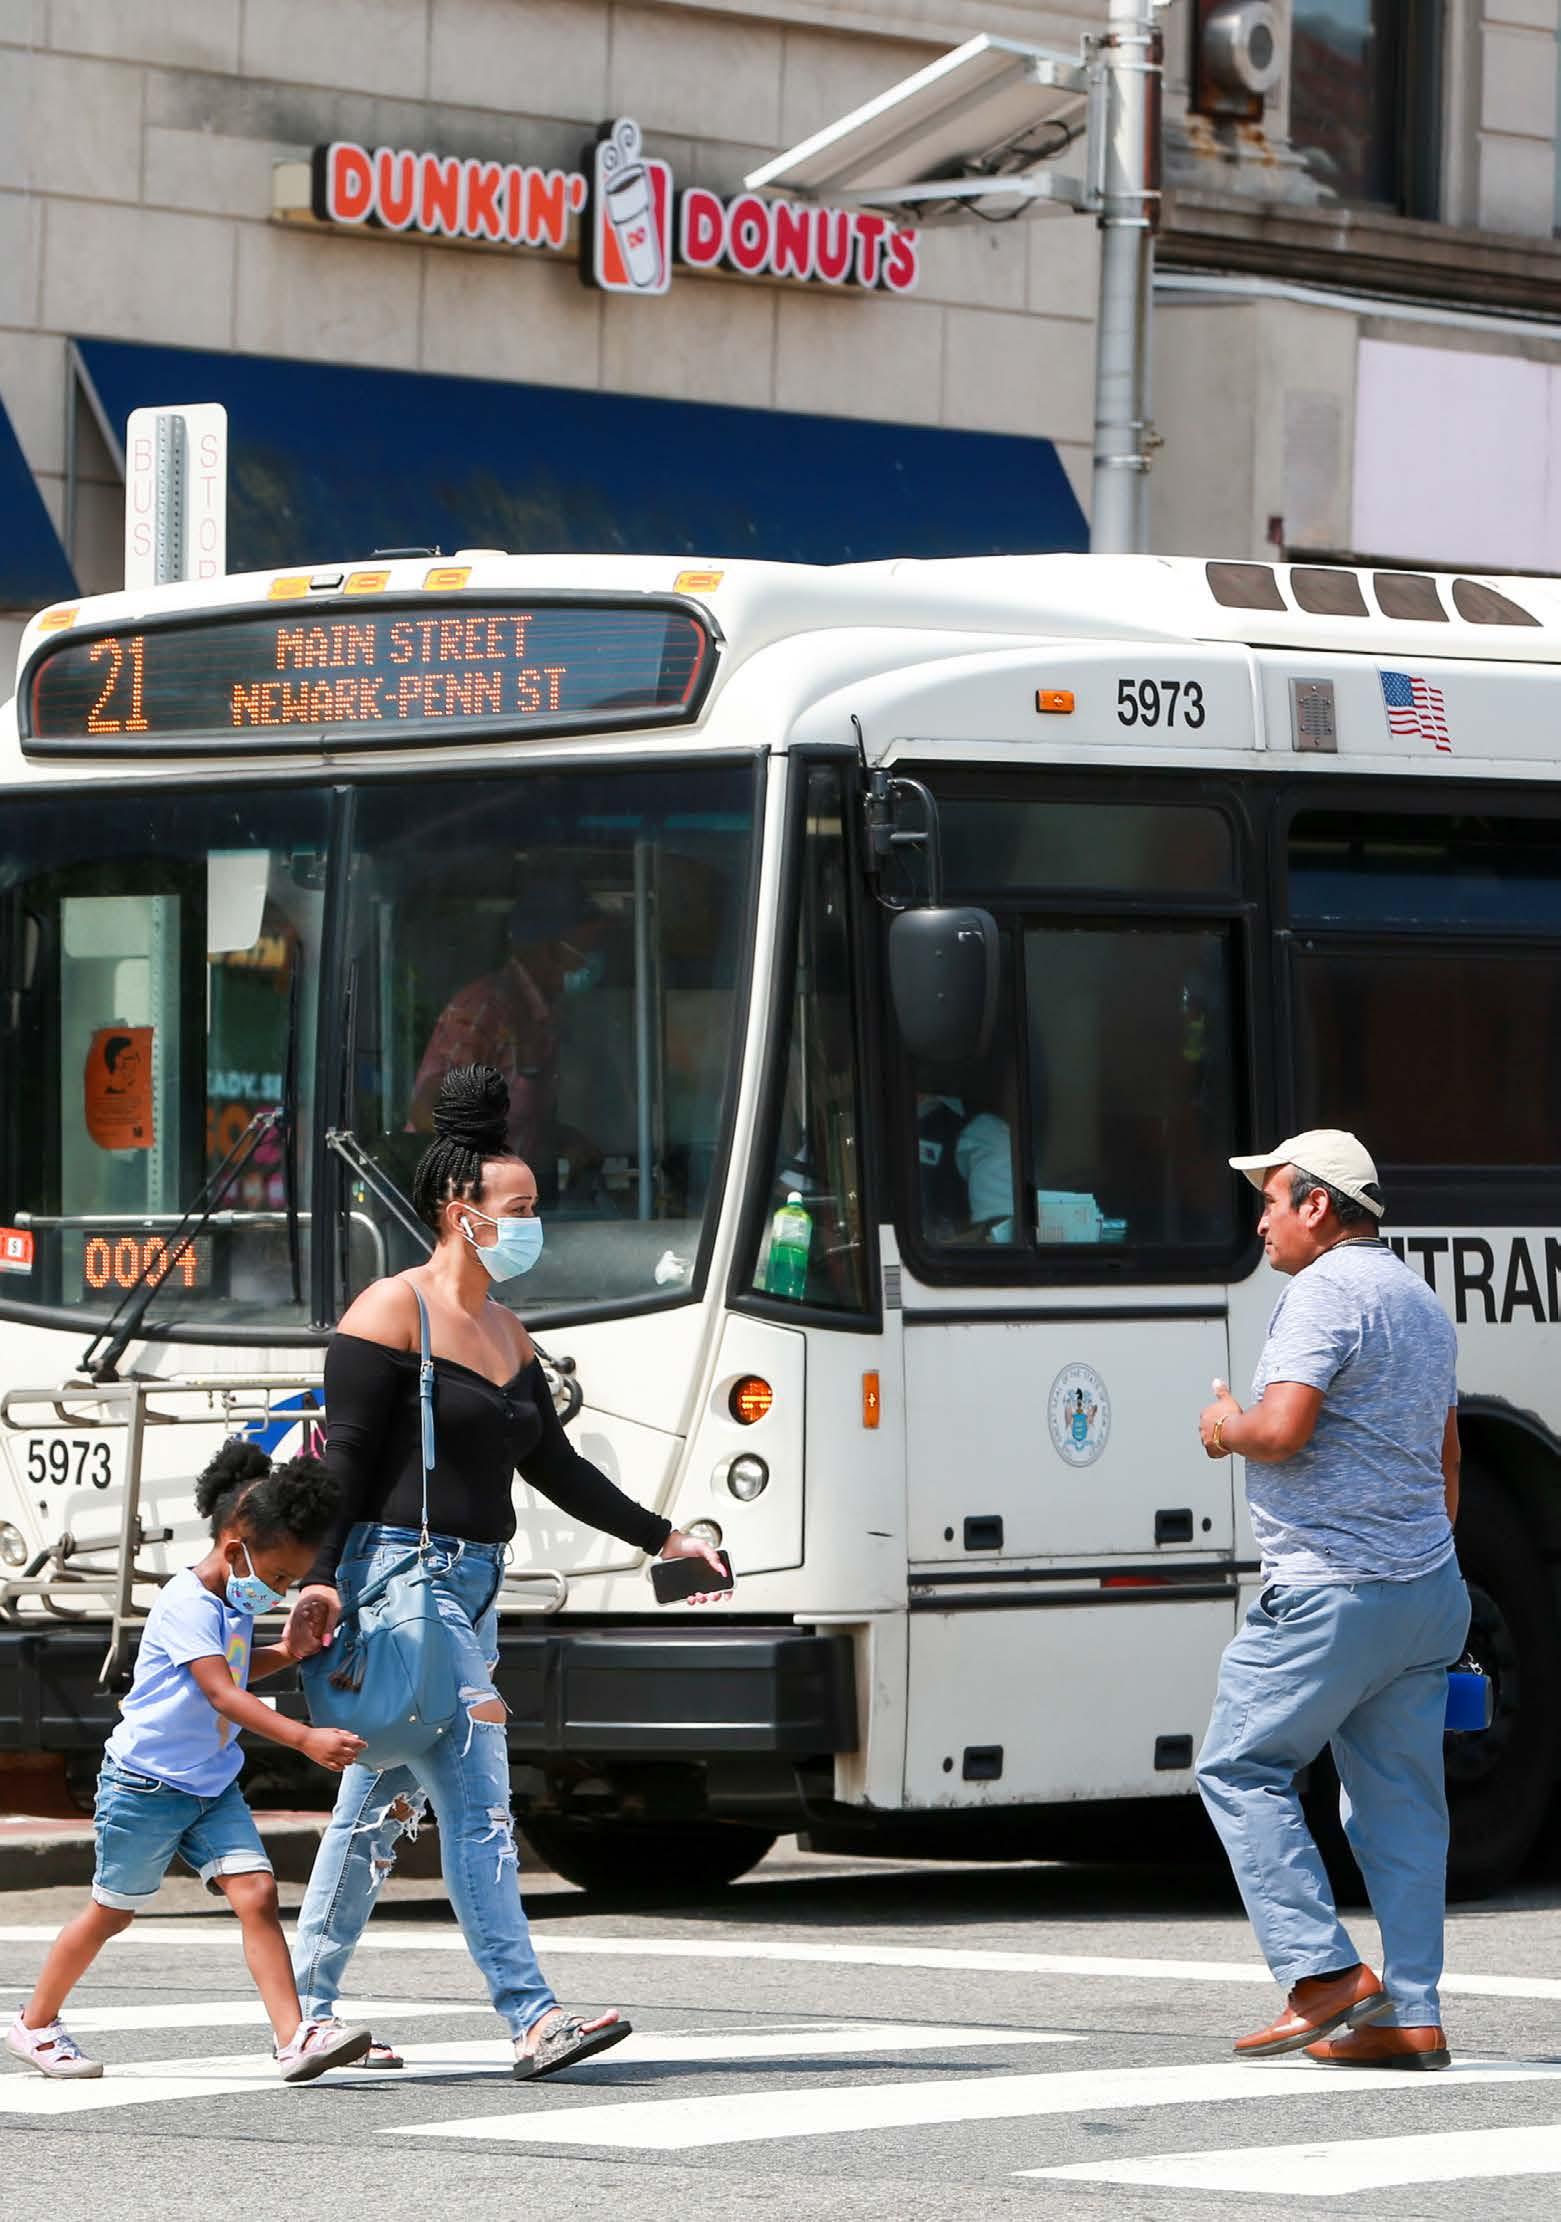
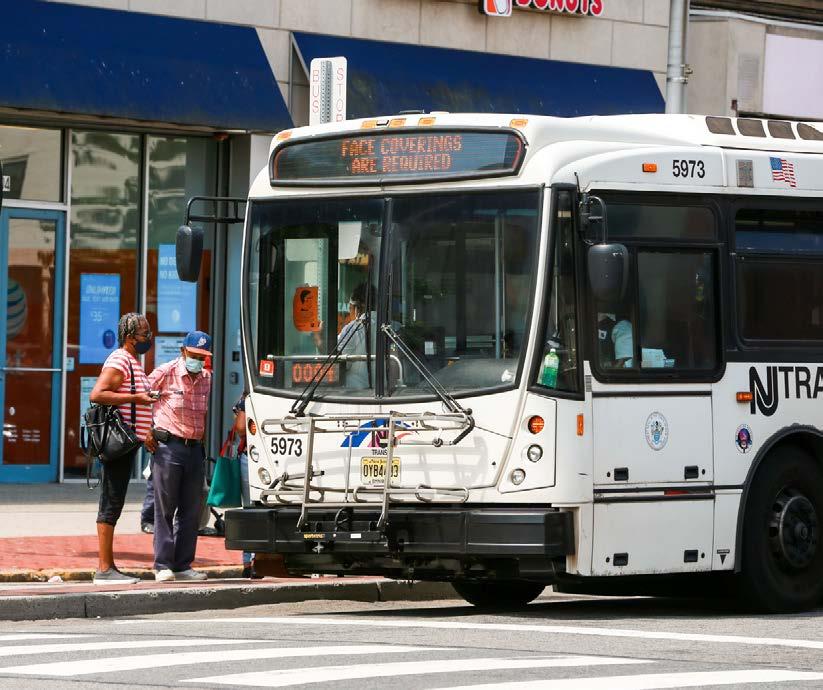
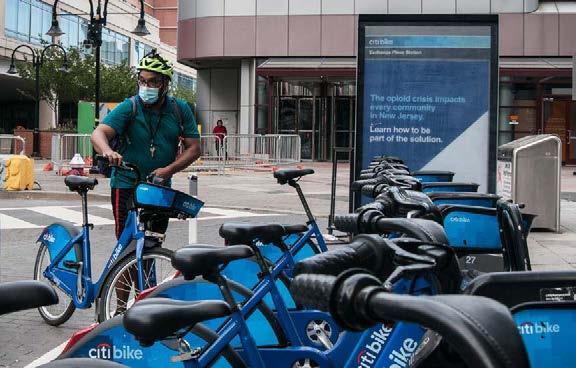
¡ The pandemic has raised public health to a top concern, prompting new public health protocols
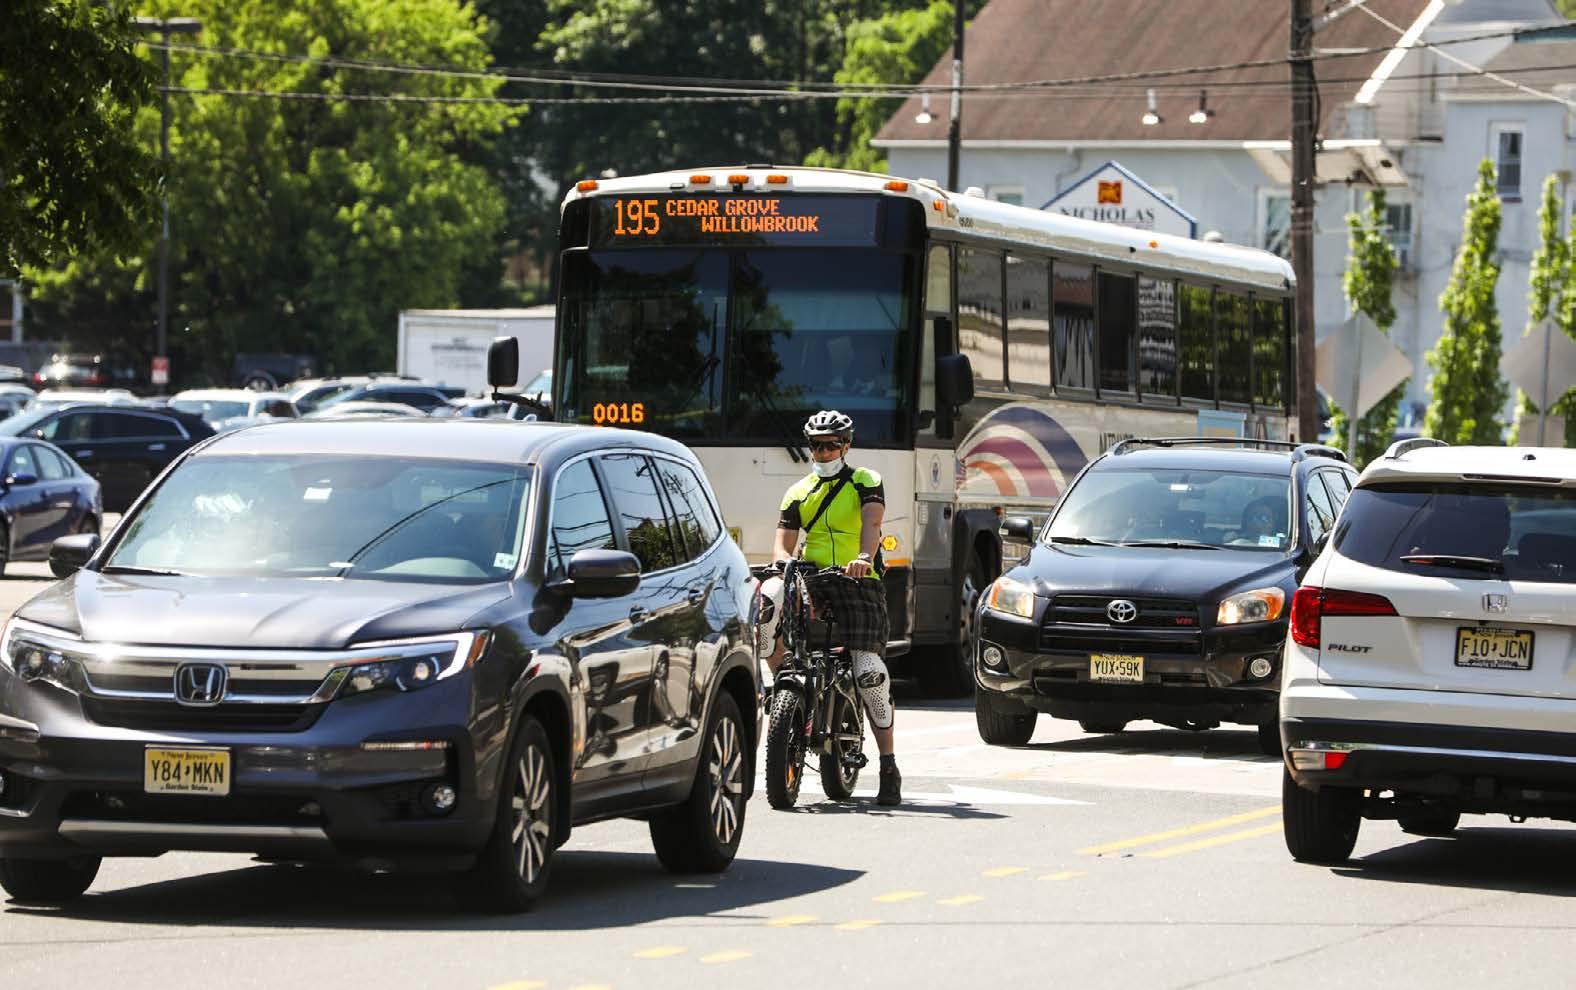
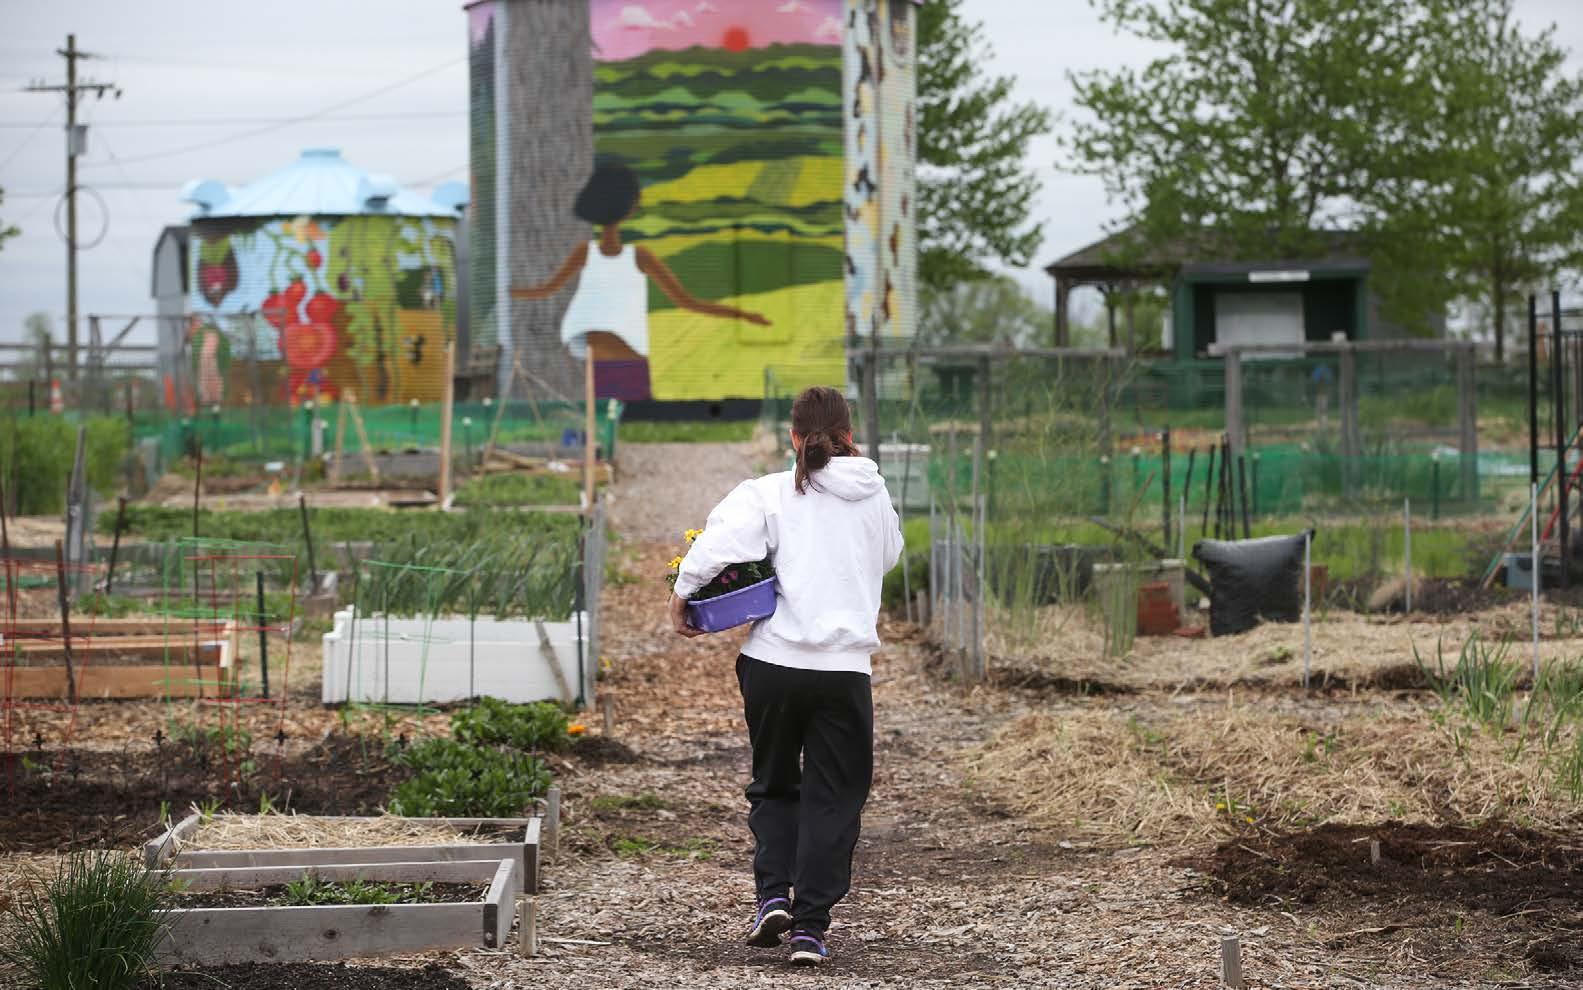
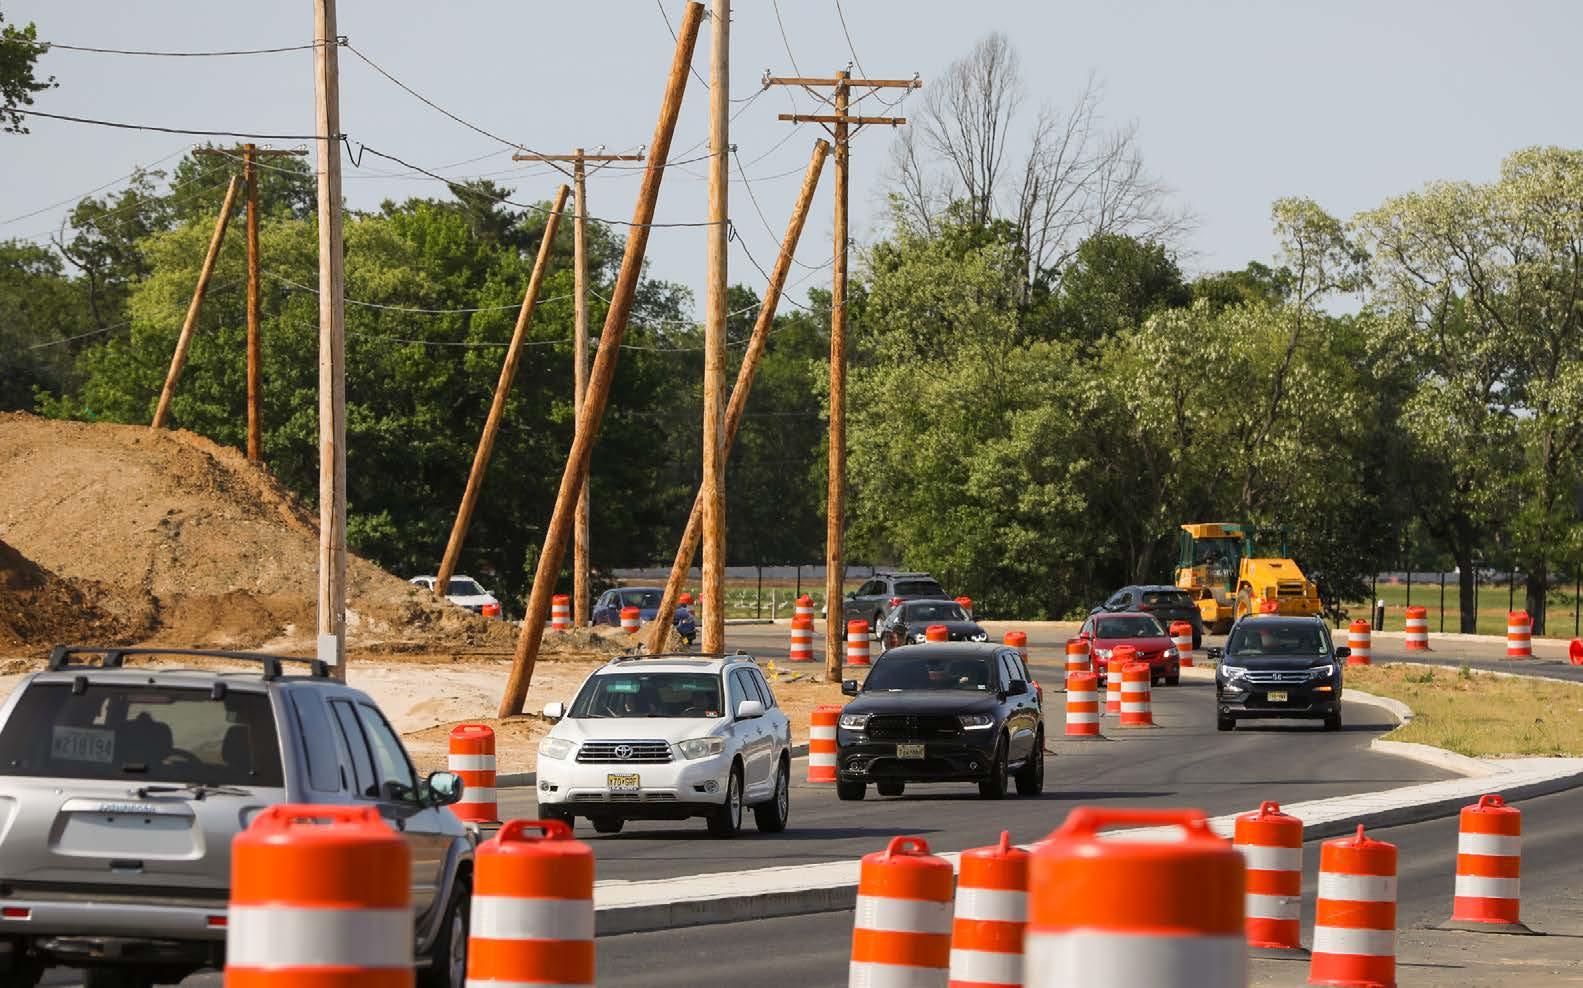
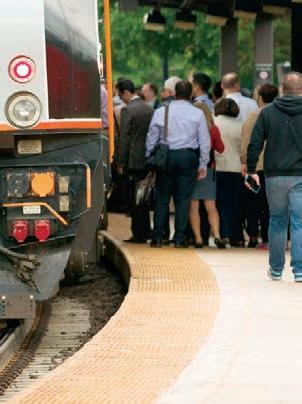
Cedar Grove, Essex County
for transit systems and requiring new designs and standards for workplaces.
¡ Some employers have come to rely on remote work arrangements, resulting in fewer commuters, which has reduced revenues, particularly for transit.
¡ New recognition has been given to addressing the needs of essential workers—many of whom work with low pay and inadequate benefits.
¡ The impacts of inequality and racial discrimination have gained new national attention, with minority and low-income families suffering disproportionately from both the virus and the economic downturn, and protests nationwide demanding action on racial injustice and institutional discrimination.
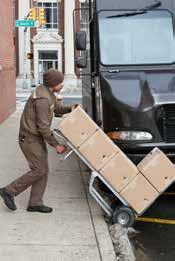
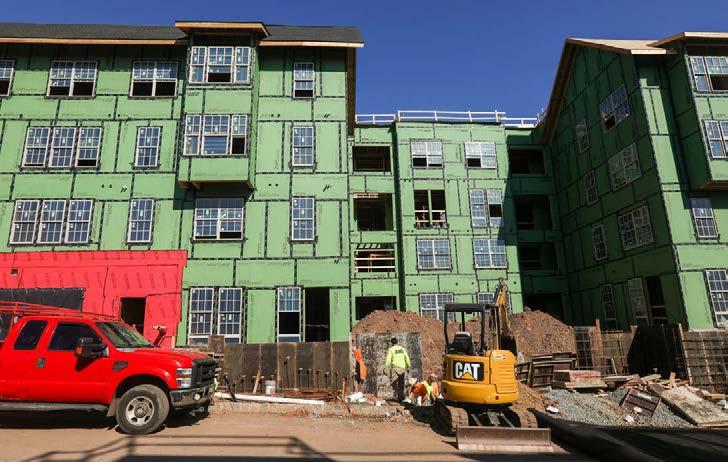
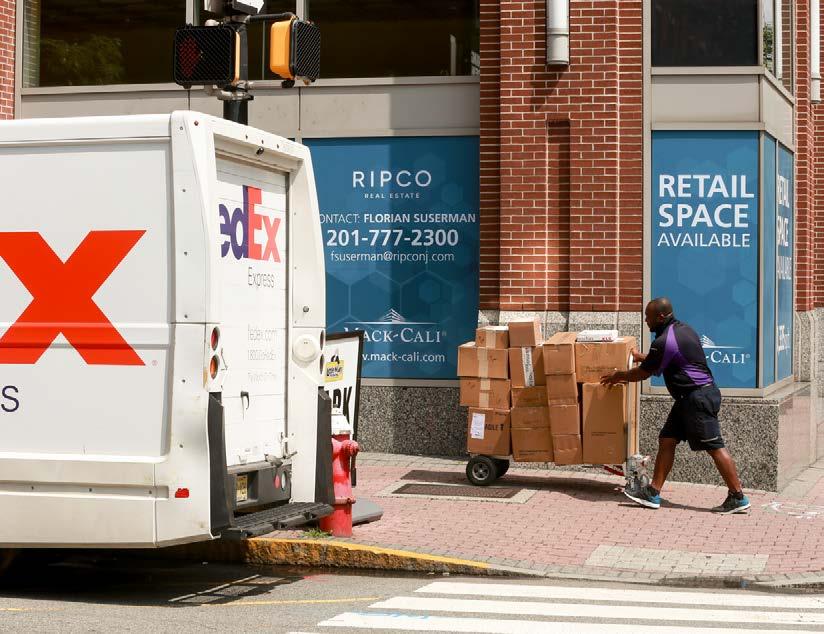
¡ The pandemic greatly increased e-commerce, adding delivery traffic to local roads, challenging freight logistics and altering industrial real estate markets.
¡ The growing impacts of climate change have added urgency to efforts to reduce greenhouse gas emissions, particularly the large share the transportation sector contributes.
Along with these and other complex challenges, there have been some decidedly hopeful developments, relevant to this plan’s themes:
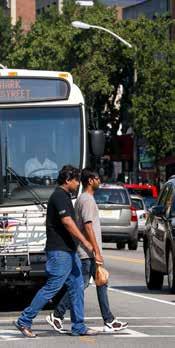
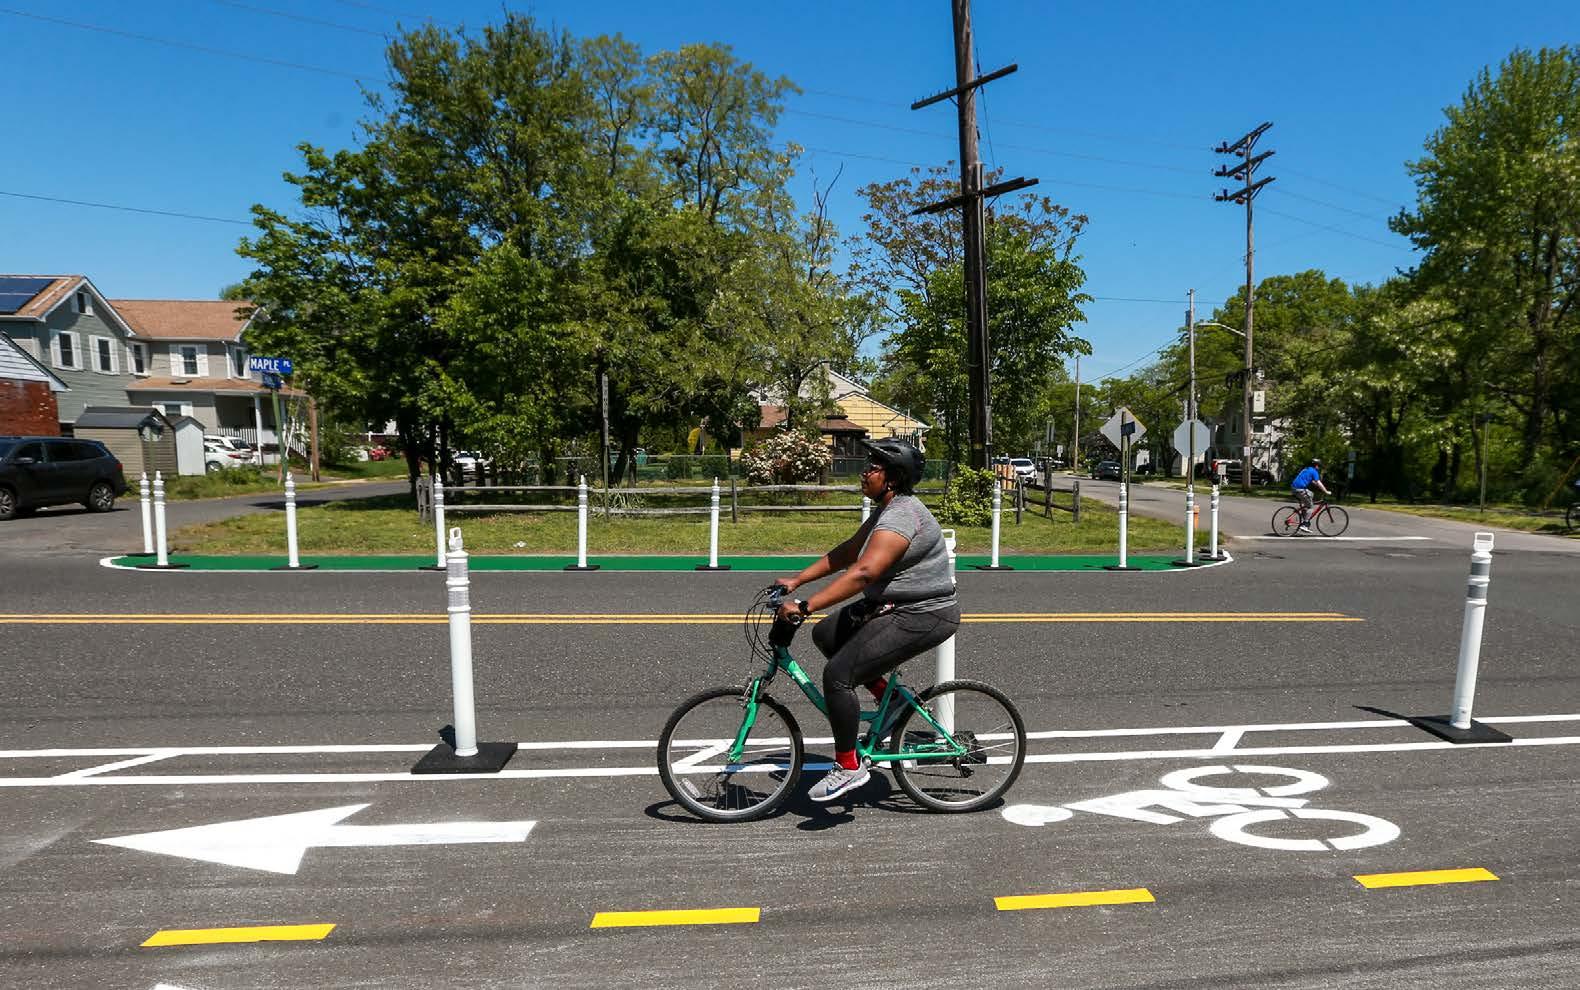
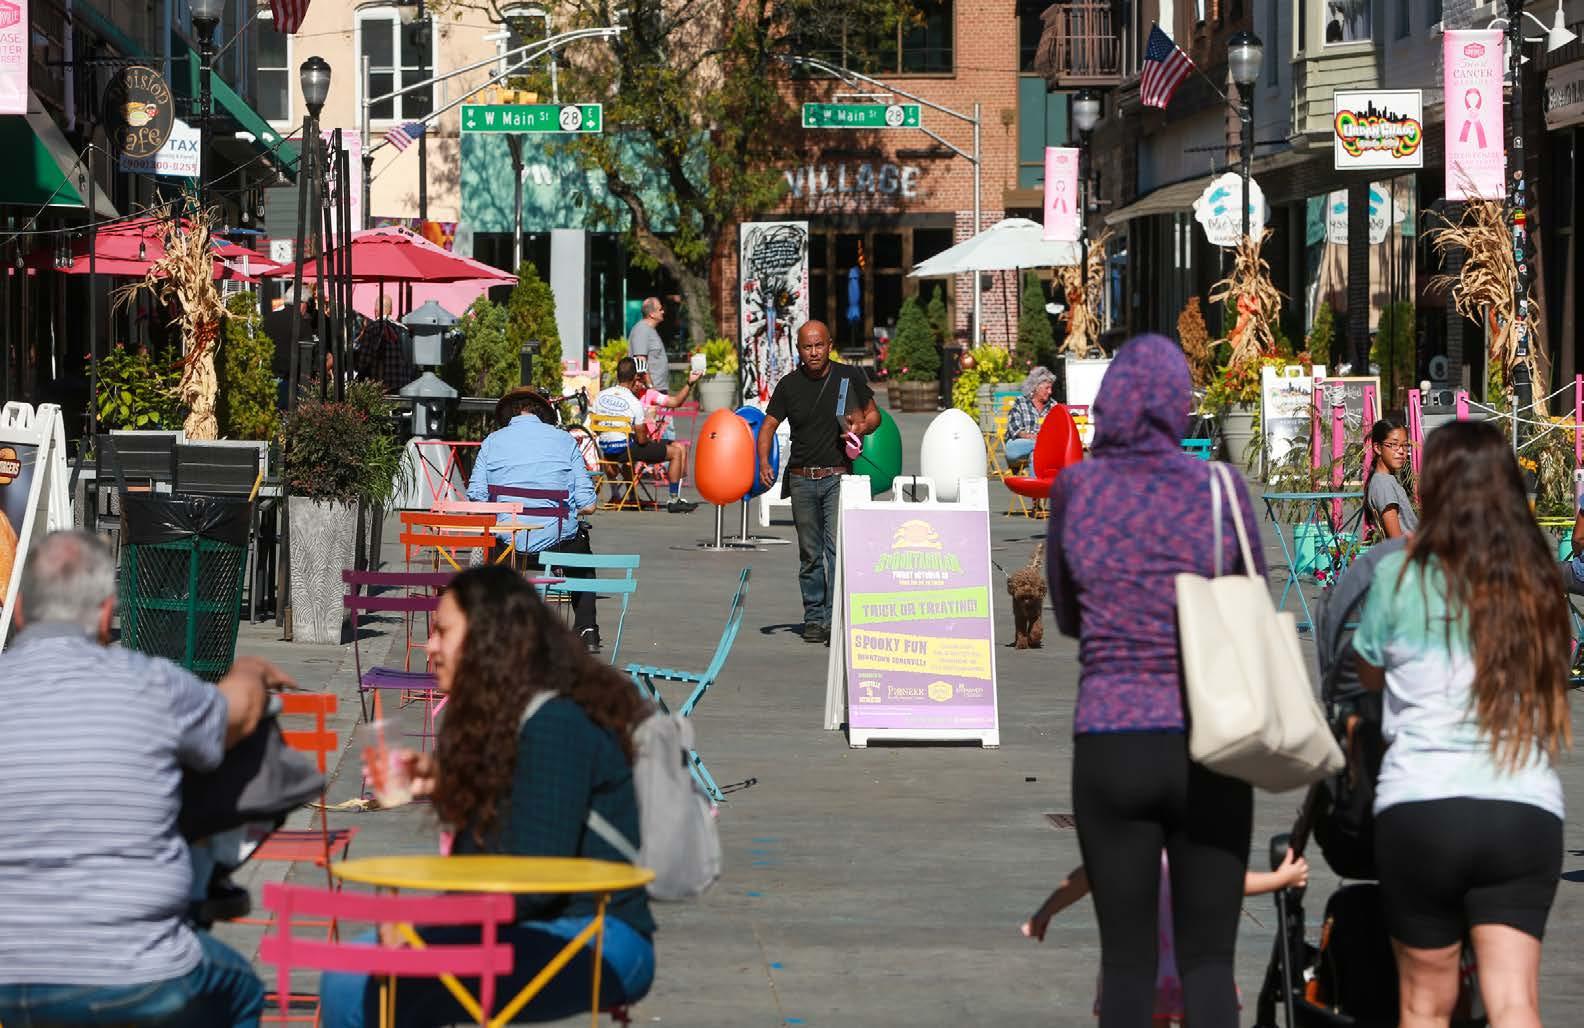
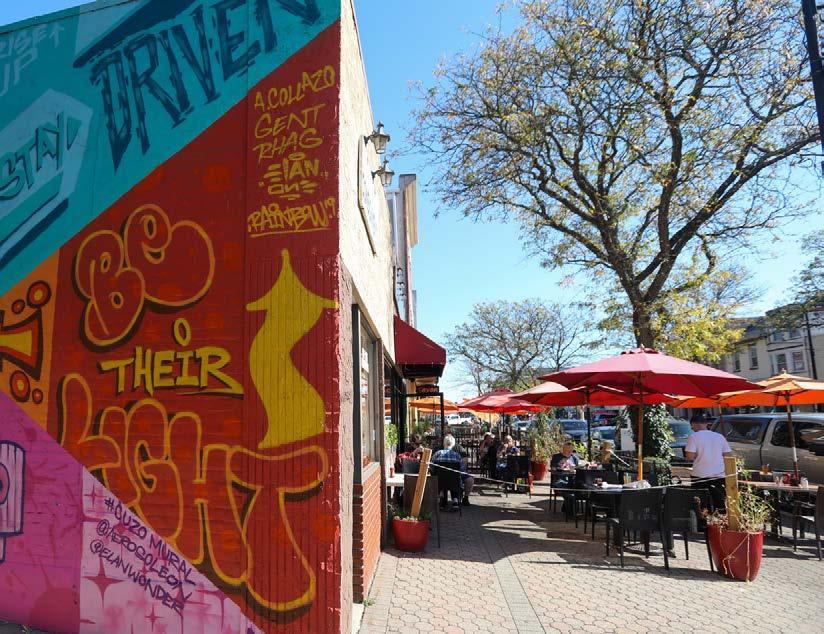
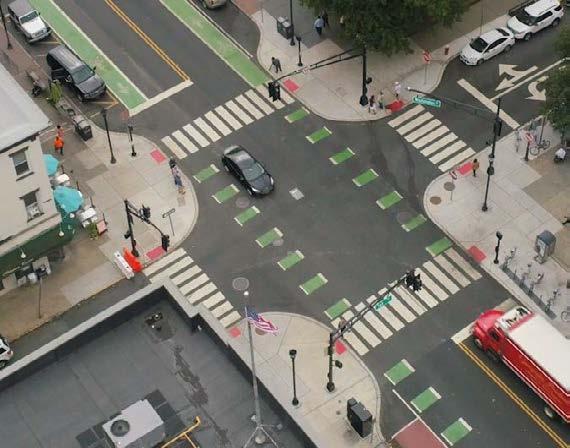
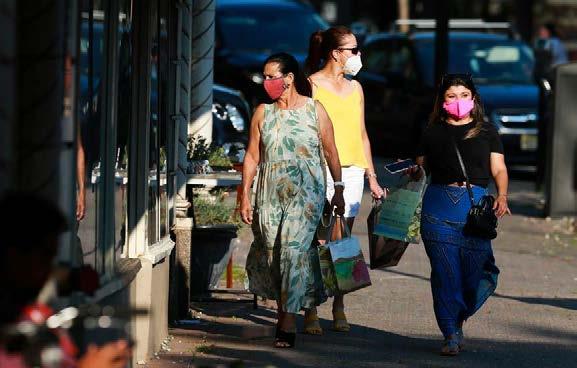
¡ People have rediscovered streets in their communities for dining, recreation, and other activities, giving new impetus to “complete streets” designs that serve all modes and people.
¡ More people have been walking, biking and using other “active” transportation to get around, reducing dependence on vehicles and encouraging residents to spend more time shopping and socializing in their communities.
¡ People have embraced technology in new ways including greatly expanded remote work, online education, virtual doctor visits and e-commerce. This may help remove transportation barriers for people with mobility limitations and bode well for acceptance of emerging transportation technologies.
¡ While the pandemic exposed some divisions in society, for many people the shared experience has bolstered their civic spirit, with increases in volunteering and charitable giving. It also prompted many organizations and companies to help those in need, make commitments to undo racial discrimination and take action on climate change.
The impacts and implications of all this are still unfolding. Throughout this plan, NJTPA takes the initial steps to integrate lessons and insights from 202021 into its vision for the future.
Developing the plan
This plan fulfills federal requirements for MPOs like the NJTPA, which must update long-range plans every four years as a condition to receive federal transportation funding. This requirement in federal law (23 CFR 450)reflects the need for transportation investments to be based on a“continuing, cooperative, and comprehensive” (3C) planning process that provides “for the development of an integrated multimodal transportation system … to facilitate the safe and efficient movement of people and goods in addressing current and future transportation demand.” It recognizes that infrastructure improvements made today can last and serve the public for a generation or more to come. The NJTPA’s goals and federal guidance (see sidebar p. 12)
A Future Vision
¡ Transportation, underpinning the regional economy, must be more e cient, safer, more responsive to changing needs and conditions and environmentally sustainable.
¡ People, in all the region’s communities, must be the focus of transportation policy and investments, aimed at equitably enhancing options and access and removing barriers.
¡ Opportunity, in all its facets—for realizing healthy and fulfilling lifestyles, for expanding jobs and commerce, for enhancing access to education, housing, and other needs—must continue to be pursued as the ultimate goal of all transportation policy and investment.
helped shape the content of this plan.
In keeping with the people-focus of this plan, extraordinary efforts were undertaken during the plan’s development to gather input from the region’s residents and users of the transportation system. While the pandemic made public outreach more challenging, it also opened new opportunities for residents who cannot easily go to physical events. More than 3,000 people submitted online surveys or participated in virtual public meetings, symposia, or targeted outreach to engage underserved populations, including focus groups and a children’s activity.
The NJTPA found people and organizations were eager to share their experiences and views. The outreach, summarized in Chapter 2, provided a wealth of insights for helping shape this plan and the ongoing planning work of the NJTPA. Among the most expressed concerns:
¡ Transit is oriented toward New York City and North Jersey’s major cities but often falls short in meeting intrastate travel needs within cities and towns and between less dense communities.
¡ Affordability of housing and transportation are barriers for many to access opportunity.
¡ Technology, such as real-time transit information and fare integration, are within reach and are critical to improving access and mobility.
¡ People want to continue the flexible use of streets that give more public space for walking, biking, and socializing instead of just for vehicles.
¡ Transportation policies often discriminate against minority communities and fail to meet their needs.
Insights from this public outreach were integrated with the findings of a variety of technical planning activities in developing this plan including forecasting and modeling, preparation of four background policy papers (see Appendix A), and studies of local needs and strategies. This work was conducted in close collaboration with partner agencies, including member city and county “subregions,” the New Jersey Department of Transportation (NJDOT), NJ TRANSIT, the state’s eight Transportation Management Associations (TMAs), and the Together North Jersey (TNJ) consortium, among others.
Collaboration has also been essential to NJTPA’s implementation of regional transportation performance measures. Under federal law, MPOs are required to track measures of various aspects of transportation performance, set data-driven targets for the measures, and select projects to help meet those targets. The NJTPA has worked with its partners to develop agreed-upon measures and targets—including for safety, infrastructure preservation, congestion reduction, freight movement and other areas.
This is the first NJTPA long range plan update to include a reporting of the region’s progress toward performance targets (Chapter 4, Appendix B). This performance-based planning and reporting ensures accountability and transparency and provides for better investment decisions.
Plan Priorities
In addition to assessing the near-term disruptions and impacts of the pandemic, this plan looks at the longterm prospect that the region’s population and economy will continue to grow, adding travel demand to a system already at or above capacity in many locations. Regional population is projected to grow by 15percent to 7.7 million, vehicle miles of travel will grow by 11 percent and freight movement will grow by 16percent by 2050. (These projections do not take into account new Census figures released in August 2021).
Along with the overarching themes of Transportation, People, Opportunity, several clear priorities emerged for the region’s transportation future, which are reflected throughout this plan:
Safety: Reducing crashes and ensuring the safety of all travelers must continue to be a primary focus across all policies, programs, and investments. New
Rahway, Union County
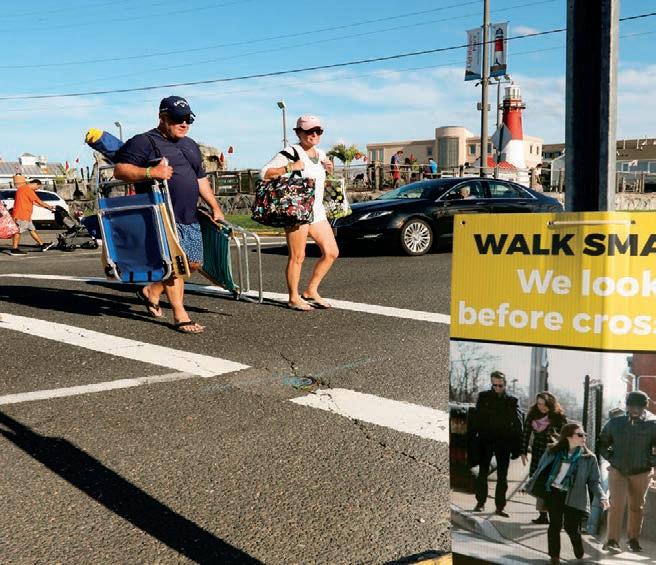
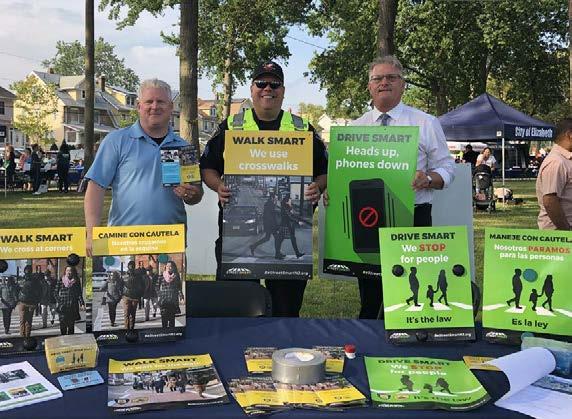
Jersey updated its Strategic Highway Safety Plan in 2020 to guide investments towards reducing serious injury and fatal crashes for all modes. As the nation’s most densely populated state, New Jersey has suffered high rates of injuries and fatalities on its roads. Pedestrians are particularly vulnerable. With more people walking and biking, renewed safety measures are required, including NJTPA’s funding of local safety projects and support for Street Smart NJ pedestrian safety campaigns.
Accessibility: The region’s planning must continue to shift its focus away from moving vehicles to one of accessibility—that is, using a variety of modes to give people convenient and affordable access to jobs, education, and other opportunities. This shift requires support for a well-funded and responsive bus and rail transit system, promotion of Transit Oriented Development, support for implementing “complete streets” and cultivation of flexible shuttle and shared ride services such as those provided through TMAs, among other approaches.
Equity: The transportation system must more fully address the needs of low-income and minority communities, which have been traditionally underserved and faced with the effects of institutional discrimination. To this end, in January 2021, the NJTPA Board adopted an updated Title VI plan which outlines NJTPA’s civil rights and anti-discrimination policies and guides environmental justice efforts. It establishes the goals and framework for equity measures in this long range plan.
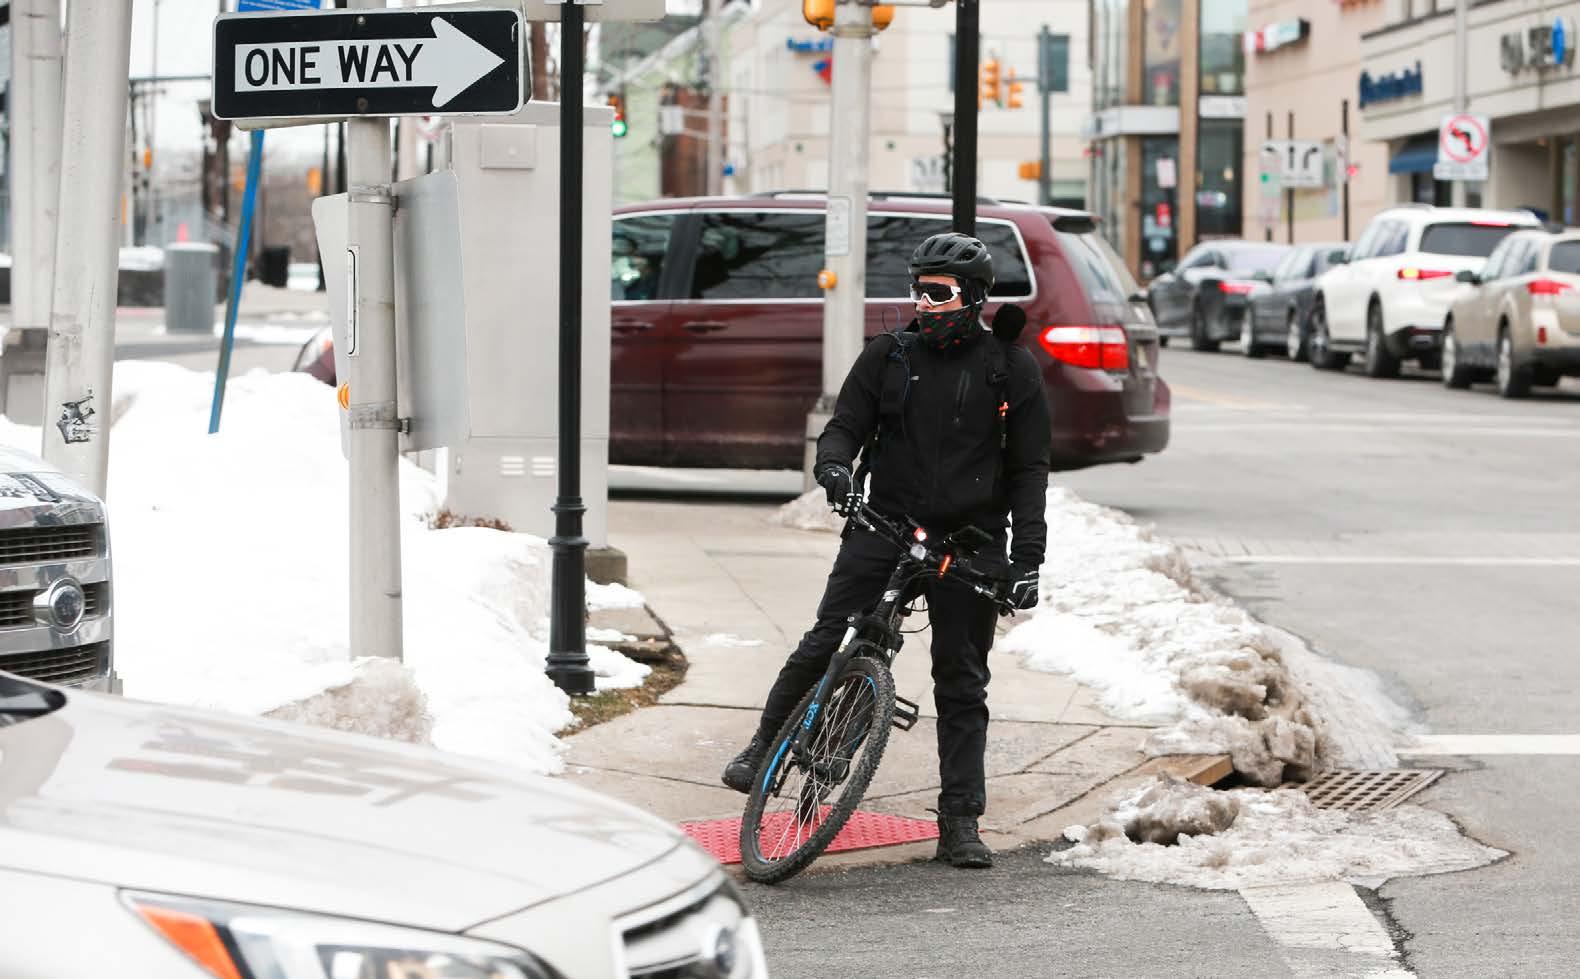
Active Transportation: Walking, biking and other active transportation modes have become increasingly popular in recent years and saw dramatic growth during the pandemic. They help make the transportation system cleaner and more efficient and support public health. A background paper for this plan identified infrastructure improvements and policies the NJTPA will pursue to support active transportation.
Climate Change: North Jersey is particularly vulnerable to climate change impacts due to its dense population and extensive coastline and waterways. A background paper explored measures the NJTPA will take to help reduce greenhouse gases generated by the transportation sector and to adapt infrastructure to meet climate impacts. This includes support for state climate change initiatives and policies.
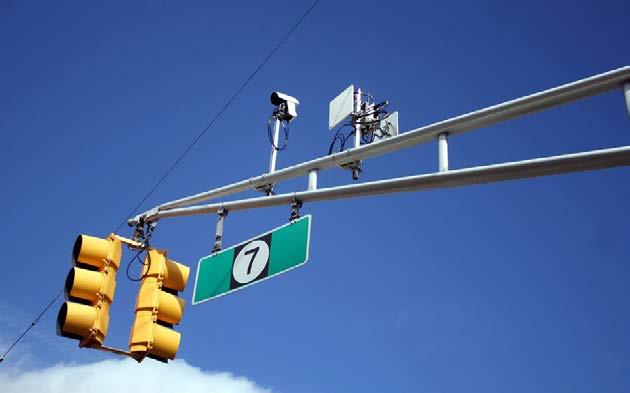
Transportation Technologies: Technology, such as adaptive traffic signals and electronic tolling, is already making transportation more efficient, improving safety, and reducing the need for expensive capacity expansions. A background paper explored these and other technologies under development, including connected and automated vehicles which could transform future transportation. The NJTPA, through this plan, will continue to support transportation technology applications and guide the region in their use.
Freight: The region has long been a hub for goods movement serving the northeastern U.S. Continued growth of the region’s port and the expansion of e-commerce handled through the region’s distribution centers present important economic opportunities for the region. However, the pandemic has altered retail and business operations, requiring new approaches to key freight issues, as discussed in a background paper that informs this plan.
A Balanced Plan
Guided by these priorities and the NJTPA’s longstanding goals for the region (see sidebar p. 12), this plan presents a balanced vision for investment in the transportation system through the year 2050. Projections prepared for the financial element of this plan (Chapter 7) look to a full economic recovery from the deep impacts of the pandemic over the next five to
Red Bank, Monmouth County
ten years. The NJTPA, at its regular Committee and Board meetings, is prepared to adjust investments and policies in this plan to meet near-term contingencies as the region recovers. For the long-term, the region is projected to resume growth at a rate of 2.3 percent annually, in line with rates prior to the pandemic. While new methods of financing transportation will be needed—including to recoup fuel tax revenue lost to vehicle electrification—this plan foresees an average of $4.2 billion in year of expenditure (YOE) dollars available annually to attend to current and future needs of the transportation system and make strategic expansions of capacity. This totals approximately $120.6 billion YOE over the life of the plan.
Guidance for Long Range Planning
TAs in previous long range plans the majority of available funding, 64 percent or more, must be devoted to maintaining and improving existing infrastructure— safeguarding the functioning of the extensive road and rail system that has served the region well, despite its limitations. The road network, as the principal means of moving both people and goods, in particular requires substantial investment for maintenance and improvement. NJTPA works closely with NJDOT and its subregions to identify and attend to these needs.
At the same time, this plan commits to continued improvements to the bus and rail transit system, advancing NJTPA’s priority for accessibility and meeting preferences widely expressed in public outreach. In total, 51 percent of funding
his plan builds upon NJTPA’s previous long range plan, Plan 2045, which was adopted by the NJTPA Board of Trustees in November 2017. This plan carries forward key guidance for shaping the future of transportation. In particular, planning goals which were originally formulated in the 1990s and later expanded set directions for this plan and the work of the NJTPA:
¡ Protect and improve natural ecosystems, the built environment and quality of life.
¡ Provide a ordable, accessible and dynamic transportation systems responsive to all current and future travelers.
¡ Retain and increase economic activity and competitiveness.
¡ Enhance system coordination, e ciency, safety and connectivity for people and goods across all modes of travel.
¡ Maintain a safe, secure and reliable transportation system in a state of good repair.
¡ Create great places through select transportation investments that support the coordination of land use with transportation systems.
¡ Improve overall system safety, reducing serious injuries and fatalities for all travelers on all modes.
The NJTPA is also guided by federal planning factors which, under the federal law, must be addressed in MPO long range plans.
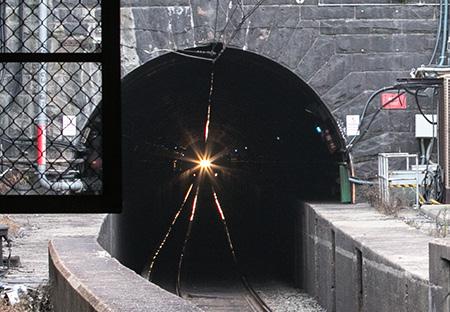
Somerville, Somerset County
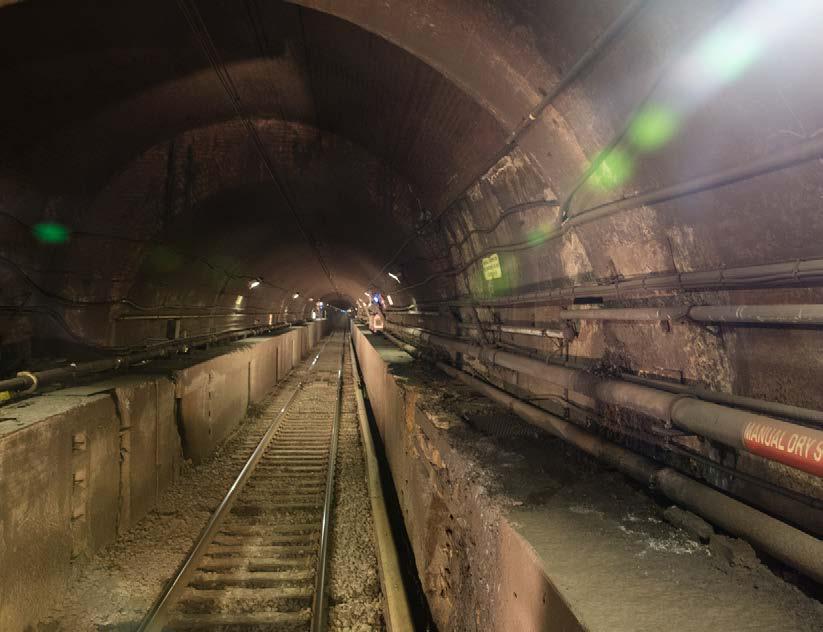
is allocated to support the transit network through 2050. A key to the future of the entire transit system, this plan recognizes, is the completion of two new rail tunnels across the Hudson River. If needed additional funding can be secured– as called for in this plan’s “aspirational” scenario—the full series of Gateway projects should be built, providing additional rail capacity serving the entire Northeast Rail Corridor.
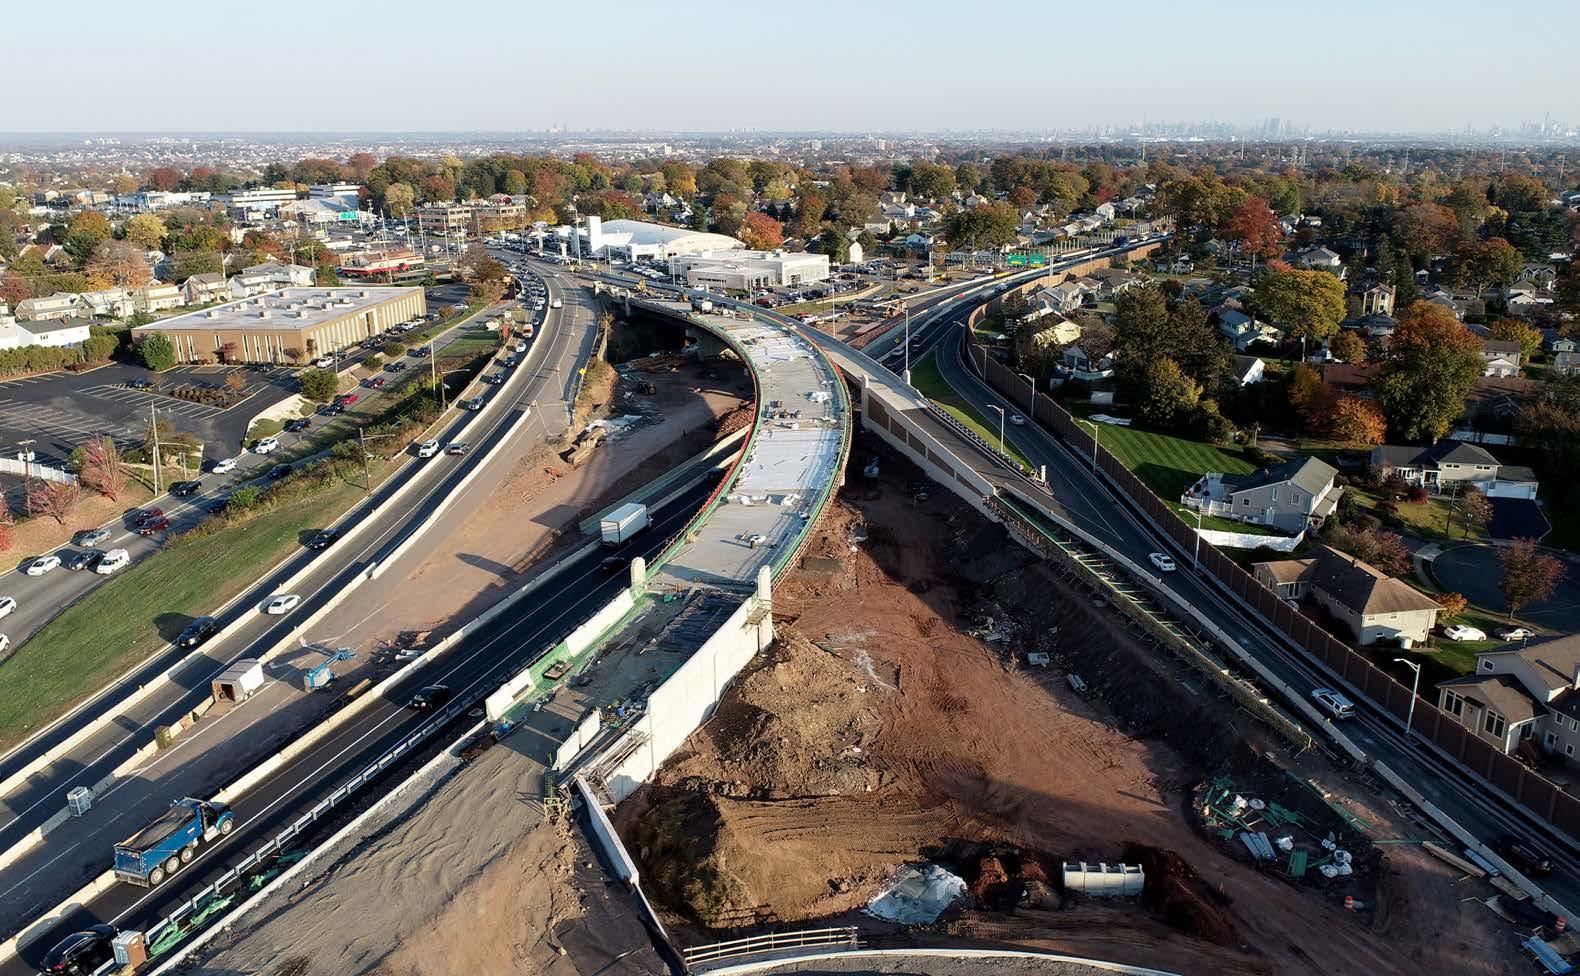
Such major regional investments in the road and transit networks must be matched with investments targeted to meet local needs. This plan includes many such projects, identified through the planning efforts of the NJTPA, its city and county subregions and partner agencies and made possible with federal funding through NJTPA programs. They span the range of
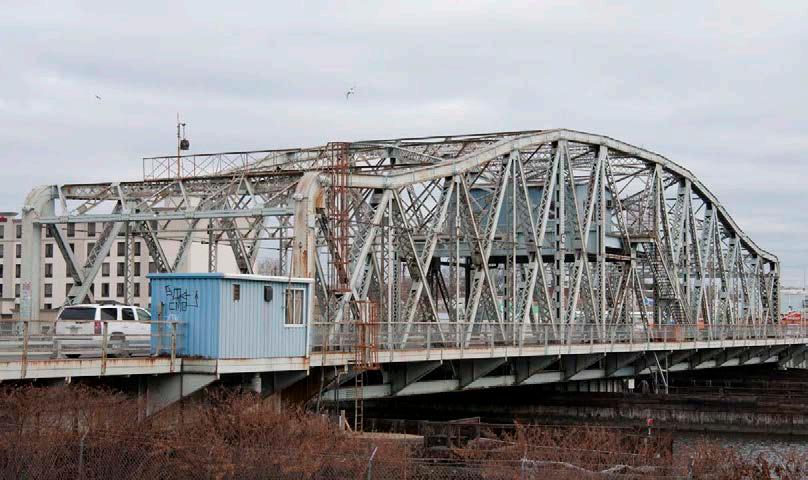
needs on the region’s system—upgrading intersection safety, creating new walk and bike trails, repairing and replacing aging bridges, installing computerized traffic signals, enhancing bus and rails stations, building roundabouts, addressing hazards on rural roads, and much more. Similar planning efforts conducted and supported by the NJTPA over the life of this plan must focus not only on current needs but preparing the region to meet future threats and challenges and realize new opportunities.
In guiding these efforts, this ambitious plan recognizes that maintaining and improving the transportation system, meeting the needs of people, enhancing opportunities and adapting to change is our path to 2050.
¡ Support the economic vitality of the metropolitan area, especially by enabling global competitiveness, productivity and e ciency.
¡ Increase the safety of the transportation system for motorized and non-motorized users.
¡ Increase the security of the transportation system for motorized and non-motorized users.
¡ Increase accessibility and mobility of people and freight.
¡ Protect and enhance the environment, promote energy conservation, improve the quality of life, and promote consistency between transportation improvements and State and local planned growth and economic development patterns.
¡ Enhance the integration and connectivity of the transportation system, across and between modes, for people and freight.
¡ Promote e cient system management and operation.
¡ Emphasize the preservation of the existing transportation system.
¡ Improve the resiliency and reliability of the transportation system and reduce or mitigate stormwater impacts of surface transportation.
¡ Enhance travel and tourism.
The NJTPA also has established a Regional Capital Investment Strategy (RCIS)—see appendix C—consisting of nine principles and associated objectives to help guide where and how investments are made. All this guidance helps shape NJTPA’s responses to needs in the region and its vision for the future in keeping with the three overarching themes of Transportation, People, Opportunity.
Blairstown, Warren County
Hackensack, Bergen County
Together North Jersey
How does North Jersey remain a place where people want to live and where employers want to locate and expand their businesses? These were some of the key questions nearly 100 partners—local governments, universities, nonprofits, businesses and others—set out to answer through the regionwide Together North Jersey (TNJ) consortium formed in 2011. With the support of a federal grant, TNJ developed the first comprehensive plan for sustainable development for the NJTPA region. Finalized in 2015, the plan provides a strategy to make the region more competitive, efficient, livable, and resilient—the four overarching themes that guide all its recommendations. It details 15 focus areas and over 70 strategies the region can pursue to meet these goals. TNJ’s vision encompasses more than transportation. It addresses challenges and broad-based aspirations involving economic development, land use, the environment, education, housing, health, the arts, culture, and other issues. The TNJ plan recognizes that the decisions we make in all of these areas—as individuals and as communities—are all connected and a ect the larger region.
Led by the NJTPA, Rutgers University and stakeholders across the region, TNJ has continued to shepherd implementation of these recommendations through local capacity-building programs, such as the TNJ Institute, and direct technical assistance to communities through the Local Technical Assistance program. The TNJ Forum and Task Forces also work to guide the implementation of the Plan. Comprised of stakeholders and subject-matter experts from around the region, there is one task force for each of the Plan’s four key vision themes: Competitive, Efficient, Livable, and Resilient. These task forces convene several times per year to discuss sustainable development challenges in the region and develop actions to further implement the Plan. Currently, the many TNJ partners have been working to update the Plan. Below are some examples of TNJ’s key e orts and accomplishments that Plan 2050 will support with long-term transportation investments, policies and programs.
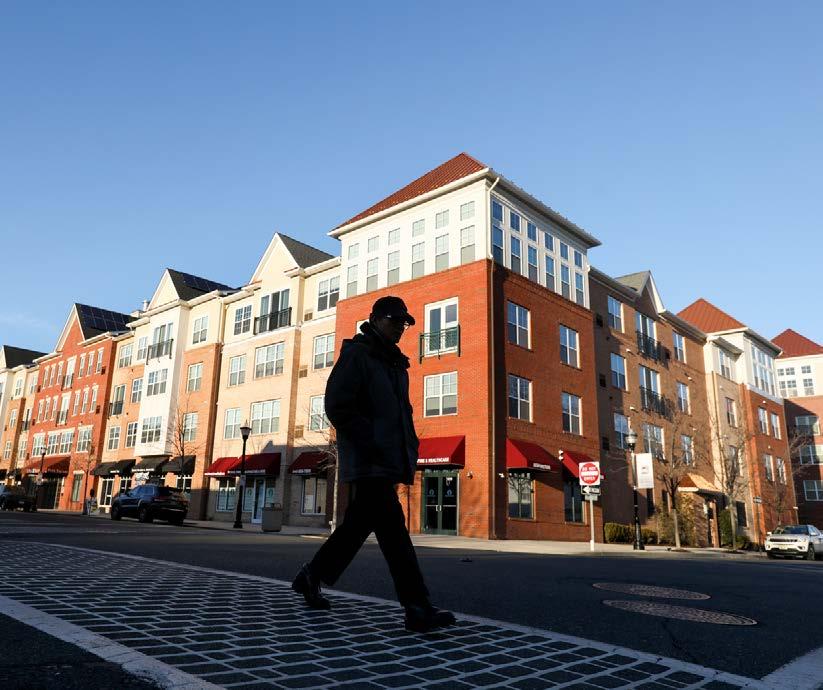
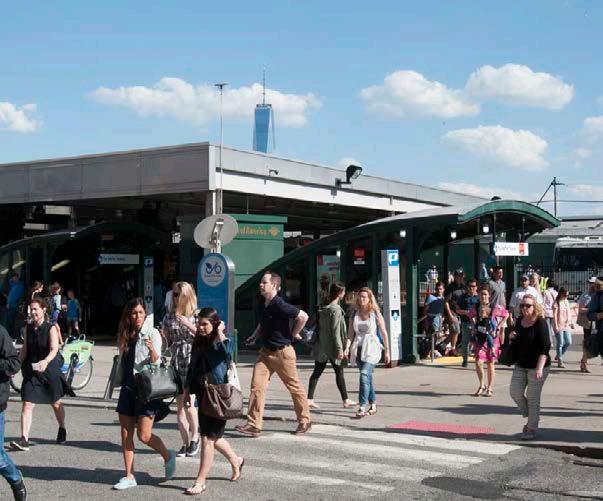
Hoboken, Hudson County
COMPETITIVE
TNJ promotes increased prosperity and access to opportunities by identifying regional priorities that support businesses, workers, and places in the region. Recent Competitive Task Force activities include publication of a report that reviewed regional tourism and economic development marketing practices; research to better understand potential benefits of a regional marketing initiative; and a workshop on post-pandemic workforce and employer needs.
EFFICIENT
TNJ promotes a transportation system that is e cient and equitable for all the region’s residents, with a particular focus on strategies that foster development around bus and rail transit hubs. The TNJ E cient Task Force partnered with the New Jersey Chapter of the American Planning Association to launch a Transit Hub Planning Initiative. This e ort explored the creation of vibrant transit hubs in three locations—Dunellen Station, Passaic Bus Depot Transit Hub Project in the City of Passaic and Watsessing Station Transit Hub in Bloomfield. The program aimed to encourage the development of transit hubs around these existing stations, supporting the community’s goals for economic development, land use, access to jobs, and cultural development. Other activities include completion of a guidebook for planning around transit and workshops on such topics as transit-oriented development, repurposing brownfields, roundabouts, and micro-mobility.
LIVABLE
A livable region allows all its residents to thrive through access to a ordable housing, employment, medical care, healthy food, and attractive and safe communities enriched by arts and culture. To that end, TNJ conducts activities that enhance quality of life, foster community pride and boost local economies. This has included the application of public art and designs for a pedestrian plaza in Hackensack, development of a visitor’s guide for Dover and a wayfinding plan for Bound Brook. Other activities include creation of a Greenway Development Guidebook, produced in partnership with the NJDOT, which helps communities interested in developing or expanding a greenway to better understand the process and a Community Food Security Assessment Guidebook aimed at assisting communities in improving access to healthy food.
RESILIENT
TNJ recognizes that a resilient region is one that equitably addresses the threats of climate change, transitions away from the use of greenhouse gas-generating fossil fuels, and sustainably uses materials and minimizes waste. Task Force initiatives include development of a threepart Resilience Webinar Series that explains approaches and tools available to local decision-makers to reduce their communities’ vulnerability to climate change, and the Sustainability & Resilience Toolkit for Local Master Plans. The toolkit provides guidance on incorporating sustainability and resilience into municipal and county master plans, measures for fostering environmental justice, and guidance and resources on specific strategies for communities to consider.
Trains get people here, but there’s no last mile connection to businesses.”
—SOMERSET COUNTY COMMUTER, LET’S TALK BUSINESS AND TRANSPORTATION EVENT
Public Engagement 2
I’d like to see a future that encompasses safe, accessible and environmentally conscious modes of transportation for pedestrians and bicyclists.”
—UNION COUTY RESIDENT, ONLINE SURVEY
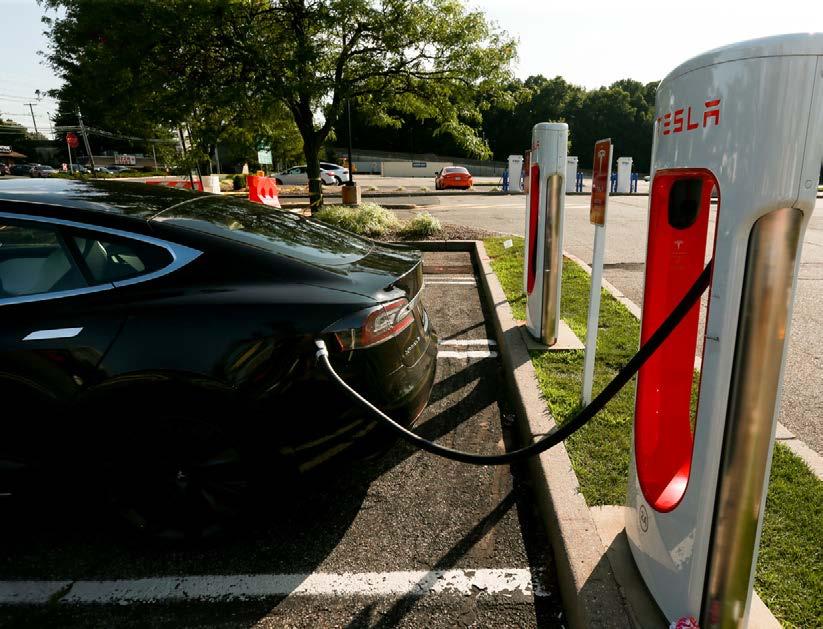
TRANSLATION: “I believe that in the coming years, people should be encouraged to go for green and clean energy. Instead of petrol, diesel, there should be electric charging points and the electricity of people’s homes also came from solar energy etc.”
—HUDSON COUTY RESIDENT, ONLINE SURVEY
THESE ARE JUST A FEW of the people who contributed their ideas to help develop Plan 2050. More than 3,000 people submitted online surveys or participated in virtual public meetings, symposia, or targeted outreach to engage underserved populations, including focus groups and a children’s activity. ■ Residents and workers from across the region, of all ages and backgrounds, shared their ideas for the future of transportation. The NJTPA found people and organizations were eager to share
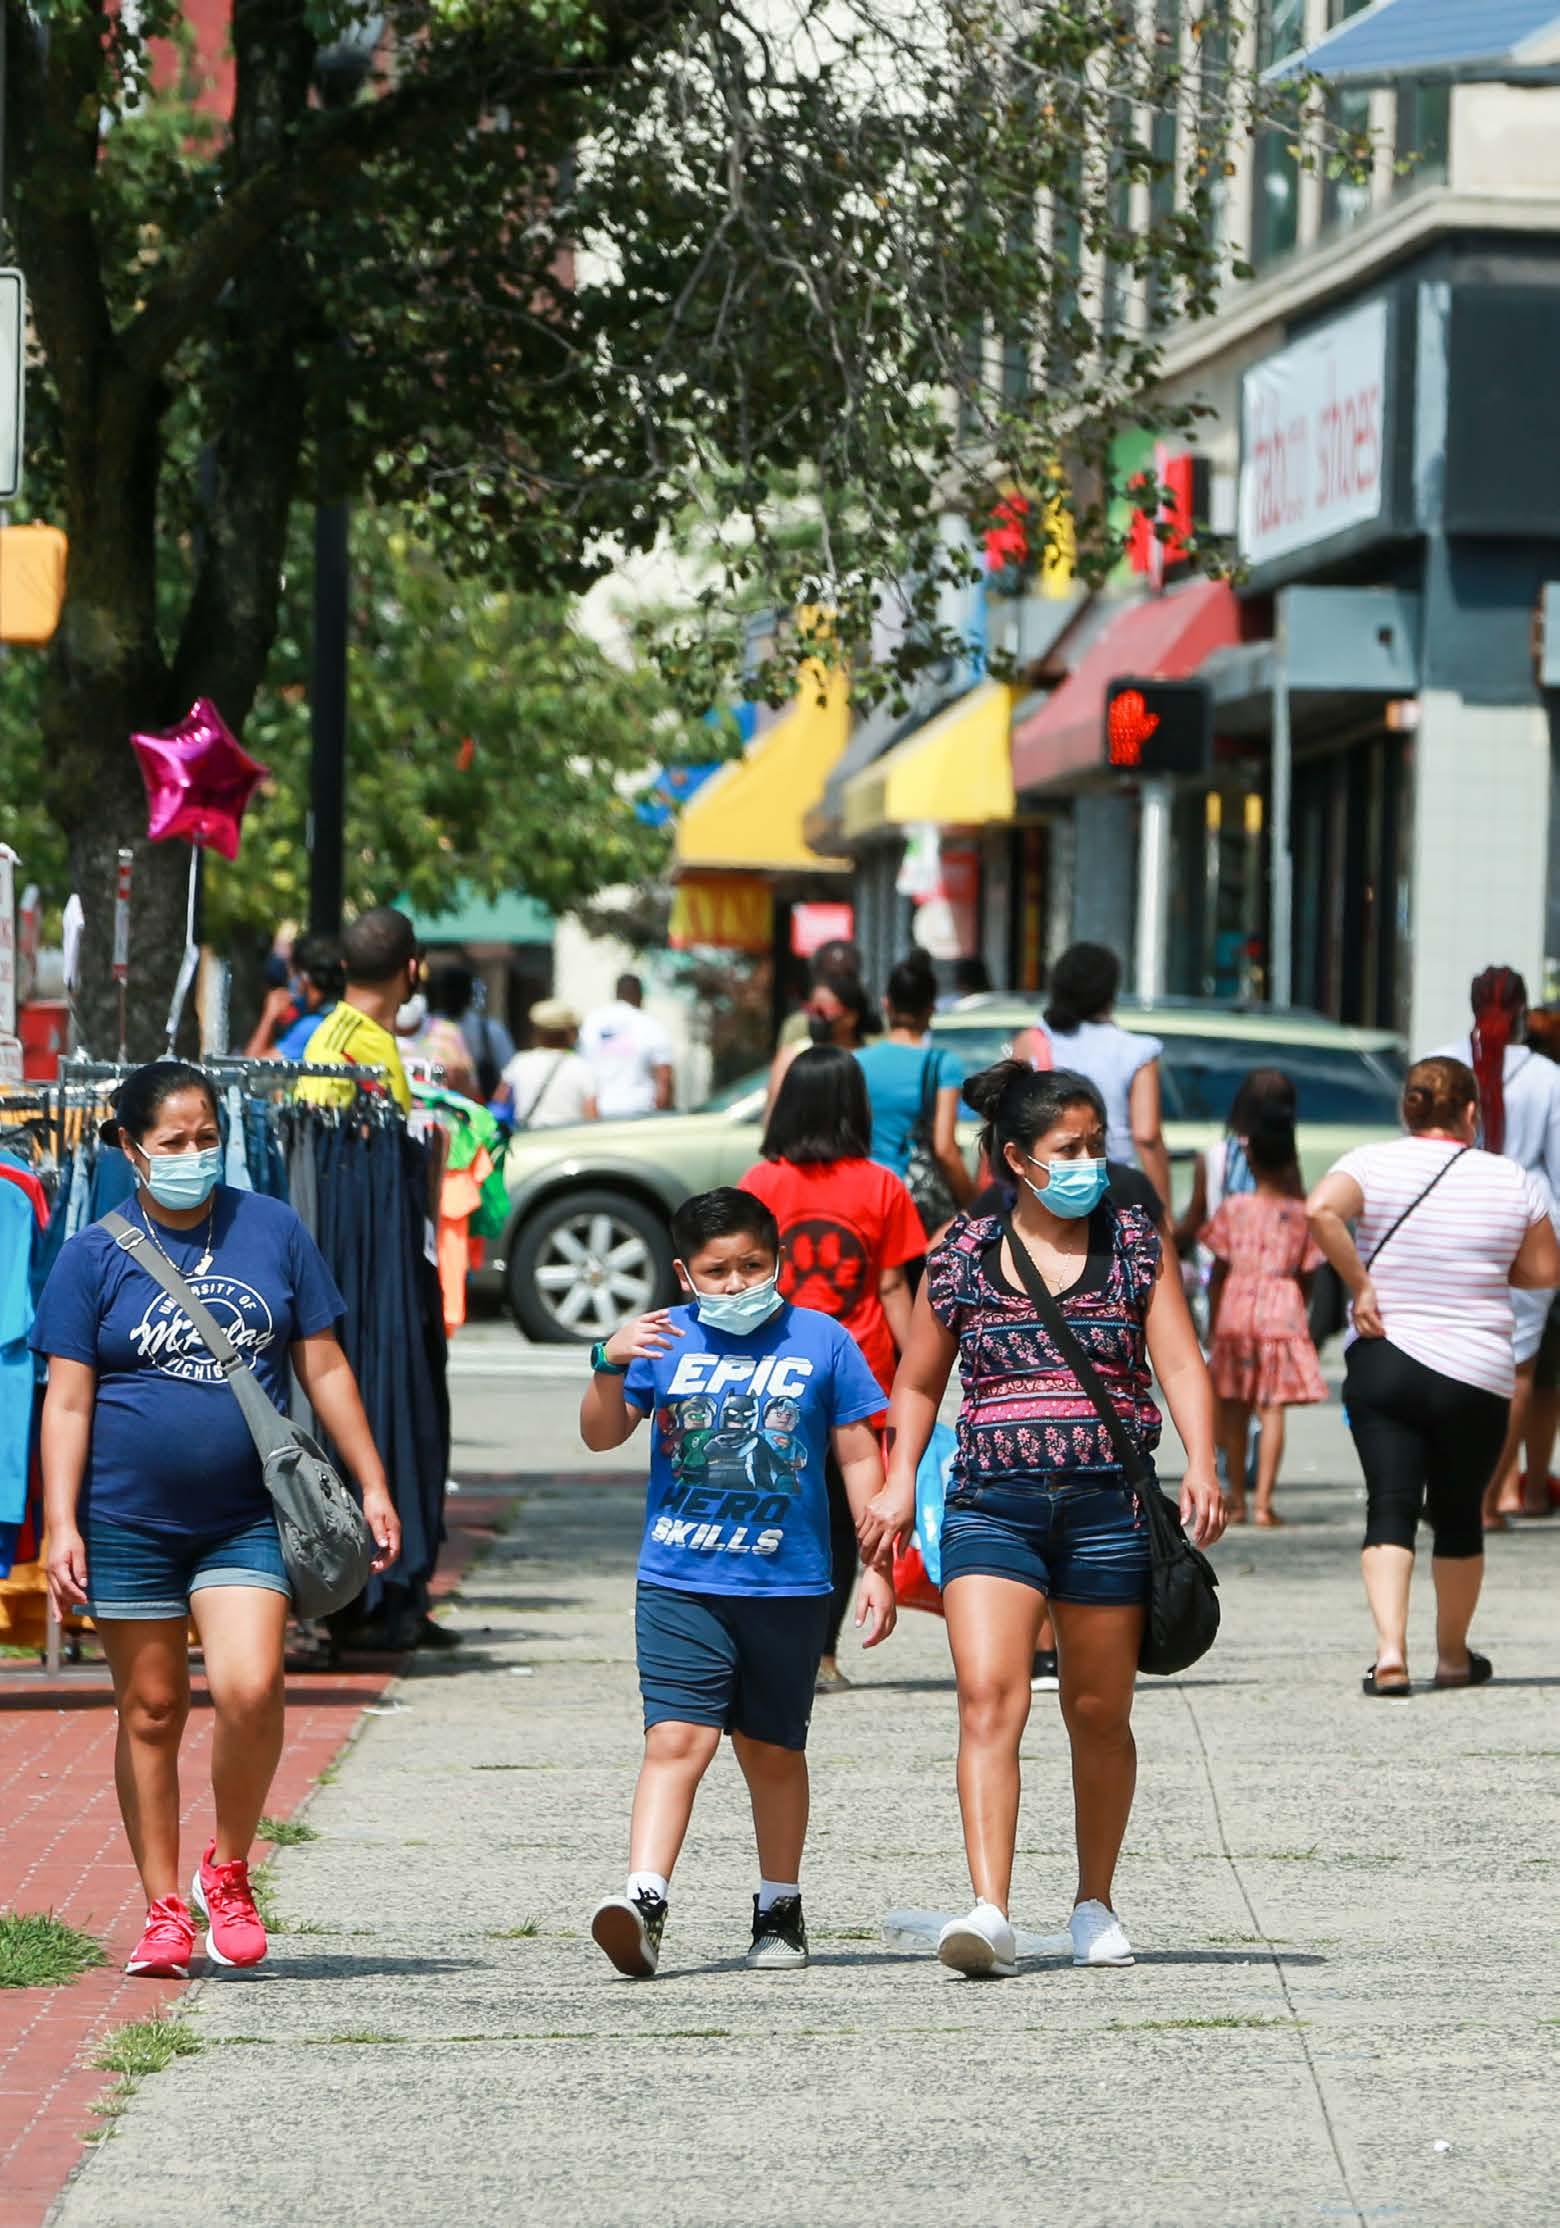
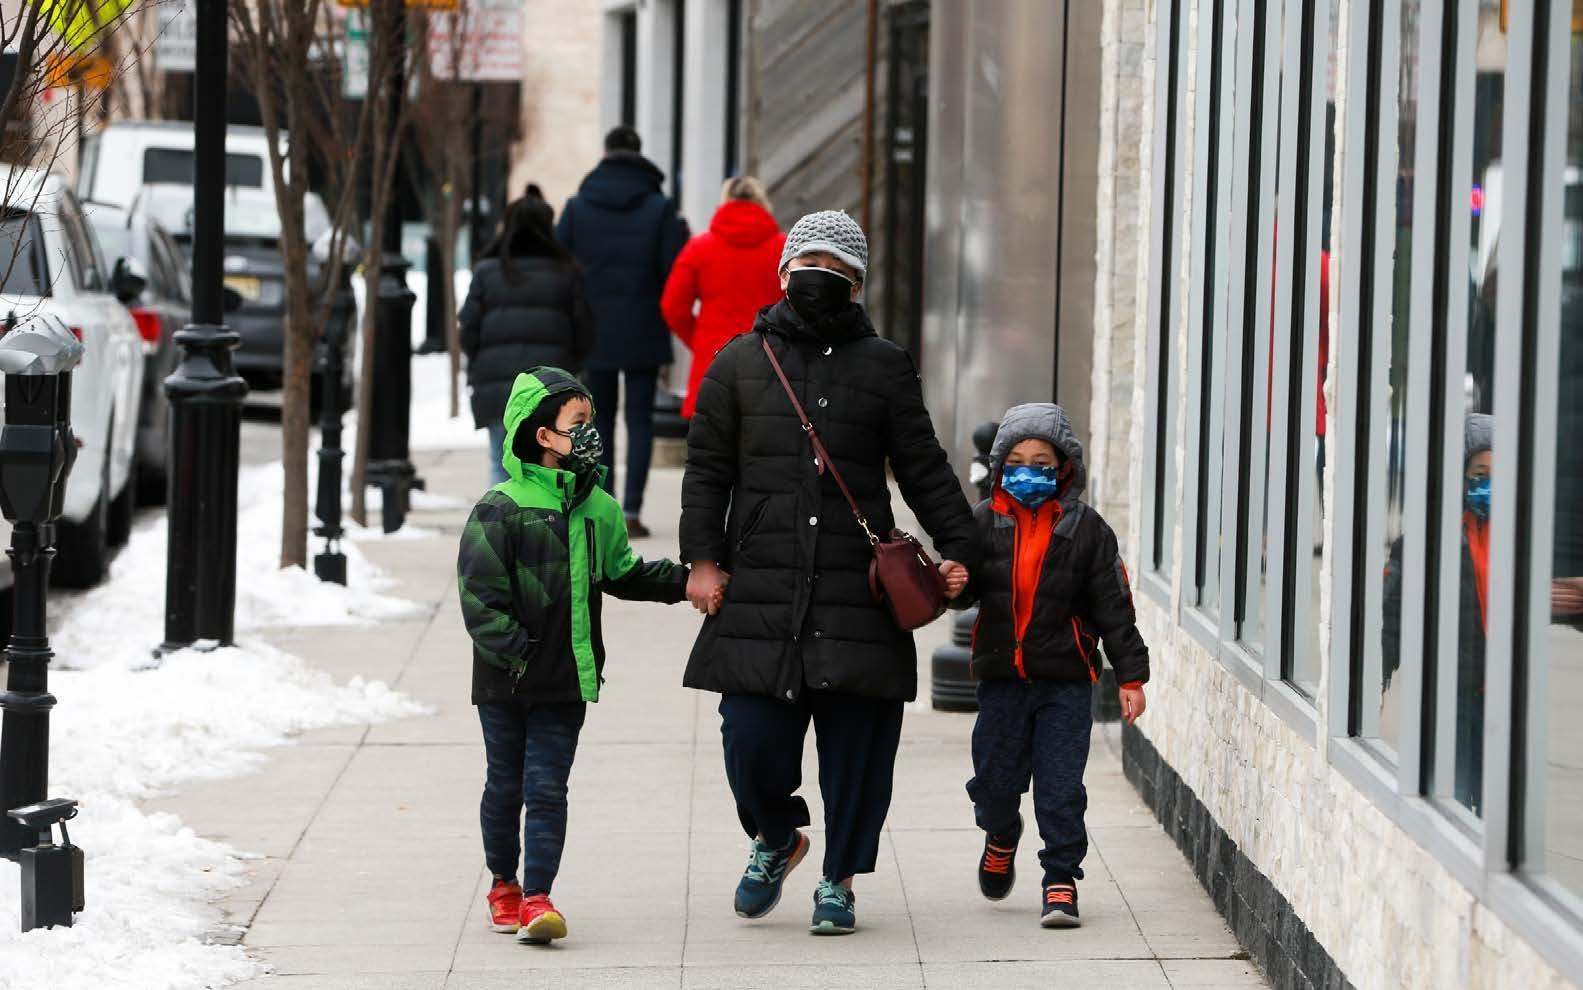
Orange, Essex County
their experiences and views, and that their comments are in line with the NJTPA’s regional goals. Several key themes emerged:
¡ Improving transit—including bus, train, light rail, and the PATH—was the highest priority for residents who took the online survey and participated in outreach events. Participants said transit should be convenient, reliable, frequent, and user-friendly. The Plan should include ways to improve transit accessibility and connectivity, and ensure the infrastructure is in a state of good repair. It should also include ways to expand transit, both in terms of the number of lines and frequency of service.
¡ In the past, the focus has been on improving transit to and from New York City, while it often remains challenging to get around North Jersey (and New Jersey as a whole) using transit.
¡ Equitable access is important for all transportation modes regardless of age, income, race, or and ability.
¡ Enhancing bike and pedestrian travel and safety is a priority, including expanding and connecting bike lanes and trails throughout the region. Bike and pedestrian planning should be thought of regionally rather than municipality by municipality. In general, more funds should be allocated to bicycle and pedestrian infrastructure.
¡ The increase in goods movement and freight traffic resulting from changes in consumer behavior
has led to more competition for curb space and increased wear and tear on roads. Goods movement needs to be better integrated into planning.
¡ Transportation funding in New Jersey is overly reliant on the gas tax. The state should look at ways to diversify and secure more reliable funding sources.
¡ Planning decisions should be more regional and holistic. More education is needed about the connection between land use planning and transportation so fewer inequities result from planning decisions.
Using new and innovative engagement strategies, the NJTPA—working with consultants from McCormick & Taylor, Mercer Planning Associates and Rutgers University’s Voorhees Transportation Center (VTC)—was able to reach a diverse cross-section of the region’s residents despite the challenges of COVID-19. Public input informed this plan, which aims to effectively and equitably address the region’s transportation challenges through 2050.
Prior to the pandemic, the NJTPA planned to hold a series of in-person and online outreach activities to engage people who live and work in the region. However, any in-person events were shifted to virtual to adhere to state and federal social distancing and health guidelines.
To get the NJTPA Board of Trustees, staff and public thinking about the future, the NJTPA launched the Planning for 2050 speaker series in January 2019. The series included 12 presentations at NJTPA Board meetings through 2019, 2020 and the first half of 2021. Speakers included representatives from the Federal Highway Administration, Regional Plan Association, Coalition for the Northeast Corridor, New Jersey Department of Environmental Protection and the National Association of Regional Councils, as well as a climatologist, economists and transportation planners. Topics included transportation performance management, long-term infrastructure needs, climate change, changing demographics, technology and more. Videos of the speakers are available at YouTube.com/ TheNJTPA.
In addition, the NJTPA hosted a virtual retreat for Board of Trustees members on June 5, 2020. The event provided an overview of the LRTP and included a discussion on the future of transportation in the region and how the COVID-19 pandemic could affect
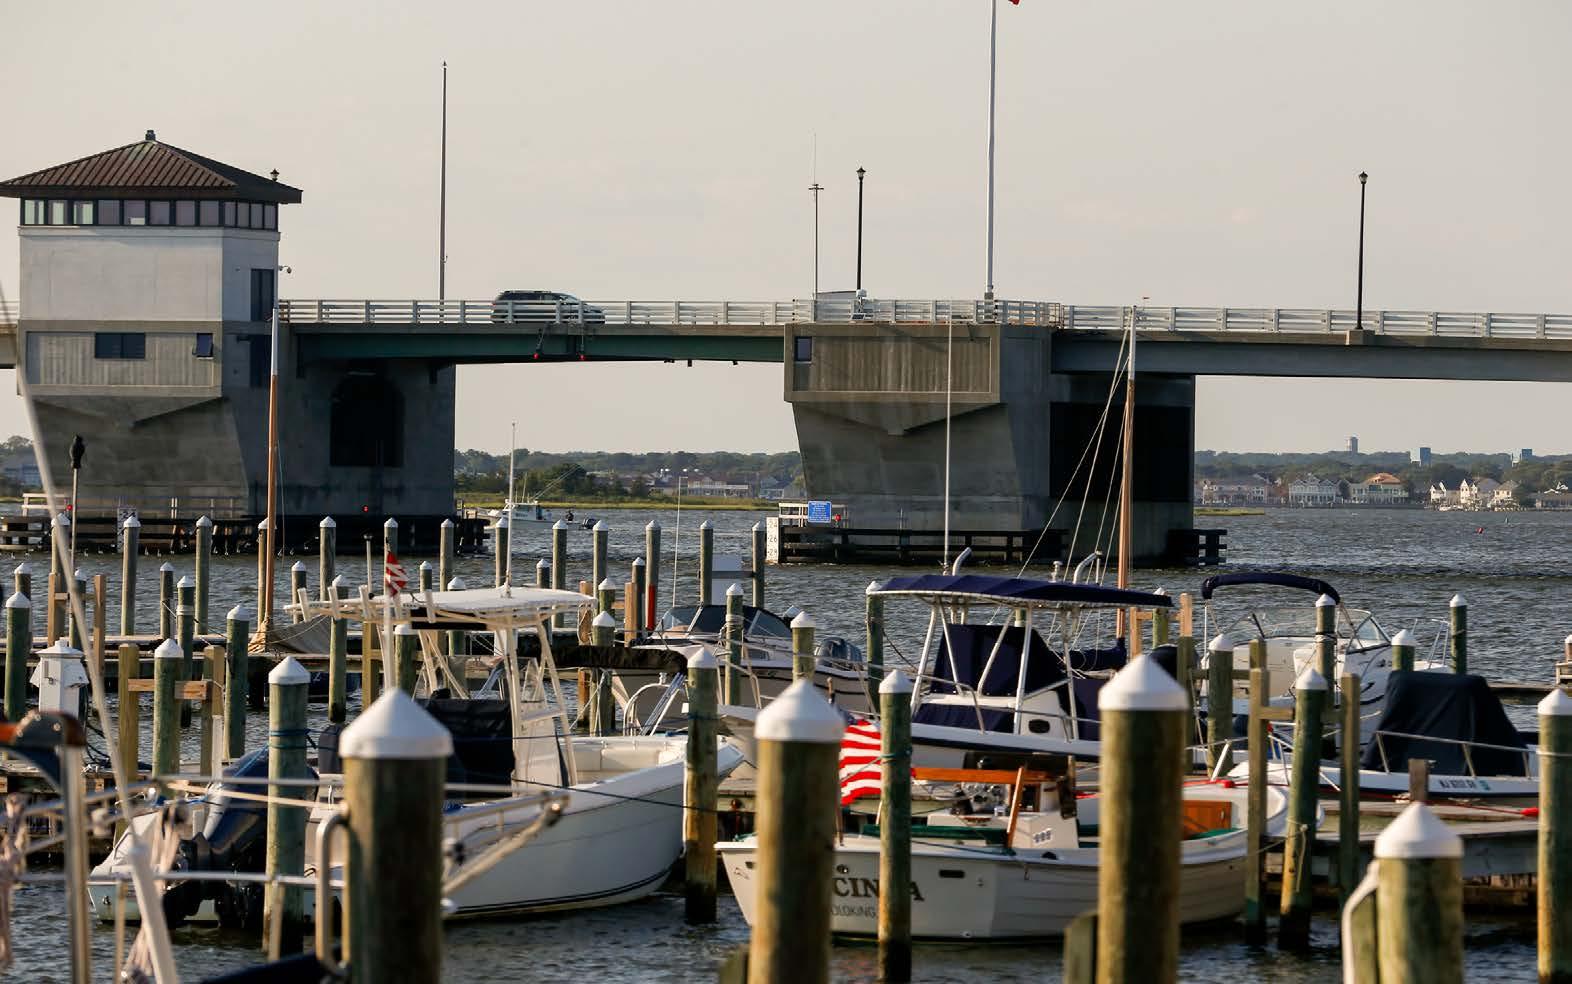
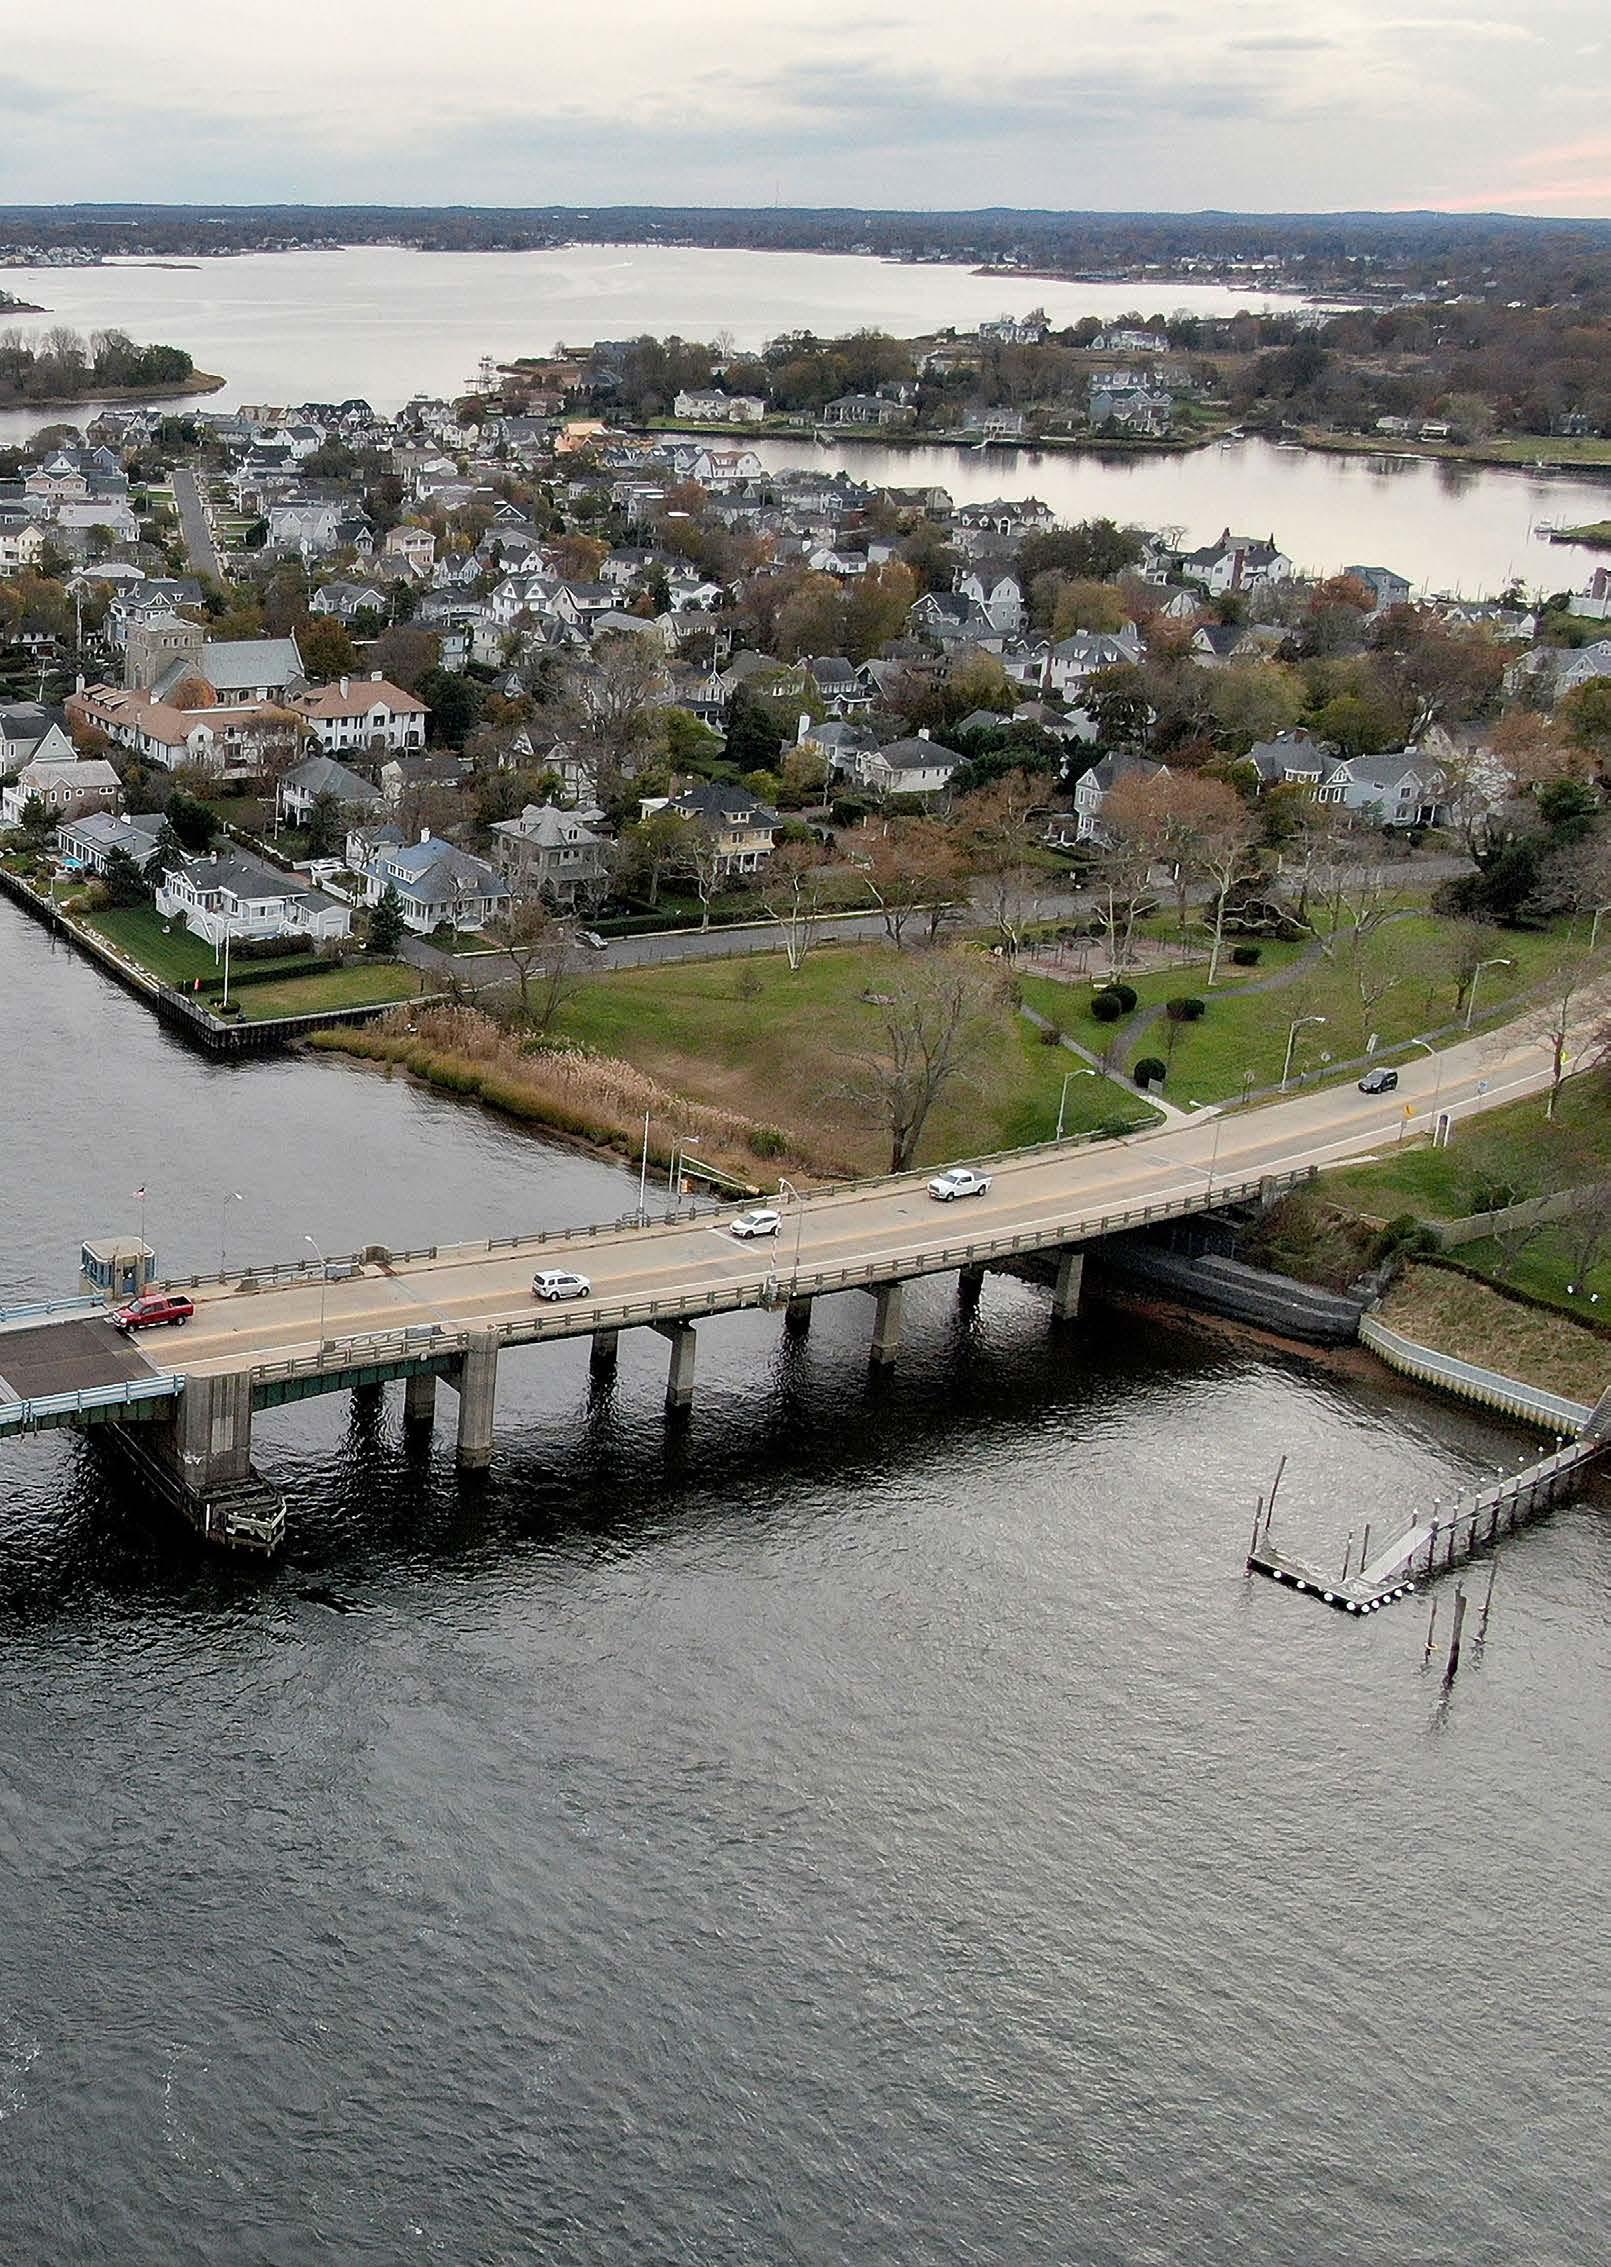
Point Pleasant, Ocean County
long-range planning. Prior to the meeting, Board members were asked to take a brief survey to share their thoughts about the region’s strengths, weaknesses, opportunities and threats in terms of transportation. Attendees participated in small group discussions— using virtual breakout rooms—on infrastructure and investment, affordability and inclusion, and bicycle and pedestrian safety. The event helped gather Board input for the plan, as well as public outreach efforts, which kicked off in September 2020 and continued through March 2021.
A draft of the plan was shared with the Board of Trustees—which includes the NJTPA subregions, NJDOT, NJ TRANSIT, the Port Authority and Governor’s Office—as well as the federally recognized tribal nations. Feedback from these key stakeholders was incorporated into the final draft, which was presented for public comment. In addition to their involvement as members of the Board of Trustees, NJ TRANSIT and the Port Authority of NY and NJ worked closely with NJTPA staff to help develop the transit portions of this plan.
Making Outreach Accessible
Understanding that not everyone can participate in live virtual events, the NJTPA employed other engagement methods. This included an online survey; distributing paper surveys with prepaid return postage and bookmarks with information about the plan to libraries; and a telephone hotline. In addition, the NJTPA engaged community groups to help publicize outreach opportunities. Additional specialized outreach, discussed in detail later in this section, was also conducted including focus groups with harder-to-reach populations, and events to engage young adults and youth.
To make the outreach more accessible to people with limited English proficiency, the survey was available in English and five other languages commonly spoken in the region: Spanish, Chinese (simplified), Korean, Portuguese, and Hindi. Other communications tools were translated as well. Social media ads were used to promote the survey in all six languages. In addition to the English-language hotline, there was also a Spanish hotline and some events were held entirely in Spanish or included an interpreter.
The NJTPA also worked with a Stakeholder
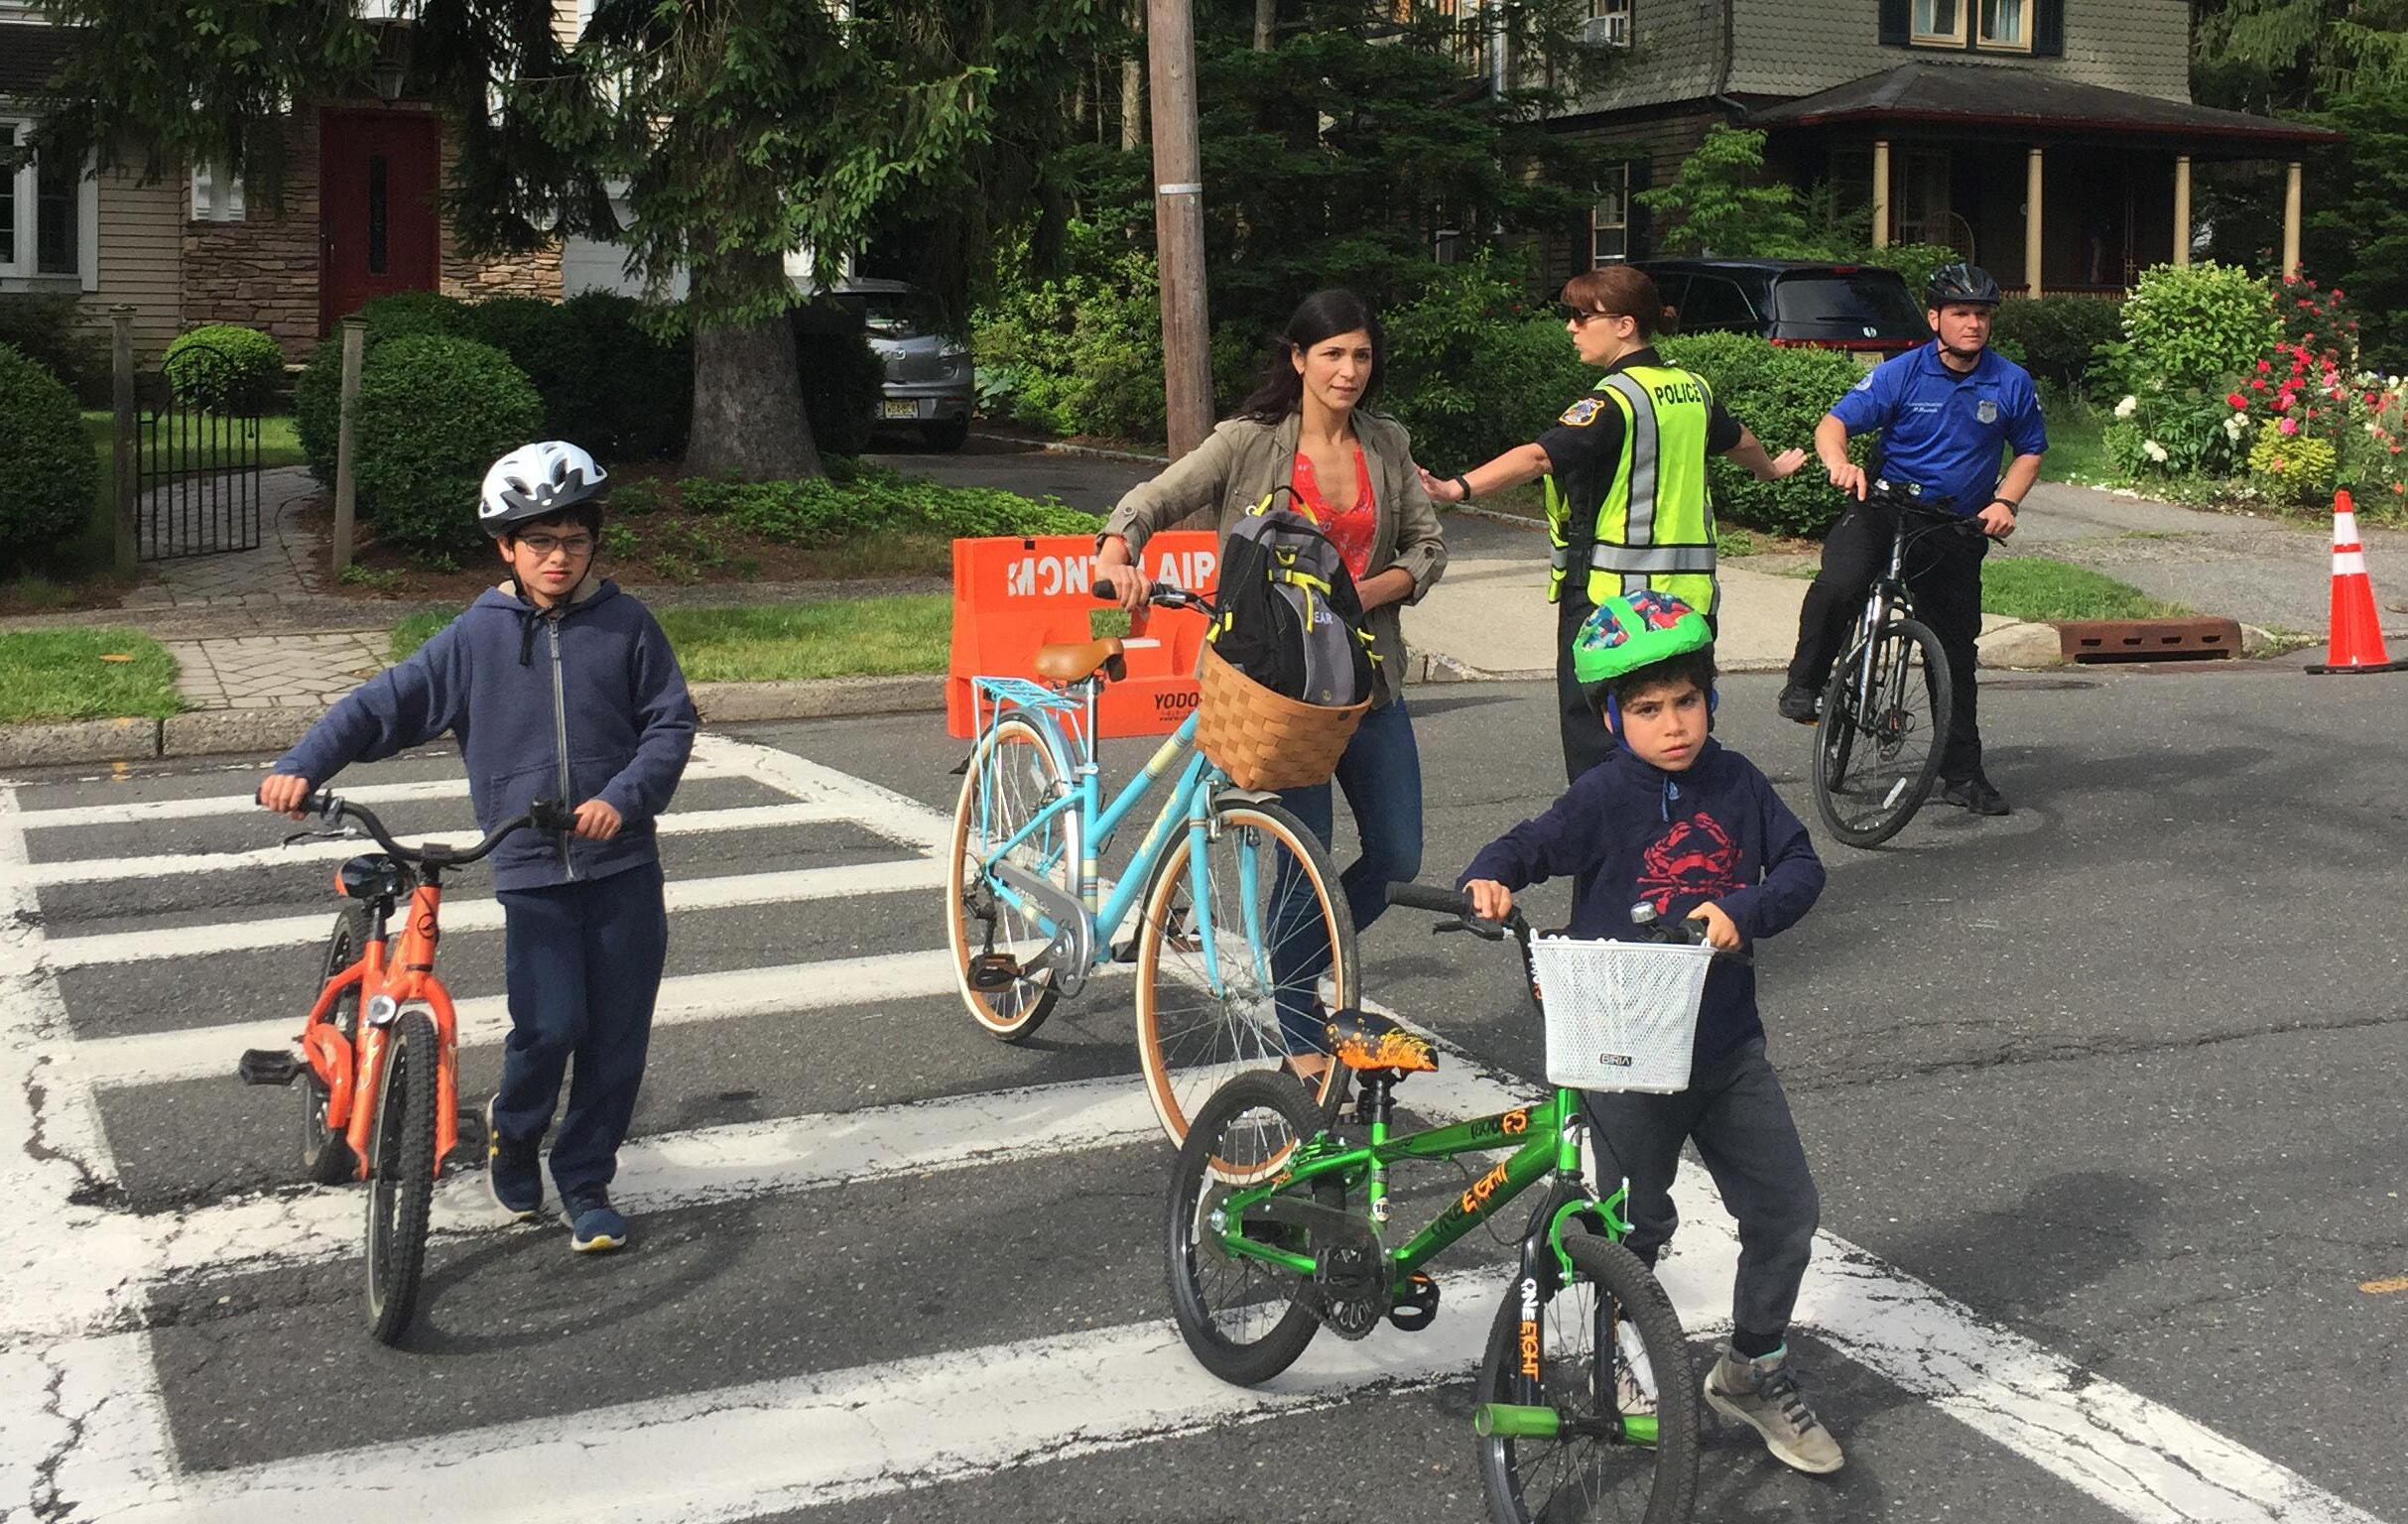
Montclair, Essex County
PUBLIC ENGAGEMENT was paramount in developing the NJTPA’s long-range Plan 2050. The NJTPA has conducted a series of accessible, inclusive, and interactive virtual public involvement activities to ensure Plan 2050 meets the needs of the region and its 7 million residents.
most frequently noted issues
Common Themes
l NORTH JERSEY RESIDENTS and workers want a reliable, e cient, responsive, and robust transit system. Improving, expanding, and connecting all types of public transportation was the highest-cited priority.
l NORTH JERSEY RESIDENTS and workers want more bicycle infrastructure for commuting, running errands, and recreation. A regional approach that enhances connectivity is highly desired.
l NORTH JERSEY RESIDENTS and workers want to feel safer when walking, and want more and better connections across communities.
l TRANSPORTATION POLICY and investments should
on a regional scale to increase equitable
and enhance overall connectivity.
Advisory Committee, a group made up of a broad cross-section of leaders from organizations that work with different demographic groups across the region to ensure outreach was inclusive and accessible.
Stakeholder Advisory Committee
The committee was created to help refine Plan 2050 public involvement approaches and to help vet outreach efforts and ideas, particularly related to youth, older adults, and women, as well as racially and ethnically diverse, foreign-born, limited English proficiency, disabled, and low-income populations. The group also promoted outreach activities and co-hosted larger outreach events. The committee met three times (August 2020, October 2020 and January 2021) and also provided input via email.
Participating organizations included:
¡ Age-Friendly Englewood
¡ La Casa de Don Pedro
¡ Statewide Hispanic Chamber of Commerce of NJ
¡ Statewide Independent Living Council
¡ New Jersey Bike & Walk Coalition
¡ Disability Rights New Jersey
¡ Project Self-Sufficiency
¡ New Jersey Alliance for Immigrant Justice
¡ New Brunswick Tomorrow
¡ United Way of Northern New Jersey
¡ Tri State Transportation Campaign
Website
The formal public involvement process began with the launch of the Plan 2050 website in September 2020. In addition to spotlighting the quick online survey, residents could find relevant reports, meeting times, and additional information about Plan 2050 and the importance of public input. The website was also available in Spanish and had a plug-in for visitors to translate the website into other languages. The website featured a Partner Resources page with public event flyers, a printable copy of the survey, sample social media posts, and materials in five additional languages.
Survey
In concert with the website, a short online survey was released. Nearly 2,200 people completed the survey, either online or by submitting a paper copy. The
survey asked questions about transportation improvements needed in the region, the modes of transportation most likely to be used in the future, and important transportation factors that help people decide where they want to live and work. These questions helped to give a snapshot of what residents are most concerned about regarding transportation. There was also an open-ended question that allowed participants to share their concerns or ideas about transportation. The survey results are included in Appendix D.
Social Media
In September 2020, the NJTPA began promoting Plan 2050 on its Twitter, Facebook, LinkedIn, and Instagram social media channels. Social media content consisted of a variety of posts that advertised the virtual events, the survey, website and the TPA Tuesday symposium series. A promotional video was created to provide a brief overview of the long range plan and encouraged people to share their ideas. The video was produced in English and Spanish. It was posted on the plan website and shared on social media. The NJTPA used paid, targeted social media ads to encourage North Jersey residents and employees to take the survey and attend virtual events.
Virtual Public Meetings
Twelve virtual outreach events were held between September 2020 and February 2021. Public meetings conducted early in the outreach process focused on gathering general perceptions about North Jersey’s transportation system. The second round of public meetings included more targeted discussions about areas of particular concern identified in the firstround meetings and survey responses, as well as potential solutions to the issues. The public meetings were advertised via email, on social media (in English and Spanish), and public access television, as well as through partner agencies and community organizations.
Round 1 Public Meetings
The first round of outreach consisted of six virtual public meetings conducted at varying times—one morning, one midday, two evening, and two on a Saturday—between September 30 and October 8, 2020. One of the meetings was conducted entirely in
Online survey, symposia and virtual events.
Spanish. The meetings were one-hour each and held via Zoom. Each event began with an overview of the NJTPA and Plan 2050. Attendees then moved to breakout rooms for facilitated interactive discussions. In the breakout rooms, attendees discussed what has changed in the past 30 years, what they would like to see change in the next 30 years and what they would like to stay the same. They were also encouraged to share their vision for the future of transportation. Expanding transit to increase mobility options and connectivity was a popular topic in the breakout rooms. The discussions also touched on improving and increasing transit accessibility, particularly for populations who live in underserved or outlying areas, low-income populations, people with disabilities, and the elderly. Many participants said they would like to see more bike and pedestrian improvements integrated into transportation projects.
Round 2 Public Meetings
A series of six “Let’s Talk! Transportation” virtual listening sessions were conducted between January and February 2021 to further discuss solutions to the transportation issues identified in the first phase of
outreach. Three of the “Let’s Talk” sessions were topic-specific and co-hosted with partner organizations:
¡ January 29, 2021: Let’s Talk! Transportation & Business—The Statewide Hispanic Chamber of Commerce of New Jersey and the Asian Indian Chamber of Commerce
¡ February 4, 2021: Let’s Talk! Transit—Tri-State Transportation Campaign
¡ February 2, 2021: Let’s Talk! Bicycle & Pedestrian Safety—City of Jersey City and the New Jersey Bike & Walk Coalition
These sessions began with a short presentation by the partner organizations. After the presentations, attendees were led into breakout rooms. The Let’s Talk! Transportation and Business event was simulcast in Spanish, and Let’s Talk! Bicycle & Pedestrian Safety had the most attendees.
In addition to the three topic-based virtual listening sessions, there were three virtual open house-style sessions, during which attendees could visit virtual rooms to discuss a variety of transportation topics. When attendees joined the Zoom meeting, they were first given an overview presentation on the NJTPA and Plan 2050. From there, they had their choice of four rooms:
¡ Transit
¡ Bike/Pedestrian
¡ Freight, Rideshare & Competition for Curb Space
¡ General Transportation
Each room had a facilitator who asked attendees questions related to the room’s topic. An attendee could visit as many rooms as they wanted and could switch rooms at any time.
Strategic Partner Outreach
Outside of the virtual public meetings, NJTPA also attended regularly scheduled meetings of strategic partner organizations to gather additional input and get help in promoting the survey and outreach events. Many of the attendees advocated for a greater focus on improving intra-county public transportation, which could include improving and expanding bus service on weekends and to communities with limited service, as well extending rail transit to new areas. Participants also said that improving bicycle safety infrastructure would encourage people to bike rather than drive.
In addition to attending strategic partner meetings, the NJTPA identified key community stakeholders as potential public outreach partners. Outreach was conducted to community-based groups, statewide chambers of commerce, statewide aid organizations like United Way, schools, public housing authorities, and other anchor institutions that helped to disseminate outreach materials via social media, print flyers, and print surveys.
TPA Tuesday Symposiums
While the public meetings and Let’s Talk! virtual listening sessions targeted the general public, the NJTPA also hosted a TPA Tuesday symposium series to engage planning and transportation professionals, as well as advocates and other interested parties. The general public was also encouraged to attend these events, which were held via Zoom. Each symposium included a keynote speaker, panel discussion and questions from the audience. The recordings were made available on the Plan 2050 website.of
¡ Adapting to Change, held on October 6, 2020, focused on anticipating and adapting to unexpected changes. This symposium explored COVID-19
related impacts on transportation that could affect the future.
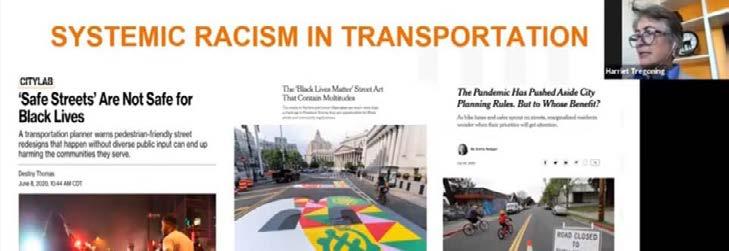
¡ Advancing Equitable Transportation Systems, held December 8, 2020, highlighted the legacy of racism and exclusionary policies and presented opportunities for advancing equitable transportation systems and investments.
¡ Realizing Opportunity Through Transportation, held January 26, 2021, explored how transportation drives North Jersey’s economy and discussed the importance of strategic transportation investments for the post-pandemic economic recovery and for the region’s economic expansion during the next 30 years.
¡ Connected and Automated Vehicles, held June 1, 2021, looked at these potentially transformational technologies, including assessments of the region’s readiness to support deployment, possible impacts on safety, and potential effects on logistics, transit, labor and business.
Bookmarks
Nearly 20,000 bookmarks advertising the online survey and hotline were sent to partner libraries, which distributed them at curbside or limited indoor pickups. Each bookmark had one side in English and one side in Spanish, as well as a QR code directing people to the online survey.
Virtual breakout room.
Specialized Outreach
In addition to general outreach, which was supported by consultants from McCormick & Taylor and Mercer Planning Associates, the NJTPA worked with Rutgers-VTC to develop specialized initiatives aimed at engaging traditionally hard-to-reach demographic groups.
Focus Groups
Focus groups included caregivers for seniors and people with disabilities; men and women re-entering society from the justice system; residents with limited English proficiency; and the unemployed.
Like the virtual public events, participants were asked about their transportation experiences—what challenges they face, what works well, what they’d like to change, how they use technology—and their visions for the future. Although the participants backgrounds varied, several common themes emerged across all five focus groups:
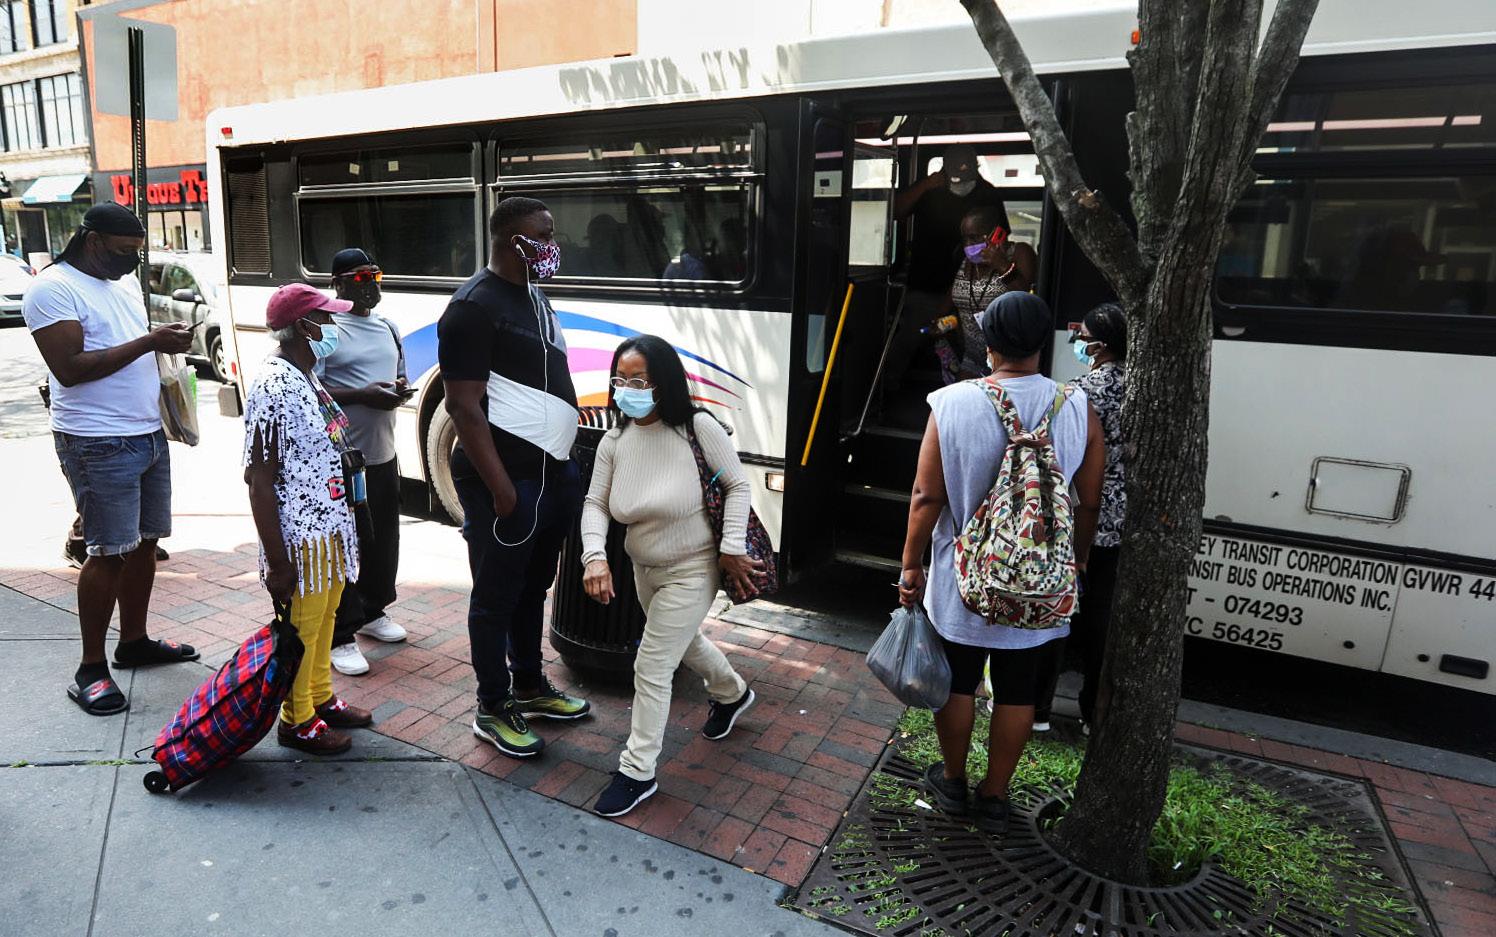
¡ Participants predominantly rely on buses for transportation. When buses run late, arrive early, or are full, it limits their access to jobs, services and opportunities. Participants blamed congestion for many of the bus delays, particularly during morning and evening rush hours.
¡ Better infrastructure, such as bus shelters, benches and lighting, and improved sidewalks would make
riders feel safer when waiting for or walking to buses, particularly on busy roads.
¡ Better communication is needed with customers, particularly when there is a change to fare payment options. During the pandemic, several riders said they were unaware about the shift to digital fare payment and those without access to a debit or credit card or smartphone were unable to use the technology.
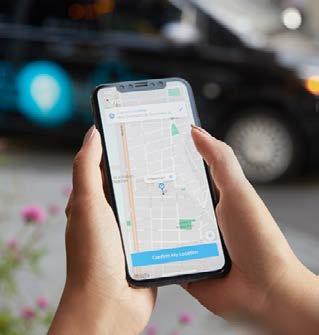
¡ Participants with access to smartphones said mobile apps that provide real-time public transit information, such as bus and train locations, and provide walking directions to stops are useful. However, they stressed that vehicle tracker locations must be accurate to help them plan their trips effectively.
NJTPA On Air
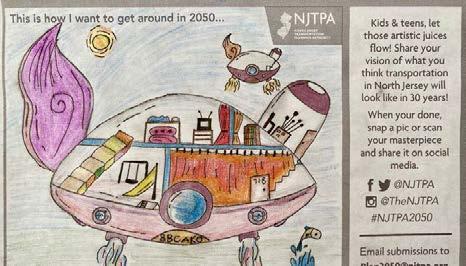
NJTPA On Air was first developed to engage children and teens as part of Plan 2045 outreach. The original activity consisted of a pop-up booth decorated like a radio studio in which participants recorded their ideas about the future of transportation. For Plan 2050, to comply with health and safety precautions during the pandemic, the radio booth was reimagined as a virtual multi-media contest. Participants watched a short video, shared on the website and social media, that provided the contest prompt: “What do you think transportation will be like in the future, say when you are your parents’ age?” Responses could be submitted using a variety of creative formats, including drawings, essays, videos, or poems. In addition to promoting the contest online, Rutgers VTC and NJTPA staff also reached out to schools, after-school programs, and community organizations that serve kids.
More than 150 children participated. Submissions included animated videos, diagrams of futuristic vehicles, stories about life in the future, rhyming poems, and even a puppet show about transportation.
A gallery of submissions is available at njtpa.org/ OnAir.
UpNext North Jersey
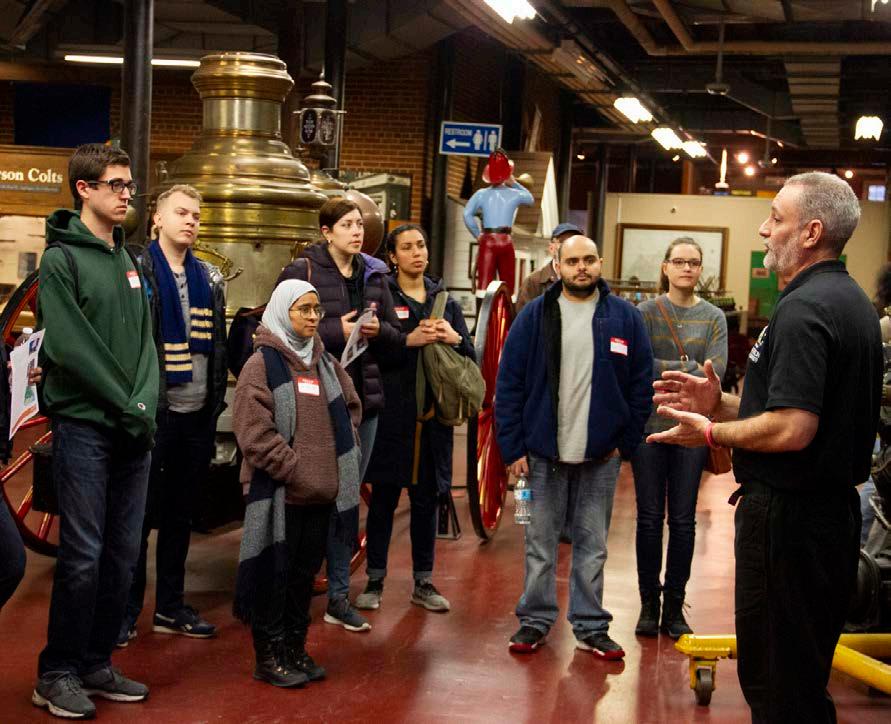
Five plan-related events were organized to engage members of the NJTPA’s UpNext North Jersey young adult advisory group. The group was created in 2019 to gather input from residents ages 18 to 30—a demographic that is traditionally underrepresented in public
Paterson Museum, Passaic County
ON AIR
outreach efforts—on a variety of NJTPA projects and programs. Due to the pandemic, in-person events were shifted to virtual. The events touched on considering game-changers—like the pandemic, technological advances and severe weather events—in long-range planning; the concepts of open streets and complete streets; and discussions around three background papers developed for Plan 2050: Active Transportation in the NJTPA Region, Transportation Technology and Climate Change and Transportation. As part of the outreach activities, members participated in an Active Transportation Challenge, during which they walked or biked to a destination they would normally drive to. They reported back on their experiences and ways to improve walking and biking on the routes they traveled.
The plan-related outreach events included:
¡ Planning for the Unplanned, April 16, 2020
¡ Open Streets, June 18, 2020
¡ Active Transportation, September 24, 2020
¡ Equitable Smart Mobility, December 17, 2020
¡ Ask a Climatologist, January 21, 2021
Full summaries of the events and feedback provided are available in Appendix D.
Incorporating What We Heard
As highlighted above, public outreach for the Plan drew a diverse group of residents and workers from across North Jersey. Several common themes emerged, which are reflected throughout this plan:
¡ Improving, expanding and better connecting public transportation should be a priority.
¡ Public transit should be reliable and efficient.
¡ There needs to be better bicycle and pedestrian infrastructure to connect to public transit and destinations, such as downtowns and recreational trails.
¡ Transportation improvements need to be made equitably to improve accessibility and enhance overall connectivity.
Although in-person outreach was restricted due to public health guidelines, more than 2,500 people provided input for Plan 2050 through an online survey, participation in events, and the children’s activity. As a result, this Plan effectively responds to the daily transportation challenges shared by the region’s residents and reflects their vision for the future over the next 30 years.
Context &Trends
THIS CHAPTER SETS THE FOUNDATION and context for informed decision-making to address the challenges facing the region and to shape its future. Population shifts, job growth, economic development and environmental concerns are among the many factors that will impact our region’s transportation network over the next 30 years. Forecasts anticipate there will be an additional 1 million people and 300,000 jobs in the region by 2050. Appendix E details these forecast changes. ■ These forecasts and others in this chapter are based on data that predates the COVID-19 pandemic; however, this plan assumes that the region will largely recover to pre-pandemic growth levels after a five- to 10-year setback. In relying on that data, this plan recognizes many of the forces that drove previous trends will reassert themselves as the region recovers, though efforts must be made to reshape or redirect these trends for the benefit of the region.
Orange, Essex County
Population
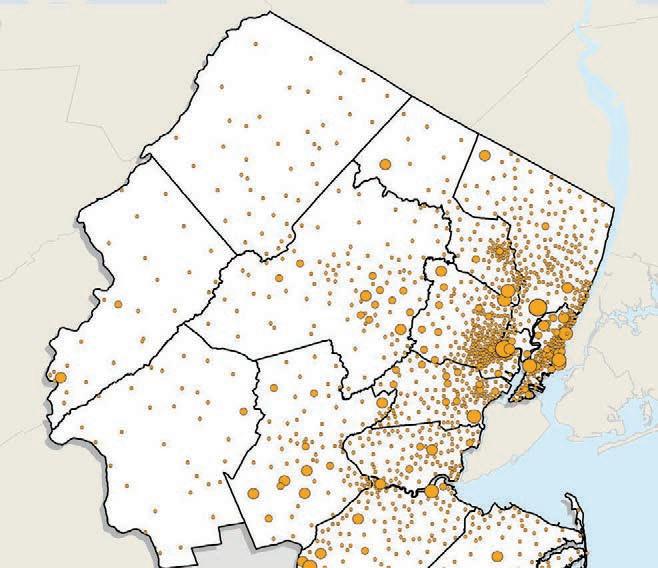
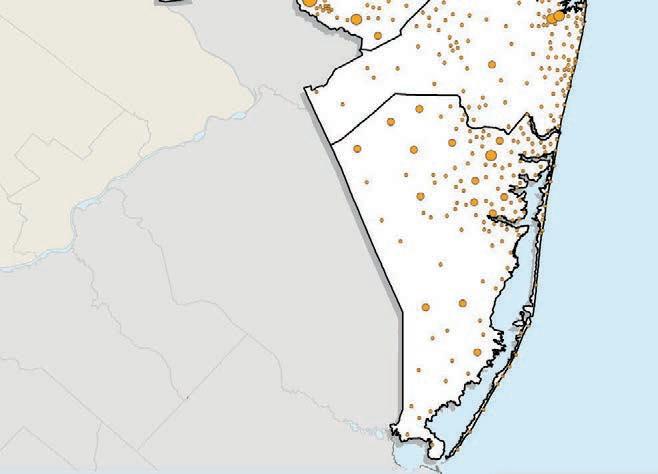
The NJTPA region is home to nearly seven million people. Initial decennial Census figures released in spring 2021 show that New Jersey’s population increased 5.7 percent from 2010 to 2020. Previous estimates by the Census Bureau for the North Jersey region had suggested more gradual growth than this, so a more complete understanding of population trends over the past decade will require further analysis.
The region’s attractiveness—its distinctive communities, vibrant culture, historic and natural resources, and position in one of the world’s most vital markets —fuels population growth. Lower international
Source: NJTPA, 2016; Esri, 2017
migration and population loss to elsewhere in the country, slows it. Overall, the region’s population is forecast to grow 15 percent to 7.7 million people by 2050 (Figure 3-1).
During the strong economic growth in the rebound from the great recession of 2008, many urban areas and denser downtowns experienced population growth, as well as increased office and other development that previously had been occurring in the suburbs. Factors influencing this trend included younger adults’ preferences for urbanized locations with more entertainment and social opportunities and the attractiveness of places with easy walking, biking, and transit access. Jersey City benefited from these factors as did Newark and Elizabeth after years of suffering population declines. The trend also boosted growth in places with good access to New York City like Harrison and Secaucus and transit towns like Madison and Boonton.
At the same time there were some countervailing trends, with millennials beginning to raise families and seeking out suburban homes, and rising housing costs driving people away from sought-after denser locations. There’s also been a growth in retirement communities, with more people choosing to age in New Jersey.
The pandemic has caused a dramatic break inthese and otherregional trends including the housing market (see sidebar p. 31).The extent to which this will alter future growth trends has become the subject of much discussion, with great stakes for the economy.Symposia and other outreach events for this plan helped highlight some of the following considerations:
¡ With companies realizing cost savings, many employees enjoying the flexibility of remote work and continuing concerns about social distancing, dependence on large central offices will likely decline, possibly driving continued suburbanization and leading to rehabilitation of aging suburban properties as remote satellite offices.
¡ The strength of the previous “back-to-cities” trend, which transformed many downtown and urban areas with large investments from major companies, suggests that it will not be quickly abandoned and will continue to draw population and jobs to denser areas.
Figure 3-1:
Population Growth Forecast 2015-2050
Push and Pull from Denser Areas
Escape the worst of tra c congestion
Travel options—driving, walking, transit
Better schools, nature and recreation
Companies want access to talent, customers
Culture: music, dining, art
Cheap land for development, lower taxes
Short commutes, convenience, close shopping
Downsizing by empty nesters
Home prices rise in dense areas
Millenials want hip locations, entertainment, socializing
Millenials start families
Opportunities for walking, biking, transit
Socially distant living arrangements
Safer driving—no buses, trains
Shift away from Central o ce to distributed job sites
More room for remote work
Lower urban rents for apartments, retail space
¡ The discovery or rediscovery of walking and biking andstreet lifeby many people during the pandemic will strengthen the appeal of complete streets and the attraction of walkable/bikeable neighborhoods.
¡ Greaterrecognition of the need to redress the effects of past racial discrimination and the harms caused by income inequality—including impacts on lowwage essential workers—will prompt more effective government and corporate activities to help distressed communities and to bolster their population growth.
As these and other possible futures take shape— driven mostly by the market but also influenced by public policy and investment decisions—the region’s population is projected to continue its growth. However, the composition of the region’s population will change, including:
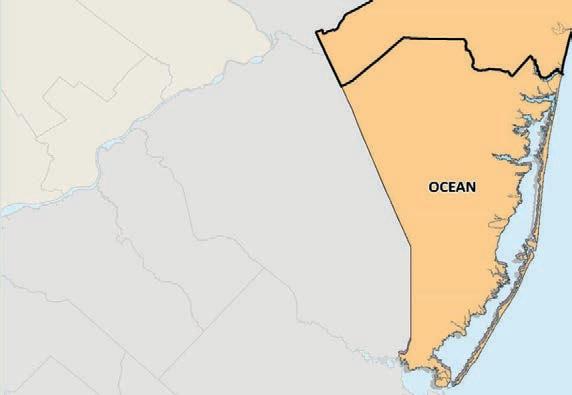
Aging population: In the short time frame between the 2010-2014 American Community Survey (ACS) and the 2015-2019 ACS, the NJTPA region saw the share of residents older than 54 years of age increase from 26 percent to 29 percent. (Figure 3-3) Ocean County has the highest concentration of seniors 65 or over at 22 percent. The aging population
Figure 3-2
KIM HAN
3-4:
contributes to slower population growth (with fewer children born per capita) and will require special transportation services and housing accommodations.
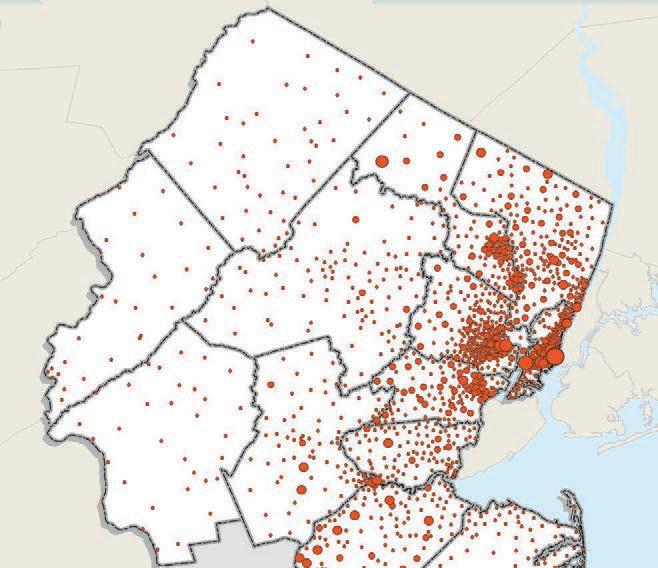
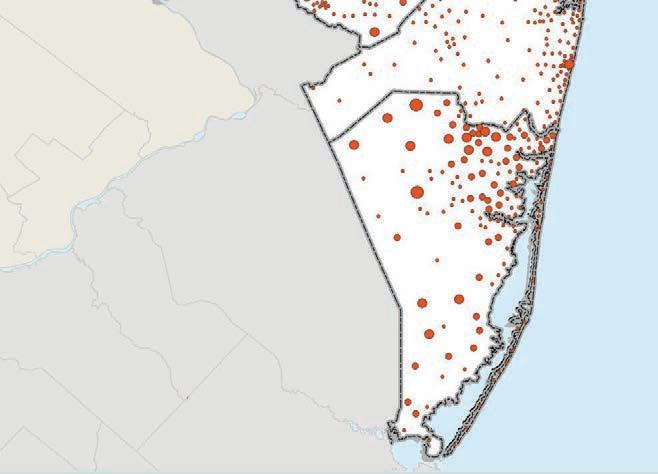
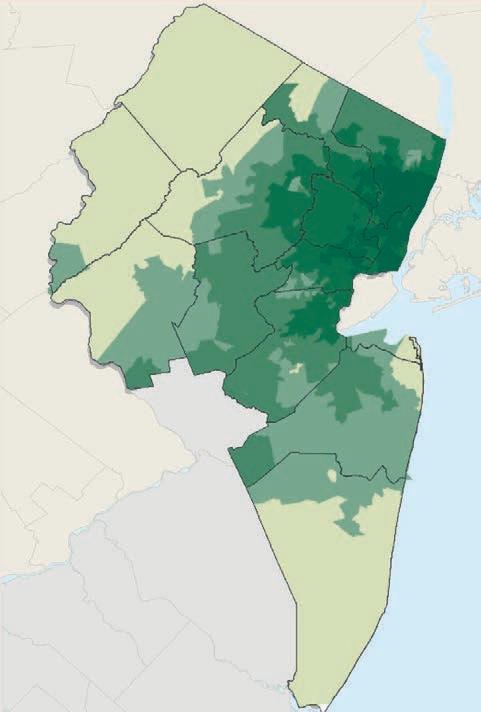
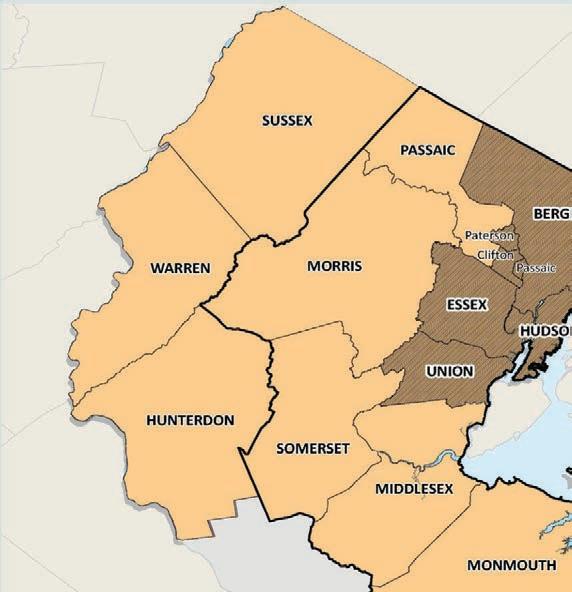
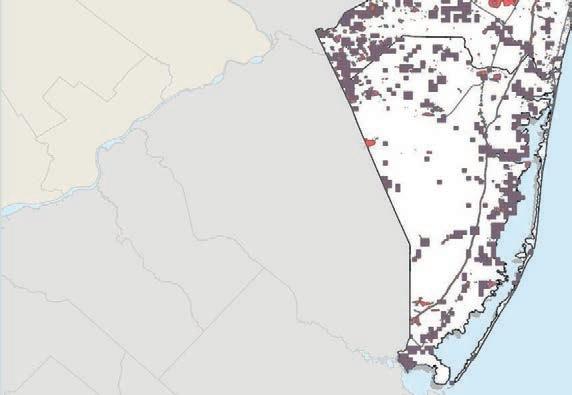
More Diversity: Mirroring national trends, the region’s population is increasingly composed of racial and ethnic minorities (principally Asians, Blacks and Latinos). Minorities are more than half the population in five counties (Figure 3-4). Minority populations historically have had lower incomes and been concentrated in urban centers—though this is changing. These residents also rely more on transit for day-today mobility, raising equity concerns that have been brought into stark relief during the pandemic.
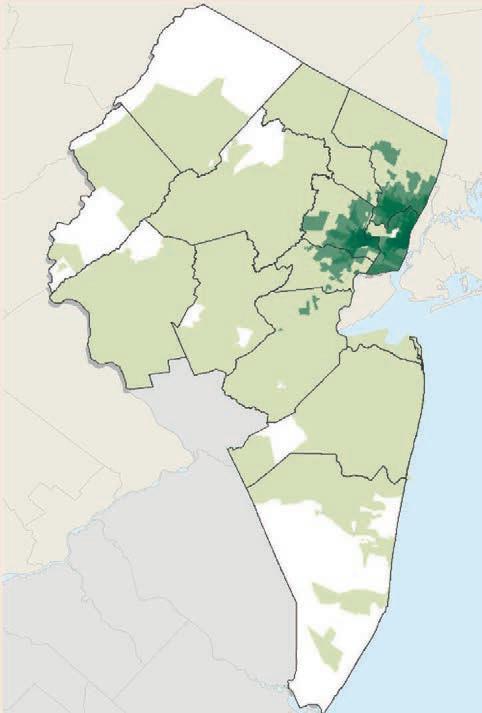
Immigration: Immigration has two components, domestic and international immigration. Except for Ocean County, the past decade has seen the region lose population to other regions of the U.S. However, New Jersey continues to attract immigrants from other countries (Figure 3-5). While international immigration declined recently due to changes in immigration policy and the impacts of the pandemic, this population is expected to grow again in the future as federal policies change. According to one estimate, New Jersey had the fifth largest immigrant population among states in 2015. Like minority populations, many of these immigrants have low incomes and depend on transit for daily travel needs.
Economic / Employment Trends
The current downturn accompanying the pandemic has caused considerable uncertainty for the region’s economic future. However, in tandem with anticipated population growth, this plan looks toward an economic recovery over the next five to 10 years and resumption of prior economic growth rates. Overall, employment is forecast to grow 9.7 percent to 3.4million jobs by 2050 (Figure 3-6).
The region’s employment and Gross Domestic Product—defined asthe value of the goods and services produced—increased substantially from the 2008 recession through 2019. The region was slower to recover in comparison with other places in the country, adding 405,600 jobs from February 2010 through February 2020, a recovery rate of 10.6percent compared to the national recovery rate of 17.6percent, according to a Rutgers University analysis.
Figure 3-3: NJTPA Region: 5 Year Age Comparison
Figure
But the pandemic brought a steep and dramatic decline. The state lost 717,200 jobs by April 2020— almost twice the number it had gained in the previous ten years—and by the end of April the unemployment rate had jumped to 16.6 percent (slightly higher than the national unemployment rate of 14.8 percent), from an unemployment rate of 3.7 percent in February 2020. However, the state gained back 54 percent (384,500) of the jobs it lost by March 2021, which is lower than the national recovery rate of 62 percent as of March 2021.
This plan assumes there will be a reassertion of previous growth trends but with changes likely in how and where growth occurs.
Shifting Growth Patterns
From 2017-2019, job growth was centered in urban core areas such as Hudson and Union counties, but Ocean County also saw an increase. Jobs grew by more than 5 percent in those three counties, while no other county had more than 3 percent job growth. Lower job growth trends in urbanized counties such as Bergen and Passaic and rural counties such as Sussex and Warren may change following the pandemic. Notably, Bergen’s American Dream retail and entertainment complex and expected expansions in hospitals and health care will add to regional jobs. Health care has been one of the largest drivers of job growth in the region overall, with over 400,000 people employed in this sector.
But suburban and rural areas could draw growth from more urbanized parts of the region if companies restructure operations around remote work on a large scale and reduce reliance on central offices. A resulting spread of growth more widely throughout the region may lessen congestion caused by traditionally high peak hour commuting volumes but could lead to problems associated with sprawl.
Many downtowns also rely on office workers for daytime commerce and may suffer if operations move. Other factors in the long-term such as wide availability of automated vehicles could also drive renewed sprawl.
Rather than reacting to issues as they arise, the region now has an opportunity to shape trends. Prior to the pandemic, corporate leaders recognized the value of downtowns and walkable areas including
Flemington, Hunterdon County
Pandemic Housing Changes
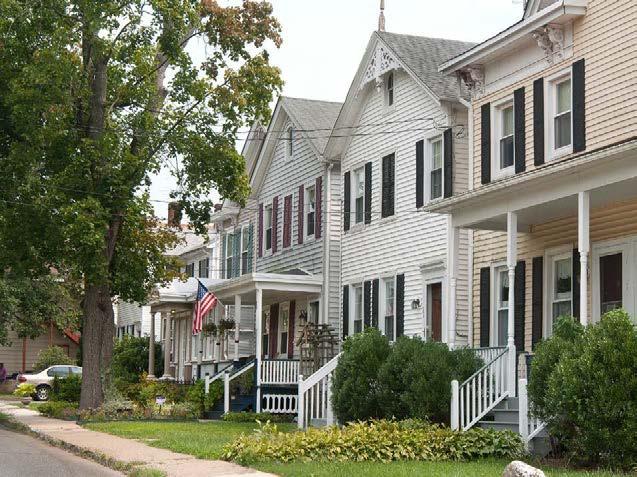
With the start of the pandemic, many people were immediately locked into their locations, which in many cases turned into workfrom-home facilities — the case for up to 60 percent of workers. As the months wore on, many families looked to change their living circumstances. Property values and sales activity jumped in suburban and rural areas, particularly as families sought more space for school- and work-at-home activities. However, this was largely confined to families with the income to a ord the extra expenses of home purchases and moving. Many homeowners in these areas suddenly found their homes worth much more and have been enticed to upgrade their housing, downsize to condos or move elsewhere. At the same time, in denser urban areas, apartment rents declined and home sales slowed.
Source: 2019 Census Population Estimates
providing opportunities for creative collaboration and proximity to customers and business partners. This plan, in Chapter 5, points to a variety of strategies that can help channel development and land use into sustainable forms, such as supporting mixed-use development near transit stations. Programs such as complete streets and transportation demand management can reduce vehicle trips and provide travel alternatives throughout the region.
Creating the future this plan envisions requires more than transportation policies and investments. The work of Together North Jersey, NJTPA subregions and non-profits—such as New Jersey Future and Transportation Alternatives—is helping coordinate
Source: NJTPA, 2016; Esri, 2017
improved transportation access with housing, arts, health, environmental and other policies. Attracting and retaining younger workers who favor walkable locations is particularly important, not only for employers but as the foundation for future economic growth and progress.
Changing Jobs
Over 300,000 people work in retail, one of the region’s largest employment sectors, especially for lowskilled workers. Retail employment has been declining in recent years, a trend now compounded by the pandemic, which saw a massive shift to e-commerce. Online shopping grew 32.4 percent in 2020,
Figure 3-5: County Change in Population 2018 and 2019
Figure 3-6: Employment Growth Forecast 2015-2050
representing 21.6 percent of total sales, up from 17.8percent in 2019. This is challenging downtowns and accelerating widespread reduction in mall shopping.
While job growth in other sectors will help ease some of this decline, it likely will not completely make up for it. Repurposing of malls and shopping centers will clearly become a larger issue during the next decade, with vacancies and disuse settling in. Plans to add residential, office and entertainment venues to the Monmouth Mall and the Garden State Plaza are examples of such repurposing. These shifts could create new transportation demands at these locations, with residences contributing to peak rush-hour traffic. Also, while e-commerce reduces shopping traffic, it places more trucks on the road and reshapes other freight movements.
In many respects, accelerated e-commerce is already reshaping New Jersey’s economy and land use. While the state has long been a center of distribution to the northeast consumer market, there has been a surge in distribution facilities. In 2020 alone, 61 buildings, totaling more than 20 million square feet, were added or under construction. Amazon is now a major employer in the state. Warren County is starting to see major warehouse activity in Philipsburg and along the I-78/US-22 corridor, as is western Monmouth County at the Mercer County border along I-195/NJ Turnpike Interchange 7A. This shift to e-commerce has pushed many jobs from traditional retail, often located near public transit, to more remote warehouse areas not well served by transit. This is evident in the growth of warehousing and logistics operations in southern Middlesex County and other places.
Consumer-driven demand for faster deliveries has pushed the burgeoning industrial real estate market to seek locations near population centers. Development of warehouses and related facilities to meet this need are contributing to sprawl, encroaching on scarce open space and bringing other environmental impacts. But it also has led to the clean-up and reuse of brownfields and prospects for investment in a variety of other neglected properties in urban areas. The rise of e-commerce has added to the volume of goods handled through the North Jersey’s port and air cargo facilities, as discussed in Chapter 5.
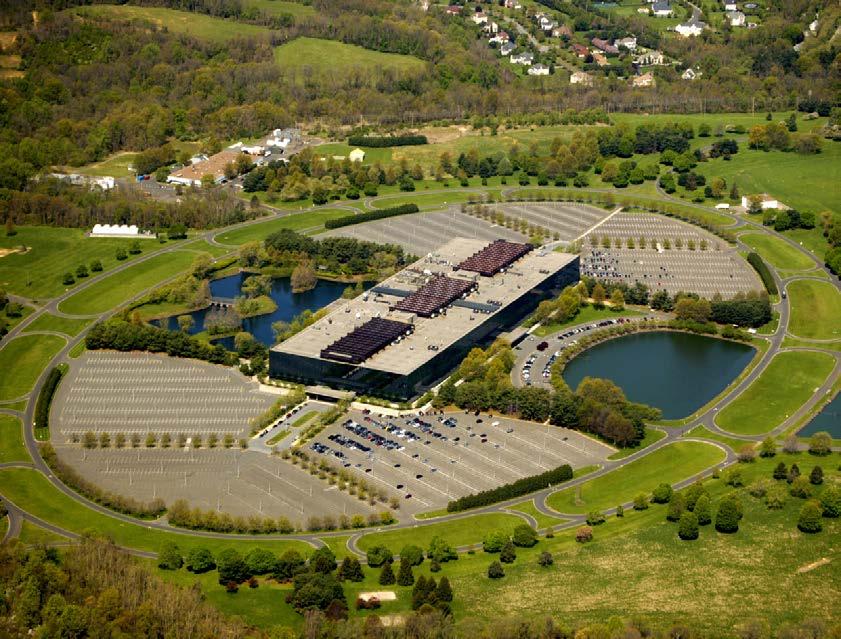
Over coming decades, the region must be prepared to adapt to shifts and changes in employment. After years of declines, manufacturing’s share of total employment has stabilized at 5 to 6 percent; however, this is still a low- to no-growth sector of the region’s economy. Among the major sectors of the economy with growth potential, as of 2019, are financial services with 222,000 employees; life sciences (including pharmaceuticals, biotechnology and medical devices) which employed 76,000 workers; and technology (including professional and technical services and information technology) employing 183,352,000 in 2019. Repurposing large campus style office complexes might help attract these businesses. For example, the Merck office complex in Hunterdon County was sold in 2018 to Unicom (the parent company of USRobotics), which created a science and technology park at the facility, and the expansive Bell Labs complex in Monmouth County has become Bell Works, home to dozens of small businesses.
In addition, the region’s economic fortunes are still very much tied to those of New York City and the larger metropolitan area. In recent years, 10 percent or more of the region’s working population has commuted to New York City. Investments in the Hudson River tunnels and larger Gateway program are needed to safeguard this crucial economic interdependence. But changes in work will likely alter commuting
Bell Works, Holmdel, Monmouth County
MATT BISANZ
Table 3.1
patterns for many people, placing greater importance on improving intra-regional transit and flexible travel options.
Despite this and other uncertainties about the future, the region has substantial assets on which to rebuild from the pandemic and support continuing
economic progress. These include an educated work force, good quality of life, a diverse population and extensive transit and highway facilities.
Income and Equity
New Jersey’s median household income, according to the 2014-2018 ACS, was the second highest in the nation. However, this is somewhat offset by a higher cost of living, estimated in 2020 to be 25 percent greater than the national average (ninth highest).
Even with a higher-than-average median income, about one-tenth of the residents in the region live in poverty (Table 3-1). Poverty rates are highly correlated with race. The counties with poverty rate exceeding the statewide average all have substantial minority populations.
New Jersey’s income disparities mean large numbers of residents face limited life choices. Low income and minority residents often live in substandard housing in communities with greater crime and struggling schools. They have less access to healthy food and face a host of disadvantages compared to wealthier locations. The pandemic has exposed and worsened these disparities, with these residents suffering greater economic hardship. Many have had no choice but to continue to travel to service jobs as essential workers while higher income workers work from home. Disease impacts were also unequal, with Blacks, Latinos, and Native Americans experiencing hospitalizations at rates 4.5 to 5.5 times higher than non-Hispanic whites, according to the federal Centers for Disease Control.
These disparities are rooted in the long legacy of racial discrimination which was institutionalized through such practices as redlining in the real estate industry, unfair hiring practices and unequal access to quality education and other resources. Protests against racial injustice during 2020 have sparked a reexamination of this legacy, its persistent impacts and steps needed to address them.
The transportation sector too has a history of discriminatory practices and disparate impacts. This includes past policies such as transportation investments favoring suburban communities, leaving many urban communities to bear disproportionate effects of cut-through highways dividing neighborhoods, limited
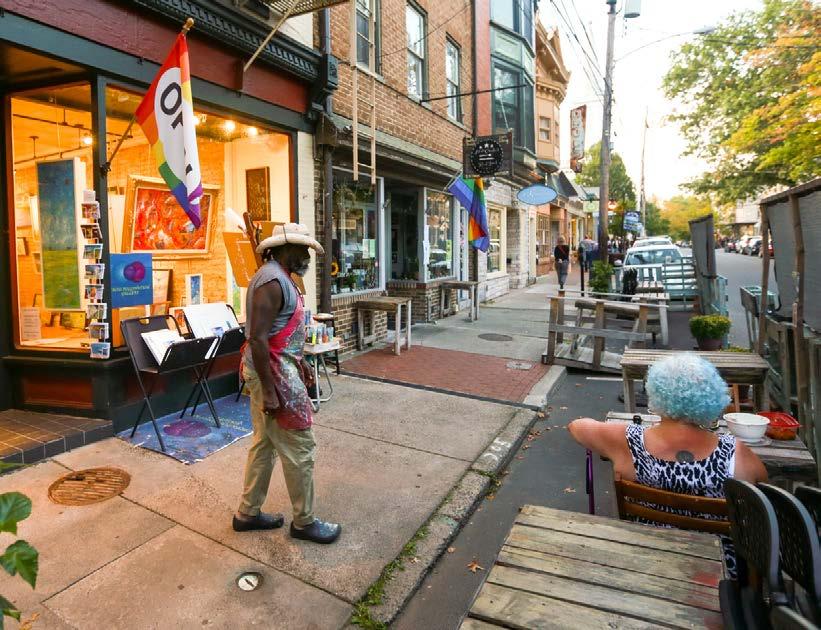
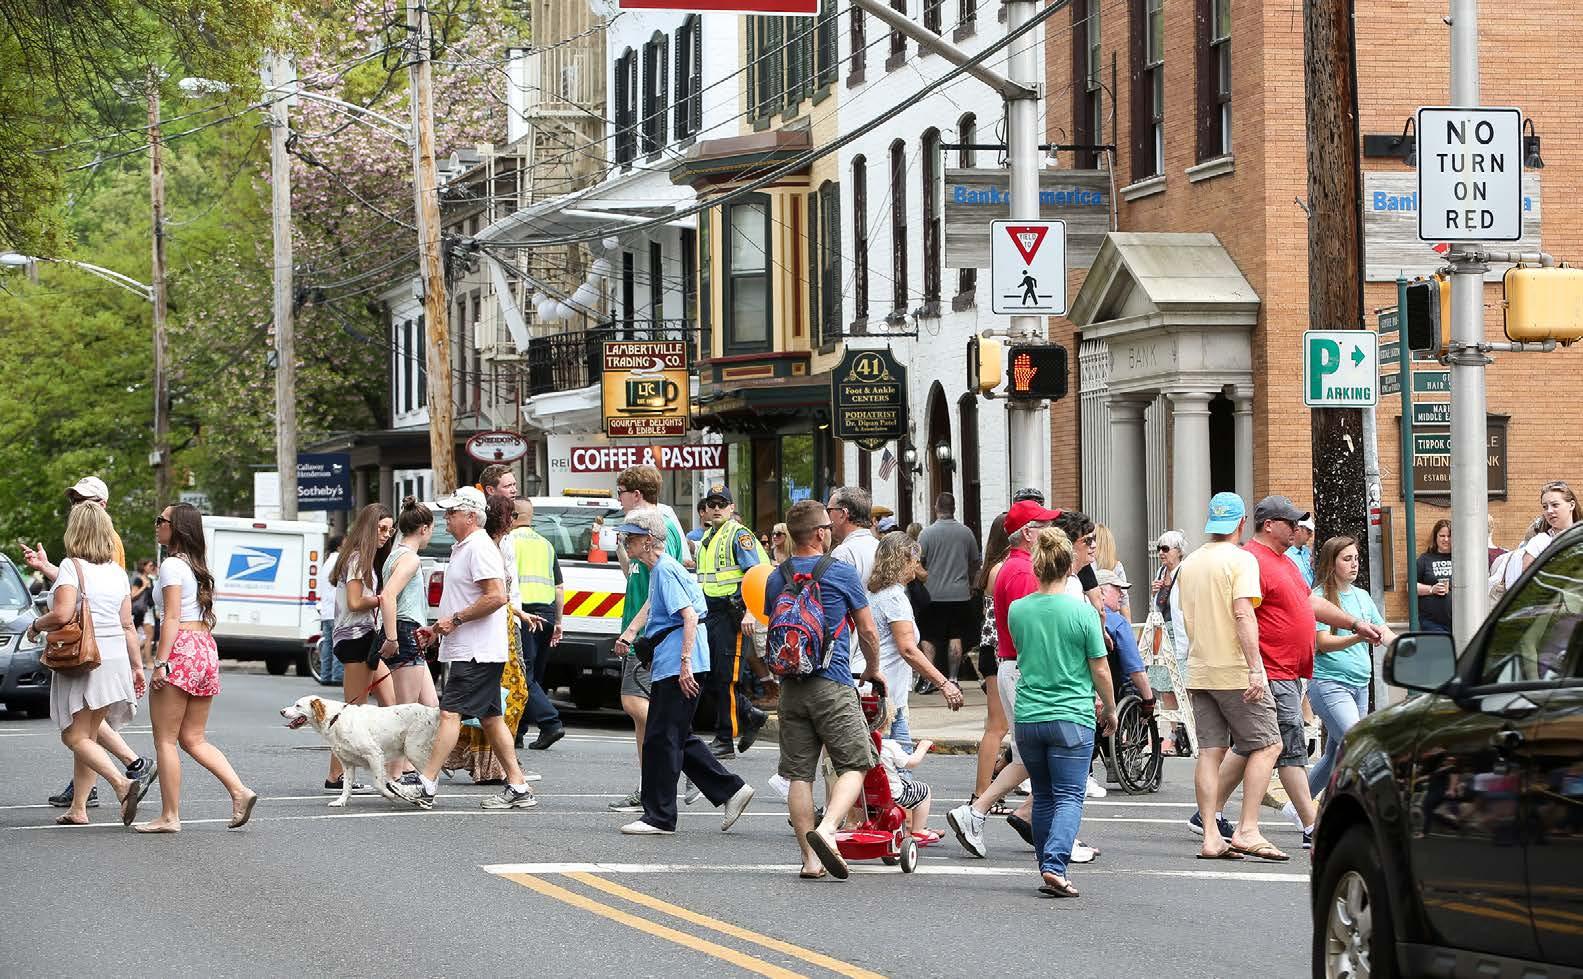
Lambertville, Hunterdon County
transit and access to jobs, and pollution from heavy truck traffic. The NJTPA, through this plan, is joining with its subregions and partner agencies to support more equitable investments and remedies for impacts of past policies. Of particular concern is providing improved access to employment, including jobs in the burgeoning distribution sector and other industries, as discussed in Chapter 5.
Environment
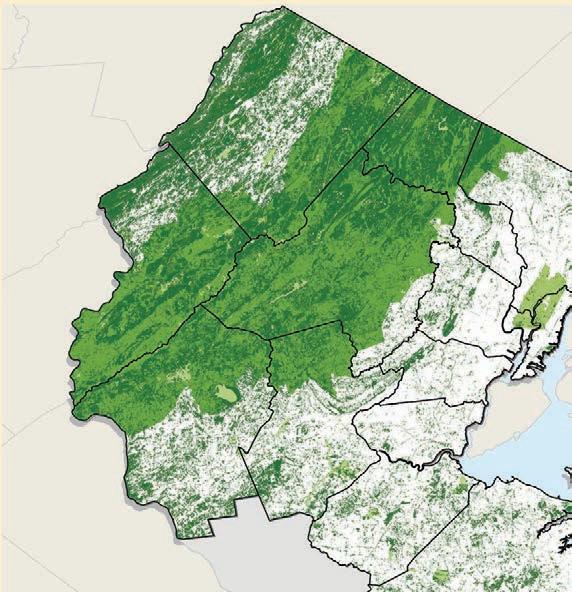
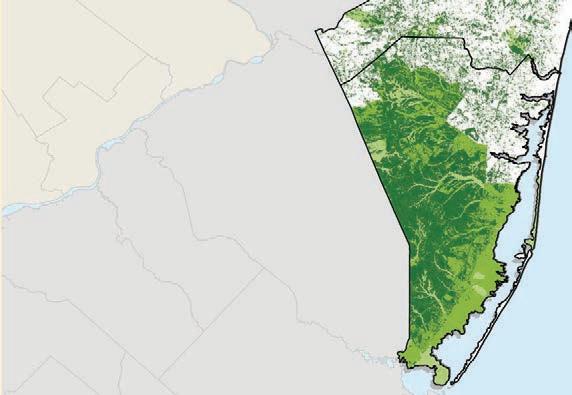
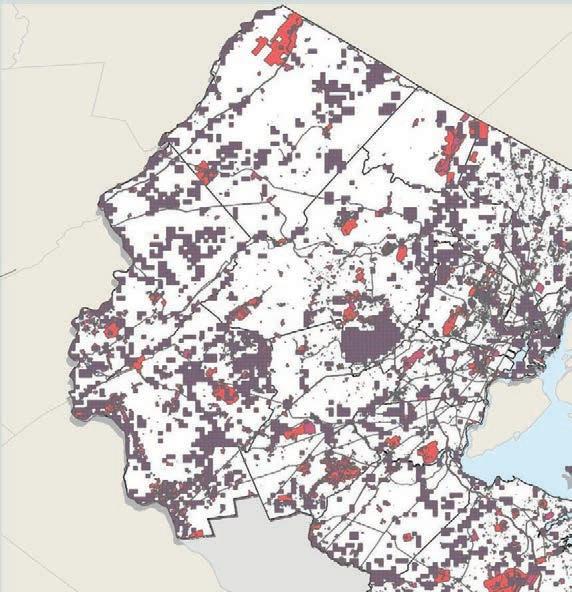
This plan includes a separate chapter (Chapter 6) focusing on environmental issues and the NJTPA’s responses, including addressing climate change impacts and threats. However, the environment is very much a part of the context for long range planning discussed in this chapter. In brief, New Jersey is the most densely populated state in the nation, and North Jersey includes the state’s most densely populated counties. Even so, much of the region is undeveloped, with large expanses of open space, including forests and preserved areas, parks, wetlands and farmland. Much of the undeveloped land is included in three special planning districts—the Highlands, the Pinelands, and the Meadowlands.
These preserved lands are important, not just as natural resources and wildlife habitats, but as part of
the systems for recharging aquifers, ensuring water quality for residents, and to help counteract heat and poor air quality impacts of climate change. Identifying and preserving important natural resources helps focus growth in areas where infrastructure, including transportation facilities, can support it. How land is developed is a key determinant of the type and quality of transportation options available to residents. As
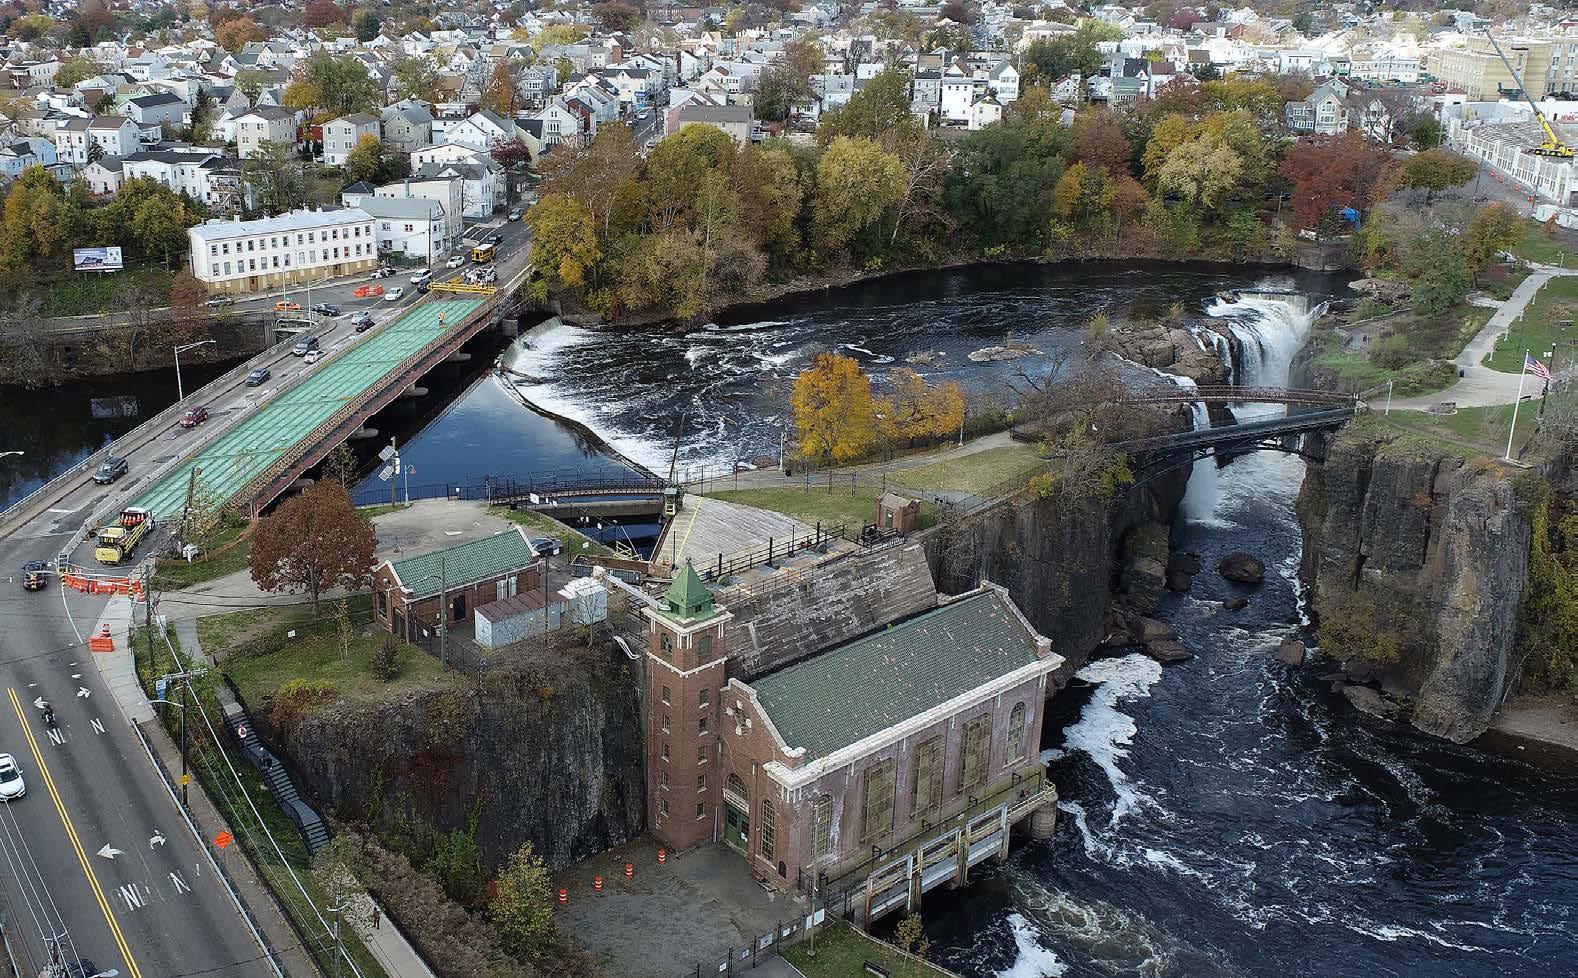
Paterson, Passaic County
Figure 3-7:
Figure 3-8: Pathway to 2050: Greenhouse Gas Emissions Called for in 2020 New Jersey Global Warming Response Act 80x50 Report
The 2019 Energy Master Plan combined with non-energy strategies, and carbon sequestration (not shown) have the potential to reduce net emissions below the 80x50 target prior to 2050.
noted, NJTPA planning and programs help support development in forms and locations that offer travel alternatives, reduce trips, and minimize environmental impacts.
In addition, a variety of environmental factors must be considered in the transportation project development process, as required under the National Environmental Policy Act (NEPA). The NJTPA also has a direct role in air quality planning and oversight through the air quality conformity process. This
process has supported steady improvement in air quality throughout the region (Figure 3-7).
Increasingly, the NJTPA is also involved in efforts to combat climate change, including supporting the state’s targets for reducing greenhouse gas emissions by 80 percent by 2050 (Figure 3-8) and adapting infrastructure to be resilient to climate impacts. These and other efforts guide this plan and the NJTPA’s contributions to broader regional progress as it focuses on transportation challenges through 2050.
Source: NJ Global Warming Response Act 80x50 Report
TRENDS 7.7M PEOPLE
Work
PEOPLE IN 2050 POPULATION
EMPLOYMENT
3.4M jobs in 2050
3.4M jobs in 2050 Up from 3.1M in 2019
2050 Up from 16% in 2019
% over 65 years old in 2050
Up from 3.1M in 2019
PORTATION M ODE
Work
SOURCE:
Work
SOURCE:
OCCUPANT VEHICLE
VEHICLE
72% vs. 80% national average
average
from 16% in 2019
18% over 65 years old in 2050
18% over 65 years old in 2050
Up from 16% in 2019
Up from 16% in 2019
47% of the population are minorities in 2019 as compared to 36% in 2000
DIVERSITY
47% of the population are minorities in 2019 as compared to 36% in
47% of the population are minorities in 2019 as compared to 36% in 2000
FREI GHT
TONS IN 2050 431M Up 16% from 372M tons in 2020
FREI GHT TONS IN 2050 431M
BREAKDOWN OF HOW IT MOVES 78% by truck 14%
144 drivers; 96 passengers; 109 pedestrians; 12 cyclists Up from 6.7M in 2019
vs. 5% national average
14% vs. 5% national average
OR BIKE
TRANSIT 14% vs. 5% national average FOOT OR BIKE
% vs. 3% national average
OR BIKE
4% vs. 3% national average
4% vs. 3% national average
OCCUPANT VEHICLE 8% vs. 10%
HIGH OCCUPANT VEHICLE
8% vs. 10% national average
HIGH OCCUPANT VEHICLE 8% vs. 10% national average
CRASH DATA (2019)
CRASH DATA (2019)
CRASH DATA (2019)
CRASH DATA (2019)
CRASH DATA (2019)
219,000
219,000
219,000
MOTOR VEHICLE CRASHES IN THE NJTPA REGION
219,000
219,000
219,000 MOTOR
MOTOR VEHICLE CRASHES IN THE NJTPA
361
361
361
361
361
Transportation System Performance 4
THIS CHAPTER LOOKS AT how well the transportation system serves the residents, visitors, and businesses that rely on it. Understanding system performance is a critical step towards identifying strategies and investments to improve the system and reach the region’s economic, equity, environmental and other goals. ■ The extensive public outreach for this plan, described in Chapter 2, provided insights into transportation system performance from the perspective of users. The NJTPA also employs a wide-ranging set of benchmarks and data to measure other aspects of transportation system performance. Many of these are national measures, established in federal regulations. MPOs, state departments of transportation, and transit agencies are required to regularly use the measures to track progress toward short-term performance targets relating to critical aspects of safety, congestion, air quality, and the condition of highway and transit infrastructure. The
Bound Brook, Somerset County
NJTPA works with NJDOT and NJ TRANSIT to analyze data and set performance targets for the region. The national performance measures are listed in Table 4-1 and discussed in Appendix B, the NJTPA System Performance Report. The NJTPA uses additional measures to supplement and provide regional context
to national measures, particularly in the areas of: livability; natural environment and resiliency; freight and economy; infrastructure condition; and mobility, congestion, reliability, and systems operations—see njtpa.org/Planning/measures.aspx.
Roadway Safety
NHS Infrastructure Management
5-yr rolling average # of Fatalities (F)
5-yr rolling averagerate (per 100 MVMT) of F
5-yr rolling average# Serious Injuries (SI)
5-yr rolling averagerate (per 100 MVMT) of F
5-yr rolling average# of Non-motorized F+SI
% pavement lane-miles pavement in good condition
% pavement lane-miles pavement in poor condition
% bridge deck areabridge in good condition
% bridge deck areabridge in poor condition
NHS Performance % person-milestraveled (PMT) with reliable travel times (LOTTR)
Freight Indextruck travel time reliability (TTTR)
Annual hours per capita peak hour excessive delay (PHED)
Congestion
Emissions
% non-SOV travel
Total (cumulative) emissions reduction (kg/day)
Transit Asset Management 4 measures
reduction in emissions of criteria pollutants (carbon monoxide, fine particulate matter, volatile organic compounds, and nitrogen oxides) from CMAQ projects in corresponding carbon monoxide, particulate matter, and ozone nonattainment or maintenance areas
• % service vehicles met or exceeded use benchmark (ULB)
• % revenue vehicles met or exceeded U
• % track segments w/performance test
• % facilities rated below condition
• 3 or (by asset class)
•# reportable fatalities by mode
• rate of reportable fatalities per total
•# reportable injuries by mode
Transit Safety 7 measures
• rate of reportable injuries per TVR
• rate of reportable safety events per mean distance between major mech
This chapter looks at performance of the system using data collected prior to the pandemic. This is generally the most recent data available, reflecting pre-pandemic trends that this plan anticipates will reassert themselves as the economy recovers. The chapter also considers issues the transportation system faces in meeting the demands of a growing and changing economy over the long-term.
Accessibility
The NJTPA region’s success stems from its accessibility and locational advantages. Activities and destinations—jobs, culture, commerce, education, health care and so on—are in relatively close proximity within one of the world’s largest metropolitan areas. For many, the transportation system makes it easy to travel to and from these destinations and to access services.
Accessibility varies greatly throughout the region, partly by design. In general, denser, more developed areas offer a wide mix of transportation modes which allows people to get to their destinations by walking, biking, driving, or riding a bus or train, although even
Vehicle Availability by Race
TABLE 4-1: National Performance Measures
Figure 4-1:
within these areas there are places that are difficult to get to without a personal vehicle. Rural areas are less developed, with fewer travel options and further from job centers. Yet all travelers, in all areas, have expectations about the times and costs for getting where they need and want to go. They want their mobility to be reliable, with travel times that are predictable from day-to-day. Challenges to accessibility are greater for some residents of the region than others.
Figure 4-2:
Number of Jobs Accessible by Auto within 45 minutes and by Transit within 60 minutes, 2020 By Auto By Transit
Minority and low-income communities, as well as people with disabilities, have faced greater barriers to jobs, healthy food, health care, and education. The use and availability of different modes varies greatly by income level. For example, 44 percent of bus riders on key routes through Newark do not have a personal vehicle, and 58 percent have household incomes below $35,000. Minorities regionwide have lower vehicle ownership, as noted in Figure 4-1. People with disabilities (over 11 percent of the regional population) make more
1,00,001–2,000,000 over 2,000,000
Source: NJTPA estimates, North Jersey Regional Transportation Model–Enhanced (NJRTM-E)
most work trips in the NJTPA region are made by single occupancy vehicle, nearly three times as many people in the NJTPA region use transit to commute compared to the national average. Walking and biking account for 4 percent of commute trips, compared to
“I think the most important step is enabling local mobility without the use of cars. Next would be maintaining or improving the network of regional hubs accessible via mass transit.”
—MONMOUTH COUNTY RESIDENT, ONLINE SURVEY WHAT WE HEARD
trips to health care facilities than the general population and have greater reliance on walking, riding a bus, or riding as a passenger. Facilitating mobility options and access for these population segments remains a challenge throughout the region.
Measurements of travel time to work indicate the variability of transportation system performance in terms of commuting accessibility (Figure 4-2). While
3percent nationally ACS- 2014-2018).
The NJTPA’s Accessibility and Mobility Strategy Synthesis, a study completed in 2021, provided a detailed assessment of accessibility as it varies around the region—including equity considerations—and identified potential strategies for improvements. The study was an update to the region’s Congestion Management Process (see Appendix F).
As shown in Table 4-2, some needs identified in the study are shared across urban, suburban, and rural areas, such as roadway reliability, a need for bicycle and pedestrian safety and infrastructure, and congestion on freight corridors. All areas benefit from transit supportive infrastructure, such as bus shelters. Other needs are more tied to geography. In terms of access to transit, for instance, urban areas, with their potential for greater transit ridership, have greater needs for supportive transit infrastructure such as bus shelters and benches; in the suburbs, increased transit-oriented development and first/last-mile connections can help bolster transit access; and in rural areas, park-and-ride opportunities are particularly important.
From an equity standpoint, issues such as access to private vehicles and concentrations of minority populations far from some suburban job centers are highlighted by the study. These and the other types of needs are the focus of strategies and actions described in Chapter 5.
Efficiency and Safety of the Road Network
The public road network is the region’s transportation backbone. With approximately 26,000 miles of road and close to 4,900 bridges, the network is the principal means of regional travel for most trips, including most goods moved in the region. At the beginning of
2020, the network handled an estimated 151 million vehicle miles of travel (VMT) daily. The NJTPA forecasts that this will increase 11 percent to 168 million VMT by 2050.
This volume of travel over the road network indicates that the system, overall, is performing its essential function of moving goods and people to support the regional economy—despite significant congestion and reliability issues as discussed below. About 80 percent of person miles traveled on the National Highway System (NHS) meets national reliability standards in the NJTPA region, according to the NJTPA Regional Performance Measures Dashboard.
For individuals, however, the road system provides highly variable access depending on location and, importantly, the ability to afford the price of entry—that is, buying, maintaining and operating a private vehicle. More than one in 10 households in the region do not own a private vehicle (ACS 20142018). Hudson and Essex counties contain the highest concentrations of households without vehicles (about a third and a quarter of households, respectively). For some, this may be an outcome of better transit options and more compact, pedestrian-friendly land uses (especially in the cities of Jersey City and Newark), but this data also reflects higher rates of poverty and the inability to afford vehicle costs.
Efforts to reduce auto dependence through denser, transit-friendly communities, while desirable throughout the region, can sometimes raise the cost of housing through gentrification, displacing low-income residents and adding to their travel hardships. Retaining and increasing housing affordability and accessibility as these areas redevelop is a key equity concern that all transportation and community development programs must consider.
ROADWAY RELIABILITY AND CONGESTION
4-3: Roadway Travel Time Reliability
Traffic congestion can hinder accessibility, impede travel, and impose economic costs. National performance measures focus on disruptions to the reliability of travel times and the extent of delays that are excessive compared to the normal functioning of the road system. These measures—which the NJTPA and its partners use as a basis for regional target setting— recognize that some level of congestion is a fact of life and even evidence of a robust, thriving region. NJTPA planning aims to prioritize investment where it can moderate unpredictable or extreme congestion (Figure 4-3) or provide travel alternatives to allow travelers to avoid congestion hot spots.
Savvy drivers in North Jersey know the real-world expression of performance measures well—including where congestion hot spots occur and how to avoid them. They also know that even the “best” routes can be unpredictable and gauge their reliability in planning trips. The NJTPA has used data to quantify and map these conditions as part of its performance-based planning.
Another measure of road network performance looks at vehicle occupancy to gauge how efficiently people are moving. It recognizes that buses, carpools or even two people sharing a trip make more efficient use of road space. According to the 2014-2018 fiveyear ACS, non-single-occupant vehicles account for
2019, AM Peak Period. Level of Travel Time Reliability is the ratio of the 80th percentile to the 50th percentile travel time (a higher LOTTR value represents worse reliability).
Source: USDOT NPMRDS, CATT Lab RITIS
31percent of trips to work, a slight increase over prior years. Trip modes include transit, biking and walking, and working from home. Travel by shared rides, such as car and vanpools, is slightly lower than the national average, perhaps due to the high use of transit in the region, which provides similar benefits for those without vehicles.
The NJTPA supports targets that aim for more shared trips. This and other measures of road network performance are sure to be affected by changes in travel patterns as a result of the pandemic. Over the long-term, connected and automated vehicle technologies could drastically change road use—for better or worse, depending on how they are deployed, as discussed in Chapter 5.
FREIGHT MOVEMENT
More than three-quarters of the region’s tonnage moves by truck according to the NJTPA 2050 Freight Industry Level Forecasts Study and even goods arriving in the region by other modes are typically transferred to trucks to reach their final destinations— homes, businesses, warehouses, and factories.
Figure
Passaic
Bergen
Hudson
Essex Union
Performance data indicate that in recent years trucks have faced increased delays while also contributing more to traffic congestion. Truck travel time reliability on interstate highways—a national performance measure—worsened in recent years (through 2019), likely due to increased traffic levels (Figure 4-4).
The reliability problems extend to county and local roads as supply chains and freight movements evolve to meet growing e-commerce demands. The number of e-commerce packages is projected to increase to more than 390 million packages by 2050— growth of more than 400 percent (NJTPA 2050 Freight Industry Level Forecasts Study). The pandemic further accelerated e-commerce growth. As noted in Chapter 3, these changes have altered land uses in many areas to accommodate distribution activities, further impacting local road systems.
Beyond trucking, the coordination of all freight modes is critical for maintaining the performance of the freight system and sustaining its substantial contribution to the North Jersey economy—including supporting hundreds of thousands of jobs.
Containerized cargo handled at the port -- the largest container port on the East Coast—initially dropped in volume due to canceled sailings during the early months of the pandemic, followed by record-breaking growth in the last quarter of 2020, ending the year with a gain over 2019 (Port Authority of New York and New Jersey). As discussed in Chapter 5, meeting this continued growth requires ongoing investments at the port, landside road and rail connections, and marine highways. Air cargo, principally handled at Newark Liberty International Airport, had declined for several years but is now growing again with the expansion of e-commerce movements.
The industrial real estate market, primarily involving the sale and development of distribution, warehousing and manufacturing facilities, has seen significant investment growth in the NJTPA region. Looking to capitalize on increased e-commerce, companies increasingly want facilities close to large numbers of customers.
As discussed in Chapter 5, addressing the accessibility of freight in the region requires taking a holistic approach that considers the interplay of all modes and a host of interconnected issues—the need for truck parking, channel deepening at the port, terminal upgrades, improved rail infrastructure, the introduction of new technologies, and much more.
ROAD SAFETY
Travel can entail considerable risk. The loss of life, injury, and property damage due to traffic crashes impose untold economic and social costs that demand attention and action.
The Federal Highway Administration designated New Jersey as a “focus state” for its high rate of intersection crash fatalities and serious injuries as well as those involving pedestrians. The City of Newark is also a “focus city” for pedestrian fatalities and injuries. Improving safety is a top priority at the NJTPA and is factored into all aspects of transportation investment decision making.
Figure 4-4:
Motorists are the largest segment of roadway users injured and killed in crashes in the state and region, but pedestrians remain the most vulnerable. Pedestrians and cyclists account for about 9 percent of non-commute trips in the region (ACS 2014-2018) but comprise more than 30 percent of those killed in crashes (NJDOT Crash Database). New Jersey’s pedestrian fatality rate is nearly double the national average. The majority of pedestrian and bicycle crashes (70 percent) in New Jersey occurred on higher traffic roads, many of which lack sufficient pedestrian and bicycle accommodations such as continuous sidewalks, safe crossings, or bicycle lanes. Targeted safety investments have helped address this disproportionate risk, but there is more work to do.
According to Smart Growth America’s 2020 “Dangerous by Design” report, low-income and minority travelers face greater risks as pedestrians. Nationally, African American and Native American pedestrians were 89 percent and 111 percent more likely to be killed while walking than white pedestrians, respectively. Lower income pedestrians (earning less than $41,000 per year) were two times more likely to be killed. New Jersey ranked 19th in the nation in 2019 in terms of its danger for pedestrians.
The NJTPA and partner agencies monitor the number of fatalities and serious injuries on public roads and set statewide targets for those measures. According to the most recent complete year of data from NJDOT (an average covering the five year period of 2015–2019) for national performance measures, statewide there have been an average of: nearly 600roadway fatalities annually (0.76 fatalities per hundred million vehicle miles traveled); 1,500 serious injuries (1.9 per hundred million vehicle miles traveled); and among these, a combined total average of 465 non-motorized fatalities and non-motorized serious injuries involving a motor vehicle. As part of the state’s Strategic Highway Safety Plan discussed in Chapter 5, New Jersey established a target of 3percent per year reduction in the five-year rolling average of fatalities and serious injuries, which would reduce serious injuries and fatalities by 14 percent over the next five years. Other targets are discussed in Appendix B.
Preliminary 2020 data for the NJTPA region from the NJDOT Crash Database shows fatal crashes increasing despite a dramatic plunge in VMT resulting from COVID-19 stay-at-home protocols. Total crash
Leonia, Bergen County
WHAT WE HEARD
“I think the most important step is enabling local mobility without the use of cars. Next would be maintaining or improving the network of regional hubs accessible via mass transit.”
—MONMOUTH COUNTY RESIDENT, ONLINE SURVEY
“High quality transportation for all that connects inter-regional destinations should be a priority. Affordability and access of transportation services will drive regional competitiveness. Technology can help be an enabler for all populations.”
—Jersey city RESIDENT, ONLINE SURVEY
“Improve travel times when using public transit in order to make the choice more competitive to driving as well as a more equitable way to get around. Some residents are dependent on transit as their primary means of travel, and I feel it should be affordable and convenient to use.”
—PASSAIC COUNTY RESIDENT, ONLINE SURVEY
fatalities increased to 367. Pedestrian fatalities spiked to 121, an increase of more than 20 percent over 2019. Preliminary analysis suggests that higher speeds may be contributing factors, as roads had fewer vehicles and less congestion, allowing for recklessness.
The region experienced a slow but steady decline in fatalities for nearly a decade, until 2015 when the number of fatal crashes began fluctuating year to year. The trend in serious injuries followed a similar pattern, declining until spikes in 2015 and again in 2018. In 2019, the federal government changed the way it classifies injuries, including more in the “serious” category than previously. Because of this change, it is
difficult to compare older and newer data to establish long-term trends. However, preliminary NJDOT data for 2020 shows there were 780 serious injuries caused by motor vehicle crashes, an increase from 2019, when the new metrics went into effect.
Injuries and fatalities are far less frequent on public transit but do occur, and measurement of these incidents involves another required set of performance measures, as discussed in Appendix B.
Transit and Travel Options
Many North Jersey residents have a variety of options for travel besides driving. The region is served by the nation’s third largest transit system in terms of ridership, making wide areas accessible by bus or rail. Prior to the pandemic, NJ TRANSIT provided 260 million passenger trips each year on buses, trains and light rail. Many communities are making walking and biking easier for local trips—an option valued more than ever during the pandemic.
The region also has ferries, park-and-rides, shared bike and scooter systems, shuttle buses, and more. Many residents without cars also have the option of car share services, car and vanpools and on-demand ride hailing such as Uber or Lyft.
All these options improve the transportation system’s performance and efficiency, and most reduce environmental impacts. Yet much of the region—and the nation—remains oriented to accommodating autos as the primary mode of travel (Figure 4-5). This plan
Figure 4-5:
supports efforts to steadily expand travel options as opportunities present themselves and through balanced transportation investments.
Over the long-term, this plan looks to foster “mobility as a service” in which residents can routinely choose among a variety of options based on cost, destination and convenience, helping reduce system ine ciencies and dependence on private autos.
Travel options keep the region competitive in attracting and retaining employers and the highquality workforce businesses rely on.New Jersey’s eight non-profit Transportation Management Associations help facilitate access to transportation choices, as discussed in Chapter 5.
Overall transportation system performance is particularly impacted by access to transit services and walking and biking opportunities.
PUBLIC TRANSIT SERVICE AND RELIABILITY
Ridership on the bus and rail transit system remained fairly steady in recent years prior to the pandemic (Figure 4-6 and 4-7), despite funding constraints limiting NJ TRANSIT’s ability to increase frequency or expand service, as discussed in the Chapter 7, Financing Plan 2050.
According to preliminary data from NJ TRANSIT, ridership dropped 90 percent on NJ TRANSIT systemwide in early 2020 amid the COVID-19 pandemic, grew back to about 40 percent of pre-pandemic levels by summer 2020, and then stayed fairly steady through early 2021. Rail ridership was significantly more suppressed than bus ridership, likely representing the differing abilities of respective riders to either work remotely or use other travel options. For the state fiscal year ending June 2021, fare box revenues were about one-third of that for the pre-pandemic year (NJ TRANSIT). How quickly and to what extent transit ridership fully rebounds will be affected by riders’ health concerns and changes in work arrangements. After 2023, the system could see an increase in transit demand from the commencement of congestion pricing in Manhattan south of 61st Street.
To track reliability, NJ TRANSIT reports on-time performance for its commuter rail, light rail and bus routes. Thesevaried over the last decade but remained over 90 percent. Still, riders have experienced delays and incidents on their trips, prompting NJTRANSIT
ability to run reliably on schedule. Overcrowding is also an issue, especially for local bus services to, from and within the region’s urban areas. Various urban bus routes also have on-time performance substantially poorer than average, with six falling under 60 percent (NJ TRANSIT).
With a larger percentage of lower income people traveling by bus regardless of whether they live in urban, suburban, or rural areas, the lower reliability of the bus system is an important equity concern.
For much suburb-to-suburb and most rural travel, bus and rail service are less viable, and reverse commute/off-peak transit travel can be problematic. The traditional transit system, dependent on “mass” ridership, is not designed for dispersed locations. Supporting access to and use of existing stations and stops in these areas is a key strategy for the region. This can involve transit-oriented development, first and last mile connections, walking and biking infrastructure and addressing parking limitations.
Transit system performance has important equity implications (Figure 4-8). While socially vulnerable populations are generally more concentrated in areas with higher frequency transit, the ability to reach jobs at suburban or exurban sites can be very limited. In addition, getting to bus stops or rail stations can impose hardships on many residents, particularly in outlying neighborhoods in urban areas and suburbs where service may be limited. This can mean significantly longer commute times.
WALKING AND BIKING
Walking and biking are integral to regional mobility as well as quality of life, economic vitality, healthy living and environmental protection. Residents throughout the region are increasingly walking and biking as part of active, healthy lifestyles.
to redouble efforts to maintain and improve the system within its funding constraints. The rail system’s ability to keep up with future demand—and avert worse system failures—is tied to completion of new rail tunnels under the Hudson River and the larger Gateway Program.
Regarding the bus system, traffic congestion, weather, and unplanned road incidents all affect its
Walking and biking account for 4 percent of commuter trips in the NJTPA region, according to the 2014-2018 ACS and 10 percent of non-commute trips, based on the NJTPA and New York Metropolitan Transportation Council (NYMTC) Regional Travel Household Survey. The poorest residents of the region walk much more than those with higher incomes both because of lack of access to cars and sometimes living in denser urban areas (Figure 4-9).
Walking and biking are also much more common for student travel to and from schools: a quarter of students who live within a mile of school walk or bike there. This rises to nearly 80 percent in some urban school districts (Jersey City School Travel Plan). Transit-related trips also tend to correlate with higher walking rates. Research shows that, nationally, 35percent of transit users walk more than 30 minutes to and from transit each day (Walking Associated With Public Transit, American Journal of Public Health).
WHAT WE HEARD
“I
For walking, bicycling and other active transportation modes—as well as micromobility options such as scooters and electric bicycles—accessibility is often contingent on a basic foundation of complete streets (roads designed to safely accommodate all modes and users) that is lacking in many areas. As noted, fatalities and injuries among pedestrians and bicyclists are a serious concern in the region.
want to be able to walk or bike for most local trips. A safe and comfortable environment is important to do so. For longer trips, I would like to be able to take a bus or train, but I need to know that it will be there when I need it.”
—MONMOUTH COUNTY RESIDENT, ONLINE SURVEY
According to BikeLeague.org, bicycling is the nation’s fastest growing mode of travel to work, with the number of bicyclist commuters increasing by 50 percent from 2000 to 2016. Bicycling gained even greater popularity during the COVID-19 pandemic, creating a potentially large base of new riders using the mode for commuting and shorter trips in coming years.
A background paper on active transportation for this plan (Appendix A), identified several impediments to walking and biking, including:
¡ Trails often lack connections to one another and to key destinations. While the NJTPA estimates that the region has a network of over 214 miles of paths and trails shared by bicyclists and pedestrians,
Keyport, Monmouth County
many of the longer trails—and rights-of-way that could one day become trails—span jurisdictions and require special efforts to fund and coordinate improvements.
¡ On-street network gaps—such as a missing section of sidewalk or a disjointed bicycle network—can pose a safety hazard and discourage people from cycling or walking to local destinations. Based on the NJTPA’s Level of Bicycle Compatibility index, most roads in the region are unsuitable for people who are not already experienced bicyclists.
¡ Many roads act as barriers to connectivity. Their distribution throughout the region breaks up what otherwise could be a highly connected bicycling or pedestrian network.
Addressing bicycle and pedestrian network connectivity and related concerns must be a priority in order to meet increasing demand created by ongoing population and economic growth, as well as current
trends favoring active transportation. Supporting walking and biking can improve transportation system performance and flexibility with zero emissions and provide social and health benefits for residents.
Infrastructure Condition and Resilience
North Jersey is home to some of the oldest transportation infrastructure in the country. Long before New Jersey’s highways enabled and symbolized modern suburban living, the region had impressive transportation infrastructure. The Morris Canal, built in 1825, once stretched 107 miles, carrying freight from the Delaware River to the Hudson River; and carriageways, ferries and railroads offered innumerable connections within the state and beyond. Some of this infrastructure is still in use and maintained by counties. In the NJTPA region there are 89 bridges that are over 100 years old that have not been reconstructed (NJDOT Bridge Management System).
Somerville, Somerset County
trails. Aging infrastructure imposes a heavy financial burden, with 64 percent of all available funding in the TIP devoted to repairing and maintaining existing infrastructure, leaving less for improvements. Transportation agencies must play constant catch-up to keep pace with accumulating needs.
The e ects of climate change and severe weather greatly compound preservation challenges and necessitate increased resilience-focused actions and policies to protect the entire transportation system, as discussed in Chapter 6, Environment.
The NJTPA Resilience Improvement Plan, found in Appendix K, also identifies climate-related vulnerabilities and explores strategies to improve transportation resilience to climate hazards in our region.
To address infrastructure needs, the NJTPA works with NJDOT and NJ TRANSIT on federally required statewide asset management plans and processes covering highways, bridges, pavement and transit. The following are snapshots of key transportation system assets.
P A VEMENT AN D B R IDGE A S S E T S
Federal law requires special attention to assets on the National Highway System (NHS), a network of strategic roads, including all of the Interstate Highway System that serves major airports, ports, rail, truck terminals, and other transport facilities. It includes about 10 percent of the 51,000 lane miles of roadway in the region, including most of the heavily traveled routes (NJTPA GIS). Appendix B reports on the pavement condition on the NHS within the NJTPA region, using the national pavement condition performance metrics (good, fair, and poor condition).
However, NJDOT uses slightly di erent methods and measurements to manage pavement condition on its system. The figures in this chapter use the NJDOT metrics (pavement in “Acceptable” condition) to report on the condition of roads within the NJTPA region. This includes roadways both on and o the NHS (including those maintained by the NJ Turnpike Authority).
As shown in Figure 4-10, in recent years road conditions have deteriorated, but bridges have improved on the NHS.
According to 2019 Pavement Management System data (Table 4-3), nearly 29 percent of road surfaces in
Figure 4-10: Percent Roadway Lane-miles in Good or Fair (i.e., A cceptable) Condition
Percent Bridge Deck A rea in Good or Fair (i.e., A cceptable) Condition
the NJTPA region are deficient, and 48.5 percent are in fair condition. Over the span of four years, these pavement ratings have remained fairly consistent, indicating that paving projects are keeping pace with accumulating needs, though further investment will be needed to bring more roads into a state of good repair. Around 71 percent of the region’s NJDOT-owned bridges will require significant improvements or replacements in 20 to 30 years. Approximately 10 percent of the region’s bridges under NJDOT jurisdiction are considered structurally deficient (Table 4-4), which means that their deck or bridge structure is deteriorated (though such bridges may remain safe to use for many years). However, overall, about 19 percent of bridges are considered in good condition, again indicating that state and regional projects are addressing accumulating needs.
NJ TRANSIT also must address 15 percent of bridges throughout the rail system which are structurally deficient (Table 4-5). Problems on these bridges can, at times, lead to speed limit restrictions and subsequent delays. Drawbridges that remain stuck in the “up” position can also lead to service stoppages.
While the most heavily traveled roads and bridges in North Jersey are under the state’s jurisdiction— mostly NJDOT but also the Turnpike Authority and NJ TRANSIT—county and local governments are responsible for maintaining and upgrading more than 90 percent of road miles (NJDOT Pavement Management System) and about 40 percent of bridges (NJDOT Bridge Management System).
Upkeep on these facilities imposes substantial costs on county and local governments, which rely on taxes and local aid from the State of New Jersey’s Transportation Trust Fund, totaling just over $261million per year. Nearly 7 percent of county-owned bridges are in poor condition (Table 4-6) and over 60 percent are in fair condition. Nearly 12percent of all county-owned bridges are over 75years old and over 250 of these bridges have yet to be reconstructed. As discussed in Chapter 5, NJTPA programs help counties access federal funds for key improvement projects.
PUBLIC TRANSIT ASSETS
The bus and rail transit network, like the road network, requires significant ongoing preservation, maintenance, and improvement.
Short-term targets are used to measure the performance of NJ TRANSIT and PATH transit assets, such as buses and trains. Among the measures are assessments of the useful life of transit vehicles (Table 4-7). According to the latest NJ TRANSIT Asset Management Plan, nearly 26 percent of all NJ TRANSIT-owned commuter rail vehicles have exceeded their Useful Life Benchmark (ULB), which is typically 30 years of service. An additional 119 units will exceed their ULB by 2025. Vehicles that exceed their useful life, but remain in service as these do, can break down more often, affecting system reliability.
4-5: NJ TRANSIT-Owned Bridges in the
TABLE 4-3: Roadway Pavement Conditions in the NJTPA Region
Source: NJDOT Pavement Management System (2019)
TABLE 4-4: NJDOT-Owned Bridges in the NJTPA Region (2019)
TABLE
NJTPA Region (2019)
Source: NJDOT Bridge Management System (2019)
Orange, Essex County
There are 2,814 buses that serve the NJTPA region. Nearly half (48 percent) of these vehicles have already exceeded their ULB, typically 12 to 14years (Table 4-8). Because of the continual need for maintenance and replacement of vehicles, over 1,200 additional buses will exceed their ULB by 2025. As noted earlier, keeping these vehicles in use can affect reliability.
Additional priorities to achieve a state of good repair on the transit system include upgrading interlockings, retaining walls, bridges, rail yards and signals which can be the source of delays and reliability issues. Numerous stations must also be improved including access improvements for the disabled. Improvements must be made to ensure resiliency, including a drainage improvement program to mitigate
flooding issues at key locations. These and other issues are addressed in NJ TRANSIT’s 5-Year Capital Plan and 10-Year Strategic Plan.
Performance-Based Planning
The NJTPA and its partners will continue to monitor and act upon the performance measures discussed in this chapter and in Appendix B. This is even more important now that traditional travel patterns and priorities for use of the system are being altered on many fronts—including by increased remote work, burgeoning e-commerce, concerns about equity and the need to combat climate change. In coming years, technology promises even greater changes. Performancebased planning allows the region to understand these changes and adapt plans and programs to implement cost effective solutions to support a growing population and expanding economy over the long-term. Monitoring progress and working toward the specific targets set cooperatively by NJDOT, NJ TRANSIT, PANYNJ, the NJTPA, and partner MPOs, as detailed in the appendix, are an important part of this process.
Performance measurement is also evolving to become more nuanced, drawing on new data sources such as anonymized “real time” cell phone data which provides detailed insight into how and where people travel. It enables the NJTPA and its partners to pursue improved strategies to address regional priorities as discussed in the next chapter.
TABLE 4-6: County-Owned Bridges in the NJTPA Region (2019)
TABLE
New Brunswick, Middlesex County
Strategies and Implementation 5
AS ANMPO,THENJTPA seeks workable and cost-effective solutions to complex transportation challenges and does so in coordination with numerous agencies and local governments, with ongoing input from the public. Among the results are transportation improvement projects funded with the $2 billion or more available to the region each year in state and federal funding. ■ This chapter looks at key modes, facilities and issues while referencing interconnections and overarching concerns, including access, equity, and economic and environmental impacts. The NJTPA’s activities focus primarily on the earliest stages of project development where problems are explored, approaches to solutions identified, plans developed, the public consulted, financing arranged, and approvals and agreement gained among key parties. This plan provides a framework for setting priorities for these and related planning activities that will shape long-term solutions. The framework
Point Pleasant, Ocean County ▶
Roads, Bridges
As discussed in Chapter 4, the road network is subject to ongoing wear, necessitating constant repair and upkeep. Travelers often face severe congestion and reliability problems. This plan seeks to address these existing needs while also preparing for a future that will see growth in travel demand and shifts in travel patterns over the road network. The region must also prepare for impacts from climate change including increased flooding and accelerated wear, which is discussed further in Chapter 6, Environment.
includes a Regional Capital Investment Strategy (RCIS), as discussed in Appendix C, that sets targets (Figure 5-1) for allocating funds among transportation needs.
Projects and programs also find their origins in planning studies; in systematic analyses of needs called the Congestion Management Process or CMP—see Appendix F; and in assessments of how particular actions can improve transportation performance Figure 5-1:
WHAT WE HEARD
The NJTPA and its partners take a “fix it first” approach to roads and bridges, using the majority of funds to maintain and preserve the system. Many of the key roads and bridges in the region were built decades ago and are due for reconstruction. Others must undergo resurfacing or other maintenance to keep up with heavy wear. The most deteriorated roads and bridges generally get the highest priority for funding. Where possible, efforts are made to perform cost-effective preventive maintenance to extend the life of a roadway and to limit long-term financial impacts.
Among the priorities for the future are the following:
¡ Reduce the backlog of needed road and bridge improvements and upgrade facilities to meet growing demand and enhance safety.
“Between our weather and driver volume, the state should really allocate more time and money to fixing the roads.”
—BERGENCOUNTYRESIDENT,ONLINESURVEY
“Despite going virtual, you still need to maintain a state of good repair for infrastructure because we are relying on deliveries more and more and people are still using roadways and bridges and you cannot get these things delivered if you do not have the infrastructure.”
—LET’STALKTRANSPORTATIONEVENTPARTICIPANT
related to measures discussed in Chapter 4. Solutions must focus above all on giving travelers access to key destinations—in keeping with this plan’s themes of Transportation, People, Opportunity—rather than solely attending to needs on a particular facility or mode of travel.
¡ Prepare infrastructure for climate change impacts, including potential flooding from more severe weather.
¡ Maintain and upgrade roads and bridges to accommodate a growing volume of truck traffic, including increased truck parking facilities.
¡ Integrate roads and bridges more fully into the multimodal transportation network by modifying facilities to accommodate walking, biking, and transit modes. This includes complete streets approaches.
¡ Employ the latest technologies to enhance the operation of the roadway network, including preparing for connected and automated vehicles.
As noted in Chapter 4, county and local governments have responsibility for maintaining and upgrading the largest total share of road miles and about 40percent of bridges, burdening them with substantial costs. Currently, nearly 7 percent of county-owned bridges are in poor condition and 63 percent are in fair condition.
The NJTPA Local Capital Delivery Program offers a means for counties to access federal funding to repair or replace bridges (seesidebar below). This program should be expanded to help the region meet growing road and bridge needs. However, this plan’s financial element reflects an increase in local aid funded through the State Transportation Trust fund
Local Capital Delivery Program
Tas part of the Local Municipal Aid, Local County Aid, and Local Bridges programs. This is particularly needed to help prepare infrastructure for growing travel demand, resiliency requirements and technology upgrades.
ROADS
Significant funding is devoted to upgrading and improving roadways to enhance their safety and ability to efficiently handle growing traffic volumes. Expanding or adding new roads is a very limited option due to high costs, environmental impacts, and the likelihood it may only temporarily relieve congestion, inducing additional traffic over the long-term.
Bridge Street Bridge, Essex/Hudson Counties
he Local Capital Project Delivery (LCPD) Program is a competitive program that provides funding to NJTPA subregions to prepare proposed transportation projects for eventual construction with federal funding. This preparation involves completing the multi-step Capital Project Delivery Process developed by NJDOT. This process is designed to streamline project development and enables a project to be considered for inclusion in the NJTPA’s bi-annual Transportation Improvement Program (TIP). Once federal funding through the TIP is obtained, subregions oversee these final phases of work to implement the project. The initial phase of the LCPD program is Local Concept Development, which is outlined in Appendix I.
The goal of the LCPD Program is to prepare local projects for the TIP. Monmouth County Bridge S-32, Rumson Road over the Shrewsbury River, has graduated from the program and is awaiting construction. A new movable bridge will be constructed adjacent to the existing structure at a cost of $132 million. Extensive public input, initiated during the LCPD phase, continues.
Other LCPD Program projects underway include the Central Avenue Bridge over the Newark Light Rail at an estimated cost of $25 million and the Bridge Street Bridge over the Passaic River at an estimated cost of $77 million, both Essex County projects; Bergen County’s Kingsland Avenue Bridge over the Passaic River, for an estimated cost of $35 million; and Hudson County’s Clay Street Bridge over the Passaic River, at an estimated cost of $55 million.
Long-standing, proven enhancement and improvement strategies include removing bottlenecks, reconfiguring intersections (such as by installing left turn lanes), controlling road access (such as by limiting driveways and curb cuts) and changing signal timings. Increasingly, the region is looking to additional strategies:
¡ Adaptive signal systems are helping manage traffic on key corridors by responding to traffic conditions. They are part of broader application of Intelligent Transportation Systems (ITS) technology discussed later in this chapter.
¡ Modern roundabouts are successors to the traffic circle that have a smaller footprint and are proving successful solutions to traffic trouble spots.
¡ Complete streets, as discussed further in the Walking and Biking section, is an approach to ensure that roads accommodate all modes and all users.
Implementation
In the near to mid-term, the region can expect to see significant progress in addressing its maintenance needs and reducing road project backlogs. Road preservation, enhancement, and expansion should represent 21 percent of all transportation investments, according to the RCIS.
There are several larger roadway improvement projects anticipated to be under construction in the near to mid-term. These include:
¡ Route 80, Riverview Drive (CR 640) to Polifly Road (CR 55), Passaic and Bergen Counties, $665 million. Construction in 2025.
¡ Route 206 Projects, Somerset County, $487 million ($160 million remaining). Construction completion in 2026.
¡ Route 3, Route 46, Valley Road and Notch/Rifle Camp Road Interchange, Contract B, Passaic County, $187 million. Construction completion in 2024.
¡ Route 1&9, Interchange at Route I-278, Union County, $108 million. Construction in 2026.
Clifton, Passaic County
¡ Route 34, CR 537 to Washington Ave., Pavement, Monmouth and Middlesex Counties, $139 million. Construction in 2029.
¡ Route 7, Kearny, Drainage Improvements, Hudson County, $92 million. Construction in 2023.
¡ Route 80, Route 15 Interchange, Morris County, $146 million. Construction in 2022.
¡ Route 31, Route 78/22 to Graysrock Road, Hunterdon County, $18 million. Construction in 2024.
¡ Route 9, Indian Head Road to Central Ave/Hurley Ave, Pavement, Ocean County, $44 million.
Construction in 2022.
BRIDGES
Every year, many bridges require improvement or replacement and ongoing maintenance. About 20percent of available funding is allocated to bridges annually. The NJDOT Bridge Management System prioritizes repair and replacement by systematically assessing bridge conditions, life cycle costs, and other factors. In addition to the over 1,800 bridges under NJDOT jurisdiction and over 2,000 county/local bridges, NJ TRANSIT owns 93 bridges in the NJTPA region (Table 5-1).
Bridges are particularly vulnerable to damage due to flooding and severe weather which will increasingly result from climate change. This presents a particular concern because bridge failures can disrupt evacuation routes from vulnerable areas, such as the shore, and movement of critical supplies in an emergency. Funding should be prioritized to improve resiliency of the region’s bridges. Bridge repair or replacement projects must address resiliency concerns in design and engineering.
Resiliency efforts have become a priority at NJDOT. The agency is developing tools for identifying assets’ vulnerabilities to climate impacts (temperature extremes, extreme rainfall, and flooding) and developing techniques to factor resiliency into the agency’s project delivery process.
Implementation
Among the bridge improvement projects anticipated to be under construction in the near- to mid-term are:
¡ Route 4, Hackensack River Bridge, Bergen County, $88 million. Construction in 2025.
¡ Route 23 Bridge over Pequannock River/ Hamburg Turnpike, Morris and Passaic Counties, $67 million. Construction in 2027.
¡ Route 1, NB Bridge over Raritan River, Middlesex County, $89 million. Construction in 2030.
¡ Route 17, Bridges over NYS&W Railroad & RR Spur & Central Avenue (CR 44), Bergen County, $120 million. Construction in 2031.
¡ In addition to NJDOT-owned bridges, there are a number of county-owned bridges under construction or expected to advance to construction over the next few years. The NJTPA assists the subregions with meeting federal requirements so that these projects can advance to construction with federal funds.
¡ Bridge S-32 on County Route 520 (Rumson Road) over the Shrewsbury River, Monmouth County, $120 million. Construction in 2021.
Table 5-1: Bridges in NJTPA Region by Ownership (2019)
Kingsland Avenue Bridge, Bergen/Essex Counties
Strategic Highway Safety Plan
The New Jersey Strategic Highway Safety Plan (SHSP) is a key part of organizing the strategies and actions that will keep the state on track towards its long-term goal to eliminate fatal and severe injury crashes. In 2020, a broad coalition of federal, state, local and private safety stakeholders coordinated to update the SHSP with a comprehensive, multidisciplinary approach that incorporates the “5Es” of safety: engineering, education, enforcement, emergency response and equity. The plan establishes statewide goals, objectives, performance measures and emphasis areas to guide safety programs and infrastructure priorities. The NJTPA plays an important role in each emphasis area.
The SHSP relies on safety data to prioritize its emphasis areas: lane departure, intersections, driver behavior, pedestrians and bicyclists, and other vulnerable road users. The 2020 SHSP also created two cross-cutting emphasis area teams focused on equity and data.
The 2020 SHSP also has a strong implementation phase that continues regular coordination among emphasis area teams to implement the most promising strategies for reducing crashes and saving lives, and to regularly report on progress across a wide array of actions. The NJTPA leads implementation of several of these strategies, which include expanding Street Smart NJ’s statewide use; exploring ways to reduce pedestrian crashes at bus stops; and identifying high crash locations on county and local roads, with an emphasis on those in underserved communities.
¡ Kingsland Avenue Bridge over the Passaic River, Bergen and Essex Counties, $38 million. Construction in 2027.
¡ Clay Street Bridge over the Passaic River, Hudson and Essex Counties, $64 million. Construction in 2029.
¡ Bridge Street Bridge (CR508) over Passaic River, Hudson and Essex Counties, $84 million. Construction in 2026.
¡ East Anderson Street Bridge (02C0023A) over the Hackensack River, Bergen County, $41 million. Construction in 2026.
¡ Monmouth County Bridges W7, W8, W9 over Glimmer Glass and Debbie’s Creek, Monmouth County, $35 million. Construction in 2028.
SAFETY
Improving safety remains a top priority at the NJTPA, and safety considerations factor into all aspects of transportation planning and investment decision-making. As discussed in Chapter 4, there are more than 200,000 motor vehicle crashes in North Jersey, resulting in more than 300 fatalities and 45,000 injuries each year. Approximately 30 percent of those killed are pedestrians in the NJTPA region. The NJTPA’s safety projects and programs contribute towards meeting federally mandated safety targets to reduce serious injuries and fatalities for all.
With the understanding that any number of road deaths is unacceptable, the NJTPA analyzes crash trends and locations to help respond to the region’s transportation safety needs most effectively through its programs and initiatives. This includes its Local Safety
Elizabeth, Union County
and High Risk Rural Roads programs, which support construction of cost-effective, high-impact safety improvements on county and local roadway facilities. These programs have invested $312 million over the past 15 years, making the NJTPA a national leader in using these funds to improve safety.
The NJTPA recognizes that engineering alone will not eliminate serious crashes. To help provide a more holistic approach, the NJTPA developed Street Smart NJ, a pedestrian safety education campaign launched in 2013 in cooperation with NJDOT and the New Jersey Division of Highway Traffic Safety (NJDHTS). Since the initial pilot in five communities, the program has grown annually to now include more than 160municipalities.
The New Jersey statewide Strategic Highway Safety Plan (SHSP), adopted in 2020, uses the “Towards Zero Deaths” approach to eliminating fatalities (https://www.saferoadsforallnj.com/about).
The cities of Jersey City and Hoboken have adopted “Vision Zero” as their safety goal, following the success of Vision Zero in New York City and elsewhere in the country and around the world. Middlesex County is developing a Vision Zero Action Plan as part of its Destination 2040 initiative. In addition, many safety advocates and localities are adopting a Safe Systems Approach. This approach, encouraged by USDOT, seeks to minimize the chances for people to make mistakes and to minimize the impacts of crashes.
The NJTPA works in partnership with its member agencies, and various stakeholders to improve safety. These partners and others collaboratively developed the SHSP to guide investment in safety improvements and set policy direction for the state (see sidebar p.60).
Implementation
The NJTPA invests considerable resources every year towards targeted, proven safety improvements and will continue and broaden these efforts. Solicitations for proposals under the Local Safety and High Risk Rural roads programs will be conducted to make full use of available federal funding.
Upcoming Local Safety and High Risk Rural Roads projects include:
¡ On Lakeview Avenue in the cities of Paterson and Clifton in Passaic County, approximately 11
intersections will be made safer under the Local Safety Program. Improvements will include a modern roundabout, left turn lanes, bicycle lanes, traffic signal upgrades, including pedestrian signals, lighting, drainage, and pedestrian refuge islands where feasible.
¡ On Garfield Avenue in Jersey City, Hudson County, an approximately 2.5-mile corridor with 31 intersections will receive ADA improvements, curb-extensions, signal upgrades, pedestrian signal upgrades, high visibility crosswalks, and lighting, also through the Local Safety Program.
¡ Using the High Risk Rural Roads program, approximately 8 miles of Stagecoach Road in Monmouth County in Upper Freehold and Millstone townships are slated for three modern roundabouts, high friction surface treatments, centerline rumble strips, and other safety improvements.
In addition, many large bridge and roadway maintenance and preservation projects also enhance safety where possible. This may include high visibility pedestrian crossings, improved sidewalks, bike lanes, and increased warning signage and striping. NJTPA will continue to work with NJDOT and its partners to implement and update the priorities in the SHSP.
Future safety investment directions include systemic improvements that focus on increasing safety on high crash corridors, rather than focusing on single
Somerville, Somerset County
WHAT WE HEARD
“It doesn’t have to only be about bike paths/trails. It can also be small side streets if they feel safe. It’s also important to have first mile/last mile connections to transit. It needs to be safe, easy, and convenient for people of all ages and abilities.”
—LET’STALKTRANSPORTATIONEVENTPARTICIPANT
“In rural settings, emphasis must be given to bicycle safety: often, there are no shoulders on which to bike, and dedicated bike lanes are a rare exception.”
—SOMERSETCOUNTYRESIDENT,ONLINESURVEY
“Shore towns and surrounding towns by the shore see a lot of bike/walking activity but is unsafe due to the lack of infrastructure.”
intersections or roadway sections. One way to identify needed improvements with vital local input is through Road Safety Audits (an FHWA proven countermeasure) and Walkable Community Workshops. The NJTPA supports and participates in both.
Expanding Street Smart NJ statewide and engaging new partners and communities is a priority for the NJTPA in support of SHSP. Continued partnerships with the NJDHTS, the subregions, other government agencies and traffic safety related organizations is crucial to improving safety through 2050, coupled with investment in proven safety countermeasures at priority locations.
WALKING AND BIKING
The NJTPA will continue to support improvements that make biking and walking safer and to improve access to transit for cyclists and pedestrians. Efforts are also underway to create more walking and cycling trails throughout the region, and to upgrade infrastructure and connections to provide better walk and bike access to recreational, employment, residential and other destinations. The NJTPA is assessing safety needs where off-road trails cross roadways to make systemic upgrades along busy trails.
The efforts are often part of locally led initiatives to realize complete streets (see sidebar p.64) and to expand and initiate new trails. Safe and attractive walking and biking routes are especially critical in low-income communities and minority communities,
—OCEANCOUNTYRESIDENT,ONLINESURVEY
where data shows disproportionate serious injuries and fatalities for pedestrians.
Complete Streets improve access to various destinations both directly and through connection to public transportation and they support mobility for residents with disabilities. During plan outreach, the public frequently cited making streets safer for people walking and biking as a top priority.
As discussed in a background paper for this plan (Appendix A), the NJTPA will pursue various measures to support walking, biking, and other active transportation.
Among the travel and lifestyle changes brought about by the pandemic were creative uses of street space and increased walking and biking. To create safer, socially distanced spaces, most municipalities allowed restaurants and other businesses in their downtowns to expand into the public realm on sidewalks, curbside “parklets” or parking lots. Some municipalities closed large sections of streets. It led to new appreciation by both residents and local officials of the value of public spaces and more local trips by walking and biking. The NJTPA supports the application of creative street uses such as those conducted by the TMAs and others. These trends will help reset future priorities.
Among the key infrastructure strategies for improving walking and biking identified in the active transportation background paper are:
¡ Pedestrian facilities: Completing the pedestrian network requires both sidewalks and crossing
treatments. Local regulations can require sidewalk and biking infrastructure upgrades as part of new projects, including sidewalk installations as well as crossing treatments such as pedestrian countdown timers, high-visibility crosswalks, curb extensions and leading pedestrian intervals.
¡ Bicycle networks: Building out a connected bicycle network enables less experienced cyclists to gain better access to destinations. Installing bike lanes is one way to designate safe space for cyclists. Protected bike lanes offer greater protection for cyclists where curbside space is available.
Glen Ridge, Bloomfield, Belleville, Newark, Kearny, Secaucus and Jersey City); and the Northern Valley Greenway running through five towns in Bergen County (Tenafly, Cresskill, Demarest, Closter, Norwood and Northvale). Both would provide safe bicycle and pedestrian connections among several mixed income areas.
¡ Pathways to transit: Safe access to public transit is a key element of an effective regional active transportation network. Investment in more accessible transit infrastructure such as safe walking paths to bus stops and safe bus stop designs also addresses equity issues, since the most frequent transit users are minority and low-income residents.
¡ Dedicated trails: Upgrading existing trails such as the Morris Canal Greenway and exploring new additions would provide even more opportunities for cyclists of all levels to comfortably travel off-road from one destination to another. Among the trails that should be explored for development and possible funding in the region are: the proposed 9-mile Essex-Hudson Greenway spanning the two counties through eight towns (Montclair, Fort Lee, Bergen County
¡ “Calming” streets: Reducing vehicle speed plays a key role in safety outcomes for pedestrians and bicyclists. If a car traveling 40 MPH strikes a pedestrian, the survival rate is 20 percent, versus a 90 percent survival rate if the vehicle is
Speed speeds have been designed to carry vehicle traffic as quickly as possible. In Hoboken, that model is changing. As become more multimodal, protecting non-vehicular travelers is vehicle speed increases, a driver’s field of vision narrows, distance increases, and the likelihood of injury or death to and cyclists involved in a crash increases. Therefore, streets should be designed with target speeds that ensure all who use the street.
Complete Streets
urban settings, every foot counts. Wide travel lanes speeding, which increases the severity of crashes. widths help improve safety, make streets more and comfortable to travel for all modes, and reallocate space to ensure all modes receive a share of public space. lanes are wide, the City should consider restriping to dedicated space for green lanes or increase pedestrian space opportunity presents.
ITable 5
Street Type Target Speed
Street Type Target Speed
Neighborhood Streets15 mph
Community Corridors 15-20 mph
Gateway Streets 20 mph
Table 6
Recommended Lane Width
Lane Type Recommended lane width
Travel Lane10 to 11 feet
ncreasingly, towns are adopting and implementing policies to create complete streets, which are roads that accommodate walking and biking along with vehicles and are welcoming to travelers of all ages and abilities. These policies guide planning, land use development and infrastructure investments. The NJDOT adopted its Complete Streets Policy in 2009 and added the Complete and Green Streets Model Policy and Guide in 2019. As of March 2021, more than 169 municipalities and eight counties in New Jersey have enacted resolutions to support complete streets and several more have adopted plans, ordinances, or policies.
Parking Lane7 to 8 feet
Green Lane4 to 6 feet
NJTPA programs are enhancing the ability of communities to implement complete streets. An example is a Local Concept Development Study supported by the NJTPA to help implement a complete streets plan along Main Avenue in the City of Passaic. See Appendix I for more information on Local Concept Development. In addition, since the last long-range plan update, two modern roundabouts have been constructed in Monmouth County and one in Passaic County using Local Safety Program funds. Modern roundabouts slow tra c, increase pedestrian and bicycle safety, and improve tra c flow. They can be an important element of complete streets.
NJTPA also partners with the Voorhees Transportation Center at Rutgers University and Sustainable Jersey on a competitive program to provide expert assistance to municipalities seeking to implement complete streets. This Complete Streets Technical Assistance Program has assisted 17 municipalities in seven counties since 2018. Assistance has included Walkable Communities Workshops, bicycle network plans, and a pedestrian safety demonstration project.
WHAT WE HEARD
“The focus of resources needs to start turning away from car-centric ones to ones that support cycling and walking. Current conditions are dangerous for those outside of cars; more people would walk and bike if only there was infrastructure, and if it was properly designed.”
—LET’STALKTRANSPORTATIONEVENTPARTICIPANT
Other NJTPA programs supporting regional complete streets are the Subregional Transportation Program, the Subregional Studies Program, the Planning for Emerging Centers Program, Together North Jersey Initiatives, walkability audits and Road Safety Audits. Integrating truck movement and goods movement needs are an important part of these planning e orts. The Planning for Emerging Centers Program recently completed a Hoboken Complete Streets Implementation plan and the Keyport Complete Streets.
2050: Transportation. People. Opportunity.
North Jersey Transportation Planning Authority | City of Hoboken
Hoboken, Hudson County
WHAT WE HEARD
“Se necesita una mayor cobertura ferroviaria que pueda permitirnos [ir] a lugares distantes por medio del tren.” (Greater rail coverage is needed to allow us to access distant places by train).”
—NEWARKRESIDENT,ONLINESURVEY
“Accessibility through public transit affects not only sales, but also employment. Business owners want to hire the best talent and the more ways there are to get there, the bigger the pool of applicants. It also makes it a viable option for the employees to travel on a daily basis.”
“Unified transit systems and payment systems would go a long way.”
—JERSEYCITYRESIDENT,ONLINESURVEY
“Accessibility is critical. Being able to get on and off trains with ease is essential.”
traveling20MPH. Road diets, landscaping and signage are just a few ways to signal to drivers that they are entering zones with higher pedestrian and biking activity.
¡ Americans with Disabilities Act (ADA) compliance: Federal ADA requirements are necessary for all infrastructure improvements, but agencies and local governments can exceed minimum requirements by conducting maintenance to ensure curb ramps are clear of obstructions to allow free and convenient travel.
Implementation
As recommended in the active transportation background paper, the NJTPA, where possible, will enhance and give priority to active transportation improvements in its plans and programs. Among the key objectives will be to:
¡ Improve connectivity between neighborhoods and key destinations, especially in places with schools, high transit use and lower incomes.
¡ Encourage local partners to incorporate bicycle and pedestrian elements into roadway projects.
¡ Implement policies, outreach, and educational opportunities for enhancing active transportation.
¡ Continue to develop plans and provide technical support to advance active transportation infrastructure improvements where they are most needed.
—BERGENCOUNTYRESIDENT,ONLINESURVEY
In addition, other priorities will be to:
¡ Create an Active Transportation Plan for the region. This is being initiated by the NJTPA in 2021.
¡ Change design standards for state and local roadways to reduce driveway conflicts with pedestrians, include active transportation accommodations, and enact speed limits and roadway design that create safe bicycle and pedestrian environments.
¡ Encourage municipalities to adopt land use regulations conducive to active transportation, such as reducing parking requirements and revising Residential Site Improvement standards and local ordinances to create pedestrian friendly areas.
¡ Increase attention to equity considerations in evaluating transportation investments to consider communities most affected by the lack of pedestrian access, including low-income communities.
¡ Promote education and public participation regarding active transportation.
¡ Improve regional data.
¡ Expand available funding. In all these areas, the NJTPA recognizes that successful implementation requires partnerships with county and local government, which have jurisdiction over most streets where residents walk and bike. However, a lack of flexibility in existing rules and the need to maintain traffic flow, notably on state highways, can limit the adoption of local initiatives to bolster
walking and biking and creative use of public spaces. These challenges highlight the need to balance the competing needs between land use and transportation, especially in downtown and urban areas and roadways where multiple jurisdictions may be involved.
Transit
North Jersey’s extensive transit system is integrated into the life of the region. Ridership growth has been an enduring feature of the transit system, with dips and rebounds after other crises, including 9/11 and Superstorm Sandy, and after the 2008-2009 recession. Growth has been continuing relatively unabated through periodic fare increases and occasional service disruptions. Emerging from the 2020-2021 COVID-19 pandemic, which reduced transit demand as a result of widespread layoffs and adoption of remote work, transit ridership will resume growth from a lower volume and likely continue its steady climb. Indeed, among the
most frequent comments from those participating in outreach for this plan was the desire for better access to transit and improved services in all areas.
Improving transit is a key to solving some of the most difficult challenges facing the region, such as tackling road congestion, reducing dependence on inefficient auto travel, reducing air pollution, combating climate change, and providing more equitable access to economic opportunities. The pandemic made it clear that many of the region’s residents who can’t drive or don’t have access to a car rely on walking, biking, or public transit for their daily needs.
North Jersey has great advantages in pursuing improved transit. Many towns and cities date from the pre-automobile era and have walkable downtowns built around train stations and the routes of former streetcar lines. NJDOT’s Transit Village program, begun in 1999, has helped towns capitalize on the transit in their community and create the kind of development—Transit Oriented Development (TOD) —that supports convenient bus and rail service, and
Elizabeth, Union County
WHAT WE HEARD
“Land use patterns and development should match up better with available transportation, especially transit. A large employer that is oriented toward on-site work and production should not, for instance, be located in a remote area with little to no accessibility to transit.”
EssexCOUNTYRESIDENT,ONLINESURVEY
“I would love to see proactive planning to connect Sussex County to job centers. More people are moving here, lots of people already live here, and people are always talking about how to get to work outside of driving down State Route 15.”
walkable, complete streets. The NJTPA’s own programs, such as Planning for Emerging Centers, and its work with Together North Jersey assist towns in planning for TOD. NJ TRANSIT is partnering with developers to encourage TOD around its stations and transit hubs.
The lessons learned about creating successful transit-oriented communities have been increasingly extended to suburban, rural villages and redevelopment sites—former offices, malls, industrial facilities—including creating new mixed-use, walkable neighborhoods. Improving parking near transit hubs and park-and-ride lots is important to supporting suburban and rural transit access, though expansions require close cooperation with communities and stakeholders. Shuttle buses and shared ride services are also important for improving transit access in many areas (see sidebar p. 76).
All these efforts point toward a vision of the future in which an ever-increasing share of trips in the region can be taken on convenient, reliable transit. This would be brought about by carefully planned and staged investments in the transit system using local, state and federal funding. Among the long-term strategies to achieve the vision:
¡ Upgrading the reliability of existing bus and rail transit services including through improved maintenance facilities, timely replacement of old vehicles, resiliency measures, expanded capacity and other improvements.
¡ Adding more frequent services to respond to and bolster demand where possible.
¡ Extending commuter rail or light rail services along the region’s rail network, including on selected old
SussexCOUNTYRESIDENT,ONLINESURVEY
rights-of-way or on shared freight rail lines where available and feasible.
¡ Creating modern bus rapid transit systems that could bypass road congestion along with upgraded local bus services.
¡ Enhancing the network of services feeding and connecting to the transit system—including shuttle buses, on-demand vans and shared rides, safe and convenient bike routes and lockers, and eventually fleets of automated vehicles.
¡ Integrate privately operated jitneys into information systems for travel planning and seek to coordinate their operations with other mobility providers.
¡ Adopting new technologies to enhance efficiency, reduce environmental impacts, and provide improved customer information.
¡ Continuing to encourage regional land use such as TOD to support bus and rail transit.
CHALLENGES
Achieving this vision faces a number of difficult obstacles, in particular financial limitations. With much of its available funding dedicated to maintaining a state of good repair on its extensive infrastructure and vehicle fleet, NJ TRANSIT has limited capacity for expansion and must carefully evaluate a wide range of proposals. In June 2020, NJ TRANSIT issued “NJT2030—A 10-Year Strategic Plan” and a “NJ TRANSIT 5-Year Capital Plan” to guide system development. The Capital Plan notes that, “Current capital funding levels leave NJ TRANSIT struggling to keep up with the growth of New Jersey, instead of leading the way as the engine of economic growth.”
In 2020 NJ TRANSIT completed the $500 million
required investment in Positive Train Control, a federally required system to provide automated safeguards to train movements. The 2020-2021 pandemic has added the need for NJ TRANSIT to rebuild and recover ridership, including implementing new health precautions.
If the promise of the future vision of an expanded transit system is to be realized, increased funding and more stable funding mechanisms are needed. Some options are addressed in the financial element of this plan, Chapter 7. Even amid the constraints, the strategic and capital plans offer a path for prioritizing projects and expanding future transit services, which this plan endorses.
Other transit systems serving the region, including PATH, ferries, and private buses, face similar challenges. The following highlights some of these major transit issues:
TRANS-HUDSON CAPACITY-BUILDING
Travel across the Hudson River would be a hopeless traffic jam if not for the extensive collection of transit services. In the peak hours, seventy-eight percent of trans-Hudson trips to Manhattan are made by transit. This includes travel primarily from North Jersey, but also other parts of New Jersey and beyond (lower upstate NY, PA, DE). But key major projects must be accomplished to safeguard current trans-Hudson
travel capacity and meet the demands of forecast growth—in particular completion of the Hudson River tunnel project and the replacement of the Portal Bridge, which in December 2020 received a federal Full Funding Grant Agreement. These projects are the NJTPA’s top transit investment priorities and set the stage for the larger Gateway Program to expand rail capacity and improve service in a multistate region (see sidebar p. 72).
In addition to the improvements included in the Gateway Program, there are other NJ TRANSIT projects that will be needed to facilitate trans-Hudson travel. These include the Main Bergen Loop, to allow trains from the north to travel directly to New York City; the Inner Storage Yard; and the need to address draw bridges and places with single railway tracks, such as in the Meadowlands. Other needs directly related to trans-Hudson travel must also be attended to, including:
Port Authority Bus Terminal—In June 2021, the FTA released its intent to begin an Environmental Assessment to replace the aging PANYNJ bus terminal. The new terminal will provide for a nearly 40 percent increase in transit rider capacity, add a 3.5-acre public park nearby, and will streamline bus operations in harmony with local community and commuter needs using the latest technology and with increased bus staging and storage space.
I-495 Exclusive Bus Lane—The Exclusive Bus Lane (XBL) is a 2.5-mile contra-flow bus lane traveling along New Jersey Route 495, leading from the New Jersey Turnpike to the Lincoln Tunnel serving 1,850 daily buses. The PANYNJ is exploring connected vehicle technologies that would allow buses to automatically communicate with one another to coordinate their movements, smooth merging and manage spacing, among other functions.
New York Penn Station—The New York Metropolitan Transportation Authority, Amtrak and NJ TRANSIT are exploring options for renovating concourses at the station. It is part of the larger planned Gateway Program, which would include constructing a new Penn Station South on an adjacent block to serve 175,000 additional passengers and 40percent more trains.
Port Authority Bus Terminal, New York City
WHAT WE HEARD
“I realize everything is focused on NYC because of jobs, activity, etc. but it shouldn’t be that difficult to get public transit from one area to another within the state.”
—HudsonCOUNTYRESIDENT,ONLINESURVEY
“The Lackawanna train line needs to be pushed to competition especially as people are spreading out in the state with the influx of New Yorkers.”—PassaicCOUNTYRESIDENT,ONLINESURVEY
“A new Hudson River tunnel to connect NYC, NJ and for trains connecting DC, NYC and Boston. Avoid the same old mistakes such as adding more and more lanes to highways.”
—EssexCOUNTYRESIDENT,ONLINESURVEY
Over the long-term, proposals for expanding trans-Hudson capacity even further, such as extensions of the New York City subway network into New Jersey, PATH system enhancements and extensions, adding transit to existing river crossings, expanding the ferry system, automated vehicles through the tunnels and other proposals may be considered and studied.
COMMUTER RAIL SYSTEM
NJ TRANSIT’s Strategic Plan looks to implement “solutions that would allow the rail system to grow in a logical way, would increase capacity, and would allow our rail system to provide more reliable and robust service.” Beyond foundational efforts to achieve a state of good repair (Chapter 3), key improvements referenced in the NJ TRANSIT 5-Year Capital Plan to be undertaken in line with available funding include:
¡ Flyover tracks at key locations to reduce train conflicts and ease scheduling pressures, such as the Hunter Flyover on the Raritan Valley Line and the Northeast Corridor Midline Loop at Jersey Avenue in New Brunswick.
¡ Improvements to Hoboken Terminal to facilitate higher levels of rail service, improve passenger throughput, accessibility, and resiliency. This is in addition to addressing the need for supporting rail yard facilities and improving the lines servicing the station such as an upgraded Waterfront Connector to Newark, both eastbound and westbound.
¡ Adding rail capacity on key routes including Lehigh
third and fourth tracks and a third track between Waldwick and Suffern.
There are many other proposals for expanding the capacity and reach of the rail network that depend on resolving the capacity bottleneck at the Hudson River, as discussed above, in addition to finding solutions to funding constraints. All require detailed environmental and feasibility assessments but are possible elements for realizing this plan’s transit vision.
Among these are:
¡ Adding main track capacity to portions of the Bergen County, Main and Pascack Valley Lines; Morris & Essex Line, and Raritan Valley Line.
¡ Some of the proposed extensions of rail and light rail service, include:
West Trenton Rail Line
Raritan Valley Line
Bergen-Passaic Rail Service on NYS&W
Lackawanna Cut-off Extension beyond Andover
Additional potential rail and light rail extension initiatives are included under Future Transit Projects in the Project Index at the end of Plan 2050.
SUBWAY/LIGHT RAIL
The PATH system serves a vital trans-Hudson market and connects key urban centers—Newark, Harrison, Jersey City and Hoboken. PATH is in the midst of a $1 billion upgrade which includes: signal improvements that will allow trains to run closer together adding to service; new rail cars purchased to allow longer trains along with station upgrades to accommodate them; plans to overhaul the entire 350-car fleet by
2024; and continued investments in resiliency, including flood mitigation.
The PATH system, like all transit services in the region, is also challenged by the loss of customers during the COVID-19 pandemic and the need to rebuild its ridership. PATH average weekday ridership in January 2021 was down by 79 percent compared to January 2019. Impacts from the pandemic are discussed further in Chapter 4.
Studies are underway to extend the reach of the system with a connection to Newark Liberty International Airport with possibly another station in South Newark.
Also serving urban areas in the region are the Hudson Bergen Light Rail (HBLR) System, which carried 51,000 passenger trips daily prior to the pandemic, and the Newark Light Rail, which carried 20,000 trips daily. Priority HBLR projects awaiting funding include:
¡ The Northern Branch Corridor Project extending the HBLR from its current northern terminus at Tonnelle Avenue in Hudson County to eastern Bergen County; and
¡ Route 440 Expansion to connect the light rail system’s West Side Avenue route to Jersey City’s western waterfront area.
Over the long-term, further expansions of the light rail/subway systems would align with this plan’s vision for future transit. Studies by the NJTPA and its subregions have examined possibilities, such as a line from Paterson to Newark. Bus rapid transit (BRT) (see below), rather than rail, may be a viable option for these possible future expansions. Lines in some cases might run parallel to walk-bike trails on old rail rights-of-way.
BUS NETWORK
The NJ TRANSIT bus system carries two-thirds of the agency’s total ridership. NJ TRANSIT offers express bus service to the Port Authority Bus Terminal in midtown Manhattan and to the George Washington Bridge Bus Station in upper Manhattan from areas of the state without commuter rail service. Local and limited-stop NJ TRANSIT bus service within the state serves the region’s centers and nearby suburbs. Buses offer the most rapid, flexible, and cost-effective ways to expand transit services over the largest geographic area. For many residents in urban areas, they are a principal means of travel. The bus system is
Jersey City, Hudson County
supplemented by Access Link, a shared-ride paratransit service provided for people with disabilities who are unable to use the local bus service per the Americans with Disabilities Act (ADA). Counties and some localities also provide transit services so that seniors and people with disabilities have access to their daily needs.
NJ TRANSIT’s strategic plan calls for purchasing new vehicles including electric buses. The pace of electrification will depend on installing adequate charging, maintenance, and other infrastructure, which can be accomplished as part of upgrading bus garages, including a new Northern Bus garage, a signature project in the capital plan. The differing operational requirements of electric vehicles also must be integrated into existing services and routes. Based on these upgrades and in line with available funding, the strategic plan calls for providing more reliable service along congested corridors serving large numbers of riders. All buses owned by NJ TRANSIT, or purchased by NJTRANSIT for use by other carriers, are equipped with features consistent with the ADA to reduce barriers to travel.
Over the longer term, BRT may offer viable options in markets where feasible. As seen elsewhere in the country, the most successful BRT systems offer rider amenities similar to light rail and operate along dedicated rights-of-way or are able to preempt traffic signals to bypass congestion. Limited applications such as GoBus in Essex County and shoulder bus lanes on Route 9 have shown promise. Studies have pointed to some locations that may be BRT candidates:
¡ Upgraded service on Route 9 in Monmouth County
¡ New Brunswick Rapid Surface Transit study
¡ Bergen BRT network
¡ Route 1 in Mercer and Middlesex counties
¡ Union County BRT
Private bus carriers are also important to the regional bus system, operating long distance interstate routes, often to and from regional park-and-rides, and on local routes contracted by NJ TRANSIT. Private carriers operate as much as 35 percent of all bus route miles in the state. The pandemic has taken a severe toll on the ridership of interstate lines operated by Coach USA, Academy Bus Lines, Lakeland, and DeCamp. It is in the interest of the region and state to support the continued viability of these services given their role in providing travel options and reducing road congestion.
FERRIES
The trans-Hudson ferry system, including services from Hoboken Terminal and Weehawken in Hudson County and Monmouth County, provides an alternative transit mode and crucial redundancy to bus and rail transit in the event of disruptions. It is important for the public sector to support landside planning and connectivity to the ferries and consider capital investment to terminals, vessels and supporting facilities as needed to ensure their viability and services. New ferry services such as those under consideration in Bayonne in Hudson County, and Perth Amboy and Carteret in Middlesex County are promising strategies for complementing and filling gaps in the transit system.
Implementation
NJTPA can assist in planning and implementing the transit strategies discussed above in cooperation with the region’s principal transit operators, NJ TRANSIT and the Port Authority of New York and New Jersey, and other parties. Among the key approaches:
¡ The NJTPA will support further development and implementation of the NJ TRANSIT 10-Year Strategic Plan and a 5-Year Capital Plan, and the Port Authority Capital Plan for 2017-2026 through its ongoing planning as well as capital programming activities to fund projects as required through the TIP. It should be noted that several proposals in
Jersey City, Hudson County
Hudson River Rail Tunnels and Gateway Program
The Hudson River rail tunnels are in desperate need of repair. Built more than a century ago, the tunnels sustained damage during Superstorm Sandy and are beyond their life expectancy. Train traffic through both tunnels was at capacity during peak periods prior to the pandemic and shutting down one tube for repairs is not feasible, as it would reduce passenger rail capacity by as much as 75 percent. The Hudson Tunnel Project, being led by the Gateway Development Commission (GDC), would add a new rail tunnel, allowing the current level of service to continue while the existing North River Tunnel is subsequently rehabilitated. This project is the NJTPA’s highest transit investment priority.
The new tunnel is a key component of the larger Gateway Program, a long-term plan to improve rail service along the Northeast Corridor. In addition to the tunnel, the Gateway Program includes the expansion of New York Penn Station for passengers and trains; new NJ TRANSIT rail storage capacity in New Jersey; replacing the Portal North Bridge over the Hackensack River (which has a separate full funding grant agreement in place); replacing and expanding the Sawtooth Bridges between Newark and Secaucus; construction of the Portal South Bridge; expansion and modification of Secaucus Junction station; Harrison Fourth Track; dockside rehabilitation and installation of the Bergen Loop, which would allow for one-seat rides to Manhattan on NJ TRANSIT’s Pascack Valley and Main lines in Bergen County. Removing the capacity bottleneck at the Hudson River is also needed to provide service to New York on existing lines that do not currently go there directly, such as the Raritan Valley Line during peak periods and the Main, Bergen, Pascack, Port Jervis and Meadowlands lines, as well as any proposed new lines, like the West Trenton line. And there are trans-Hudson projects outside of Gateway that will greatly increase transit options, such as additional tracks on the Raritan Valley Line; the Hunter Flyover; the Northeast Corridor Midline Loop; and the waterfront connection in Hoboken; as well as the inner storage yard, and other rail infrastructure including bridges, flyovers, capacity improvement projects.
These projects are largely under study. In July 2017, the Federal Railroad Administration released a Record of Decision for a related effort, NEC Future, choosing an alternative for additional infrastructure between Washington, D.C., and New Haven, and between Providence and Boston, including investments that increase speeds and eliminate chokepoints.
In late May 2021, the Federal Railroad Administration and the Federal Transit Administration (FTA) approved the Environmental Impact Statement (EIS) for the Hudson Tunnel Project and issued a Record of Decision. This means the $16 billion1 plan outlined above can move ahead in the process to obtain a Capital Investment Grant through FTA, as well as other potential funding sources.
1 See Appendix J for additional information about this project.
WHAT WE HEARD
“Not all train stations are accessible near us, and also there aren’t any wheelchair accessible taxis/Ubers to even take us to a train/bus station. It’s very discouraging, especially for young people, who are striving to have some independence.”
—HUNTERDONCOUNTYRESIDENT,ONLINESURVEY
“Cheap, frequent, and widely available public transport, whether in the form of buses or trains, is very important to those who are disabled, elderly, or poor. Especially those in more rural communities, the availability of this type of transport is often the only means for some people to get out of the house.”
these plans could take years to be realized and will continue to evolve as NJTPA updates its own longrange plans.
¡ Studies conducted by the NJTPA and its subregions—including through the Subregional Studies program—will continue to explore new transit options to meet needs around the region, which can lay the groundwork for future expansion projects. An example is the 2020 Paterson Newark Transit Market Study.
¡ Studies and planning programs, including Planning for Emerging Centers and planning initiatives conducted in conjunction with Together North Jersey, will promote and support TOD in the region, including efforts to realize complete streets which complement TOD. Examples include the recent Planning for Emerging Centers projects supporting Keyport’s Complete Streets Policy and Implementation Plan and Raritan’s Sustainable Economic Development Plan.
NJTPA will continue to support and fund the work of the eight TMAs serving the state, which have a crucial role in working with employers and in assessing local needs to integrate transit into communities and local economies.
LOCAL MOBILITY SERVICES
Local mobility services, such as county and local transportation services, Access Link ADA paratransit, and shuttle buses to and from transit are crucial in providing travel options for those who do not have access to a car, cannot drive, or whose travel needs cannot be met with fixed route transit. This includes many
—HUNTERDONCOUNTYRESIDENT,ONLINESURVEY
older adults, people with disabilities, and low-income residents. These services provide transportation to jobs, shopping, education and other destinations, either directly or through links to/from transit and serve rural areas without sufficient population density to support fixed route transit. In addition to meeting needs of residents, travel options for local mobility help reduce travel demand as part of Transportation Demand Management (TDM) strategies (see sidebar p.76). Based on 2019 data, there were over 700,000 annual passenger trips on various shuttles operating in the NJTPA region, including on the following services: County and Local Transit Services County transit providers and many local agencies provide a wide variety of shuttles serving different trip purposes that cannot be easily met by more traditional, fixed route transit. These may have fixed or flexible routes or may operate as on-demand services. They can be operated by counties, municipalities, TMAs and other non-profits, employers, medical facilities, and others using a combination of public and private funding sources. Many of these services receive additional support from state and federal transit programs targeted to senior citizens and the disabled, including funds set aside from state casino revenues.
Access Link—NJ TRANSIT operates the Access Link complementary paratransit service that shadows its local fixed route bus and light rail services to provide more transportation options to customers who are unable to use the fixed route services, in accordance with the Americans with Disabilities Act. NJTRANSIT recently introduced an app-based travel
Trends and Emerging Technologies in Mobility Services
Several trends and emerging technologies are anticipated to change the way that mobility services are provided over the next four to 10 years. These will present challenges as well as opportunities to enhance transit connectivity Among these trends are:
¡ Warehousing and distribution is a large and growing job market that can be challenging to serve by fixed-route bus transit. Distribution centers, both urban and rural, are often located far from established bus routes, have extended working hours, and may be part of a spreadout campus. Access to these jobs can be improved by creating public-private partnerships with agencies, TMAs, and industrial park developers to provide reverse commute shuttles, vanpools, and carpools.
¡ Transportation Network Companies (TNCs) such as Lyft and Via are playing an increasing role in supplementing transit and paratransit. For example, Jersey City partnered with Via to provide on-demand, dynamically routed shuttles to help residents travel from outer neighborhoods to the downtown, PATH, and light rail. The Hunterdon Healthcare Center Foundation is working with goHunterdon TMA and Lyft to provide transportation to medical appointments. NJ TRANSIT launched a “TNC Challenge Program” with some of the county specialized transportation departments to connect residents with transit stations, places of employment, retail establishments, and healthcare appointments while reducing the wait time between making a reservation and taking a trip.
¡ The concept of “Mobility on Demand” would allow for the integration of multimodal transportation services for consumers to plan, reserve, and purchase services that meet their transportation needs. If implemented, this coordinated trip planning could make it much easier for the public to make transit trips that link two or more services.
¡ Developments in autonomous vehicle technology lends itself to the creation of automated shuttles. Many shuttles have the potential for the introduction of partial or full automation because they travel on a regular path, at neighborhood speeds, and may operate in small downtowns or single use districts such as o ce or industrial parks. NJ TRANSIT is working with the Rutgers University Center for Advanced Infrastructure and Transportation to test low-speed automated shuttles at Fort Monmouth in Monmouth County.
information and reservation system for Access Link to enhance the customer experience.
Employment Shuttles—A wide variety of employment shuttles operate in the region, provided by county agencies, TMAs, other nonprofits, and private employers. These may take the form of a fixed-route bus, a point-to-point shuttle, or an on-demand car service. Of particular importance are last mile services connecting homes and workplaces with transit hubs. Some of the shuttles are supported by NJ TRANSIT’s NJ-Job Access Reverse Commute (NJ-JARC) program. The NJTPA Local Mobility Initiatives Program, funded by the federal Congestion Mitigation and Air Quality Improvement Program (CMAQ), also funds shuttles.
First Mile Shuttles—Shuttles and other mobility services also connect residents from their home to rail, bus, or ferry. Many are funded by municipalities or developers as a local amenity.
Implementation
Implementing local mobility services relies on coordination between NJ TRANSIT, counties, TMAs, and municipalities. NJ TRANSIT administers most of the state and federal funding that supports these vital services. The NJTPA plays a coordinating role and works to advance the recommendations of the regional Coordinated Human Services Transportation Plan which was created in 2017 to guide meeting the needs
activities that serve to reduce traffic congestion and air pollution include promoting and supporting commuter vanpools and carpools; working with employers to enact flextime, telecommuting and compressed work initiatives; managing shuttle services; and promoting walking and bicycling. TMAs also play an important role in construction mitigation and emergencies, providing timely information about road and transit conditions and alternative modes of travel.
Implementation will also be carried out in cooperation with subregions, NJ TRANSIT and other agency partners, and a host of public and private partners, many of whom started working together under the Together North Jersey umbrella, in addition to the TMAs. Examples of the kinds of services to be supported and expanded include first mile shuttles such as:
¡ Fort Lee Parking Authority—Offers morning and evening shuttles to and from the Edgewater Ferry Terminal.
¡ EZ Ride—Operates multiple shuttle routes that connect apartment complexes in the Meadowlands area with NJ TRANSIT rail stations, PATH, and New York City.
¡ Community based—Some communities sponsor shuttles to regional railroad stations, with examples found in Livingston and West Orange to connect to NJ TRANSIT Midtown Direct service.
The NJTPA will continue to support Local Mobility Initiatives Program, funded by the federal
WHAT WE HEARD
“Create more local, electric, green, shuttle services to connect residents with train stations, etc. Try to get cars off the road where this is do-able, such as commuting to a nearby train station.”
—EssexCOUNTYRESIDENT,ONLINESURVEY
of seniors, low-income people, veterans, and individuals with disabilities.
The state’s eight TMAs are particularly important in implementing local mobility and TDM strategies. The NJTPA funds, administers, and coordinates the statewide TMA program. These organizations work with employers, governments, and the public throughout New Jersey to help people get where they need to go efficiently and safely without driving alone. TMA
Congestion Mitigation and Air Quality Improvement Program (CMAQ), through periodic solicitation of proposals. Examples of CMAQ funded services include:
Essex County Night Owl—Provides late night shuttle transportation from homes in Newark and nearby communities to Newark Penn Station for bus connections to Newark Liberty International Airport, PATH trains and other connections.
Transportation Demand Management
Transportation Demand Management (TDM) involves regional policies and strategies that increase traveler choices while also minimizing the negative impacts of single-occupant vehicle travel on congestion, air quality, and safety. Plan 2050 is committed to advancing TDM strategies through NJTPA planning activities and programs. To this end, in 2021, the agency completed a TDM and Mobility Plan (Appendix G).
TDM encompasses a host of strategies and programs. These include shifting priority away from driving alone, and can include monetary incentives, carsharing or bike sharing, dedicated bus lanes, protected bike lanes, and lowering o -street parking minimums for new developments; working with employers to host carpools or vanpools or provide incentives to take transit; public transit improvements, such as accurate real-time arrival information, reduced fares for some trips, and easy to use wayfinding; and marketing the benefits of reducing driving. TDM strategies also embrace new technologies including on-demand services and automated services where feasible.
The NJTPA has supported these and other strategies, particularly through its work with the state’s eight TMAs.
Exploring new mobility options will be important for a dynamic, multimodal, resilient transportation system that meets the needs of varied users. Priorities from the TDM and Mobility Plan include the following:
¡ Institutionalize a “complete streets” approach to designing, building, and maintaining streets, which has the potential to increase the convenience and safety of walking and biking, thereby reducing the need for vehicle trips.
¡ Help municipalities integrate sustainable and equitable transportation initiatives into land use and development decisions.
¡ Support telework and teleservices, which reduce trips and can increase access to employment, healthcare, education, socializing opportunities and social services.
¡ Create a “Mobility on Demand” platform to enhance traveler information, trip planning, and payment across multiple services.
¡ Fund first/last mile solutions including transit shuttles, car services, micromobility systems, and bicycle/pedestrian networks connecting people from home to transit or from their transit stop to their workplace/destination.
¡ Enhance NJRideshare.com, New Jersey’s carpool and vanpool matching system to better meet the needs of commuters and non-commuters alike.
Jersey City, Hudson County
Montclair, Essex County
Somerset County DASH Connects residents of Bound Brook and New Brunswick with places of employment in Franklin Township.
Union County Route 22 Safety Shuttle—Loop shuttle connecting NJ TRANSIT bus stops with places of employment and retail establishments along the Route 22 corridor.
FREIGHT
The NJTPA region is a growing hub of freight distribution and global trade for much of North America, helping North Jersey retain and attract businesses and expand its jobs base. This requires an increasingly integrated multimodal network of roads, rail lines and terminals, port facilities, air cargo facilities, warehouses, and distribution centers. But to remain competitive, the region must continue to address freight infrastructure needs and prepare for an anticipated 16 percent growth in freight volume by 2050. This requires investing in and optimizing operations of the various modes and facilities, as highlighted below. Several issues cut across the entire freight sector:
¡ The pandemic has accelerated key trends (such as e-commerce, “buy online, pick up in store, or BOPIS” and domestic production of critical goods), increasing the demand for industrial facilities and prompting new business practices in supply chains
WHAT WE HEARD
economy, expansion increases the need to mitigate impacts on communities including noise, pollution, traffic, and loss of open space, which can be accomplished through various cooperative strategies involving freight-related companies and communities.
Truck movements—Nearly all freight moves by truck for part of its journey, whether across long distances or locally. The region’s major truck routes are the New Jersey Turnpike, I-78, I-80, I-287 and NJ17. As freight volumes grow these roads will see even higher truck volumes. Among the issues:
¡ Maintaining and improving pavement, bridges, and other infrastructure, as discussed elsewhere in this chapter, is required for safe, efficient truck travel. This includes turning lanes with signals timed for truck movements, sufficient bridge clearance, enhanced rail access, and upgraded intermodal transfer facilities
¡ Enhancing infrastructure that connects the Port complex and Newark Liberty International Airport, the region’s air cargo hub, with distribution centers and customer facilities.
¡ Sufficient and safe truck parking and rest areas must be provided to avoid the hazards of unauthorized truck parking on roadway shoulders and interchanges. These facilities provide safe, secure places for truck drivers to rest and enable drivers
“People complain about tractor trailers on local roads, but everyone wants choice at grocery stores and on time deliveries. …Trucks play a big role in [the] consumer goods-based market. We need to find ways to better accommodate them so people are safer and the vehicles are cleaner and remove them from peak hours.” LET’STALKTRANSPORTATIONEVENTPARTICIPANT
as discussed in a background paper, COVID-19 and North Jersey Freight (Appendix A).
¡ Labor shortages affect all modes, particularly trucking. Strategies include building awareness of available jobs, enhancing training and apprenticeship opportunities, recruitment, retention and improving accessibility options for workers to reach facilities.
¡ While the sector creates jobs and supports the
to meet federal hours of service regulations, allow local staging of trucks awaiting pickups and drop offs and provide emergency parking during storms and other disruptive events.
¡ The region must plan for the introduction of additional technologies, including semi-autonomous and fully autonomous trucks and alternatively powered trucks (including electric and natural gas).
Newark, Essex County
¡ The acceleration of e-commerce has greatly added delivery trucks on local roads requiring more attention to local impacts and coordination between freight companies and communities.
The Port and Marine Cargo Movement—The region continues to see larger vessels coming to the port, thanks to the added clearance below the Bayonne Bridge, increased use of the Suez Canal by carriers, and increases in global trade. To guide planning and accommodation of marine cargo movement for the next 30 years, the Port Authority’s Port Master Plan 2050 is a comprehensive and flexible roadmap that charts the course for future growth and development at the Port of New York and New Jersey. The 30-year plan takes a holistic look at the port, including cargo container facilities, automobile terminals, dry and liquid bulk cargo operations, cruise terminals, and ferry landings and maps out the next generation of land use and infrastructure development projects that will allow the port to remain among the nation’s leading maritime gateways.
Among the most pressing issues in the NJTPA region are:
¡ Adequate channel depth and width must be maintained to accommodate these larger vessels as well as newer ultra-large container vessels beginning to serve the East Coast.
¡ Continued improvements of landside road and rail connections to maritime terminals and facilities are needed to meet rising maritime traffic.
¡ Domestic waterborne movement of cargo on designated “marine highways” or via “short sea shipping” is anticipated to grow by 2050, augmenting road and rail movements. Two key sites are Port Raritan at the Raritan Center industrial park, under development, and the New York New Jersey Rail carfloat, which moves from Greenville Yards in Jersey City to Bush Terminal Yard in Brooklyn and was recently enhanced by the Port Authority. Infrastructure investments at these and other locations must be considered.
Warehouses, Distribution Centers and Production Facilities The region has one of the greatest concentrations of these facilities in the nation. They will continue to expand as e-commerce grows and national policies support domestic production of key commodities. New or expanded facilities have provided opportunities for reclaiming
brownfields and underutilized properties in the NJTPA region. However, there are places in the region—particularly in rural areas—where warehousing may not be desirable. These operations must be effectively integrated with other land uses, particularly in greenfield locations, and into communities. Sufficient transportation options must be provided for workers to reach freight-related facilities.
Freight Rail The freight rail system continues to face capacity constraints and issues related to legacy infrastructure. The region must upgrade its freight rail infrastructure to support national standard Plate “F” rail cars, which are 17 feet tall, 10.5 feet wide, and can carry up to 286,000 pounds. In addition, certain rail improvements are needed to accommodate the growing rail share of cargo movement at the port. The NJTPA Freight Concept Development Program, along with efforts through the Freight Rail Industrial Opportunities (FRIO) Corridors program with partner organizations can help address these needs along with investments of the railroads, the Port Authority, and NJDOT.
Air Cargo—Newark Liberty International Airport hosts significant Federal Express, UPS, and other cargo facilities. Strategies to address needs involving moving freight to and from the airport include improved access to air cargo facilities, improved connections between the air terminal and offsite warehouse and distribution centers and improved signage for freight-related access and facilities.
Implementation
The NJTPA’s implementation of freight strategies to address regional needs is directed by the Freight Initiatives Committee (FIC), composed of local elected officials and agency representatives from the NJTPA Board. The committee’s bimonthly meetings serve as a forum for discussion of regional freight activities and an important means for disseminating information. Private sector participation in these meetings encourages coordination on freight matters. Implementation steps will include the following:
¡ The NJTPA will continue serving on NJDOT’s Freight Advisory Committee and act as subject matter experts on assessments, projects, and studies. This includes support for the Statewide Freight
Plan, a federally required document being updated to provide guidance for future planning activities, with expected completion in fall 2022.
¡ The NJTPA also provides support to freight-related efforts of partner agencies, such as NJ TRANSIT and the PANYNJ, as well as subregions that are undertaking freight analyses and studies. Through the Metropolitan Area Planning (MAP) Forum and the Council on Port Performance, NJTPA collaborates with partner agencies in a four-state area on multi-jurisdictional freight issues and topics.
¡ The NJTPA will continue its FRIO Corridors Program, which focuses on systematically identifying and addressing impediments to national standard rail freight car access.
¡ NJTPA will continue to maintain and expand the Goods Movement Strategies for Communities webtool to facilitate development of practices that can help make freight-related operations less potentially disruptive to host and neighboring communities. The tool lists and describes practices that have proven effective in addressing community impacts of truck traffic.
¡ Truck parking strategies will be the focus of continuing collaboration with partner agencies in the state and wider multi-state region.
¡ The NJTPA continues to monitor and analyze trends and conditions with information regularly
Hoboken, Hudson County
Freight Concept Development Program
More than 500 potential freight projects have been identified in planning studies conducted in the NJTPA region over the past 10years. But many lacked a clear path forward to implementation. To address this need, the NJTPA developed the Freight Concept Development Program (FCDP). This program builds o the NJTPA’s Local Capital Project Delivery Program. Subregions submit applications to advance projects through the program. FCDP studies include data collection, community outreach, assessment of environmental impacts, development of potential alternatives and selection of a preferred alternative. Projects that graduate from the FCDP are well positioned to seek grant funding for eventual final design and construction.
Three projects advanced during the program’s pilot phase, FY2019-FY2020:
¡ Phillipsburg South Main Street Bridge Rail Clearance Project in Warren County
¡ Hackettstown Bridge over Drain Weight Restriction Elimination Project in Warren County
¡ Dover and Rockaway Rail Realignment Project in Morris County
Two projects will advance in FY2021:
¡ Berkshire Valley Road Truck Circulation Project in Roxbury, Morris County
¡ Port Reading Secondary South Main Street Grade Crossing Elimination Project in Bound Brook, Somerset County
added to the NJTPA website and shared with the FIC. The 2050 freight forecasts developed for this plan will be updated as data becomes available.
¡ The Freight Concept Development Program is another key initiative which investigates project concepts and advance them for eventual funding (see sidebar).
¡ This plan supports critical freight infrastructure improvements to the roads, rails, and marine corridor. An example of this is Port Street Corridor Improvement Project, the modernization of an approximately 2.9-mile section of roadway at the north entrance of Port Newark and the ElizabethPort Authority Marine Terminal. The project includes replacement of the Corbin Street Ramp, the realignment of portions of Corbin Street, Port Street, and Kellogg Street, and the improvement of several other nearby intersections in Newark, Essex County. A federal Infrastructure for Rebuilding America (INFRA) grant was awarded to the Port Authority in 2021 for this project.
Freight is integral to all aspects of the region’s economy and is considered in all transportation planning and investment decision making at the NJTPA. Freight issues are important to the NJTPA’s resiliency efforts in order to sustain supply chains through major disruptive events. Additionally, safety planning must consider reducing crashes involving trucks and ensure that autos, trucks, bicyclists, and pedestrians can move in a safe and efficient manner.
TRANSPORTATION TECHNOLOGY
Transportation technology is helping make the transportation system safer and more efficient. Emerging technologies such as connected and automated vehicles promise even more dramatic benefits over the life of this plan. But the NJTPA and other agencies must guide how such new technologies are integrated into the transportation network and ensure they are applied equitably and respond to the region’s mobility needs. In goods movement and deliveries, technologies such as drones, autonomous delivery vehicles, and using real time information to make deliveries most efficient are already coming into use and will continue to grow. A background paper prepared for this plan (Appendix A) explored how the region can take advantage of transportation technologies.
One long standing issue identified in public outreach that technology can address is the need for greater flexibility in the on-road transit system (currently primarily buses and shuttles) to meet existing and emerging needs. Technology that allows for ondemand, potentially autonomous, microtransit (small vehicles summoned by smartphone apps) responds to this need as a way to meet the “many to many” relationships—travel by large numbers of people to a number of widespread locations, as opposed to one central area—that characterize travel in the NJTPA region. Technology can also provide real time route and service information at kiosks in addition to what is currently available on smart phones and could include many travel options such as shuttles and bike share.
In addition, which kinds of energy are used, and how it is produced and distributed, will dramatically shape transportation in the future. Electric vehicles or vehicles fueled by other means are increasing, reducing air pollution from transportation. Charging innovations, such as roadways that can charge vehicles in motion, could solve the “range anxiety” that keeps many from switching to all electric vehicles, even as charging stations become more common.
VEHICLES COMPREHENSIVE PLAN
Technology such as adaptive traffic signal systems, traffic operations centers and multiagency incident response networks are already helping reduce traffic congestion and its enormous economic costs while also improving safety. On the transit network, technology is improving efficiency and giving riders real time information on the location and arrival times of buses and trains.
VEHICLE CONDITIONAL AUTOMATION
capable of conditional driving potential application of ADS in the model (i.e., individual ownership rather this application, the ADS would performing the complete dynamic driving specific set of conditions, and the expected to be ready to take back control requests it. Only a few companies have interest in pursuing this use case, driving environments such as
various transportation technologies can work together smoothly and effectively.
Within the next decade existing ITS applications will be improved and implemented more widely, and connected and automated vehicles (CAV) will come into use.
Connected Vehicles use short to medium range communications to interface with infrastructure and other vehicles, allowing coordination of movements to minimize crashes, reduce congestion and make more efficient use of road space, among other applications.
Automated Vehicles provide varying levels of automation to reduce the role of drivers in directing vehicle movements. Many first-generation automation features to assist drivers—such as blind spot information system, and adaptive cruise control—are available in the latest vehicle models.
These systems promise to drastically reduce crashes—80 percent or more with fully automated vehicles—and to create a wide range of possibilities for more efficient transportation, new travel options, and even new ways to reorganize community land use.
Among the possibilities of emerging transportation technologies are fleets of driverless vehicles available on-call, platoons of automated long-haul trucks on highways, roadside systems orchestrating the safe and efficient movement of vehicles and downtown land use transformed by reclaiming parking and other spaces now used for private autos for walking, biking, and other uses.
These innovations are examples of Intelligent Transportation Systems, or ITS. In the near-term, one priority of ITS implementation is expanding adaptive traffic signal systems throughout New Jersey, helping significantly reduce delay on key road corridors. Such systems can give “signal preemption” to speed bus trips, an important goal for expanding transit convenience and use.
Many ITS systems gather real time data from roads and rails, used for both managing operations and increasingly analyzing patterns for use in transportation planning. Under federal law, states develop and maintain an “ITS Architecture” to ensure that
Example
Characteristics
Best estimates are that driverless vehicles will emerge in limited forms in the next decade, at least initially operating in constrained areas at low speeds. Fully capable automated vehicles may take decades more and may await breakthroughs in technologies and computing. In the meantime, the NJTPA supports pilot initiatives in the region, such as the Middlesex
WHAT WE HEARD
Among other activities, this includes cooperation with NJDOT in maintaining the state’s ITS Architecture, Transportation System Management and related programs; support for TRANSCOM which gathers and disseminates data on traffic and travel conditions in real-time; funding and support for improving technologies employed by NJ TRANSIT,
“Capacity can be created through improved traffic management that gives due priority to freight transport demand. Improved traffic management can also reduce the considerable environmental impact caused by excessive emissions produced by the transport sector.”
County Smart Mobility Testing Ground, located in New Brunswick in partnership with the Center for Advanced Infrastructure and Transportation (CAIT) at Rutgers University and NJDOT.
These and other transportation technologies are being developed in conjunction with a wider series of technology innovations that are transforming many aspects of life and work for large numbers of people. This includes mobile device apps feeding real time information, increasing power of internet connectivity such as 5G networks—and likely faster successors— and “internet of things” in which mobile devices are tied to other devices in the home and surroundings. They make possible expanded remote work and education and facilitate greater use of on-demand transportation services, discussed elsewhere in this chapter. Integration of technologies in “smart cities” promises more efficient use of public resources to meet community needs. As with most emerging technologies, fully realizing this promise may take many years and comes with potential pitfalls, notably the need to guard against cyber threats and protect user privacy.
Implementation
The NJTPA will continue to coordinate with its partner agencies in pursuing a variety of ITS programs and projects that are helping improve regional travel and preparing the region for the advent of CAV.
in collaboration with the Port Authority, on its bus and rail network; work with the Port Authority of New York and New Jersey on technology to improve operations at the region’s bridges, tunnels and at port facilities; and working with the region’s freight industry on technologies for efficient goods movement and mitigating environmental and community impacts.
There are several ITS and technology related projects underway and planned in the NJTPA region. Among them are several projects on Route 46 in Essex, Morris and Passaic Counties that will add ITS systems to better manage traffic for a total cost of $37million with construction anticipated to begin in 2022. These projects will add dynamic message signs, camera surveillance systems, travel time sensors and traffic signal systems. Another ITS project is underway along Route 78 in Hunterdon, Somerset, and Warren counties at a cost of $19 million. This project will address congestion and high crash rates, with construction anticipated to begin in 2028.
The technology background paper offers numerous recommendations for guiding the further development and implementation of transportation technology in the region. It recognizes that substantial investments must be made in upgrading and adapting infrastructure for these systems. For the NJTPA, as a planning agency, a crucial role will be helping weave ITS and CAV into the transportation system in ways that best meet local needs and visions while also advancing regional goals. The NJTPA has helped fulfill
these functions for existing ITS systems through its plans and programs, particularly in cooperation with its 15 subregions. As more advanced systems emerge, the NJTPA will have to broaden and extend its planning activities and programs relating to technology.
The NJTPA has many forward-looking planning programs to help integrate emerging technologies into the fabric of travel in the region. For example, a recently completed TDM Plan anticipates seamless travel information systems; a subregional study in Jersey City recommends managing parking demand in part through technology that allows for dynamic pricing and helps identify available parking; and, in conjunction with the School of Computer Science at the New Jersey Institute of Technology, the NJTPA is partnering to explore new uses of Artificial Intelligence to support good planning. In addition, the agency’s forecasting and performance measure benchmarking work increasingly harnesses real-time data to analyze existing and future conditions more accurately.
In keeping with the themes of this plan, the NJTPA’s planning activities seek to ensure that technology deployment is people-focused—helping address genuine community needs and offering social benefits. While the private sector will lead many aspects of future transportation technology, implementation must be guided in pursuit of the public interest—enhancing job access for low-income workers; helping those without personal autos; providing mobility for people of all ages and abilities; and offering new options for transit access.
This will require ensuring that access to new mobility options is affordable and without barriers based on location. It also favors shared use or multiple passenger vehicles, which will help limit the volume of vehicles on the road and environmental impacts. The NJTPA, through its planning programs and the resources it offers for gathering and sharing data and best practices, can help the region realize the promise of new and potentially transformative technologies over the life of this plan.
Adaptive Signals
Adaptive Signal Control Technology adjusts how long each signal (red, yellow, or green) is displayed to accommodate changing tra c patterns, ease tra c congestion, and improve air quality. Adaptive signals can also be used to hold the “red” phase for vehicles should large numbers of pedestrians be crossing a roadway, such as during a festival or event.
By monitoring tra c with roadway sensors or cameras, adaptive tra c signals change red and green light phasing based on the current tra c conditions. This smooths tra c flows, resulting in improved travel times. Adaptive signal systems are especially e ective during disruptive events such as roadway construction and crashes.
In the NJTPA region, adaptive systems are operational on parts Route 1 in Middlesex and Mercer counties; Route 18 in Middlesex County; and Route 1&9 in Hudson County. In the Meadowlands region, adaptive signals have improved tra c flow and safety on county roads such as Paterson Plank Road in this dense, congested area.
Additional adaptive signal projects are being developed along Route 440 and Route 1&9 in Hudson and Union counties; Route 1 in Middlesex and Mercer counties; and Route 23 in Morris and Passaic counties.
Environment
CONCERNS
ABOUT THE
ENVIRONMENT
are central to the work of the NJTPA. Despite being the most densely populated state in the nation, New Jersey has extensive undeveloped land, forests, farms, wildlife preserves and other natural resources that must be well managed and protected. The operation of the transportation system, construction of transportation projects and land use development tied to transportation can harm these natural resources. In addition, pollution from transportation affects the region’s air and water quality ■ These and related concerns—including noise pollution and impacts on archeological sites and historic structures—have long been considered in the planning process to meet requirements in state and federal regulations. In recent years, climate change has become a more urgent concern based on mounting evidence of its potentially devastating impacts. ■ While transportation is often viewed in opposition to the natural environment, this
Cedar Grove, Essex County
plan recognizes that well-planned transportation can be integrated into the environment with manageable impacts. Transportation, in some circumstances, can help foster public appreciation and support for environmental progress, for instance, by providing access to outdoor activities and recreation and fostering healthy lifestyles and sustainable living.
This chapter highlights some key environmental issues related to the NJTPA’s planning work and steps it will take to support the environment. Additional information on the environmental mitigation work done by the NJTPA as part of the project delivery process can be found in Appendix I. Furthermore, the NJTPA developed a Resilience Improvement Plan, which identifies climate-related vulnerabilities and explores strategies to improve transportation resilience to climate hazards found in Appendix K.
Climate Change
Climate change presents a growing challenge to the e ective functioning of the North Jersey transportation system and its ability to meet the increasing demands for the movement of people and goods. Along with broader disruptions to the economy, environment, quality of life and public heath, these threats create an urgent need for the transportation sector to reduce greenhouse gas (GHG) emissions and for transpor-
tation infrastructure to be built or retrofitted in a more resilient way. A background paper for this plan (Appendix A) explored climate impacts facing the region and identified strategies NJTPA will pursue.
Climate change presents real and growing threats to the state’s future. Sea levels are rising faster in New Jersey than in most of the Northeast in part due to land subsidence and other factors. In addition to preparing for potentially catastrophic events—such as Superstorm Sandy in 2012—the region must contend with more frequent flooding, more frequent and prolonged heat waves and more extreme storms.
Much of the region is vulnerable to rising sea levels, storm surge and flooding. According to a 2019 report by a Rutgers University Science and Technical Advisory panel, by 2050 New Jersey is expected to experience 0.9 feet to 2.1 feet of sea level rise (SLR) above the levels in 2000; by 2070 it is expected to experience 1.4 feet to 3.1 feet of SLR; and by 2100 it will experience 2 feet to 5.2 of SLR. And, as temperatures rise, New Jersey will experience a 4 to 11 percent increase in annual precipitation by 2050. Of great significance will be how the state experiences this precipitation. It will come as more frequent, intense and extreme rain events that lead to greater risk of floods. As base sea level rises, storm surge will become
Readington, Hunterdon County
a greater risk and is expected to increase in frequency and intensity and flood larger areas of land.
The aftermath of Superstorm Sandy and Hurricane Irene showed the devastation that water, wind, and falling debris can cause during severe weather events. Among the impacts are erosion that can undermine infrastructure foundations and accelerated deterioration of rail and roadway systems.
Strategies to address climate change must focus on adaptation, to make infrastructure more resilient, and mitigation, to reduce the amount of GHG from transportation. Nationwide, transportation was the largest source of GHG emissions in 2018 at 28 percent, followed by electricity generation (27 percent) and industry (22 percent). In New Jersey, transportation’s contribution is much higher, accounting for 42 percent of total GHG emissions. According to the New Jersey Department of Environmental Protection (NJDEP), 68percent of the transportation sector’s GHG emissions are generated by passenger cars, passenger trucks or motorcycles.
Strategies to mitigate these emissions involve reducing vehicle miles traveled, by encouraging transit ridership or more compact and walkable land uses; or switching the energy source, such as vehicle electrification coupled with low-carbon electricity generation and distribution. Adaptation strategies to make infrastructure more resilient include elevating roadways and transit electrical systems, relocating facilities from flood-prone areas, and investing in alternative or redundant routes or systems. Mitigation and adaptation must work in tandem as part of effective climate change responses.
Implementation
The NJTPA has been active in addressing climate change for a decade or more. The NJTPA is guided by federal planning factors written into law, including the need to “Improve the resiliency and reliability of the transportation system.” This is reflected in NJTPA’s own planning goal to “protect and improve natural ecosystems” and in the application of project prioritization criteria that award points to projects that “promote adaptation and resiliency to extreme weather events and the impacts of climate change.”
Moreover, the agency’s responsibilities under federal law to reduce air pollution from the
transportation sector, as discussed later in this chapter, support the use of low carbon fuels and means of travel, also helping to reduce GHGs. These responsibilities have provided the agency the tools and expertise to continue to support New Jersey’s climate change policies and initiatives, captured in the NJDEP’s October 2020 Global Warming Response Act 80x50 Report. It assesses New Jersey’s GHG reduction progress by emissions sector and provides recommendations for achieving an 80 percent reduction from 2006 levels by 2050. Further implementation guidance is provided by the May 2021 Draft Climate Change Resilience Strategy which includes recommendations for actions the State should take to mitigate and adapt to the effects of climate change. The NJTPA also supports climate change initiatives from Congress and federal agencies.
The Plan 2050 Climate Change and Transportation background paper identified key steps the NJTPA will take to combat climate change through its plans, programs, and coordination functions, including:
¡ Supporting electrification of vehicles and the creation of vehicle charging systems.
¡ Supporting partner agencies and subregions in efforts to review and revise operations to reflect both current and projected climate impacts.
Cranford, Union County
JOSUE LORA/ NJ GOVERNOR’S OFFICE
WHAT WE HEARD
“Mass transit is important for a cleaner environment. The state should support NJ TRANSIT and help encourage residents to use mass transit options.”
—Middlesex COUNTY RESIDENT, ONLINE SURVEY
“I’m an electric car driver so I’m all for pushing the electric vehicle movement forward in any way possible. I think it’s the future.”
“Climate change is very, very REAL, unless we get out of our cars, and develop healthier behaviors; we unfortunately are already seeing irreversible changes to our Earth and society.”
—monmouth COUNTY RESIDENT, ONLINE SURVEY
¡ Supporting low-carbon transit and walking/biking options, TOD and TDM.
¡ Overseeing and modeling the impacts planned transportation investments have on air quality.
¡ Supporting projects that target reducing pollutants whose emissions are tied to generation of GHGs.
¡ Funding studies to address the vulnerability of transportation infrastructure to climate change, such as the 2019 Passaic River Basin Climate Resilience Planning Study.
¡ Providing grants under the federal Congestion Mitigation and Air Quality (CMAQ) program. Funds have been used for electric vehicle
infrastructure, diesel retrofits for vehicles and equipment, idle reduction technology, traffic signal optimization, ITS and local shuttle services and more.
These and other activities represent NJTPA’s commitment to working with its partner agencies and the counties, cities, and municipalities in the region to combat climate change and achieve sustainable transportation and a more sustainable environment.
Air Quality
Transportation is a major source of air pollution, which can exacerbate asthma and other serious health conditions. Many factors affect the level of pollution, including the number of car and truck trips, trip length, time spent idling in congestion, vehicle technology and more.
The NJTPA is responsible for advancing transportation policies and projects that will help improve air quality in its region. The Figure 6-1 illustrates the current status of emissions in the NJTPA region. Ozone continues to be the greatest challenge. The NJTPA region is currently in “nonattainment” (does not met the National Ambient Air Quality Standards) for ozone (O3). However, the NJTPA region has made great strides in improving air quality by significantly reducing emissions from fine particulate matter (PM2.5) and carbon monoxide (CO). In fact, the NJTPA region is currently completing its first ten year “maintenance” phase for PM 2.5 (requiring it to continue to meet standards for 20 years) and is in “attainment” for CO having met National Ambient
WARREN COUNTY RESIDENT, ONLINE SURVEY
Woodbridge, Middlesex County
Air Quality Standards for 20 years).
To address air quality non-attainment and maintenance, the NJTPA is required to demonstrate conformity with state air quality commitments. That is, the NJTPA must use modeling to show that the projects it approves through the TIP and this long range plan will have a net zero or positive impact on air quality and contribute to the achievement of the air quality goals contained in the New Jersey State Implementation Plan (SIP). NJDEP establishes the SIP with pollutant budgets for mobile sources. The Air Quality Conformity determination for Plan 2050 can be found in Appendix H. As indicated in Chapter 3, there has been an overall reduction in bad air quality days from 53 in 2010 to 10 in 2019.
Reining in pollutants from transportation is an important component of realizing environmental justice. Low income and minority communities face disproportionate impacts because many live in urban areas or along major highways where there are higher concentrations of mobile source emissions. These emissions come from several vehicle-related processes, including tailpipe exhaust, fuel evaporation, brake and tire wear, and dust kicked up from traffic and from industrial facilities.
Those emissions cause health problems including higher rates of asthma and cardiopulmonary disease. Children, older adults and people with preexisting cardiopulmonary disease are at especially higher risk.
WHAT WE HEARD
“We need to look at the demographics of who is at most health risk from transportation activity; whose physical safety is at greatest risk in terms of traffic safety; how lack of access to opportunity creates stress and health risk inequitably; who is benefitting from the investments that are made and the way the system is managed; and finally, how system funding and management contribute to any inequities that we find in these regards.”
—newark commuter, ONLINE SURVEY
“I would like to see buses and trucks that do not pollute, especially in urban areas (e.g., Port areas, Newark, Elizabeth, Camden, Trenton). Poorer people cannot easily move to areas of low pollution, so we should reduce pollution in these areas. This will improve their quality of life and reduce their personal (and government-supported) healthcare costs, too.”
somerset COUNTY RESIDENT, ONLINE SURVEY
Figure 6-1: Maintenance and Nonattainment Areas in the NJTPA Region
Minority communities across the state have a higher prevalence of asthma.
While trucks and cars are becoming cleaner because of alternative fuels, the NJTPA will continue to address these impacts as part of its commitment to regional equity, including through the consideration of environmental justice factors in the selection of projects for funding. One example of this is the inclusion of an equity factor in the selection of Transportation Alternative Program (TAP) projects, in conjunction with the NJDOT and neighboring MPOs.
In addition to overseeing air quality impacts and conformity, the NJTPA supports continued air quality progress through its funding programs. The NJTPA’s Transportation Clean Air Measures (TCAM) program has funded adaptive traffic signal systems and lesspolluting off-road diesel construction equipment, ferry engines and electric vehicles and infrastructure. The Local Mobility Initiatives program supports shuttle buses around the region. The programs are funded with federal CMAQ allocations to the region.
As part of required performance measurement, the NJDOT, with the support of the NJTPA, tracks the impacts of projects funded by CMAQ, and sets specific
targets that aim to reduce emissions for pollutants of concern (Table 6-1). The 2018 targets were met at both the state and MPO levels.
Implementation
In 2005, as part of efforts to reduce harmful emissions, the NJTPA launched its TCAM program. Federal CMAQ funds are awarded on a competitive basis to implement projects that reduce emissions and congestion across North Jersey. In 2020 the NJTPA awarded $21.0M for a range of projects including electric vehicles and infrastructure, traffic signal optimization, diesel retrofits, truck replacements and bicycle/pedestrian projects. This program will be continued and enhanced as part of NJTPA’s regional air quality efforts
The NJTPA also administers the Local Mobility Initiatives program with CMAQ funds in partnership with NJ TRANSIT. This program funds the development of financially sustainable and innovative shuttle services that provide increased opportunities for travelers to connect to major transit routes, and last mile connections to major destinations. This program also funds replacement vehicles for existing or expanded
Notes:
1 “AQ Areas” are nonattainment or maintenance areas for ozone, carbon monoxide or particulate matter. Note that for the emissions reduction measures, the NJTPA is required to set targets specific to the AQ Areas within its planning region. Where different, the statewide targets are also shown for reference.
2 NJTPA regional targets were met mainly due to its share of statewide projects and programs. Given ongoing uncertainty due to COVID-19 and Buy America, the 4-year targets have not been changed even though they have already been met.
Table 6-1: CMAQ Emission Reduction Measures—NJTPA AQ Areas1—2- and 4-year targets2
shuttle services. In 2020 the NJTPA awarded $1.9M for four shuttle projects. This program will also be part of NJTPA continuing regional air quality efforts. These and other air quality activities with be adapted to respond to any new mandates or regulations combatting climate change. Overall, implementing improved air quality in the region will include:
¡ Meeting the requirements of the Federal Clean Air Act
¡ Upgrading regional air quality modeling capabilities
¡ Solicitating proposals under the CMAQ-funded TCAM and Local Mobility Initiatives programs
¡ Including air quality benefits in project selection criteria
¡ Coordinating with NJDEP, NJDOT, NJ TRANSIT and the Port Authority, the NJTPA subregions and the TMAs on CMAQ-funded initiatives.
¡ Supporting travel alternatives and options, as discussed elsewhere in this plan, that lower emissions, including promoting transit use, walking/biking, TDM and other measures.
¡ Supporting technologies, including vehicle electrification, connected vehicles, traffic operations management, clean energy, and adaptive signals, to realize greater system efficiency and lower emissions.
Environmental Mitigation
The NJTPA’s planning and project development programs are designed to consider the impacts transportationprojectscan have on both the human and natural environments. Multi-disciplinaryteams from the subregions, NJTPAandNJDOT work together on project development with the goal of avoiding impacts and minimizing and/or mitigating impacts that do occur.Project delivery processes can be streamlined through early coordinationwith environmental agenciesduringtheplanningphase.
The NJTPA’s environmental protection and mitigation activities are guided by key federal and state requirements including:
¡ National Environmental Policy Act (NEPA)—A federal law that requires agencies to conduct environmental reviews and consider the potential impacts of projects on the natural and social environments.
¡ FAST Act—Regulations implementing this federal surface transportation law encourage a program for Planning and Environmental Linkages, which incorporate environmental and community values into transportation decisions early in planning and
Hillsborough, Somerset County
carrying these considerations through project development and delivery.
¡ Environmental Justice—As part of NEPA evaluations, transportation agencies identify and address any disproportionately high and adverse human health or environmental effects of federal programs, policies, and activities on minority and low-income populations.
¡ LandUseManagement Regulations—These rules, administered by NJDEP, strive to balance responsible land development and protection of New Jersey’s valuable natural resources.
¡ HistoricPreservation Regulations—These rules, administered by the Historic Preservation Office of NJDEP, focus on identifying, preserving, protecting, and sustaining historic and archaeological resources.
These and other requirements guide project development work beginning at the concept development phase. During this phase, the NJTPA seeks toensure early coordination with review agencies, and collaboration with local governments and communities, toidentify and compare reasonable alternatives and the selection of apreliminary preferred alternative.
This early consideration of environmental concerns can avoid confronting impacts when plans are already in place and difficult to alter and help streamline project delivery. It exemplifies NJTPA’s goals to balance and integrate efforts to both safeguard the environment and enhance regional mobility as discussed in this plan.
NJTPA’s mitigation of project impacts are part of ongoing environmental planning activities beyond the project development process. In addition to climate change and air quality planning discussed earlier in
this chapter, among the key environmental considerations in NJTPA planning are water and other natural features, and cultural and historical resources. These are discussed below.
WATER QUALITY
As the region continues to grow, protecting the sources of our drinking water becomes increasingly important. This is a key goal of special districts created through the Highlands Water Protection and Planning Act and the Pinelands National Reserve. The Highlands encompasses over 850,000 acres in the northwest portion of the NJTPA region. The Pinelands, partially located in Ocean County, sits on one of the largest and cleanest sources of drinking water in the country, the Kirkwood-Cohansey Aquifer. Both special districts help define areas where growth can be supported while preserving more sensitive lands.
Throughout the region, stormwater runoff from paved surfaces and transportation facilities can pollute waterways and threaten aquatic life (Figure6-2). Environmental regulations governing transportation projects at the state and federal levels require NJTPA and its partner agencies to assess and mitigate non-point source pollution from transportation projects including water runoff.
“Green infrastructure” measures to improve water quality are also increasingly being integrated in street designs, including complete street and resiliency initiatives, to slow and better manage stormwater runoff that can overwhelm sewer systems and contaminate waterways and drinking water. Measures include installation of curbside planters or bioswales, permeable pavements, vegetated strips, and rain catchment systems. The Lakeview Corridor in Paterson in Passaic County and the City of Hoboken in Hudson County are among the communities that are planning and implementing these measures. The NJTPA encourages their planning and use.
In addition, the NJTPA considers the likelihood of flooding impacts on local projects, primarily bridge projects, in Local Concept Development (see AppendixI). Environmental screening maps produced for each project show the 100-yr flood plain for the project study area. These maps are then used for preliminary analysis to show the likely impacts of flooding on each alternative for the project. Further detailed
6-2
analysis of floodplain Impacts on the Preliminary Preferred Alternative for each project takes place in the Preliminary Engineering (PE) phase of project development.
OPEN SPACE & WILDLIFE HABITATS
Despite the state’s dense population, New Jersey has among the nation’s most successful programs for preserving open space and natural resources. According to NJDEP, the state’s Green Acres program, created in 1961, “has protected over half a million acres of open space and provided hundreds of outdoor recreational facilities in communities around the State.” State efforts support and are coordinated with programs of counties and municipalities, many of which make yearly allocations to open space preservation, and the work of numerous non-profit and private sector
organizations. New Jersey voters have consistently shown support for referendums providing funding for open space initiatives. These efforts are supplemented by state programs to support farmland preservation and to relocate homes from flood prone areas.
Transportation improvements sometimes can present threats to open space preservation by opening up areas for new development. Of recent concern, as noted in Chapter 3, is the development of fulfillment and warehouse facilities on open greenfield sites and farmlands prompted by the growth of e-commerce. The NJTPA, through its project prioritization criteria, favors projects that provide access to areas already designated for development with infrastructure already in place to support it, particularly formerly contaminated buildings or sites, also known as brownfields. NJTPA planning programs support studies and projects making sustainable use of available land.
Preserving and enhancing wildlife habitat must be part of sustainable transportation. Transportation facilities can reduce and fragment forests, wetlands and other spaces that are critical habitat for the state’s wildlife, including threatened/endangered species. In addition, transportation facilities can present barriers to wildlife movement and migration, isolating animals from food and resources or forcing them into dangerous road crossings. Mitigation can include tunnels, green bridges and fencing to channel animals to these crossings. Transportation project development must investigate habitat concerns as part of the early stages
of project planning where strategies are most easily incorporated. Transportation planning must draw upon and coordinate with state efforts including using tools such as the Connecting Habitat Across New Jersey (CHANJ) mapping application offered by the NJ Division of Fish and Wildlife.
CULTURAL AND HISTORIC RESOURCES
Environmental mitigation extends to preserving cultural and historical resources. North Jersey has been home to indigenous peoples for thousands of years, as well as people from around the world for hundreds of years. All these human settlements have left behind historic cultural resources and artifacts, ranging from ancient sacred sites and industrial revolution artifacts. The region was the site of important routes and stops on the Underground Railroad, particularly in Jersey
City in Hudson County and Warren County and home to numerous historic colonial settlements, leaving a rich and diverse multicultural legacy.
Future Environmental Planning
Environmental issues are part of nearly all planning work conducted by the NJTPA and will become an increasing focus in years to come. As discussed in this chapter, the NJTPA has direct involvement with implementing measures to address climate change, improve regional air quality and mitigate project-related environmental impacts. But concerns about the environment and strategies to protect open space, water quality, cultural resources, and other natural features of the region are also part of ongoing transportation planning studies and initiatives by the NJTPA, its subregions and partner agencies. Criteria used for NJTPA grants and
technical assistance reflect the need to consider a wider range of environmental factors in transportation plans and investments.
NJTPA has also joined with a broader array of agencies and organizations in Together North Jersey (TNJ), as discussed in Chapter 1, to support an update to the 2015 TNJ Regional Plan, which addresses environmental, transportation, and other issues beyond the scope of the MPO. It helps guide and shape land use and development policies in communities in ways that balance economic and environmental concerns for the long-term.
These and other planning activities of the NJTPA provide the foundation for effective responses to future environmental challenges, particularly from climate change impacts. These responses must recognize and better address regional environmental justice, helping undo and guard against disproportionate impacts of pollution and other environmental impacts on the health and well-being of minority and low-income communities. The responses may also involve helping the region cope with future potentially catastrophic events—as occurred with Superstorm Sandy and the pandemic. The NJTPA is committed to working with its member and partner agencies and the public to ensure that protecting and improving the environment continues to be a priority of regional planning and investment.
Figure 6-5: Historic Resources
Source: NJDEP, 2021; NJOIT, 2008; NJTPA, 2021.
Jersey City, Hudson County
Financing Plan 2050
NORTH JERSEY FACES transportation infrastructure needs and funding challenges, which Plan 2050 describes in detail. This chapter provides a financial plan for implementing identified projects and programs, ensuring a balanced vision for investment in the transportation system. ■ Plan 2050’s financial assumptions and identified improvements were developed in part considering emerging trends and potential significant changes in demographics, economics, the environment, user behavior, and technology. A key consideration is COVID-19’s impact, which the NJTPA projects will affect transportation financing in the near to mid-term as funding sources slowly recover. In the longterm, most economic indicators, including gross domestic product (GDP) and unemployment, are projected to return to historical averages. To address the uncertainty inherent with long-range transportation funding spanning decades, the NJTPA developed three funding
Elizabeth, Union County ▶
Notable Factors Affecting the Financial Element
Increased expenditures to fortify the existing transportation network and construct future infrastructure to be more resilient and provide redundancy.
Electric Vehicles
Changes in policy to focus less on taxes levied on gasoline sales and more on VMT or other assessed user-based fees or taxes.
Increased infrastructure investments by the public sector in EV infrastructure and conversion of transit agencies’ fleets to zero emissions vehicles.
Increased telecommuting and altered commuting patterns as a result of COVID-19 are likely to continue post pandemic, likely resulting in reduced transit use and associated revenues; vehicle miles traveled (VMT) and autorelated fees and taxes; among other possible impacts.
scenarios to assess resources available under differing futures.
The Financial Element described in this chapter was developed following the guidance of the NJTPA Board of Trustees, in collaboration with planning partners and using sound analytical data driven methods. It identifies traditional and non-traditional funding sources to implement a program of infrastructure investments to improve roads, rail, non-motorized and other infrastructure, thereby supporting a strong and sustainable regional economy for the benefit of all.
Regional Outlook
Historic and current economic trends play a large role in estimating the funding available for transportation through 2050. The Financial Element takes a conservative approach when forecasting the later years of the planning horizon, basing funding growth on projected inflation and within the historical average annual funding growth rate, with additional federal funds for anticipated critical projects. This approach reflects reasonable future expectations for key revenue sources, including state and federal gas excise taxes. It must be stressed that the gas tax, the major source of funding for transportation infrastructure, is not keeping pace with the region’s transportation needs due to several factors including the increasing fuel efficiency of vehicles and adoption of electric vehicles. Both trends are expected to dramatically increase over Plan 2050’s 30-year planning period.
New Jersey’s economic strength in trade, corporate and financial services, pharmaceuticals, information technology and other areas, as discussed in Chapter3, should continue to contribute to sustained funding growth that can support the investment needs in this plan. Projections for population and employment, also outlined in Chapter 3, point to increases in travel demand on all aspects of the transportation network. Technological advances such as ITS and autonomous vehicles will make the system more efficient and able to accommodate some increased demand. However, the region will still need to address potentially greater congestion, wear to roads and bridges, insufficient transit capacity, and other challenges, as outlined in Chapter4, System Performance. These increasing needs provide the context for the funding scenarios discussed in this chapter.
Climate Change
Teleworking
Long-term economic projections are particularly important in preparing the Financial Element because of federal requirements that the plan be based on year-of-expenditure dollars (YOE $). This means that future expenditures and funding must be adjusted to reflect the impact of inflation. The annual rate of consumer inflation for North Jersey is expected to be 2.3percent per year over the Plan 2050 30-year period. This rate of inflation is based on the historical growth in the larger New York-New JerseyConnecticut metropolitan region and is consistent with Rutgers University’s R/ECON forecasts for New Jersey.
Although the Financial Element is largely informed by economic and demographic projections and histor-
WHAT WE HEARD
along with other taxes and federal general fund contributions, are deposited into the Highway Trust Fund (HTF) and the Mass Transit Account (MTA). The NJTPA region receives a portion of these funds pursuant to the federal Surface Transportation Program currently authorized by the FAST Act, which was adopted in 2015, expired in 2020 and was extended an additional year through September 30, 2021. From 1998 to 2018, the FHWA and FTA funds apportioned to New Jersey have grown on average by 3.0 percent and 3.9 percent per year, respectively, outpacing the consumer price index (CPI) growth of 2.3 percent per year over the same period. While the federal administration is proposing a significant increase in funding over the near and mid-term,
“Maintenance of New Jersey roads is supported primarily by the gasoline tax. As all electric vehicles become more predominant in the future, how will the funding for maintenance of highways be provided? All electric vehicle tires wear out the roads just as quickly as an internal combustion engine vehicle.”
ical transportation funding levels, many other factors will impact and possibly disrupt future funding levels and transportation investment needs. These factors are varied—notably changes in climate change impacts, technology innovation, travel options and preferences, and land use.
However, predicting how these factors will evolve over a 30-year planning horizon, how they might interact with one another, and how significantly they might impact transportation funding and expenditures is highly uncertain. Therefore, it is important to monitor and reassess how these factors develop over time and what impacts they generate.
Capital Funding Sources
FEDERAL FUNDING SOURCES
The federal government provides transportation funding for the State of New Jersey through numerous programs and grants administered by the FHWA and the FTA. Federal and state motor fuel taxes are the primary revenue sources for funding the region’s transportation investment. Federal motor fuel taxes,
—Union COUNTY RESIDENT, ONLINE SURVEY
NJTPA is taking a reasonably conservative position by projecting that funding will grow at a somewhat slower rate than the historical average given the inherent uncertainties of forecasting fiscal conditions over an extended period.
STATE OF NEW JERSEY FUNDING SOURCES
The New Jersey Transportation Trust Fund (TTF) funds capital improvements for the state’s transportation system. It provides required matching funds, which vary across programs, necessary to receive federal funds. The TTF receives annual appropriations from the state Petroleum Products Gross Receipts Tax, State Motor Fuel Tax, State Sales & Use Tax on vehicle purchases, vehicle registration fees, and Toll Road Authority revenues. The state has periodically raised the rate of taxes that fund the TTF to keep pace with the program’s needs. State legislation enacted in 2016 raised the motor fuel tax and Petroleum Products Gross Receipts Tax from a combined 14.5 cents per
Funding Challenges and Opportunities
gallon to 37.1 cents per gallon. This was a significant funding increase that helps the state and the NJTPA region put resources towards much needed investments to address the backlog of needs. In addition, by voter approval, all motor fuels tax revenues are now constitutionally dedicated for transportation purposes.
The TTF is protected from declining gas tax collections, pursuant to the 2016 legislation, which requires the gas tax to be annually adjusted, if required, to provide at least $2.0 billion in annual funding through 2024. The gas tax was increased in 2020 by approximately 22 percent to 50.7 cents per gallon due to the drastic drop in motor fuels taxes and other fees resulting from pandemic related lower levels of travel. Prior to 2016, New Jersey had the second-lowest fuel tax in the country. The state now has the fourth-highest fuel tax behind California, Pennsylvania, and Illinois. Total TTF funding has grown by 5.7 percent per year on average from 2000 to 2020, largely driven by the Petroleum Products Gross Receipts Tax in the last few years.
While the FAST Act and its expected successor provide predictable federal transportation funding, the federal program still faces significant challenges. Motor fuel tax collections have not kept up with the program’s needs in large part because the federal gasoline tax has not been raised since 1997 and motor fuel consumption continues to decline, as noted previously. This trend is projected to increase as factors such as electric, hybrid, and other alternatively powered vehicles proliferate; many residents continue to prefer denser, transit accessible places to live—despite short-term pandemic patterns; and teleworking increases. In recent years, Congress has used appropriations from the General Fund and selected nontransportation funding sources to cover the federal funding gap.
To help mitigate pandemic-related, near-term fiscal stresses, the American Rescue Plan Act appropriated $43.2 billion primarily to transit agencies, aviation, and Amtrak. For New Jersey, the American Rescue Plan includes an estimated $2 billion for NJ TRANSIT, an additional $77 million for the Portal North Bridge and resources to support New Jersey’s airports. The Biden administration is proposing a longer-term, broad-based infrastructure program which could
Freehold, Monmouth County
include as much as $312 billion for transportation out of a total of $579 billion, which also includes funding for broadband access and resiliency.
The State TTF is also primarily reliant on the motor fuels tax and has kept pace with program needs better than federal funding programs due to periodic rate increases. Current funding legislation expires in 2024, at which time it is expected the legislature will reauthorize the TTF. Nevertheless, TTF funding is projected to be increasingly impacted by many of the same factors affecting federal transportation funding sources.
One of the biggest funding challenges facing the region is the need to support ongoing NJ TRANSIT operations and to substantially increase resources available for enhancing and expanding transit services. In addition to funding needed for the Gateway Program and supportive projects to realize its full capacity (see Chapter 5), initiating the many worthwhile and needed transit improvements for the region will require more stable and predictable funding at a level to meet increasing demand. NJ TRANSIT is the largest public transit operator in the country and has made strides to improve its financial stability in recent years, yet still has continued financial constraints.
The Plan 2050 planning period will include multiple reauthorizations for federal and state transportation funds. It is anticipated that federal and state elected officials will continue to support funding for the region’s transportation needs given the long-term history of support for these projects and programs. It is also likely that, over the long run, project delivery methods and funding sources will evolve to include more public-private partnerships. There will be less reliance on fossil fuel-based revenues and other innovative approaches will emerge to meet critical transportation needs. Potential funding sources may include the application of a VMT tax, carbon tax, value capture, toll revenue capture, or other sources of revenue. New Jersey, along with many other states, is studying and piloting alternative funding and financing mechanisms. In 2020-2021, New Jersey participated in a multi-state study of VMT-based funding to evaluate its potential impact on travelers and funding levels.
Other examples of alternative funding include a Congressional proposal to monetize toll credits, where
states with a surplus of credits can sell them to states in need of credits to meet federal match requirements. At the state level, increasing use of the New Jersey Transportation Infrastructure Bank (I-Bank), which provides low interest transportation financing for local and regional public entities, can fill the gap for local transportation improvement needs.
Project and program development and implementation are highly complex and costly within the NJTPA region. Cost-effective use of funds will depend on continuing efforts to streamline project delivery from the planning stage to construction, including reducing unnecessary delays and exploring new approaches to project implementation, such as designbuild and design-build-operate-maintain contracts. In addition, effective use of the latest technologies (including advanced materials) will maximize the benefits achieved. Over the life of the plan, new technologies, if applied effectively, may contribute to increased efficiencies and cost reduction.
Revenue Assumptions
The state’s FY 2022 Transportation Capital Program (TCP) allocates $29.1 billion in state and federal funding to the NJTPA region over ten years, through 2031. The region receives about $600 million in additional funds from various sources to support its portion of NJ TRANSIT operating costs.
Hoboken, Hudson County
The NJTPA has worked closely with NJDOT, NJTRANSIT, the Port Authority of New York & New Jersey, the New Jersey Turnpike Authority, and other partner agencies to assess the long-term funding and expenditure needs for the region and to determine the appropriate assumptions about future transportation funding.
Three funding scenarios were developed for this Financial Element to examine impacts of various potential capital funding levels, as follows: Plan 2050 (the fiscally constrained scenario), a Limited Scenario, and an Aspirational Scenario. The impacts of these three scenarios on various initiatives—such as trans-Hudson rail improvements and reducing the backlog of road and bridge projects—are addressed in the expenditures section later in the chapter.
Common Assumptions for Funding Scenarios
The funding forecast covers the period from FY 2022 through FY 2050. All three scenarios incorporate the funding assumptions from the TCP for the first ten years, which corresponds to the near and mid-term time periods. The combination of state and federal funding in the TCP averages $2.9 billion (YOE$) annually ($1.4 billion federal funding with $1.5 billion state funding) and includes funding for the Gateway Program’s Portal North Bridge project. In addition to funding from the TCP in the near- to mid-term, there is also funding for possible future projects from the Study and Development Program, further Gateway Program capital investments, and additional transit capacity expansion from the FTA’s
Capital Investment Grant (CIG) Program, all of which vary greatly depending on the scenario. The Study and Development program includes concept development studies that assess potential project needs—including alternatives, feasibility, and environmental concerns— which may justify future funding.
Over the long-term, beginning in FY 2032, funding and expenditures for scenarios continue to diverge markedly based on the assumed general funding growth rates, funding from the Study and Development Program, further Gateway Program capital investments, and additional funding for transit capacity expansion from the FTA’s CIG Program. Funding growth rates are applied to all programs in the current TCP (NJDOT regionwide and statewide projects and programs and NJ TRANSIT projects and programs), which are carried forward into the longterm, as well as to the CIG Program. The forecast utilizes three different time periods to illustrate changes throughout the duration of the 2050 plan. The time periods are:
¡ Near-term (FY 2022—FY 2025)
¡ Mid-term (FY 2026—FY 2031)
¡ Long-term (FY 2032—FY 2050)
The near and mid-term time periods of the capital funding projections are largely based on NJDOT and NJ TRANSIT funding assumptions for the NJTPA region. Federal and state funds will continue to provide most of the resources for the region’s transportation needs. A small portion of funding is made up of other sources, including programmed contributions from the Port Authority, New Jersey Turnpike Authority and Metro-North, which provides funding support for shared commuter rail services with NJTRANSIT.
Funding Scenarios Overview
Funding levels and assumptions for the three Financial Element funding scenarios are summarized in Table7-1.
Seaside Park, Ocean County
PLAN 2050 SCENARIO CAPITAL FUNDING LEVELS AND ASSUMPTIONS
The Plan 2050 Scenario is a reasonable and wellgrounded financing plan for underwriting the projects, programs, and investments called for in this plan. The Plan 2050 Scenario is fiscally constrained, only relying on reasonably anticipated funding and is intended to be politically feasible. It supports a level of funding to maintain the transportation network in a state of good repair and provides capacity for targeted transit, highway, and nonmotorized improvements and capacity expansion projects.
The total capital funding available under this scenario is YOE $120.6 billion (Table 7-3) over the plan period, averaging YOE $4.2 billion annually. In this scenario, state and federal transportation funding levels are based predominantly on the FY 2022 TCP in the near to mid-term, which includes funding for Gateway Program’s Portal North Bridge project, as noted under the Common Assumptions section. Funding is also included for all planned regional projects in the Study and Development Program, as well as work on the Gateway Program’s projects, including the construction of the new Hudson River Tunnel, initiation of the modernization and rehabilitation of the North River Tunnel, replacement of the Sawtooth Bridge, rehabilitation of the Dock Bridge, and construction of the Harrison Fourth Track.
Over the long-term (FY 2032 to FY 2050), state and federal transportation funding is projected to increase at an average rate of 2.3 percent per year (Table 7-1). This annual rate is consistent with the long-term inflation forecast for New Jersey over the Plan 2050 period. Funding for NJDOT and NJTRANSIT programs in the FY 2022 TCP is carried forward into the long-term. Funding for transit capacity expansion from the FTA’s Capital Investment Grant Program starts at a base of $110 million per year (with equal non-federal match) in FY 2032. The anticipated annual funding from the FTA is equivalent with that assumed under the previous Long Range Transportation Plan, Plan 2045, adjusted for inflation in year of expenditure (YOE) dollars.
While the most heavily traveled roads and bridges in North Jersey are under the state’s jurisdiction, county and local governments are responsible for maintaining and upgrading more than 90 percent of road miles and about 40 percent of bridges. To assist with this responsibility, NJDOT and NJ TRANSIT statewide and regionwide programs in the TCP provide significant transportation funding to county and local governments in the NJTPA region within all three scenarios. Illustrative examples include the Local Municipal Aid, Local County Aid, and Local Bridges programs, which are projected to provide YOE $3.4billion, YOE $3.4 billion, and YOE $1.1 billion
TABLE 7-1: Scenario Funding Levels and Assumptions
respectively, through 2050 for the Plan 2050 Scenario. While this maintains the spending power of local aid with respect to inflation, fully meeting growing needs will likely require additional funding—at the level of the Aspiration Scenario.
LIMITED SCENARIO CAPITAL FUNDING LEVELS AND ASSUMPTIONS
The Limited Scenario is the most conservative of the three scenarios, providing a level of transportation funding significantly less than the Plan 2050 Scenario. The total capital funding available under this scenario is YOE $101.8 billion (Table 7-5) over the plan period, averaging YOE $3.5 billion per year, which is 16 percent less than the Plan 2050 Scenario funding level. Under the Limited Scenario, the region would continue to make investments in the transportation network at levels sufficient to maintain the network in a state of good repair, but not enough to fund targeted transit, highway, and nonmotorized improvements and capacity expansion projects. Over the near- to midterm, state and federal transportation funding consists almost entirely of the FY 2022 TCP, with limited funding (only in the near-term) for planned regional
projects in the Study and Development Program and no funding for additional Gateway Program projects aside from the Portal North Bridge project, which is already included in the FY 2022 TCP.
Over the long-term (FY 2032 to FY 2050), state and federal transportation funding increases at an average rate of 1.9 percent per year. This annual growth rate falls below the forecasted rate of longterm inflation (2.3 percent) and approximates the inflation rate observed during the 2005—2015 period, which included historically low rates during and after the Great Recession, followed by a period of economic recovery. Long-term funding consists entirely of NJDOT and NJ TRANSIT programs in the FY 2022 TCP that are projected over the long-term. No funding is included from the Study & Development Program, FTA’s Capital Investment Grant Program, or the Gateway Program.
ASPIRATIONAL SCENARIO CAPITAL FUNDING LEVELS AND ASSUMPTIONS
The Aspirational Scenario reflects a fiscal environment where economic conditions and policy decisions support a level of transportation funding significantly
Fort Lee, Bergen County
greater than what the Plan 2050 Scenario affords, providing additional capacity for transit, highway, and nonmotorized improvements and targeted capacity expansion projects. The total capital funding available under this scenario is $147.5 billion (Table 7-7) over the plan period, averaging YOE $5.1 billion per year, which is 22 percent greater than the Plan 2050 Scenario. Over the near- to mid-term, in addition to the FY 2022 TCP, this scenario includes funding for all planned regional projects in the Study & Development Program and for the full Gateway Program. Funding for two Gateway Program projects, including the modernization and rehabilitation of the North River Tunnel and construction of the NJ TRANSIT Storage Yard, will carry over into the long-term period. The numerous individual projects that make up the Gateway Program are outlined in Chapter 5.
There is also funding for additional transit capacity expansion from the CIG Program, which starts at a base of $140 million per year (with equal non-federal match) in FY 2025 and continues through the remainder of the plan period. This level of annual funding is equivalent with that assumed for the Aspirational Scenario in Plan 2045, adjusted for inflation in year of expenditure (YOE) dollars.
Over the long-term (FY 2032 to FY 2050), state and federal transportation funding increases at a rate of 3.3 percent per year. Although higher than in the other two scenarios, this annual growth rate is nonetheless a reasonably conservative figure, in between the projected inflation rate of 2.3 percent per year and the historical transportation funding growth rate of 4.3percent per year (including federal and state funding sources) observed between 1998 and 2018. Funding for NJDOT and NJ TRANSIT programs in the FY 2022 TCP is carried forward into the longterm. Also included is funding for all planned projects in the NJTPA region in the Study & Development Program and the completion of the Gateway Program.
Achieving the substantial increase in transportation funding outlined in the Aspirational Scenario is not unprecedented. Between 1998 and 2018, there were eight years in which transportation funding met or exceeded the 3.3 percent Aspirational growth rate. Legislation underwriting the interstate highway system and the creation of state and federal transportation trust funds occurred during periods of economic
expansion when elected officials and the public recognized the importance of providing adequate and stable funding sources for transportation. Future economic expansion could reasonably underwrite a new era of state and federal commitments to transportation investment at the level of the Aspirational Scenario. Current discussions at the federal level about major infrastructure investments, which may or may not come to fruition, indicate a recognition of needs and an ongoing willingness to address them.
Expenditures and Investments OPERATING EXPENDITURES
While capital funding is critical for the repair and upgrade of the existing transportation network and for targeted capacity increases, NJDOT and NJ TRANSIT also require and receive appropriations from the state General Fund for ongoing operations. Any capacity increases will also need operating resources.
State General Fund appropriations cover NJDOT’s direct maintenance and operations expenses, including snow removal, road surface upkeep, maintenance of roadside lighting, vegetation, inspections, technical studies and general and administrative services. The FY 2021 appropriation is $30.7 million per year. If adjusted at 2.3 percent annually to keep pace with projected inflation, the appropriation for NJDOT’s annual operating expenses would total $59.5 million
Jersey City, Hudson County
per year by 2050. Actual appropriations have declined in recent years due to ongoing constraints on the state budget. Continued reductions in funds to cover operating expenses over time could affect NJDOT’s ability to monitor and maintain the roadway and bridge network and lead to higher capital costs, longer-term capital costs, or both.
As the third largest transit agency in the country, NJ TRANSIT’S operating funding needs are substantial. The extensive transit services provided by the agency are described in Chapter 5. Providing the best possible customer service is a major emphasis of NJTRANSIT, along with being careful stewards of tax-payer dollars which are annually appropriated by the NJ State Legislature. NJ TRANSIT is constantly pursuing initiatives to maximize system-generated funding to reduce dependence on taxpayer supported funding. Expenses are controlled in a similar fashion to ensure the most cost-effective means of delivering service. NJTRANSIT also aggressively pursues being in a state of-good-repair.
Partnering with other public agencies, communities and the private sector is a common practice that is needed and encouraged in these financially challenging times. Such partnering extends to operating services since farebox revenues do not fully cover operating costs.
NJ TRANSIT continues to be one of the most
efficient transit operators, with almost 50 percent of its operating budget prior to the pandemic supported by passenger fares and other system-generated revenues (such as parking fees and advertising payments). NJTRANSIT’s 2021 operating budget projects an expenditure of about $2.6 billion to provide public transit services on the current system. The NJTPA region accounts for approximately 80 percent of these costs, or about $2.1 billion (Table7-2). The expenses that are not covered by system revenues are supported by yearly appropriations from the State and by various federal funding sources.
Reliance on capital funding for operations must also be reduced and NJ TRANSIT is making progress on the issue. The FY 2022 capital budget calls for $360 million in state and federal capital funding to be used each year to support NJ TRANSIT operations, principally involving major repair and rehabilitation projects for bus and rail vehicles, down from $480million per year in previous years. Part of this shortfall is being met through greater contributions from the NJ Turnpike Authority, which is increasing its support of NJ TRANSIT to $350 million in FY 2022 to up to $500 million in future years. Over the long-term, this plan calls for the adoption of state policies and funding mechanisms that would allow the use of capital funds for operating expenses to be phased out, with the diverted capital funding redirected to other needs.
NJ TRANSIT’s projected annual operating costs will increase to $6.2 billion per year by 2050, or nearly $5.0 billion per year within the NJTPA region (Table 7-2). These NJ TRANSIT projections are based on existing services and projected growth and include allowances for inflation, growth in service to accommodate a moderate rate of growth in ridership demand, and limited initiation of new services beyond the current system.
NJ TRANSIT will place a continued emphasis on future partnerships and efficiencies to hold down expenses. NJ TRANSIT estimates that expenses related to increases in service levels to accommodate projected growth in demand is about 1.1 percent per year for rail service and 0.6 percent for both bus and light rail. Expansion of NJ TRANSIT’S existing light rail services are included, such as the Hudson Bergen Light Rail extensions into Bergen County on
TABLE 7-2: NJ TRANSIT Annual Operating Budget Projections for the NJTPA Region (year of expenditure in millions)
the Northern Branch and west of Route 440 in Jersey City.
There are several active initiatives to determine the future service needs and capacity expansion of the major public transit connections from New Jersey to Midtown Manhattan which will have implications for transit operating budgets and needs. The Federal Railroad Administration (FRA), Amtrak and Port Authority are each advancing different initiatives to guide future development of the rail and bus systems.
CAPITAL EXPENDITURES
Decisions about how funding will be allocated among transportation investment types for the Plan 2050 Scenario are guided by the Regional Capital Investment Strategy (RCIS). The RCIS considers a long-term horizon and sets allocation targets for twelve categories of capital investment with a balanced approach to future transportation spending in the region that enhances mobility, economic development, quality of life, resiliency, and social equity. While the Plan 2050 Scenario’s transportation expenditures approximate the RCIS allocation targets, expenditures for the Limited and Aspirational Scenarios differ where appropriate. Further information on the RCIS is in Appendix C.
It should be noted that although investments are assigned a single category in the RCIS, there is inevitable overlap between the categories. As a result, the level of investment in each RCIS category is only approximate. Of particular note, investments in road or bridge projects normally include improvements that benefit freight and pedestrian/bicyclists, even though funds for these purposes are not categorized as such. The freight and pedestrian/bicycle RCIS categories only include projects dedicated to improving those modes.
Plan 2050 Scenario Capital Expenditures
Guided by the RCIS, the Plan 2050 Scenario is intended as a realistic and balanced approach for making future transportation investments. To match projected funding, total expenditures are projected to be YOE $120.6 billion (Table 7-3) over the plan period, averaging YOE $4.2 billion per year. While most investments are focused on maintaining the existing transportation network in a state of good repair, the Plan 2050 Scenario includes select upgrades and improvements to the transportation network to enhance system capacity, performance, resiliency, and
Lambertville, Hunterdon County
TABLE 7-3: Plan 2050 Scenario (billions of year of expenditure dollars)
TABLE 7-4: Plan 2050 Scenario Annual Averages (billions of year of expenditure dollars)
*Other includes Port Authority of New York and New Jersey, New Jersey Turnpike Authority and Metro-North contributions.
equity. This scenario includes the implementation of projects and programs included in the Project Index (located at the back of this plan) over the near, mid, and long-term.
With regards to transit investments, the Plan 2050 Scenario supports NJ TRANSIT’s ten-year strategic plan (https://njtplans.com), which focuses on maintaining the agency’s assets in a state of good repair, improving operational performance, enhancing customer experience, improving safety, and making the system more resilient. The Plan 2050 Scenario includes a subset of Gateway Program projects including the construction of the new Hudson River Tunnel,
modernization and rehabilitation of the existing 100-year-old North River Tunnel, replacement of the Portal North Bridge and Sawtooth Bridge, rehabilitation of the Dock Bridge, and construction of the Harrison Fourth Track. These projects provide the foundation for the more extensive long-term Gateway Program projects included in the Aspirational Scenario.
In addition, several prospective transit projects in the region, including those that are now undergoing planning and environmental review, may be candidates for future federal and state funding assumed in the Plan 2050 Scenario. Potential future transit projects
TABLE 7-5: Limited
(billions of year of expenditure dollars)
(RCIS CATEGORIES)
TABLE 7-6: Limited Scenario Annual Averages (billions of year of expenditure dollars)
are outlined in Chapter 5. However, as discussed in Chapter 5, most transit expansion projects focused on increasing access to New York City cannot proceed until additional rail capacity is created through the Gateway Program.
Limited Scenario Capital Expenditures
The Limited Scenario is the most conservative of the three scenarios, with significantly less transportation expenditures than the Plan 2050 Scenario. The scenario focuses on preserving the transportation network in a state of good repair at the expense of system enhancement and expansion. Other than the projects
programmed in the FY 2022 TCP, including the Portal North Bridge, there are no expenditures for significant system expansion including critically needed trans-Hudson capacity. To match funding, total expenditures are YOE $101.8 billion (Table 7-5) over the plan period, averaging of YOE $3.5 billion per year, which is 16 percent less than the Plan 2050 Scenario.
The NJTPA prioritizes maintaining a safe transportation network in a state of good repair for all three scenarios. Because of the Limited Scenario’s lower level of overall transportation investment, the proportion of expenditures allocated to system preservation and safety through the RCIS categories of
Scenario
TABLE 7-7: Aspirational Scenario (billions of year of expenditure dollars)
Annual Averages (billions of year of expenditure dollars)
*Other includes Port Authority of New York and New Jersey, New Jersey Turnpike Authority and Metro-North contributions.
bridges, road preservation, transit preservation, and direct safety is higher than the Plan 2050 Scenario. This reallocation results in reduced expenditures for the remaining RCIS categories, which focus on system enhancement and expansion. As a result, under the Limited Scenario, the region will maintain the existing transportation network, but will be less prepared to meet the demands on the transportation system of a growing population and economy. If the region and state face future crises that substantially cut transportation funding capacity, this scenario provides a reasonable “fallback position” for transportation investment.
Aspirational Scenario Capital Expenditures
The Aspirational Scenario is a more robust, yet feasible spending approach for the region. It identifies additional transit, highway, nonmotorized improvements and capacity expansion investments that could potentially be made if significant new transportation funding were realized. To match funding, total expenditures are YOE $147.5 billion (Table 7-7) over the plan period, averaging YOE $5.1 billion per year, which is 22 percent higher than the Plan 2050 Scenario. This scenario includes all the investments assumed in the Plan 2050 Scenario, as well as greater expenditures on projects and programs across most
TABLE 7-8: Aspirational Scenario
transportation categories. Notably, the Aspirational Scenario includes $39 billion in transit expansion (Table 7-7) that supports the construction of the full Gateway Program, as well as a larger list of other prospective transportation projects than is included in the Plan 2050 Scenario, which may be candidates for future federal and state funding assumed in this scenario. The numerous individual projects that make up the Gateway Program are outlined in Chapter 5, as well as other potential future transit projects.
As with the Limited Scenario, transportation expenditure allocations differ from the RCIS allocation targets. Specifically, the additional expenditures available in the Aspirational Scenario (above what the Plan 2050 Scenario includes) are allocated to all the RCIS categories except for bridges, road expansion, road enhancement, and road preservation. These categories would remain funded at Plan 2050 Scenario levels, which are projected to be sufficient to meet the demands on the transportation system of a growing population and economy. The remaining transportation expenditures categories of transit preservation, transit enhancement, transit expansion, TDM, direct bike/ped, direct safety, direct ITS, and dedicated freight would receive considerably more funding than the Plan 2050 Scenario. If the region and state are able
to secure additional funding capacity, this scenario provides a reasonable path forward for expanded investment to meet the transportation demands of the future.
Other Funding for Transportation
The state and federal investments discussed in this chapter are supplemented by additional investments by other transportation agencies—principally, the Port Authority of New York & New Jersey, New Jersey Turnpike Authority, and the Delaware River Joint Toll Bridge Commission. Their investments will continue over the life of this plan. Key projects planned by the authorities are included in the Project Index. While these agencies fund their capital and operating needs through user fees and other sources of revenue outside the scope of Plan 2050, their transportation investments and services are integral to the North Jersey region and contribute to its mobility and economic growth. The following provides a brief overview of these agencies and their contributions to the NJTPA region’s transportation network.
Red Bank, Monmouth County
PORT AUTHORITY OF NY & NJ
Key facilities operated by the Port Authority within the NJTPA region include Newark Liberty International Airport, Teterboro Airport, the PATH rail system, the port complex in Newark and Elizabeth and major New York-New Jersey crossings—the Outerbridge Crossing, Goethals Bridge, Bayonne Bridge, Holland Tunnel, Lincoln Tunnel, and George Washington Bridge. The agency has built passenger ferry facilities, maintains roadways within its facilities, provides on dock and cross-harbor rail-freight service, and contributes to other key infrastructure elements that access its facilities and aid the movement of goods and people throughout the region. The Port Authority is financially self-sustaining and must raise funds through tolls, fares, rentals and other user charges for capital and operating expenses needed to provide services to the public. Port Authority facilities and financial resources are not included within the definition of the federally supported surface transportation system used to establish the fiscally constrained Plan Scenario.
The Port Authority’s 2017-2026 $37 billion capital plan (reassessed in 2019) features investments spread over a broad portfolio of assets and facilities with the goal of keeping them efficient, safe, secure, and reliable. In addition to investing in its own assets, the Port Authority’s capital plan allocates up to $2.7 billion in debt service support for the Gateway Program. Major projects include essential state-ofgood-repair investments at the George Washington Bridge, the Lincoln Tunnel Helix Replacement
Program, Port Wharf and Berth Replacement Program (which includes pier replacement and improvements at Port Newark/Elizabeth and Port Jersey), near-term improvements and the long-term replacement of the Port Authority Bus Terminal, PATH initiatives including capacity, reliability and service frequency improvements, extension to Newark Liberty Rail Link Station and new car purchases. The Port Authority ten-year plan notes that the agency may seek to leverage its capital investments to secure additional discretionary federal funding and financing assistance and public-private partnership financing for major projects that enhance the region’s surface transportation capacity.
NEW JERSEY TURNPIKE AUTHORITY
The Turnpike Authority operates and maintains both the New Jersey Turnpike and the Garden State Parkway. The Turnpike is 146 miles long (56 miles in the NJTPA region) and includes 27 interchanges, nearly 500 bridges and 12 service areas. The Garden State Parkway is 173 miles long (121 miles within the NJTPA region) and includes 90 interchanges, approximately 300 entrance and exit ramps and nearly 500bridges.
The Turnpike Authority’s funding comes from toll revenues, which it uses to meet operations and maintenance expenses, finance capital needs, and to contribute to the TTF. The Turnpike Authority’s $24.1 billion twenty-year capital improvement program focuses on maintaining the Turnpike and Parkway in a state of good repair and investment in certain capacity improvements including widening the Parkway between interchanges 98 and 163, widening the Turnpike between interchanges 1 and 4 and 14 through 14C to the terminus of Turnpike at the Holland Tunnel, alignment widening between the Southern Mixing Bowl and Interchange 16W, as well as installation of all electronic tolling. On-going investments include pavement preservation and wall replacement. In addition, it provides $22 million per year to the TTF, plus additional funds for feeder road maintenance ($2.5 million in CY 2020 and annually through CY 2024), and additional funds per prior and existing state transportation funding agreements ($129.0 million in CY 2020 and $264.5 million in CY2021).
Westwood, Bergen County
AMTRAK
Amtrak owns the Northeast Corridor (NEC) and provides intercity passenger rail service that includes regional and high-speed Acela trains connecting North Jersey with Philadelphia, Wilmington, Baltimore and Washington, D.C. to the south; New York City, Providence and Boston to the north; along with other metropolitan areas throughout the nation.
Amtrak, in concert with NJ TRANSIT, the Port Authority, and the Gateway Development Commission, is planning and developing the Gateway Program, which will allow the doubling of passenger trains on the NEC between Newark Penn Station and New York Penn Station. The Gateway Program consists of numerous individual projects which are detailed in Chapter 5. The recently completed $1.6 billion Moynihan Station Project is not technically part of the Gateway Program. However, it is an essential part of increasing the capacity of New York Penn Station through the renovation of the James A. Farley
Building, formerly NYC’s main post office building, into a train hall.
DELAWARE RIVER JOINT TOLL BRIDGE COMMISSION
This commission maintains and operates seven toll bridges and 13 non-tolled bridges over the Delaware River spread out along 139 miles between Bucks County, Pennsylvania, and the New York State line. All Delaware River toll bridges are in the NJTPA region except for the Trenton-Morrisville Bridge. The commission is also responsible for the repair and maintenance of the first seven miles of I-78 in Warren County. The commission relies on its toll revenues to fund operations, maintenance, and capital needs. Capital projects are focused on bridge repair, replacement, and rehabilitation.
Paterson, Passaic County
Rumson, Monmouth County
Moving Forward
THIS PLAN HELPS CHART a course through uncertain and challenging times to continue progress towards a more efficient and sustainable transportation future, holding to the themes of Transportation, People, Opportunity. While the worst of the pandemic appears to be ending as this plan is being finalized for approval in fall 2021, the crisis has altered much about life in North Jersey, including the essential functioning of the transportation system and expectations for how, when and where we travel. ■ Even before the pandemic, other changes, such as the growth of e-commerce, were occurring that only accelerated with the crisis. The NJTPA has been challenged to meet emerging new economic, social, and environmental priorities in its planning work. This includes making our plans and programs more inclusive for the benefit of all and meeting the growing threats of climate change. At the same time, technologies have advanced to offer prospects for new approaches
to enduring problems. But despite the changes, many fundamental needs and issues continue—the needs to repair or replace aging bridges, support and expand bus and rail transit, upgrade signals and intersections and much more. As discussed in this plan, meeting these needs and the new priorities will grow more difficult without fresh approaches as demands on the system increase.
The way forward offered by this plan foresees the investment of some $120.6 billion through 2050, as discussed in Chapter 7. This averages $4.2 billion per year (factoring in inflation)—a reasonable and fiscally constrained path for future investment. If additional funding can be secured, the region could fulfill a more aspirational approach to improving regional transportation with investment of $5.1 billion per year.
Despite this and many other possible directions for the future in this plan, it is only a foundation. Much of the analysis, strategies and implementation steps offered are based on conditions over a relatively brief—and tumultuous—period of time since the last plan update in 2017. Congress, in creating the requirement that MPOs update their long-range transportation plans every four years, recognized that the vision
of the future they create must evolve with ever-changing circumstances and opportunities. Thus, many of the prescriptions and recommendations in this plan are likely to evolve based on new realities.
Most immediately, in the coming months and years, the state and region will be on its way to recovering from the deep economic disruptions of the pandemic. Some who lost employment or engaged in remote work likely will return to workplaces in large numbers. At the same time, many employers may adopt new work arrangements that could include continued remote options, new health precautions and less centralized operations as they may move some operations closer to where employees live. These changes will impact commuting patterns, transit ridership, office markets, transportation revenues and much more, requiring a reassessment of trends and key assumptions underpinning NJTPA’s transportation planning. There is also recognition that simply returning to the ways of 2019 will not build a more equitable and sustainable future for everyone.
In addition, new federal programs targeted to supporting recovery and improving infrastructure will take full effect and prompt new initiatives at the state, local and regional levels. These efforts will
Readington, Hunterdon County
take advantage of new data from the 2020 Census and ever-improving computing and transportation technologies.
The foundation provided by this plan will allow the region to flexibly meet the challenges and opportunities ahead. As always, this will require close coordination with regional partners, notably the 15 subregions, NJDOT, NJ TRANSIT and the Port Authority of New York and New Jersey (all of whom sit on the NJTPA Board), as well as Together North Jersey partners, who have collaborated with the NJTPA on many planning initiatives. All of these parties face and are responding to challenges brought on by the pandemic. Notably, NJ TRANSIT and the Port Authority have lost substantial revenue needed for essential operations and improvements due to reduced travel demand during the pandemic.
Like the NJTPA, partner agencies have plans and planning mechanisms to build for the future. Among the key plans and vision documents which were drawn upon in developing this plan and which will continue to guide its implementation are:
¡ Together North Jersey Regional Plan
¡ New Jersey 2020 Strategic Highway Safety Plan
¡ NJTPA Coordinated Human Services Transportation Plan (in coordination with the TMAs)
¡ NJTPA Transportation Demand Management Plan
¡ Port Authority 2017–2026 Capital Plan
¡ NJDOT Statewide Freight Plan
¡ NJT2030 (NJ TRANSIT 10-Year Strategic Plan)
¡ NJDEP 80x50 Report
¡ The Fourth Regional Plan (Regional Plan Association)
NJTPA’s coordination with partner agencies and organizations is facilitated not only by ongoing communications, including extensive collaboration at the staff level, but by the fact that there is a remarkable degree of consensus reflected in them about regional priorities and investments. This agreement includes support for the critical Hudson River Tunnel project to safeguard current transit commuting between New Jersey and New York and the larger Gateway Program to realize additional trans-Hudson capacity on which the future of efficient rail travel along the multistate Northeast Corridor depends. The interagency consensus also encompasses essential priorities in all areas
cited in the introduction as the focus of initiatives in this plan—safety, accessibility, equity, active transportation, climate change, transportation technologies and freight.
NJTPA’s coordination and collaboration to meet common goals extends to agencies in the wider metropolitan region, particularly neighboring MPOs: the New York Metropolitan Transportation Council, the MPO for New York City and downstate New York with which the NJTPA collaborates on forecasting and other efforts affecting the bi-state region; the two other MPOs in New Jersey, the South Jersey Transportation Planning Organization and the Delaware Valley Regional Planning Commission; the Lehigh Valley Planning Commission, the MPO for the Allentown, Pennsylvania area adjacent to the NJTPA’s western border; and the Metropolitan Area Planning (MAP) Forum, a consortium of 10 MPOs from New Jersey, New York, Connecticut and Pennsylvania. Members of the MAP Forum regularly share data and analysis on issues faced across the tri-state region and, among other efforts, are collaborating to address a critical shortage of truck parking and rest areas in the region.
To pursue this collaboration while implementing NJTPA’s long range priorities and adapting to a changing region, NJTPA develops detailed tasks and product descriptions for its annual Unified Planning
North River Tunnel, Hudson County
Work Program or UPWP. This work program guides the ongoing transportation planning activities of the NJTPA staff, its member agencies and other transportation agencies in the region.
The current UPWP was updated with tasks specifically oriented to fulfilling priorities identified as this plan was being crafted. These include tasks to develop an active transportation plan to promote walking and biking, revalidate the agency transportation model, enhance the agency’s ability to meet TitleVI civil rights requirements, examine freight rail crossings, further evaluate and measure transportation system performance, fund new rounds of subregional studies and local safety projects, assist municipalities in implementing complete streets, investigate concepts for key local infrastructure improvements and a host of other tasks. UPWP tasks in coming years will have to build upon these efforts and address changing conditions and trends. This work will set the course for the next
update of this long-range plan, which must be completed in 2025.
The next long range plan update and the plan updates that follow may have different titles and reflect new assessments of the region, but they will need to maintain the essential approaches signified in the themes of this plan, Transportation, People, Opportunity. Those themes reflect that transportation is not an end in itself but serves wider progress— improving the health and well-being of people, including our quality of life and the environment around us, together with fostering a growing and equitable economy that supports people, their families and businesses in all communities.
Montclair, Essex County
Plan 2050 Project Index
The following Project Index contains current and future candidate projects that have been identified through the metropolitan planning process in northern New Jersey and whose costs can be accommodated based on the 28-year funding assumptions as set forth in Chapter 7. The Index arrays projects by the county in which they are located. They are further arrayed by Highway/Bridges, Transit and Authority categories as well as by timeframe. Near-term projects are those that can be completed within one to four years. This includes projects contained in the 4-year NJTPA Transportation Improvement Program (TIP). Mid-term projects are scheduled to be completed in years 5 through 10. They include the six outyears of the 10-year State Transportation Improvement Program (STIP). Projects Under Study are in various stages of project development and are estimated to be completed during the final 15 years of the plan, years 13 to 28, should they move forward towards construction. Projects in the Study and Development Program are included in the “Projects under Study” category of the Index. Projects are listed in their respective timeframe category based on the year they will be completed. All costs are presented in Year of Expenditure dollars
Port Authority of NY & NJ Port Street Corridor Improvement Project PA2201Freight
*Denotes projects with Congressionally designated funding which does not necessarily reflect the full cost of projects, nor the YOE amount. **Projects are funded by DBNUM N063, NJTPA Future Projects.
***Projects are funded by unobligated Prior Year Funding.
Near-Term (FY 2022-FY 2025) Paterson Plank Road (CR 681), Bridge over Route 3 at MP
*Pedestrian Bridge over Route 440
Portway, Fish House Road/Pennsylvania Avenue, CR 659
(FY 2026-FY 2031)
3 & Route 495 Interchange
Projects Under Study
Baldwin Avenue, Bridge over Passaic and Harsimus Branch 18307 Bridges Central Avenue (CR 659), Bridge over Route 1&9T 18322 Bridges CR 501 (JFK Blvd), Rt 139 Conrail Viaduct Spans 18317 Bridges
Route 1&9, Bridge over NYS&W RR & Division Street 9240 Bridges to Fairview Avenue
Route 1&9, Route 22 to Route 46, ITS Improvements 03312 ITS Route 3 EB, Bridge over Hackensack River & Meadowlands Parkway15430 Bridges Route 440/1&9, Boulevard through Jersey City 06307 Road Enhancement
NJ TRANSIT
Near-Term (FY 2022-FY 2025)
Mid-Term (FY 2026-FY 2031)
*Denotes projects with Congressionally designated funding which does not necessarily reflect the full cost of projects, nor the YOE amount. **Projects are funded by DBNUM N063, NJTPA Future Projects.
***Projects are funded by unobligated Prior Year Funding.
Authority Projects
Near-Term (FY 2022-FY 2031)
New Jersey Turnpike Authority
TPK Newark Bay - Hudson County Extension Mainline Widening Program TPK22100Road Expansion
TPK Westerly Alignment Mainline Widening Between Southern Mixing Bowl - 15W and Replacement of Laderman Bridge
CR 531 (Park Avenue), Bridge over Lehigh Valley Main Line 14417 Bridges Grove Avenue, Bridge over Port Reading RR 14423 Bridges Intersection Improvement Program, Contract 2017-2 17302 Safety
Route 1, Route 130/Route 171 (Georges Road) to East Side Avenue18380 Road Preservation
Route 1, Stouts Lane/Promenade Blvd) to Thomas Avenue 18370 Road Enhancement
Route 9 North, Ramp to Garden State Parkway North 18321 Road Enhancement
Route 9/35, Main Street Interchange 079A Road Enhancement
Route 27, Eighth Avenue to Brookhill Avenue 19311 Safety
Route 27, Veronica Avenue/How Lane (CR 680) to Delavan Street19308 Safety
Route 34, Bridge over Former Brick Yard Road 17331 Bridges
*Denotes projects with Congressionally designated funding which does not necessarily reflect the full cost of projects, nor the
amount. **Projects are funded by DBNUM N063, NJTPA Future Projects.
***Projects are funded by unobligated Prior Year Funding.
Project Name DBNUM RCIS Category
YOE Estimate (in $ millions)
Route 130, CR 539 (North Main Street)/Cranbury Turnpike (CR 685) and Wyckoff Mill Road 18366 Safety
Main Avenue Corridor Improvements N1806Road Enhancement
Passaic Avenue, Ward Avenue 18377
Piaget Avenue (CR 628), Bridge over Passaic-NY Branch (Abandoned)17425 Bridge
*Denotes projects with Congressionally designated funding which does not necessarily reflect the full cost of projects, nor the YOE amount. **Projects are funded by DBNUM N063, NJTPA Future Projects.
***Projects are funded by unobligated Prior Year Funding.
Highway/Bridges Near-Term (FY 2022-FY 2025)
Route 202, First Avenue Intersection Improvements
Route 202/206, over Branch of Peter’s Brook, Culvert
(FY 2026-FY 2031)
Projects Under Study
Great Road (CR 601), Bridge over Bedens Brook (D0105)
Route 27, Veronica Avenue/How Lane (CR 680) to Delavan Street19308 Safety
Route 28 (Main Street), Bridge Street to Grove Street 19306 Safety
Route 202, Old York Road (CR 637) Intersection Improvements12332 Road Enhancement
Route 202/206 and Route 22 Interchange, Peters Brook to Commons Way 02372 Road Enhancement
Route 202/206, Bridge over Branch of Peters Brook 17333 Bridges
Route 287, Interchange 10 Ramp Improvements 9169QRoad Enhancement West County Drive Extension N2102Road Expansion
*Denotes projects with Congressionally designated funding which does not necessarily reflect the full cost of projects, nor the YOE amount. **Projects are funded by DBNUM N063, NJTPA Future Projects. ***Projects are funded by unobligated Prior Year Funding.
Project Name DBNUM RCIS Category YOE Estimate (in $ millions)
*Denotes projects with Congressionally designated funding which does not necessarily reflect the full cost of projects, nor the YOE amount. **Projects are funded by DBNUM N063, NJTPA Future Projects.
***Projects are funded by unobligated Prior Year Funding.
Project Name DBNUM RCIS Category YOE Estimate (in $ millions)
Stations, Access, Parking and Site Planning
Trans-Hudson Planning
Transit-Friendly Planning Program
NJ TRANSIT
TN21007Transit Enhancement
TN21008Transit Expansion
TN21009Transit Enhancement
*Denotes projects with Congressionally designated funding which does not necessarily reflect the full cost of projects, nor the YOE amount. **Projects are funded by DBNUM N063, NJTPA Future Projects. ***Projects are funded by unobligated Prior Year Funding.
Projects Under Study Bus
Rail
Ridership Forecasting
Stations, Access, Parking and Site Planning
Trans-Hudson Planning
Transit-Friendly Planning Program
*Denotes projects with Congressionally designated funding which does not necessarily reflect the full cost of projects, nor the YOE amount.
**Projects are funded by DBNUM N063, NJTPA Future Projects.
***Projects are funded by unobligated Prior Year Funding.
Project Name DBNUM RCIS Category YOE Estimate (in $ millions)