TRAFFIC
SPEED IN CETACEAN HABITATS
CANADA’S PACIFIC
DISCUSSION DOCUMENT
2021
SHIPPING
AND
ON
COAST
July
Prepared for WWF-Canada by Aurelie Cosandey-Godin, Elissama De Oliveira Menezes, Hussein Alidina, Miako Ushio and Will Meritt.
©Shutterstock CONTENTS EXECUTIVE SUMMARY 1 CETACEANS OFF CANADA’S PACIFIC COAST 2 SHIPPING IMPACTS ON CETACEANS AND THEIR HABITATS 5 METHODOLOGY 8 TRAFFIC AND SPEED IN IMPORTANT CETACEAN HABITATS 10 PRIORITIES FOR SHIPPING IN IMPORTANT CETACEAN HABITATS 12 REFERENCES 14 MAPS 16
WWF-CANADA – SHIPPING TRAFFIC AND SPEED IN CETACEAN HABITATS ON CANADA’S PACIFIC COAST DISCUSSION DOCUMENT
Cover Photo: © Shutterstock
EXECUTIVE SUMMARY
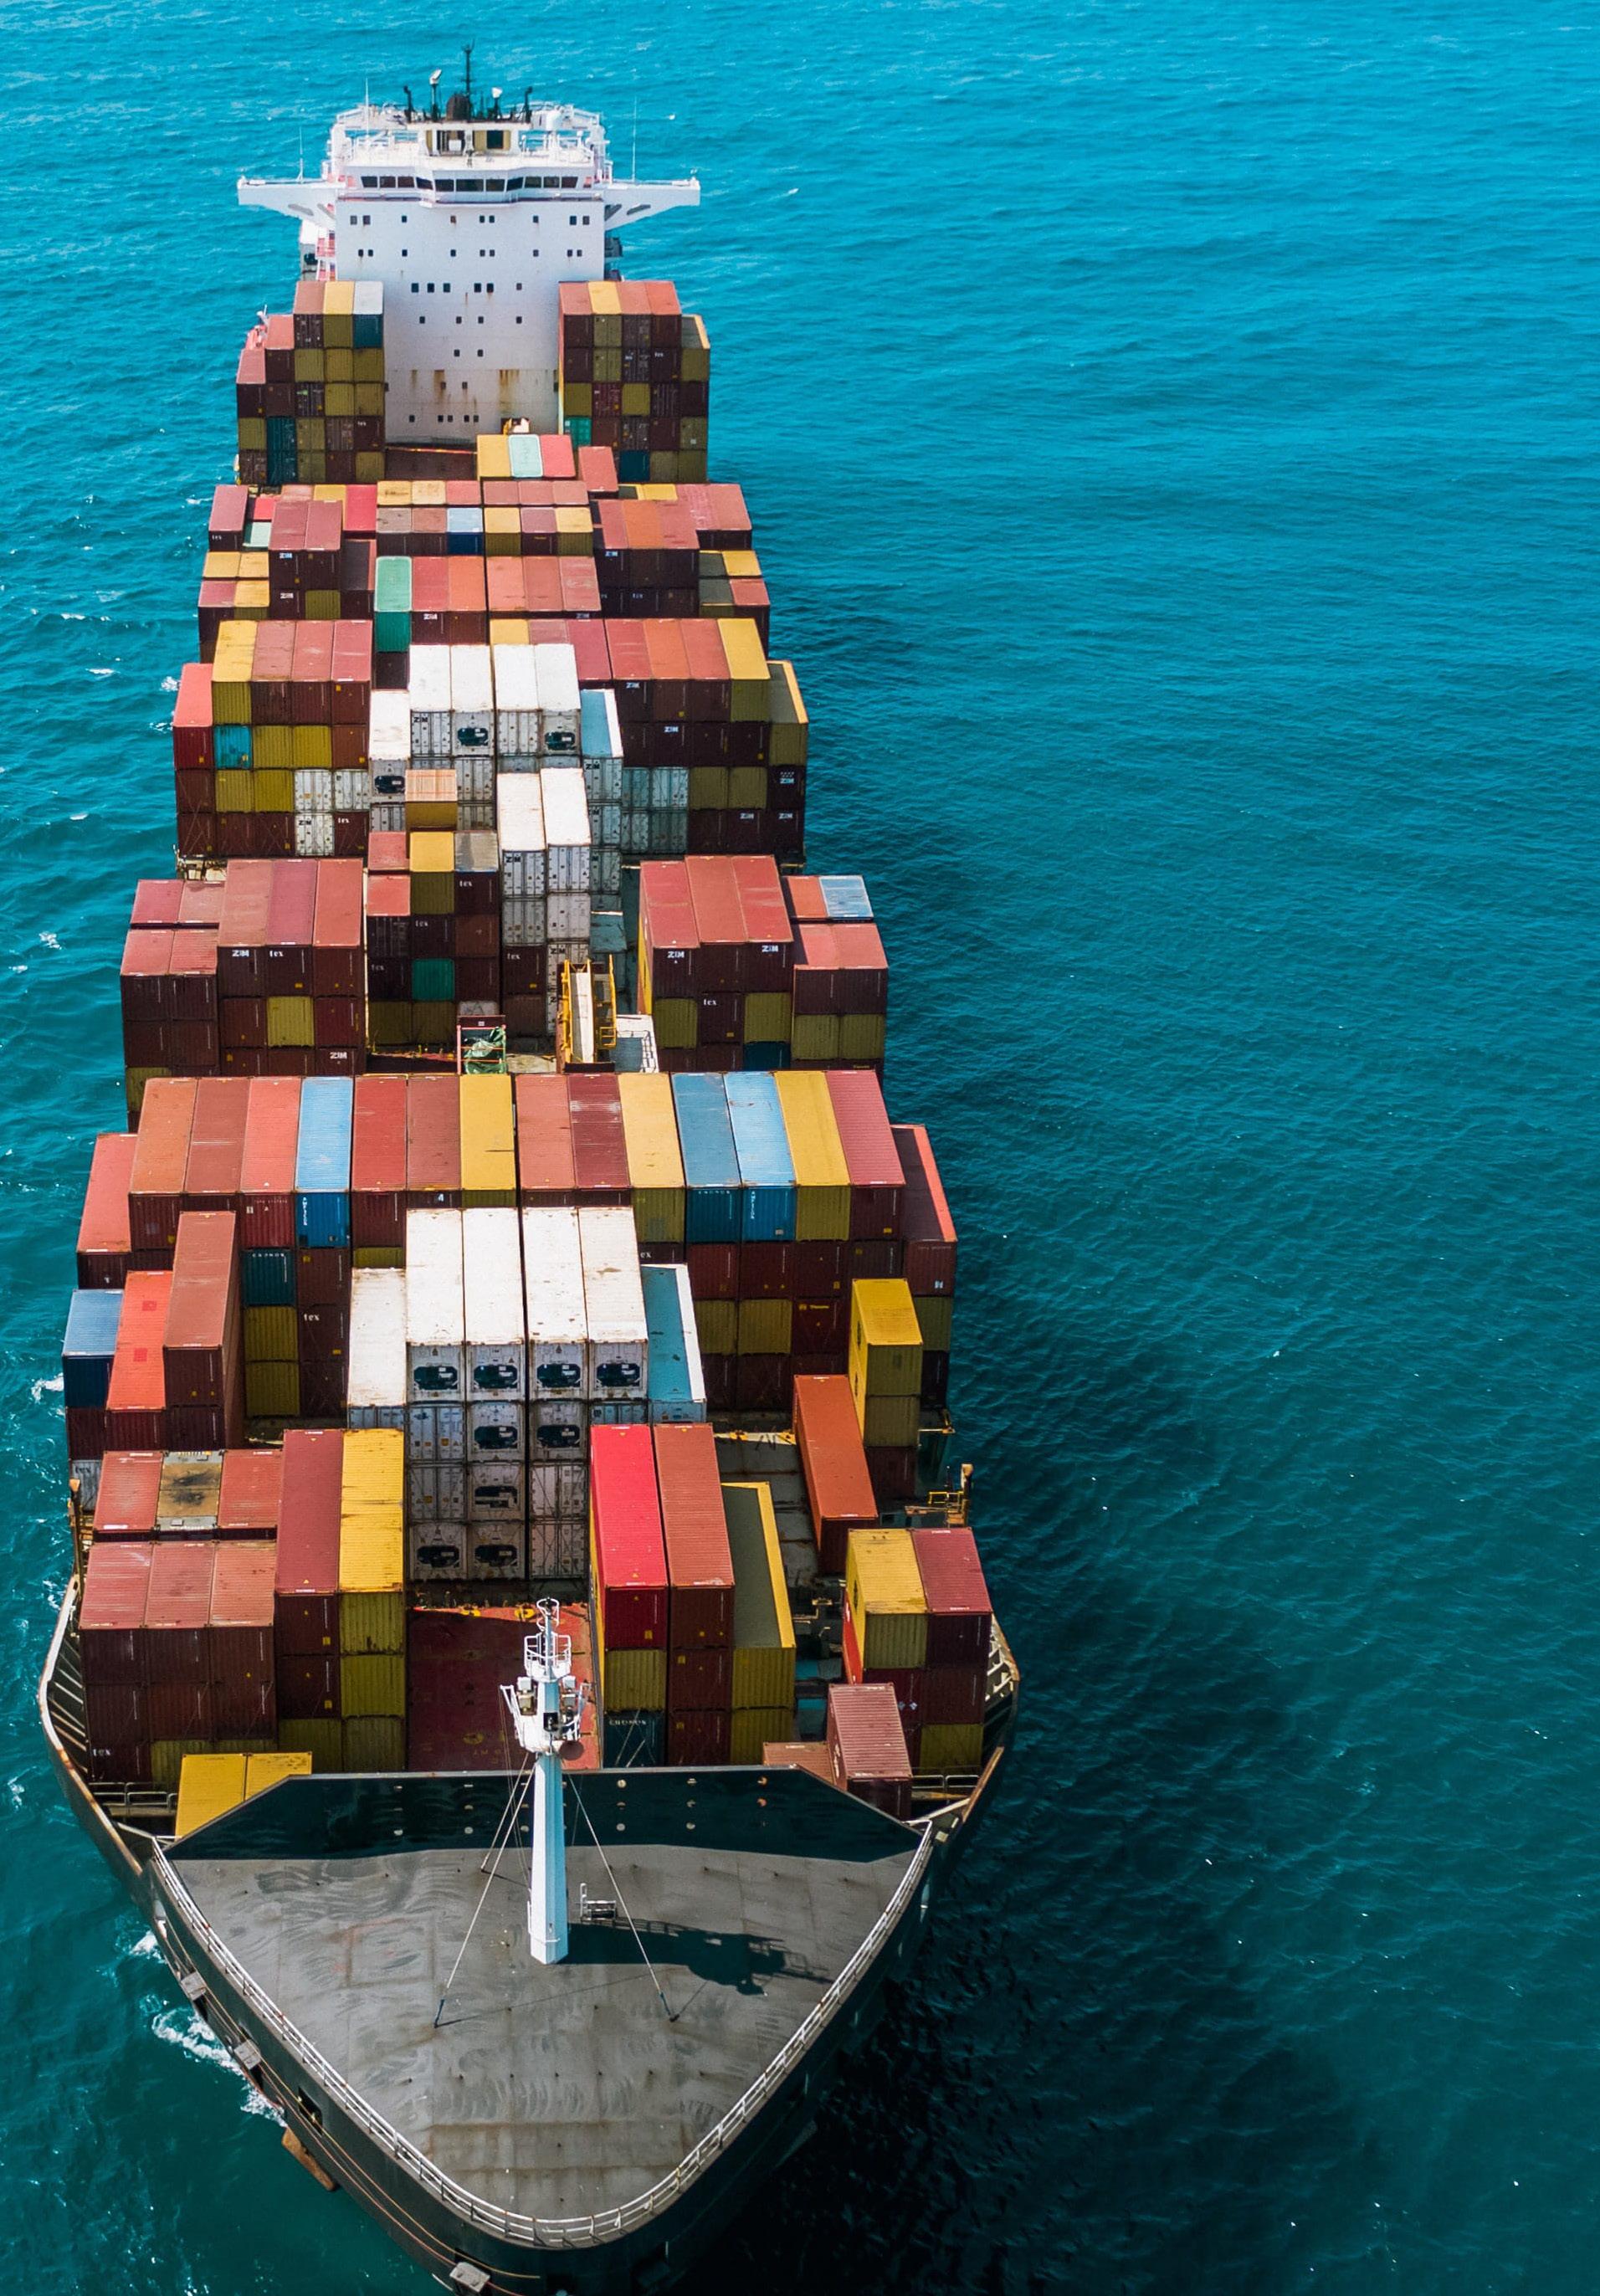
Canada’s Pacific coast is home to vast marine and coastal ecosystems that are rich in biodiversity. These habitats also have significant economic, cultural and spiritual importance to coastal communities. This globally significant region also plays a central role in Canada’s economy, hosting the largest port in the country and acting as the gateway to trans-Pacific and North American trading corridors. As a result, ship traffic on Canada’s West Coast is growing, and this growth is expected to continue, with planned increases in regional port and terminal capacity. Shipping directly and indirectly impacts marine wildlife and the quality of their habitats.
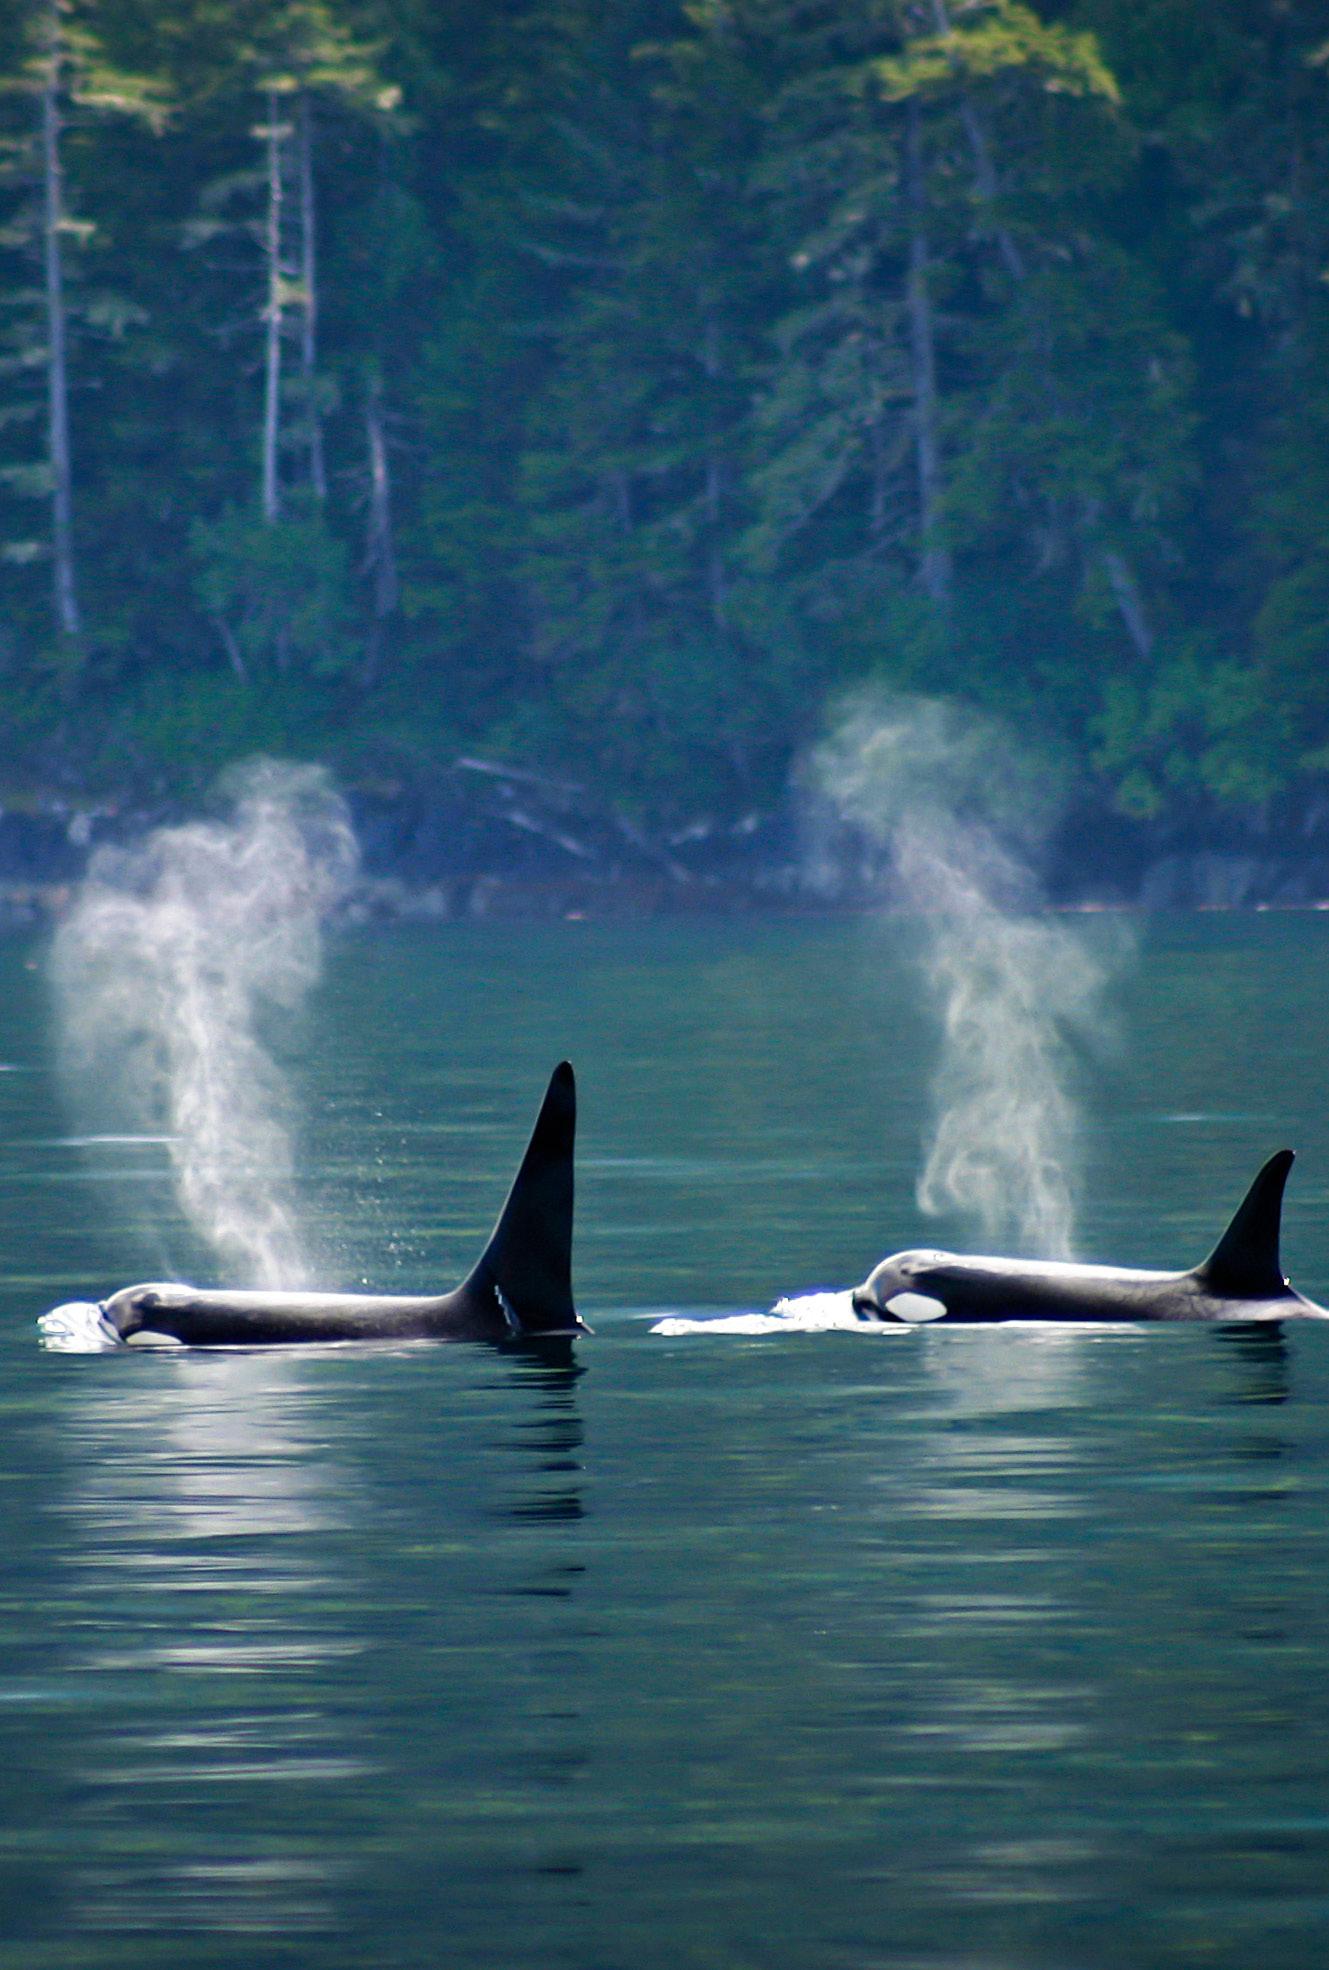
Cetaceans – whales, dolphins and porpoises – are known to suffer significant consequences, both to their well-being and survival, from ship strikes, underwater noise and pollution related to shipping.
This document provides a preliminary analysis of vessel traffic and speeds within known important whale habitats off the Canadian Pacific coast. Results show that some of the most common vessel classes (volume in kilometres) travelling within important whale habitats include tugs and pleasure
crafts, passenger vessels, bulk carriers, container ships and cruise ships. High-risk areas include the Dixon Entrance to the Port of Prince Rupert, which has bulk carriers and container ships travelling at speeds above 11 knots (kt); and the central coast, Inside Passage and entrance to the Port of Kitimat, with cruise and passenger ships travelling at speeds above 16kt.
WWF-Canada recommends that the Dixon Entrance to the Port of Prince Rupert, and the central coast, the Inside Passage and the entrance to the Port of Kitimat should be prioritized for vessel management to reduce risk to cetaceans from shipping related impacts. The most effective mitigation measures will be highly specific to each geographic area and stakeholders; nonetheless, best practices show that shipping impacts on cetaceans can be effectively reduced by moving ships away from important whale habitats, slowing down and making ships quieter and cleaner.
©Shutterstock 1
SHIPPING OFF CANADA’S PACIFIC COAST
Canada’s Pacific coast encompasses about 947,932 square kilometres. Highly urbanized environments are concentrated along the southern coast and on the lower reaches of the major river systems. Ships provide transportation of vital goods and services, delivering cargo and enabling transit of people to areas inaccessible by roads. As the population and economy expand, vessels are increasing in number, size and speed.1
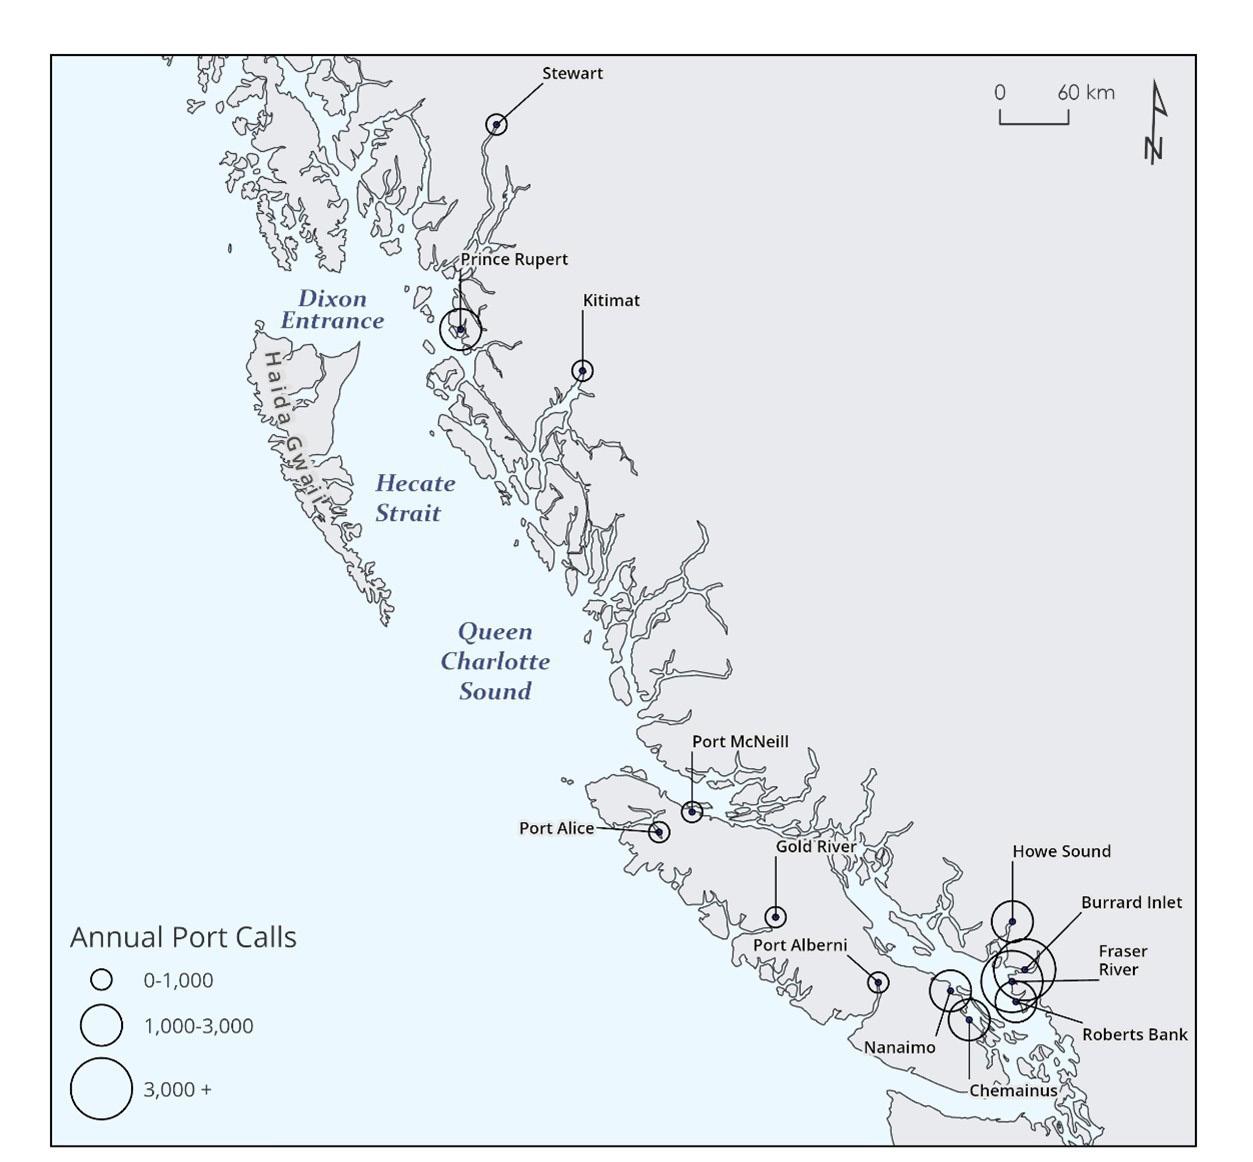
Canada’s Pacific coast is the gateway to trans-Pacific and North American trade through ports engaged in local, national and international activities. The Port of Vancouver is Canada’s largest port, and the third largest in North America, with 29 terminals (Figure 1). Prince Rupert is the second largest port for container and cargo volume and third largest port overall in Canada, and its Ridley Island Export Logistics Platform – which will create important infrastructure to support the development of large-scale export transloading facilities for bulk commodities – will expand the port’s capacity more than five-fold.2 The Ports of Kitimat and Stewart also have proposed shipping and terminal expansions.3
More than 4,000 large vessels travel the trade routes in Canadian Pacific waters. Bulk carriers are the dominant commercial traffic in the region followed by container ships.4 Vessel traffic in B.C. waters also includes over 50 ferries and more than 300,000 registered private recreational vessels. Since the 1980s, container and cruise ship traffic through B.C. ports increased by 200 per cent,5 and traffic in the region continues to increase exponentially. The Port of Vancouver alone saw 1 per cent marginal growth in 2020, with records for grain and shipping containers movement increasing 24 per cent and 2 per cent, respectively, amid the global pandemic.6
The Inside Passage is a coastal network of protected channels and fjords that serve as a sheltered route for ships between islands and mainland B.C., while transiting to and from Alaska and the state of Washington. These inside waters are primarily used by tugs, cruise ships, smaller cargo vessels and other vessels seeking protection from Pacific Ocean weather.4 Tugs dominate vessel traffic in the Inside Passage, with more than 5,500 vessels on average travelling one-way across the south end of the Strait of Georgia annually.4 It is also a route for deep-draft ships trading in the Port of Vancouver, and about 380 tankers cross this area annually.7
Figure 1. Map of Canada’s West Coast, showing the location of important ports and annual average port calls for all vessels (2014-2016).4 Vancouver port encompasses Burrard Inlet, Roberts Bank and Fraser River for a total of over 12,000 average annual calls.
WWF-CANADA – SHIPPING TRAFFIC AND SPEED IN CETACEAN HABITATS ON CANADA’S PACIFIC COAST DISCUSSION DOCUMENT
CETACEANS OFF CANADA’S PACIFIC COAST
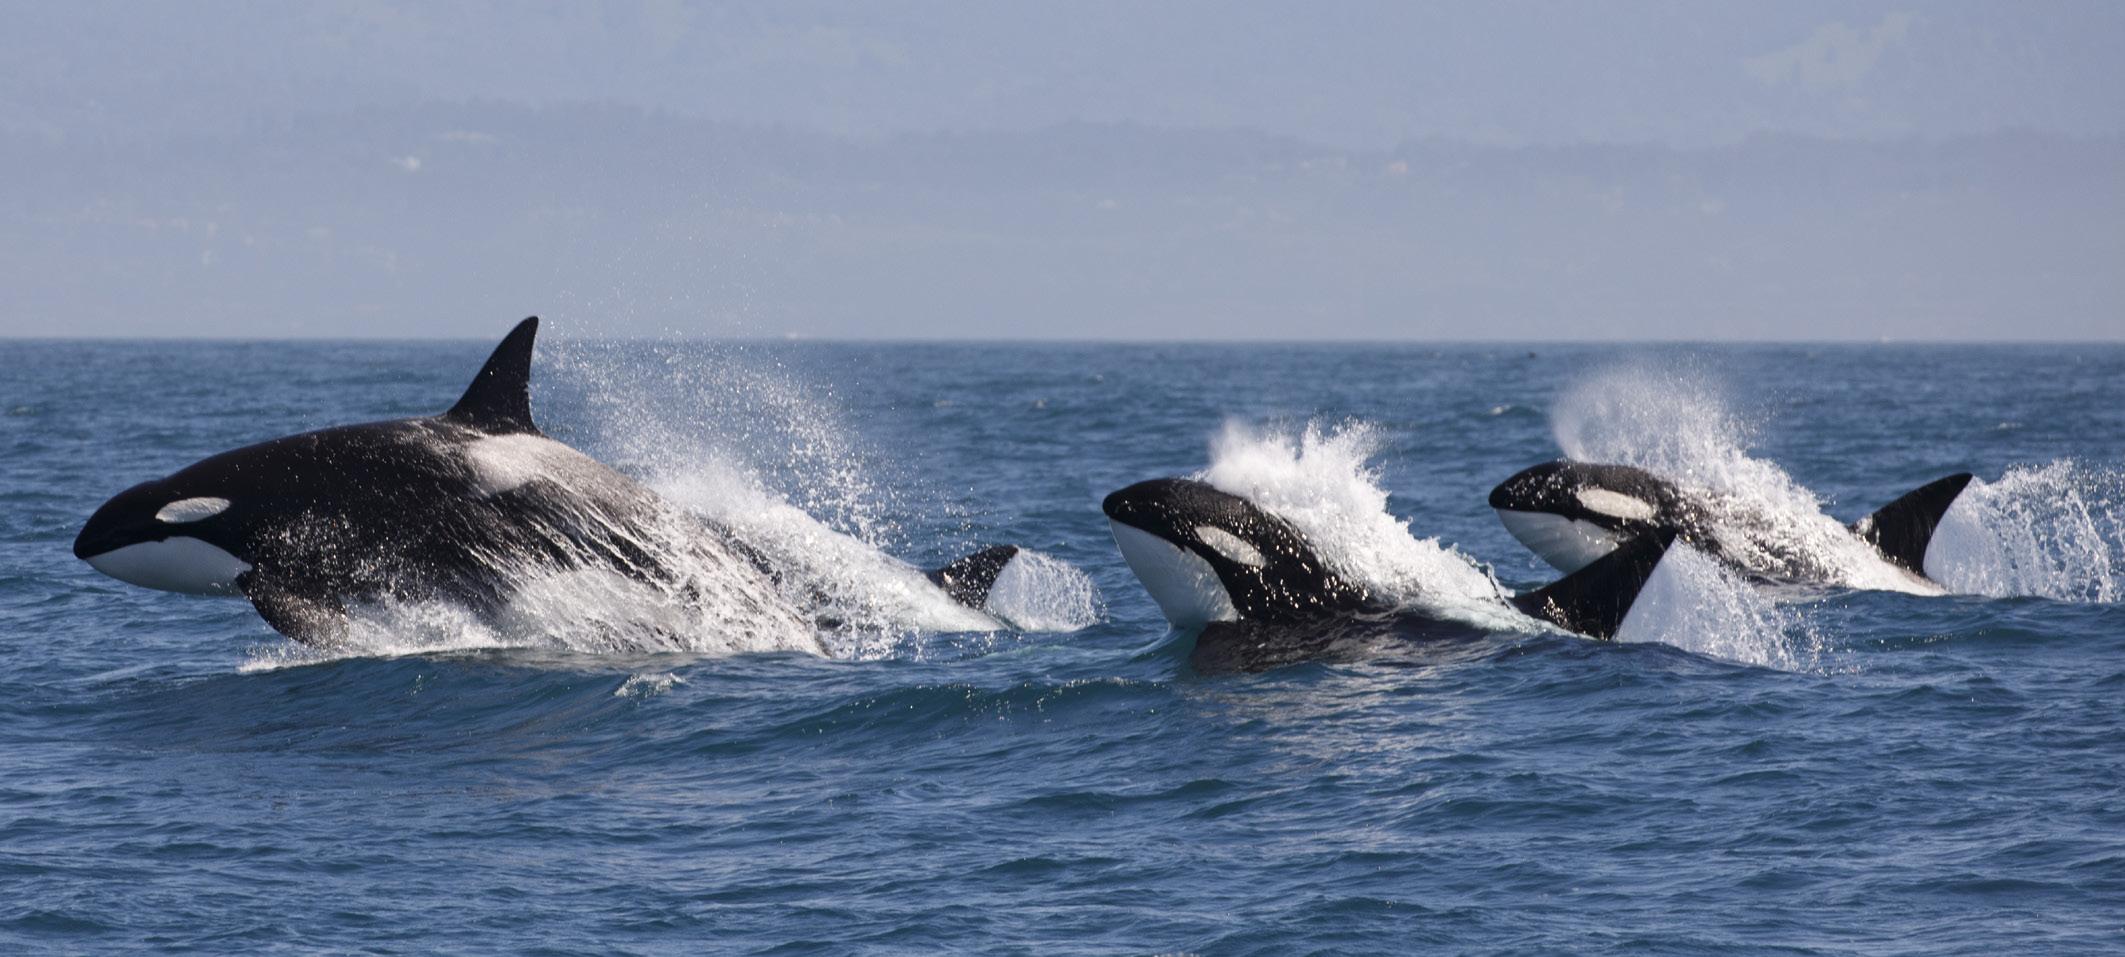
Many at-risk cetaceans – whales, dolphins and porpoises – that inhabit Canadian Pacific waters are vulnerable to ship strikes as well as pollution and underwater noise associated with shipping. Canada offers protection to at-risk cetaceans listed under the Species at Risk Act (SARA), primarily through Fisheries and Oceans Canada’s (DFO) mandate to develop SARA recovery strategies and action plans for legally listed aquatic species.8 In B.C., 26 populations or species of cetaceans use the waters seasonally or year-round, of which 11 are listed under SARA (Table 1). Under SARA, it is legally required to identify Critical Habitat (CH), the habitat necessary for the survival or recovery of listed endangered or threatened species. CH is designated through an order under SARA at which point it is legally protected. Anyone destroying or damaging CH can be prosecuted. Activities that destroy or damage CH could be prohibited, and measures to effectively manage and reduce the impact of those activities could be put in place. Examples of measures in southern resident killer whale (SRKW) critical habitat to manage for the impacts of marine vessels include regulating approach distances, large vessel slowdowns and prohibited areas for vessels (i.e., sanctuaries) to reduce noise exposure. At the time of publishing this report, CH have only been designated for resident killer whales (north and south populations) and humpback whales, resulting in some additional protection for these populations.
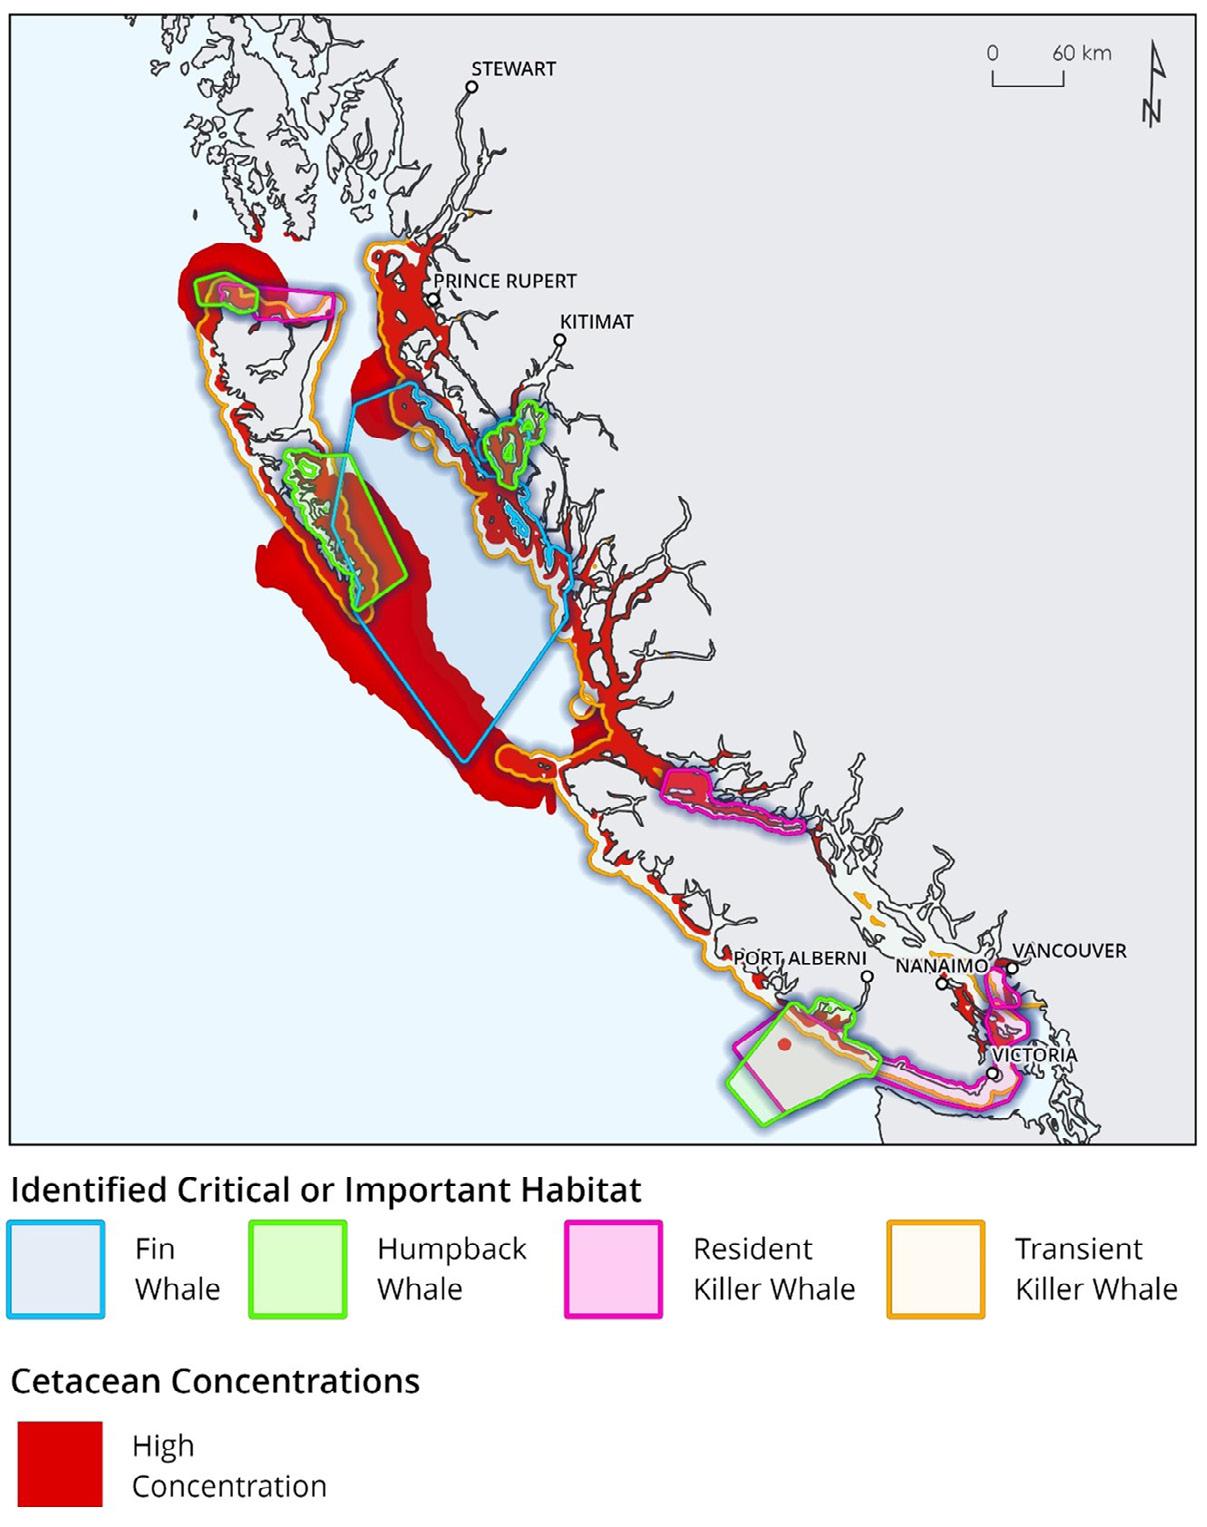
While the majority of Pacific at-risk cetaceans have not had their CH designated, habitat of special importance has been identified for fin whale9 and Bigg’s (transient) killer whale10 (Figure 2), which is a first step towards the identification and designation of CH.

3 © Shutterstock
Figure 2. High relative density of all cetacean species during the summer season (May to September) and designated CH under SARA (resident killer whale, north and south populations) and DFO identified important habitats (fin whale, Bigg’s transient killer whale and humpback whale).
Table
SARA listing Populations or species
Endangered
Species facing imminent extirpation or extinction.
Threatened
Species which are likely to become endangered if nothing is done to reverse the factors leading to their extirpation or extinction.
Special Concern
Species which may become threatened or endangered because of a combination of biological characteristics and identified threats.
Blue whale
Sei whale
North Pacific right whale SRKW
Fin whale
Northern resident killer whale (NRKW)
Offshore killer whale
Bigg’s (transient) killer whale
Grey whale
Humpback whale
Harbour porpoise
© Shutterstock
IMPORTANCE OF CETACEANS FOR NATURE AND PEOPLE
Cetaceans provide important ecosystem services that maintain the health of the marine environment and the stability of marine food-webs. Large whales contribute to enhancing ocean productivity and fighting climate change. Known as “the whale pump,”12 cetaceans are intrepid recyclers of ocean nutrients. They feed throughout the ocean at depth and defecate at the surface, releasing clouds of iron and nitrogen which benefit the food chain and phytoplankton growth. Phytoplankton is the base of the marine food web and supports the vast majority of ocean life. These tiny organisms are also a crucial regulator of atmospheric conditions –generating at least 50 per cent of all oxygen in our atmosphere and capturing an estimated 40 per cent of all carbon dioxide produced globally.13 Moreover, cetaceans themselves can be considered a carbon sink, as they lock in large amounts of carbon when they die and fall to the bottom of the ocean.
Whales, including killer whales, also hold immense cultural and spiritual value for First Nations in B.C. They are embedded into traditions, language, history and teachings.14
In tourism, whale-watching is a multi-million-dollar industry, with thousands of visitors annually in the Salish Sea region If all requirements and guidelines are followed, whale-watching can be done responsibly and minimize the potential impacts to the animals that are being observed (disturbance, increased exposure to pollution, including underwater noise, etc). However, excessive whale-watching targeted on endangered populations can contribute to their further decline.
1. Cetaceans listed under Canada’s Species at Risk Act (SARA) inhabiting Canada’s West Coast waters.
WWF-CANADA – SHIPPING TRAFFIC AND SPEED IN CETACEAN HABITATS ON CANADA’S PACIFIC COAST DISCUSSION DOCUMENT
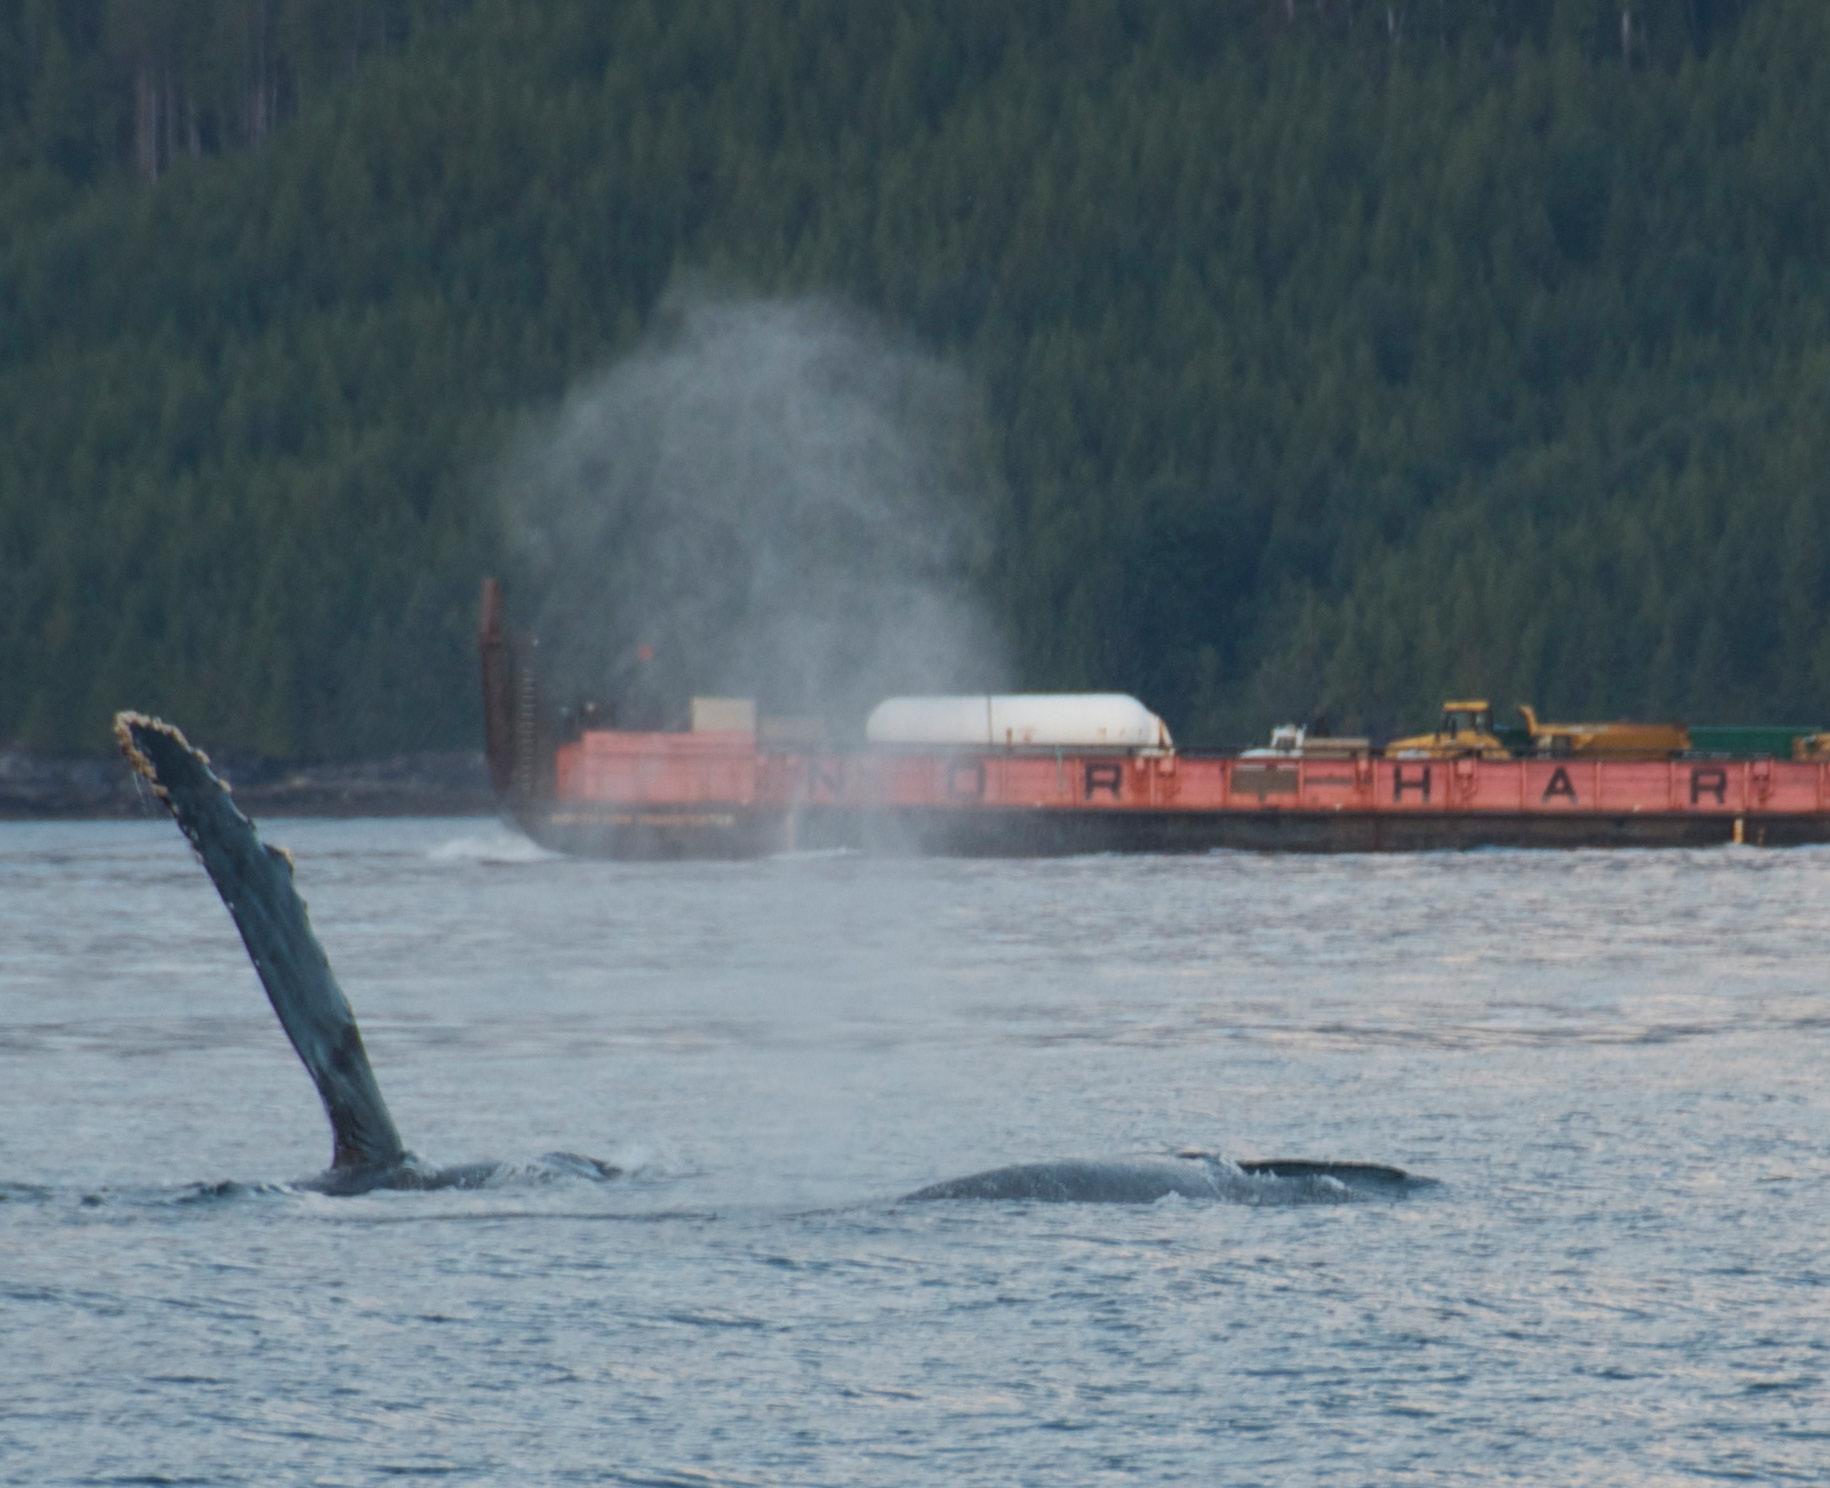
SHIPPING IMPACTS ON CETACEANS AND THEIR HABITATS SHIP STRIKES
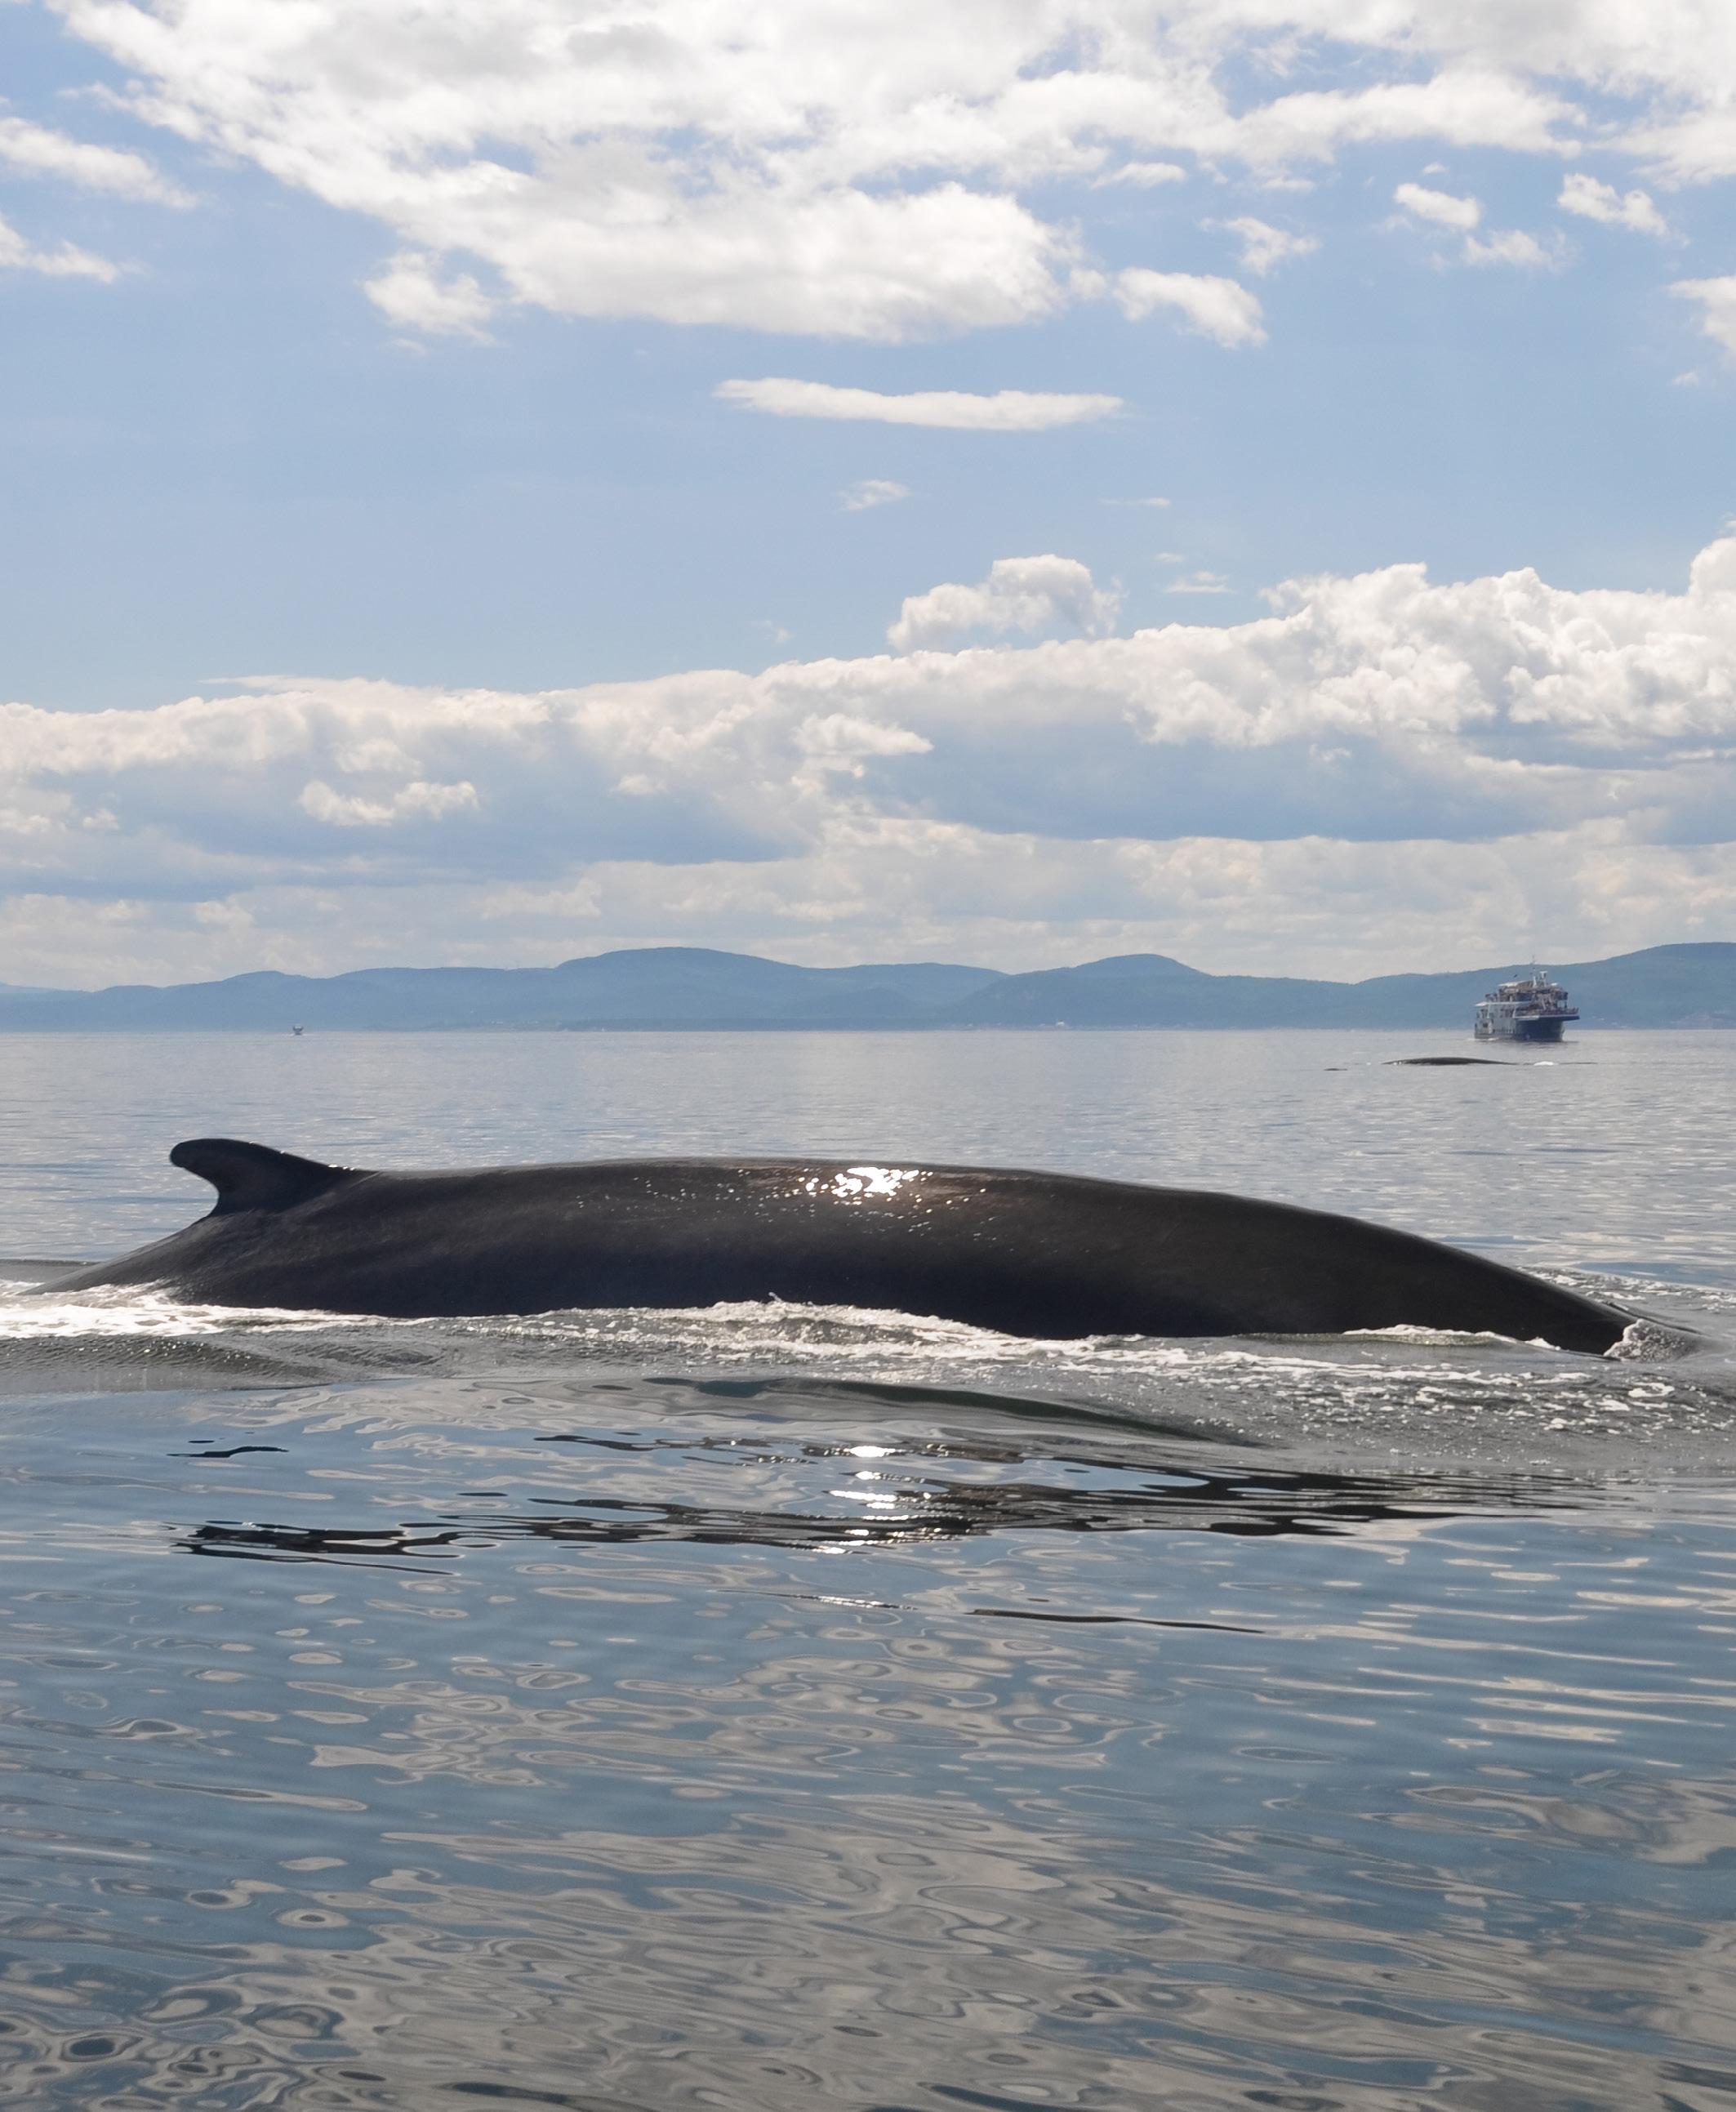
Vessel strikes are a recognized cause of cetacean mortality worldwide. The risk is known to be higher for baleen whales because of their large body size, limited ability to manoeuvre and behavioural characteristics;15, 16 however, other whales and marine wildlife are still at risk. A global review of vessel collisions with marine animals listed at least 75 marine species, including smaller whales, dolphins, porpoises, sea turtles, sharks and seals, among others.17 In B.C., vessel strikes are now considered a significant cause of mortality in killer whales.18 Collision risk is also a key threat to humpback, blue, fin, sei and transient killer whale populations.5, 19 The expansion of the Port of Prince Rupert is expected to increase east-west traffic, which will increase risk to fin whales; the increase in tanker traffic along the North Coast associated with the construction of the Pacific Trail Pipeline to Kitimat will impact fin, humpback and northern resident killer whales.20 Recent assessments off the west coast of the U.S. indicate that the highest mortalities of blue, fin and humpback whales are in shipping lanes to and from major U.S. ports. The estimated levels of mortality are sufficiently high that they would impede population recovery for these species.21
The primary factor increasing vessel strike risk is the overlap between whale habitats and ship traffic. Risk will also vary with vessel size and cruising speed; meteorological conditions; behaviour, age and sex of the animal; as well as acoustic factors. In general, the risks of mortality increase with cruising speed.17 As such, slowdowns or speed restriction to 10kt or below (to the minimum safe transit speed) is often used as a means to increase opportunity for detection and avoidance of cetaceans and to reduce the severity of impacts. In B.C., for the Juan de Fuca Traffic Separation Scheme (TSS), simulations have shown that maintaining a speed of 8 to 10kt allowed nearly all types of vessels to maintain good steering and positional control, providing wind speeds did not exceed 30kt.22 However, re-routing to actively avoid whale habitat when possible is the best management approach as new findings suggest that the risk of mortality remains high (80 per cent) at any given speed for large ships (above 20 metres in length).23
High-risk areas – areas with a high density of both whales and ships – pose an elevated threat. In B.C., high-risk areas were identified previously for
• Humpback whale: Along the continental shelf break at the 200m depth contour (shelf edge), the inshore approaches to Juan de Fuca Strait and within the strait itself,24 the Dixon Entrance, areas in Queen Charlotte and Hecate Straits and several inlet systems on the central coast;20
• Fin whale: In offshore approaches to Juan de Fuca Strait and inside the western portion of the strait,24 the Dixon Entrance, areas in Hecate Strait and entrance to one inlet system on the North Coast around Squally Channel;20
• Northern resident killer whale: In Johnstone Strait.20
© Shutterstock 5 © Shutterstock
UNDERWATER NOISE
The growth of the global maritime industry has largely contributed to increasing underwater noise levels in the Northeast Pacific, which have more than doubled every decade since the 1960s.25 Most underwater noise generated by large ships is produced by the propulsion system (i.e., cavitation around the propellers).26 The level of noise generated by a ship is affected by the overall designed construction (i.e., the vessel size, type, engine type, hull form and propeller cavitation, among other characteristics of a ship’s construction, all influence noise levels). Typically, larger (exceeding 100m) and faster vessels (exceeding 10 kt) generate louder sound.26
Underwater noise significantly impacts marine mammals by reducing their ability to hear and inducing physiological and behavioural changes.27 In B.C., SRKW are one of the world’s most studied whale populations, and numerous publications quantify vessel28 and anthropogenic noise interferences.29–33 The impacts on SRKW are broad and include behavioural disturbances, increased physiological stress and avoidance behaviours, disruption of important activities (e.g., resting and foraging), shifts in hearing sensitivity, communication and echolocation masking (which impacts group cohesion and coordination, interferes with social behaviours and reduces foraging efficiency), navigation ability and threat avoidance34 (Figure 3).
Since 2014, the Enhancing Cetacean Habitat and Observation (ECHO) Program led by the Port of Vancouver has developed several initiatives to mitigate underwater noise impacts on SRKW, including installing a listening station to quantify the noise signature of commercial vessels; voluntary slowdowns and routing measures to move vessel traffic away from whales and reduce underwater noise in SRKW feeding areas; as well as financial incentives (reduced docking fees) for ships that apply vessel quieting best practices and technology.35 Multiple years of seasonal slowdown trials have shown that slowdowns are an effective means for reducing mean underwater radiated noise for container ships, cruise vessels, vehicle carriers, tankers and bulkers.28 In 2017, the voluntary slowdown trial achieved 22 per cent reduction in “potential lost foraging time” for SRKW despite longer passage times for vessels.36
Similarly, the lateral displacement trial that shifted the transit path away from SRKW CH seasonally between 2018 and 2020 also resulted in a significant reduction in underwater noise in the area. A meta-analysis published in Frontiers in Marine Science in 2019 confirms that reducing speed is an effective mitigation measure to reduce vessel-based underwater noise levels.37
Canada is developing an ocean noise strategy for 2022 to better guide government efforts in addressing the adverse impacts of noise on marine ecosystems.
To effectively reduce underwater noise pollution, WWFCanada recommends that Canada establish a strong strategy with the implementation of thresholds, vessel-based and areabased noise targets, and incentivize quieter technologies.
impairment
Behaviour change
Hearing
Masking
& stress
1 2 3 4
Effects on prey
WWF-CANADA – SHIPPING TRAFFIC AND SPEED IN CETACEAN HABITATS ON CANADA’S PACIFIC COAST DISCUSSION DOCUMENT
Figure 3. Impacts of underwater noise on cetaceans.
POLLUTION
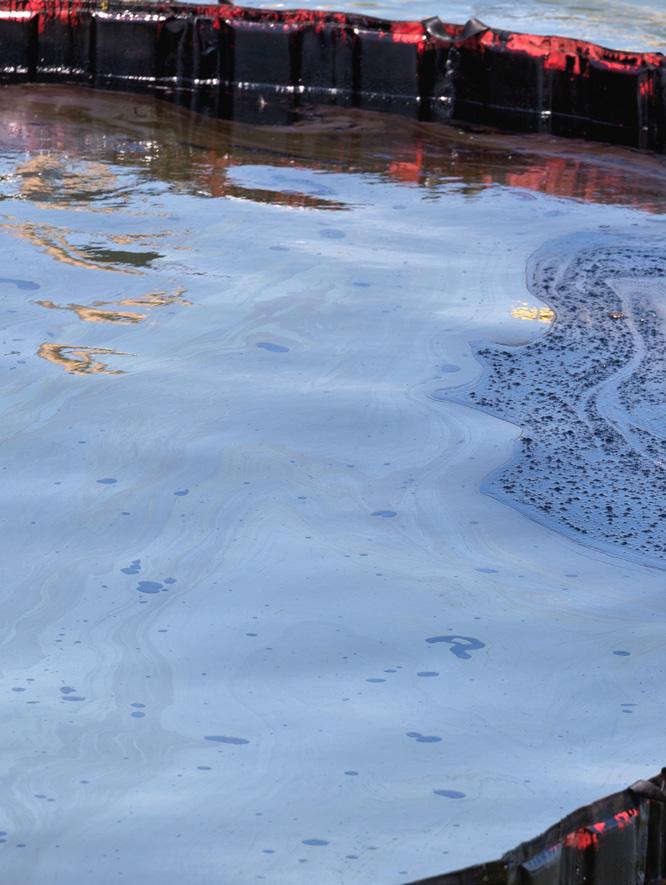
Harmful materials may be discharged into the water as part of commercial shipping daily operations or by accident, polluting whale habitat.38 Discharges can include grey water (i.e., untreated wastewater from shower, sink and laundry), sewage, lubricant fuel39, 40 and heavy metals released from exhaust gas cleaning systems (i.e., scrubbers).
In 2017, an estimated 1.54 billion litres of grey water was generated near the B.C. coast, with cruise ships generating 253.6L of grey water per day per person.41 Grey water is comparable to untreated domestic sewage discharges42 and can lead to excessive nutrient offload and algal growth, generating dead zones (hypoxic or low oxygen areas) affecting all marine life. In B.C. waters, a passenger vessel carrying more than 500 passengers must treat any release of grey water within three nautical miles (nm) of land, but as soon
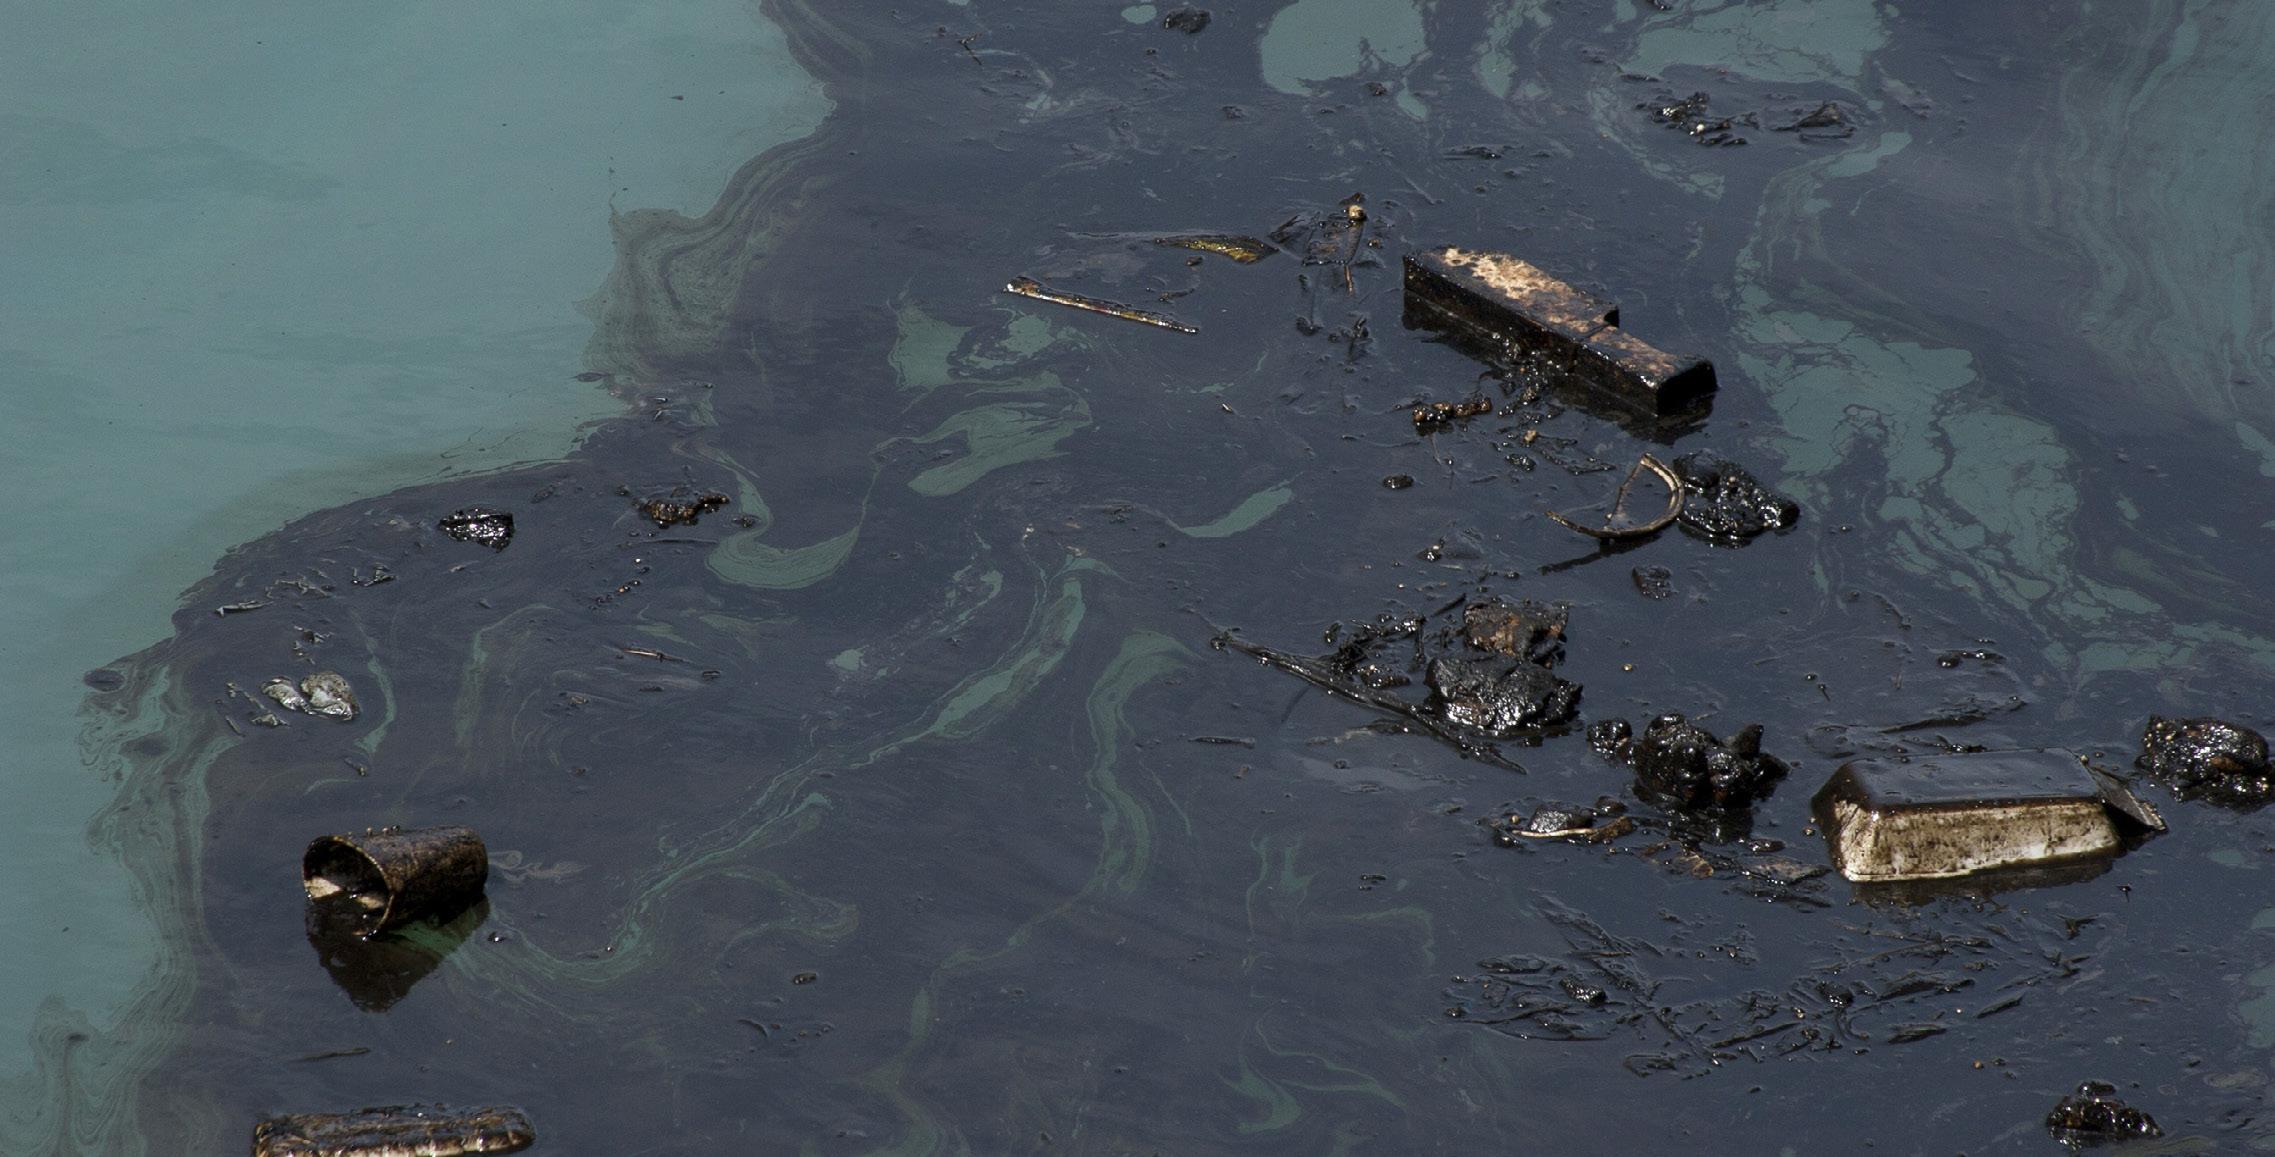
OIL SPILL
Hydrocarbons, including crude oil, can be released intentionally by oil tankers after offloading or unintentionally though accidental discharges. Fuel oil can also be released into the environment from leaking vessels and shipping accidents. The vessel traffic between the U.S. and Canada includes over 1,300 oil tankers, carrying around 30 to 40 million gallons of crude oil.46 Oil carriage in the Inside Passage is estimated to be less than 800,000 cubic metres annually, principally driven by cargo ships and cruise ships.4 Oil spills can have devastating short- and long-term consequences to cetaceans and their habitat. Cetaceans can be exposed to oil through subsurface, surface and air contamination.47 Lung damage, impaired stress response, compromised immune function, increased mortality and reproductive failure and other adverse health effects in cetaceans are linked to oil spills.47 For cetacean populations impacted by oil spills, it can take 10 to 105 years for recovery.47
as vessels are outside of that limit, untreated grey water may be discharged.43Ninety per cent of heavy fuel oil (HFO) and the washwater effluent from exhaust gas cleaning systems in B.C. overlapped with resident killer whale critical habitat, further polluting and degrading their habitat.38 Exposure to polycyclic aromatic hydrocarbons (PAHs) and heavy metals found in washwater of this kind has been linked to negative health outcomes for marine mammal species such as belugas, other whales and pinnipeds. Even small quantities of these chemicals can accumulate in the environment and bioaccumulate in the food web. In shallow coastal areas where dilution is limited and vessel traffic is high, pollutant concentration increases over time.44 Additionally, synergistic effects of exposure to contaminants on zooplankton, the basis of the food web for many marine species, may be drastically different than the effect of exposure to only one pollutant.45
©
Shutterstock
OTHER POLLUTANTS
• Between 1984 and 2015, among the 167 shipping accidents reported in Washington and B.C., four resulted in the discharge of more than 100,000 gallons of oil.46
• In 2006, the Queen of the North ferry, carrying more than 1,300 barrels of diesel and 16 vehicles, sank in the Inside Passage. Its grounding and sinking created an oil slick that spread throughout the Wright Sound.
• In 2007, a barge loaded with a fuel truck tipped over and spilled about 10,000L of diesel. One quarter of the NRKW population may have been exposed to the fuel and other hydrocarbons.20
• In 2016, Nathan E. Stewart tug and articulated barge sank in the Gale Pass, Heiltsuk territory, spilling 110,000L of diesel fuel, lubricants, heavy oils and other pollutants, impacting the surrounding land, sea and marine life.48
Marine debris, such as plastics, paper, metal, rubber, glass or textiles, can make its way into the marine environment through shipping activity.49 These types of debris can take years to disintegrate while simultaneously releasing harmful chemicals into the environment. Persistent organic pollutants such as DDT from degrading plastics are resistant to degradation and can persist for long periods of time in the environment and bioaccumulate through the food chain. Greenhouse gas (GHG) emissions from ships burning fossil fuels impacts the environment. B.C. and Quebec are responsible for almost 50 per cent of shipping fuel consumption in Canada.50 By adopting cleaner technologies (e.g., clean fuel, electrification), the maritime sector has the potential to reduce GHG emissions as well as future spill risks and underwater noise. A global study found that a reduction of average speed by 10 per cent resulted in 19 per cent reduction of GHG, 40 per cent reduction of underwater noise pollution and fewer ship strikes to whales.51 © Shutterstock 7
METHODOLOGY
Vessel and cetacean data
Automated Identification System (AIS) point data from ExactEarth from 2015 to 2019 were used to analyze ship traffic and speed. Vessel categories available in the AIS data included 15 ship types which grouped more specific classes. For a complete description of the ship types, please refer to the traffic data document. For the purpose of this analysis, the following ship types were selected: bulk carriers, cargo, container, cruise, fishing, “other,” passenger, roll-on/roll-off (also called RORO or ro-ro, these are cargo ships designed to carry wheeled cargo) and tankers (crude oil, gas, oil product and chemical tankers combined).
Relative abundance of cetaceans was extracted from the Mariners Guide to Whales, Dolphins, and Porpoises of Western Canada. 52 The “all species” map for the summer season (May to September) in this guide was georeferenced, and the relative “high” abundance category was vectorized using an Iso-Cluster classifier based on the original relative abundance colour ramp legend. This dataset is the most comprehensive collection of data on cetacean distribution in B.C. waters and includes both scientific and opportunistic data corrected for effort and survey methodology. In addition, SARA CH and habitats of special importance shapefiles were acquired from DFO. SARA CH and habitats of special importance as well as high-density cetacean areas are hereafter referred as “important habitats” for whales.
© Shutterstock
Processing and analysis
AIS point data were corrected and harmonized (i.e., removal of vessels with an insufficient volume of points and deletion of erroneous position data). Rate of travel was estimated for each point by isolating individual ship tracks and assessing the distance between individual points along each track relative to the associated timestamps. Since the distance between raw AIS points is variable, each individual ship track was densified to obtain a more consistent distance between points. Speed and timestamp attributes were interpolated for these additional points and speed was calculated for adjacent points. This process of densifying each track helps account for bias that can be introduced when generating raster heatmaps from point data. However, it should be noted that vessels engaged in activity requiring irregular travel patterns, or successive transits of the same area (i.e., fishing vessels and ferries), may still be underrepresented in the processed data.
The data were gridded at a resolution of 0.05 decimal degrees to produce raster heatmaps summarizing both speed and volume. As speed is known to be an important factor increasing shipping impacts on whales, the data were separated into three broad speed categories to explore the distribution and volume of low, medium and higher speed vessels. This initial step produced three gridded datasets for each ship type, as well as three maps for all ships combined (i.e., one for each speed category). The speed categories are low (0-11kt), medium (11-16kt) and high (>16kt). Note that AIS broadcast speed is “speed over ground”: distance travelled in one hour with respect to ground which is affected by prevailing navigational conditions (e.g., currents, winds).
“Speed over water” remains stable and should be the metric used to assess vessel-based noise or severity of collisions.22 Knowing this limitation and that steering and positional
WWF-CANADA – SHIPPING TRAFFIC AND SPEED IN CETACEAN HABITATS ON CANADA’S PACIFIC COAST DISCUSSION DOCUMENT
control remained good for nearly all vessel types at 8 to 10kt water speed,22 the low cut-off point was set at 11kt. Eleven knots speed has also been used as a target of voluntary slowdowns in previous trials from the ECHO Program.
The volume was defined as the total distance in kilometres travelled per pixel, which was then normalized by the total volume of ships in each corresponding speed category to produce a proportion of volume with a per cent value (0 to 100 per cent). A value of 100 per cent in a pixel means that
all the ship traffic in that cell travelling within that speed range is associated with the specified ship type. Eighteen heatmaps in total were created using ArcGIS Pro and show all vessels combined for each speed category and one of each speed categories for each of the top five vessel classes – bulk carrier, “other,” container ship, passenger and cruise – within important whale habitats. Summary statistics were generated for whale habitats (critical/special habitats and high-density habitats) and the Pacific Canadian waters (Table 2).
© Shutterstock 9
TRAFFIC AND SPEED IN IMPORTANT WHALE HABITATS
From 2015 to 2019, bulk carrier, “other,” container, passenger and cruise ships accounted for 75 per cent of all traffic in Pacific Canadian waters (Table 2). Bulk carriers carry cargo in large holds; are primarily used to export mineral, forest or agricultural products to foreign markets; and they call at every major port in B.C.4 The so-called other class is very broad and includes vessel activities such as other liquids, other fishing, research, towing/pushing, dredging, other activities, other non-seagoing, yacht, barge and non-ship structures, which includes over a hundred vessel types. Based on cross-reference, this “other” category is largely dominated by tugs and pleasure crafts. Tugs of all types are indeed a sizeable part of the shipping traffic in Pacific Canadian waters and are a dominant vessel type in the Inside Passage.4
Tugs are being used for several activities, including towing barges and assisting ships. Container ships import and export consumer goods in containers worldwide and call at the three main ports in B.C.: Prince Rupert, Vancouver and Nanaimo.4 Passenger ships travel regular consistent routes as a means of transportation, whereas cruises carry tourists and operate from April to October, with a peak season of May to September, with regular routes close to shore and in inside waters.4 For further and more detailed information on ship traffic in B.C. waters, please refer to the Clear Seas publication Vessel Traffic in Canada’s Pacific Region
the total volume of traffic in important whale habitats (critical/special whale habitats and high-density of all cetaceans) and in Pacific Canadian waters. Pacific Canadian waters include internal waters, territorial waters (12nm) and the exclusive economic zone
The numbers are percentages (0 to 100 per cent). The last two columns provide a general indication if the ship type is more concentrated in important whale habitats.
Ship type Critical/Special Habitats High density Pacific Canadian waters Critical/Special Habitats High density Bulk carriers 16.5 11.4 22.7 Less Less “Other” 30.3 34.3 19.9 More More Container ships 8.8 6.1 14.5 Less Less Passenger 16.5 18.6 10.2 More More Cruises 8.5 11.7 8.1 More More Fishing 7.5 8.4 7.7 Less More Ro-ro 4.7 5.2 6.5 Less Less Tankers 3.3 0.9 6 Less Less Cargo 3.9 3.3 4.4 Less Less
WWF-CANADA – SHIPPING TRAFFIC AND SPEED IN CETACEAN HABITATS ON CANADA’S PACIFIC COAST DISCUSSION DOCUMENT
Table 2. Proportion of the volume of total distance per ship-type over
(200nm).
The main ship-type travelling in important whale habitats in order of importance (volume) are “other,” passenger, bulk carriers, container ships and cruises followed closely by fishing (Table 2). For the top five vessel classes, the proportion of traffic appears to be more concentrated in important whale habitats for “other,” cruise and passenger when compared to traffic across Pacific Canadian waters (Table 2). The vessel type “other” represents over 30 per cent of the traffic volume in important whale habitats. That traffic is widespread with the majority travelling at low speed (<11kt) (Figures 10 through 12). Passenger ships are concentrated in inside waters with the bulk of low-speed ferries in the south, whereas faster ferries are more heavily spread along the coast and in the Inside Passage (Figures 16 through 18). Cruise ships also have a widespread footprint within important whale habitats, navigating regular routes close to shore and
in inside waters between Vancouver, Victoria, Nanaimo and Prince Rupert Ports as well as offshore to Washington state and Alaska. Higher speed traffic is concentrated in the northern region inshore from roughly Bella Bella to Prince Rupert and offshore from the tip of Vancouver Island up the coast of Haida Gwaii (Figures 19 through 21).
Bulk carriers’ and container ships’ footprints within important whale habitats are concentrated on the main trading corridors in the north to the Port of Prince Rupert and in the south to the Port of Vancouver and through Hecate Strait (Figures 7 through 9). Bulk carriers do not travel at high speed (>16kt), so most of that category’s traffic falls within the medium speed category, whereas container ships travel faster, particularly through Hecate Strait and offshore Vancouver Island to the Strait of Juan de Fuca (Figures 13 through 15).
©Shutterstock 11
PRIORITIES FOR SHIPPING IN IMPORTANT CETACEAN HABITATS
This preliminary analysis sheds light on the volume and speed of shipping traffic within known important whale habitats in Pacific Canadian waters.
As noted previously, the southern coast of B.C. includes CH of SRKW and habitats of special importance to humpback and transient killer whales, and as a result, this region is the focus
Key results:
• The main ship types travelling in important whale habitats in order of importance (volume in kilometres) are tugs and pleasure crafts, passenger, bulk carriers, container ships and cruises.
• The fastest traffic (>16kt) in important whale habitats is found off the west coast and south to Haida Gwaii in the main route to Pacific Northwest ports1 and within Hecate Strait and is driven by container and cruise ships. This region overlaps primarily with high density of cetaceans during the summer months and fin whale important habitat.
• High-risks areas where several important whale habitats overlap with fast vessel traffic (>11kt) include:
o The Dixon entrance to the Port of Prince Rupert: This region hosts a high density of cetaceans during the summer months, CH for NRKW and habitat of special importance for humpback whales. Traffic speed in the region is medium (between 11-16kt) and primarily driven by bulk carriers and, to a lesser extent, container ships.
o The Central Coast, Inside Passage and entrance to the Port of Kitimat: This region hosts a high density of cetaceans during the summer months, as well as fin, humpback and transient killer whale important habitats. The fastest (above 16 kt) and most common vessels (volume in kilometres) in the region are cruise and passenger vessels. This area will also increase in shipping volume from LNG (liquefied natural gas) carriers loading at the Port of Kitimat beginning in 2024.
of the ECHO Program, which has developed several measures to reduce the cumulative effects of commercial shipping activity on at-risk whales. As this region receives substantial attention, key results presented here focus primarily on the Northern Shelf Bioregion of B.C., which has generally been overlooked when identifying shipping priorities for cetaceans in Canada’s Pacific waters.
Based on the analysis presented above, WWF-Canada recommends that the Dixon Entrance to the Port of Prince Rupert and the Central Coast, the Inside Passage and the entrance to the Port of Kitimat should be prioritized for vessel management to reduce risk to cetaceans from shipping.
1.
©Shutterstock
A voluntary shipping protection zone trial for the west coast of the island of Haida Gwaii started in September 2020. Vessels of 500 tonnes or more are asked to observe a minimum distance of 50 miles from the island apart from vessels going between Pacific Northwest ports (25nm) and cruise vessels (12nm). Changes in vessel behaviours and speed from this trial is not reflected in this report. WWF-CANADA – SHIPPING TRAFFIC AND SPEED IN CETACEAN HABITATS ON CANADA’S PACIFIC COAST DISCUSSION DOCUMENT
© Shutterstock
Reducing risks to cetaceans
The most effective mitigation measures will be highly specific to each geographic area and stakeholders; nonetheless best practices show that shipping impacts on cetaceans can be effectively reduced by moving ships away from important habitat, slowing down and making ships quieter and cleaner.53
• Move ships away: Modifying routes or designing vessel exclusion zones to reduce the overlap of traffic within important whale habitats will reduce the risk of collisions, disturbances and exposure to underwater noise, particularly during large aggregation of animals (e.g., migration, feeding, etc).
• Slow down ships: Reducing speed to 10kt or lower will decrease risks of collision and reduce underwater noise and GHG emissions, providing a number of cobenefits to cetaceans, ecosystems and people.
• Make ships quieter: Noise reduction practices and technologies with port-led incentives, eco-certification and long-term underwater noise management plans with clear targets and thresholds for noise reduction can make a big difference in creating quieter oceans.
• Make ships cleaner: Eliminating operational discharges like grey water and scrubber effluents within important whale habitats and encouraging the switch to low- and zero-emission technologies (including clean fuels) to achieve zero emissions by 2050 can reduce oil spill risks and cetaceans’ exposure to pollutants as well as reduce GHG emissions.
The Northern Shelf Bioregion of British-Columbia is experiencing an increase in shipping activities and includes two high-risks areas in key habitats for several at-risk whales. This document provides preliminary information to guide discussions and the development of working groups; to encourage actions and support future studies, such as scenario-based and cost-benefit analysis in support of decision-making and trial mitigation measures that will aid in the recovery of Canadian Pacific cetaceans; and to ensure that Canada’s growing shipping sector is sustainable.
For more information, read WWF-Canada blogs:
• Grey water dumping threatens ocean health and people
• The trouble with scrubbers: shipping’s emissions “solution” creates new pollution
• No, I don’t want no scrubbers
• I got 99 problems and dumping is one
• For whales, underwater noise is pollution too
13
REFERENCES
1. Council of Canadian Academies. The Value of Commercial Marine Shipping to Canada cca-reports.ca/wp-content/uploads/2018/08/ ValueMarineShipping_fullreport_EN.pdf (2017).
2. Prince Rupert Port Authority. 2020. Ridley Island Export Logistics Platform Project. rupertport.com/ wp-content/uploads/2020/04/20200128_669159_ RPT_RIELP_ProjectDescription_Final.pdf
3. Chevron Canada Limited. 2019. Project Description Summary: Kitimat LNG Expansion Project. iaac-aeic. gc.ca/050/documents/p80180/130805E.pdf
4. Clear Seas. 2020. Vessel Traffic in Canada’s Pacific Region. clearseas.org/wp-content/uploads/2021/02/ VTA-Pacific-Final-Report-EN.pdf
5. Gregr, E.J., Calambokidis, J., Convey, L., Ford, J.K.B., Perry, R.I., Spaven, L. and M. Zacharias. 2005. Proposed Recovery Strategy for Blue, Fin, and Sei Whales (Balaenoptera musculus, B. physalus, and B. borealis) in Pacific Canadian Waters. Nanaimo: Fisheries and Oceans Canada. vi + 54pp. sararegistry. gc.ca/virtual_sara/files/plans/rs_Blue_fin_sei_ whales_Pacific_popln_0306_e.pdf
6. Port of Vancouver. Cargo Statistics Report - 2 pager YTD : Dec 2020 vs Dec 2019.
7. Nuka Research & Planning Group, L. 2013. West Coast Spill Response Study, Volume 2 – Vessel Traffic Analysis. 105.
8. Government of Canada. Species at Risk Public Registry. canada.ca/en/environment-climate-change/ services/species-risk-public-registry.html
9. DFO. 2017. Identification of Habitat of Special Importance to Fin Whales (Balaenoptera physalus) in Canadian Pacific Waters. DFO Canadian Science Advisory Secretariat Science Advisory Report. 2017/039.
10. DFO. 2013. Information in Support of the Identification of Critical Habitat for Transient Killer Whales (Orcinus Orca) off the West Coast of Canada. DFO Canadian Science Advisory Secretariat Science Advisory Report. 2013/025.
11. DFO. 2010. Advice Relevant to the Identification of Critical Habitats for North Pacific Humpback Whales (Megaptera novaeangliae). DFO Canadian Scienc Advisory Secretariat Science Response. 2009/016.
12. Roman, J. and McCarthy, J. J. 2010. The Whale Pump: Marine Mammals Enhance Primary Productivity in a Coastal Basin. PLOS One 5.
13. Chami, R., Cosimano, T., Fullenkamp, C. and S. Oztosun. 2019. Nature’s Solution to Climate Change. Finance & Development. 56: 34-38.
14. Government of Canada. 2018. Southern Resident Killer Whale Symposium, October 10-12, 2017, Vancouver, British-Columbia – What We Heard Report. waves-vagues.dfo-mpo.gc.ca/ Library/40665884.pdf
15. McKenna, M., Calambokidis, J., Oleson, E., Laist, D. and J. Goldbogen. 2015. Simultaneous Tracking of Blue Whales and Large Ships Demonstrates Limited Behavioral Responses for Avoiding Collision. Endangered Species Research 27: 219-232.
16. Silber, G.K., Slutsky, J. and S. Bettridge. 2010. Hydrodynamics of a Ship/Whale Collision. Journal of Experimental Marine Biology and Ecology 391: 1019.
17. Schoeman, R.P., Patterson-Abrolat, C. and S. Plön. 2020. A Global Review of Vessel Collisions with Marine Animals. Frontiers of Marine Science 7: 1-25.
18. Raverty, S., et al. 2020. Pathology Findings and Correlation with Body Condition Index in Stranded Killer Whales (Orcinus orca) in the Northeastern Pacific and Hawaii from 2004 to 2013. PLOS One 15.
19. DFO. 2007. Recovery Strategy for the Transient Killer Whale (Orcinus orca) in Canada. Species at Risk Act Recovery Strategy Series. sararegistry.gc.ca/ virtual_sara/files/plans/Rs-ResidentKillerWhalev00-2018Aug-Eng.pdf
20. Williams, R. and O’Hara, P. 2010. Modelling Ship Strike Risk to Fin, Humpback and Killer Whales in British Columbia, Canada. Journal of Cetacean Research and Management 11: 1-8.
21. Cotton Rockwood, R., Calambokidis, J. and J. Jahncke. 2017. High Mortality of Blue, Humpback and Fin Whales from Modeling of Vessel Collisions on the U.S. West Coast Suggests Population Impacts and Insufficient Protection. PLOS One 13: 1-24.
22. LANTEC Marine Inc. 2019. Report of Simulation Manoeuvring Analysis – Vessel Low Speed Transits in Areas Identified as Whale Sensitive Habitat. xxvi + 172 p.
23. Kelley, D.E., Vlasic, J.P. and S.W. Brillant. 2021. Assessing the Lethality of Ship Strikes on Whales Using Simple Biophysical Models. Marine Mammal Science 37: 251-267.
24. Nichol, L.M., Wright, B.M., O’Hara, P. and J.K.B. Ford. 2017. Risk of Lethal Vessel Strikes to Humpback and Fin Whales off the West Coast of Vancouver Island, Canada. Endangered Species Research 32: 373-390.
25. Mcdonald, M.A., Hildebrand, J.A. and S.M. Wiggins. 2006. Increases in Deep Ocean Ambient Noise in the Northeast Pacific West of San Nicolas Island, California. doi:10.1121/1.2216565.
26. Southall, B.L., et al. 2017. Underwater Noise from Large Commercial Ships – International Collaboration for Noise Reduction. Encyclopedia of Maritime and Offshore Engineering 1-9 (John Wiley & Sons, Ltd). doi:10.1002/9781118476406.emoe056.
27. Duarte, C.M., et al 2021. The Soundscape of the Anthropocene Ocean. Science 371.
WWF-CANADA – SHIPPING TRAFFIC AND SPEED IN CETACEAN HABITATS ON CANADA’S PACIFIC COAST DISCUSSION DOCUMENT
28. MacGillivray, A.O., Li, Z., Hannay, D.E., Trounce, K.B. and O.M. Robinson. 2019. Slowing Deep-Sea Commercial Vessels Reduces Underwater Radiated Noise. Journal of the Acoustical Society of America 146: 340-351.
29. Crystal, D., Moseley, K., Paterson, C., Ryvola, R. and S. Wang. 2011. Commercial Shipping Noise Impacts on the Critical Habitat of the Southern Resident Killer Whale (Orcinus orca). Environmental Science pp. 1-34.
30. Holt, M.M., Noren, D.P., Veirs, V., Emmons, C.K. and S. Veirs. 2009. Speaking up: Killer Whales (Orcinus orca) Increase Their Call Amplitude in Response to Vessel Noise . Journal of the Acoustical Society of America 125: EL27–EL32.
31. Lusseau, D., Bain, D.E., Williams, R. and J.C. Smith. 2009. Vessel Traffic Disrupts the Foraging Behavior of Southern Resident Killer Whales (Orcinus orca). Endangered Species Research 6: 211-221.
32. Noren, D.P., Johnson, A.H., Rehder, D. and A. Larson. 2009. Close Approaches by Vessels Elicit Surface Active Behaviors by Southern Resident Killer Whales. Endangered Species Research 8: 179-192.
33. Williams, R., Erbe, C., Ashe, E., Beerman, A. and J. Smith. 2014. Severity of Killer Whale Behavioral Responses to Ship Noise: A Dose-Response Study. Marine Pollution Bulletin 79: 254-260.
34. Heise, K., et al. 2017. Proposed Metrics for the Management of Underwater Noise for Southern Resident Killer Whales. Coastal Ocean Report Series 2017: 31.
35. Hemmera Envirochem Inc. 2016. Vessel Quieting Design, Technology, and Maintenance Options for Potential Inclusion in EcoAction Program portvancouver.com/ecoaction
36. Joy, R., et al. 2019. Potential Benefits of Vessel Slowdowns on Endangered Southern Resident Killer Whales. Frontiers of Marine Science 6: 1-20.
37. Chion, C., Lagrois, D. and J. Dupras. 2019. A MetaAnalysis to Understand the Variability in Reported Source Levels of Noise Radiated by Ships From Opportunistic Studies. Frontiers in Marine Science 6.
38. Georgeff, E., Mao, X., and B. Comer. 2019. A Whale of a Problem? Heavy Fuel Oil, Exhaust Gas Cleaning Systems, and British Columbia’s Resident Killer Whales. ICCT Consulting Report. wwf.ca/report/ killer-whale-habitat-consulting-paper-2019
39. Etkin, D.S. 2010. Worldwide Analysis of In-Port Vessel Operational Lubricant Discharges and Leakages. Proceedings of the 33rd AMOP Technical Seminar on Environmental Contamination and Response 1: 529-553.
40. IMO MEPC. 2008. Use of Seawater Lubricated Tube Bearings to Eliminate Stern Tube Oil Pollution Ships.
41. Vard Marine Inc. 2019. Greywater Generation Estimates for the BC Coast. wwf.ca/wp-content/ uploads/2020/03/GREYWATER-GENERATIONESTIMATES-FOR-THE-BC-Coast_June-2019.pdf (2019).
42. EPA. 2011. Greywater Discharges from Vessels. www3.epa.gov/npdes/pubs/vgp_graywater.pdf
43. Transport Canada. 2013. Pollution Prevention Guidelines for the Operation of Cruise Ships under Canadian Jurisdiction - TP14202E. tc.canada.ca/ en/marine-transportation/marine-safety/pollutionprevention-guidelines-operation-cruise-ships-undercanadian-jurisdiction-tp14202e-2013
44. Endres, S., et al. 2018. A New Perspective at the ShipAir-Sea-Interface: The Environmental Impacts of Exhaust Gas Scrubber Discharge. Frontiers of Marine Science 5.
45. Magnusson, K., Thor, P. and M. Granberg. 2018. Scrubbers: Closing the Loop Activity 3: Task 2 Risk Assessment of Marine Exhaust Gas Scrubber Water.
46. Gillespie, A. 2016. Vulnerability and Response to the Risk of International Shipping: The Case of the Salish Sea. Review of European, Comparative & International Environmental Law 25: 317-332.
47. NOAA. 2010. Sea Turtles, Dolphins, and Whales – 10 years after the Deepwater Horizon Oil Spill.
48. Heiltsuk Tribal Council. 2017. Investigation Report : The 48 Hours after the Grounding of the Nathan E. Stewart and Its Oil Spill. heiltsuknation.ca/wpcontent/uploads/2017/10/HTC-NES-IRP-2017-03-31. pdf
49. Agamuthu, P., Mehran, S.B., Norkhairah, A. and A. Norkhairiyah. 2019. Marine Debris: A Review of Impacts and Global Initiatives. Waste Management & Research 37: 987-1002.
50. DNV GL AS Maritime. 2021. Alternative Fuels for Canada: Pointing the Direction towards Low/ZeroEmission Shipping. 12.
51. Leaper, R. 2019. The Role of Slower Vessel Speeds in Reducing Greenhouse Gas Emissions, Underwater Noise and Collision Risk to Whales. Frontiers in Marine Science 6.
52. Coastal Ocean Research Institute. 2016. Mariner’s Guide to Whales, Dolphins, and Porpoises of Western Canada
53. Minton, G., et al. 2021. Shipping and Cetaceans: A Review of Impacts and Mitigation Options for Policy Makers. WWF Report. https://wwfwhales.org/ resources/2021-wwf-report-shipping-cetaceans
15
MAPS
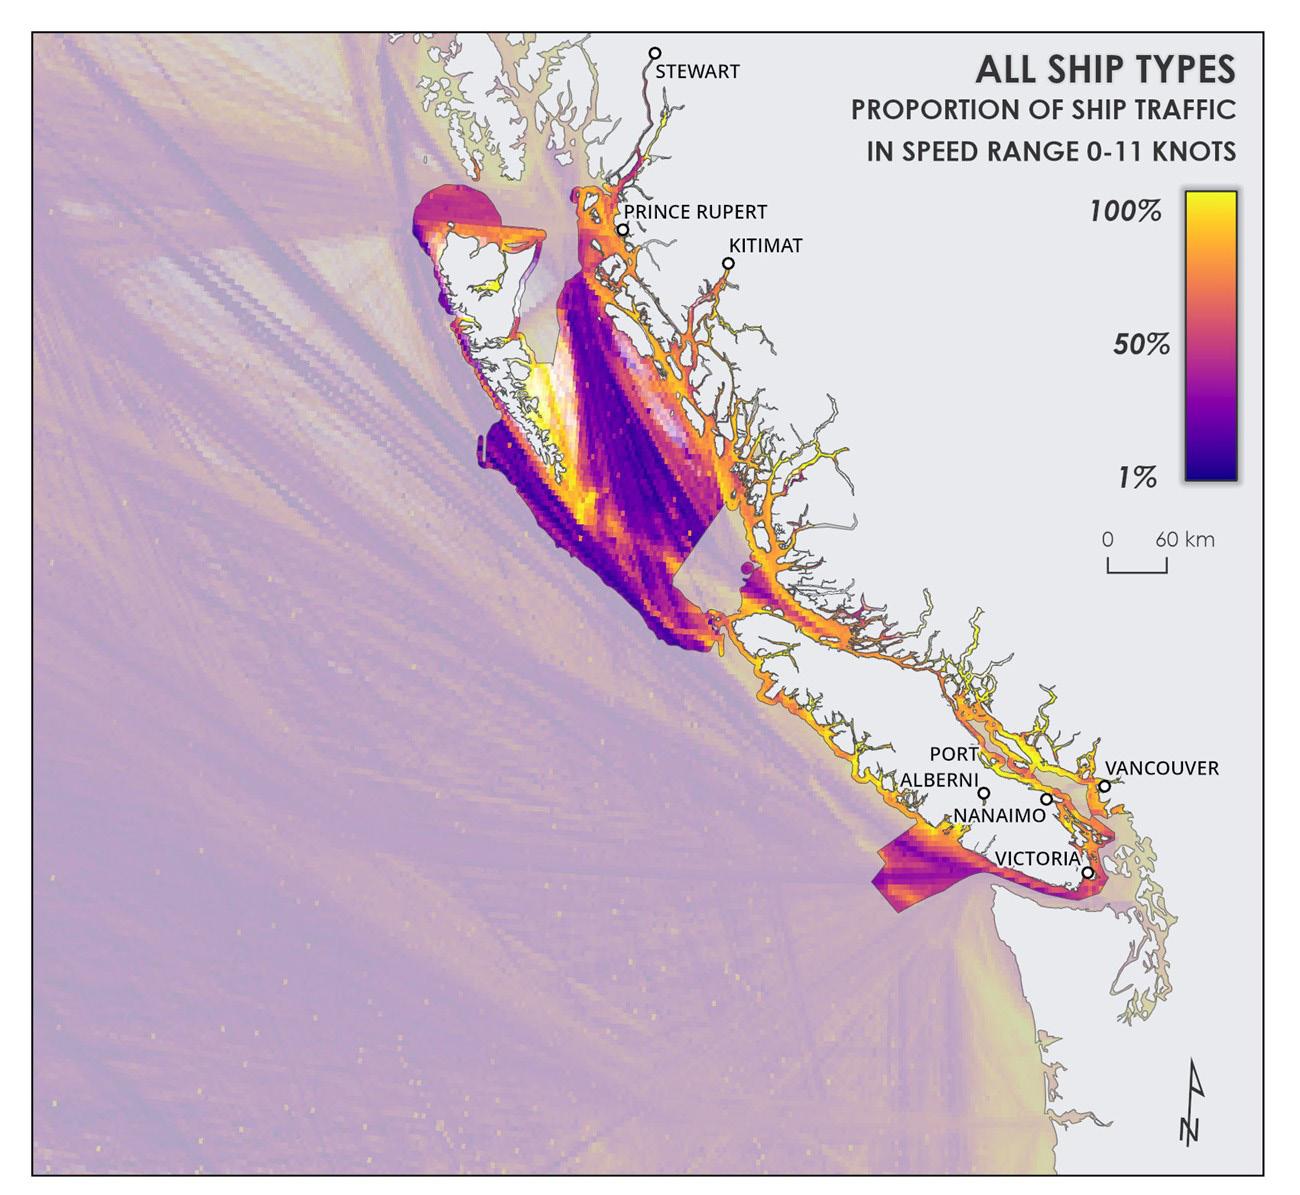
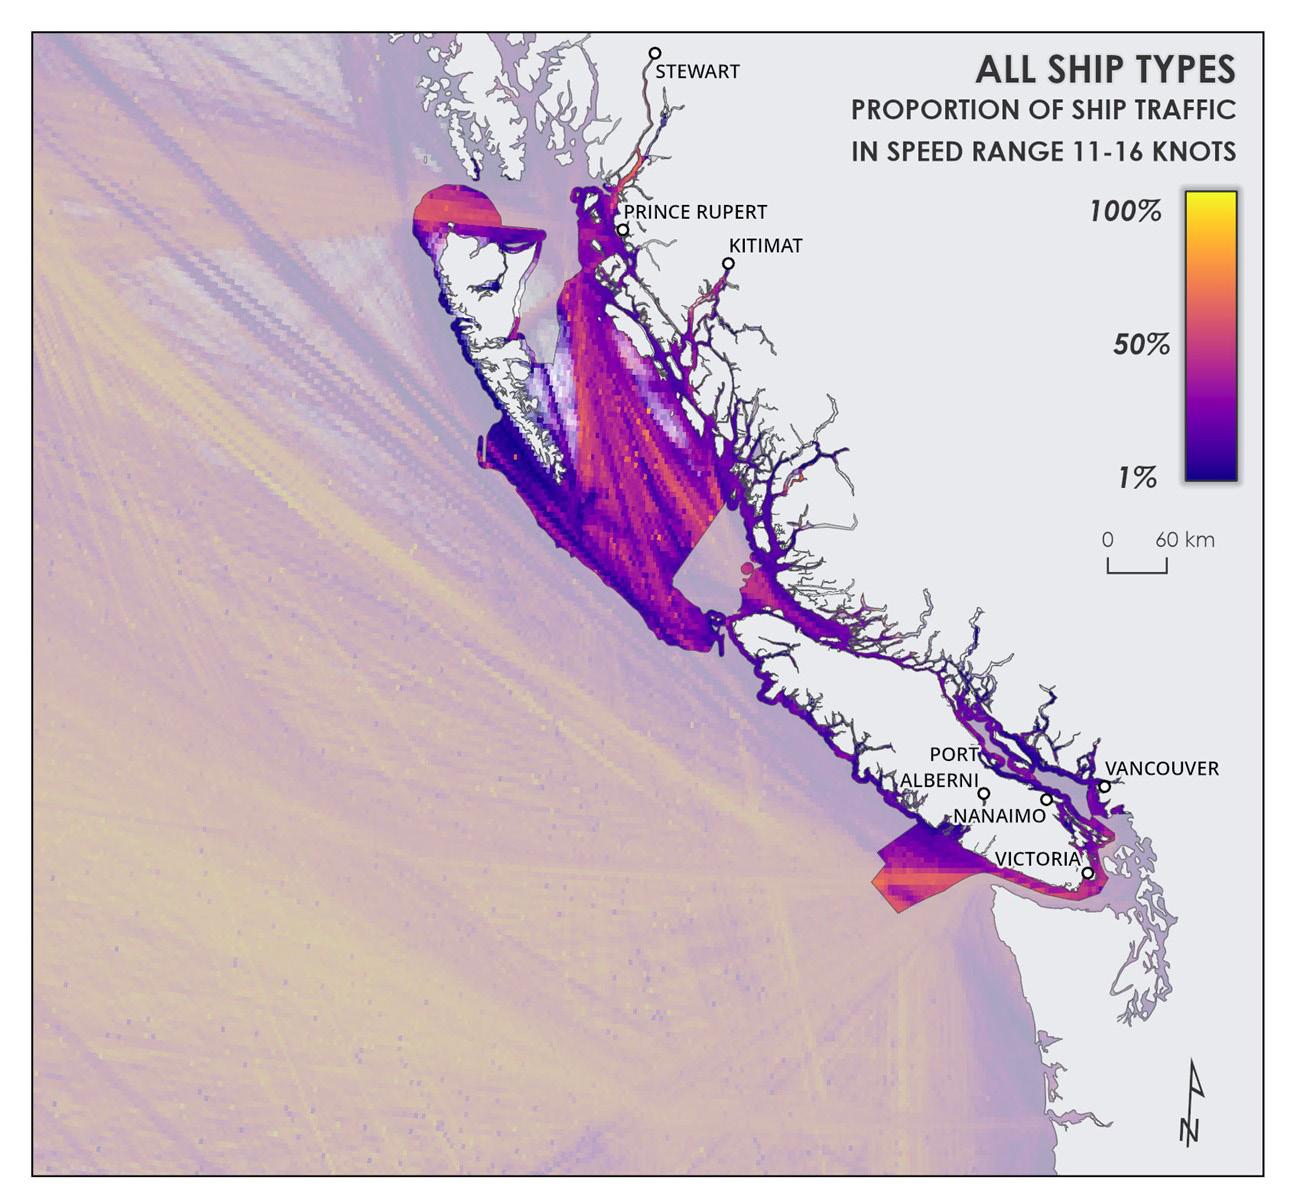 Figure 4. Volume of all vessels travelling between 0 and 11kt as a proportion of all vessel traffic within important whale habitats. Bright yellow (100%) indicates that all vessel traffic in this region is travelling within the speed category.
WWF-CANADA – SHIPPING TRAFFIC AND SPEED IN CETACEAN HABITATS ON CANADA’S PACIFIC COAST DISCUSSION DOCUMENT
Figure 5. Volume of all vessels travelling between 11 and 16kt as a proportion of all vessel traffic within important whale habitats. Bright yellow (100%) indicates that all vessel traffic in this region is travelling within the speed category.
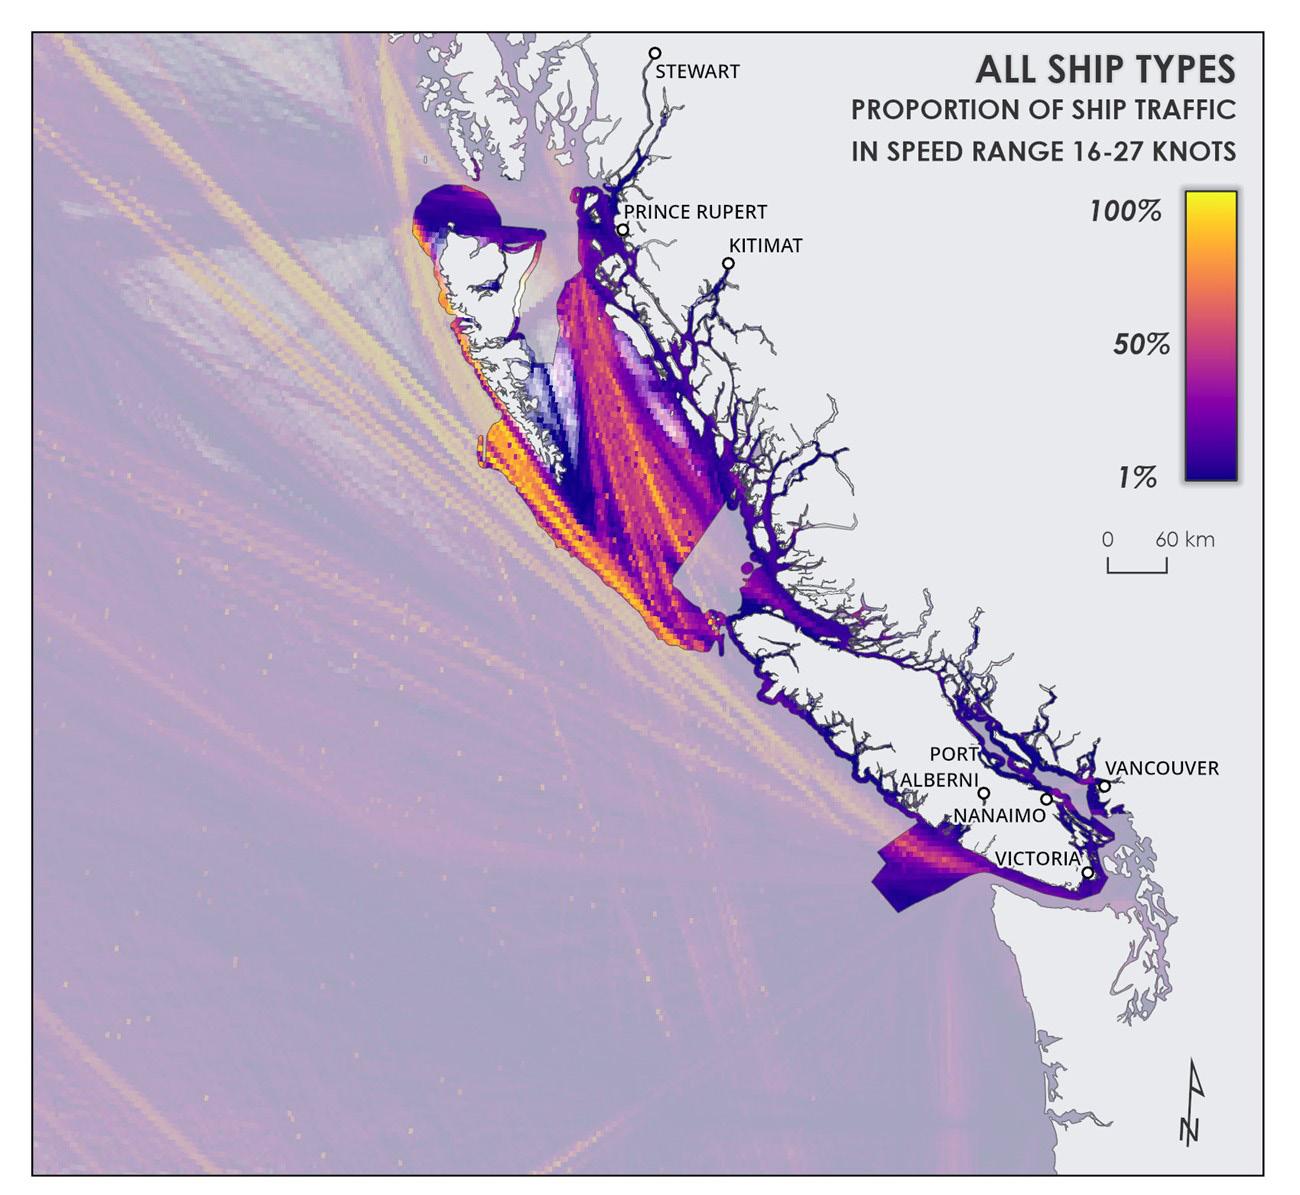
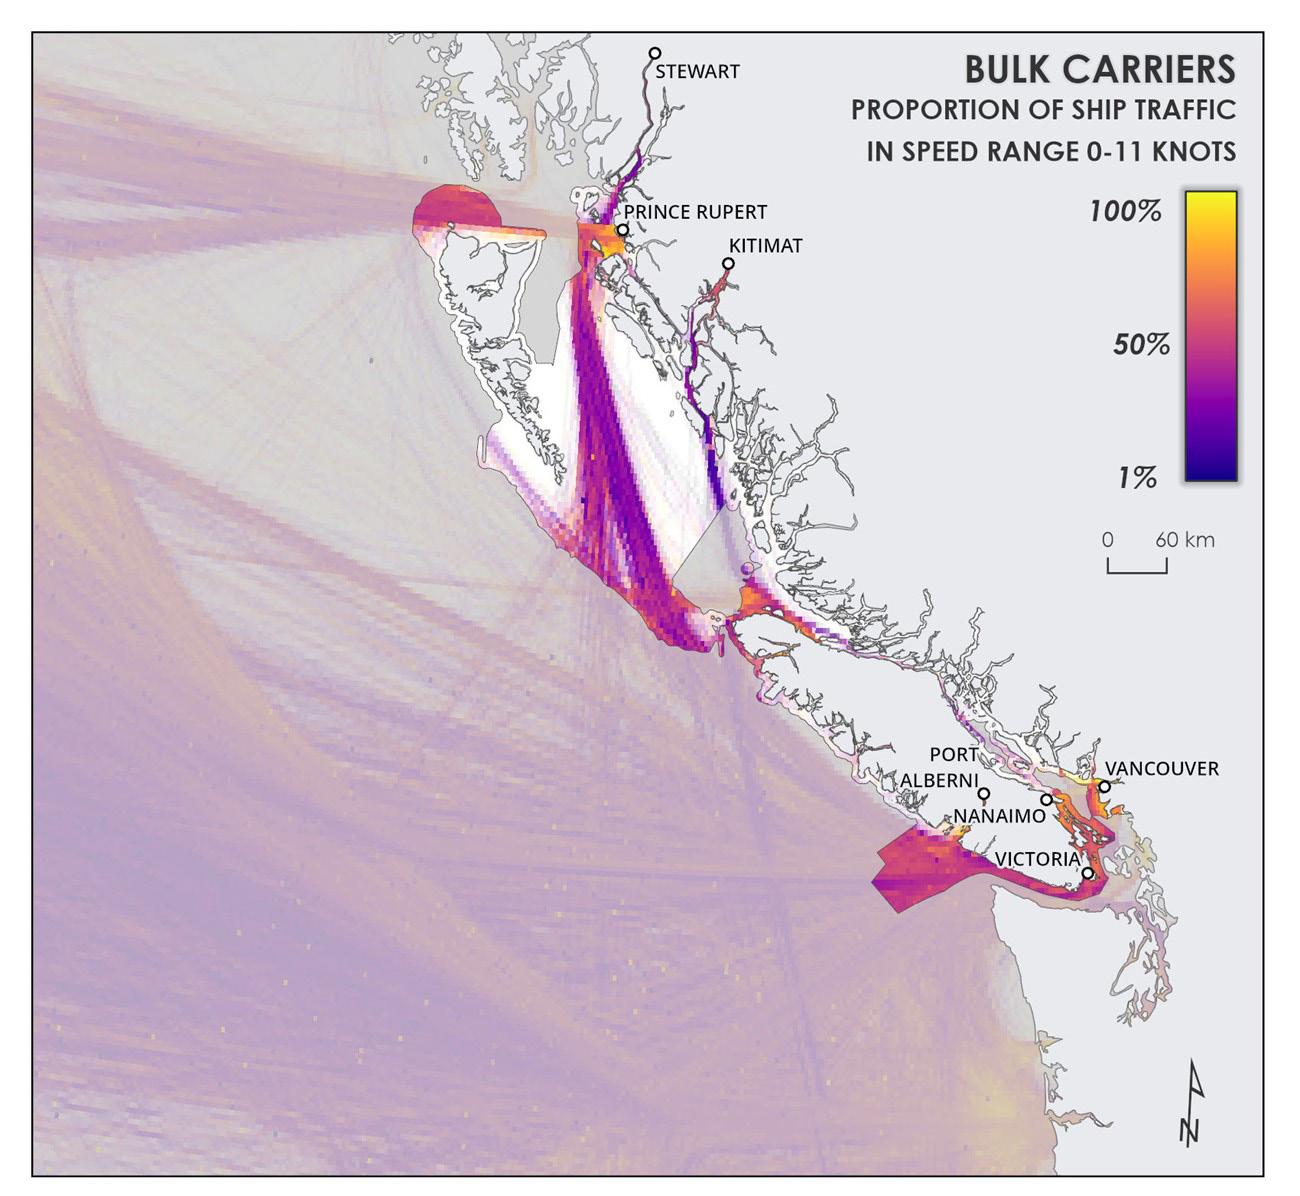 Figure 6. Volume of all vessels travelling above 16kt as a proportion of all vessel traffic within important whale habitats. Bright yellow (100%) indicates that all vessel traffic in this region is travelling within the speed category.
17
Figure 7. Volume of bulk carriers travelling below 11kt as a proportion of all vessel traffic within this speed range in important whale habitats. Bright yellow (100%) indicates that bulk carriers in this region are all travelling within the speed category.
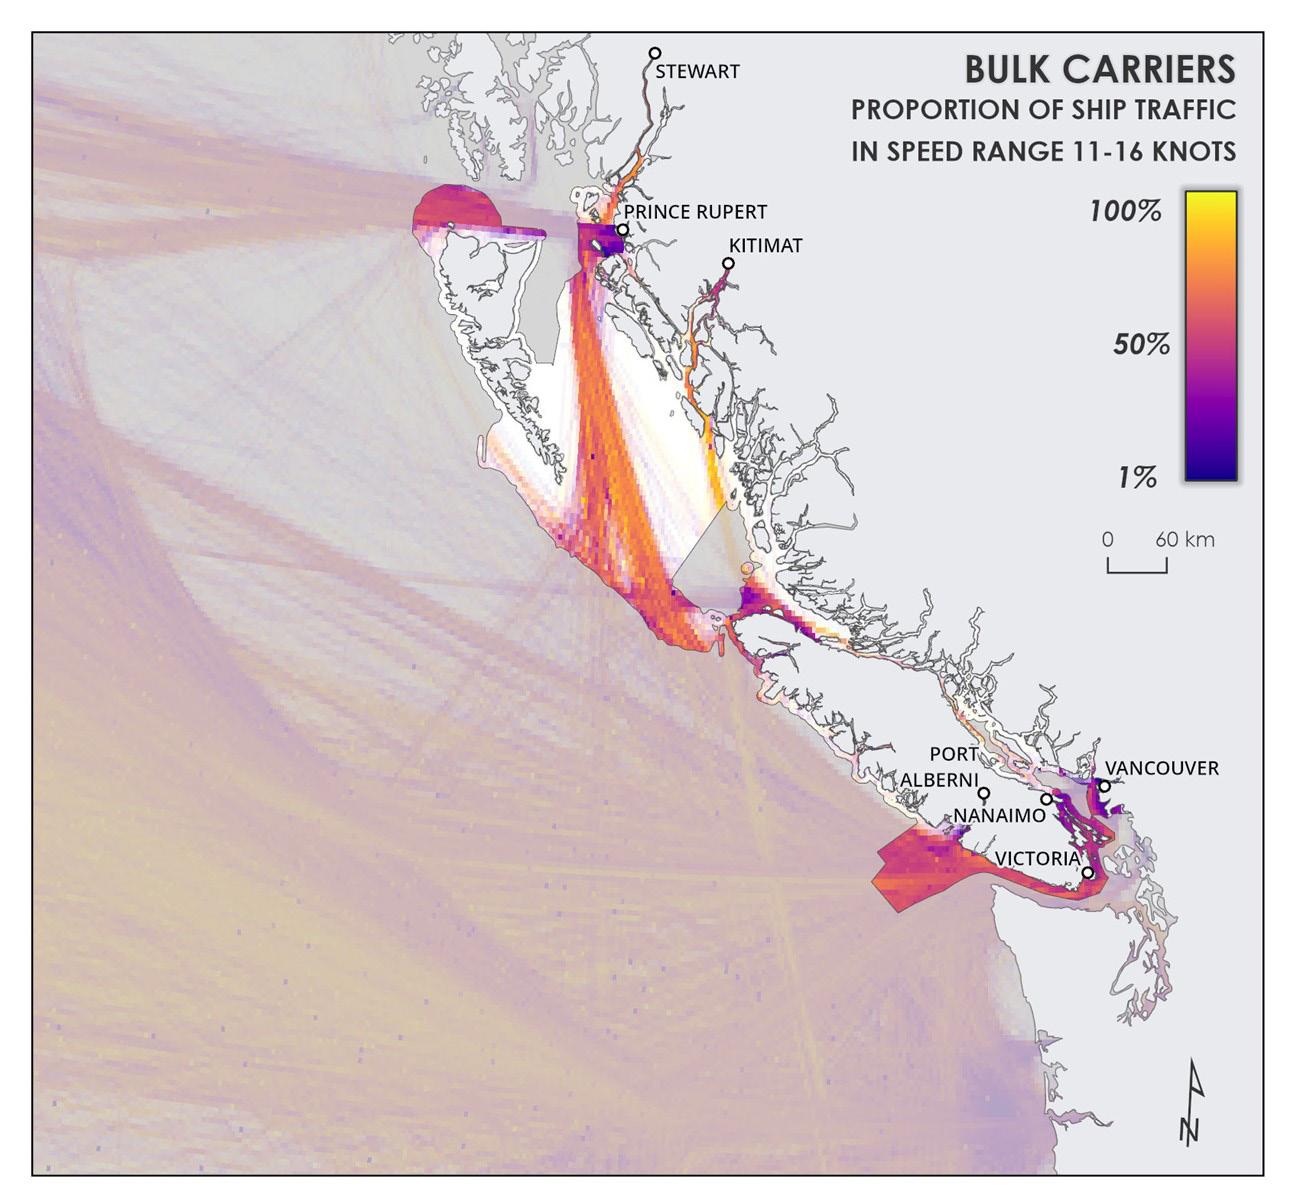
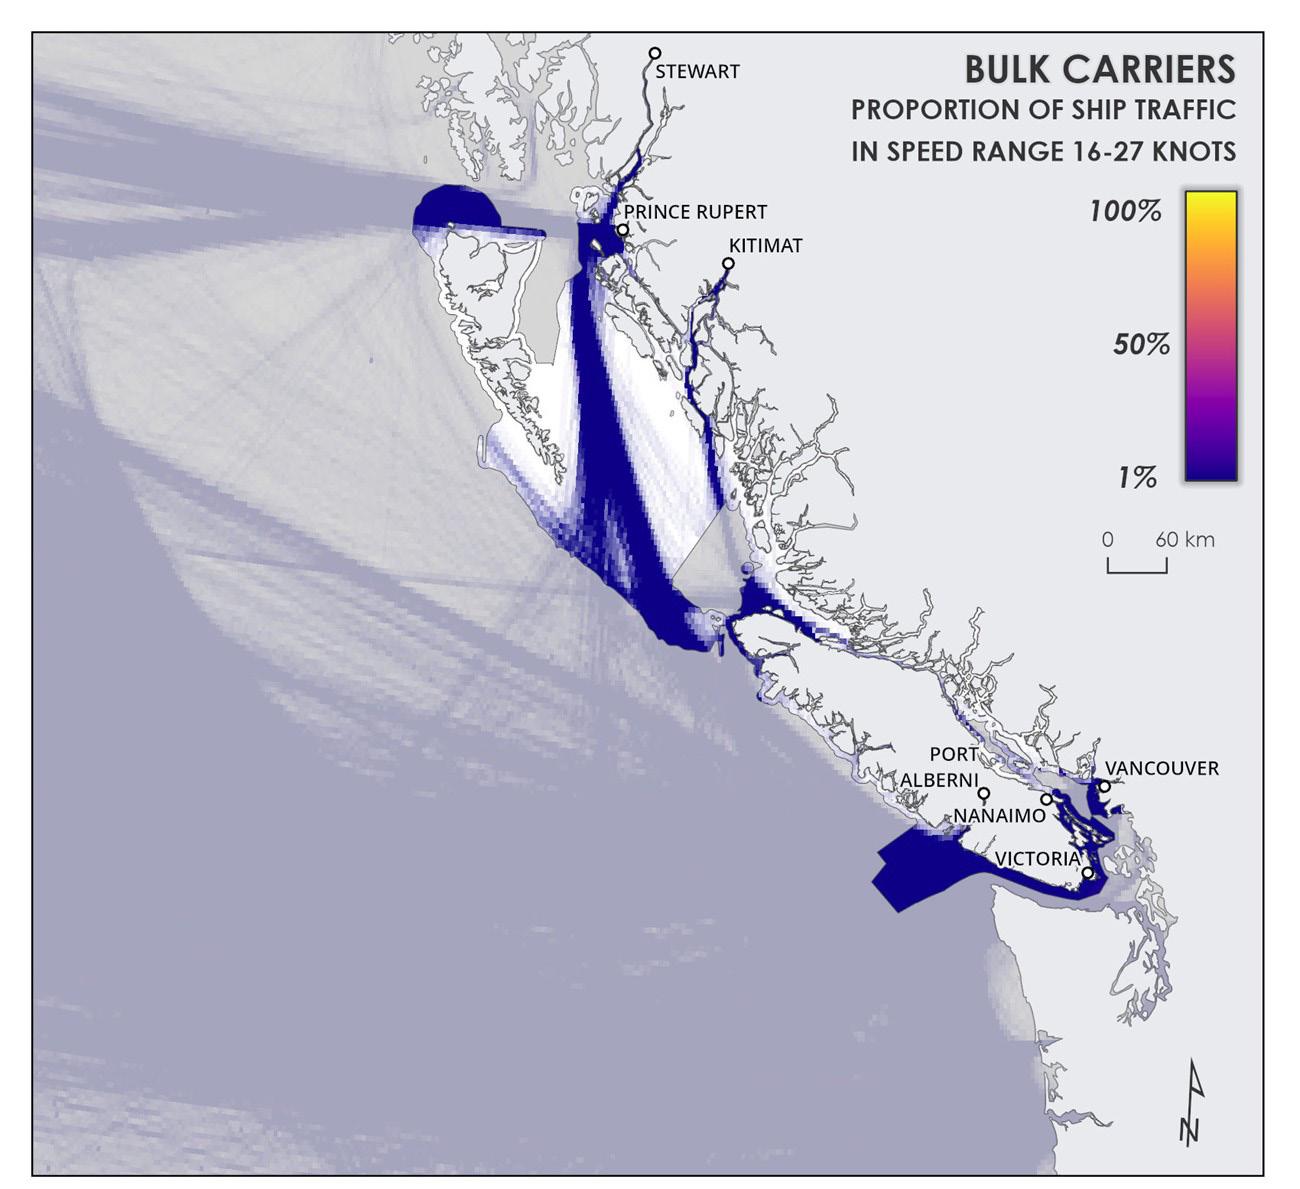 Figure 8. Volume of bulk carriers travelling between 11 and 16kt as a proportion of all vessel traffic within this speed range in important whale habitats. Bright yellow (100%) indicates that bulk carriers in this region are all travelling within the speed category.
WWF-CANADA – SHIPPING TRAFFIC AND SPEED IN CETACEAN HABITATS ON CANADA’S PACIFIC COAST DISCUSSION DOCUMENT
Figure 9. Volume of bulk carriers travelling above 16kt as a proportion of all vessel traffic within this speed range in important whale habitats. Bright yellow (100%) indicates that bulk carriers in this region are all travelling within the speed category.
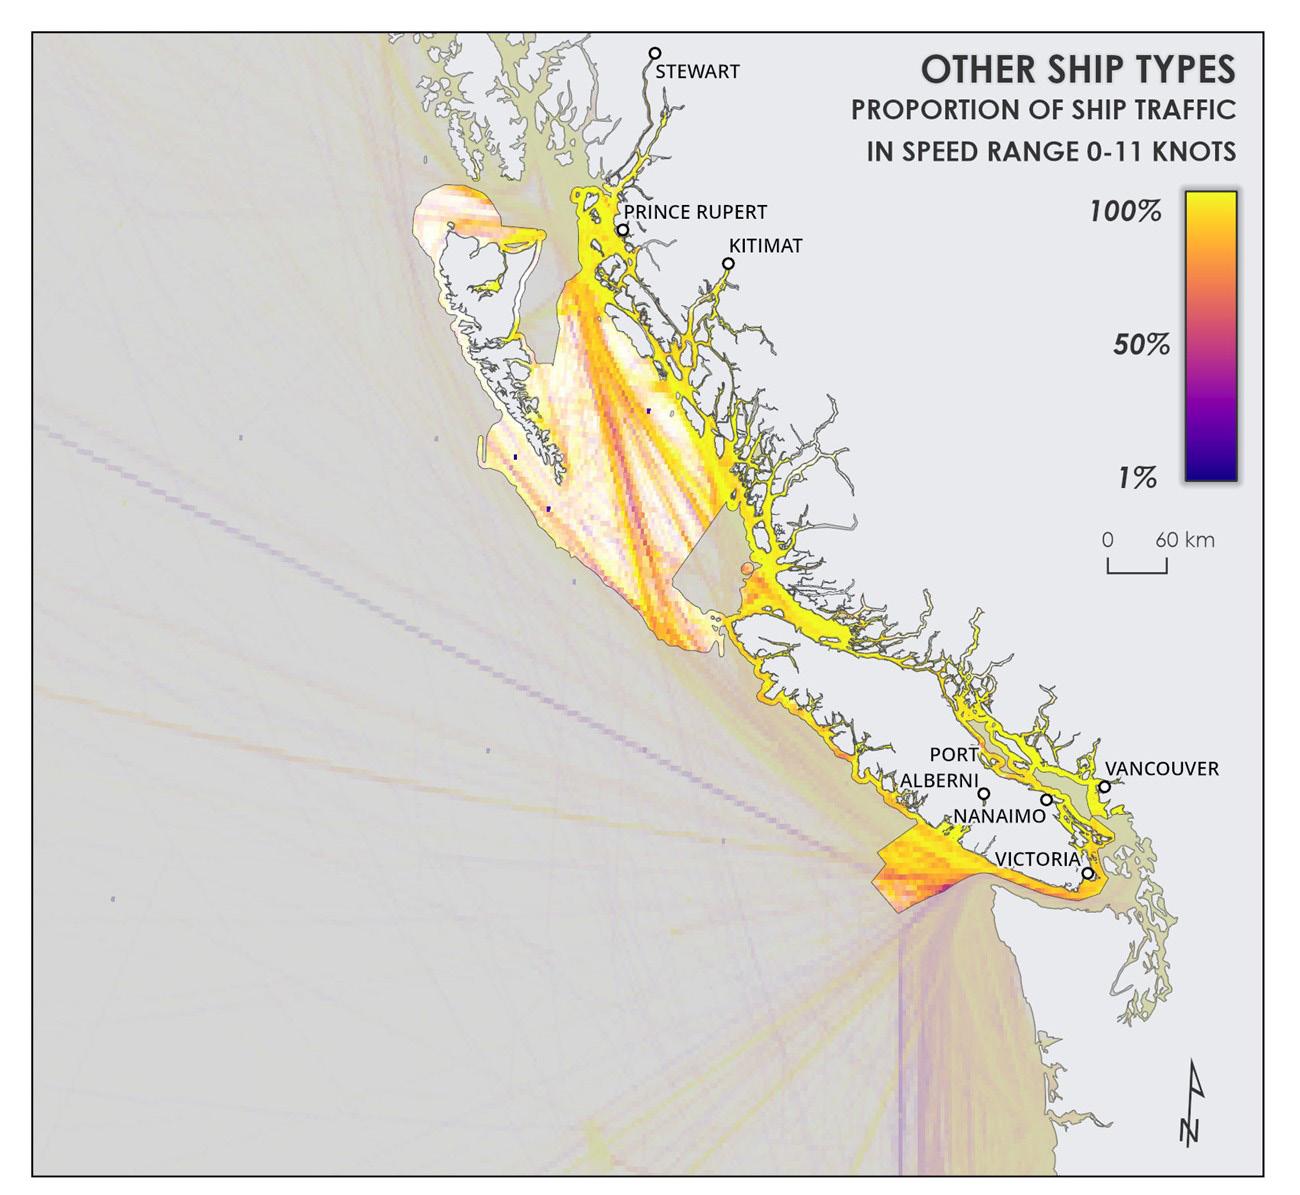
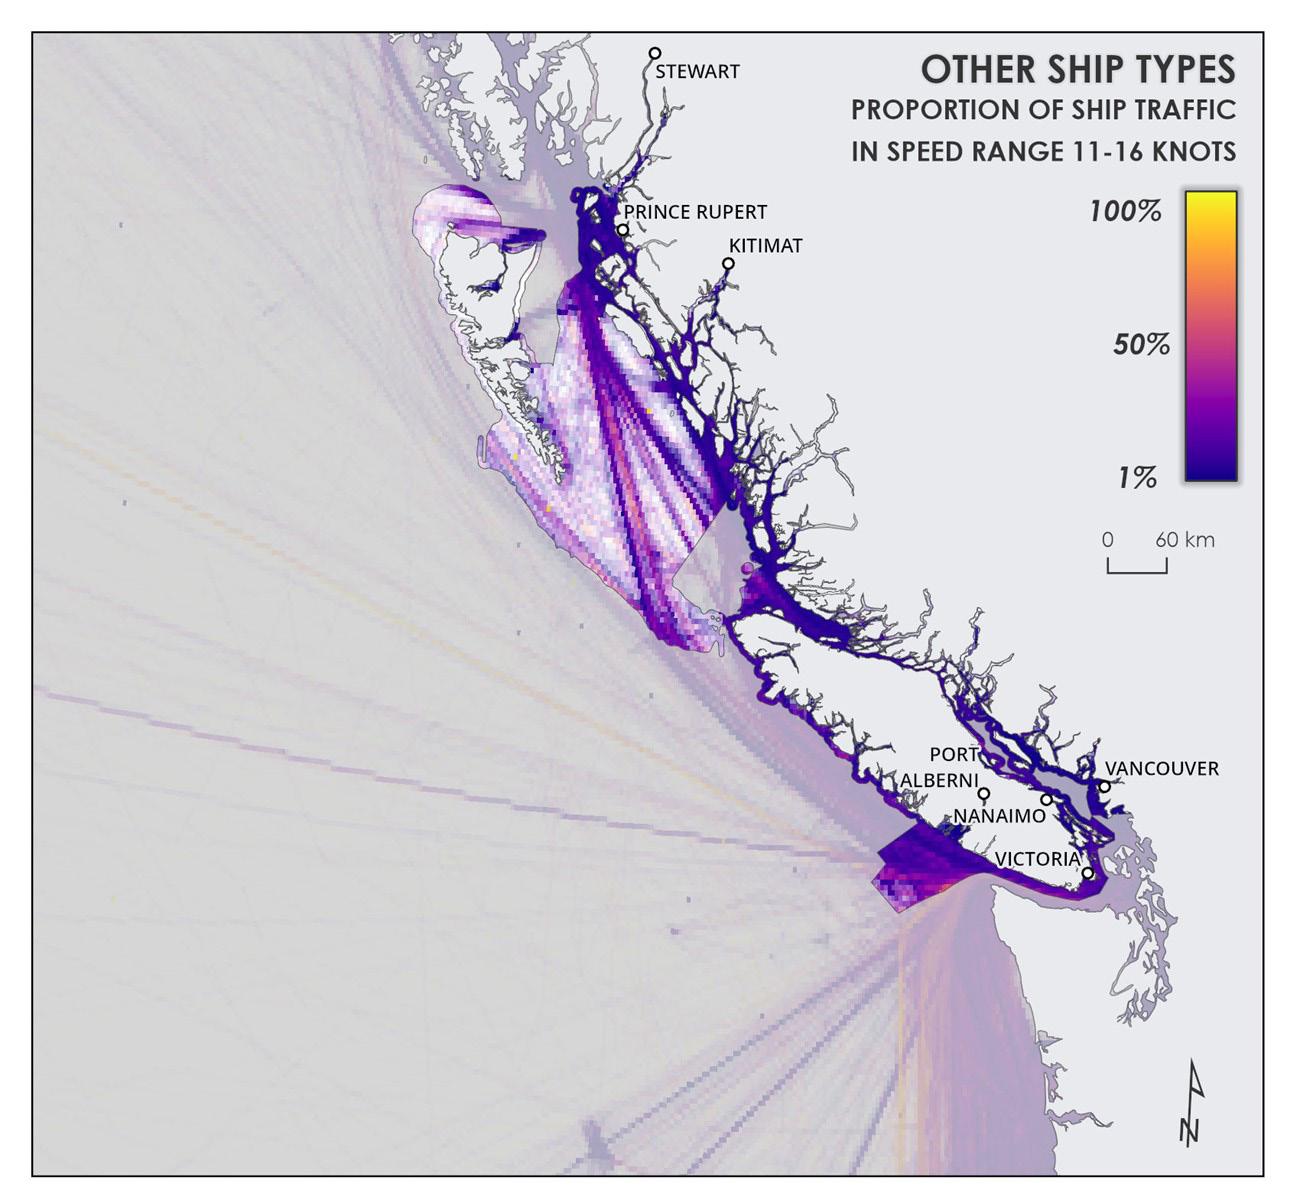 Figure 10. Volume of “other” ships travelling below 11kt as a proportion of all vessel traffic within this speed range in important whale habitats. Bright yellow (100%) indicates that “other” ships in this region are all travelling within the speed category.
19
Figure 11. Volume of “other” ships travelling between 11 and 16kt as a proportion of all vessel traffic within this speed range in important whale habitats. Bright yellow (100%) indicates that “other” ships in this region are all travelling within the speed category.
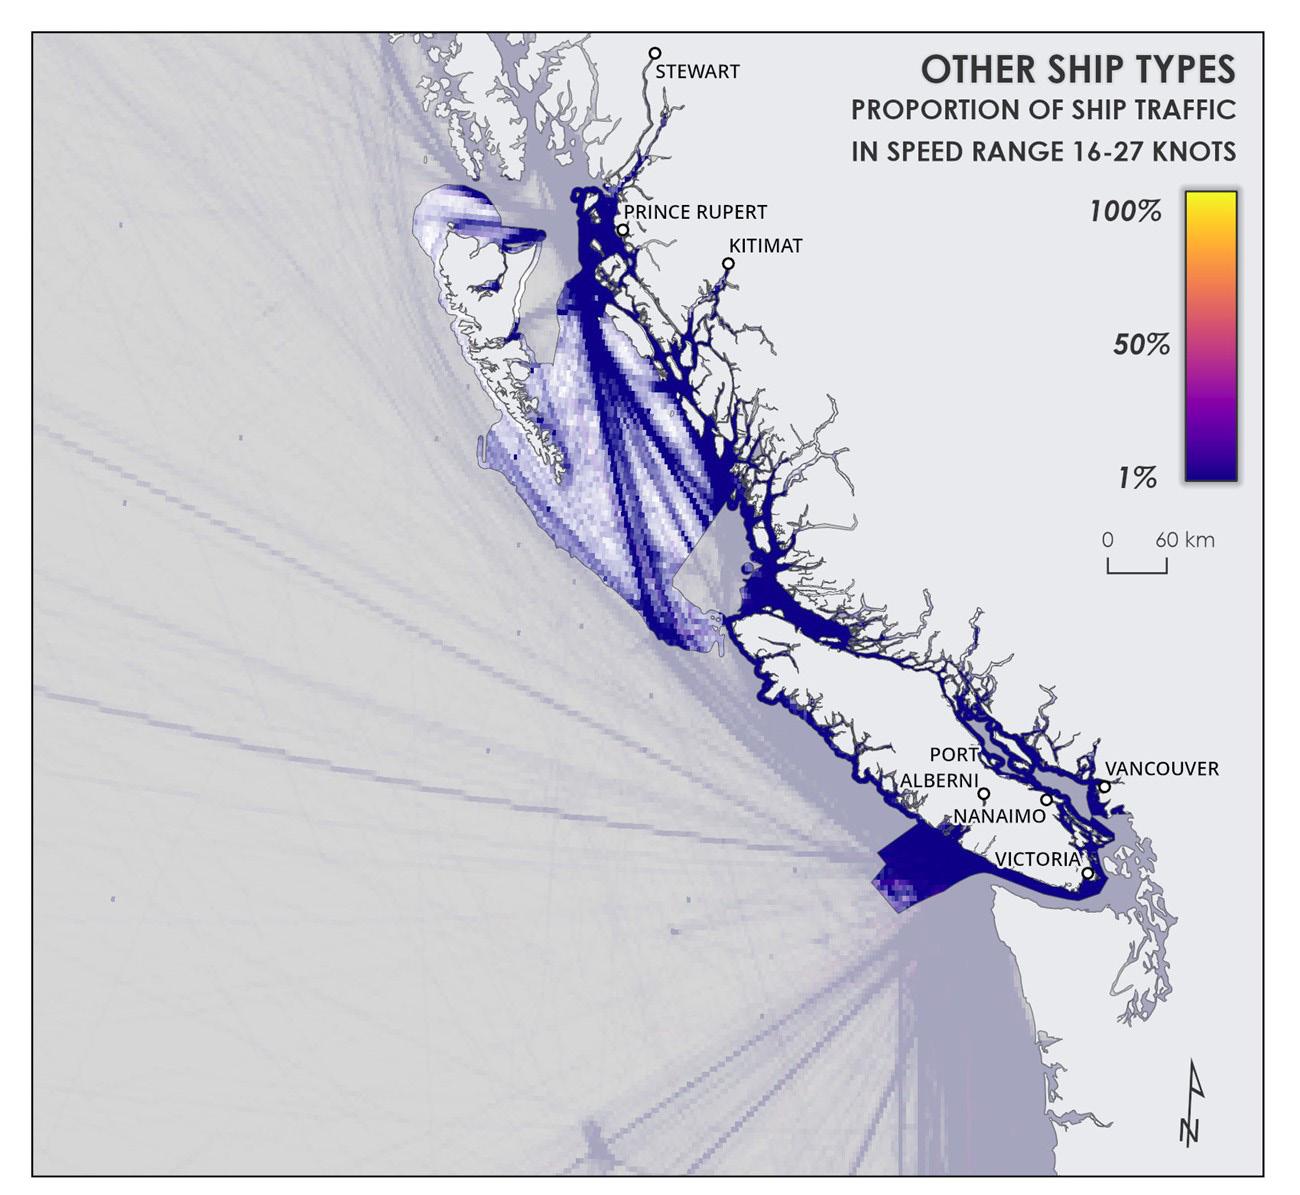
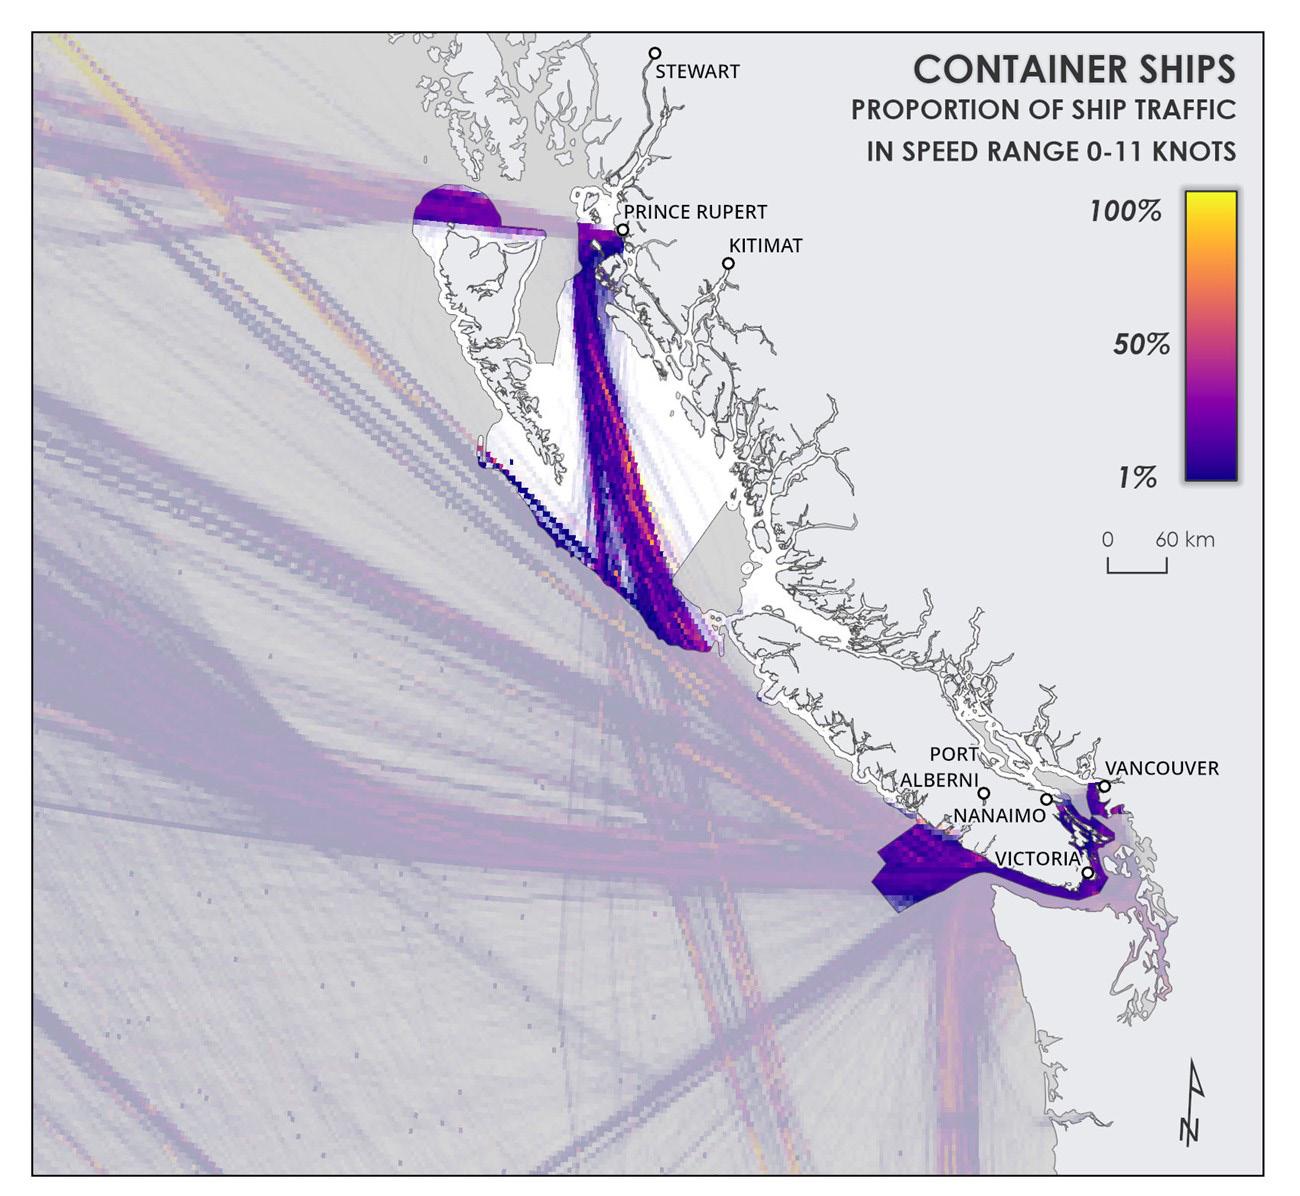 Figure 12. Volume of “other” ships travelling above 16kt as a proportion of all vessel traffic within this speed range in important whale habitats. Bright yellow (100%) indicates that “other” ships in this region are all travelling within the speed category.
WWF-CANADA – SHIPPING TRAFFIC AND SPEED IN CETACEAN HABITATS ON CANADA’S PACIFIC COAST DISCUSSION DOCUMENT
Figure 13. Volume of container ships travelling below 11kt as a proportion of all vessel traffic within this speed range in important whale habitats. Bright yellow (100%) indicates that container ships in this region are all travelling within the speed category.
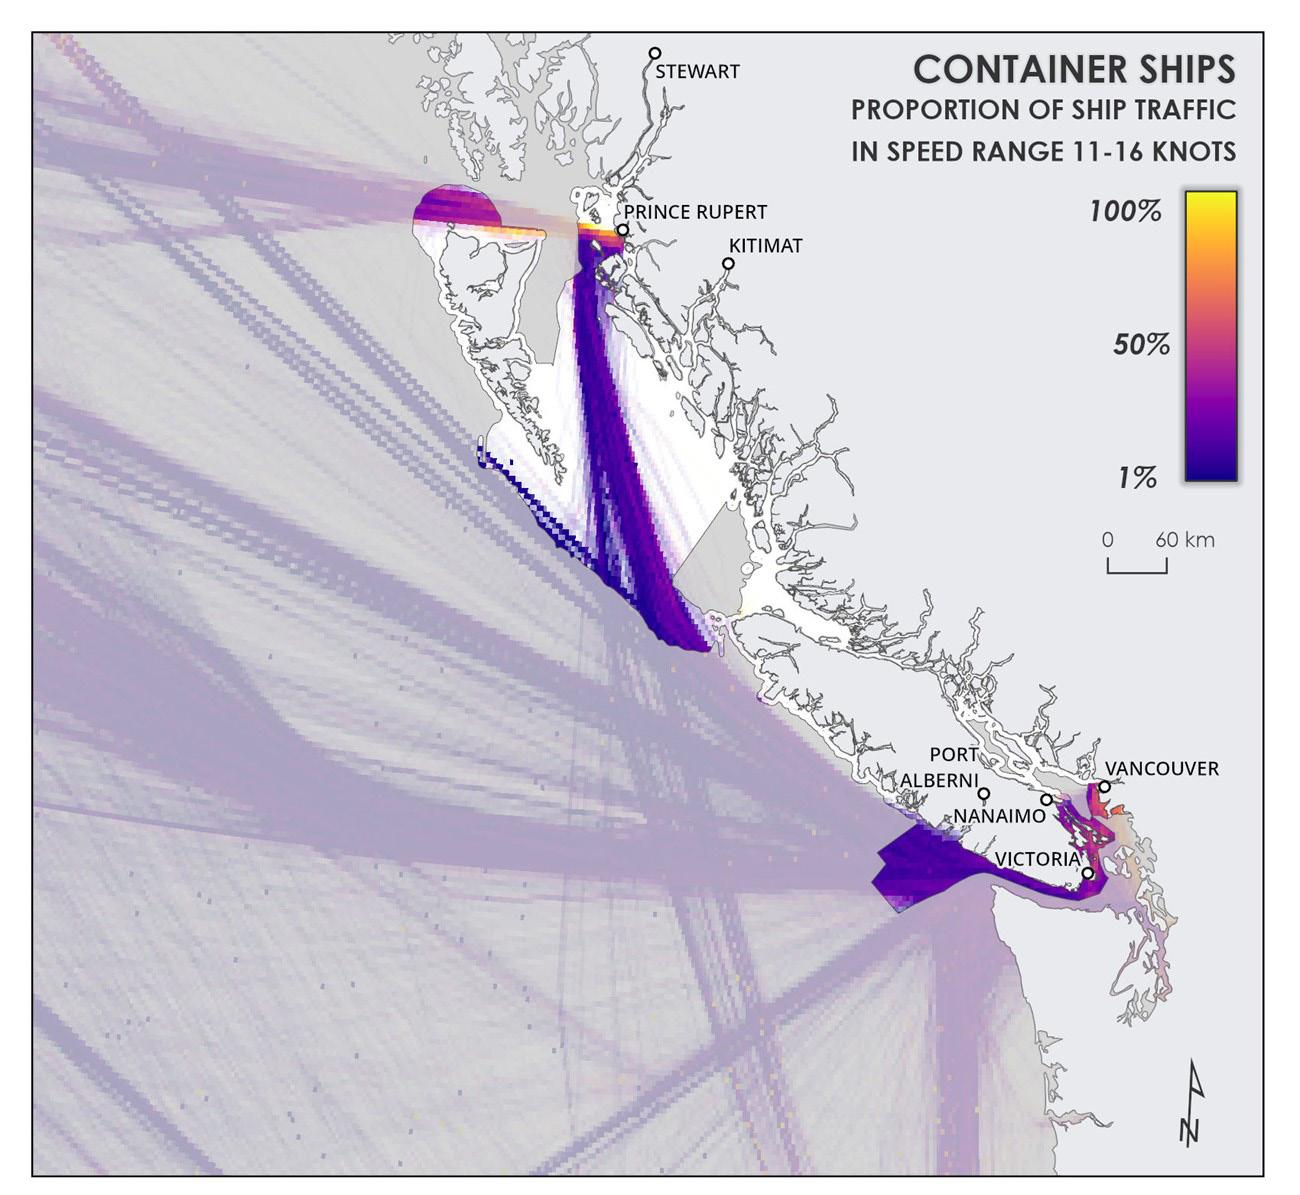
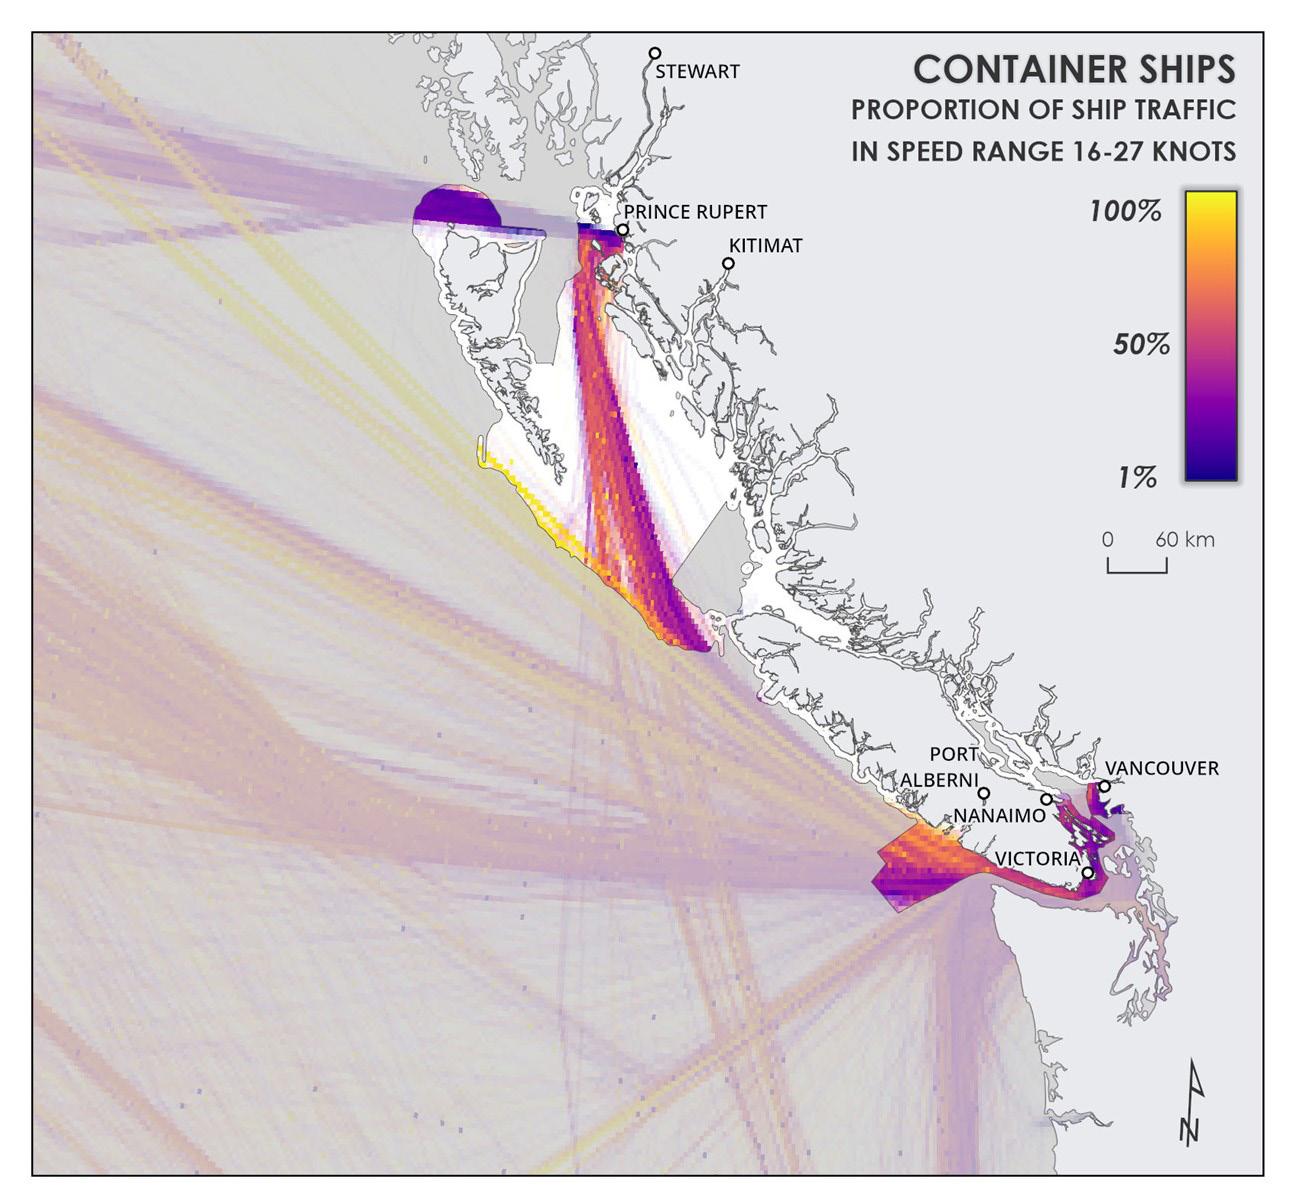 Figure 14. Volume of container ships travelling between 11 and 16kt as a proportion of all vessel traffic within this speed range in important whale habitats. Bright yellow (100%) indicates that all container ships in this region are travelling within the speed category.
21
Figure 15. Volume of container ships travelling above 16kt as a proportion of all vessel traffic within this speed range in important whale habitats. Bright yellow (100%) indicates that container ships in this region are all travelling within the speed category.
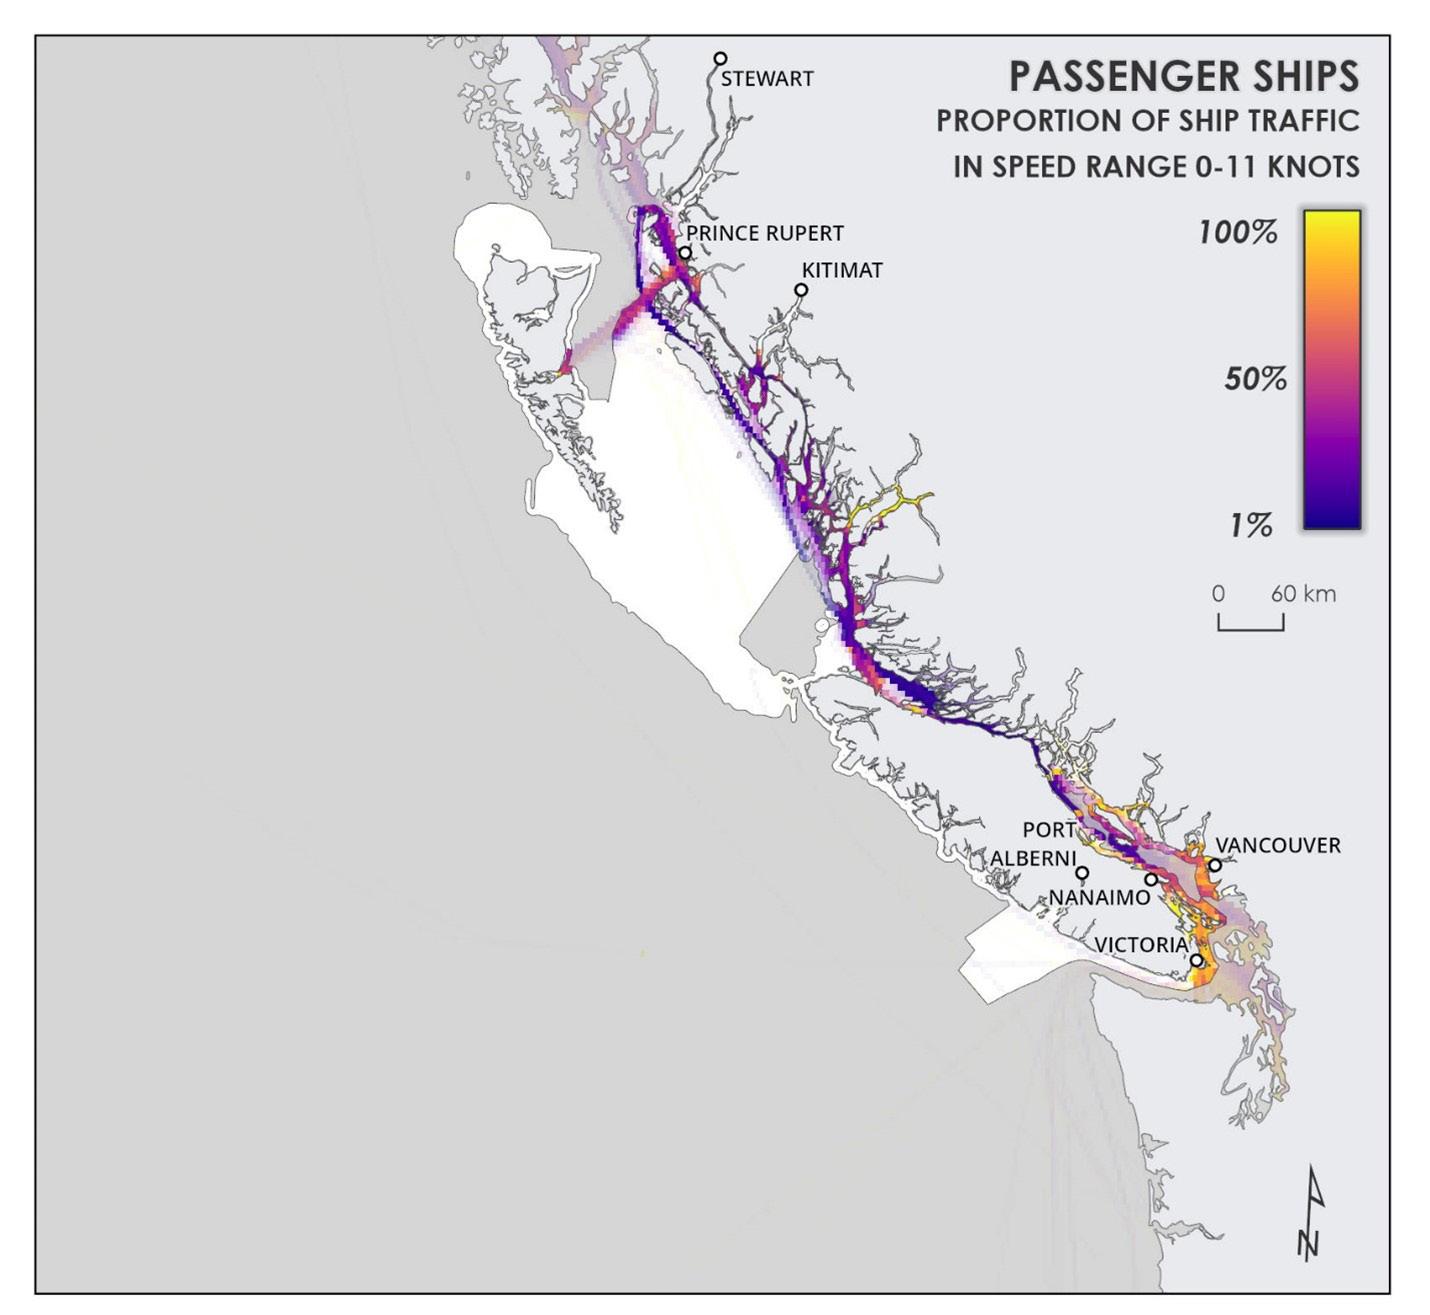
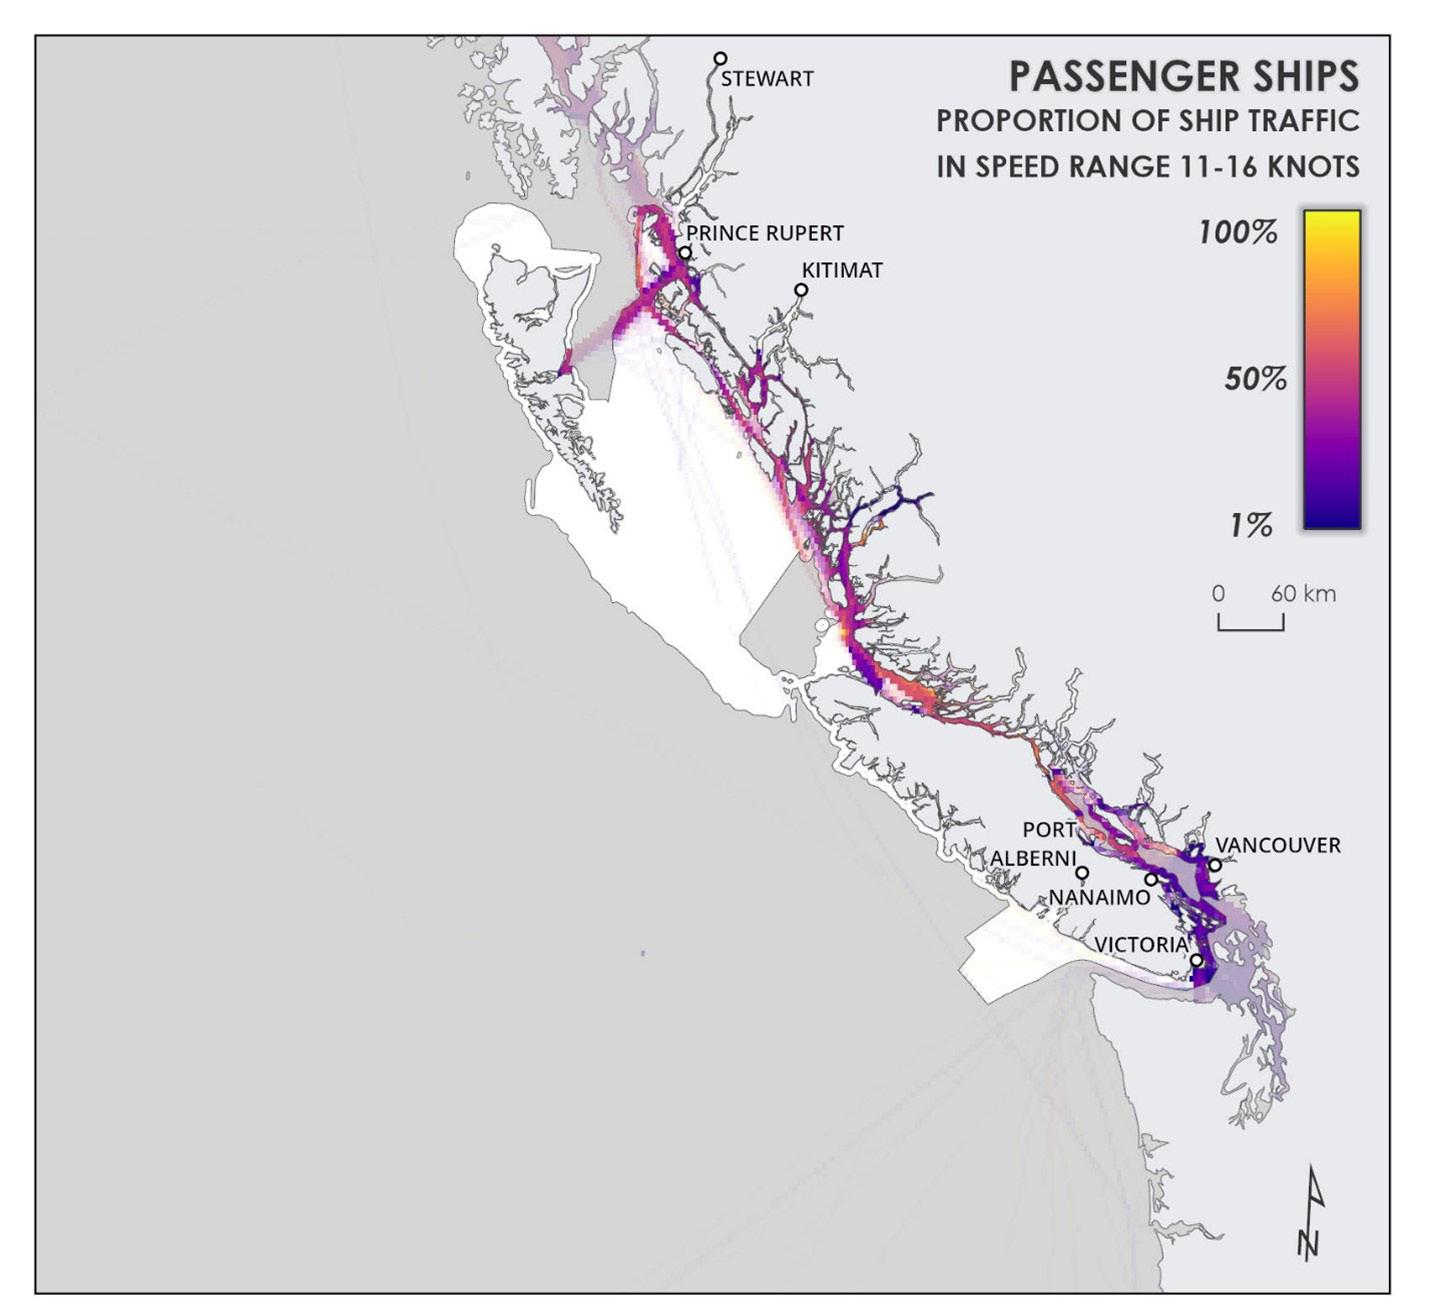 Figure 16. Volume of passenger ships (ferries) travelling below 11kt as a proportion of all vessel traffic within this speed range in important whale habitats. Bright yellow (100%) indicates that passenger ships in this region are all travelling within the speed category.
WWF-CANADA – SHIPPING TRAFFIC AND SPEED IN CETACEAN HABITATS ON CANADA’S PACIFIC COAST DISCUSSION DOCUMENT
Figure 17. Volume of passenger ships (ferries) travelling between 11 and 16kt as a proportion of all vessel traffic within this speed range in important whale habitats. Bright yellow (100%) indicates that passenger ships in this region are all travelling within the speed category.
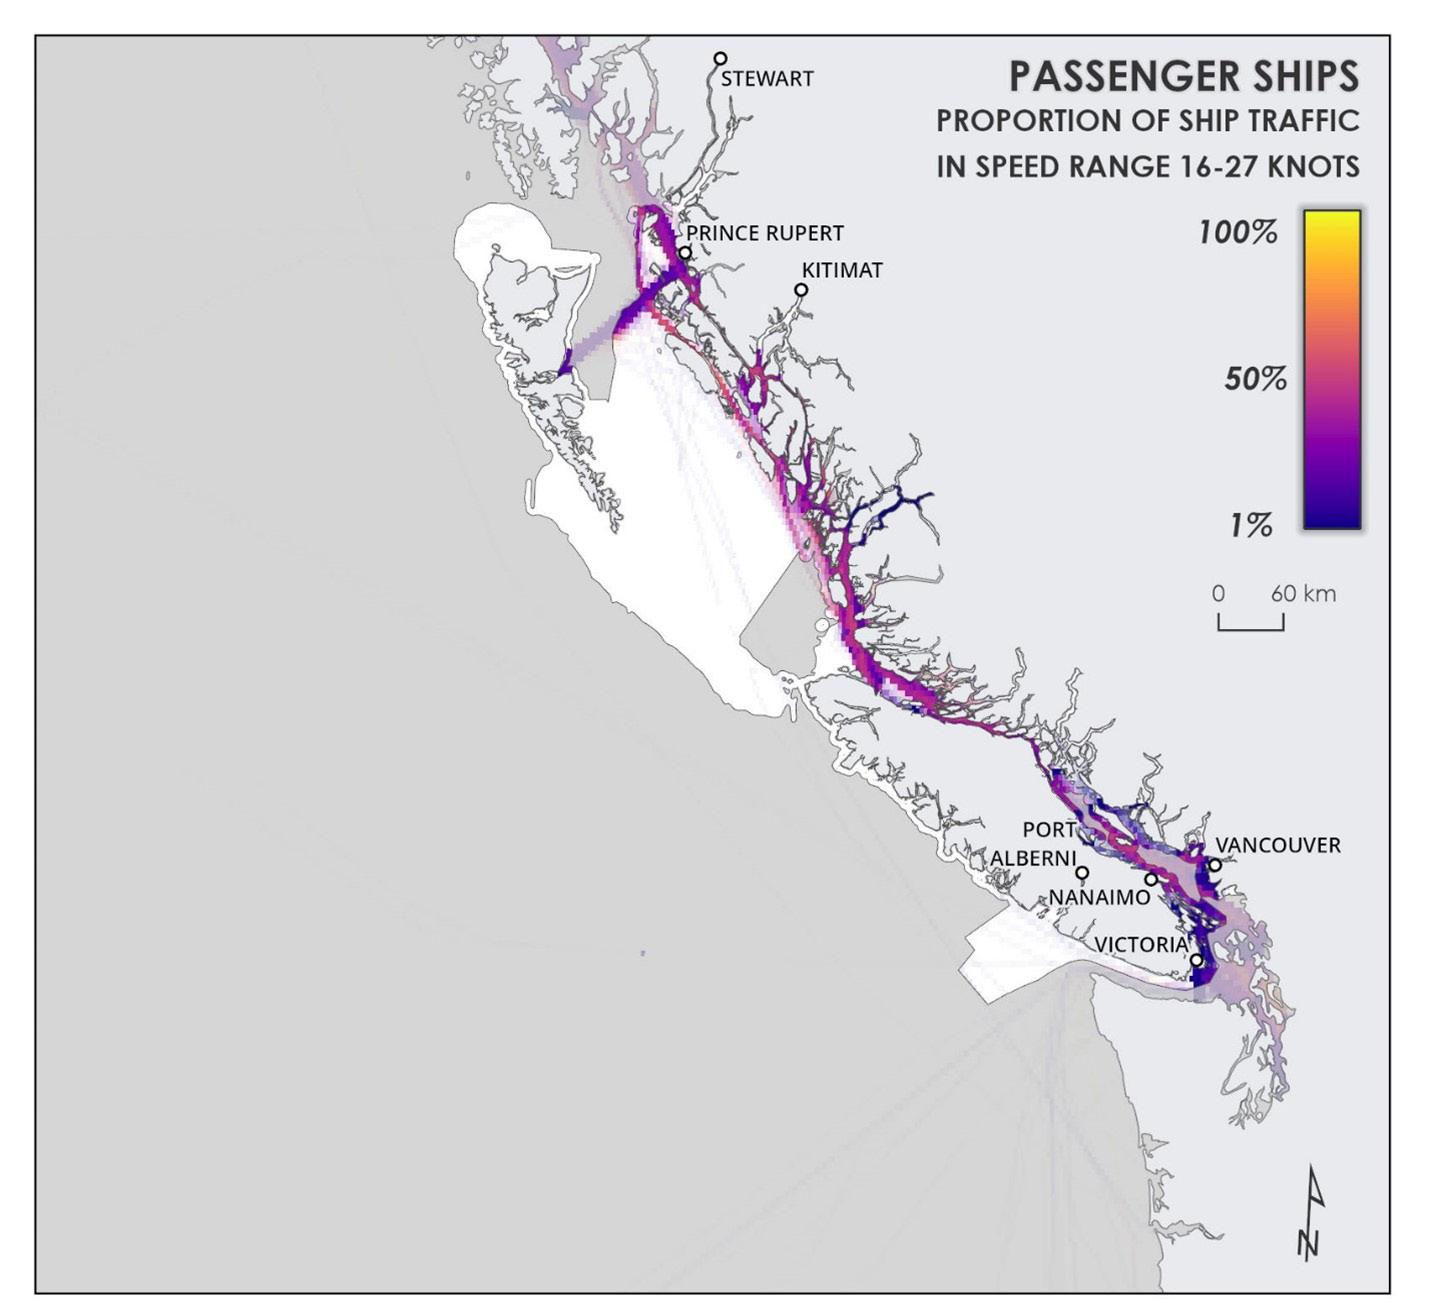
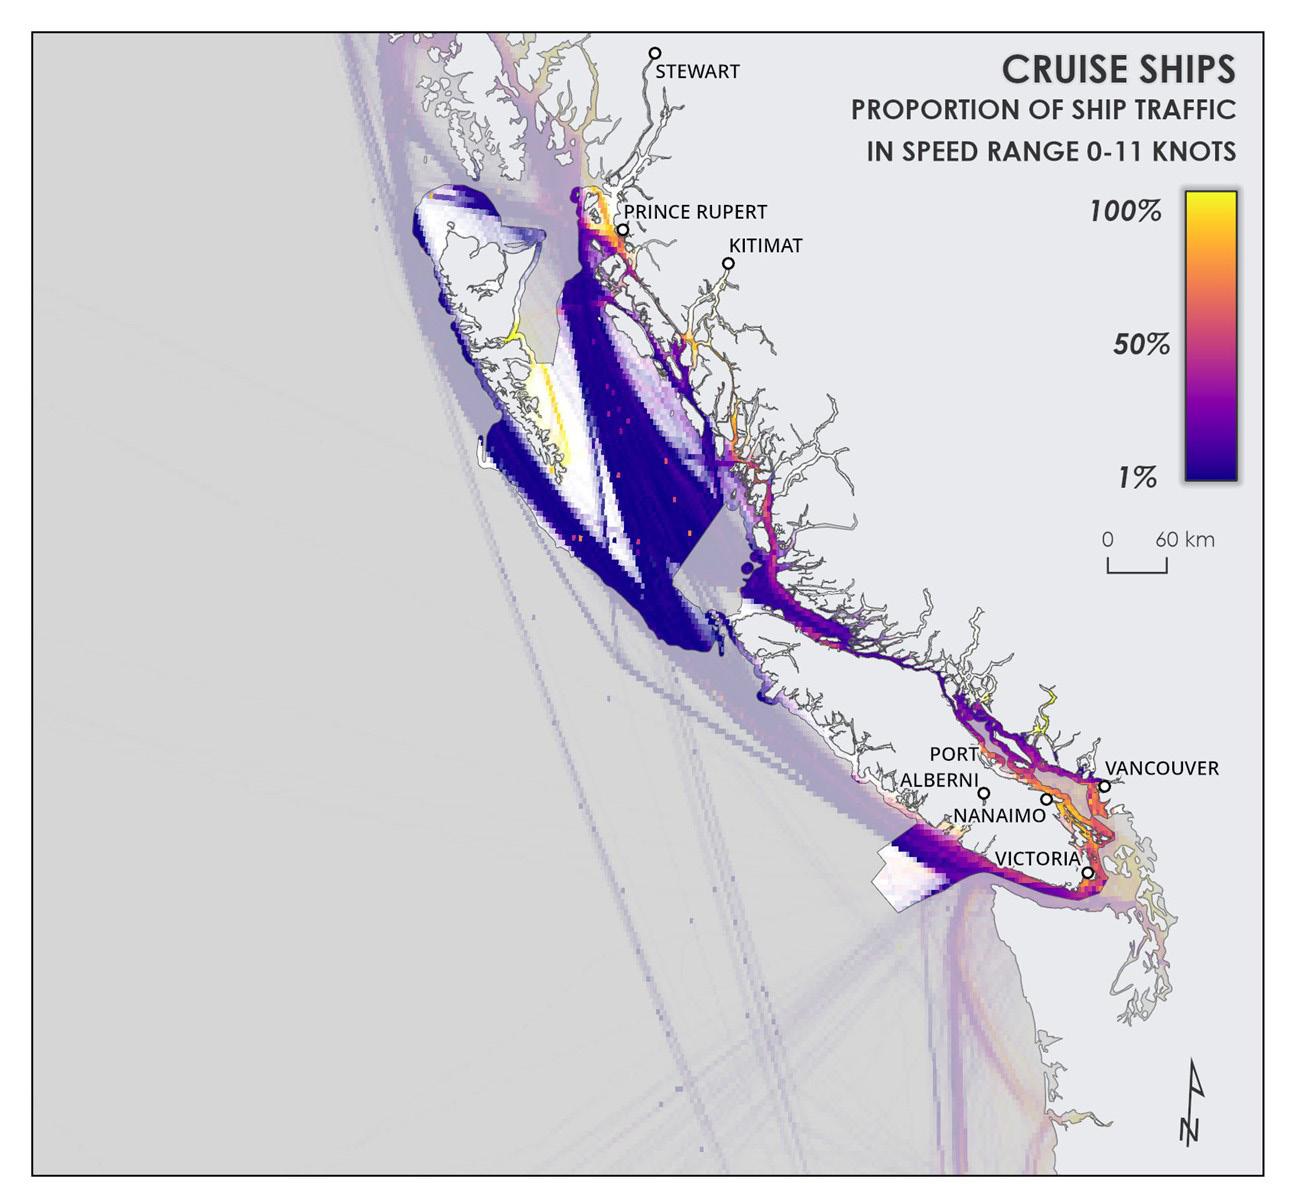 Figure 18. Volume of passenger ships (ferries) travelling above 16kt as a proportion of all vessel traffic within that speed range in important whale habitats. Bright yellow (100%) indicates that passenger ships in this region are all travelling within the speed category.
23
Figure 19. Volume of cruise ships travelling below 11kt as a proportion of all vessel traffic within this speed range in important whale habitats. Bright yellow (100%) indicates that cruise ships in this region are all travelling within the speed category.
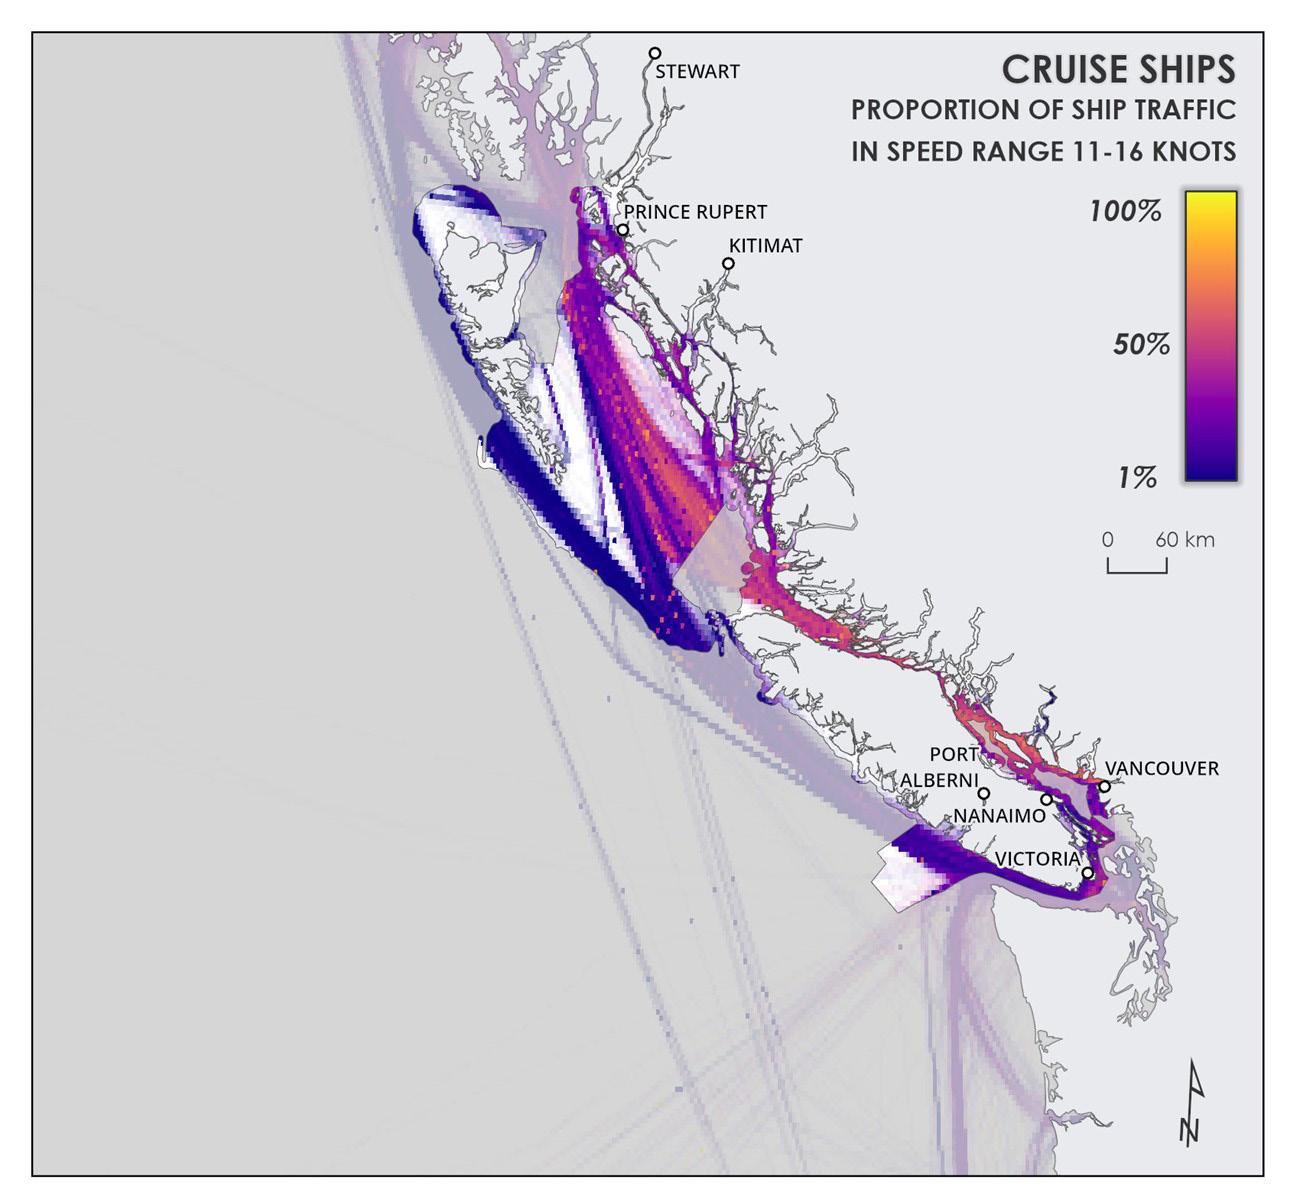
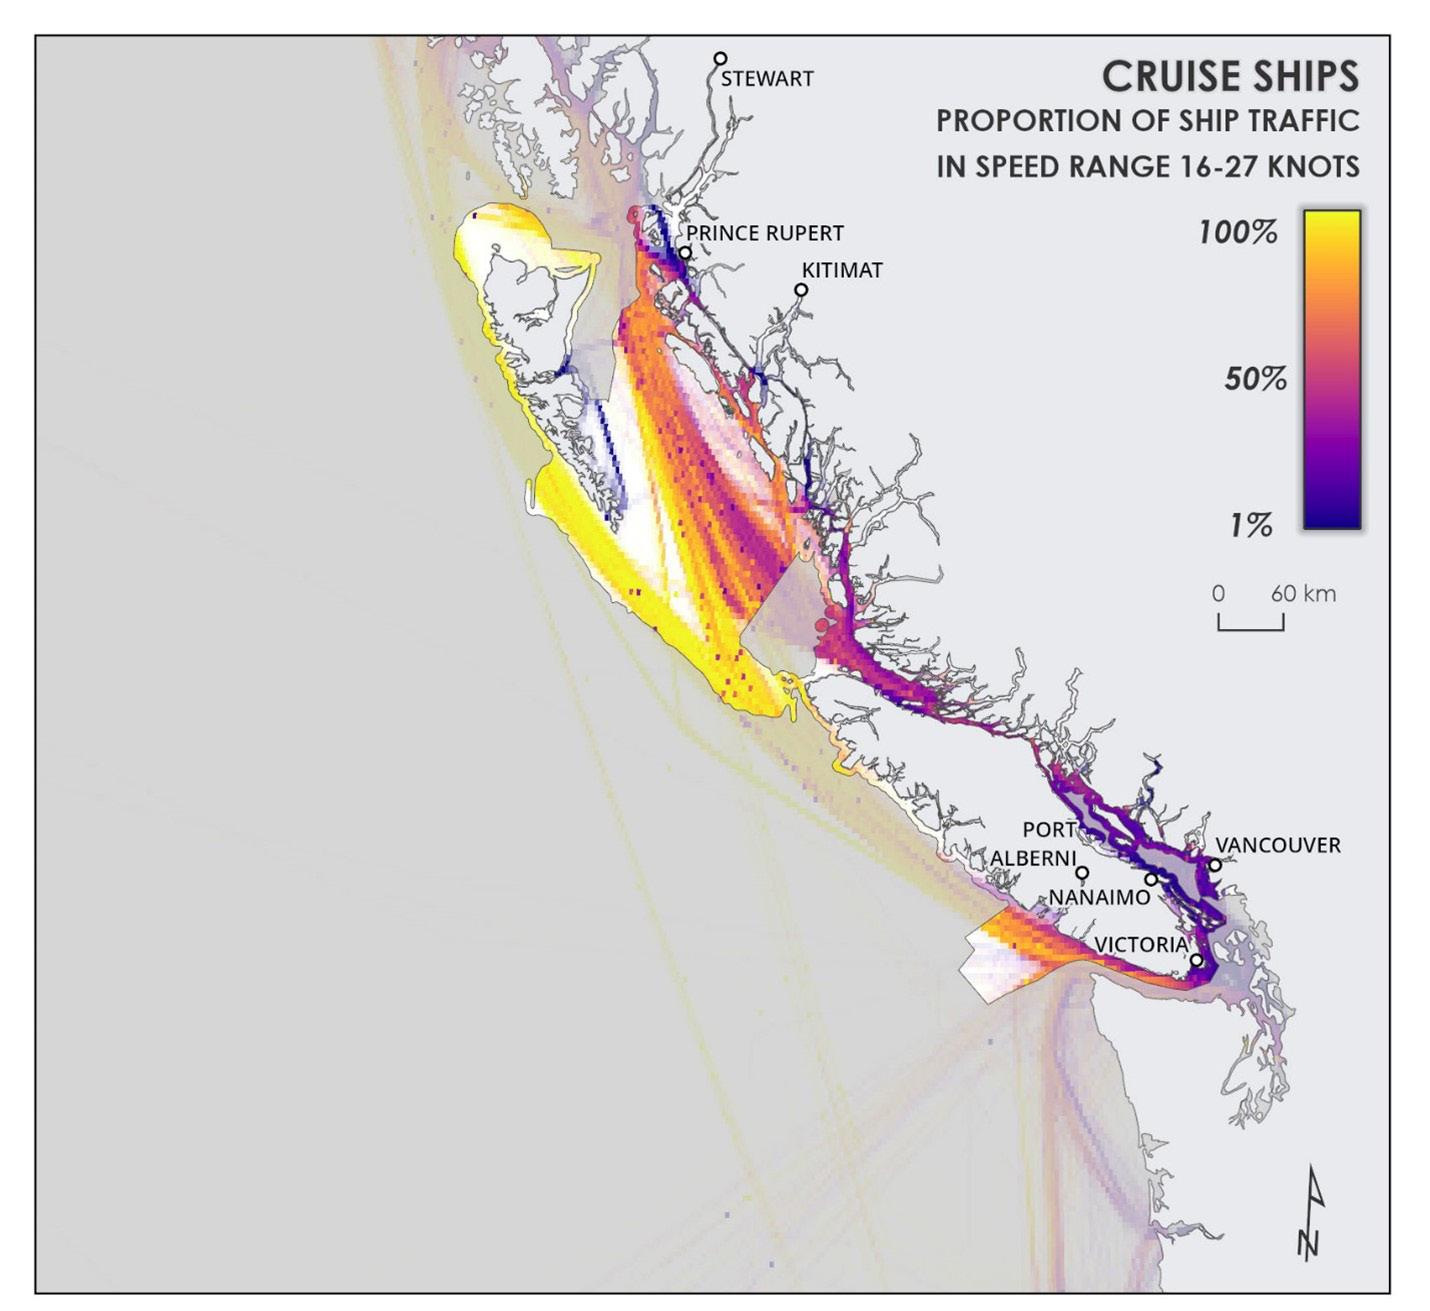 Figure 20. Volume of cruises travelling between 11 and 16kt as a proportion of all vessel traffic within this speed range in important whale habitats. Bright yellow (100%) indicates that cruise ships in this region are all travelling within the speed category.
Figure 21. Volume of cruise ships travelling above 16kt as a proportion of all vessel traffic within that speed range in important whale habitats. Bright yellow (100%) indicates that cruise ships in this region are all travelling within the speed category.
Figure 20. Volume of cruises travelling between 11 and 16kt as a proportion of all vessel traffic within this speed range in important whale habitats. Bright yellow (100%) indicates that cruise ships in this region are all travelling within the speed category.
Figure 21. Volume of cruise ships travelling above 16kt as a proportion of all vessel traffic within that speed range in important whale habitats. Bright yellow (100%) indicates that cruise ships in this region are all travelling within the speed category.
25
